Abstract
In a Kubernetes environment, the resource allocation for Pods has a direct impact on both performance and cost. When resource sizes are determined based on user experience, under-provisioning can lead to performance degradation and execution instability, while over-provisioning can result in resource waste and increased costs. To address these issues, this study proposes an adaptive scheduling method that employs the Design of Experiments (DoE) approach to determine the optimal resource size for each application with minimal experimentation and integrates the results into a custom Kubernetes scheduler. Experiments were conducted in a Kubernetes-based cloud environment using five applications with diverse workload characteristics, including CPU-intensive, memory-intensive, and AI inference workloads. The results show that the proposed method improved the performance score—calculated as the harmonic mean of execution time and cost—by an average of approximately 1.5 times (ranging from 1.15 to 1.59 times) compared with the conventional maximum resource allocation approach. Moreover, for all applications, the difference in mean scores before and after optimal resource allocation was statistically significant (p-value < 0.05). The proposed approach demonstrates scalability for achieving both resource efficiency and service-level agreement (SLA) compliance across various workload environments.
1. Introduction
In modern cloud and data center environments, virtualization technologies are widely adopted to improve the efficiency of IT infrastructure utilization. However, traditional virtual machine (VM)–based virtualization includes an operating system in each instance, which can lead to performance degradation compared to bare-metal systems [1]. To address these limitations, lightweight virtualization technologies such as containers have gained attention, offering high portability, scalability, and deployment efficiency. Kubernetes [2], the de facto container orchestration platform, automatically selects the optimal node for Pod placement through filtering and scoring. In this process, the resource request configuration of a Pod directly affects the stability and performance of the application.
Misconfigured resource requests can cause delays in other workloads due to excessive resource occupation or result in unnecessary resource waste and cost increases. In fact, recent industry reports indicate that up to 30% of enterprise cloud spending is wasted due to over-provisioning and inefficient resource utilization [3]. Despite this, most configurations still rely heavily on user experience and rule-of-thumb practices, which lack consistency and data-driven rigor. These challenges motivate the need for lightweight and systematic methods that can identify optimal resource allocations with minimal experimentation.
To address these issues, prior research has explored a range of scheduling strategies. Traditional approaches include batch and dynamic schedulers designed to balance resource utilization [4,5]. Machine learning–based schedulers achieve high predictive accuracy [6] but require extensive training data and frequent retraining, resulting in high computational overhead. Non-learning–based methods, such as adaptive, heuristic, or event-driven schedulers, improve performance in large clusters [7,8,9,10,11,12,13,14], yet they often lack statistical rigor. Online scheduling frameworks have also been proposed to dynamically adapt to workload fluctuations [15], while environment-aware schedulers aim to improve energy efficiency and sustainability in data centers [16]. More recently, industry tools such as the Kubernetes Vertical Pod Autoscaler (VPA) [17] and Karpenter [18] have automated resource scaling, but they also rely on heuristics or historical monitoring data, which may introduce instability under rapidly changing workloads.
These studies demonstrate significant advances but also highlight persistent gaps. ML-based schedulers are costly to maintain, heuristic approaches may yield inconsistent results, and empirical configuration continues to dominate in practice, leading to inefficiency. In contrast, the Design of Experiments (DoE) methodology offers a statistically rigorous yet lightweight framework for systematically exploring resource configurations. DoE has not been fully applied to Kubernetes scheduling, and its ability to derive application-specific optimal settings with minimal trials presents a unique opportunity to balance performance and cost efficiency.
In this study, we propose a DoE-based adaptive scheduling method that determines the optimal resource configuration for each application and integrates these results into a Kubernetes custom scheduler. By applying Response Surface Methodology (RSM) with Central Composite Design (CCD), our approach efficiently estimates both linear and quadratic effects, enabling accurate prediction with a limited number of experiments. The contributions of this study are as follows: (i) it introduces DoE as a novel statistical foundation for Kubernetes scheduling, providing an alternative to empirical and ML-based approaches; (ii) it develops a predictive model for optimal resource sizing across diverse application workloads; and (iii) it demonstrates integration into a Kubernetes custom scheduler, validating statistically significant improvements in cost–performance trade-offs.
A structured comparison of representative scheduling approaches is provided in Table 1.

Table 1.
Comparative summary of scheduling approaches.
2. Design of Experiments-Based Adaptive Scheduling Method
2.1. Overview of the Design of Experiments
The Design of Experiments (DoE) [19] is a statistical methodology designed to obtain the maximum amount of information from the minimum number of experiments. Instead of evaluating every possible combination of factors, DoE evaluates only selected experimental points according to the factor levels, thereby identifying the optimal conditions. A conceptual diagram is shown in Figure 1.
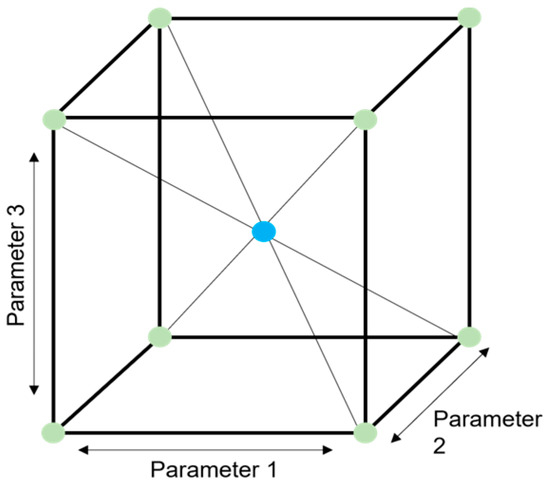
Figure 1.
Concept of the Design of Experiments.
In this study, DoE was applied to identify the performance characteristics of each application with minimal experimentation and to implement an adaptive scheduling method that dynamically adjusts resource allocation in Kubernetes environments based on these characteristics. The general DoE process, first introduced by Fisher [19] and later formalized in modern statistical texts such as Montgomery [20], consists of the following steps: (1) defining the objective, (2) selecting response variables, (3) determining experimental variables, (4) selecting an experimental design method, (5) conducting experiments and analyzing results, (6) building models and verifying factors, and (7) standardizing results and identifying improvements. In our context, the response variable was the performance evaluation metric, and the experimental variables were CPU and memory levels.
For this study, Response Surface Methodology (RSM) with a Central Composite Design (CCD) was adopted. RSM is widely used to model and optimize systems influenced by multiple factors, particularly when non-linear relationships are expected, while CCD provides an efficient design for estimating quadratic effects with relatively few experimental runs. These features make the RSM–CCD combination well-suited to our objective of deriving application-specific CPU and memory configurations with minimal experimentation. Although RSM and CCD are well-established techniques, the novelty of this work lies in applying them to Kubernetes scheduling for resource optimization—a context that has not been systematically addressed in prior research.
2.2. Experimental Design and Environment Configuration
An overview of the experiment designed to develop the optimal resource size prediction model is shown in Table 2. The infrastructure was implemented using Amazon Web Services (AWS) [21] Elastic Compute Cloud (EC2) [22] instances running the Ubuntu 24.04 operating system. For benchmarking, five applications with different workload characteristics—selected from the Phoronix Test Suite [23]—were used, reflecting CPU-bound, memory-bound, and AI inference–oriented workloads. The experimental design and statistical analysis were conducted using Minitab 21 [24]. The experimental environment and application descriptions are summarized in Table 3 and Table 4.
Table 2.
Experimental design.
Table 3.
Experimental environment configuration.
Table 4.
Application Details.
In this study, a total of 13 experiments were generated from the two-factor Central Composite Design, consisting of four factorial points, four axial points, and five replicates at the center point. This configuration provides sufficient information to estimate both linear and quadratic effects while maintaining experimental efficiency with a relatively small number of runs. Moreover, according to the principles of Response Surface Methodology, this design ensures adequate statistical power for detecting curvature and interaction effects, thereby justifying that 13 experiments are sufficient for the scope of this study.
2.3. Experimental Procedure
To explore the optimal resource combination, this study applied an experimental design based on Response Surface Methodology. Table 5 presents the experimental factors and their respective levels for each application. The CPU and memory levels were determined through preliminary benchmarking to ensure that performance differences between levels were clearly distinguishable.
Table 5.
Factor levels by application.
Since execution time and cost have different measurement units, failing to normalize them may result in excessive weighting toward one metric, reducing the reliability of the results. Therefore, execution time and cost were normalized separately to enable accurate and balanced comparisons. To jointly evaluate performance and cost in a single metric, we defined a “Score” as the harmonic mean of the two normalized values, ensuring a balanced assessment of trade-offs between execution efficiency and resource expenditure. In this study, we used a simplified cost model based on linear per-core and per-MiB pricing to capture the primary effects of CPU and memory allocation.
Nevertheless, this approach has several limitations. First, real-world cloud environments involve more complex cost structures, including spot instance pricing, persistent storage, and network usage, which were not reflected in our model. Second, the evaluation metrics were restricted to execution time and cost, while other important dimensions such as latency, throughput, SLA violations, and energy efficiency were excluded. Third, the scope of resource factors was limited to CPU and memory, without considering additional resources such as GPU, network bandwidth, and storage I/O. Future work will extend the cost model, evaluation metrics, and resource dimensions to incorporate these factors, thereby enhancing the realism and applicability of the proposed method in production-scale Kubernetes environments.
The cost was calculated using Equation (1), applying an hourly rate of 0.0072 USD per CPU core and per GiB of memory (based on the AWS EC2 Seoul region t2 instance pricing). Execution time and cost were each normalized, and a single score was calculated using the harmonic mean, as in Equation (2). The harmonic mean has the advantage of balancing the rate of change for independent variables with different units. The final score, calculated from the normalized execution time T and cost C, is given by Equation (3).
Table 6 shows the run order and measurement values for the c-ray application after normalization, including execution time and cost for each CPU and memory configuration.
Table 6.
Normalized c-ray experiment treatment combination schedule.
2.4. Derivation of Optimal Resource Size by Application
Based on the scores derived from execution time and cost, response surface plots were generated, and optimal resource points were identified using a response optimization tool. Figure 2 shows the response surface plot for the c-ray application, while Figure 3 presents the optimal response point. According to Figure 3, the optimal resource size for c-ray was 4.68 CPU cores and 100 MiB of memory, with a desirability value of 0.9178.
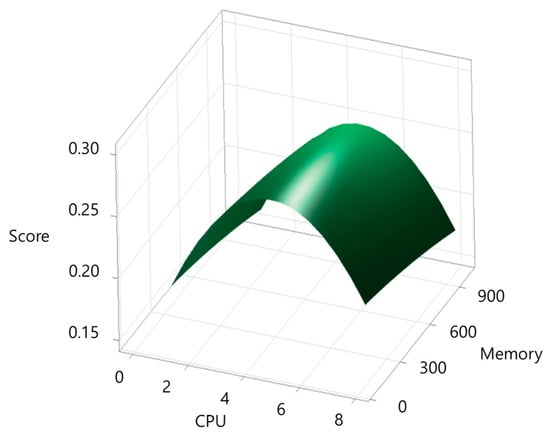
Figure 2.
Response surface plot for c-ray.
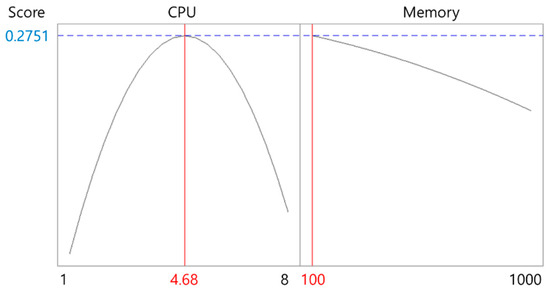
Figure 3.
Response optimization result for c-ray.
The same method was applied to the other applications. Figure 4, Figure 5, Figure 6 and Figure 7 present the response surface plots for each application, and Figure 8, Figure 9, Figure 10 and Figure 11 show their corresponding optimal resource points.
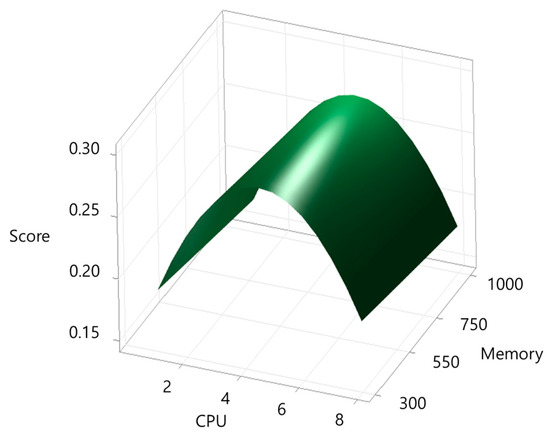
Figure 4.
Response surface plot for build-apache.
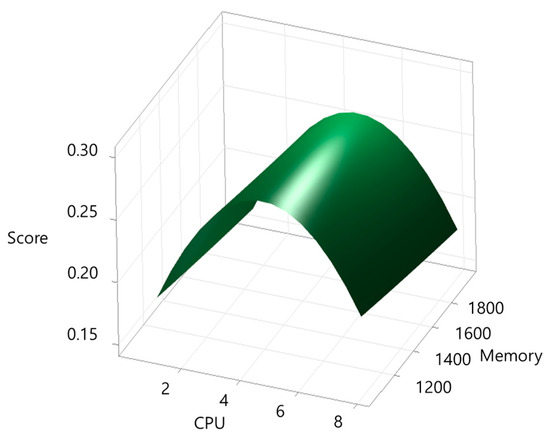
Figure 5.
Response surface plot for blender.
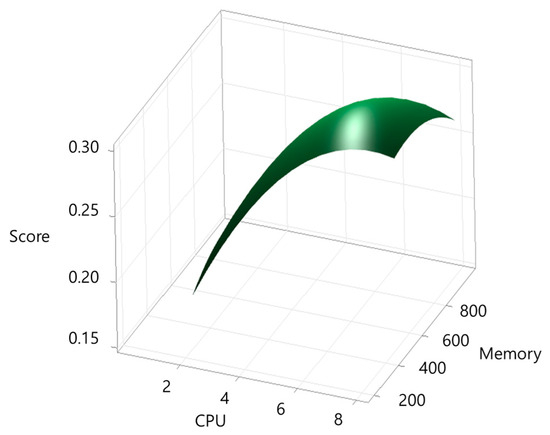
Figure 6.
Response surface plot for tensorflow-lite.
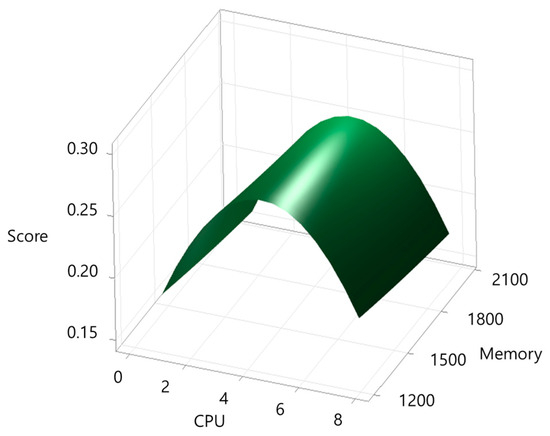
Figure 7.
Response surface plot for build-imagemagick.
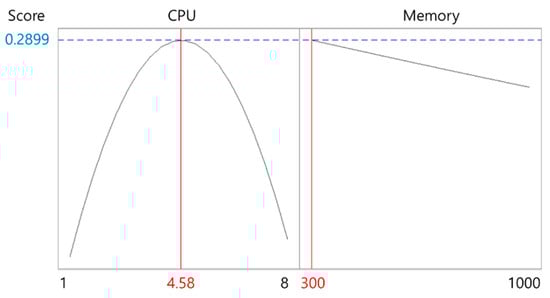
Figure 8.
Response optimization result for build-apache.
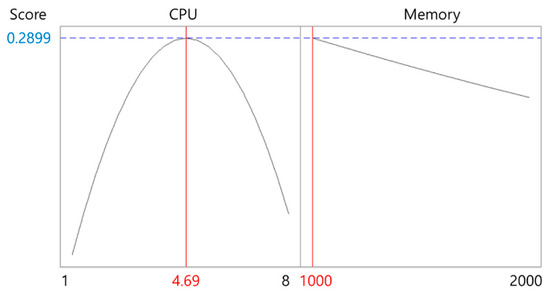
Figure 9.
Response optimization result for blender.
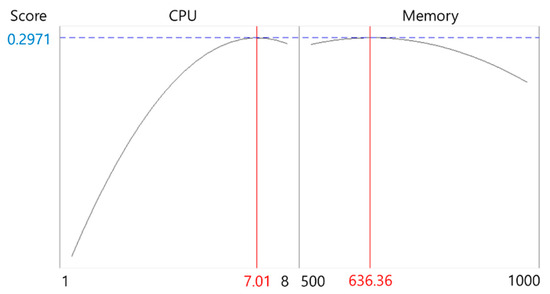
Figure 10.
Response optimization result for tensorflow-lite.
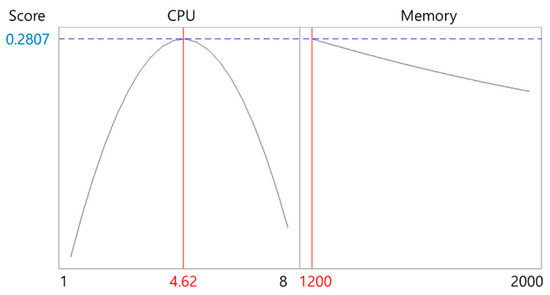
Figure 11.
Response optimization result for build-imagemagick.
Table 7 summarizes the optimal CPU and memory sizes derived for each application. The results indicate that most applications achieved optimal performance at approximately 4.6 CPU cores, while the AI inference workload (tensorflow-lite) required significantly higher CPU resources (7.01 cores). For memory, the optimal size ranged from 100 to 1200 MiB, depending on the application’s characteristics. These derived optimal resource sizes were directly applied to the Kubernetes custom scheduler, enabling adaptive scheduling that dynamically adjusts resource requests according to each application’s performance profile. To provide a clearer visualization, Figure 12 presents a scatter plot of the optimal CPU and memory allocations, highlighting the distinct resource requirements across different application types.
Table 7.
Optimal resource size for each application.
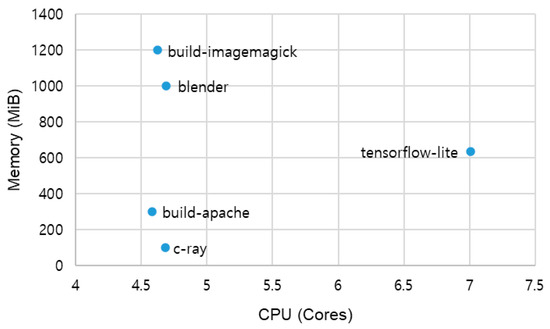
Figure 12.
Scatter plot of optimal CPU cores and memory sizes for each application.
The workload-specific results reflect the distinct computational characteristics of each application. CPU-bound tasks such as c-ray and build-apache showed strong sensitivity to CPU scaling, with relatively low memory requirements, highlighting their dependence on processor throughput. In contrast, blender and build-imagemagick required substantially larger memory allocations due to their memory-intensive compilation and rendering processes, even though their CPU requirements converged near 4.6 cores. The tensorflow-lite workload exhibited the highest CPU demand (7.01 cores), reflecting the parallelism inherent in AI inference tasks, while its memory requirement was moderate compared to the other applications. These differences confirm that workload type—CPU-bound, memory-intensive, or AI inference—directly influences the optimal resource balance, underscoring the need for application-specific profiling rather than uniform resource allocation policies.
3. Performance Evaluation
3.1. Comparison of Performance Before and After Applying the Optimal Resource Size
To verify the effectiveness of the proposed adaptive scheduling method, experiments were conducted under the same conditions by comparing the maximum resource allocation method with the optimal resource size–based allocation method for each application. Table 8 shows the changes in execution time of the c-ray application. When the optimal resource size was applied, CPU and memory usage were reduced, resulting in longer execution time. However, this is a natural consequence of the cost reduction achieved through resource savings.
Table 8.
c-Ray execution time before and after optimal resource allocation.
According to the normalized comparison of execution time, cost, and score in Table 9, in the case of c-ray, although execution time increased to 1.943, cost decreased significantly to 5.201, resulting in an improvement of the score from 0.182 to 0.280, about 1.538 times higher. This demonstrates that the proposed method effectively achieves a balance between execution time and cost.
Table 9.
Normalized performance metrics for c-ray before and after resource allocation.
The results for other applications (Table 10) also show the same trend. In particular, build-apache improved by about 1.593 times, blender by about 1.566 times, and build-imagemagick by about 1.549 times in performance efficiency. The relatively smaller improvement in tensorflow-lite is due to the nature of AI inference tasks, where CPU parallel computation plays a major role, leaving less room for resource reduction. To further highlight these improvements, Figure 13 provides a visual comparison of the normalized performance scores before and after optimal resource allocation across all applications.
Table 10.
Normalized performance metrics for each application before and after resource allocation.
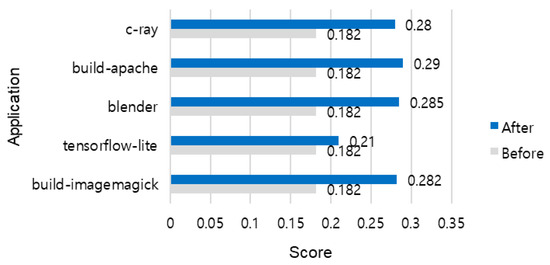
Figure 13.
Normalized performance scores before and after applying optimal resource allocation for each application.
While these results demonstrate the effectiveness of the proposed method across multiple application types, the evaluation was limited to a small-scale AWS EC2 environment using benchmark workloads from the Phoronix Test Suite. These workloads, although covering CPU-bound, memory-bound, and inference tasks, do not fully represent the diversity and complexity of production Kubernetes clusters, where factors such as concurrent multi-container services, network latency, node interference, and storage bottlenecks play critical roles. Future work will therefore validate the proposed approach in larger and more heterogeneous clusters, incorporating these operational factors to further examine scalability and generalizability.
In summary, the DoE-based adaptive scheduling method optimizes per-application resource usage by balancing cost reduction and performance maintenance. The consistent improvements in score across all test cases highlight its potential to reduce operational costs while preserving service quality (SLA) in real-world cloud environments.
3.2. Normality Test of Scores
In this study, a paired t-test [25] was employed to verify whether the changes in scores before and after applying the proposed scheduling method were statistically significant. This test is suitable for pre-post comparisons of the same group and requires the assumption that score data follow a normal distribution. When the sample size is less than 30, normality must be examined in advance. If normality is not satisfied, a non-parametric Wilcoxon signed-rank test [26] is applied. Accordingly, the following hypotheses were set for the normality test of each application:
- Null hypothesis (H0): The data follow a normal distribution.
- Alternative hypothesis (H1): The data do not follow a normal distribution.
Table 11 shows the scores of the c-ray application before and after resource allocation, as well as their differences. Since the difference was calculated as (before–after), a negative value indicates that the score increased after allocation.
Table 11.
c-Ray scores before and after optimal resource allocation.
Table 12 presents the normality test results for each application. At a significance level of 5% (p = 0.05), if p-value ≥ 0.05, normality is satisfied, and the paired t-test was applied. Otherwise, the Wilcoxon test was applied. The results show that all applications except build-apache satisfied normality. Since build-apache had a relatively large execution time variation, the skewness of its data distribution was high, necessitating a non-parametric test. Through these verification procedures, it was confirmed that the performance improvement of the proposed DoE-based adaptive scheduling method is also statistically significant.
Table 12.
Normality test results for each application.
3.3. Statistical Analysis of Mean Score Differences
Based on the normality test results, either a paired t-test or Wilcoxon signed-rank test was applied to each application. The hypotheses were set as follows:
- Null hypothesis (H0): The mean scores before and after optimal resource allocation are equal.
- Alternative hypothesis (H1): The mean scores before and after optimal resource allocation are different.
Table 13 shows the analysis method and p-value for each application. All p-values were below the significance level of 0.05, leading to the rejection of the null hypothesis and the acceptance of the alternative hypothesis. Particularly for the blender, the p-value was as low as 3.601 × 10−42, indicating that the effect of resource optimization was extremely pronounced. These results demonstrate that the proposed DoE-based method for determining optimal resource sizes not only enhances resource efficiency but also significantly improves performance (scores) in a statistically meaningful way. Furthermore, consistent significance across five applications with different characteristics confirms the generality and practical applicability of the proposed method in diverse workload environments.
Table 13.
Mean score difference test results for each application.
In addition, unlike prior machine learning-based approaches that often require continuous retraining and extensive monitoring data, the proposed DoE-based method achieves statistically validated optimization with minimal experimental overhead. Compared to heuristic or rule-based schedulers, it also offers a more systematic and statistically grounded framework for deriving optimal resource configurations. These distinctions demonstrate that DoE can serve as a lightweight yet robust alternative for Kubernetes scheduling, bridging the gap between empirical trial-and-error methods and data-intensive ML-based solutions. However, this study did not include direct experimental comparisons with existing tools such as the Kubernetes Vertical Pod Autoscaler (VPA), Karpenter, or AI-based predictive schedulers. Incorporating such evaluations will be an important direction for future work to further validate the relative advantages of the proposed approach.
4. Implementation of a Kubernetes-Based Custom Scheduler
In this study, the proposed Design of Experiments (DoE)-based predictive model for application-specific optimal resource sizing was applied to a Kubernetes custom scheduler. The implementation process consists of the following steps:
- Developing the scheduler program:
- An example of the custom-scheduler.py function is provided in Appendix A (Figure A1). This code snippet demonstrates how optimal CPU and memory sizes derived from the DoE model are referenced through Pod annotations to select a suitable node. It filters the list of nodes that satisfy the required resource demand and performs node scoring to place Pods on the most suitable node.
- Creating the container image:
- The scheduler program was packaged into a container image using the Dockerfile. An example of the Dockerfile is provided in Appendix A (Figure A1). A custom scheduler pod was then generated based on this image. The container image included Python 3.8 and the Kubernetes client library.
- Assigning the scheduler during application deployment:
- In the pod configuration file of the application, the schedulerName field was specified with the name of the custom scheduler instead of the default scheduler. An example of this configuration is shown in Appendix A (Figure A2).
Through this process, the DoE-based optimal resource information was directly integrated into the Kubernetes scheduling stage. Consequently, the method achieved adaptive resource allocation tailored to the performance characteristics of each application while simultaneously improving cluster resource utilization.
Furthermore, the proposed approach enhances practical applicability since it can be easily extended to diverse workload environments by modifying only YAML configurations, without the need to rebuild container images. In practice, the proposed scheduler offers several advantages. It can be seamlessly integrated into existing clusters without disrupting default scheduling mechanisms, thereby simplifying adoption for system administrators. By reducing unnecessary over-provisioning while preserving application performance, it supports both cost savings and SLA compliance, which are critical in enterprise cloud environments. In addition, the lightweight statistical foundation of the DoE model ensures scalability and adaptability to heterogeneous clusters and evolving workload demands, enhancing its long-term viability in production settings.
As noted in Section 3.1, the current implementation was validated in a controlled environment, and scenarios such as competing Pods, multi-user settings, and autoscaling were not included. These aspects will be addressed in future work to further demonstrate the robustness of the custom scheduler.
5. Conclusions and Future Work
This paper proposed a DoE-based adaptive scheduling method in Kubernetes environments that determines the optimal resource size by jointly considering application execution time and cost. To overcome the limitations of conventional experience-based resource configuration, a Response Surface Methodology was applied to design and conduct experiments on five applications with distinct workload characteristics, thereby constructing a predictive model for optimal resource sizing. When applied to a Kubernetes custom scheduler, the proposed model achieved an average score improvement of approximately 1.5× (ranging from 1.15× to 1.59×) compared to the conventional maximum resource allocation strategy. In all applications, performance improvements were found to be statistically significant, with p-values < 0.05.
While these findings demonstrate the potential of the proposed approach, the evaluation was limited to a small-scale cluster and a set of benchmark applications. Dynamic workload fluctuations, multi-tenant scenarios, and other real-world deployment complexities were not fully addressed. In particular, realistic deployment settings such as competing Pods, multiple users, and autoscaling mechanisms were not evaluated. Therefore, the generality of the results should be interpreted with caution.
Future research will extend the model to a wider variety of workloads and large-scale distributed cluster environments, while implementing dynamic prediction-based scheduling that leverages real-time monitoring data. Moreover, we plan to design experiments incorporating controlled levels of network latency, node interference, and concurrent workloads, using metrics such as latency, throughput, and SLA violations to quantify performance. Standard monitoring and benchmarking tools (e.g., Prometheus, cAdvisor, and Kubernetes-native autoscaling modules) will be used to validate these scenarios. Furthermore, the proposed method will be integrated with AI-based resource management frameworks, with the ultimate goal of developing an advanced scheduler that simultaneously ensures resource efficiency and service quality in cloud and big data environments. It is also worth noting that the DoE methodology itself is inherently extensible: additional resource factors such as GPU, network bandwidth, and storage I/O, as well as evaluation metrics like energy efficiency and SLA compliance, can be systematically incorporated into the experimental design. This flexibility underscores the broader applicability of our approach beyond the CPU and memory dimensions examined in this study.
Author Contributions
Conceptualization, Y.Y., B.C. and J.L.; methodology, Y.Y., B.C. and J.L.; software, Y.Y. and B.C.; validation, Y.Y. and B.C.; formal analysis, Y.Y. and B.C.; investigation, Y.Y. and B.C.; resources, Y.Y. and B.C.; data curation, Y.Y. and B.C.; writing—original draft preparation, Y.Y.; writing—review and editing, Y.Y. and J.L.; visualization, Y.Y. and J.L.; supervision, J.L.; project administration, J.L.; funding acquisition, J.L. All authors have read and agreed to the published version of the manuscript.
Funding
This work was supported by research grants from Daegu Catholic University in 2023.
Institutional Review Board Statement
Not applicable.
Informed Consent Statement
Not applicable.
Data Availability Statement
Not applicable.
Conflicts of Interest
The authors declare no conflicts of interest.
Appendix A
Figure A1 shows a simplified function select_node_for_pod(pod) from the custom-scheduler.py script, which illustrates how optimal CPU and memory sizes derived from the DoE model are used during node selection.

Figure A1.
Example function select_node_for_pod(pod) in custom-scheduler.py.
Figure A2 presents an example Dockerfile for building the custom scheduler container image, including the Python runtime and the Kubernetes client library.

Figure A2.
Example Dockerfile for building the custom scheduler container image.
Figure A3 provides an example Pod configuration YAML file, where the schedulerName field is set to the custom scheduler instead of the default Kubernetes scheduler.

Figure A3.
Example Pod configuration YAML file specifying the custom scheduler.
References
- Rejiba, Z.; Chamanara, J. Custom Scheduling in Kubernetes: A Survey on Common Problems and Solution Approaches. ACM Comput. Surv. 2022, 55, 1–37. [Google Scholar] [CrossRef]
- Kubernetes. Available online: https://kubernetes.io/ (accessed on 30 July 2025).
- Boston Consulting Group. Cloud Cover: Price Swings, Sovereignty Demands, and Wasted Resources. Available online: https://www.bcg.com/publications/2025/cloud-cover-price-sovereignty-demands-waste (accessed on 6 September 2025).
- Wang, Z.; Liu, H.; Han, L.; Huang, L.; Wang, K. Research and Implementation of Scheduling Strategy in Kubernetes for Computer Science Laboratory in Universities. Information 2021, 12, 16. [Google Scholar] [CrossRef]
- Li, D.; Wei, Y.; Zeng, B. A Dynamic I/O Sensing Scheduling Scheme in Kubernetes. In Proceedings of the 4th International Conference on High Performance Compilation, Computing and Communications (HP3C), Guangzhou, China, 20–22 June 2020; pp. 14–19. [Google Scholar] [CrossRef]
- Dakić, V.; Đambić, G.; Slovinac, J.; Redžepagić, J. Optimizing Kubernetes Scheduling for Web Applications Using Machine Learning. Electronics 2025, 14, 863. [Google Scholar] [CrossRef]
- Luo, J.; Zhao, X.; Ma, Y.; Pang, S.; Yin, J. MerKury: Adaptive Resource Allocation to Enhance the Kubernetes Performance for Large-Scale Clusters. In Proceedings of the ACM Web Conference 2025 (WWW ’25), Sydney, Australia, 28 April–2 May 2025; pp. 4937–4948. [Google Scholar] [CrossRef]
- Kim, T.Y.; Lee, J.R.; Kim, T.H.; Chun, I.G.; Park, J.; Jin, S. Kubernetes Scheduler Framework Implementation with Realtime Resource Monitoring. IEMEK J. Embed. Syst. Appl. 2020, 15, 129–137. [Google Scholar] [CrossRef]
- Fu, Y.; Zhang, S.; Terrero, J.; Mao, Y.; Liu, G.; Li, S.; Tao, D. Progress-Based Container Scheduling for Short-Lived Applications in a Kubernetes Cluster. In Proceedings of the IEEE International Conference on Big Data (Big Data 2019), Los Angeles, CA, USA, 9–12 December 2019; pp. 278–287. [Google Scholar] [CrossRef]
- Menouer, T. KCSS: Kubernetes Container Scheduling Strategy. J. Supercomput. 2021, 77, 4267–4293. [Google Scholar] [CrossRef]
- Song, S.; Deng, L.; Gong, J.; Luo, H. Gaia Scheduler: A Kubernetes-Based Scheduler Framework. In Proceedings of the 2018 IEEE ISPA/IUCC/BDCloud/SocialCom/SustainCom, Melbourne, Australia, 11–13 December 2018; pp. 252–259. [Google Scholar] [CrossRef]
- Medel, V.; Rana, O.; Banares, J.A.; Arronategui, U. Adaptive Application Scheduling under Interference in Kubernetes. In Proceedings of the IEEE/ACM 9th International Conference on Utility and Cloud Computing (UCC), Shanghai, China, 6–9 December 2016; pp. 426–427. [Google Scholar] [CrossRef]
- Cho, E.J.; Kim, Y.H. Design of Scheduling Architecture for Policy-Driven Event Management in Kubernetes. In Proceedings of the 2021 KICS Fall Conference, Jeju, Republic of Korea, 24–26 November 2021; pp. 927–928. [Google Scholar]
- El Haj Ahmed, G.; Gil-Castineira, F.; Costa-Montenegro, E. KubCG: A Dynamic Kubernetes Scheduler for Heterogeneous Clusters. Softw. Pract. Exp. 2021, 51, 213–234. [Google Scholar] [CrossRef]
- Duque, R.; Arbelaez, A.; Díaz, J.F. Online over Time Processing of Combinatorial Problems. Constraints 2018, 23, 310–334. [Google Scholar] [CrossRef]
- Townend, P.; Clement, S.; Burdett, D.; Yarg, R.; Shaw, J.; Slater, B.; Xu, J. Improving Data Center Efficiency through Holistic Scheduling in Kubernetes. In Proceedings of the IEEE International Conference on Service-Oriented System Engineering (SOSE), San Francisco, CA, USA, 4–9 April 2019; pp. 156–166. [Google Scholar] [CrossRef]
- Kubernetes. Vertical Pod Autoscaler (VPA). Available online: https://github.com/kubernetes/autoscaler/tree/master/vertical-pod-autoscaler (accessed on 5 September 2025).
- AWS. Karpenter: A Kubernetes Node Autoscaler. Available online: https://karpenter.sh/ (accessed on 5 September 2025).
- Fisher, R.A. The Design of Experiments. Br. Med. J. 1936, 1, 554. [Google Scholar] [CrossRef]
- Montgomery, D.C. Design and Analysis of Experiments, 9th ed.; Wiley: Hoboken, NJ, USA, 2017. [Google Scholar]
- Amazon Web Services. Available online: https://aws.amazon.com/ (accessed on 30 July 2025).
- Amazon EC2. Available online: https://aws.amazon.com/ec2/ (accessed on 30 July 2025).
- Phoronix Test Suite. Available online: https://phoronix-test-suite.com/ (accessed on 30 July 2025).
- Minitab. Available online: https://minitab.co.kr/ (accessed on 30 July 2025).
- Hsu, H.; Lachenbruch, P.A. Paired t Test. In Wiley StatsRef: Statistics Reference Online; Wiley: Hoboken, NJ, USA, 2014. [Google Scholar] [CrossRef]
- Woolson, R.F. Wilcoxon Signed-Rank Test. In Wiley Encyclopedia of Clinical Trials; Wiley: Hoboken, NJ, USA, 2008; pp. 1–3. [Google Scholar] [CrossRef]
Disclaimer/Publisher’s Note: The statements, opinions and data contained in all publications are solely those of the individual author(s) and contributor(s) and not of MDPI and/or the editor(s). MDPI and/or the editor(s) disclaim responsibility for any injury to people or property resulting from any ideas, methods, instructions or products referred to in the content. |
© 2025 by the authors. Licensee MDPI, Basel, Switzerland. This article is an open access article distributed under the terms and conditions of the Creative Commons Attribution (CC BY) license (https://creativecommons.org/licenses/by/4.0/).