Abstract
The vehicle lateral position within a lane is critical in road safety, particularly on curved sections, where excessive deviations are often associated with crashes. This study analyses the effect of three traffic-calming measures on the lateral position of vehicles on curves with varying radii and turning directions. The experiment was conducted using a driving simulator with the participation of 48 drivers, assessing two leading indicators: the vehicle’s mean lateral position (LP) and the standard deviation of that position (SDLP). The results showed that, in curves, male drivers tended to drive further from the centre of the lane compared to female drivers. Additionally, female drivers exhibited less weaving in their trajectories (lower SDLP). Older drivers adopted more centred trajectories; however, SDLP increased with age. Drivers with higher annual exposure tended to drive further from the lane centre in curves. Among the traffic-calming measures, red-coloured transverse bands (CTB) reduced the lateral position by approximately 0.12 m in left curves. In contrast, red peripheral transverse bars (PTB) proved most effective in lowering lateral variability (SDLP). Geometric differences were also observed: greater curve radii were associated with lower SDLP values.
1. Introduction
In 2023, 19,175 crashes were recorded on rural two-lane roads in Spain. Of these, 6115 occurred on curves, including 1859 on unsigned curves, and 232 involved fatal crashes with at least one person killed. Fatality rates were higher on unsigned curves [1]. A vehicle’s lateral position within the lane is a significant factor in road safety. Several studies agree that road departures and head-on collisions are strongly linked to deviations in vehicle trajectory, particularly when drivers fail to maintain a steady lateral position, resulting in oscillations in the path followed [2,3]. Some researchers estimated that up to three out of four curve-related crashes were associated with excessive speed and poor lateral positioning [4,5,6]. In Spain, in 2023, and considering only curves on rural two-lane roads, there were 340 head-on crashes, 543 frontal–lateral, 221 side-impact, 903 related to road departures to the left, and 1579 linked to road departures to the right [1].
Driving simulators have become widespread in recent decades as a safe and flexible means of replicating real-world scenarios, enabling the study of phenomena such as driver behaviour on curves. By controlling environmental conditions, these virtual settings made it possible to isolate variables and accurately assess how different road design elements affected a vehicle’s lateral behaviour [7]. In addition, simulators offered a further advantage: they allowed testing traffic-calming measures without endangering drivers or interfering with real traffic conditions [8].
Individual driver-related factors influence driving behaviour, such as personal characteristics. Several studies indicated that male drivers tended to exhibit greater confidence behind the wheel and perceived traffic situations as less hazardous. In contrast, female drivers were likelier to adopt cautious and conservative driving styles [9,10,11]. Age was also a key factor: young drivers were more frequently involved in crashes due to riskier behaviour and a reduced ability to anticipate hazards [12,13]. In contrast, older drivers showed slower reaction times [14], which could hinder evasive manoeuvres or precise braking. In addition, annual driving exposure (i.e., kilometres driven per year) contributed to better vehicle control, improved risk perception, and more appropriate decisions in response to environmental conditions—although not necessarily slower or more conservative ones [15,16,17]. In driving simulator studies, it was observed that female and older drivers exhibited lower standard deviation of lateral position [18].
Road geometry also influenced the lateral position of the vehicle. Babic [19] and Barendwaard [20] highlighted the phenomenon of curve anticipation, whereby drivers shifted laterally to optimise their trajectory, which was more pronounced at higher speeds and on curves with smaller radii. Furthermore, various studies [4,21,22,23,24] demonstrated that reduced curve radii increased the risk of lane departure. Drivers tended to adopt more hazardous trajectories on left-hand curves and those with radii below 200 m [25]. Additionally, the geometric complexity of the road (including radius, direction, gradient, and turn length) was found to increase lateral displacement [26,27].
Some studies used variations in lateral position as an indicator to assess whether traffic-calming measures might have unintended adverse effects on driving behaviour [28,29,30,31]. On curves, it was observed that specific measures (road markings), such as rumble strips and transverse hatching, helped maintain a more centred trajectory [5,32,33]. Other research highlighted the role of road markings at intersections and transition zones, including dragon’s teeth, coloured zones, and optical circles, which also influenced lateral positioning [30,34,35]. Moreover, it was demonstrated that specific longitudinal markings close to the lane edge also affected vehicle placement [36].
Table 1 summarises the primary studies that quantify the effect of traffic-calming measures on the lateral displacement of the vehicle using driving simulators. Various studies employed the mean lateral position (LP) of the vehicle to analyse lateral displacement [2,5,8,32,33,34,35,36,37,38], while others used the standard deviation of lateral position (SDLP) as an indicator of trajectory stability [28,31,39,40]. Regarding the reference axis for calculating lateral position, some studies considered the axis of the lane in which the vehicle travelled [8,28,31,35,37,39,40], whereas others used the road centreline as a general reference [2,5,32,33,34,36,38]. From this perspective, a more centred trajectory, without large lateral oscillations, reflects safer driving [25].

Table 1.
Summary of studies on the effect of road markings on vehicle lateral position using a driving simulator.
This study aimed to evaluate the effectiveness of three traffic-calming measures—checkerboard patterns, red peripheral transverse bars, and red-coloured transverse bands—in modifying the vehicle’s lateral position in curves with varying radii and directions of turn. Additionally, the influence of driver characteristics such as age, gender, exposure (annual kilometres driven), and possession of an additional driving licence on lateral lane position was analysed through a driving simulator. This work constitutes a continuation of a previous study by the authors [41] on vehicle speed along the same road. That study found that male drivers drove at higher speeds than females, younger drivers exceeded older drivers in speed, and those with greater driving annual exposure maintained higher speeds. Furthermore, smaller radii were observed to produce greater speed reductions. Regarding the calming measures, the checkerboard pattern demonstrated greater effectiveness in curves with smaller radii, whereas the red-coloured transverse bands were more effective in curves with larger radii. The present study expands on this research by focusing on the lateral position of the vehicle rather than speed, aiming to identify which traffic-calming measures may help reduce hazardous lateral movements, particularly in curved sections. The study selected three measures with promising effectiveness in modifying driver behaviour: red peripheral transverse bars (PTB) and red-coloured transverse bands (CTB) were included because they had shown good results in previous research, while the checkerboard patterns (CBP) were chosen due to their frequent use on Spanish roads.
2. Materials and Methods
2.1. Road Design
The horizontal alignment comprised 10 curves (five pairs of radii: 26 m, 50 m, 85 m, 130 m, and 190 m) and 11 large tangents (Figure 1). The radii of circular curves were designed to achieve a specific operating speed (30, 40, 50, 60, or 70 km/h) following Spanish regulations [42]. The tangent between each curve was 500 m long, a distance considered sufficient to ensure the independence of each curve [42]. The tangent before the first curve and after the last one was 600 m long, allowing drivers to accelerate from a stationary position at the start and decelerate comfortably at the end of the experiment. All drivers completed the sequence of curves in the same fixed order, from C1 to C10. The deflection angle was always 90 gon. There were spirals before and after each circular curve (according to Spanish regulations). The vertical alignment was designed with a 0% grade to exclude it as a variable in the study. The cross-section was also designed according to Spanish regulations and consisted of two 3.5 m lanes, a 1 m shoulder, 0.75 m benches, and a superelevation of 7%.
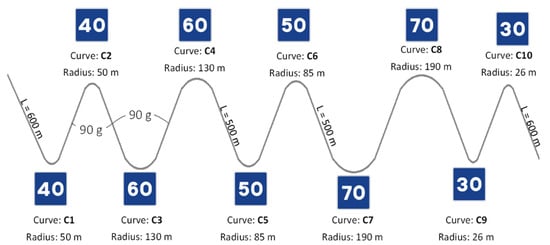
Figure 1.
Road horizontal alignment (L = tangent length) and operating speeds. The numbers shown in blue boxes (e.g., 40, 60, 50, 70, 30) indicate the recommended operating speeds (in km/h) for each curve based on their radius and design characteristics. Please note that the notation “90 g” in the figure refers to an angle of 90 gon (where 1 gon = 1/400 of a full circle).
2.2. Design of Road Markings
Four scenarios (or alternatives) were created to study the effect of traffic-calming measures on lateral position (Figure 2):
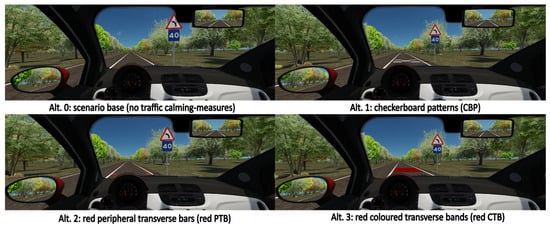
Figure 2.
Scenarios: Alt. 0 without traffic-calming measures; Alt. 1 with white checkerboard patterns (CBP); Alt. 2 with red peripheral transverse bars (PTB); Alt. 3 with red coloured transverse bands (CTB).
- The base scenario (Alt. 0) (without traffic-calming measures) serves as a reference to assess the effectiveness of the traffic-calming measures by comparing it with the other scenarios.
- Scenario 2 (Alt. 1): checkerboard patterns (CBP).
- Scenario 3 (Alt. 2): red peripheral transverse bars (PTB).
- Scenario 4 (Alt. 3): red-coloured transverse bands (CTB).
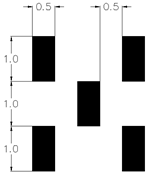
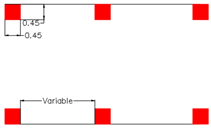
All traffic-calming measures began 200 m before the tangent’s end and the spiral’s start. The same vertical signs were used for all alternatives. At the beginning of each tangent, a sign indicating the road posted speed (90 km/h) was placed. Additionally, 200 m before each curve, a double sign was positioned, displaying the recommended maximum speed at the curve (according to Spanish regulations) and the direction of the curve (e.g., before the first curve, the double sign indicated that the recommended maximum speed was 40 km/h and the direction of the curve was left). Figure 1 shows the recommended speed at each curve, and Figure 2 shows the double sign placed before the first curve. No specific instructions about speed modification were provided to drivers, who were free to regulate their speed in accordance with the posted limits and recommendations. The road environment consisted of rural two-lane roads lined with trees, with clear, dry weather conditions and good visibility throughout the driving tests. Table 2 summarises the configuration details and references of the road marking alternatives implemented in the study, along with schematic representations of each marking type.

Table 2.
Summary of road marking configurations. Units in meters.
Forty-eight volunteers participated in the driving tests conducted in the simulator (Road Laboratory of the Escuela Técnica Superior de Ingenieros de Caminos, Canales y Puertos (Universidad Politécnica de Madrid)). The simulator is a fixed-base system running Assetto Corsa simulation software (Kunos Simulazioni Srl., Version 1.5, Rome, Italy). The visual system consisted of three 32-inch screens, with a combined resolution of 5760 × 1080 pixels and a refresh rate of 165 Hz, connected via DisplayPort. The driving cockpit comprised a Next Level Racing GT-Track seat, a Thrustmaster T-GT II steering wheel, T3PGT-II pedals and a TH8A Shifter Add-On. This simulator has been validated in previous speed studies [49].
2.3. Participants
Table 3 summarises the distribution of the sample (48 drivers) by gender (men—M, women—W), age (young—Y, middle-aged—MA, senior—S), annual driving exposure (<10,000—G1, 10,000–20,000—G2, >20,000—G3; km/year) and possession of other driving licences. These ages and genders mirror Spanish drivers [1]. The average age was 42.9 (standard deviation = 16.0, range = 20–73 years). The mean age of the participants’ driving licences was 22.4 years.

Table 3.
Characteristics of the driver sample.
All participants were volunteers, and they did not receive any remuneration. None of them were under the supervision or authority of the research team. All were informed of the research objectives and the trial conditions before it commenced, and a preliminary questionnaire was filled out. The data were processed anonymously. This study does not include details of ethnic origin, political opinions, religious beliefs, physical or mental health issues, trade union affiliation, or sexual life.
For the experimental tests, the procedure involved four stages designed to ensure complete data collection on participants’ driving experiences. The first stage lasted approximately 1 min, during which the simulator controls were explained to each participant. Participants completed a 3-min training drive within the simulator in the second stage. They used a test scenario different from the one used in the main experiment to familiarise themselves with the vehicle controls. In the third stage, participants randomly drove four scenarios (three with measures and one without) to exclude potential learning effects, each lasting 6 to 8 min, followed by a 3-min rest period. There was no traffic in the opposite direction. Finally, in the fourth stage, participants completed an evaluation questionnaire after all driving trials to gather information on their driving perceptions and any issues experienced, such as nausea or fatigue. No participants reported significant symptoms of simulator sickness during or after the driving sessions. The experimental procedure lasted 45 to 55 min per participant, including breaks.
2.4. Data Analysis
Ten control points were defined to measure participants’ lateral positions in curves and tangents (Table 4). Points P1, P2, and P10 are located on the tangent before and after each curve, while the others are situated within the curve (spiral and circular curve). As the case study consisted of 10 curves separated by tangents, lateral positions were analysed at 100 points on the road.

Table 4.
Control points in each curve and their tangents (before and after).
In this study, lateral position was defined as the distance between the vehicle’s centroid and the central axis of the lane, which was used as the reference point (value 0) (Figure 3). Deviations to the left of the axis were considered positive, while deviations to the right were assigned negative values [18]. Given that the vehicle width was 1.63 m, a lateral displacement exceeding 0.935 m (represented by the green lines in Figure 3) to either side was established to imply that part of the vehicle encroached upon the opposing lane or the hard shoulder. The red rectangle in Figure 3 represents the vehicle.

Figure 3.
Reference axis for the lateral position (LP) in this study. The green lines represent the lateral displacement limits (±0.935 m), and the red rectangle represents the vehicle (car).
Data analysis was conducted in several stages to identify the factors significantly influencing drivers’ lateral behaviour. Initially, the normality of the lateral position data was assessed using the Kolmogorov–Smirnov test, which verified whether the data met the assumptions required for applying parametric statistical models. Subsequently, a general linear model (GLM) was employed, focusing on two key dependent variables: LP and SDLP, the latter serving as a measure of trajectory variability. Both indicators were analysed separately for left and right curves, allowing detection of differences according to the direction of the curve. The model included independent factors comprising geometric variables (curve radius, type of road marking) and participant characteristics (gender, age, annual driving exposure, possession of an additional driving licence) for each curve direction. For factors found to be statistically significant, further analyses were conducted using descriptive plots and post hoc comparisons via Fisher’s LSD test at a 95% confidence level. Additionally, for LP, a complementary analysis of lane departures was carried out by evaluating the percentage of control points exceeding the lateral lane limits (±0.935 m), indicating encroachment onto the opposing lane or hard shoulder.
3. Results
According to the Kolmogorov–Smirnov test, the lateral position data showed a normal distribution (p-value < 0.0001). Table 5 and Table 6 present the results of the GLM applied to LP and SDLP, respectively, differentiating between left and right curves. The main effects and interactions of the factors with the traffic-calming alternative on both variables were evaluated. The table summarises the degrees of freedom (Df), F-ratios (F-Ratio), and p-values (p-Value) for each combination of dependent variable, curve direction, and factor analysed. Effects with p-values below 0.05, corresponding to a 95% confidence level, were considered statistically significant.

Table 5.
GLM results: main effects and interactions on LP in left- and right-hand curves. Significant effects are shown in bold. * indicates an interaction between the factors.

Table 6.
GLM results: main effects and interactions on SDLP in left- and right-hand curves. Significant effects are shown in bold. * indicates an interaction between the factors.
Gender, age, annual exposure, and curve radius were statistically significant (at the 95% confidence level) for both LP and its SDLP, regardless of steering direction (left or right curves). Significant interaction effects between the traffic-calming alternative and factors such as gender, age, and annual exposure were observed, but only for LP. Furthermore, possession of an additional driving licence was significant for both LP and SDLP in left curves, but not in right curves. No significant effects were found for the traffic-calming alternative alone, nor were there interactions with curve radius on either dependent variable. Likewise, no significant interaction effects were found between the alternative and possession of an additional licence.
3.1. Driver-Related Factors
Figure 4 presents the vehicle’s LP along the different sections of the curve, distinguishing between left and right curves. The analysis has been segmented according to driver characteristics (gender, age, annual exposure, and possession of an additional driving licence). Positive values indicate a position towards the left of the lane centreline, while negative values correspond to displacements towards the right.
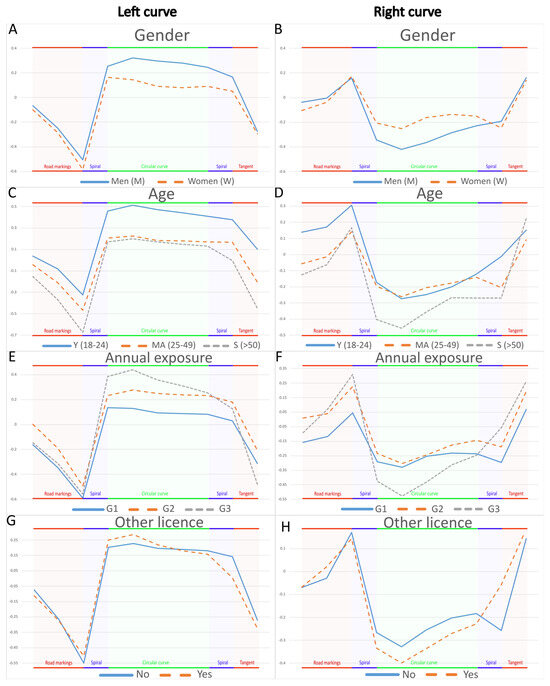
Figure 4.
LP according to driver characteristics (m). (A) Gender, left curves (M—men; W—women); (B) Gender, right curves (M—men; W—women); (C) Age, left curves (Y—18–24 years; MA—25–49 years; S—over 50 years); (D) Age, right curves (Y—18–24 years; MA—25–49 years; S—over 50 years); (E) Annual exposure, left curves (G1—<10,000 km/year; G2—10,000–20,000 km/year; G3—over 20,000 km/year); (F) Annual exposure, right curves (G1—<10,000 km/year; G2—10,000–20,000 km/year; G3—over 20,000 km/year); (G) Other licence, left curves (Yes; No); (H) Other licence, right curves (Yes; No). Red sections = tangent; blue sections = spiral transition curves; green sections = curve.
Systematic differences in LP along the curve were observed according to the analysed human factors. Regarding gender, in left curves (Figure 4A; F = 21.22, p = 0.0192; Table 5), male drivers tended to position themselves further from the lane centreline compared to females, moving closer to the opposite lane (at the curve centre: M = 0.296 m, W = 0.092 m). Additionally, on approach to the curve, women drove closer to the right verge, an average of 10 cm further from the lane centre than men. In right curves (Figure 4B; F = 15.63, p = 0.0289; Table 5), men also deviated more from the centerline, but in this case towards the right verge (at the curve centre: M = −0.364 m, W = −0.162 m).
Regarding age, differentiated patterns were identified with significant differences (Fisher LSD post hoc) between the group over 50 years (S) and the younger groups (Y/MA), in both left and right curves. In left curves (Figure 4C; F = 150.63, p < 0.0001; Table 5), senior drivers showed the most significant deviation towards the right verge before entering the curve (end of straight: S = −0.674 m), subsequently driving closer to the lane centre during the curve (curve centre: S = 0.172 m). Conversely, younger drivers remained closer to the centreline on entry but showed greater deviation towards the opposite lane during the curve (quarter curve: Y = 0.513 m). In right curves (Figure 4D; F = 43.88, p < 0.0001; Table 5), this pattern reversed: younger drivers positioned themselves closer to the opposite lane on approach (spiral start: Y = 0.307 m), then drove nearer the lane centre during the circular segment, whereas seniors remained nearer the centreline on entry but progressively moved closer to the right verge throughout the curve (quarter curve: S = −0.456 m).
Significant differences were also observed in annual exposure (Fisher LSD post hoc) between the low driven annual exposure group (G1) and the higher annual exposure groups (G2 and G3). In left curves (Figure 4E; F = 38.34, p < 0.0001; Table 5), G1 showed the most significant deviation towards the verge on curve entry (spiral start: G1 = 0.385 m) but remained more centred during the curve (quarter curve: G1 = 0.130 m). By contrast, G3 drivers positioned themselves closer to the opposite lane throughout the circular segment (quarter curve: G3 = 0.440 m). In right curves (Figure 4F; F = 58.21, p < 0.0001; Table 5), G1 maintained negative values throughout most of the curve (right of lane centreline), while drivers with higher annual exposure, especially G3, drove closer to the right verge in the circular segment (quarter curve: G3 = −0.528 m).
Possession of another driving licence was also associated with differences in lateral position. In left curves (Figure 4G; F = 5.46, p = 0.0195; Table 5), drivers holding another licence positioned themselves closer to the opposite lane during the curve (quarter curve: 0.285 m vs. 0.227 m). In right curves (Figure 4H; F = 3.32, p = 0.0683; Table 5), the effect was significant at the 90% confidence level and showed a similar pattern of greater deviation from the lane centreline, although here the displacement was towards the verge and less pronounced.
Figure 5 shows the participants’ SDLP, broken down by different driver factors. The upper graph presents the mean SDLP values recorded in the left curves, while the lower graph shows the corresponding data for the right curves. The central points represent the mean values, and the small horizontal lines indicate ±1 standard deviation.
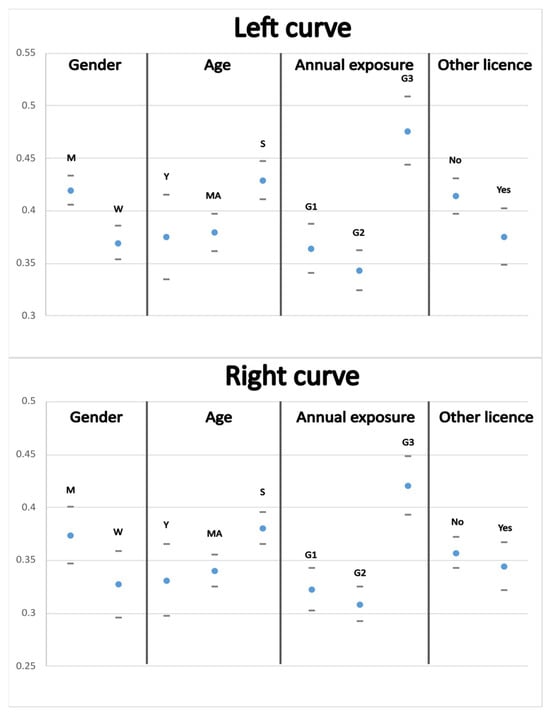
Figure 5.
SDLP according to driver characteristics (m): gender (M—men; W—women), age (Y—18–24 years; MA—25–49 years; S—>50 years), annual exposure (G1—<10,000 km/year; G2—10,000–20,000 km/year; G3—>20,000 km/year), other licence (Yes; No). The central points represent the mean SDLP values, and the small horizontal lines indicate ±1 standard deviation.
Analysis of SDLP in left curves revealed statistically significant differences between driver groups (Figure 5; p < 0.05; Table 6). Regarding gender, men exhibited greater lateral oscillation than women, with an average difference of approximately 5 cm. Age also had a notable effect: drivers over 50 years (group S) recorded the highest SDLP, with differences of up to 5 cm compared to younger (Y) and middle-aged (MA) groups. Concerning annual exposure, drivers in the highest group (G3) showed significantly higher lateral variability, exceeding groups G1 and G2 by more than 10 cm, with marked differences between G1 and G3. Significant differences were also found based on possession of other driving licences, with a 4 cm higher SDLP for drivers without an additional licence in left curves. In right curves, no significant differences between groups were observed for this variable (p > 0.05, Table 6).
3.2. Geometric Factors
Figure 6 shows the vehicle’s LP along the different sections of the curve, distinguishing between left and right curves. The analysis is segmented according to two geometric factors of the road: firstly, the type of traffic-calming measure used (Alt. 0 to Alt. 3), and secondly, the curve radius (ranging from 26 to 190 m). Positive values indicate a position to the left of the lane centreline, while negative values correspond to displacements to the right.
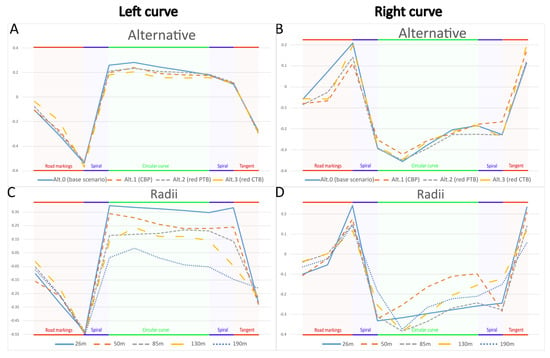
Figure 6.
LP according to geometric characteristics of the road (m). (A) Alternative, left curves (Alt. 0—baseline scenario; Alt. 1—CBP; Alt. 2—red PTB; Alt. 3—red CTB); (B) Alternative, right curves (Alt. 0—baseline scenario; Alt. 1—CBP; Alt. 2—red PTB; Alt. 3—red CTB); (C) Curve radius, left curves (26—radius = 26 m; 50—radius = 50 m; 85—radius = 85 m; 130—radius = 130 m; 190—radius = 190 m); (D) Curve radius, right curves (26—radius = 26 m; 50—radius = 50 m; 85—radius = 85 m; 130—radius = 130 m; 190—radius = 190 m). Red sections = tangent; blue sections = spiral transition curves; green sections = curve.
The analysis of the effect of the road marking alternatives on lateral position showed slight differences in the sections where these markings were installed (p > 0.05, Table 5). In both curve directions (Figure 6A,B), vehicle trajectories tended to diverge slightly in the road marking area (straight sections prior to the curve). However, trajectories were more similar across alternatives during the circular curve sections, which may have attenuated the overall effect and explained the lack of statistically significant differences. Generally, the baseline scenario without calming measures (Alt. 0) showed lateral displacement values further from the lane centreline. In left curves, 100 m before the end of the straight, Alt. 0 recorded a mean position of −0.311 m relative to the lane centreline (right side of the lane), whereas with red CTB (Alt. 3), this distance decreased to −0.193 m. In right curves, CBP (Alt. 1) showed the most centred value at the end of the straight (Alt. 0 = 0.207 m; Alt. 1 = 0.111 m).
Regarding the effect of curve radius values on vehicle lateral position, no significant differences were observed on the straight approach to the curve (p > 0.05; Table 5). However, in the sections corresponding to the circular left curves, a clear trend was observed: as radius increased, drivers tended to position themselves closer to the lane centreline, with smaller displacements towards the opposite lane (Figure 6C). For example, at the centre of the circular curve, the mean lateral displacement decreased from 0.374 m with a radius of 26 m to 0.012 m with a radius of 190 m. This pattern was consistent both in the first quarter of the curve and on exit, where values decreased from 0.383 m (R = 26 m) to −0.146 m (R = 190 m), reflecting a closer proximity to the centreline and even a slight shift towards the right verge at larger radii. In contrast, right curves showed no clear pattern and greater variability in vehicle lateral position (Figure 6D).
Figure 7 presents SDLP according to the road’s geometric factors. The upper graph shows the mean SDLP values recorded in the left curves, while the lower graph depicts the data for the right curves. The analysis considers, on the one hand, the different alternatives of calming measures (road markings) and, on the other, the curve radii evaluated. As in Figure 5, the central points represent the mean values, and the small horizontal lines indicate ±1 standard deviation.
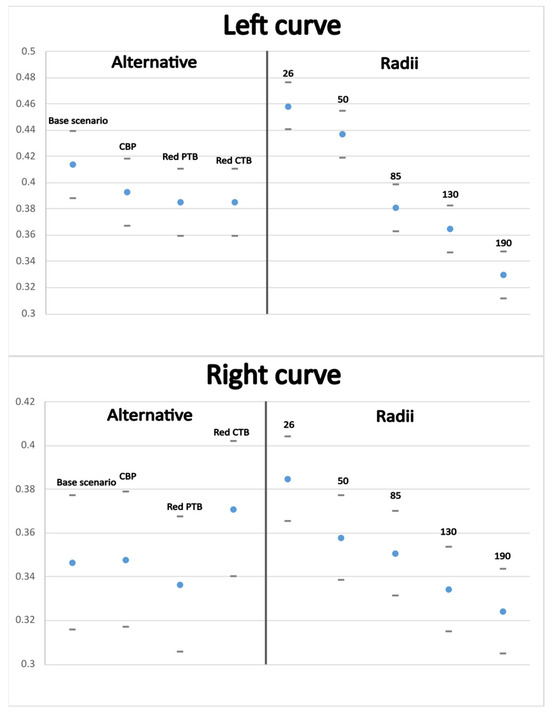
Figure 7.
SDLP according to geometric road factors (m): alternative (Alt. 0—baseline scenario; Alt. 1—CBP; Alt. 2—red PTB; Alt. 3—red CTB), curve radius (26—radius = 26 m; 50—radius = 50 m; 85—radius = 85 m; 130—radius = 130 m; 190—radius = 190 m). The central points represent the mean SDLP values, and the small horizontal lines indicate ±1 standard deviation.
Regarding SDLP, relevant differences were observed depending on the geometric factors analysed (Figure 7, Table 6). Concerning the type of road marking, Alt. 2 (red PTB) showed the lowest variability in both curve directions, standing out as the most stable option (left curve: SDLP = 0.385 m; right: SDLP = 0.336 m). In contrast, for right-hand curves, the red CTB configuration (Alt. 3) showed the highest lateral variability (SDLP = 0.371 m), even exceeding that of the baseline scenario (SDLP = 0.346 m). Concerning curve radius, a clear pattern was identified in both directions: the greater the radius, the lower the SDLP, indicating more stable trajectories. For example, in left-hand curves, SDLP decreased from 0.458 m on the sharpest curve (26 m radius) to 0.330 m on the widest (190 m radius), while in right-hand curves it dropped from 0.385 m (26 m) to 0.324 m (190 m).
3.3. Lane Departure
Given that the average vehicle width is 1.63 m, a lateral departure is considered to occur when the lateral position exceeds ±0.935 m relative to the centreline of the lane. Table 7 shows the frequency of lane departures, distinguishing between departures into the opposite lane (values greater than 0.935 m) and towards the right shoulder (values less than −0.935 m). The data are presented by curve direction (left or right) and type of departure (opposite lane or shoulder), and they are grouped according to driver characteristics and road geometry factors. For each combination, the proportion of control points where a lateral departure was detected is indicated and expressed as a relative percentage (%).

Table 7.
Frequency (%) of lateral vehicle departures according to driver characteristics and geometric factors. Gender (M—men; W—women), age (Y—18–24 years; MA—25–49 years; S—>50 years), annual driven exposure (G1—<10,000 km/year; G2—10,000–20,000 km/year; G3—>20,000 km/year), Other licence (YES—with other licence; NO—without other licence), alternative (ALT.0—baseline scenario; ALT.1—CBP; ALT.2—red PTB; ALT.3—red CTB), Curve radius (R26—radius = 26 m; R50—radius = 50 m; R85—radius = 85 m; R130—radius = 130 m; R190—radius = 190 m).
The analysis of lane departure events revealed notable differences depending on curve type, departure direction, and driver characteristics.
Regarding departures into the opposite lane (lateral displacement > 0.935 m), the highest percentage was observed in left-hand curves for the R26 subtype, with 7.03% of events, followed by group G3 (6.67%) and male drivers (5.13%). In right-hand curves, group G3 again showed the highest rate, with 2.00%, followed by Alt 3 (1.92%) and male drivers (1.90%).
The highest percentages were recorded in right-hand curves for departures towards the shoulder (lateral displacement < −0.935 m). Group G3 stood out with 6.83% of departures, followed by R26 (5.63%) and male drivers (5.61%). In left-hand curves, the highest rate was recorded for the senior group (S) at 4.08%. These findings indicate that group G3 experienced the most significant number of departures in three of the four analysed conditions.
Male drivers also exhibited higher departure rates than females across all scenarios, particularly in right-hand curves with shoulder departures.
Regarding road geometry, the R26 curve subtype and the baseline scenario (Alt. 0) were associated with a higher risk of opposite lane invasions. Overall, the total percentages of departure events were: 3.92% for opposite lane departures in left-hand curves, 1.58% in right-hand curves, 2.39% for shoulder departures in left-hand curves, and 3.64% in right-hand curves.
3.4. Relationship Between Speed and Lateral Position
Figure 8 complements the lateral position (LP) results with the speed data reported in the authors’ previous work [41]. It shows the mean speed (km/h) together with the mean lateral position (m) for each factor level, in left-hand curves (top) and right-hand curves (bottom).
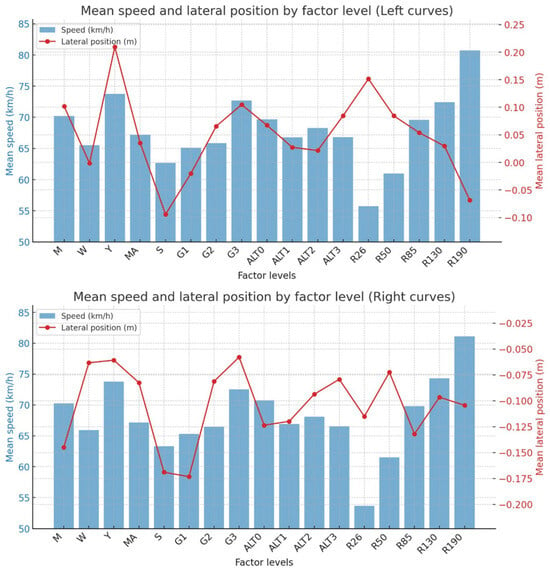
Figure 8.
Mean speed (km/h, left axis) and mean lateral position (LP) (m, right axis) by factor level: Gender (M—men; W—women), Age (Y—18–24 years; MA—25–49 years; S—>50 years), Annual driven exposure (G1—<10,000 km/year; G2—10,000–20,000 km/year; G3—>20,000 km/year), Alternative (ALT.0—baseline scenario; ALT.1—CBP; ALT.2—red PTB; ALT.3—red CTB), and Curve radius (R26—26 m; R50—50 m; R85—85 m; R130—130 m; R190—190 m).
Among the personal characteristics, young drivers’ most significant mean lateral displacement is observed, reaching 0.20 m, with an associated speed of almost 75 km/h in left-hand curves. Regarding the geometric characteristics, the most significant lateral displacement corresponds to curves with a 26 m radius (0.15 m), although these are driven at a considerably lower mean speed (55 km/h).
4. Discussion
4.1. Driver-Related Factors
The results reflected consistent differences in lateral behaviour according to driver gender, aligning with previous findings in the literature. In left-hand curves, male drivers tended to position themselves further from the lane centreline, showing greater proximity to the opposing traffic side at the curve apex, whereas female drivers maintained more centred trajectories. This pattern was also observed in right-hand curves, where men adopted positions closer to the lane edge, deviating more from the centreline than women. This tendency suggested that male drivers followed wider lateral paths, likely seeking greater driving comfort, albeit at the expense of reduced clearance from the opposing lane or shoulder. The higher SDLP recorded among men supported this interpretation, indicating reduced directional stability. These findings were consistent with Galante et al. [18], who also reported higher SDLP in male drivers than females.
Lane departure events revealed that men exhibited higher rates under all conditions, particularly in right-hand curves with departures towards the inner shoulder. These gender-related differences were likely linked to greater perceived confidence at the wheel and a lower risk perception among male drivers, as noted by Harré et al., Vavrik, and Lyu et al. [9,10,11], who described male driving styles as more risk-oriented compared to the more cautious and regulated approach typically observed among female drivers. The findings suggested that the male driving style, although potentially aimed at maximising comfort (i.e., reducing centrifugal acceleration), entailed a higher likelihood of trajectories that compromised lane-keeping.
Apparent differences in vehicle lateral displacement were also found across age groups, particularly between drivers over 50 and younger cohorts. In left-hand curves, older drivers approached the curve nearer to the right-hand shoulder during the preceding straight but adopted more centred trajectories within the curve. In contrast, younger drivers approached closer to the lane centreline but deviated more towards the opposing traffic side through the curve. This strategy, involving greater variation in the trajectory, may have reflected a more variable but riskier driving pattern. In right-hand curves, the pattern reversed: younger drivers initially positioned closer to the opposing lane but then maintained a more centred path, whereas older drivers gradually drifted towards the right-hand shoulder. This difference was likely associated with a more cautious approach among senior drivers, aiming to avoid encroachment into hazardous zones. From a comfort perspective, the wider trajectories observed in younger drivers could reduce centrifugal acceleration, potentially offering a smoother driving experience. However, this occurred at the cost of reduced clearance from the opposing lane, which might compromise safety—particularly on two-way roads. Older drivers, by contrast, followed more restrained trajectories, although their higher SDLP values suggested lower lateral stability, possibly due to limitations in vehicle control or reduced ability for continuous adjustment. These SDLP findings diverged from those reported by Galante et al. [18], who found that older individuals demonstrated better lateral control, with lower SDLP values than other age groups. One possible explanation for this discrepancy is related to age group definitions: while Galante et al. used 35 years as the age threshold, the present study applied a 50-year cut-off. Nevertheless, the results aligned with previous studies that highlighted a greater risk propensity among younger drivers [12,13], and a progressive decline in perceptual–motor skills in older drivers [14]. The data suggested that younger and older age groups were associated with driving styles that may entail specific risks: in younger drivers, due to more aggressive trajectories; in older drivers, due to reduced precision and directional stability.
Significant differences in lateral behaviour were also identified in annual driving exposure. In left-hand curves, drivers with lower driven annual exposure (G1) deviated more towards the opposing lane during the curve approach but adopted more centred paths. In contrast, those with higher yearly exposure (G3) remained closer to the opposing lane throughout the curve, indicating wider and potentially more comfortable trajectories (i.e., lower centrifugal acceleration). A similar pattern emerged in right-hand curves: while G1 drivers maintained trajectories closer to the centreline, G3 drivers stayed nearer to the right-hand shoulder. This strategy could reflect a comfort-oriented driving style, softening the turn radius via a wider path. However, it also implied greater lateral space use, potentially increasing the risk of lane departure. The higher SDLP recorded in G3 and a greater rate of departures suggested that higher annual exposure did not always translate into more stable vehicle control. Although frequent driving might enhance environment-sensitive decisions and refine risk perception [15,16], it could also be associated with a more relaxed or automated driving style, prioritising comfort over strict lane adherence.
Possessing an additional driving licence was also associated with lateral behaviour differences, particularly in left-hand curves. Drivers holding another licence (e.g., motorcycle or heavy vehicle) tended to follow wider paths, approaching the opposing lane more closely during the curve, possibly indicating greater familiarity with spatial control or a tendency to smooth the trajectory for improved turning comfort. However, drivers without an additional licence exhibited greater SDLP, indicating reduced directional stability. The differences were insignificant, although a similar pattern was observed in right-hand curves. Overall, the findings showed that experience with other vehicle types might lead to more efficient trajectory planning, albeit with greater lateral occupation—particularly towards the inside of the curve.
The results concerning speed reduction and lateral behaviour revealed consistent patterns closely tied to driver-related factors. Just as male and younger drivers had previously been observed to delay deceleration and display riskier behaviours [41], the same groups tended to describe wider paths in terms of lateral displacement. This strategy may have been intended to maintain higher speeds without excessively increasing centrifugal acceleration by enlarging the turning radius. However, such paths also exhibited greater lateral variability, possibly reflecting reduced fine control or a more demanding driving style. In contrast, women, older drivers, and those with lower annual exposure adopted a more cautious and centred approach, adjusting their speed earlier and maintaining more stable and restrained trajectories throughout the curve.
4.2. Geometric Factors
Although the differences between alternatives were not statistically significant (p > 0.05), a slight tendency towards more central trajectories was observed in the approach section, where the markings had been installed. The scenario without intervention (Alt. 0) in left-hand curves showed the most significant deviation towards the opposing lane. Regarding lateral displacement, the CTB resulted in more central trajectories in left-hand curves, while CBP achieved this in right-hand curves, both performing better than the baseline scenario. Additionally, the PTB yielded the best results in terms of lateral stability, as they recorded the lowest SDLP values in both curve directions.
These findings on lateral positioning were consistent with previous observations regarding speed modulation [41], which showed that speed reductions were triggered by the early presence of road markings, suggesting that drivers responded to visual stimuli before entering the curve. However, as with speed, the effect of the markings diminished once the vehicle was inside the curve. The comparison between alternatives also revealed differentiated behavioural responses: CBP promoted a gradual deceleration, whereas red CTB elicited a sharper response during the initial phase. Regarding lateral displacement, the various markings serve distinct purposes, such as encouraging more central trajectories or enhancing stability. However, none produced statistically significant changes throughout the curve.
The results showed that curve radius significantly influenced lateral vehicle behaviour, although the effect varied according to the trajectory phase and the curve direction. No significant differences were detected in the straight section before the curve, suggesting that lateral positioning was not yet affected by the upcoming geometry. However, a clear pattern emerged in left-hand curves: drivers tended to stay closer to the lane centreline as the radius increased, reducing their deviation towards the opposing traffic side. This behaviour was consistent across all curve phases—entry, apex, and exit—indicating more controlled trajectories in curves with larger radii. This greater consistency could be attributed to the reduction in centrifugal acceleration as the radius increased, reducing the need for drivers to adopt wider paths to improve comfort.
In contrast, no clear trend was identified in right-hand curves, where lateral position values showed greater variability. Nevertheless, in terms of directional stability—measured via SDLP—a coherent pattern emerged in both curve directions: larger radii were associated with lower lateral variability. This suggested that in wider curves, drivers could maintain trajectories with more constant turning radii, without requiring frequent steering corrections, translating into more stable and precise driving.
These results aligned with previous studies that identified small-radius curves as a factor that made stable trajectory planning more difficult and increased the risk of lane departures [21,22,23]. Additionally, research by Babic [19] and Barendwaard [20] highlighted the phenomenon of curve preparation, whereby drivers adjusted their lateral position more actively when approaching tight curves. This behaviour could explain part of the oscillations observed in the preceding straight sections. Likewise, geometric complexity had been documented as a factor increasing lateral displacement [26,27], particularly in left-hand curves with radii below 200 m [25]. As the radius increased, drivers tended to follow more central and stable paths, with reduced SDLP, which was associated with smoother speed adaptation through the curve [41]. In contrast, sharper curves imposed greater geometric demands, resulting in more variable trajectories and a sharper deceleration over shorter distances—thus increasing the risk of loss of control.
5. Conclusions
The main conclusions are as follows:
- Male drivers exhibited greater lateral variability and a higher tendency to depart from the lane than female drivers, indicating a riskier driving style.
- Younger drivers followed more aggressive trajectories, often closer to the opposing lane, while older drivers tended to remain nearer the centreline, albeit with reduced lateral stability. This highlighted distinct risk profiles associated with each age group.
- Higher annual driving exposure (in kilometres) was associated with wider and smoother trajectories, increased lateral oscillation, and frequent lane departures, suggesting that greater exposure does not necessarily equate to improved vehicle control.
- Drivers with additional driving licences (e.g., motorcycle or heavy vehicle) tended to adopt wider and potentially more comfortable paths, with increased lateral occupation. In contrast, those without another licence showed more irregular trajectories with greater lateral oscillation.
- Road markings (installed on the approach section) did not produce significant differences throughout the curve, but they did help to centre vehicle trajectories before curve entry. CTB markings improved trajectory centring in the approach to left-hand curves, CBP markings did so for right-hand curves, and the PTB network was the most effective in reducing lateral variability across the entire curve.
- Curve radius impacts vehicle trajectories: Wider radii allow for more central and less erratic paths, whereas tighter radii are associated with greater lateral deviation and more oscillatory trajectories.
This study has several limitations that should be considered. The tested interventions were limited to traffic-calming measures placed exclusively before the curves; no in-curve or explicit trajectory-guidance treatments were evaluated. Only passenger cars were considered. In addition, experiments were conducted under controlled conditions (daytime, good visibility, no adverse weather, no opposing traffic, neutral roadside environment with minimal potential distractions). Overtaking was prohibited throughout the study section, with a single continuous centreline separating the traffic directions, eliminating the possible influence of overtaking manoeuvres and related driver distraction.
Future work could examine the longitudinal placement of measures—extending them to the curve entry and/or exit—and evaluate lane widening (extra lane width) prescribed for small-radius curves. It could also incorporate traffic presence, nighttime conditions, other variables (e.g., driver attention, acceleration profiles, mental workload, and visibility). Beyond passenger cars, analyses could be extended to heavy vehicles. Additionally, future work could test motorcyclist-specific treatments and lane-guidance-specific measures for passenger cars.
The results of this study have practical applications in both the design and operation of road infrastructure. In the design stage, they can help road authorities combine geometry, signage, and the most effective traffic-calming measures to reduce run-off-road crashes. In the operational phase, they support creating evidence-based protocols to select the most suitable corrective measures in high-risk sections, ensuring that investments are prioritised towards the most effective solutions. Because the findings are based on simulated scenarios, they avoid the need for temporary pilot installations, reducing costs and eliminating safety risks during testing. Finally, considering the variability in driver responses, measures can be strategically allocated according to road context and user profiles, identified through official statistics, surveys, or land-use patterns.
Author Contributions
Conceptualization, M.C.; methodology, R.E., M.M.-G., M.C. and S.M.-C.; formal analysis, S.M.-C.; data curation, S.M.-C.; writing—original draft preparation, R.E., M.M.-G., M.C. and S.M.-C.; writing—review and editing, R.E., M.M.-G., M.C. and S.M.-C.; supervision, M.C.; funding acquisition, M.C. All authors have read and agreed to the published version of the manuscript.
Funding
Grant PID2021-122471OB-I00 funded by MICIU/AEI/10.13039/501100011033 and by ERDF/EU.
Institutional Review Board Statement
Not applicable.
Informed Consent Statement
Informed consent was obtained from all subjects involved in the study.
Data Availability Statement
The original contributions presented in this study are included in the article. Further inquiries can be directed to the corresponding author.
Conflicts of Interest
The authors declare no conflicts of interest.
Abbreviations
The following abbreviations are used in this manuscript:
| CBP | Checkerboard patterns |
| CTB | Coloured transverse bands |
| Df | Degrees of freedom |
| G1 | <10,000 km/year |
| G2 | 10,000–20,000 km/year |
| G3 | >20,000 km/year |
| GLM | General lineal model |
| LP | Mean lateral position |
| M | Men |
| MA | 25–49 years |
| PTB | Peripheral transverse bars |
| S | >50 years |
| SDLP | Standard deviation of lateral position |
| W | Women |
| Y | 18–24 years |
References
- DGT. Anuario Estadístico Anual 2023. 2024. Available online: https://www.dgt.es/export/sites/web-DGT/.galleries/downloads/dgt-en-cifras/publicaciones/Anuario_Estadistico_General/Anuario-Estadistico-General-2023.pdf (accessed on 7 April 2025).
- Rosey, F.; Auberlet, J.M.; Bertrand, J.; Plainchault, P. Impact of perceptual treatments on lateral control during driving on crest vertical curves: A driving simulator study. Accid. Anal. Prev. 2008, 40, 1513–1523. [Google Scholar] [CrossRef] [PubMed]
- Yan, X.; Abdel-Aty, M.; Radwan, E.; Wang, X.; Chilakapati, P. Validating a driving simulator using surrogate safety measures. Accid. Anal. Prev. 2008, 40, 274–288. [Google Scholar] [CrossRef] [PubMed]
- Calvi, A. A Study on Driving Performance Along Horizontal Curves of Rural Roads. J. Transp. Saf. Secur. 2014, 7, 243–267. [Google Scholar] [CrossRef]
- Charlton, S.G. The role of attention in horizontal curves: A comparison of advance warning, delineation, and road marking treatments. Accid. Anal. Prev. 2007, 39, 873–885. [Google Scholar] [CrossRef]
- Zegeer, C.; Stewart, R.; Council, F.; Neuman, T.; Hamilton, E.; Miller, T.; Hunter, W. Cost-Effective Geometric Improvements for Safety Upgrading of Horizontal Curves (No. FHWA-RD-90-021); United States Department of Transportation, Federal Highway Administration: Washington, DC, USA, 1991. [Google Scholar]
- Godley, S.T. A Driving Simulator Investigation of Perceptual Countermeasures to Speeding; Monash University: Melbourne, Australia, 1999. [Google Scholar]
- Akbari, A.; Haghighi, F. Traffic calming measures: An evaluation of four low-cost TCMs’ effect on driving speed and lateral distance. IATSS Res. 2020, 44, 67–74. [Google Scholar] [CrossRef]
- Harré, N.; Field, J.; Kirkwood, B. Gender differences and areas of common concern in the driving behaviors and attitudes of adolescents. J. Saf. Res. 1996, 27, 163–173. [Google Scholar] [CrossRef]
- Lyu, N.; Cao, Y.; Wu, C.; Xu, J.; Xie, L. The effect of gender, occupation and experience on behavior while driving on a freeway deceleration lane based on field operational test data. Accid. Anal. Prev. 2018, 121, 82–93. [Google Scholar] [CrossRef]
- Vavrik, J. Brief Report: Personality and risk-taking: A brief report on adolescent male drivers. J. Adolesc. 1997, 20, 461–465. [Google Scholar] [CrossRef]
- Blockey, P.N.; Hartley, L.R. Aberrant driving behaviour: Errors and violations. Ergonomics 1995, 38, 1759–1771. [Google Scholar] [CrossRef]
- Doherty, S.T.; Andrey, J.C.; MacGregor, C. The situational risks of young drivers: The influence of passengers, time of day and day of week on accident rates. Accid. Anal. Prev. 1998, 30, 45–52. [Google Scholar] [CrossRef]
- Stelmach, G.E.; Nahom, A. Cognitive-motor abilities of the elderly driver. Hum. Factors 1992, 34, 53–65. [Google Scholar] [CrossRef]
- Elvik, R. Some difficulties in defining populations of “entities” for estimating the expected number of accidents. Accid. Anal. Prev. 1988, 20, 261–275. [Google Scholar] [CrossRef] [PubMed]
- Groeger, J.A.; Clegg, B.A. Why isn’t driver training contributing more to road safety? In Proceedings of the Behavioural Research in Road Safety Iv, Proceedings of the A Seminar, London, UK, 6–7 September 1993; Brunel University: London, UK, 2025.
- Jørgensen, F.; Polak, J. The Effect of Personal Characteristics on Drivers’ Speed Selection: An Economic Approach. J. Transp. Econ. Policy 1993, 27, 237–252. [Google Scholar]
- Galante, F.; Mauriello, F.; Pernetti, M.; Rella Riccardi, M.; Montella, A. Effects of traffic control devices on rural curve lateral position. Transp. Res. Rec. 2022, 2676, 162–180. [Google Scholar] [CrossRef]
- Babić, D.; Fiolić, M.; Babić, D.; Gates, T. Road markings and their impact on driver behaviour and road safety: A systematic review of current findings. J. Adv. Transp. 2020, 2020, 7843743. [Google Scholar] [CrossRef]
- Barendswaard, S.; Van Breugel, L.; Schelfaut, B.; Sluijter, J.; Zuiker, L.; Pool, D.M.; Boer, R.B.; Abbink, D.A. Effect of velocity and curve radius on driver steering behaviour before curve entry. In Proceedings of the 2019 IEEE International Conference on Systems, Man and Cybernetics (SMC), Bari, Italy, 6–9 October 2019; IEEE: New York, NY, USA, 2019; pp. 3866–3871. [Google Scholar] [CrossRef]
- Ben-Bassat, T.; Shinar, D. Effect of shoulder width, guardrail and roadway geometry on driver perception and behavior. Accid. Anal. Prev. 2011, 43, 2142–2152. [Google Scholar] [CrossRef]
- Comte, S.L.; Jamson, A.H. Traditional and innovative speed-reducing measures for curves: An investigation of driver behaviour using a driving simulator. Saf. Sci. 2000, 36, 137–150. [Google Scholar] [CrossRef]
- Lin, Y.; Niu, J.F.; Xu, Y. Study on Characteristics of Vehicle Path in Curves on Two-lane Highways. Gonglu Jiaotong Keji. J. Highw. Transp. Res. Dev. 2011, 28, 113–117. [Google Scholar]
- Liu, J.; Wang, X.; Zhang, R. A vehicle stability study of combined alignments on mountainous freeways: A driving simulator-based approach. In Proceedings of the CICTP 2016, Shanghai, China, 6–9 July 2016; pp. 1546–1557. [Google Scholar]
- Mauriello, F.; Montella, A.; Pernetti, M.; Galante, F. An Exploratory Analysis of Curve Trajectories on Two-Lane Rural Highways. Sustainability 2018, 10, 4248. [Google Scholar] [CrossRef]
- Jeong, H.; Liu, Y. Effects of non-driving-related-task modality and road geometry on eye movements, lane-keeping performance, and workload while driving. Transp. Res. Procedia Part F Traffic Psych. Behav. 2019, 60, 157–171. [Google Scholar] [CrossRef]
- Kang, X.; Namgung, M.; Fujiwara, A.; Kim, W.; Wang, W. Analysis of vehicle maneuverability and driving characteristics on a curved road condition. KSCE J. Civ. Eng. 2019, 23, 420–432. [Google Scholar] [CrossRef]
- Ariën, C.; Jongen, E.M.; Brijs, K.; Brijs, T.; Daniels, S.; Wets, G. A simulator study on the impact of traffic calming measures in urban areas on driving behavior and workload. Accid. Anal. Prev. 2013, 61, 43–53. [Google Scholar] [CrossRef]
- Ariën, C.; Brijs, K.; Brijs, T.; Ceulemans, W.; Vanroelen, G.; Jongen, E.M.M.; Daniels, S.; Wets, G. Does the effect of traffic calming measures endure over time?—A simulator study on the influence of gates. Transp. Res. Part F Traffic Psychol. Behav. 2014, 22, 63–75. [Google Scholar] [CrossRef]
- Hussain, Q.; Pirdavani, A.; Ariën, C.; Brijs, T.; Alhajyaseen, W. The impact of perceptual countermeasures on driving behavior in rural-urban transition road segments: A driving simulator study. Adv. Transp. Stud. 2018, 46, 83–96. [Google Scholar]
- Merat, N.; Jamson, A.H. The effect of three low-cost engineering treatments on driver fatigue: A driving simulator study. Accid. Anal. Prev. 2013, 50, 8–15. [Google Scholar] [CrossRef]
- Ariën, C.; Brijs, K.; Vanroelen, G.; Ceulemans, W.; Jongen, E.M.M.; Daniels, S.; Brijs, T.; Wets, G. The effect of pavement markings on driving behaviour in curves: A simulator study. Ergonomics 2017, 60, 701–713. [Google Scholar] [CrossRef]
- Babić, D.; Brijs, T. Low-cost road marking measures for increasing safety in horizontal curves: A driving simulator study. Accid. Anal. Prev. 2021, 153, 106013. [Google Scholar] [CrossRef] [PubMed]
- Awan, H.H.; Pirdavani, A.; Houben, A.; Westhof, S.; Adnan, M.; Brijs, T. Impact of perceptual countermeasures on driving behavior at curves using driving simulator. Traffic Inj. Prev. 2019, 20, 93–99. [Google Scholar] [CrossRef]
- Montella, A.; Aria, M.; D’Ambrosio, A.; Galante, F.; Mauriello, F.; Pernetti, M. Simulator evaluation of drivers’ speed, deceleration and lateral position at rural intersections in relation to different perceptual cues. Accid. Anal. Prev. 2011, 43, 2072–2084. [Google Scholar] [CrossRef] [PubMed]
- Daniels, S.; Vanrie, J.; Dreesen, A.; Brijs, T. Additional road markings as an indication of speed limits: Results of a field experiment and a driving simulator study. Accid. Anal. Prev. 2010, 42, 953–960. [Google Scholar] [CrossRef] [PubMed]
- Hussain, Q.; Alhajyaseen, W.K.M.; Pirdavani, A.; Brijs, K.; Shaaban, K.; Brijs, T. Do detection-based warning strategies improve vehicle yielding behavior at uncontrolled midblock crosswalks? Accid. Anal. Prev. 2021, 157, 106166. [Google Scholar] [CrossRef] [PubMed]
- Pirdavani, A.; Bajestani, M.S.; Bunjong, S.; Delbare, L. The Impact of Perceptual Road Markings on Driving Behavior in Horizontal Curves: A Driving Simulator Study. Appl. Sci. 2025, 15, 4584. [Google Scholar] [CrossRef]
- Hussain, Q.; Alhajyaseen, W.K.M.; Reinolsmann, N.; Brijs, K.; Pirdavani, A.; Wets, G.; Brijs, T. Optical pavement treatments and their impact on speed and lateral position at transition zones: A driving simulator study. Accid. Anal. Prev. 2021, 150, 105916. [Google Scholar] [CrossRef]
- Iio, K. The Effects of Road Marking Patterns on Simulated Driving Speed and Lane Position. Available online: https://behavior.hus.osaka-u.ac.jp/2015/01A11004.pdf (accessed on 4 April 2025).
- Martin-Castresana, S.; Alvarez, D.; Andrade-Cataño, F.; Castro, M. Effect of Road Markings on Speed Through Curves on Rural Roads: A Driving Simulator Study in Spain. Infrastructures 2025, 10, 94. [Google Scholar] [CrossRef]
- MFOM. Trazado. Norma 3.1-IC de la Instrucción de Carreteras; Ministerio de Fomento (España): Madrid, Spain, 2016. [Google Scholar]
- MFOM. Orden FOM/3053/2008, Instrucción Técnica para la Instalación de Reductores de Velocidad y Bandas Transversales de Alerta; Ministerio de Fomento: Madrid, Spain, 2008. [Google Scholar]
- MITMA. Catálogo de Marcas Viales; Ministerio de Transportes, Movilidad y Agenda Urbana: Madrid, Spain, 2022. [Google Scholar]
- Katz, B.J. Peripheral Transverse Pavement Markings for Speed Control. 2007. Available online: https://vtechworks.lib.vt.edu/server/api/core/bitstreams/886f5183-fb95-4aac-8098-c4541be1e34e/content (accessed on 7 April 2025).
- Calvi, A.; D’Amico, F.; Bianchini Ciampoli, L.; Ferrante, C. Evaluating the effectiveness of perceptual treatments on sharp curves: A driving simulator study. Traffic Inj. Prev. 2019, 20, S13–S19. [Google Scholar] [CrossRef]
- Galante, F.; Mauriello, F.; Montella, A.; Pernetti, M.; Aria, M.; D’Ambrosio, A. Traffic calming along rural highways crossing small urban communities: Driving simulator experiment. Accid. Anal. Prev. 2010, 42, 1585–1594. [Google Scholar] [CrossRef]
- Montella, A.; Galante, F.; Mauriello, F.; Pariota, L. Effects of traffic control devices on rural curve driving behavior. Transp. Reserch Rec. 2015, 2492, 10–22. [Google Scholar] [CrossRef]
- Higuera, S.; Sáez, M.; Castro, M. Validation of a driving simulator for speed research on two-lane rural roads. Transp. Res. Procedia 2023, 71, 156–163. [Google Scholar] [CrossRef]
Disclaimer/Publisher’s Note: The statements, opinions and data contained in all publications are solely those of the individual author(s) and contributor(s) and not of MDPI and/or the editor(s). MDPI and/or the editor(s) disclaim responsibility for any injury to people or property resulting from any ideas, methods, instructions or products referred to in the content. |
© 2025 by the authors. Licensee MDPI, Basel, Switzerland. This article is an open access article distributed under the terms and conditions of the Creative Commons Attribution (CC BY) license (https://creativecommons.org/licenses/by/4.0/).
