Article

XANES Absorption Spectra of Penta-Graphene and Penta-SiC2 with Different Terminations: A Computational Study

1
Materials and Topologies for Sensor & Devices (MTSD), Sensors and Devices Center, Fondazione Bruno Kessler (FBK), Via Sommarive 18, Povo, 38123 Trento, Italy
2
European Centre for Theoretical Studies in Nuclear Physics and Related Areas (ECT*), Fondazione Bruno Kessler (FBK), Strada delle Tabarelle 286, 38122 Trento, Italy
3
Trento Institute for Fundamental Physics and Applications (TIFPA-INFN), Via Sommarive 14, 38123 Trento, Italy
*
Author to whom correspondence should be addressed.
Appl. Sci. 2025, 15(17), 9812; https://doi.org/10.3390/app15179812 (registering DOI)
Submission received: 1 August 2025 / Revised: 3 September 2025 / Accepted: 5 September 2025 / Published: 7 September 2025
(This article belongs to the Special Issue Development and Application of Computational Chemistry Methods)

Abstract

Pentagonal two-dimensional allotropes—penta-graphene (PG) and penta-SiC2—are promising but experimentally elusive materials whose identification requires spectroscopic fingerprints that extend beyond ground-state descriptors. Using density functional theory within a core-hole formalism and polarisation-resolved cross sections, we compute element- and site-resolved K-edge spectra for pristine H- and OH-terminated PG, Si-substituted PG, and pristine/H-passivated penta-SiC2. In PG, the C K-edge shows a π * onset at 285 eV from three-coordinated C and σ * bands at 293–303 eV, yielding three plateaus and a strong low-energy z-polarised response. The H/OH functionalisation suppresses the 283–288 eV plateau and weakens the polarisation anisotropy, which can be rationalised by PDOS changes at the two non-equivalent C sites. Si substitution generates a polarisation-dependent Si K-edge doublet (∼1844/1857 eV). In penta-SiC2, the high-energy Si feature broadens (1850–1860 eV) and the C K-edge becomes strongly anisotropic; H-passivation yields a sharp, almost polarisation-independent C K-edge at 290 eV. The presence of clearly resolved, system-dependent spectral features enables unambiguous experimental discrimination between phases and terminations, facilitating spectroscopic discovery and supporting device development in 2D pentagonal materials.

1. Introduction

Among the various carbon allotropes, graphene [1] has attracted a great deal of attention due to its remarkable electronic [2,3], mechanical and thermal [4,5,6] properties. Graphene is the epitome of 2D materials that exhibit high electron mobility at room temperature, with reported values of over 15,000 cm2V−1s−1, high opacity for an atomic monolayer and a large breaking strength. It is a semimetal with unique characteristics, where electrons and holes behave like massless fermions due to linear energy dispersion around the six Dirac corners of the Brillouin zone, which also makes it a promising platform for studying quantum systems in curved spacetime [7,8].
Since the discovery of graphene, several other 2D materials have been proposed, including silicene, boron nitride, and layered heterostructures made of germanene, tinene, and antimonene nanocomposites [9,10,11,12]. This has opened up a specific field of research in “quantum materials”.
Recently, in addition to a series of theoretically predicted penta-materials that far exceed the experimentally synthesised ones [13,14,15], a novel 2D carbon allotrope, called penta-graphene, has been proposed [16]. In such a material, the plane is tiled by a series of pentagons composed of three- and four-coordinated carbon atoms. Unlike graphene, however, it is not completely flat, as the three-coordinated atoms protrude in pairs above and below the plane on which the four-coordinated atoms lie. Penta-graphene is an insulator with an indirect band gap in the range of 4.1–4.3 eV, as calculated in the G0W0 approximation [17,18,19]. The mechanical [20], electronic and optical properties [21,22,23] as well as the thermal stability and thermal conductivity [24,25,26,27] of this 2D carbon allotrope have already been characterised from a computational point of view. In particular, an effective tight-binding model for penta-graphene [28] was developed.
It has also been found that hydrogenation, fluorination and hydrocarbons can effectively tune the electronic properties of 2D materials such as graphene [29,30] and penta-graphene [31,32,33]. For example, hydrogenation of graphene [29] leads to a tunable electronic gap, with a coverage-dependent gap reaching approximately 1.0 eV at 8% H coverage. X-ray absorption spectroscopy (XANES) reveals the local sp2sp3 rehybridisation and confirms an additional feature near the π * resonance, while first-principles calculations can reproduce the coverage-dependent core-level shifts and the graphene spectral function. These results demonstrate a reversible pathway for tailoring 2D material properties and provide a modelling platform for hydrogen–carbon interactions.
Various strategies have been proposed to tune the electronic and magnetic properties of penta-graphene [34,35,36,37]. The fully hydrogenated version of penta-graphene, the so-called penta-graphane, has an indirect band gap with a value of 5.78 eV [38], which is close to the band gap of diamond. In addition, hydrogen passivation effects on the magnetic moment [39] and mechanical properties [40] were investigated. In this respect, a detailed overview of advances in penta-graphene and related materials was recently published [41].
Although the stability of penta-graphene has been predicted theoretically, its experimental stability remains controversial [42]. This does not fundamentally exclude the possibility that it can be synthesised at low temperature or stabilised by a supporting surface, as in the case of silicon nanoribbons, composed only of pentagonal rings, grown on the Ag(110) surface, which has been demonstrated both experimentally and computationally [43].
Analogous to penta-graphene, a pentagonal tiled 2D silicon dicarbide (penta-SiC2) has been proposed that combines covalent C-C σ / π networks with partially ionic Si-C bonds [44,45,46,47]. Ab initio calculations using the modified Becke-Johnson generalized gradient approximation (mBJ-GGA) predict an indirect gap of ∼1.75 eV (or 1.4 eV with the Perdew-Burke-Ernzerhof (PBE) exchange-correlation functional) and low reflectivity with strong absorption in the visible region, indicating promising potential for next-generation photovoltaics [48]. DFT studies also show that penta-SiC2 nanoribbons exhibit width- and edge-dependent electronic structures that include tunable semiconducting and antiferromagnetic states, which is consistent with trends observed in graphene nanoribbons [49,50,51]. These properties make penta-SiC2 an attractive platform for optoelectronics and high-performance energy storage.
However, despite the many intriguing properties of these materials, a thorough analysis of the X-ray absorption spectra of these materials is still missing, which is extremely useful both for their characterisation and for their technological applications [52,53]. XANES has proven to be a powerful tool for gaining insight into the local chemical environment. It is indeed particularly sensitive to coordination states such as s p 2 and s p 3 , as atoms of the same element with different coordination have different core-level energies. XANES is also susceptible to subtle geometric distortions that are difficult to detect with other spectroscopy and microscopy techniques. Furthermore, the oxidation state of the excited atomic sites can be detected, opening the way for wide-ranging technological applications based on this excited-state property, from the characterisation of catalysts [54] to mediated cancer therapy [55].
In this work, we present a comprehensive study of the X-ray absorption of pristine, hydrogenated, and hydroxylated penta-graphene, together with an investigation of the influence of a single silicon substitution in pristine penta-graphene using accurate DFT calculations within the core-hole formalism. In addition, we present a similar analysis for penta-SiC2 for both pristine and hydrogenated materials. This study paves the way for potentially identifying penta-graphene and penta-SiC2 phases by X-ray spectroscopy and also provides the basis for tailoring the absorption properties of these materials in optical devices.

2. Computational Methods

2.1. Penta-Graphene and Penta-SiC2 Models

In Figure 1A, we show the geometric backbone of the studied materials, which is based on Cairo tiling. The unit cell is outlined in black. Inequivalent sites are marked as 1 and 2 and shown in purple and green, respectively. These sites are found in the ratio 1:2. Figure 1B shows the crystal structure of penta-graphene, which consists of alternating s p 3 - and s p 2 -hybridised carbon atoms. Penta-graphene exhibits P-421m symmetry with six atoms in the tetragonal unit cell. The penta-graphene structure is not completely flat like that of graphene, but has a protrusion of s p 2 -bonded atoms above and below the layer plane. This non-planarity arises from the presence of s p 3 -bonded atoms.
The s p 3 and s p 2 sites are inequivalent within the unit cell, so these two sites should be naturally used as target atoms for the X-ray absorption calculations. The structure of penta-SiC2 is essentially the same as that of penta-graphene, with silicon atoms in the four-coordinated positions.
In Figure 1, we also show a representation of C hydrogenated penta-graphene and D hydroxylated penta-graphene 3 × 3 supercells. In addition, penta-SiC2 and hydrogenated penta-SiC2 are shown in panels E and F of the same figure, respectively. In the case of hydrogenation and hydroxylation, the s p 2 atoms of penta-graphene or penta-SiC2 are saturated with H and OH end groups, respectively. We would like to point out that the labels of the inequivalent sites 1 and 2 remain valid for all structures investigated, and are consistently used in the absorption spectra below. In Table 1, we summarise the geometric structures and the different types of functionalisation examined in this work.
As we will explain in more detail below, we used 3 × 3 supercells in all calculations of the absorption spectra, which was sufficient to ensure convergence of the spectra with respect to the supercell size. Along the direction perpendicular to the penta-graphene (or penta-SiC2) plane, we chose a supercell dimension of 2 nm to avoid spurious interactions between the periodic replicas. To optimise the structure, we relaxed both the dimensions of the supercells and the positions of the atoms using DFT calculations. Self-consistency was achieved when the total energy and the Hellmann–Feynman forces on the atoms were below 0.00136 eV and 0.0136 eV Å−1, respectively. At the same time, the dimensions of the supercell were relaxed along the planar directions until a pressure of 0.5 kbar was reached. The geometric minimisation was performed with the Quantum ESPRESSO suite [58].

2.2. Electronic Band Structure, Density of States, and Absorption Spectra Calculations

Electronic structure and density of states (DOS) calculations have been performed using DFT with a plane wave cutoff of 680 eV to represent the wave functions, a six-times larger density cutoff, and a 9 × 9 × 1 k-point sampling of the first Brillouin zone. These calculations were performed using a PBE exchange–correlation functional, a norm-conserving pseudopotential for carbon, and ultra-soft pseudopotentials for hydrogen, oxygen, and silicon to account for ion–electron interaction. To improve the convergence of the self-consistent calculations, a Fermi smearing of 0.136 eV was also applied.
Ab initio calculations of the XANES spectra were performed with the XSpectra program [59], which is included in the Quantum ESPRESSO suite [58]. The Lanczos chain algorithm implemented in the code allows the calculation of the K-edge absorption spectra based on the ground-state electron density, avoiding the explicit calculation of the empty states. The core-hole created by the absorption of X-rays is included in the pseudopotential. In particular, for the treatment of interactions between the ionic core and valence electrons, we used the Quantum ESPRESSO ultra-soft (for Si and O atoms) and norm-conserving (for C atoms) core-hole pseudopotential database [60]. The PBE [61] was used for the exchange–correlation potential.
The projector augmented wave (PAW) formalism [62] allows for the reconstruction of the all-electron wave function. In particular, for the C pseudopotential, we used two projectors for the s and p atomic states, while for Si and O, we used two projectors for the s and p states and one for the d orbital. After convergence tests, DFT simulations were carried out with a kinetic energy cutoff of 544 eV and a density cutoff of four times this value. A 1 × 1 × 1 k-point sampling of the Brillouin zone was sufficient to obtain converged energy and DOS in the case of a 3 × 3 simulation cell. The Lanczos recursion parameters used in our calculations are the following: the maximum number of iterations (maximum dimension of the Lanczos basis) to achieve convergence (xniter) is 2000; the convergence threshold for the integral of the XANES cross section (xerror) is 0.001 eV, and the number of iterations between two convergence checks (xcheck_conv) is 10. XANES spectra are calculated in the dipole approximation; therefore, only the transitions from 1 s to n p or s p -hybridised orbitals are examined in K-edge spectroscopy due to symmetry constraints imposed by the selection rules. The spectrum simulations were performed using a 4 × 4 × 1 k-point grid to sample the Brillouin zone. Three different polarisation vectors of the incident light were considered, namely one perpendicular to the penta-graphene and penta-SiC2 plane (z-axis) and two parallel to it and perpendicular to each other (x- and y-direction). It should be noted that the line shape obtained with x-polarised light is often not visible in the XANES spectrum, as it completely overlaps with the line shape of the y-polarised light (shown as a green line) for reasons of symmetry. In all XANES simulations, the spectral lines were broadened by a convolution with a Lorentzian function whose full width at half maximum is 0.8 eV at all energies.

3. Results and Discussion

3.1. Structural and Electronic Properties

To characterise the geometry of the systems in Figure 1, we report in Table 2 the cell parameters and selected bond distances (in Å) for the pristine and functionalised penta-graphene and penta-SiC2 unit cells.
Chemical functionalisation influences both cell size and bond lengths in penta-graphene and penta-SiC2. Both hydrogenation and hydroxylation lead to an increase in C-C bond length compared to pristine penta-graphene, with hydroxylation having a greater influence. The cell dimensions tend to decrease with hydrogenation, while they increase slightly with hydroxylation. The replacement of carbon with silicon in penta-SiC2 increases the bond lengths and the lattice constant, as the Si atoms have a larger van der Waals radius.
In Figure 2, we show the electronic band structure of these systems. Pristine penta-graphene is a semiconductor with an indirect band gap of 2.23 eV, which we have calculated at the PBE level of theory, in line with the original work on the free-standing 2D sheet [16]. However, it is known that DFT-PBE underestimates the fundamental band gap, which is due to an approximate treatment of the many-body interaction. Therefore, we calculated the band gap with the HSE06 (Heyd–Scuseria–Ernzerhof) hybrid exchange–correlation functional [63] and found an increased value of 3.29 eV, similar to Ref. [16]; GW, starting from DFT-PBE, even pushes the gap to 4.53 eV [64]. Since there is no experimental synthesis, all values are calculated.
However, looking at the electronic band structure of penta-graphene calculated with the exchange–correlation functional HSE06 (see Ref. [16]) and PBE (see Figure 2A), we find that the only effect of using HSE06 is a rigid shift of the bands by ≈1 eV to open the gap, while the shape and width are similar. The DOS, i.e., the projection of the bands onto the energy axis, which is directly linked to the XANES signal modulo by some weighting factors, is therefore also similar. Using HSE06 for such large computational supercells as we need for the convergence of XANES spectra of penta-graphene and related structures is prohibitively expensive and only has the effect of rigidly shifting the spectrum by 1 eV along the energy axis, at an onset of more than 280 eV. Thus, the error we make in the peak positions with PBE is ≈1/280, extremely small, possibly within experimental resolution). For these reasons, we have decided to use the PBE exchange–correlation functional.
We find that the insertion of hydrogen atoms and hydroxyl groups generally does not change the semiconductor property, although the indirect band gap increases significantly after functionalisation, which can be useful for photovoltaics and photoelectrochemistry outside the visible range. The indirect band gaps of the analysed structures, which were evaluated with DFT-PBE, are 4.35 eV (hydrogenated penta-graphene), 3.26 eV (hydroxylated penta-graphene), 1.44 eV (penta-SiC2), and 2.21 eV (hydrogenated penta-SiC2).

3.2. Penta-Graphene

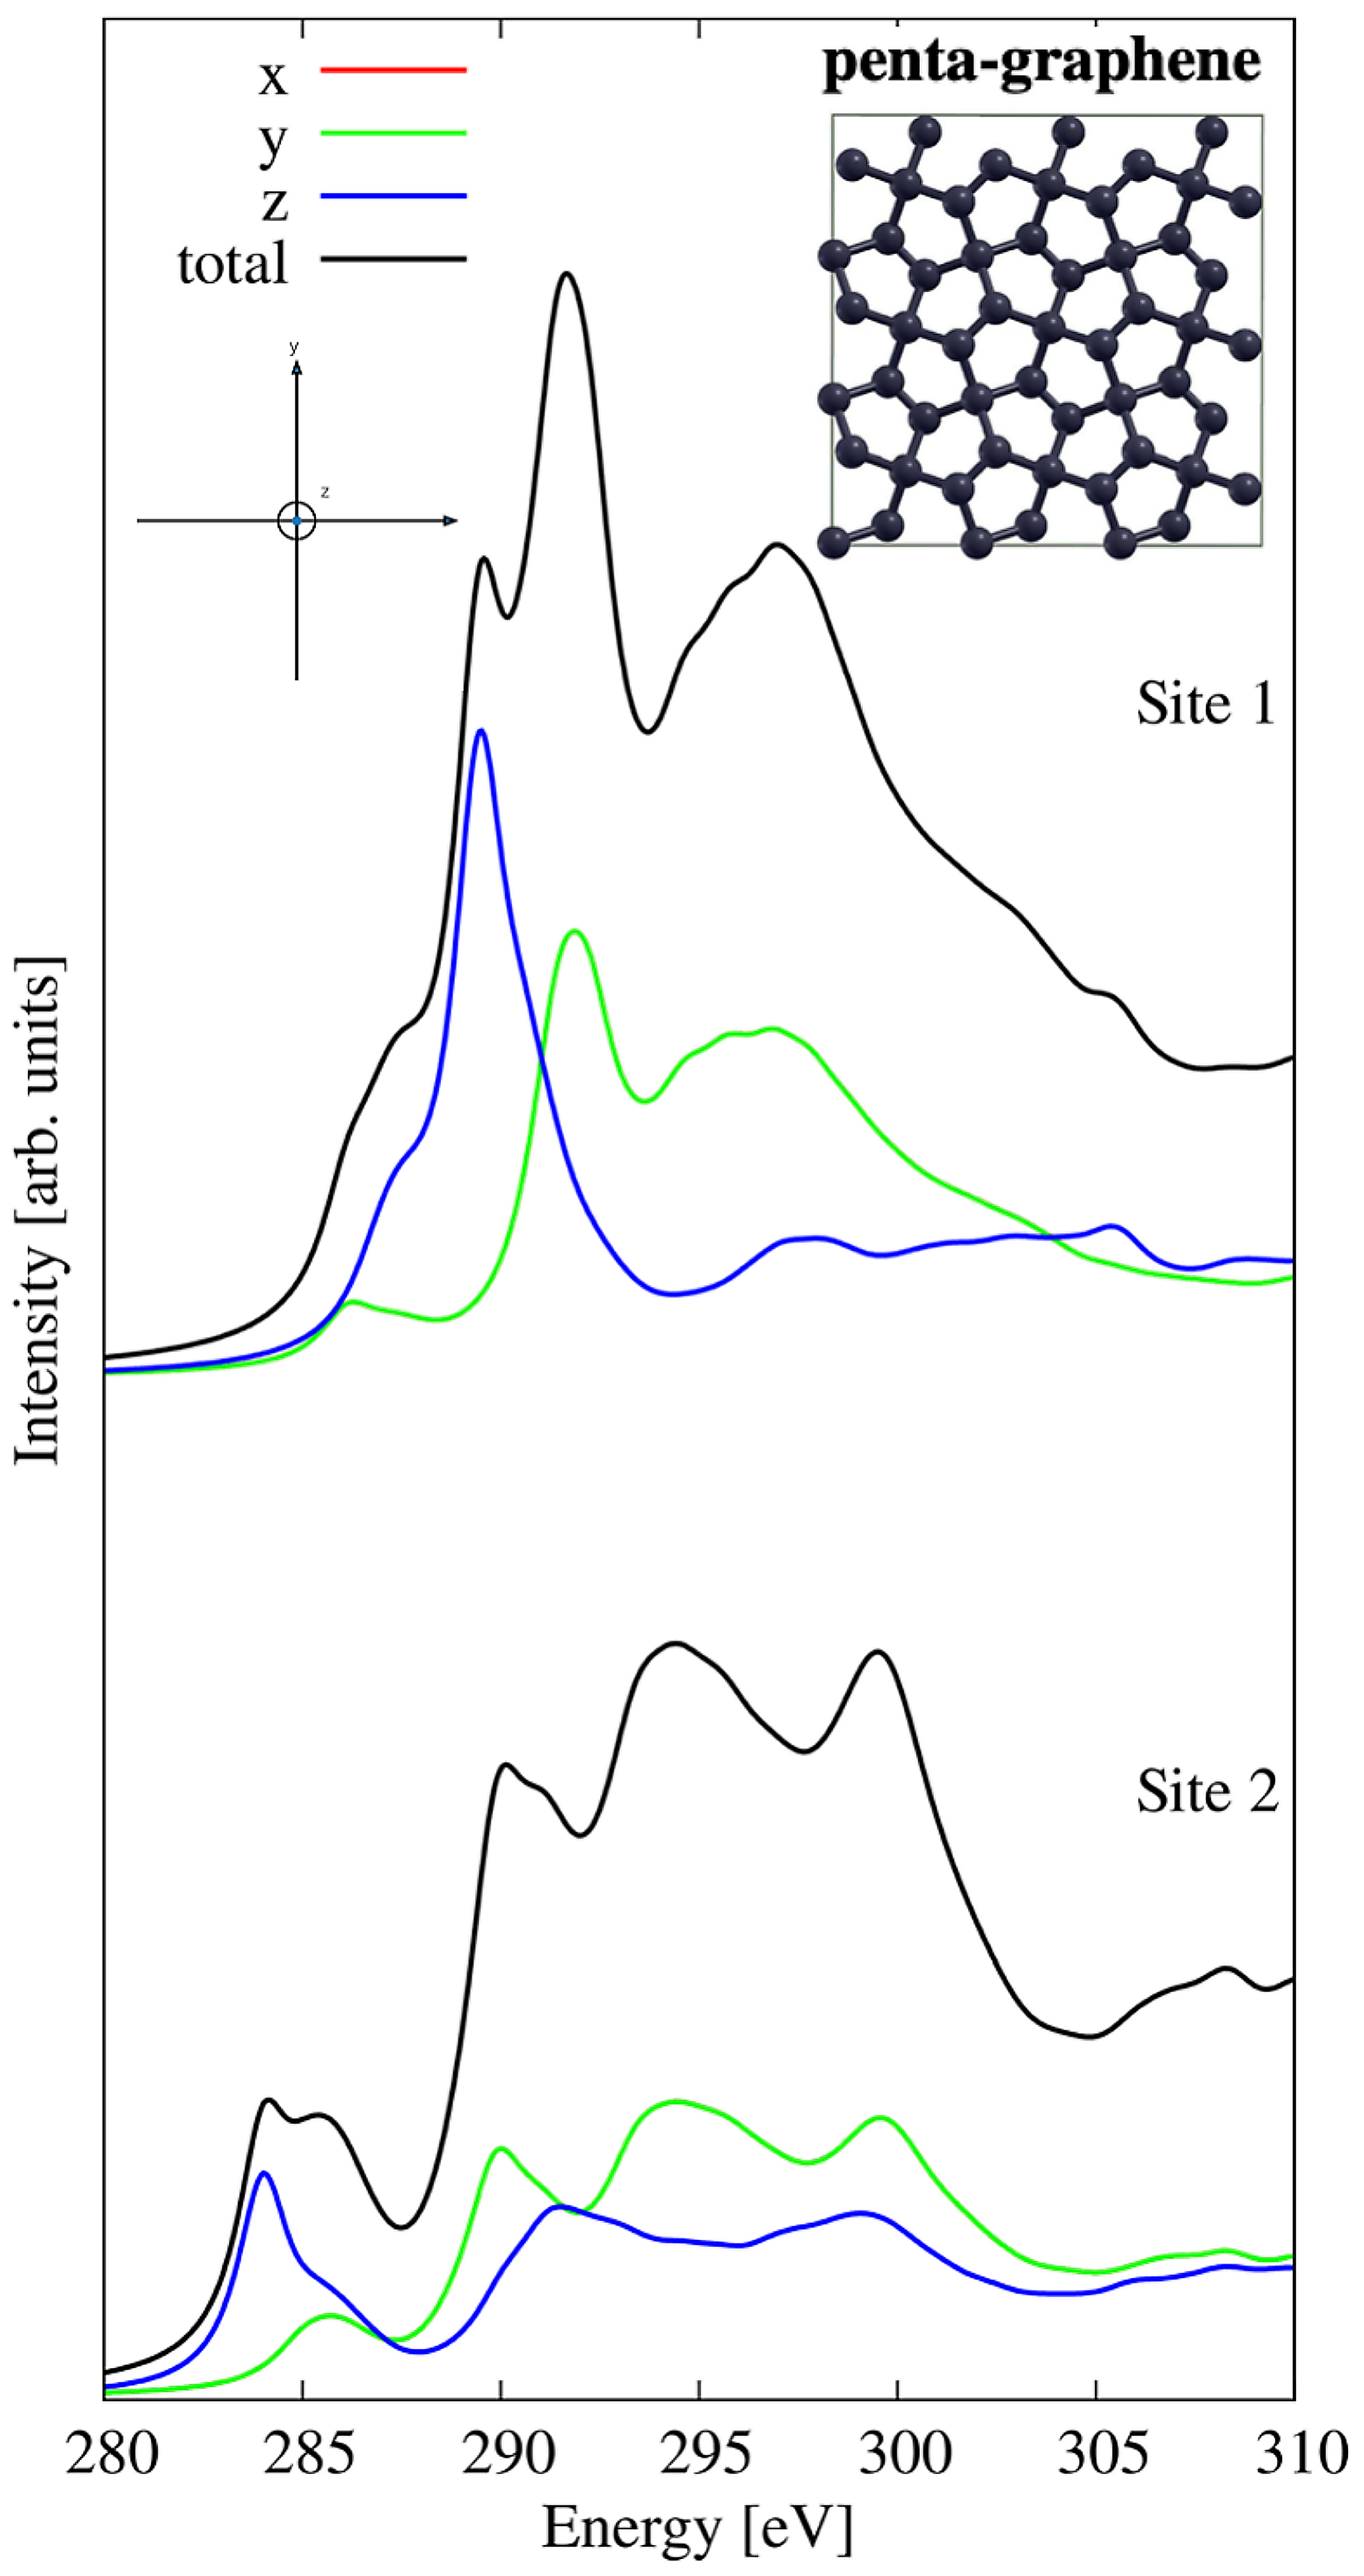
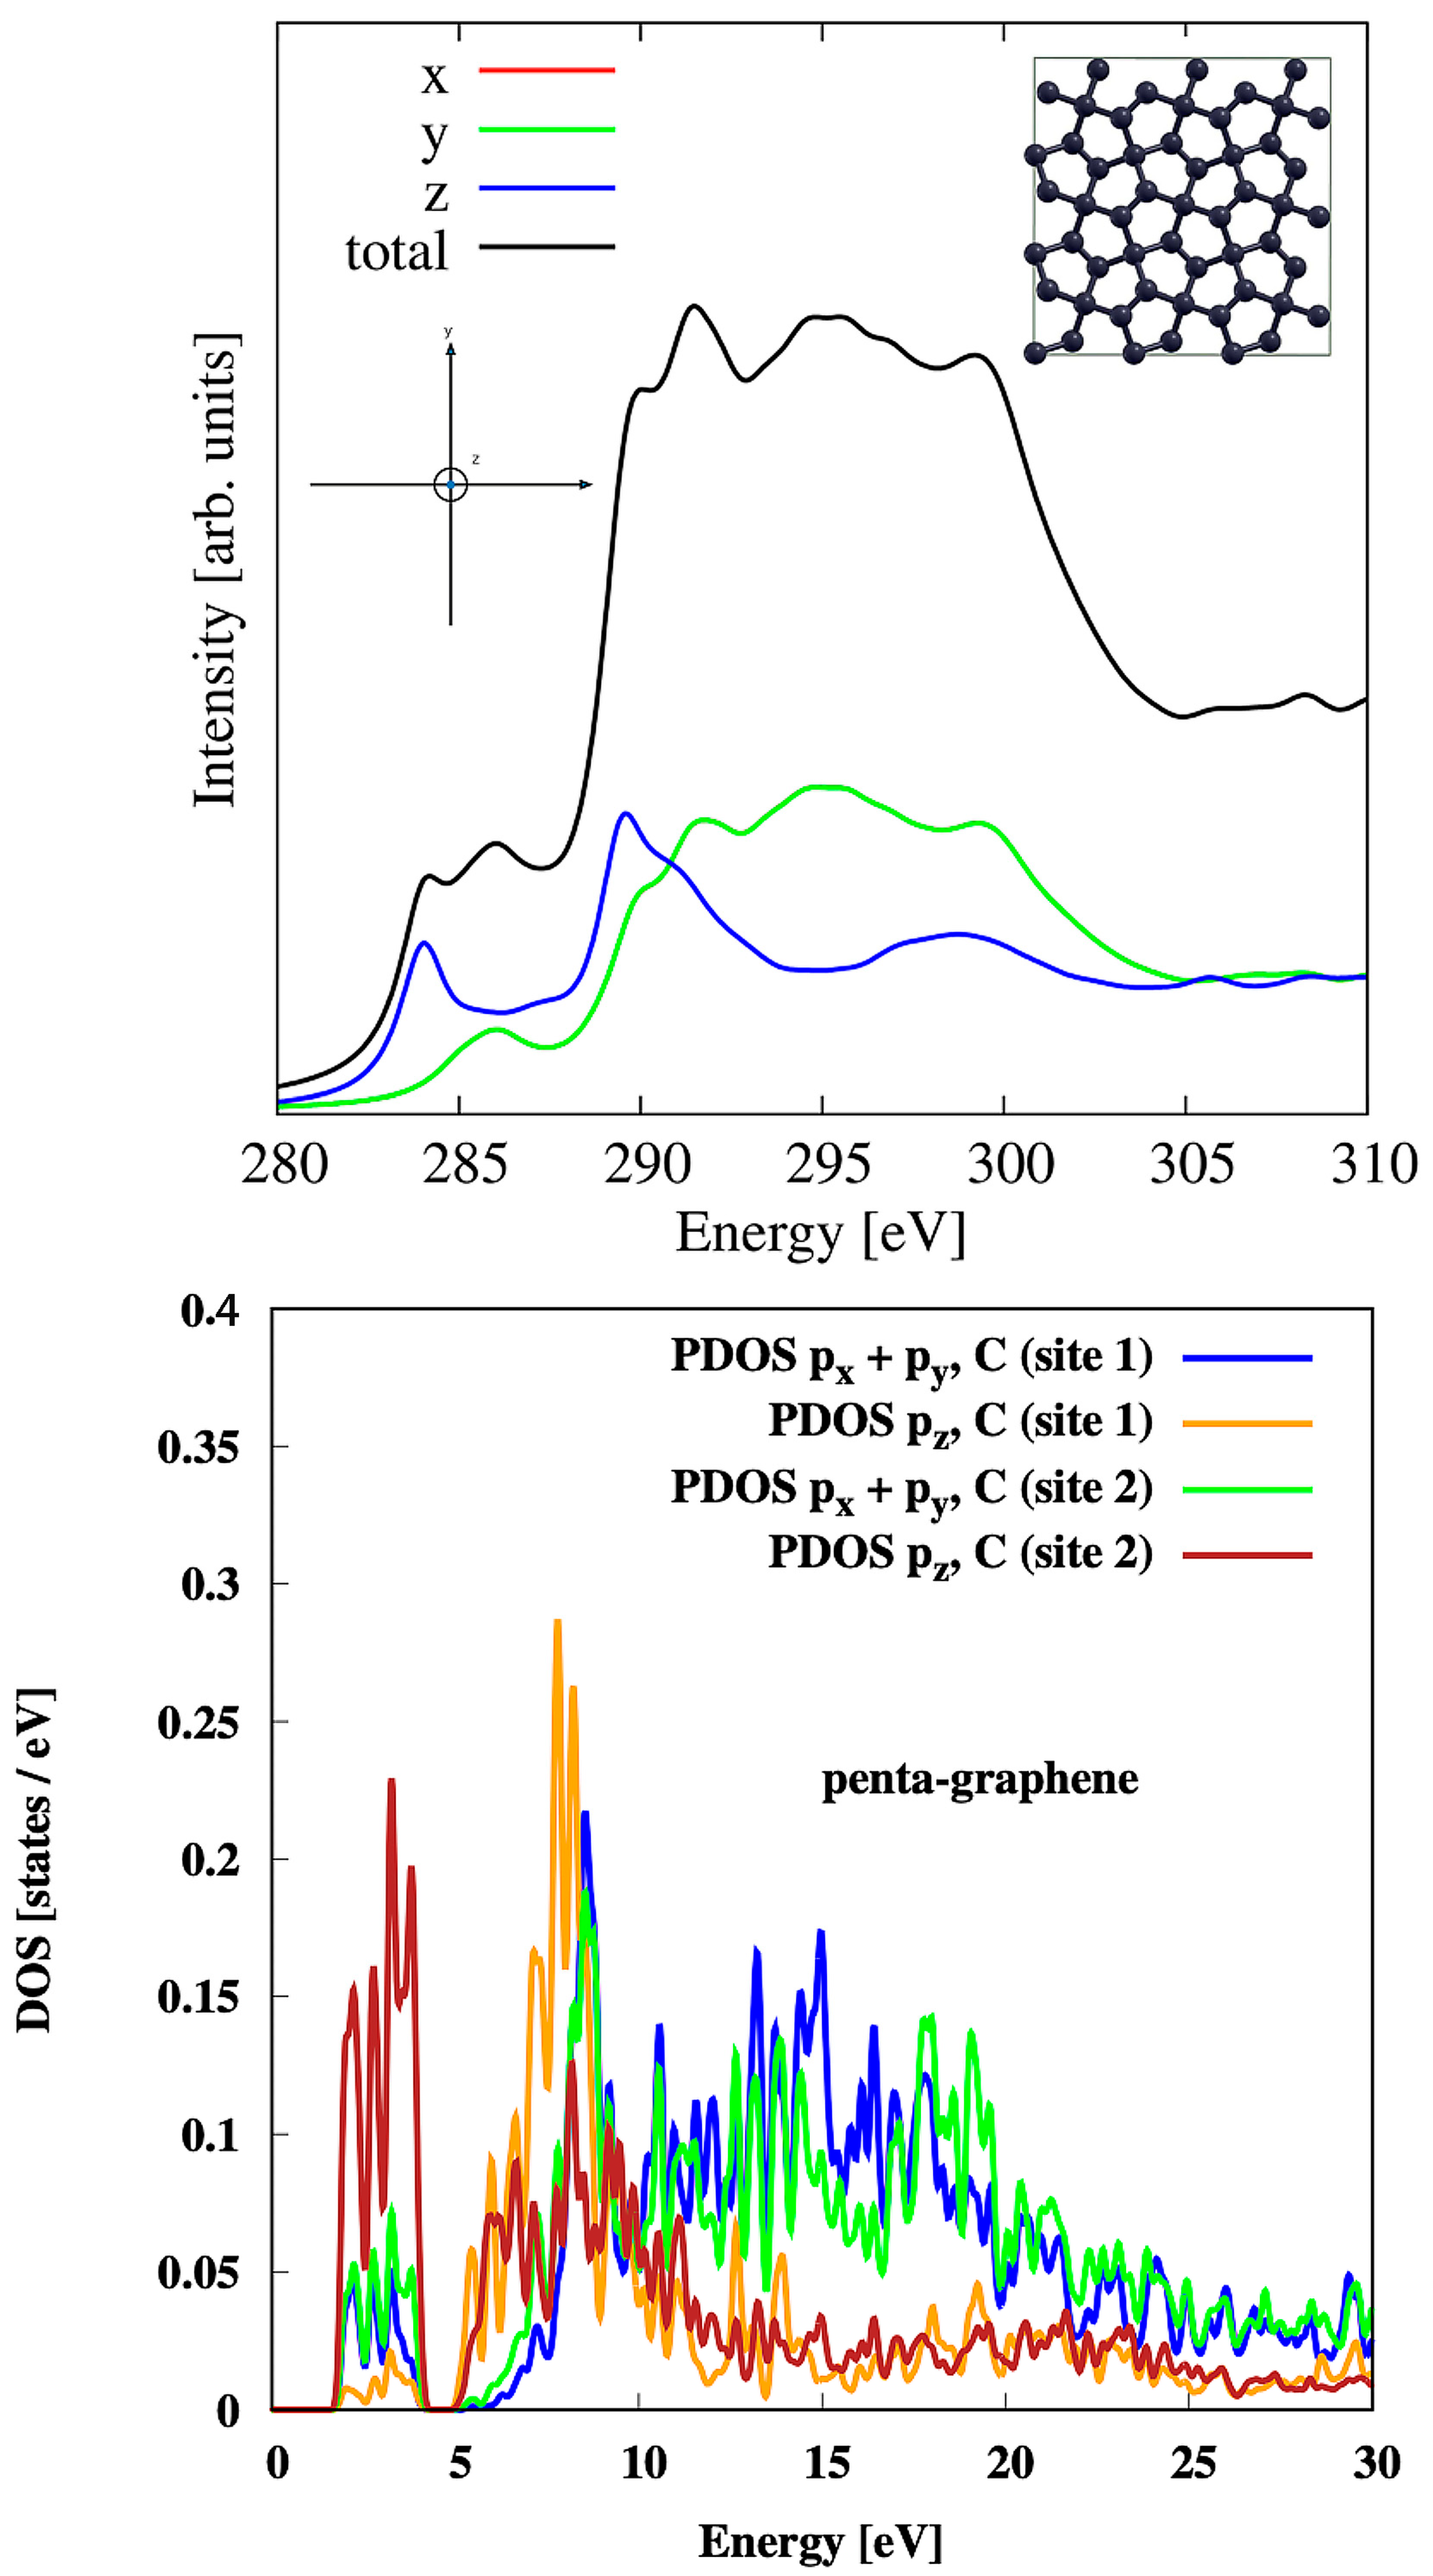
The calculated C K-edge XANES spectra for pristine penta-graphene (3 × 3 supercell) are shown in Figure 3. In particular, we have calculated the spectra for the two inequivalent carbon atoms. The spectra in the upper panel of Figure 3 refer to four-coordinated carbon atoms (site 1 in Figure 1A), while the spectra in the lower panel were determined for a three-coordinated carbon atom (site 2 in Figure 1A). The peak around 285 eV, which only occurs in site 2, can be explained by π bonds resulting from the overlap of the p orbitals of the bonded atoms. It is interesting to see how the subsequent peaks in the spectra for site 2 are the same as those for graphene. Indeed, three peaks at 293 eV, 298 eV, and 303 eV are present in graphene, indicating transitions into the three σ bands [24,65,66,67]. We note that wherever the spectrum for x-polarised X-rays is not visible, the line coincides with that for y-polarised X-rays due to local symmetry. We have also calculated the weighted average of the spectra for all inequivalent positions of the target atom within the unit cell; this is the total spectrum, which is to be compared with the experimental measurements and shown in the top panel of Figure 4 with black lines. We note that the main peak at low energy is obtained for both sites in response to X-ray radiation polarised along the z-axis. The responses to X-rays polarised along the in-plane directions are instead found at higher energies. The total spectra reported in Figure 4 can be recognised as a composition of three plateaus in the ranges 283–288 eV, 290–300 eV, and the quasi-continuum above 305 eV.
In the bottom panel of Figure 4, we show the DOS of penta-graphene projected onto the atomic orbitals p x , p y and p z for the two inequivalent sites. The DOS between 0 and 30 eV behaves similarly to the C K-edge XANES total spectrum between 280 and 310 eV (black line in the upper part of the figure). We note that the main contribution to the first peak at 284 eV comes from the transition 1 s p z , in agreement with the selection rules, which occurs mainly locally on site 2 (brown curve in the PDOS diagram), while the second bright peak comes mainly from the transition 1 s p z , which occurs locally on site 1 (orange curve in the PDOS diagram). Finally, the plateau between 290 and 300 eV is essentially due to mixed contributions from both sites via the transition 1 s p x , p y .

3.3. Hydrogenated Penta-Graphene

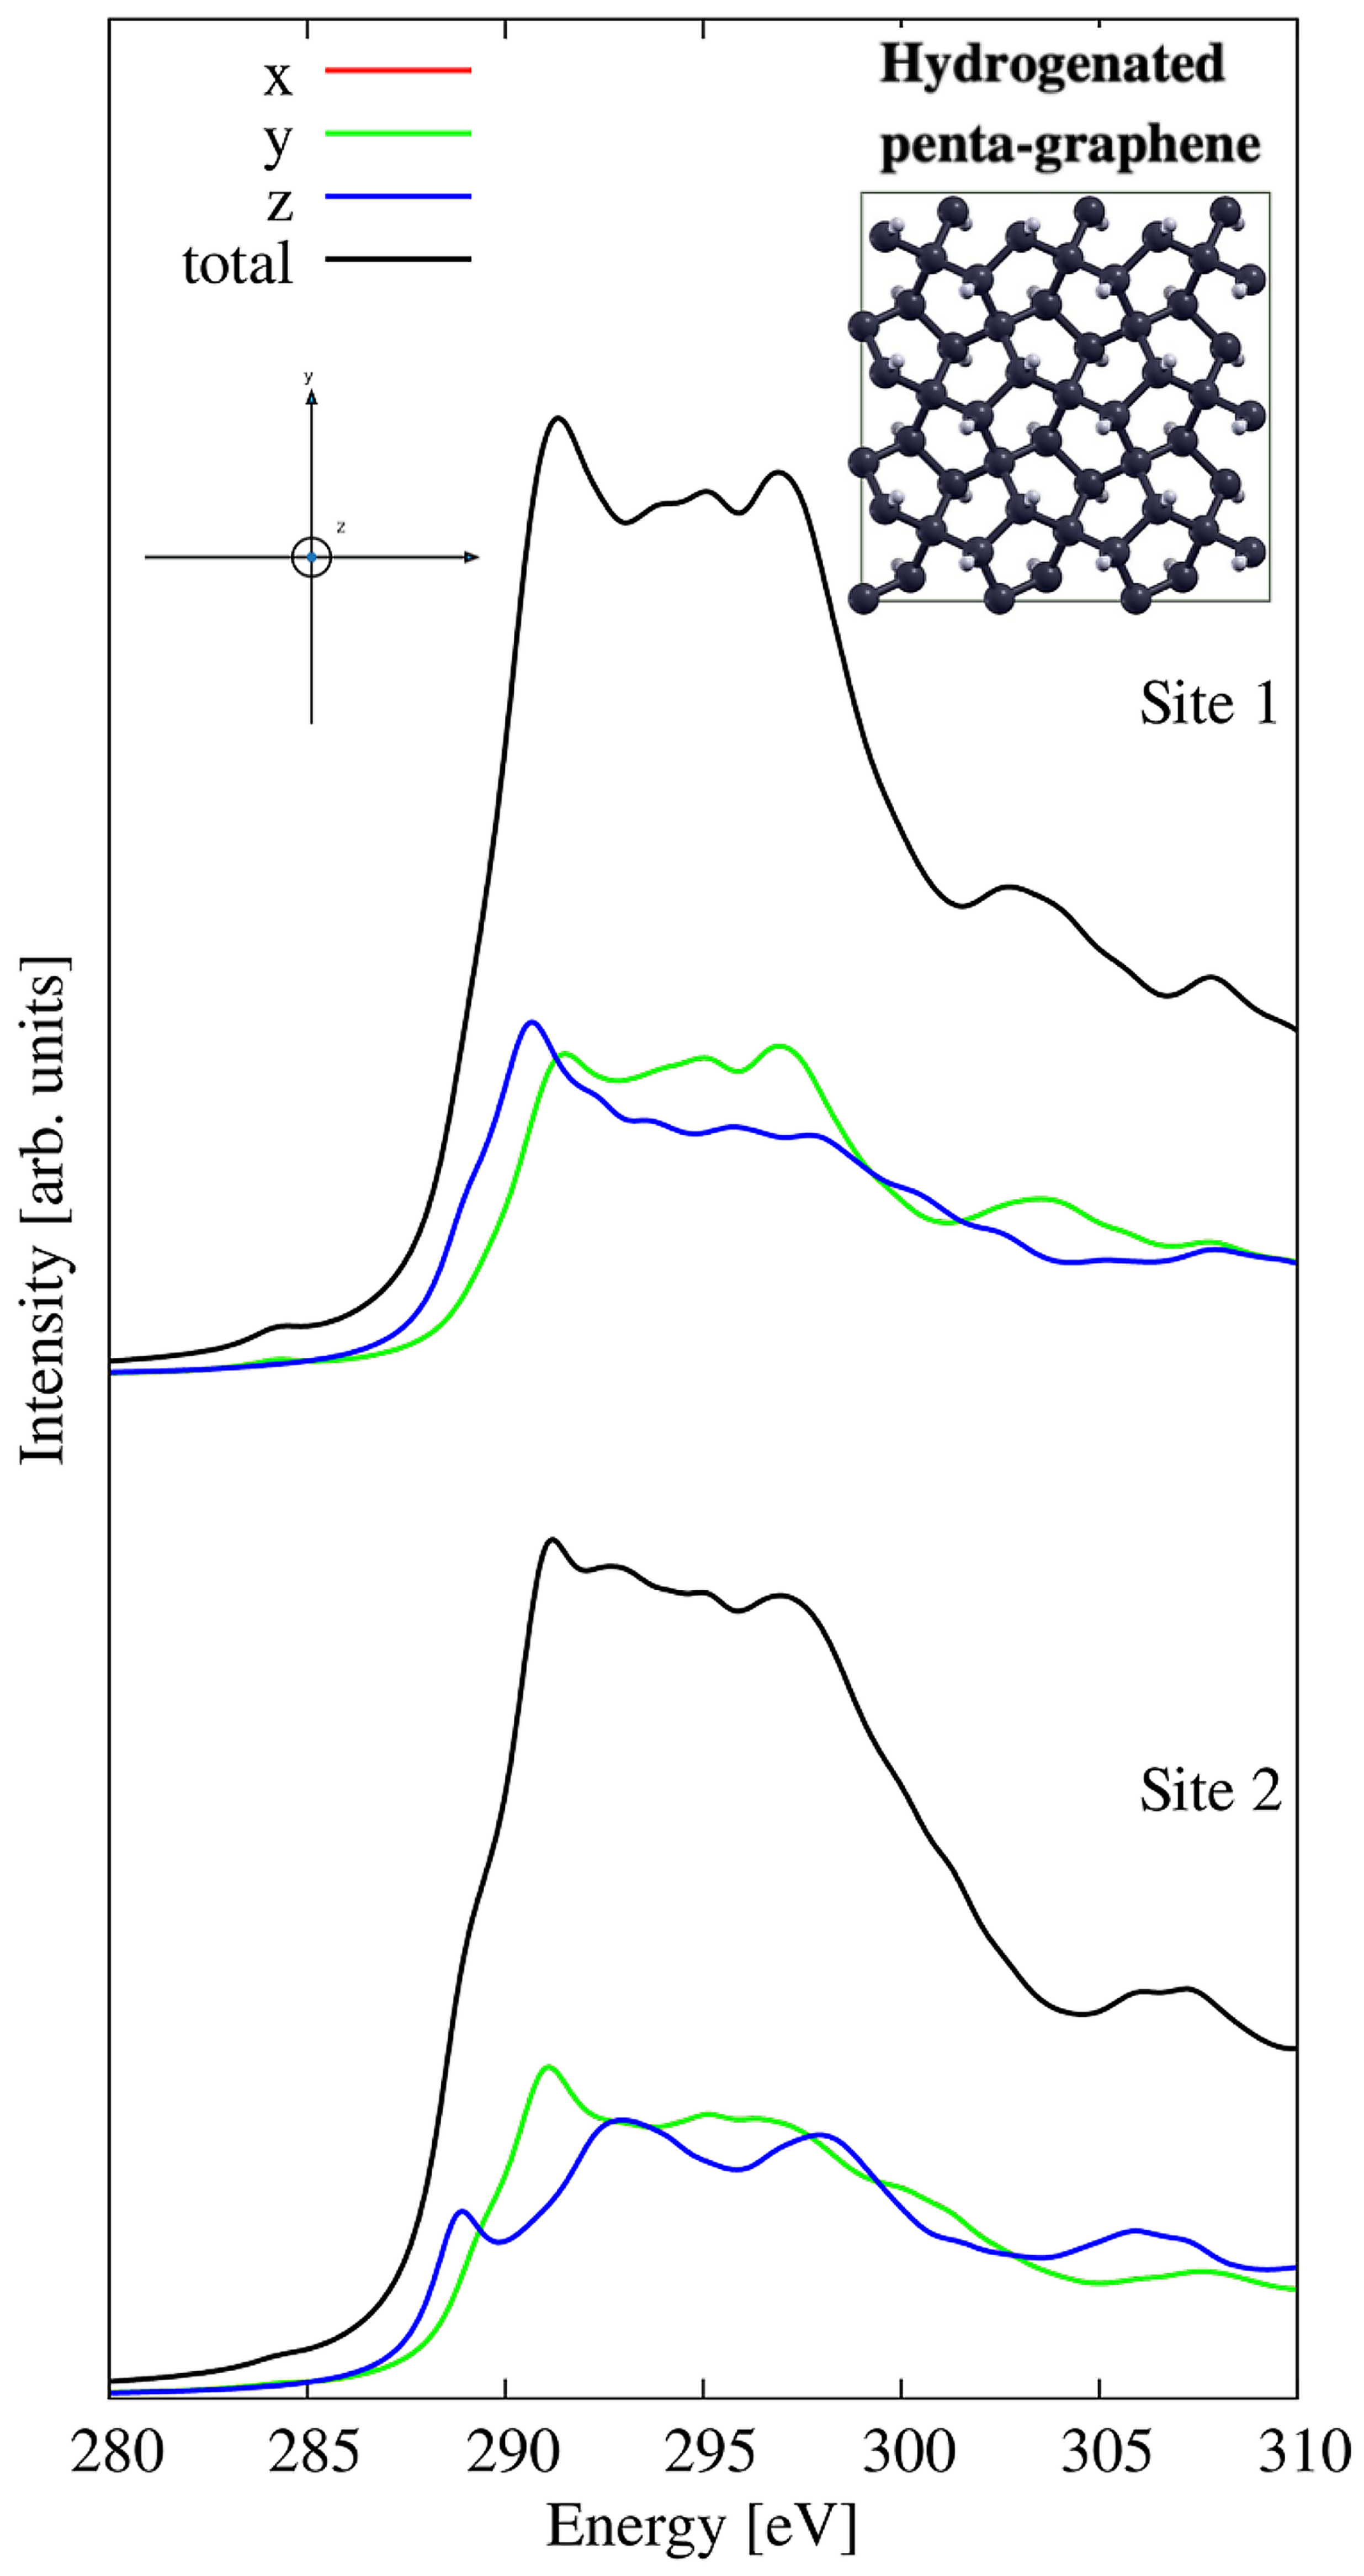
We also analysed the XANES response in hydrogenated penta-graphene, which is characterised by all four-coordinated carbon centres. The calculated XANES C K-edge spectra of the 3 × 3 supercell are shown in Figure 5 for the two inequivalent positions of the target carbon atoms.
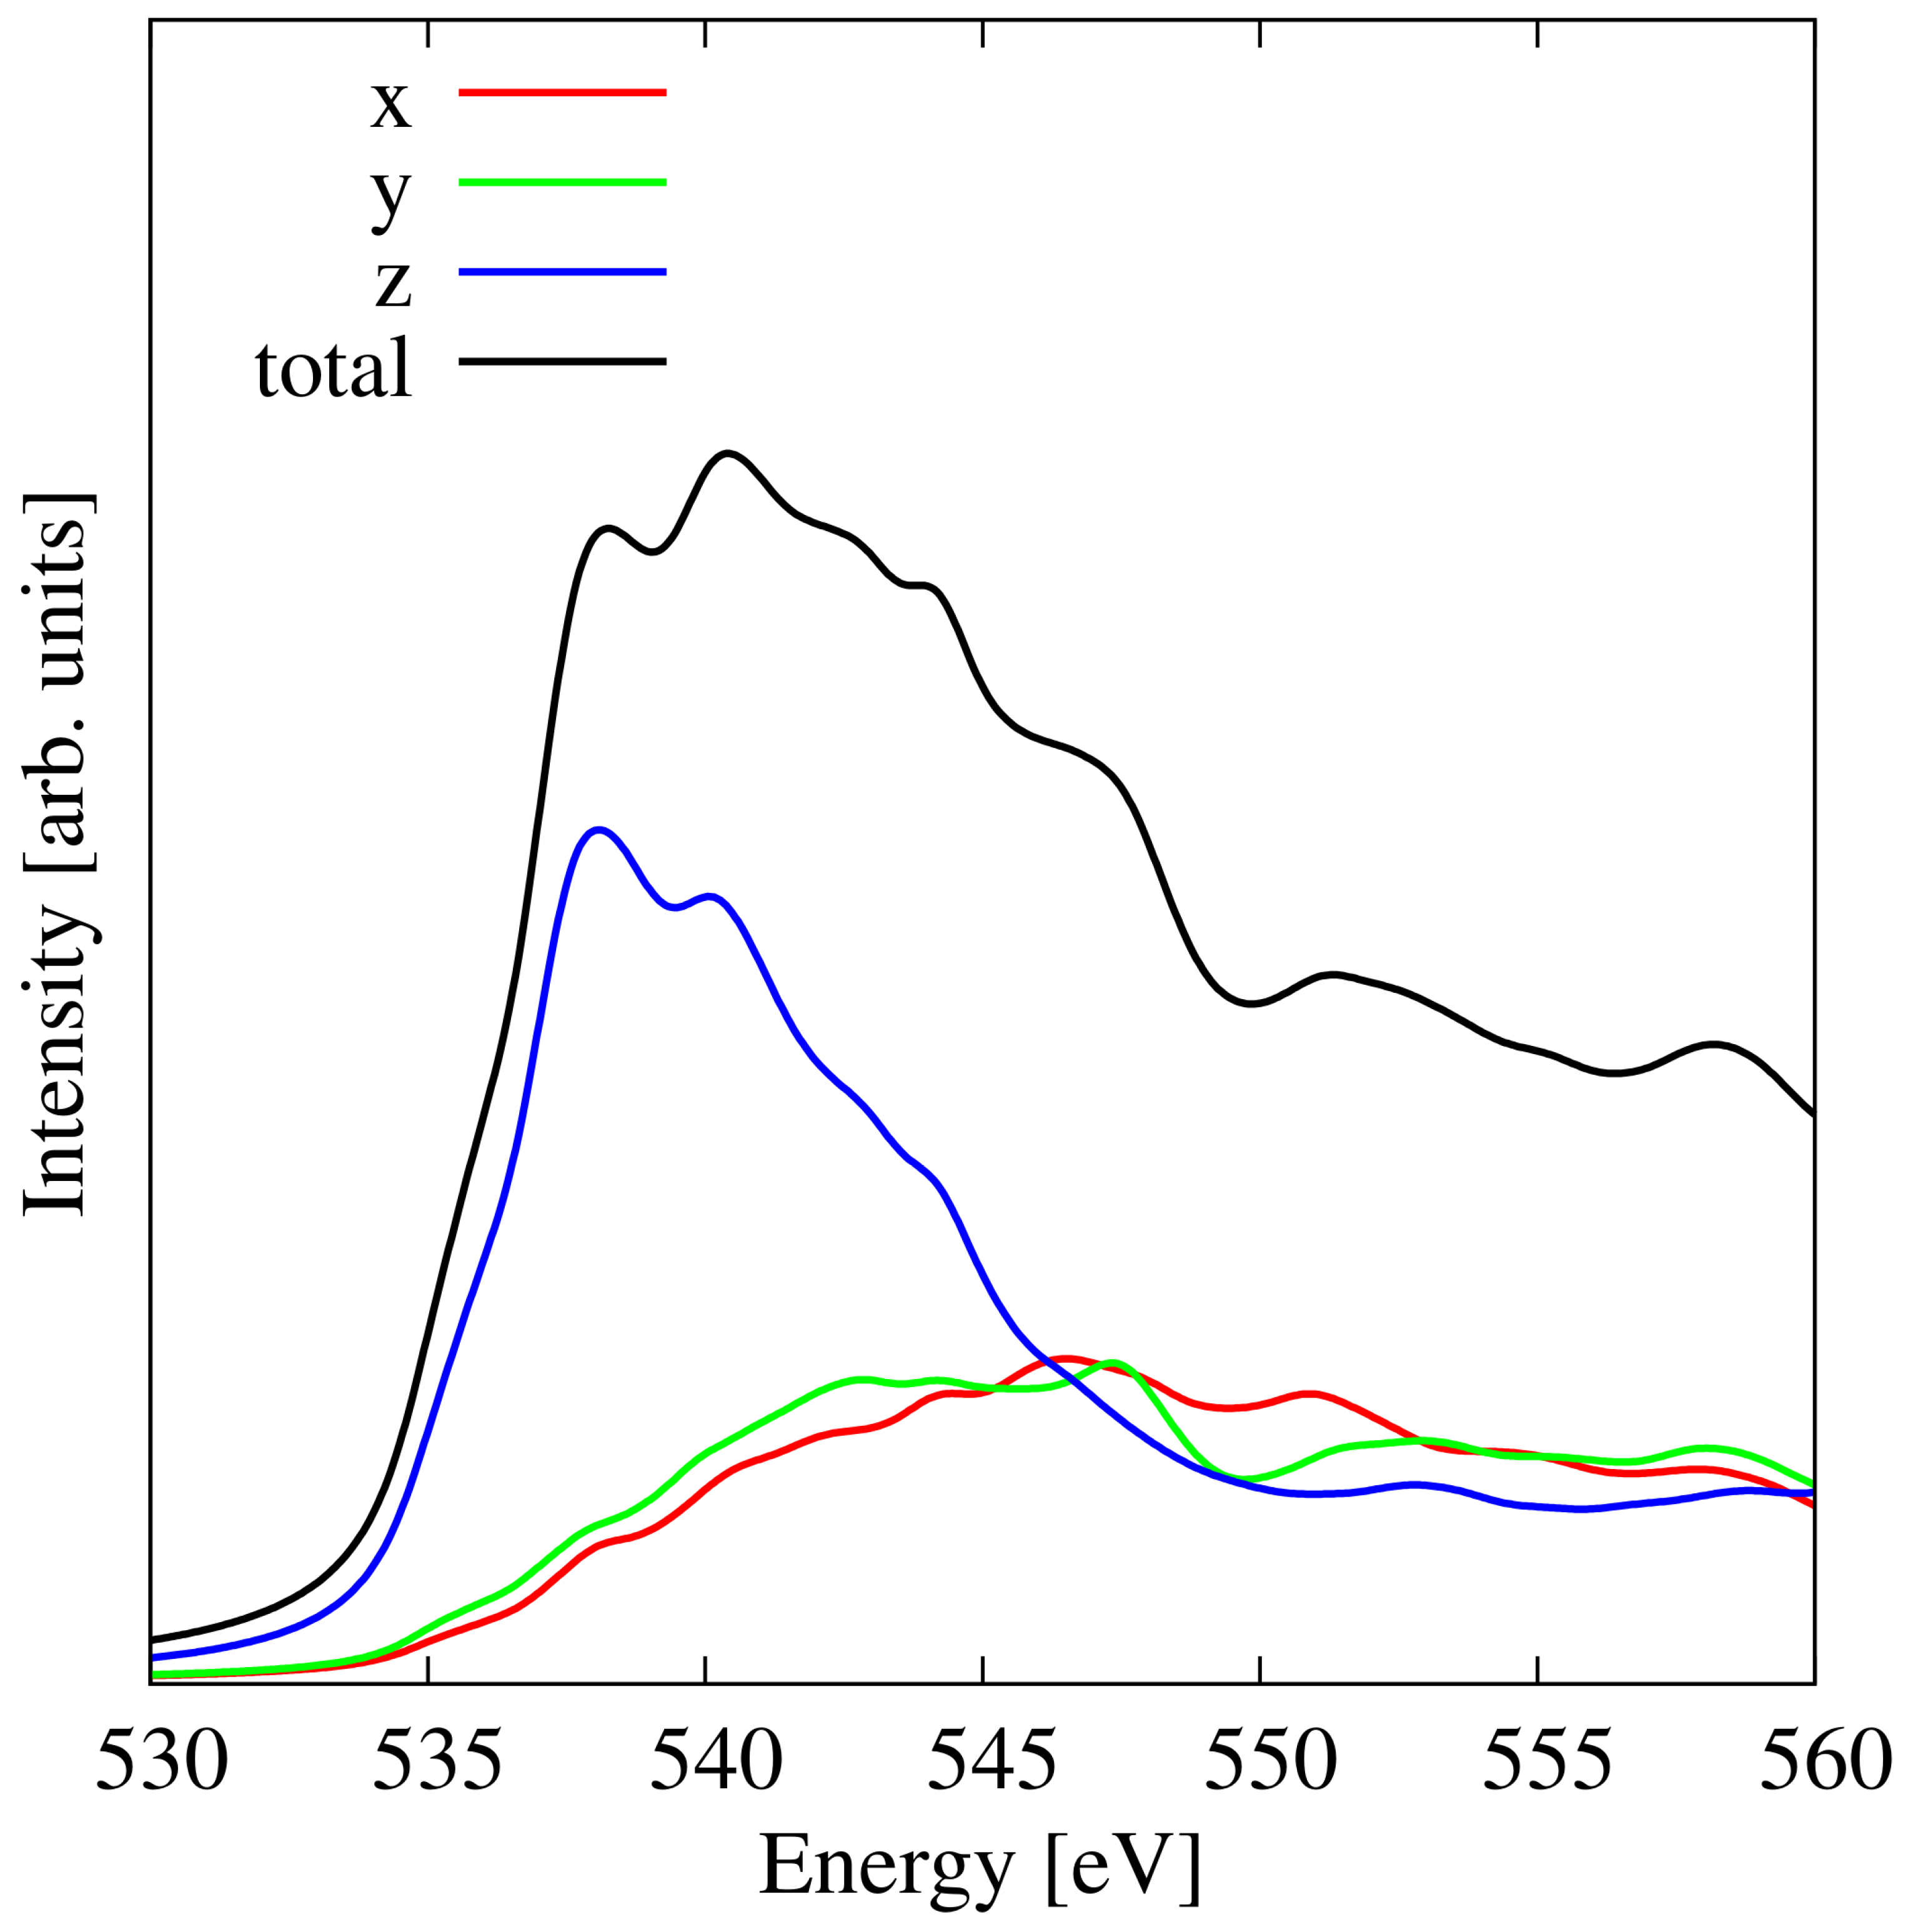
The hydrogen termination of three-coordinated atoms of penta-graphene has a strong influence on the low-energy part of the XANES spectra. In addition, hydrogenation affects the relative contribution of different X-ray polarisations to the absorption spectra. In particular, we note that (i) the absorption plateau in the 283–288 eV range that we found in the pristine case (Figure 4) is not as pronounced in the top part of Figure 6 and (ii) the X-ray absorption spectra depend only weakly on the polarisation (see green and blue lines in the top part of Figure 6).
In addition, we also analysed the DOS projected onto the inequivalent carbon sites (1 and 2), shown in the bottom part of Figure 6. As expected, the DOS reproduces the XANES spectral features of the C K-edge in the 0–30 eV energy range with similar contributions to the peaks in the 290–300 eV energy range, which are originated from the 1 s p x , p y transitions (see green and blue lines in the PDOS) and the 1 s p z transition (see orange and violet lines in the PDOS), which occur locally at both inequivalent sites. This property differs from pristine penta-graphene, in which the 1 s p x , p y , p z transitions do not overlap as they do here.

3.4. Hydroxylated Penta-Graphene

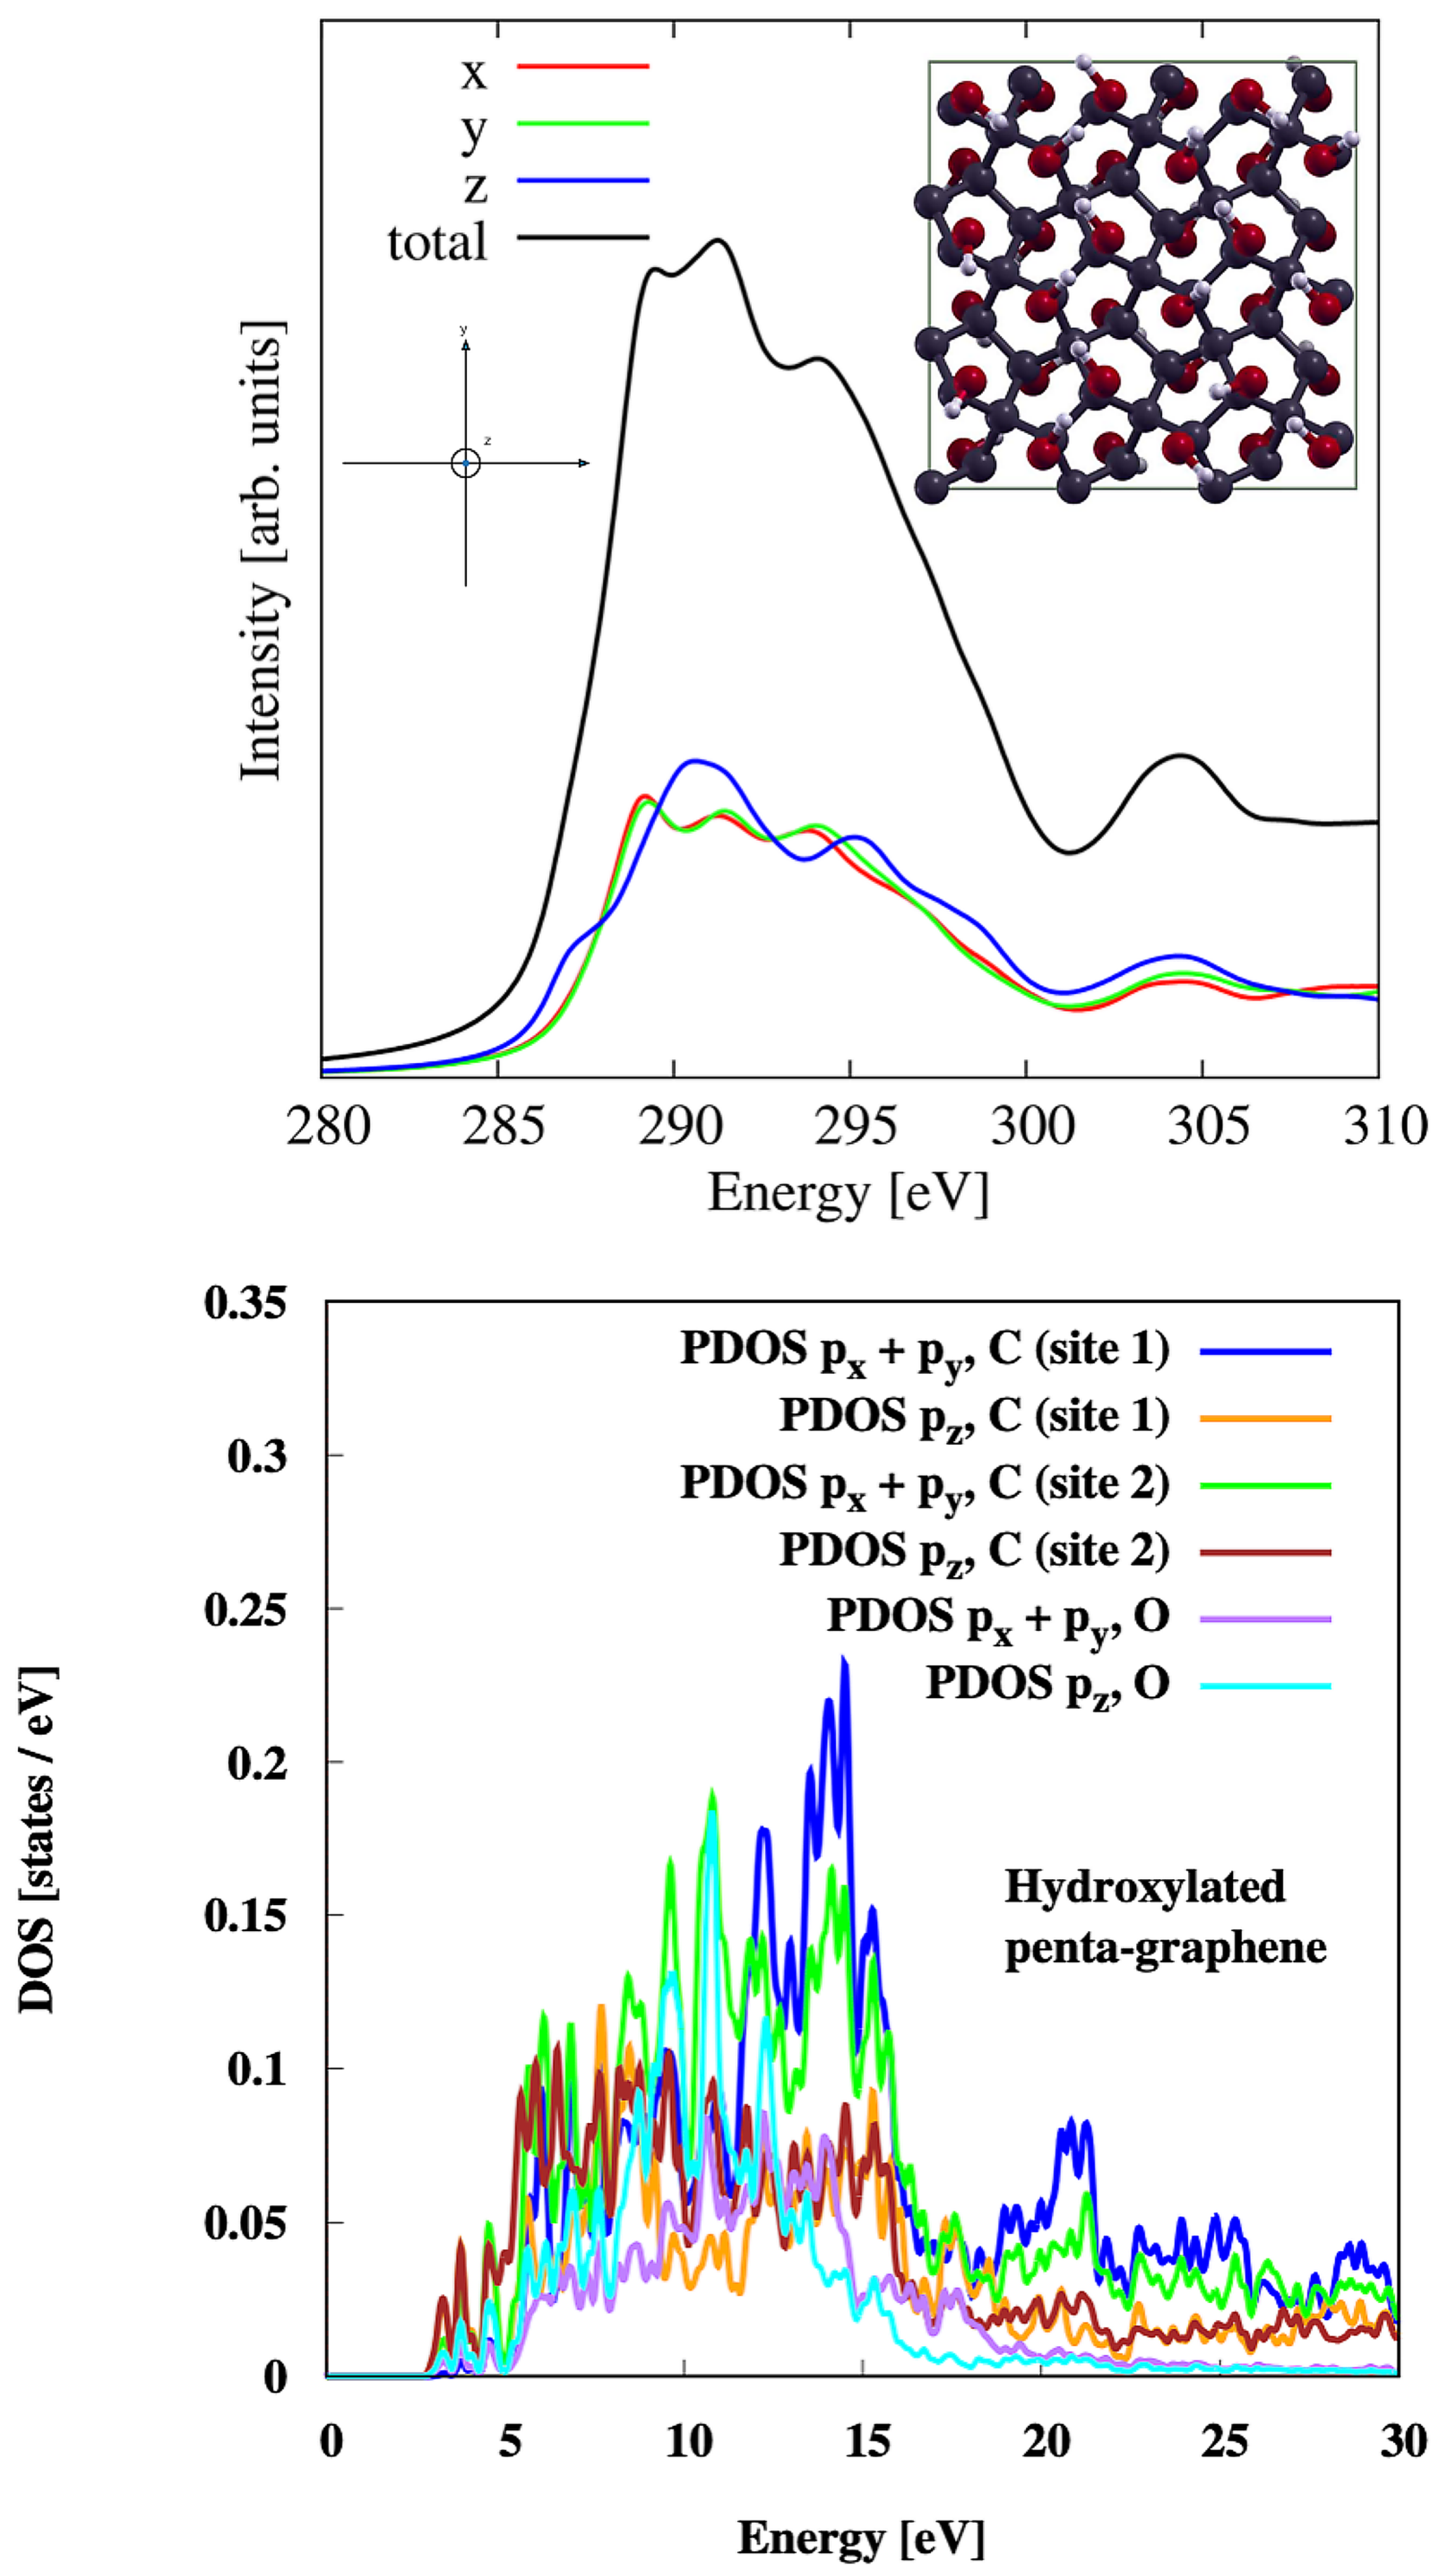
We analysed the XANES response in hydroxylated penta-graphene. In this case, all atoms except for the hydrogen and oxygen atoms are four-coordinated. In Figure 7, the calculated C K-edge XANES spectra for hydroxylated penta-graphene (3 × 3 supercell) are shown. In particular, we have calculated the spectra for the two inequivalent positions of the target carbon atoms within the unit cell. The upper spectra in Figure 7 refer to a carbon atom at site 1 (see Figure 1A), while the lower spectra are for a carbon atom at site 2 (see Figure 1A). For future comparison with experimental data, we also calculated the total spectrum as a weighted average of the spectra for all inequivalent positions of the target atom within the unit cells. We show these spectra in the top part of Figure 8. As in the case of hydrogenated penta-graphene, the plateau at 283–288 eV, that we found in the pristine case (see Figure 4), is not visible in Figure 8. The total spectra for inequivalent polarisation directions (in-plane and out-of-plane) are very similar.
In addition, we also analysed the DOS projected onto the inequivalent carbon sites (1 and 2) and oxygen, shown in the bottom part of Figure 8. The DOS still reproduces the XANES spectral features of the C K-edge in the energy range of 0–30 eV with clear contributions to the XANES peaks from the 1 s p x , p y transitions in the energy ranges 280–290 eV (see green line), and 290–295 eV (see blue line) for the two inequivalent carbon sites, respectively. The 1 s p z transitions (see orange and brown lines in the PDOS), which occur locally at both inequivalent sites, contribute almost equally to the XANES signal. Here, the 1 s p x , p y , p z transitions that occur in the oxygen atoms also contribute relatively strongly to the XANES line, particularly in the 285–295 eV spectral range.
Finally, in Figure 9 the O K-edge XANES spectra are shown. The lineshape is strongly dependent on the polarisation direction. In particular, most of the total spectra at low energy can be attributed to the response to z-polarised X-rays.

3.5. Silicon Substitution in Pristine Penta-Graphene

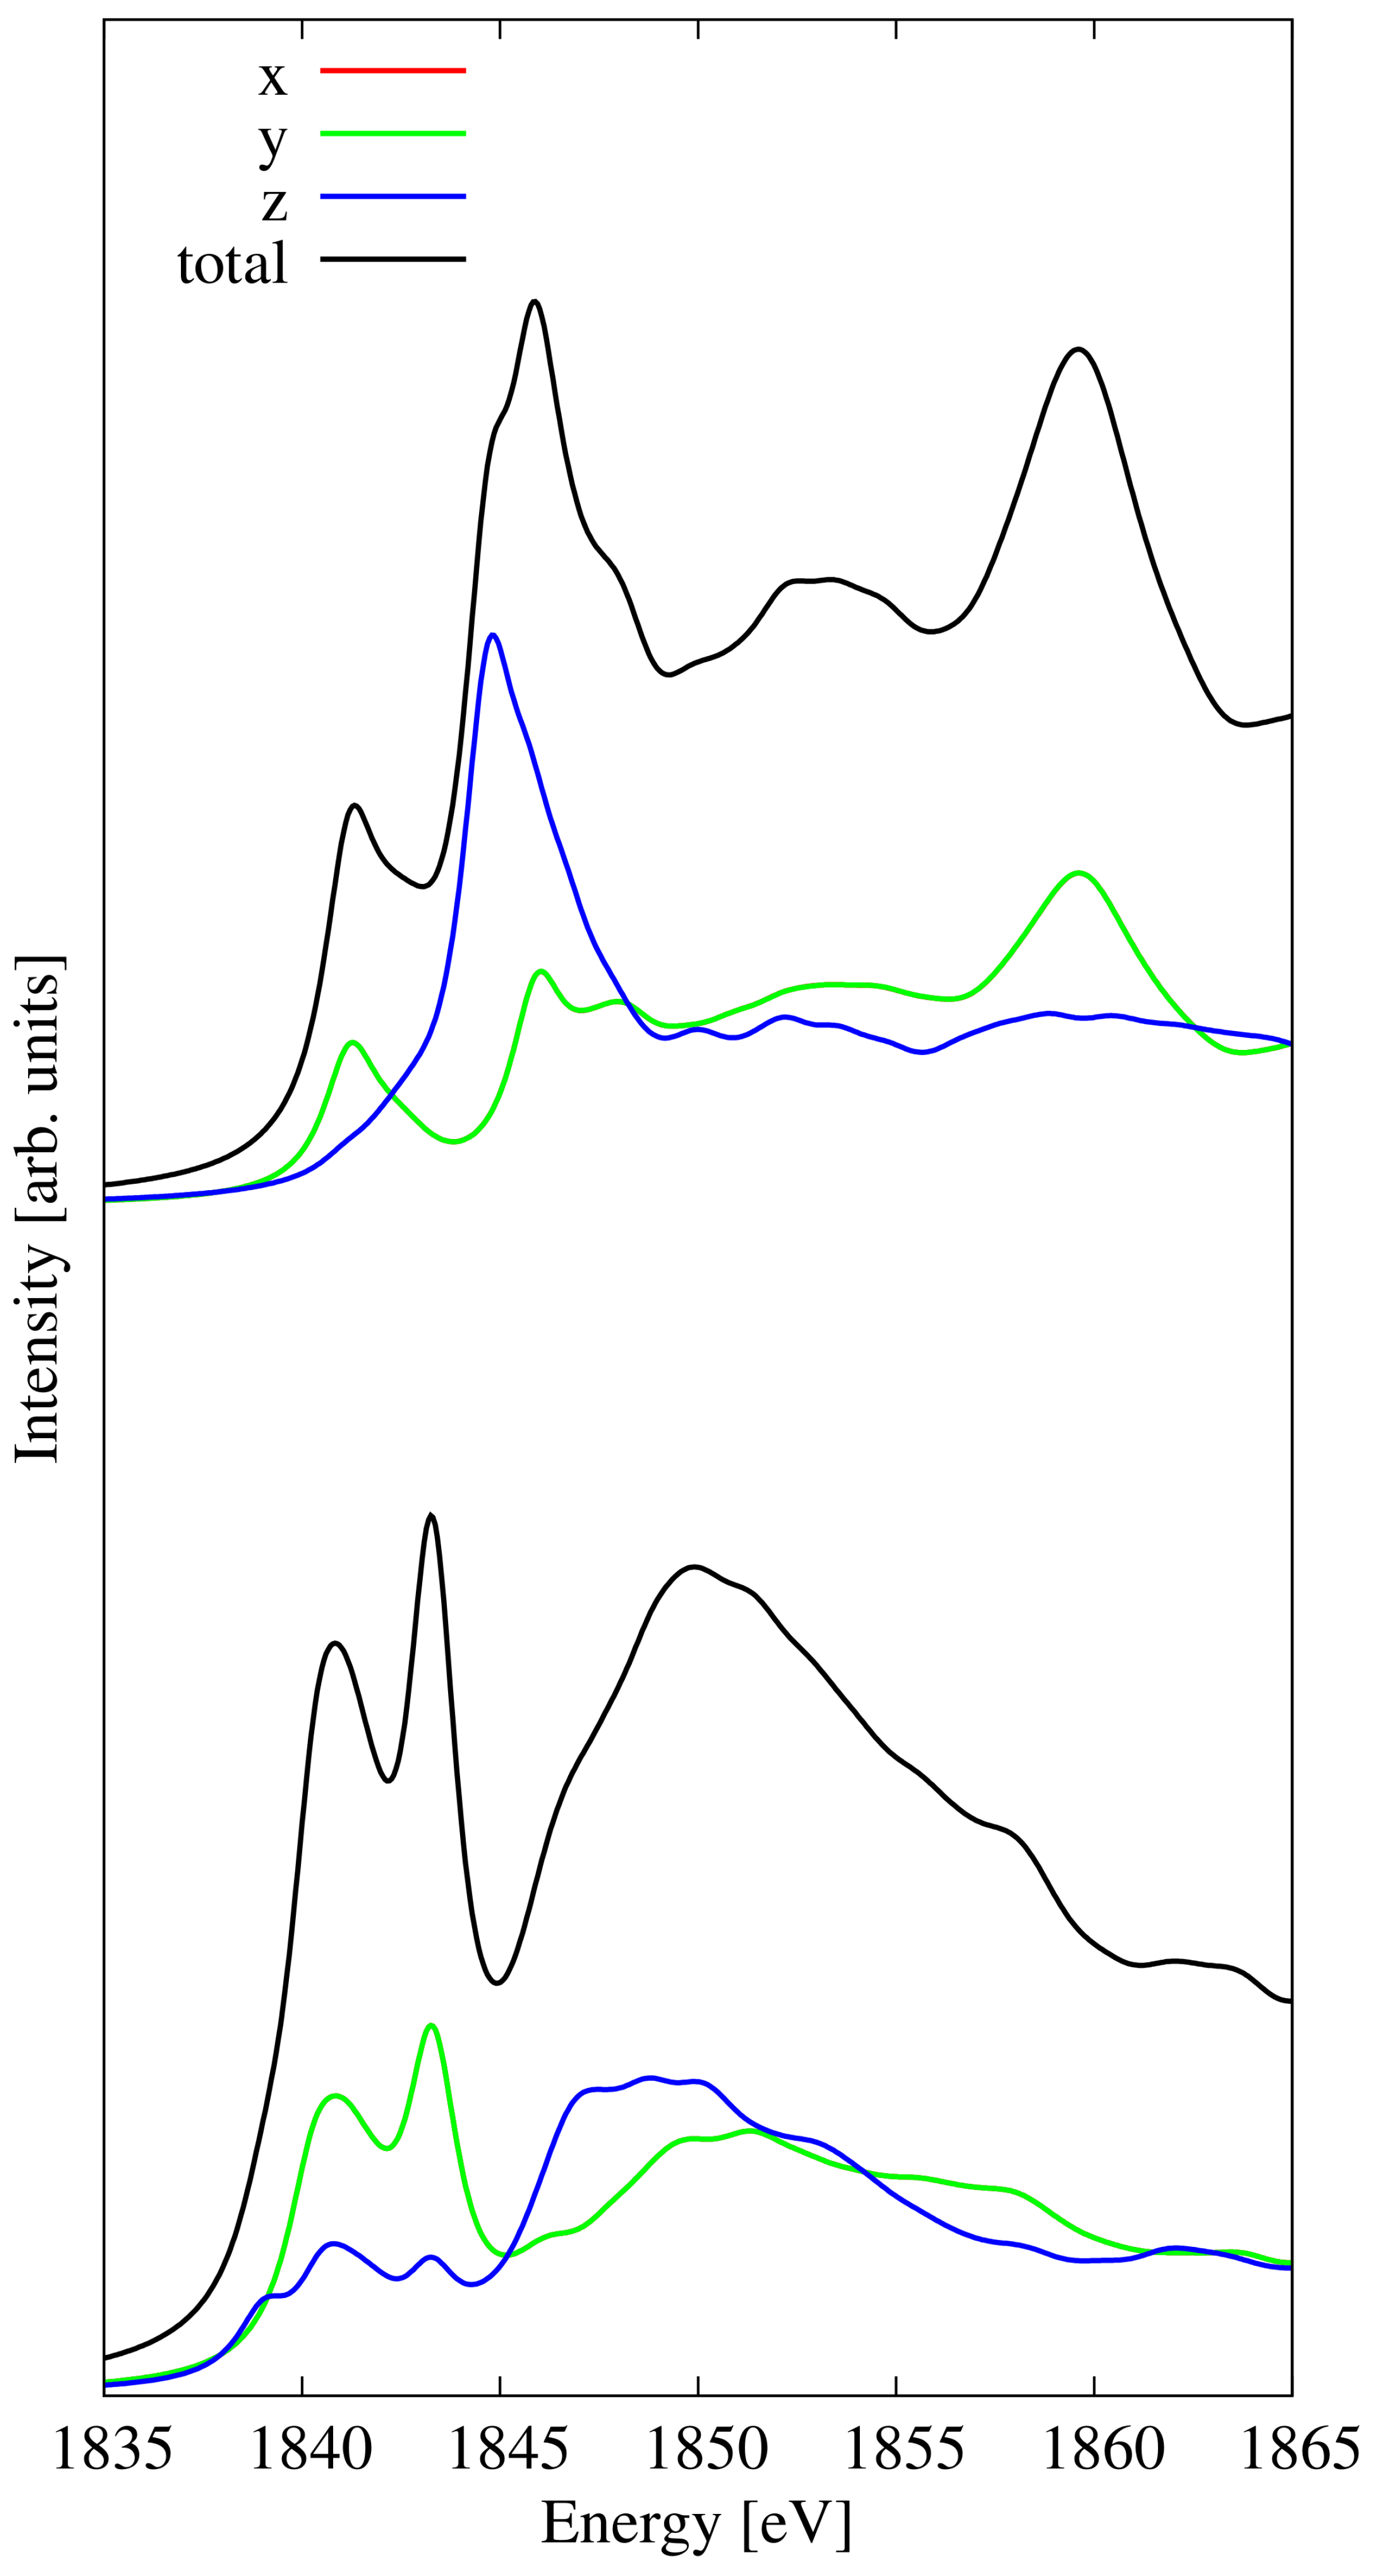
The calculated Si K-edge XANES spectra for silicon-doped penta-graphene (3 × 3 supercell) are shown in Figure 10. As in the case of carbon, we have calculated the spectra for the two inequivalent positions of the target silicon atom within the unit cell. If the silicon atom is in the four-coordinated site, the total spectrum (upper panel in Figure 10) shows two main peaks at 1844 and 1857 eV, which are separated by a flat plateau. If the silicon atom is located at the three-coordinated site, the total spectrum (lower panel in Figure 10) again shows two main peaks, the first in the 1840–1845 eV range, which is made by two different contributions of the polarisation of the electric field, and the second broad peak in the 1845–1860 eV range. We find a clear dependence on the polarisation of the X-rays for both locations of Si.

3.6. Silicon Substitution in Hydrogenated Penta-Graphene

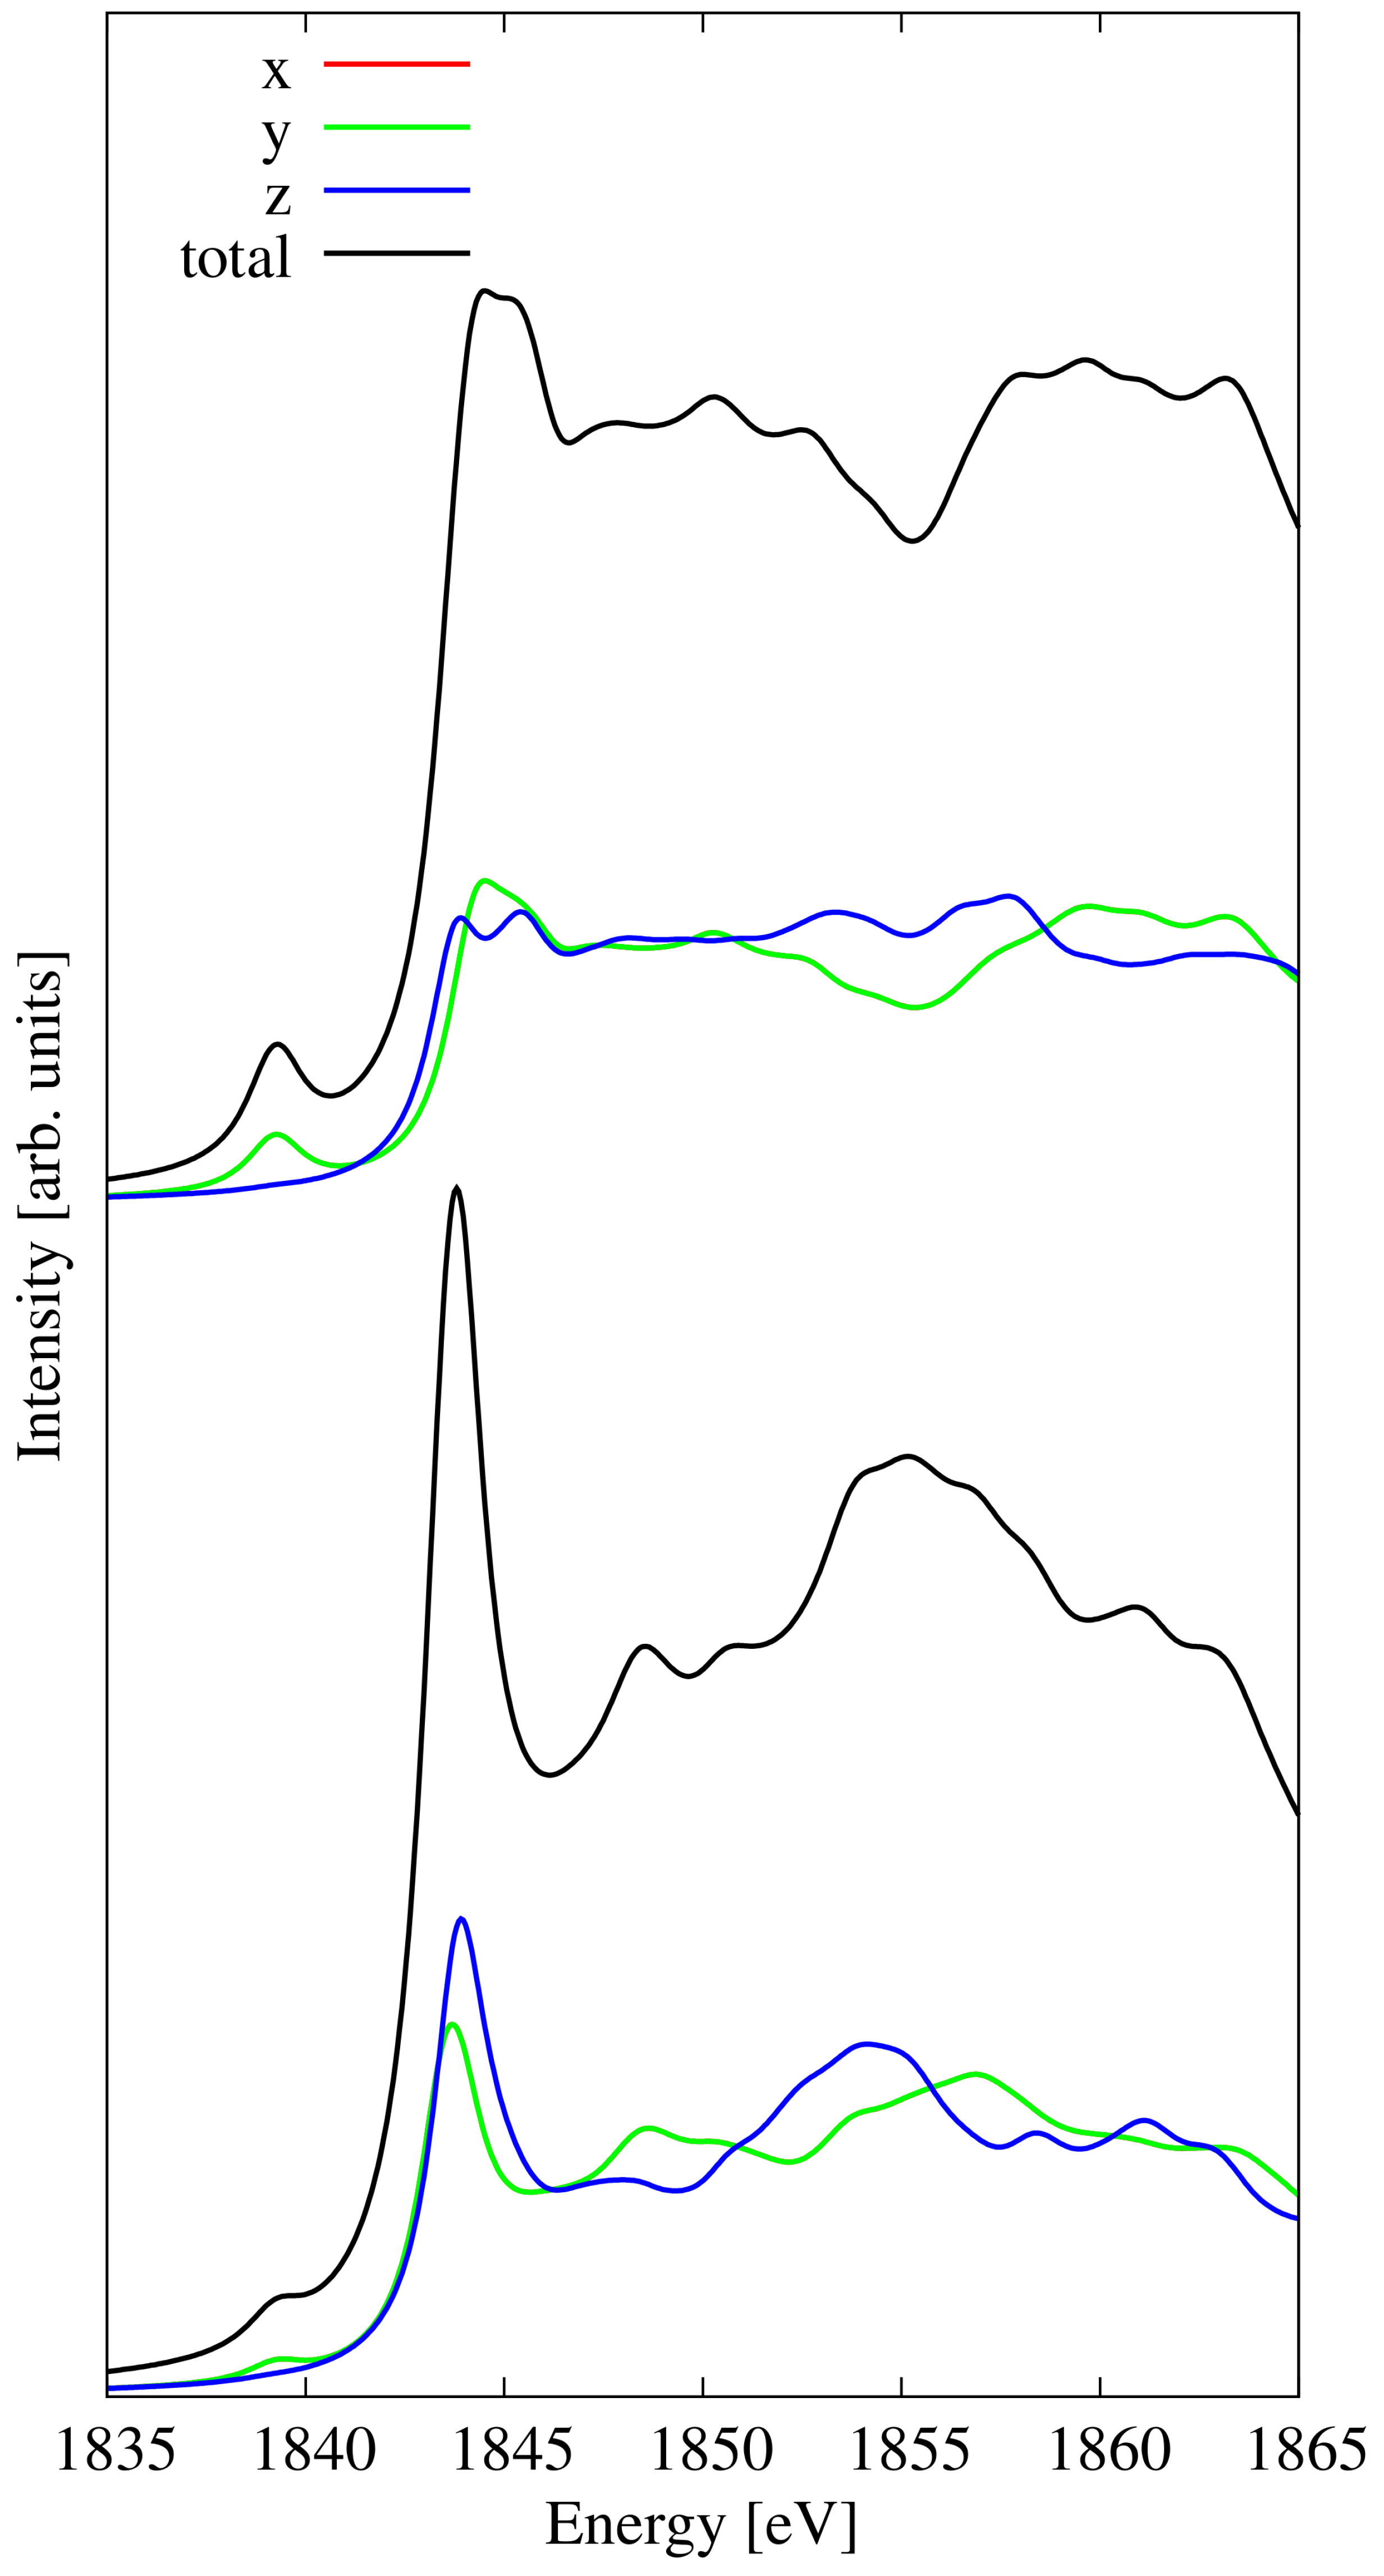
With respect to the single silicon substitution in hydrogenated penta-graphene, we report the Si K-edge XANES spectra (3 × 3 supercell) in Figure 11. We have calculated the spectra for the two inequivalent positions of the target silicon atom within the unit cell. The spectra for the different substitution sites, as in the previous cases, site 1 and site 2 in Figure 1A, show a weak dependence on the polarisation direction of the X-rays.
If the silicon substitution in hydrogenated penta-graphene is at site 1, the partial and the total spectrum (Figure 11 upper panel) show a plateau beyond 1844 eV. In the case where the silicon atom is located at site 2, it has three carbon atoms and one hydrogen atom as its closest neighbors. In this case, the spectra are again almost independent of the polarisation and show a sharp absorption peak at 1843–1844 eV (Figure 11 lower panel).

3.7. Penta-SiC2

Our analysis was extended to the X-ray absorption of pristine penta-SiC2. The two inequivalent sites 1 and 2 in Figure 1A are now occupied by a silicon and a carbon atom, respectively.
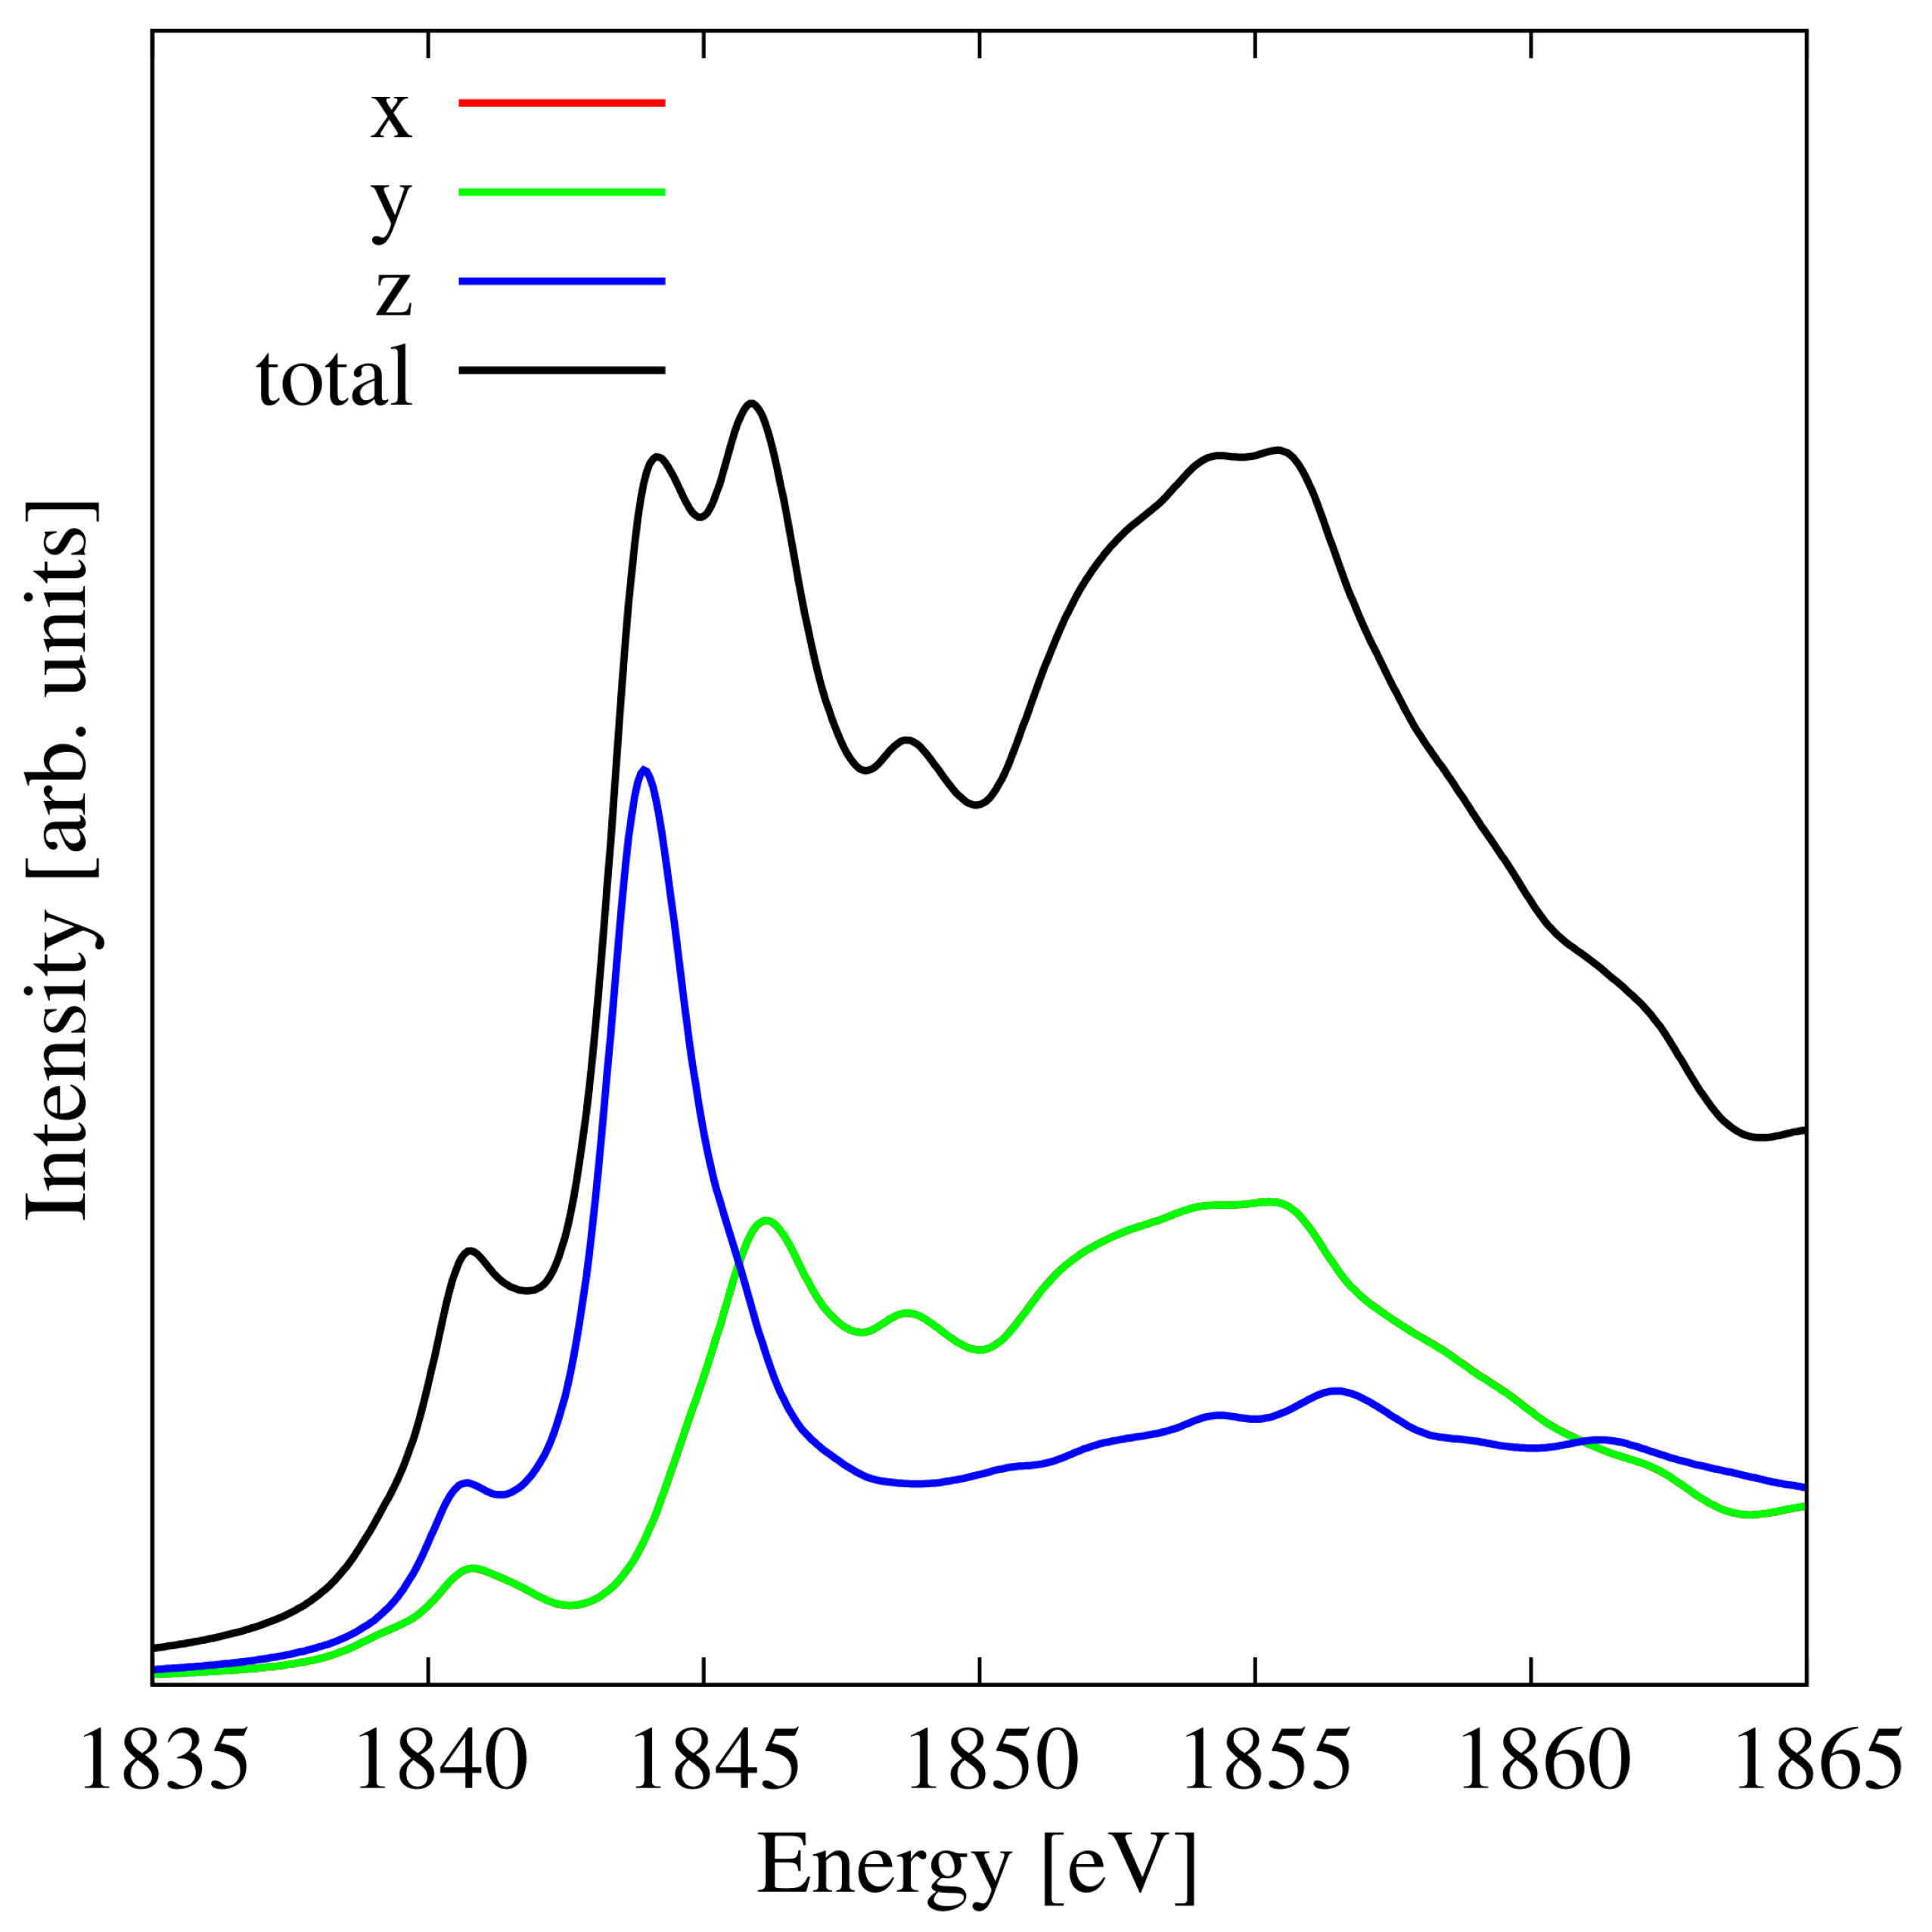
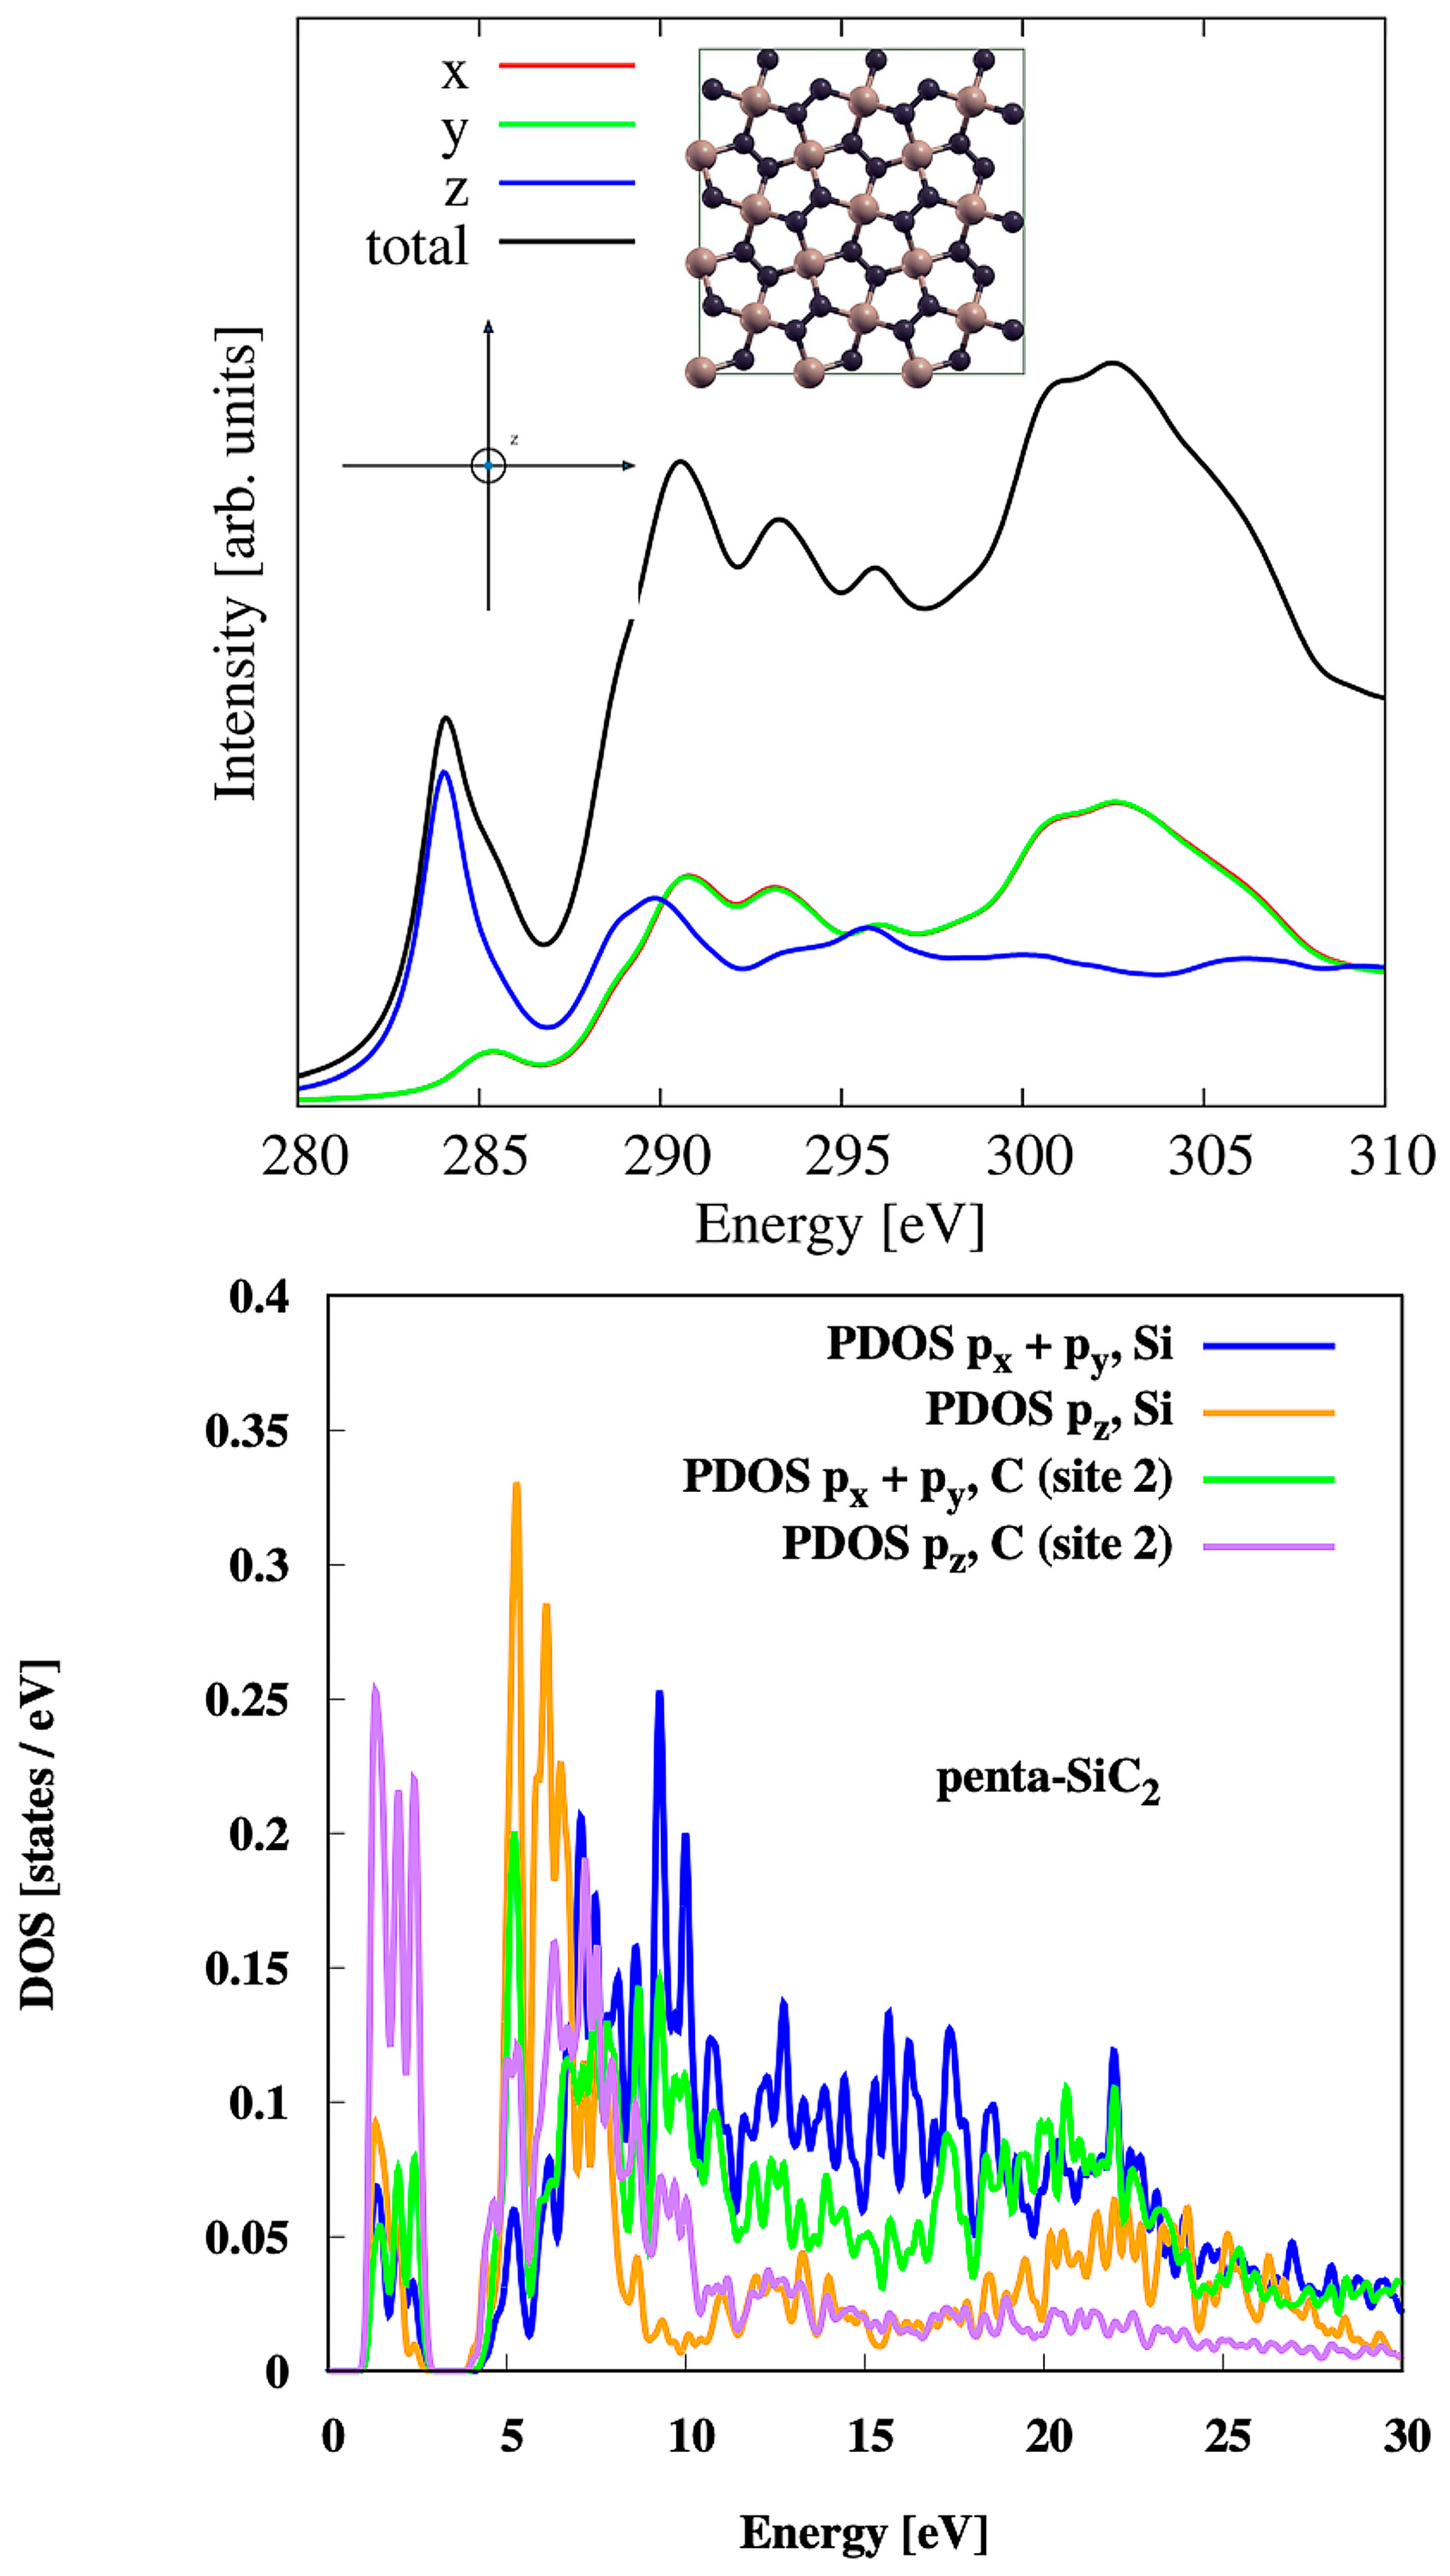
We show in Figure 12 the Si K-edge XANES spectra of a 3 × 3 supercell of penta-SiC2 and in Figure 13 the spectra for the C K-edge.
It is interesting to compare the penta-SiC2 Si K-edge spectra reported in Figure 12 with the case of a single four-coordinated silicon substitution in penta-graphene, for which the Si K-edge XANES spectra were presented in Figure 10. At low energy, the main difference is the decoupling of the peaks in the low-energy brightest peak around 1845 eV due to the shift of the z-polarised contribution to the spectra towards low energy. However, the most important change, which is due to the change of the atomic environment from penta-graphene to penta-SiC2, is found at energies beyond 1850 eV. The high-energy peak in the Si K-edge spectra for silicon substitution in penta-graphene is essentially suppressed, while a broad peak occurs between 1850 and 1860 eV.
With respect to the C K-edge results (see top panel of Figure 13), the system shows a clear anisotropic behaviour with the main contribution of z-polarised X-rays at low energy, while in the 300–305 eV range the main contribution can be attributed to the absorption of X-rays polarised along the in-plane directions.
This behaviour can be explained by the analysis of the PDOS in the lower part of Figure 13. The PDOS clearly shows that at low energy the transition 1 s p z , localised on the carbon at position 2, contributes significantly to the XANES peak, with only a small contribution from p x , p y orbitals. In contrast, the bright peaks between 290 and 300 eV in the XANES spectrum can be confidently assigned to the transitions to the p x , p y , p z orbitals localised on Si.

3.8. Hydrogenated Penta-SiC2

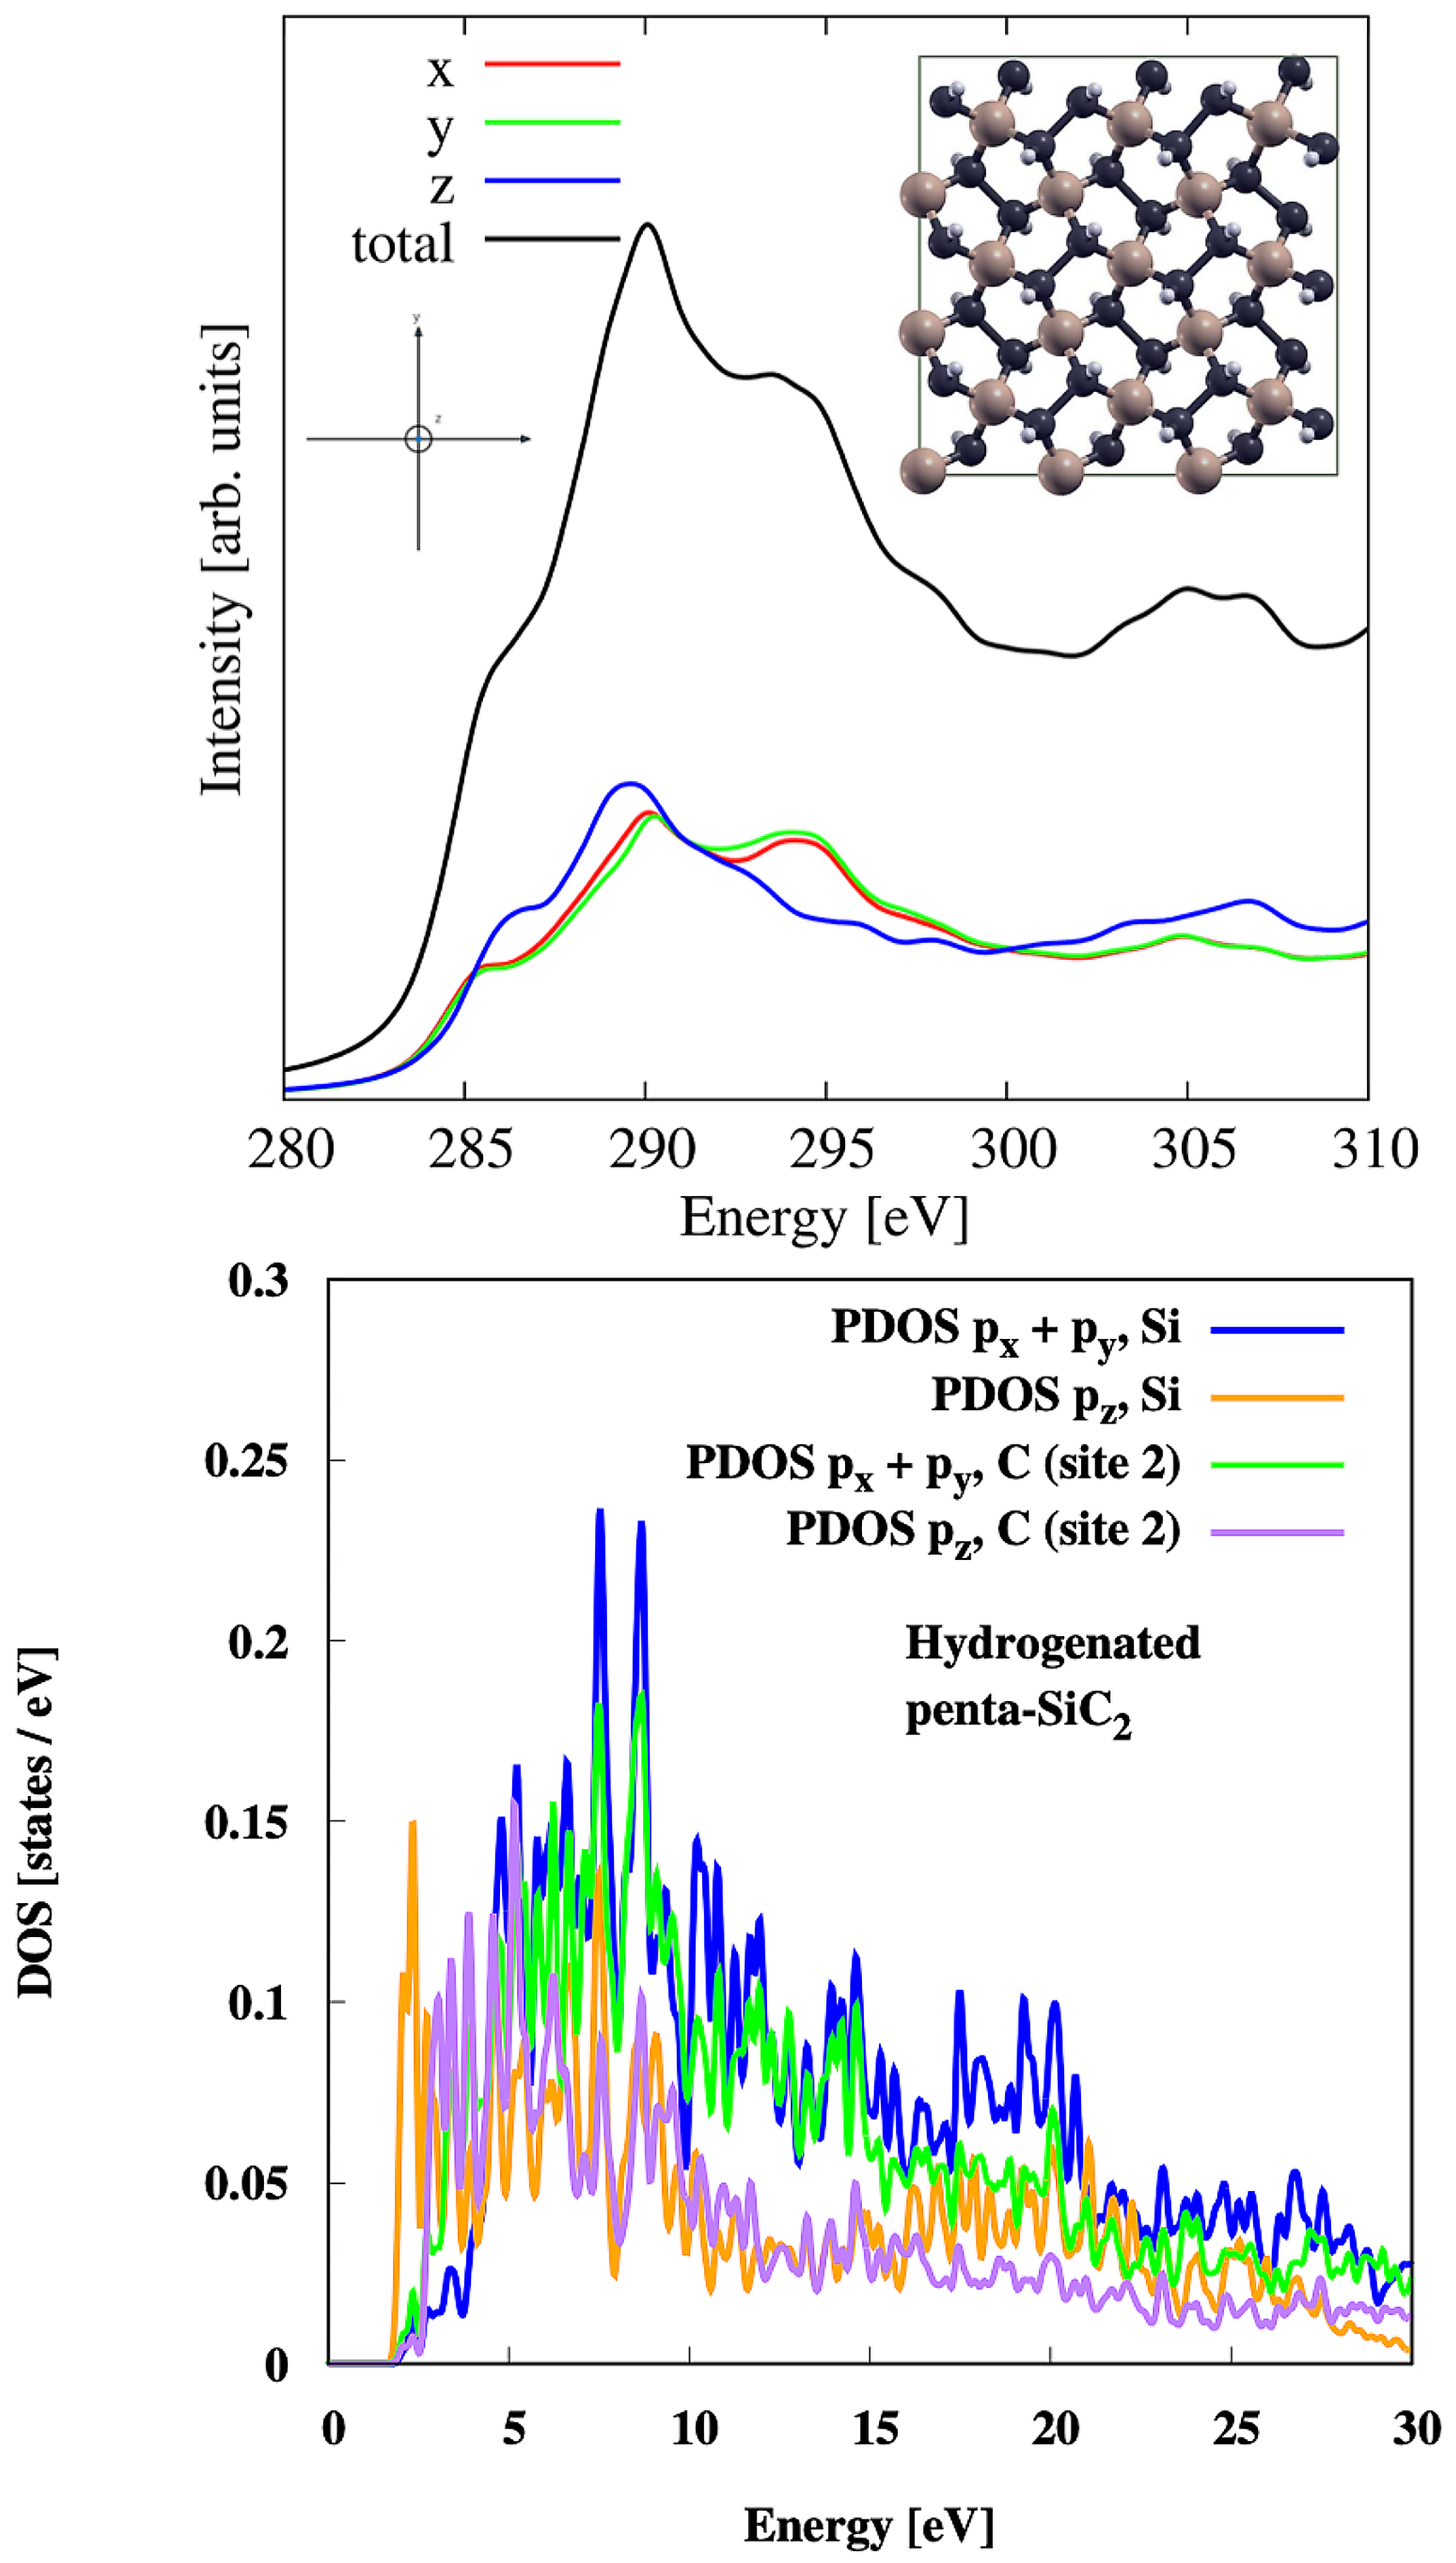
The last system for which we have calculated the X-ray absorption is hydrogenated penta-SiC2. Starting with silicon, we report the calculated Si K-edge XANES spectra for hydrogenated penta-SiC2 (3 × 3 supercell) in Figure 14 with the core-hole in a four-coordinated silicon (site 1 in Figure 1A).
The similarity with the one case of silicon substitution reported in Figure 11 is obvious. In both cases, the local environment of the four-coordinated silicon atom, in which the core-hole is formed, consists of carbon atoms without unsaturated bonds.
In Figure 15, we show the C K-edge spectra for a 3 × 3 supercell of hydrogenated penta-SiC2 with the core-hole in a three-coordinated position (site 1 in Figure 1A). In this case, the total spectrum essentially consists of a sharp main peak located at 290 eV. We also note that the spectra in this case are essentially independent of the polarisation direction.
Also in this case, a thorough analysis of the DOS projected onto the atomic orbitals of C and Si can help us to understand the electronic transitions that contribute to the shape of the XANES spectrum. At low energy, the PDOS clearly shows a strong contribution of the C 1 s p z excitation to hybridised orbitals localised on both C and Si, while the bright transition at 290 eV in the XANES spectrum can be attributed to the excitation to the C 1 s p x , p y orbitals of both hybridised elements.

3.9. Influence of Functionalisation on C K-Edge

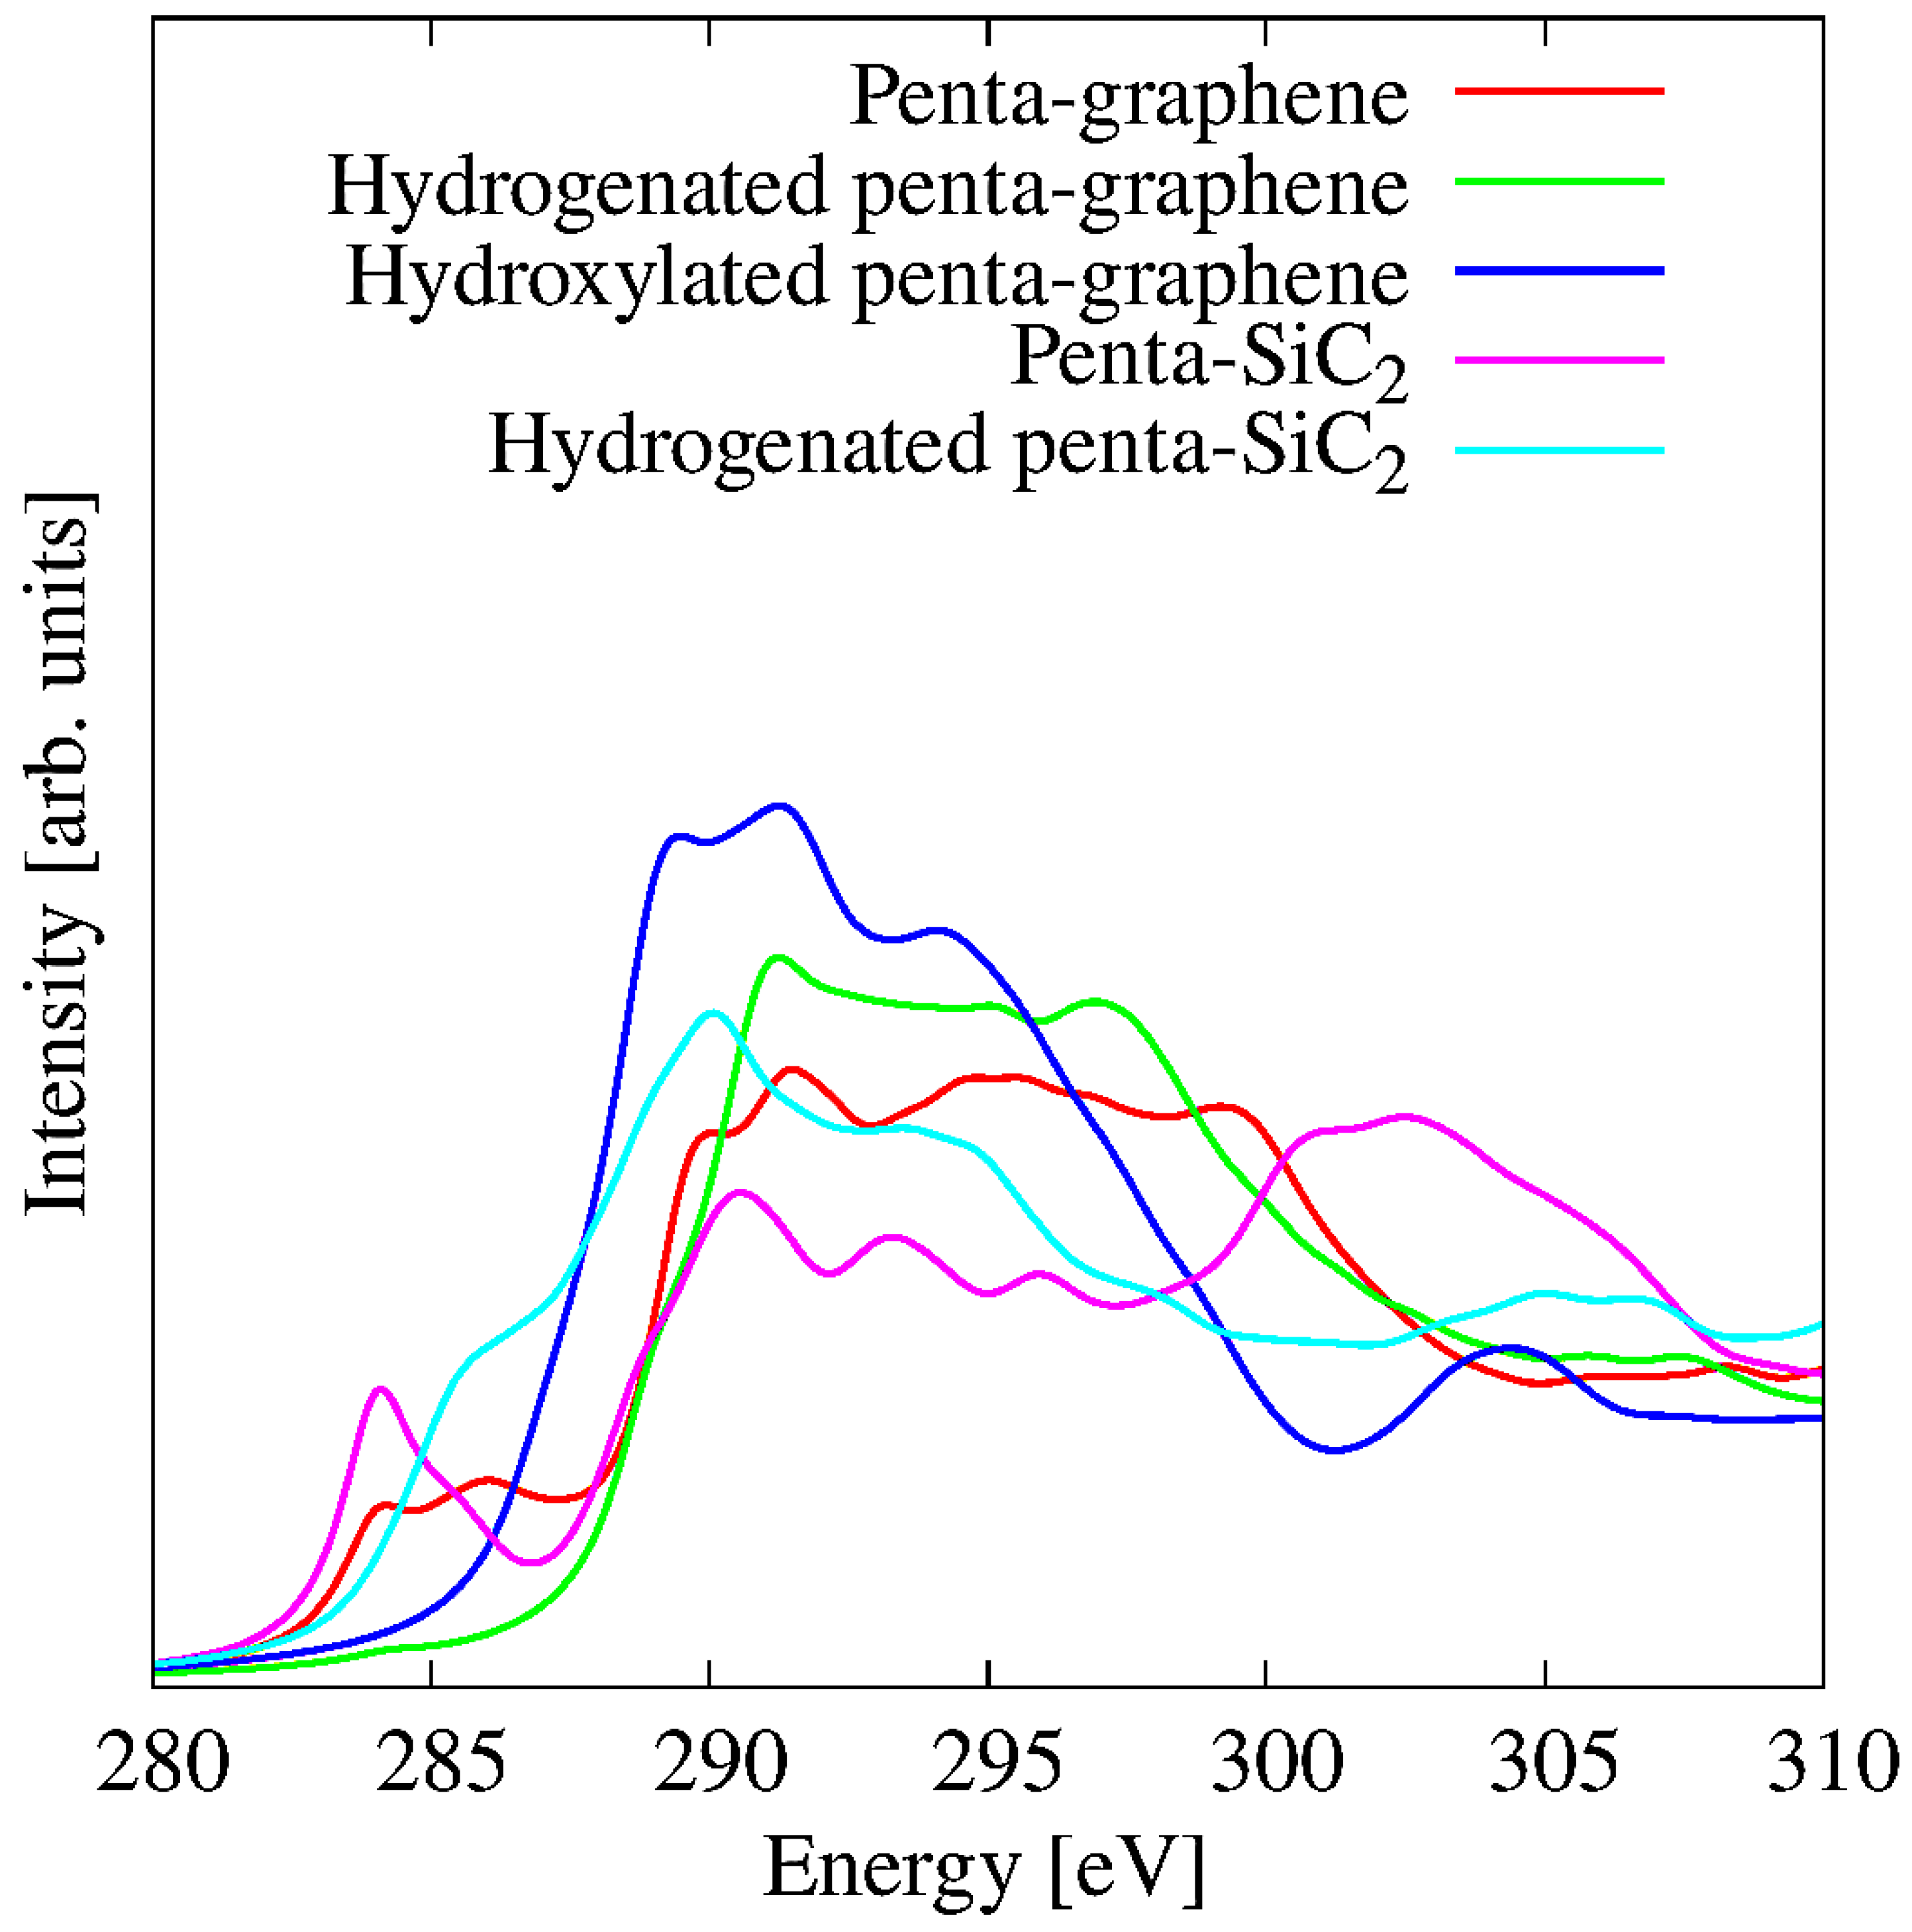
To further discuss the influence of functionalisation, we summarise in Figure 16 all C K-edge spectra, averaged over the two inequivalent sites and the polarisation directions of the electric field. Apart from penta-SiC2, the XANES spectra of the analysed structures show a maximum in the range 290–295 eV. For penta-SiC2, the maximum is in the range of 300–305 eV. Another notable difference is that the low-energy, sharp peak at 285 eV is only found in penta-SiC2. The functionalisation of penta-graphene leads to a slight increase in the absorption maximum upon H-functionalisation, and to a red shift with hydroxylation. Moreover, both terminations suppress the low-energy plateau of the C K-edge of penta-graphene. In the case of penta-SiC2, hydrogenation has a strong influence on the spectrum, which transitions from three to one main peak.

4. Conclusions

In this work, a detailed and comprehensive ab initio analysis of the electronic properties and XANES line shape of 2D materials characterised by Cairo pentagonal tiling, such as pristine, hydrogenated, and hydroxylated penta-graphene, is presented. In addition, we investigated the effects of a single silicon substitution on the XANES spectra of pristine and hydrogenated penta-graphene as well as pristine and hydrogenated penta-SiC2. The calculations of the element- and spatially resolved K-edge spectra were performed using a DFT framework within the core-hole formalism and polarisation-resolved cross sections. Bond length analysis, electronic band structure, and projected density of states of these materials were used to investigate the effects of functionalisation and substitution compared to the original pristine penta-graphene.
In this structure, the C K-edge XANES spectrum exhibits a pronounced π * transition at about 285 eV, with a σ * -character region between 293 and 303 eV. In addition, a strong anisotropy is observed that favours z-polarised transitions at low energy. Hydrogen and hydroxyl functional groups significantly change the C K-edge spectrum. In particular, π * transitions at low energy are suppressed, and the anisotropic polarisation is less pronounced. This change is due to the unoccupied electronic states at the two inequivalent C sites, which is confirmed by PDOS analysis. Furthermore, the silicon substitution in penta-graphene forms a well-defined, polarisation-sensitive Si K-edge doublet at 1844 eV and 1857 eV. However, in penta-SiC2, these features are broadened due to stronger Si-C hybridisation and delocalisation. The C K-edge in penta-SiC2 becomes strongly anisotropic, but regains a sharp, almost isotropic character after hydrogen passivation.
These spectral features can be used as fingerprints to classify structural phases, different terminations, and substitutional changes, such as residual hydrogen in two-dimensional pentagonal materials. The strong correlation between the local bond environments and the XANES features not only facilitates the differentiation of phases, but also enables the investigation of the relationship between structure and functionalities. We note that the tunability of the chemical modification that alters the absorption behaviour of these 2D materials enables promising applications in polarisation-sensitive optoelectronics, directional photodetectors, and energy harvesting devices. The high sensitivity of K-edge spectra to surface termination and local coordination environments enables in situ and in operando characterisation of these materials, which are suitable for chemical sensing and environmental monitoring. Their easily tunable band structure and localised spectral properties also support potential applications in nanoelectronics, photocatalysis, and adaptive material systems.
We emphasise that the calculation of XANES spectra using PBE-DFT can be significantly improved in future work, including temperature-dependent vibrational broadening, many-body, and excitonic effects (beyond the mean-field independent particle picture). These effects pose a major challenge in matching experimental and theoretical spectra. When electron–hole interactions are included by solving the Bethe–Salpeter equation (BSE), strong excitonic effects markedly reshape the XANES relative to the independent-particle approximation (IPA). Exciton binding shifts the absorption onset and renormalises peak positions; oscillator strength is redistributed, altering intensities and line shapes through the mixing of single-particle transitions. Notably, XANES spectra can exhibit pre-edge features (pre-peaks) or enhanced resonances absent in simple band-structure or IPA calculations. These effects caution against drawing conclusions from IPA spectra alone. In addition, the observed underestimation of the band gap leads to a shift in the onset of absorption features.
Despite these limitations, the present study confirms that first-principles XANES calculations are a useful and effective tool for investigating the local electronic and chemical environment in 2D materials.

Author Contributions

Conceptualisation, A.P., T.M. and S.T.; methodology, A.P., T.M. and S.T.; software, A.P.; validation, A.P.; formal analysis, A.P.; investigation, A.P.; resources, S.T.; data curation, A.P.; writing—original draft preparation, A.P.; writing—review and editing, A.P., T.M. and S.T; visualisation, A.P.; supervision, S.T.; project administration, S.T.; funding acquisition, S.T. All authors have read and agreed to the published version of the manuscript.

Funding

This work has received funding from the European Union under the Mimosa grant agreement No. 10104665.

Data Availability Statement

The original contributions presented in this study are included in the article. Further inquiries can be directed to the corresponding author.

Acknowledgments

The authors gratefully acknowledge the use of the HPC facilities at FBK.

Conflicts of Interest

The authors declare no conflicts of interest.

References

  1. Geim, A.K.; Novoselov, K.S. The rise of graphene. Nat. Mater. 2007, 6, 183–191. [Google Scholar] [CrossRef] [PubMed]
  2. Allen, M.J.; Tung, V.C.; Kaner, R.B. Honeycomb Carbon: A Review of Graphene. Chem. Rev. 2010, 110, 132–145. [Google Scholar] [CrossRef]
  3. Randviir, E.P.; Brownson, D.A.; Banks, C.E. A decade of graphene research: Production, applications and outlook. Mater. Today 2014, 17, 426–432. [Google Scholar] [CrossRef]
  4. Pedrielli, A.; Taioli, S.; Garberoglio, G.; Pugno, N.M. Designing graphene based nanofoams with nonlinear auxetic and anisotropic mechanical properties under tension or compression. Carbon 2017, 111, 796–806. [Google Scholar] [CrossRef]
  5. Morresi, T.; Pedrielli, A.; Beccara, S.a.; Gabbrielli, R.; Pugno, N.M.; Taioli, S. Structural, electronic and mechanical properties of all-sp2 carbon allotropes with density lower than graphene. Carbon 2020, 159, 512–526. [Google Scholar] [CrossRef]
  6. Pedrielli, A.; Taioli, S.; Garberoglio, G.; Pugno, N.M. Mechanical and thermal properties of graphene random nanofoams via Molecular Dynamics simulations. Carbon 2018, 132, 766–775. [Google Scholar] [CrossRef]
  7. Taioli, S.; Gabbrielli, R.; Simonucci, S.; Pugno, N.M.; Iorio, A. Lobachevsky crystallography made real through carbon pseudospheres. J. Phys. Condens. Matter 2016, 28, 13LT01. [Google Scholar] [CrossRef] [PubMed]
  8. Morresi, T.; Binosi, D.; Simonucci, S.; Piergallini, R.; Roche, S.; Pugno, N.M.; Simone, T. Exploring event horizons and Hawking radiation through deformed graphene membranes. 2D Mater. 2020, 7, 041006. [Google Scholar] [CrossRef]
  9. Vogt, P.; De Padova, P.; Quaresima, C.; Avila, J.; Frantzeskakis, E.; Asensio, M.C.; Resta, A.; Ealet, B.; Le Lay, G. Silicene: Compelling Experimental Evidence for Graphenelike Two-Dimensional Silicon. Phys. Rev. Lett. 2012, 108, 155501. [Google Scholar] [CrossRef]
  10. Meyer, J.C.; Chuvilin, A.; Algara-Siller, G.; Biskupek, J.; Kaiser, U. Selective Sputtering and Atomic Resolution Imaging of Atomically Thin Boron Nitride Membranes. Nano Lett. 2009, 9, 2683–2689. [Google Scholar] [CrossRef] [PubMed]
  11. Chen, X.; Yang, Q.; Meng, R.; Jiang, J.; Liang, Q.; Tan, C.; Sun, X. The electronic and optical properties of novel germanene and antimonene heterostructures. J. Mater. Chem. C 2016, 4, 5434–5441. [Google Scholar] [CrossRef]
  12. Matthes, L.; Pulci, O.; Bechstedt, F. Massive Dirac quasiparticles in the optical absorbance of graphene, silicene, germanene, and tinene. J. Phys. Condens. Matter 2013, 25, 395305. [Google Scholar] [CrossRef]
  13. Shen, Y.; Wang, Q. Pentagon-based 2D materials: Classification, properties and applications. Phys. Rep. 2022, 964, 1–42. [Google Scholar] [CrossRef]
  14. Shah, N.A.; Janjua, R.A.; Jin, Y.; Evans, J.; Shen, J.Q.; He, S. Theoretical development in the realm of pentagonal 2D-materials. J. Appl. Phys. 2024, 136, 130701. [Google Scholar] [CrossRef]
  15. Bykov, M.; Bykova, E.; Ponomareva, A.V.; Tasnádi, F.; Chariton, S.; Prakapenka, V.B.; Glazyrin, K.; Smith, J.S.; Mahmood, M.F.; Abrikosov, I.A.; et al. Realization of an Ideal Cairo Tessellation in Nickel Diazenide NiN2: High-Pressure Route to Pentagonal 2D Materials. ACS Nano 2021, 15, 13539–13546. [Google Scholar] [CrossRef] [PubMed]
  16. Zhang, S.; Zhou, J.; Wang, Q.; Chen, X.; Kawazoe, Y.; Jena, P. Penta-graphene: A new carbon allotrope. Proc. Natl. Acad. Sci. USA 2015, 112, 2372–2377. [Google Scholar] [CrossRef]
  17. Einollahzadeh, H.; Dariani, R.; Fazeli, S. Computing the band structure and energy gap of penta-graphene by using DFT and G0W0 approximations. Solid State Commun. 2016, 229, 1–4. [Google Scholar] [CrossRef]
  18. Taioli, S.; Umari, P.; De Souza, M.M. Electronic properties of extended graphene nanomaterials from GW calculations. Phys. Status Solidi B 2009, 246, 2572–2576. [Google Scholar] [CrossRef]
  19. Umari, P.; Petrenko, O.; Taioli, S.; De Souza, M.M. Communication: Electronic band gaps of semiconducting zig-zag carbon nanotubes from many-body perturbation theory calculations. J. Chem. Phys. 2012, 136, 181101. [Google Scholar] [CrossRef]
  20. Le, M.Q. Mechanical properties of penta-graphene, hydrogenated penta-graphene, and penta-CN2 sheets. Comput. Mater. Sci. 2017, 136, 181–190. [Google Scholar] [CrossRef]
  21. Rajbanshi, B.; Sarkar, S.; Mandal, B.; Sarkar, P. Energetic and electronic structure of penta-graphene nanoribbons. Carbon 2016, 100, 118–125. [Google Scholar] [CrossRef]
  22. Yuan, P.F.; Zhang, Z.H.; Fan, Z.Q.; Qiu, M. Electronic structure and magnetic properties of penta-graphene nanoribbons. Phys. Chem. Chem. Phys. 2017, 19, 9528–9536. [Google Scholar] [CrossRef]
  23. Minaie, B.; Ketabi, S.A.; Sousa, J.M.D. First-principles calculations of the electronic and optical properties of penta-graphene monolayer: Study of many-body effects. arXiv 2024, arXiv:2401.05429. [Google Scholar]
  24. Xu, W.; Zhang, G.; Li, B. Thermal conductivity of penta-graphene from molecular dynamics study. J. Chem. Phys. 2015, 143, 154703. [Google Scholar] [CrossRef]
  25. Wang, F.Q.; Yu, J.; Wang, Q.; Kawazoe, Y.; Jena, P. Lattice thermal conductivity of penta-graphene. Carbon 2016, 105, 424–429. [Google Scholar] [CrossRef]
  26. Wang, F.Q.; Liu, J.; Li, X.; Wang, Q.; Kawazoe, Y. Weak interlayer dependence of lattice thermal conductivity on stacking thickness of penta-graphene. Appl. Phys. Lett. 2017, 111, 192102. [Google Scholar] [CrossRef]
  27. Behzad, S.; Chegel, R. The evolution of penta-graphene thermoelectrics: External fields as a key enabler for High-Performance devices. Mater. Sci. Eng. B 2024, 300, 117082. [Google Scholar] [CrossRef]
  28. Stauber, T.; Beltrán, J.I.; Schliemann, J. Tight-binding approach to penta-graphene. Sci. Rep. 2016, 6, 22672. [Google Scholar] [CrossRef]
  29. Haberer, D.; Vyalikh, D.V.; Taioli, S.; Dora, B.; Farjam, M.; Fink, J.; Marchenko, D.; Pichler, T.; Ziegler, K.; Simonucci, S.; et al. Tunable Band Gap in Hydrogenated Quasi-Free-Standing Graphene. Nano Lett. 2010, 10, 3360–3366. [Google Scholar] [CrossRef]
  30. Haberer, D.; Petaccia, L.; Farjam, M.; Taioli, S.; Jafari, S.A.; Nefedov, A.; Zhang, W.; Calliari, L.; Scarduelli, G.; Dora, B.; et al. Direct observation of a dispersionless impurity band in hydrogenated graphene. Phys. Rev. B 2011, 83, 165433. [Google Scholar] [CrossRef]
  31. Berdiyorov, G.R.; Dixit, G.; Madjet, M.E. Band gap engineering in penta-graphene by substitutional doping: First-principles calculations. J. Phys. Condens. Matter 2016, 28, 475001. [Google Scholar] [CrossRef]
  32. Li, X.; Zhang, S.; Wang, F.Q.; Guo, Y.; Liu, J.; Wang, Q. Tuning the electronic and mechanical properties of penta-graphene via hydrogenation and fluorination. Phys. Chem. Chem. Phys. 2016, 18, 14191–14197. [Google Scholar] [CrossRef]
  33. Zhu, M.Q.; Wang, X.F. First-Principles Study of CO, C2H2, and C2H4 Adsorption on Penta-Graphene for Transformer Oil Gas Sensing Applications. C 2025, 11, 49. [Google Scholar] [CrossRef]
  34. Santos, R.M.d.; Sousa, L.E.d.; Galvão, D.S.; Ribeiro, L.A. Tuning Penta-Graphene Electronic Properties Through Engineered Line Defects. Sci. Rep. 2020, 10, 8014. [Google Scholar] [CrossRef]
  35. Santos, R.M.d.; da Cunha, W.F.; de Sousa Junior, R.T.; Giozza, W.F.; Ribeiro Junior, L.A. Tuning magnetic properties of penta-graphene bilayers through doping with boron, nitrogen, and oxygen. Sci. Rep. 2020, 10, 16748. [Google Scholar] [CrossRef]
  36. Morales-Ferreiro, J.; Silva-Oelker, G.; Kumar, C.; Zambra, C.; Liu, Z.; Diaz-Droguett, D.; Celentano, D. Tuning the Electronic Bandgap of Penta-Graphene from Insulator to Metal Through Functionalization: A First-Principles Calculation. Nanomaterials 2024, 14, 1751. [Google Scholar] [CrossRef] [PubMed]
  37. Tien, N.T.; Thao, P.T.B.; Thuan, L.V.P.; Chuong, D.H. First-principles study of electronic and optical properties of defective sawtooth penta-graphene nanoribbons. Comput. Mater. Sci. 2022, 203, 111065. [Google Scholar] [CrossRef]
  38. Einollahzadeh, H.; Fazeli, S.M.; Dariani, R.S. Studying the electronic and phononic structure of penta-graphane. Sci. Technol. Adv. Mater. 2016, 17, 610–617. [Google Scholar] [CrossRef]
  39. Liu, L.L.; Wang, Y.; Chen, C.P.; Yu, H.X.; Zhao, L.S.; Wang, X.C. Tuning the electronic and magnetic properties of penta-graphene using a hydrogen atom: A theoretical study. RSC Adv. 2017, 7, 40200–40207. [Google Scholar] [CrossRef]
  40. Ebrahimi, S. Effect of hydrogen coverage on the buckling of penta-graphene by molecular dynamics simulation. Mol. Simul. 2016, 42, 1485–1489. [Google Scholar] [CrossRef]
  41. Nazir, M.A.; Hassan, A.; Shen, Y.; Wang, Q. Research progress on penta-graphene and its related materials: Properties and applications. Nano Today 2022, 44, 101501. [Google Scholar] [CrossRef]
  42. Ewels, C.P.; Rocquefelte, X.; Kroto, H.W.; Rayson, M.J.; Briddon, P.R.; Heggie, M.I. Predicting experimentally stable allotropes: Instability of penta-graphene. Proc. Natl. Acad. Sci. USA 2015, 112, 15609–15612. [Google Scholar] [CrossRef] [PubMed]
  43. Cerdá, J.I.; Sławińska, J.; Le Lay, G.; Marele, A.C.; Gómez-Rodríguez, J.M.; Dávila, M.E. Unveiling the pentagonal nature of perfectly aligned single-and double-strand Si nano-ribbons on Ag(110). Nat. Commun. 2016, 7, 13076. [Google Scholar] [CrossRef]
  44. Berdiyorov, G.R.; Madjet, M.E.A. First-principles study of electronic transport and optical properties of penta-graphene, penta-SiC2 and penta-CN2. RSC Adv. 2016, 6, 50867–50873. [Google Scholar] [CrossRef]
  45. Xu, Y.; Ning, Z.; Zhang, H.; Ni, G.; Shao, H.; Peng, B.; Zhang, X.; He, X.; Zhu, Y.; Zhu, H. Anisotropic ultrahigh hole mobility in two-dimensional penta-SiC2 by strain-engineering: Electronic structure and chemical bonding analysis. RSC Adv. 2017, 7, 45705–45713. [Google Scholar] [CrossRef]
  46. Lopez-Bezanilla, A.; Littlewood, P. σ-π-Band Inversion in a Novel Two-Dimensional Material. J. Phys. Chem. C 2015, 119, 150724095829005. [Google Scholar] [CrossRef]
  47. Chabi, S.; Kadel, K. Two-dimensional silicon carbide: Emerging direct band gap semiconductor. Nanomaterials 2020, 10, 2226. [Google Scholar] [CrossRef]
  48. Jiang, H. Band gaps from the Tran-Blaha modified Becke-Johnson approach: A systematic investigation. J. Chem. Phys. 2013, 138, 134115. [Google Scholar] [CrossRef] [PubMed]
  49. Nakada, K.; Fujita, M.; Dresselhaus, G.; Dresselhaus, M.S. Edge state in graphene ribbons: Nanometer size effect and edge shape dependence. Phys. Rev. B 1996, 54, 17954–17961. [Google Scholar] [CrossRef] [PubMed]
  50. Tian, C.; Miao, W.; Zhao, L.; Wang, J. Graphene nanoribbons: Current status and challenges as quasi-one-dimensional nanomaterials. Rev. Phys. 2023, 10, 100082. [Google Scholar] [CrossRef]
  51. Liu, Z.; Liu, X.; Wang, J. Electronic structures of Penta-SiC2 and g-SiC3 nanoribbons: A first-principles study. Materials 2023, 16, 4041. [Google Scholar] [CrossRef]
  52. Taioli, S.; Simonucci, S.; Calliari, L.; Dapor, M. Electron spectroscopies and inelastic processes in nanoclusters and solids: Theory and experiment. Phys. Rep. 2010, 493, 237–319. [Google Scholar] [CrossRef]
  53. Taioli, S.; Dapor, M. Advancements in secondary and backscattered electron energy spectra and yields analysis: From theory to applications. Surf. Sci. Rep. 2025, 80, 100646. [Google Scholar] [CrossRef]
  54. Yano, J.; Yachandra, V.K. X-ray absorption spectroscopy. Photosynth. Res. 2009, 102, 241–254. [Google Scholar] [CrossRef] [PubMed]
  55. Fabbri, F.; Rossi, F.; Attolini, G.; Salviati, G.; Iannotta, S.; Aversa, L.; Verucchi, R.; Nardi, M.; Fukata, N.; Dierre, B.; et al. Enhancement of the core near-band-edge emission induced by an amorphous shell in coaxial one-dimensional nanostructure: The case of SiC/SiO2core/shell self-organized nanowires. Nanotechnology 2010, 21, 345702. [Google Scholar] [CrossRef]
  56. Kokalj, A. Computer graphics and graphical user interfaces as tools in simulations of matter at the atomic scale. Comput. Mater. Sci. 2003, 28, 155–168. [Google Scholar] [CrossRef]
  57. Stukowski, A. Visualization and analysis of atomistic simulation data with OVITO—The Open Visualization Tool. Model. Simul. Mater. Sci. Eng. 2009, 18, 015012. [Google Scholar] [CrossRef]
  58. Giannozzi, P.; Baroni, S.; Bonini, N.; Calandra, M.; Car, R.; Cavazzoni, C.; Ceresoli, D.; Chiarotti, G.L.; Cococcioni, M.; Dabo, I.; et al. QUANTUM ESPRESSO: A modular and open-source software project for quantum simulations of materials. J. Phys. Condens. Matter 2009, 21, 395502. [Google Scholar] [CrossRef]
  59. Gougoussis, C.; Calandra, M.; Seitsonen, A.P.; Mauri, F. First-principles calculations of X-ray absorption in a scheme based on ultrasoft pseudopotentials: From α-quartz to high-Tc compounds. Phys. Rev. B 2009, 80, 075102. [Google Scholar] [CrossRef]
  60. Available online: http://www.quantum-espresso.org (accessed on 1 March 2025).
  61. Perdew, J.P.; Burke, K.; Ernzerhof, M. Generalized Gradient Approximation Made Simple. Phys. Rev. Lett. 1996, 77, 3865–3868. [Google Scholar] [CrossRef]
  62. Blöchl, P.E. Projector augmented-wave method. Phys. Rev. B 1994, 50, 17953–17979. [Google Scholar] [CrossRef] [PubMed]
  63. Heyd, J.; Scuseria, G.E.; Ernzerhof, M. Hybrid functionals based on a screened Coulomb potential. J. Chem. Phys. 2003, 118, 8207–8215. [Google Scholar] [CrossRef]
  64. Minaie, B.; Ketabi, S.K.; De Sousa, J.M. Theoretical calculations of the optoelectronic properties of a penta-graphene monolayer: Study of many-body effects. J. Comput. Electron. 2024, 23, 1102–1110. [Google Scholar] [CrossRef]
  65. Pacilé, D.; Papagno, M.; Rodríguez, A.F.; Grioni, M.; Papagno, L.; Girit, U.O.; Meyer, J.C.; Begtrup, G.E.; Zettl, A. Near-Edge X-Ray Absorption Fine-Structure Investigation of Graphene. Phys. Rev. Lett. 2008, 101, 066806. [Google Scholar] [CrossRef]
  66. Papagno, M.; Fraile Rodríguez, A.; Girit, u.; Meyer, J.; Zettl, A.; Pacilé, D. Polarization-dependent C K near-edge X-ray absorption fine-structure of graphene. Chem. Phys. Lett. 2009, 475, 269–271. [Google Scholar] [CrossRef]
  67. Christiansen, D.; Selig, M.; Biegert, J.; Knorr, A. Theory of x-ray absorption spectroscopy: A microscopic Bloch equation approach for two-dimensional solid states. Phys. Rev. Res. 2023, 5, 023002. [Google Scholar] [CrossRef]
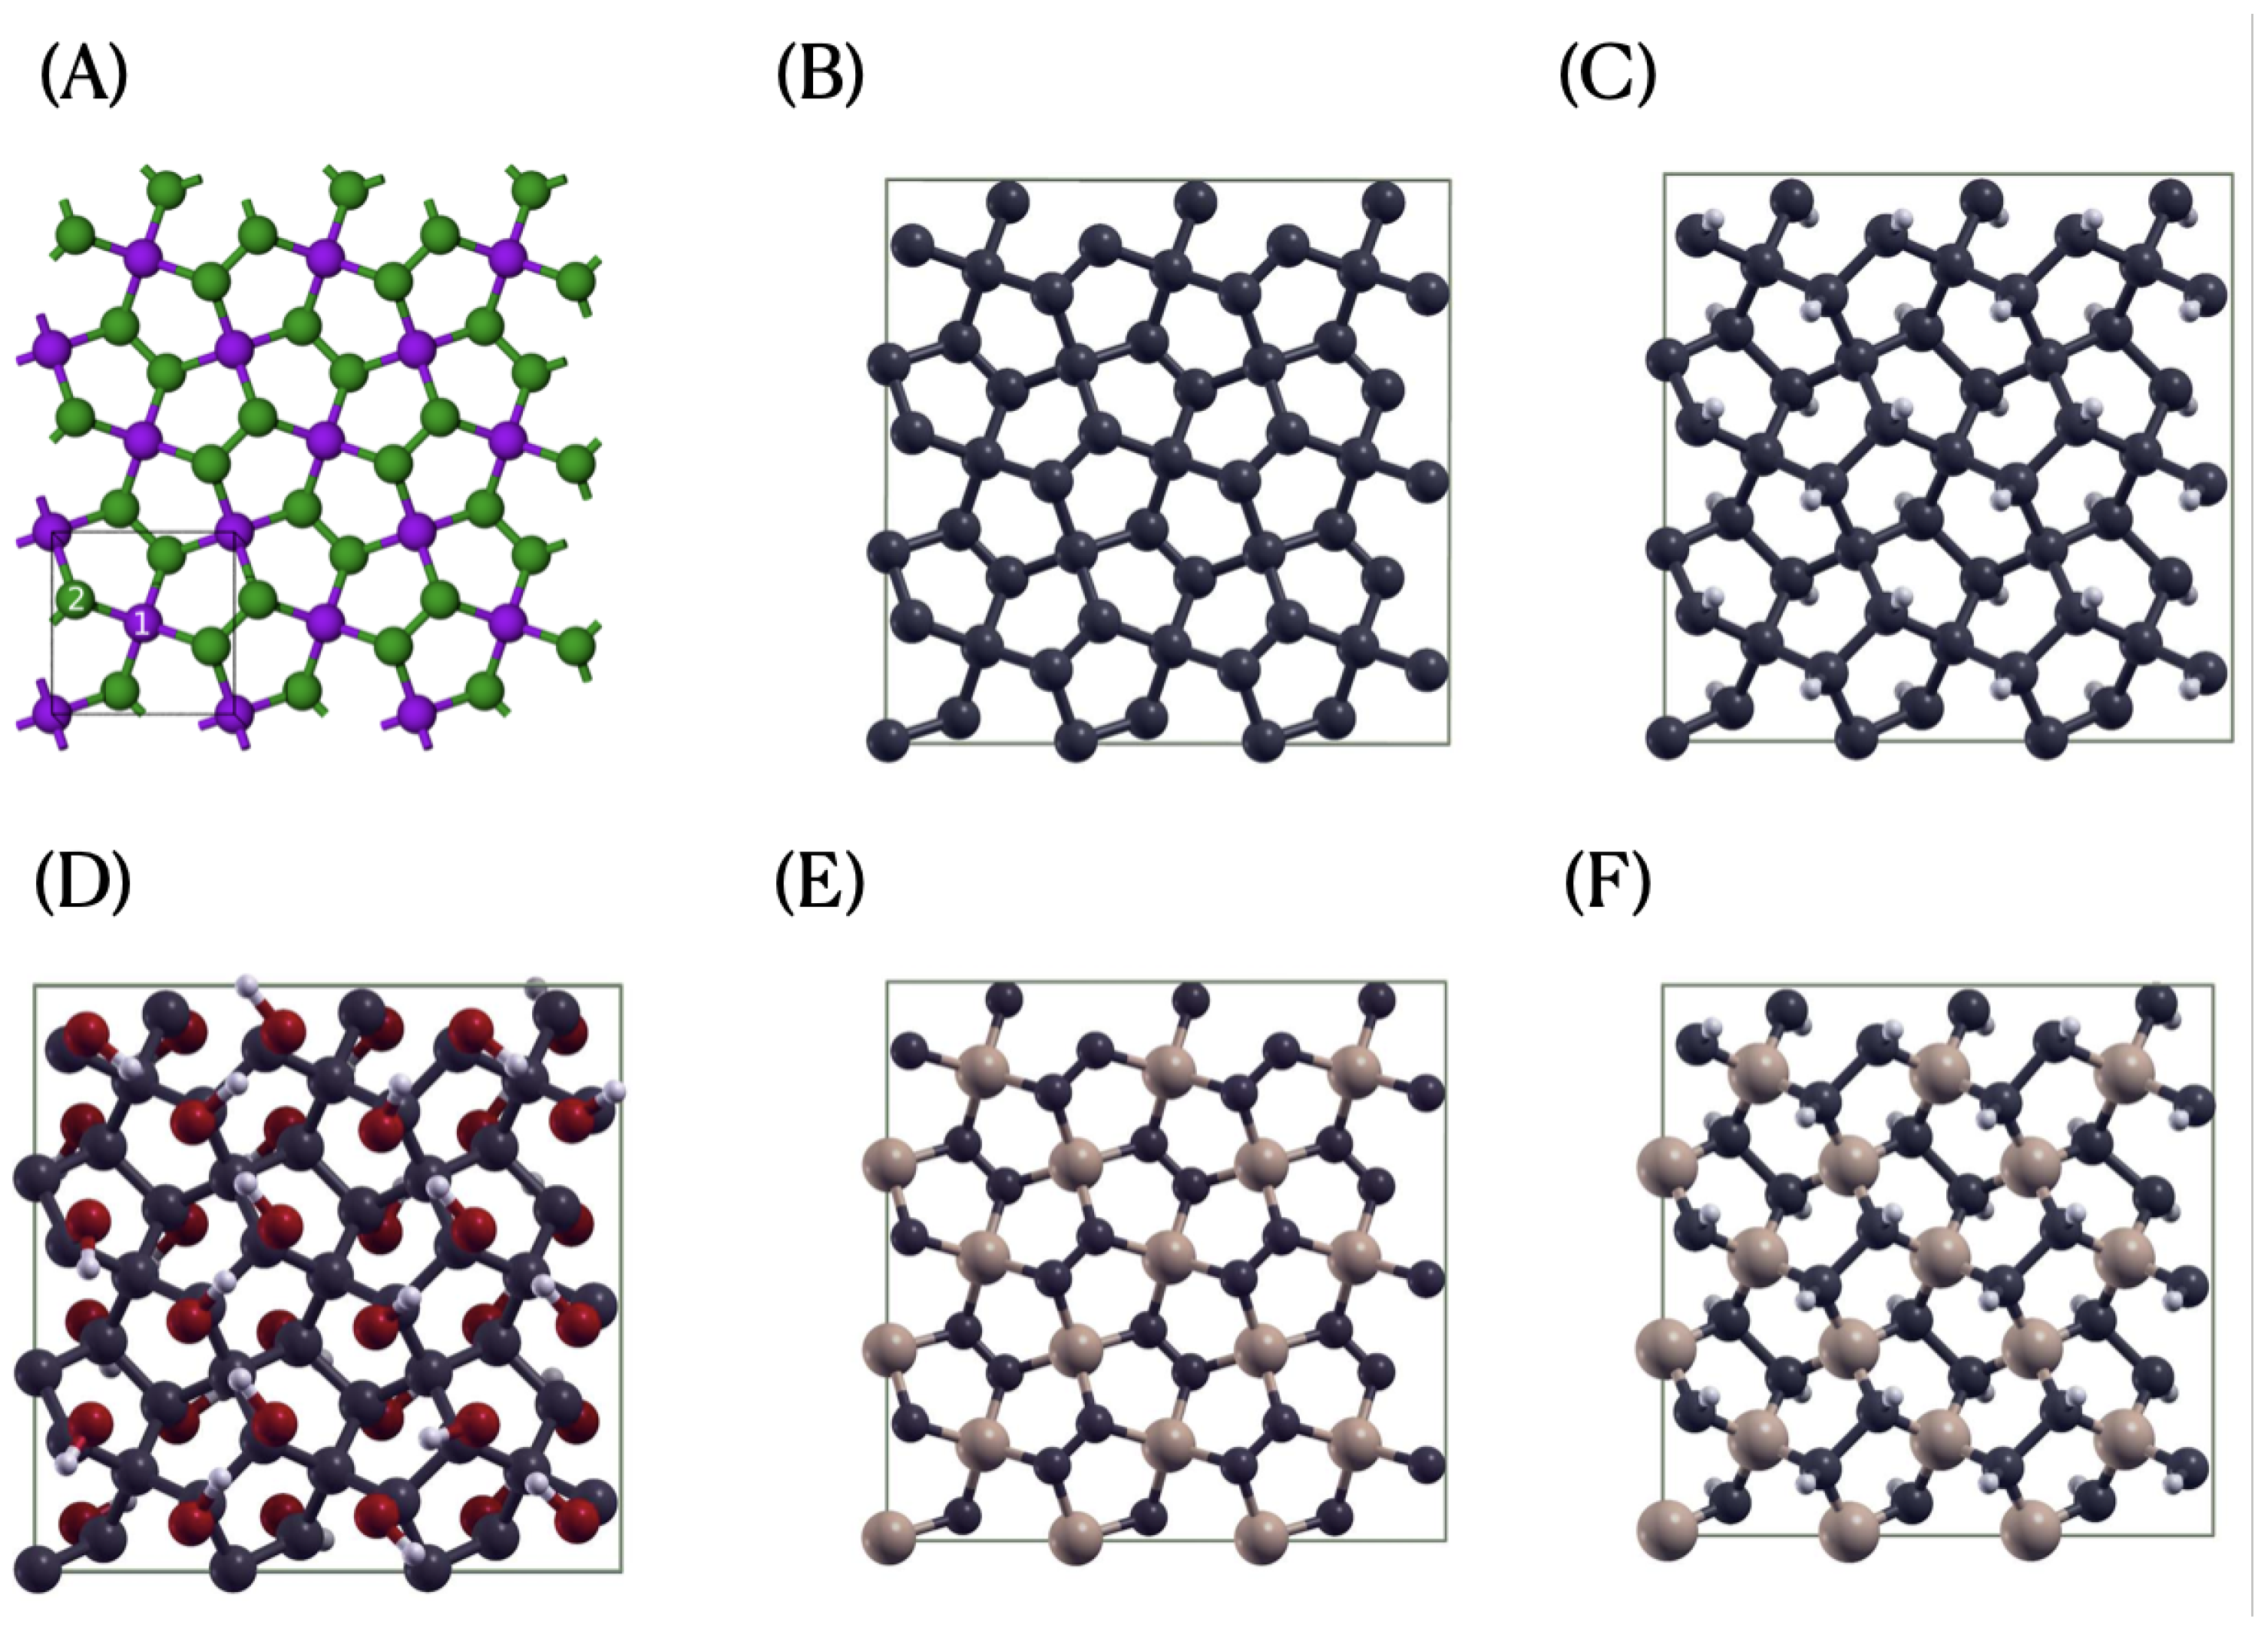
Figure 1. (A) A 3 × 3 supercell of the geometric structure based on the Cairo tiling in which the tri-coordinated sites are shown in green and the four-coordinated sites in purple. The unit cell is framed by black lines, and the two non-equivalent sites are numbered 1 and 2. In penta-graphene, all atoms are carbon atoms, while in penta-SiC2, the tri-coordinated sites are occupied by carbon atoms and the four-coordinated sites by silicon atoms. The other panels show the supercells of (B) penta-graphene, (C) hydrogenated penta-graphene, (D) hydroxylated penta-graphene, (E) penta-SiC2 and (F) hydrogenated penta-SiC2, each consisting of 3 × 3 unit cells. The carbon atoms are shown in gray, the silicon atoms in beige, the oxygen atoms in red, and the hydrogen atoms in white. The images of the analysed structures were created with the software XCrySDen [56] and Ovito [57].
Applsci 15 09812 g001
Figure 2. Electronic band structure along high-symmetry directions in the Brillouin zone of (A) penta-graphene, (B) hydrogenated penta-graphene, (C) hydroxylated penta-graphene, (D) penta-SiC2, and (E) hydrogenated penta-SiC2. The Fermi level (horizontal red dashed line) is set to zero, the calculations were performed with the PBE exchange–correlation functional.
Applsci 15 09812 g002
Figure 3. Theoretical C K-edge XANES spectra of a 3 × 3 unit cell of penta-graphene for inequivalent positions of the core-hole within the unit cell, for electric fields polarised along the x-, y-, and z directions (see the Cartesian reference frame in the figure inset). We note that the spectrum of the x-polarised X-rays (red line, not visible in the image) completely overlaps with that of the y-polarised light (green line).
Applsci 15 09812 g003
Figure 4. Top: theoretical C K-edge XANES spectra of a 3 × 3 unit cell of penta-graphene, averaged over all inequivalent positions of the core-hole within the unit cell, for x-, y- and z-polarised electric fields. We note that the spectrum for x-polarised X-rays (red line, not visible in the diagram) is the same as that for y-polarised light (green line). Bottom: DOS of penta-graphene projected onto the atomic orbitals p x , p y and p z for the two inequivalent sites.
Applsci 15 09812 g004
Figure 5. Theoretical C K-edge XANES spectra of a 3 × 3 supercell of hydrogenated penta-graphene for inequivalent positions of the core-hole within the unit cell, for x-, y-, and z-polarised electric fields (see the Cartesian frame of reference in the figure explaining the directions). We note that the spectrum of the x-polarised X-rays (red line, not visible in the image) completely overlaps with that of the y-polarised light (green line).
Applsci 15 09812 g005
Figure 6. Top: theoretical C K-edge XANES spectra of a 3 × 3 supercell of hydrogenated penta-graphene averaged over all inequivalent positions of the core-hole within the unit cell, for x-, y- and z-polarised electric fields. We note that the spectrum of the x-polarised X-rays (red line, not visible in the image) completely overlaps with that of the y-polarised light (green line). Bottom: DOS of hydrogenated penta-graphene projected onto the atomic orbitals p x , p y , and p z for the two inequivalent sites.
Applsci 15 09812 g006
Figure 7. Theoretical C K-edge XANES spectra of a 3 × 3 supercell of hydroxylated penta-graphene for inequivalent positions of the core-hole within the unit cell, for electric fields polarised along the x-, y- and z directions (see the Cartesian reference frame in the figure inset).
Applsci 15 09812 g007
Figure 8. Top: theoretical C K-edge XANES spectra of a 3 × 3 supercell of hydroxylated penta-graphene averaged over all inequivalent positions of the core-hole within the unit cell, for x-, y- and z-polarised electric fields. Bottom: DOS of hydroxylated penta-graphene projected onto the atomic orbitals p x , p y , and p z of the two carbons in the two inequivalent sites and oxygen.
Applsci 15 09812 g008
Figure 9. Theoretical O K-edge XANES spectra of a 3 × 3 supercell of hydroxylated penta-graphene for x-, y- and z-polarised electric fields.
Applsci 15 09812 g009
Figure 10. Theoretical Si K-edge XANES spectra of a 3 × 3 supercell of silicon-doped penta-graphene for inequivalent positions of the core-hole within the unit cell (upper panel site 1, lower panel site 2), for x-, y- and z-polarised electric fields. We note that the spectrum of the x-polarised X-rays (red line, not visible in the image) completely overlaps with that of the y-polarised light (green line).
Applsci 15 09812 g010
Figure 11. Theoretical Si K-edge XANES spectra of a 3 × 3 supercell of silicon-doped hydrogenated penta-graphene for different positions of the core-hole within the unit cell (upper panel site 1, lower panel site 2), for x-, y- and z-polarised electric fields. We note that the spectrum of the x-polarised X-rays (red line, not visible in the image) completely overlaps with that of the y-polarised light (green line).
Applsci 15 09812 g011
Figure 12. Theoretical Si K-edge XANES spectra of a 3 × 3 supercell of penta-SiC2 with the core-hole at site 1 for x-, y- and z-polarised electric fields. We note that the spectrum of the x-polarised X-rays (red line, not visible in the image) completely overlaps with that of the y-polarised light (green line).
Applsci 15 09812 g012
Figure 13. Top: Theoretical C K-edge XANES spectra of a 3 × 3 supercell of penta-SiC2 with the core-hole at site 2 for x-, y- and z-polarised electric fields (see the Cartesian reference frame in the figure inset). We note that the spectrum of the x-polarised X-rays (red line, not visible in the image) completely overlaps with that of the y-polarised light (green line). Bottom: DOS of penta-SiC2 projected onto the atomic orbitals p x , p y , and p z of carbon, which is located in the inequivalent site 2, and of silicon.
Applsci 15 09812 g013
Figure 14. Theoretical Si K-edge XANES spectra of a 3 × 3 supercell of hydrogenated penta-SiC2 with the core-hole at site 1 for x-, y- and z-polarised electric fields. We note that the spectrum of the x-polarised X-rays (red line, not visible in the image) completely overlaps with that of the y-polarised light (green line).
Applsci 15 09812 g014
Figure 15. Top: Theoretical C K-edge XANES spectra of a 3 × 3 supercell of hydrogenated penta-SiC2 with the core-hole at site 2 for x-, y- and z-polarised electric fields. Bottom: DOS of penta-SiC2 projected onto the atomic orbitals p x , p y , and p z of carbon, which is located in the inequivalent site 2, and of silicon.
Applsci 15 09812 g015
Figure 16. Comparison of the theoretical C K-edge XANES spectra of a 3 × 3 supercell of pristine and functionalised penta-grapene and penta-SiC2, averaged on the unit cell.
Applsci 15 09812 g016
Table 1. Summary of the examined cases for the X-ray absorption analysis.
MaterialPristineHydrogenatedHydroxylated
Penta-grapheneyesyesyes
Penta-graphene + Si sub.yesyes
Penta-SiC2yesyes
Table 2. Cell parameters and selected bond distances (in Å) for pristine and functionalised penta-graphene and penta-SiC2 structures.
Structure (Cell Parameter a in Å)Bond Distances (Å)
Penta-graphene ( a = 3 . 629 )
C (site 2)–C (site 2): 1.338
C (site 1)–C (site 2): 1.549
Hydrogenated penta-graphene ( a = 3 . 502 )
C (site 2)–H: 1.101
C (site 1)–C (site 2): 1.553
C (site 2)–C (site 2): 1.553
Hydroxylated penta-graphene ( a = 3 . 599 )
C (site 2)–O: 1.432
C (site 1)–C (site 2): 1.576
C (site 2)–C (site 2): 1.576
O–H: 1.030
Penta-SiC2 ( a = 4 . 384 )
C (site 2)–Si: 1.900
C (site 2)–C (site 2): 1.363
Hydrogenated penta-SiC2 ( a = 4 . 213 )
C (site 2)–Si: 1.906
C (site 2)–C (site 2): 1.580
C (site 2)–H: 1.102
Disclaimer/Publisher’s Note: The statements, opinions and data contained in all publications are solely those of the individual author(s) and contributor(s) and not of MDPI and/or the editor(s). MDPI and/or the editor(s) disclaim responsibility for any injury to people or property resulting from any ideas, methods, instructions or products referred to in the content.