Article

Mechanistic Insights into 5-Fluorouracil Adsorption on Clinoptilolite Surfaces: Optimizing DFT Parameters for Natural Zeolites, Part II

1
Crystallography & Geomaterials Research, Faculty of Geosciences, University of Bremen, Klagenfurter Straße 2-4, 28359 Bremen, Germany
2
Bremen Center for Computational Materials Science and MAPEX Center for Materials and Processes, University of Bremen, 28359 Bremen, Germany
*
Author to whom correspondence should be addressed.
Appl. Sci. 2025, 15(17), 9535; https://doi.org/10.3390/app15179535
Submission received: 29 July 2025 / Revised: 20 August 2025 / Accepted: 23 August 2025 / Published: 29 August 2025
(This article belongs to the Special Issue Development and Application of Computational Chemistry Methods)

Abstract

Even though clinoptilolite mineral is the most important natural zeolite for technical applications, the molecular-level insights and detailed knowledge of their true local structures and adsorption behavior are largely lacking. An experimental determination of their surface structures, in particular, could be very challenging due to the sensitivity of some facets to temperature and impurities. In this study, we present a robust multiscale modeling framework to investigate the adsorption of 5-fluorouracil, an anticancer drug, on dispersion-corrected density functional theory (DFT-D3)-optimized Na-clinoptilolite surfaces. Using a combination of interface force field and polymer consistent force field-based molecular dynamics with simulated annealing and parallel replica sampling, followed by DFT-D3 optimizations, we explore a wide configurational space of surface–molecule interactions. Our results show that Na-clinoptilolite surfaces support very strong adsorption, with adsorption energies ranging from −430.0 to −174.4 kJ/mol. Surface models with exposed Na cations consistently exhibit stronger binding, in contrast to their known steric hindrance effects in bulk environments. Furthermore, cation-free surfaces displayed relatively weaker interactions, yet configurations exposing the 8-membered rings (8 MR) demonstrated more favorable adsorption than those exposing 10 MR channels due to enhanced hydrogen bonding and spatial and entropic confinement effects. These findings reveal the importance of surface composition, local geometry, and configurational sampling in determining adsorption performance and lay the groundwork for future studies on cation-specific and multicationic clinoptilolite systems.

1. Introduction and State of the Literature

5-fluorouracil (5-FU) [1] is widely recognized as one of the most effective anticancer agents used in chemotherapy, being extensively employed in the treatment of various malignancies such as colorectal, breast, and gastric cancers [2,3]. Its antitumor efficacy is primarily due to the mechanism of inhibiting thymidylate synthase (TS), which is an enzyme crucial for synthesizing thymidine, a nucleotide required for DNA synthesis. By blocking this enzyme, 5-FU interferes with DNA formation, stopping cancer cells from replicating. Another crucial mechanism of 5-FU is that 5-FU incorporates itself and its metabolites into the genetic material of cancer cells. 5-FU and its fluorinated molecules disrupt normal RNA and DNA structure and function, leading to errors during cell division and ultimately causing the death of rapidly dividing tumor cells. In other words, 5-FU disrupts essential pathways cancer cells need to grow, replicate, and survive, thus making it an effective anticancer drug [3].
However, despite its clinical significance, therapeutic outcomes with 5-FU are frequently compromised due to the development of resistance in cancer cells. The latter arises from various factors, including enzymatic degradation by dihydropyrimidine dehydrogenase (DPD) [4], which reduces drug concentration in cells, and alterations in drug transporters that limit uptake [5]. Additionally, disruptions in apoptotic pathways allow cancer cells to evade drug-induced cell death, further diminishing 5-FU’s therapeutic impact [6]. Normally, apoptosis is a highly regulated biological process that ensures damaged or abnormal cells—such as cancerous cells—are systematically eliminated to maintain tissue health. Anticancer drugs, including 5-FU, typically kill tumor cells by inducing apoptosis [7]. However, some cancer cells adapt or mutate, disrupting these apoptosis pathways [3,4,5,6,7].
In this context, innovative strategies to enhance drug delivery and reduce resistance are essential. Zeolites attracted attention as promising drug delivery vehicles due to their unique porous structure and biocompatibility, potentially increasing the adsorption, controlled release, and efficacy of anticancer agents such as 5-FU [2,8,9,10].
Several contemporary experimental studies and modeling efforts suggest that zeolites could serve as promising carriers for 5-fluorouracil due to their favorable adsorption properties. Vilaça et al. [11] conducted an experimental analysis about the incorporation and release of 5-fluorouracil into NaY-type zeolites. Their results show that over 80–90% of the drug was released within the first 10 min, demonstrating a rapid and efficient release profile. The release behavior was influenced by the pH of the surrounding medium, with faster release occurring at lower pH—mimicking the tumor microenvironment. Another experimental study demonstrated that HY zeolites [12] with Si/Al ratios between 5 and 60 showed consistent loading (~0.1 g 5-FU/g zeolite), but varied release behavior: Al-rich samples retained 5-FU tightly, while more siliceous ones released over 50% of the drug quickly. Abd-Elsatar and colleagues [13] studied three types of micronized synthetic zeolites—ZSM-5, Zeolite A (ZA), and Faujasite NaX (ZX)—as oral delivery vehicles for 5-FU targeting colon cancer therapy. The authors evaluated ionic release (Na, Al, Si) and drug release behaviors in simulated gastric fluids at pH 1.6 and pH 5. Drug and ion release occurred in two sequential stages and were more pronounced in the highly acidic medium. Importantly, all prepared zeolites proved non-cytotoxic against CaCo-2 cells, highlighting their strong potential as drug delivery platforms. Another research on Na-functionalized clinoptilolite reported impressive loading capacities of up to 462 mg/g and highlighted controlled release profiles governed by exchangeable cations and porosity tuning [2]. This study confirmed the affinity of natural clinoptilolite for 5-FU in aqueous systems, demonstrating favorable adsorption under physiological conditions. Moreover, zeolite nanoparticles and composites have been engineered for time-controlled release in anti-cancer therapy. These systems extend drug residence time, reduce burst release, and mitigate resistance through sustained 5-FU delivery.
Fischer [10] used dispersion-corrected density functional theory (DFT-D3) and ab-initio MD to analyze 5-FU adsorption in Faujasite-type zeolites (FAU/Y–X) with varying Si/Al ratios. It turned out that protonic zeolites—especially those with two proximal framework protons—form stable multi-site hydrogen bonds with 5-FU, yielding adsorption energies from −73 kJ/mol in all-silica forms up to −180 kJ/mol in protonic variants. Another work by Klimes et al. [14] demonstrates that the random phase approximation with singles corrections (RPA(S)) provides more accurate and computationally efficient adsorption energies for small molecules in zeolite chabazite than the second-order Møller–Plesset perturbation theory (MP2), underscoring the importance of using high-fidelity quantum methods. Spanakis et al. [9] demonstrated that microporous FAU-type zeolite nanoparticles (NaX-FAU) and BEA frameworks can be loaded with 5-FU, with FAU showing rapid, full drug release in acidic conditions, driven by molecular dynamics-supported diffusion differences. Their findings underscore the critical role of zeolite topology and van der Waals interactions in determining loading efficiency and release kinetics. Simonetti et al. [15] showed that 5-FU adsorbs exothermically onto hydroxylated silica (β-cristobalite (111)) by forming multiple hydrogen bonds with surface silanol groups, with four energetically favorable configurations confirmed via DFT. They also demonstrated that hydrogen bonding and dispersion interactions cause measurable shifts in bond vibrational frequencies and partial charges, confirming surface-mediated adsorption mechanisms.
These studies consistently support the concept that zeolites, particularly protonic and Na-exchanged natural variants, are exceptional platforms for 5-FU adsorption and release. Key benefits include strong binding via hydrogen bonding or cation interactions, high loading capacities (up to ~0.5 g/g: which means 500 mg of drug adsorbed per 1 g of zeolite), and tunable release kinetics influenced by framework chemistry (Si/Al ratio, cation type). Computational and experimental results align well, reinforcing the rationale for using optimized carrier materials such as zeolites to enhance 5-FU delivery and circumvent resistance. Additionally, the above-mentioned works in the field support and emphasize the need for advanced, dispersion-aware computational techniques to reliably model 5-FU interactions with zeolites.
Despite the growing body of literature exploring 5-FU interactions with zeolitic materials, the vast majority of studies focus on adsorption within internal pore systems—often in synthetic frameworks such as FAU, HY, or BEA. In contrast, the external surfaces of natural zeolites, particularly clinoptilolite, remain largely unexamined, essentially in the context of pharmaceutical adsorption. To the best of our knowledge, no prior work systematically investigated the adsorption behavior of 5-FU at the surface of clinoptilolite. Exploring the interaction of 5-FU with optimized clinoptilolite surfaces via computational methods provides valuable insights into enhancing its therapeutic performance and overcoming resistance barriers. Moreover, experimental determination of surface properties is rare and difficult, and in specific cases can be inconsistent too, due the sensitivity of specific facets to temperature and impurities [16,17]. Given that, a detailed computational understanding of molecule–surface interactions is essential. This study addresses this significant gap by presenting a comprehensive, first-principles investigation of 5-FU adsorption on DFT-optimized surface models of clinoptilolite. The following sections outline the computational methodology and surface construction protocols employed in this work, followed by the results and discussion on adsorption energies and the influence of surface composition, exposed channels, and cation distributions on binding performance.

2. Model Development and Computational Workflow

Natural clinoptilolite [18] is a monoclinic zeolite mineral belonging to space group C2/m; it is composed of an aluminosilicate framework and charge-balancing cations as extra-framework content and has three intersecting channels: two parallel to the c-axis (10-membered and 8-membered rings) and one along the a-axis (8-membered rings). As depicted in Figure 1, these channels define the porous architecture essential for molecular transport and adsorption applications. In our previous work [18], we developed bulk clinoptilolite models by systematically distributing Al atoms across tetrahedral sites and sampling various extra-framework cation configurations—employing dispersion-corrected DFT validated against experimental lattice parameters. The most stable models, consistent with structural and energetic criteria, were then used as the basis for constructing surface slabs in the present study. Those surface slabs are created by cleaving the bulk models along crystallographically relevant planes and fully optimizing to preserve stoichiometry, structural integrity, and interfacial properties.

2.1. Construction of the Surface Models

A detailed understanding of surface properties is essential for many applications, ranging from catalysis (which is in many cases a process that is fundamentally surface-driven) to drug delivery and adsorbate interactions with facet-specific precision, yet experimental characterization of surface energetics and electronic structure remains challenging and requires highly advanced experimental characterization methods. Therefore, first-principles methods have become essential tools, enabling detailed insights into facet-dependent surface energies, their variation with chemical potential, nanocrystal shapes, surface electronic states, charge transfer processes, work functions, atomic reconstructions, interlayer relaxations, and interactions with adsorbates, among others [16,17].
The most widely adopted approach for modeling surfaces in this context is the surface slab model—a periodic supercell representing an infinite two-dimensional crystal slab oriented to expose the facet of interest, with sufficient vacuum spacing to prevent interactions between periodic images. To ensure convergence and physical accuracy, the slab must be thick enough to eliminate artificial coupling between its two faces, while the vacuum region must be large enough to avoid spurious interactions in the direction perpendicular to the surface [16,17].
To construct surface models, we recommend using either the outstanding Python Materials Genomics (pymatgen) [19] library (we used version 2024.8.9) or VESTA (version 3.5.7, 64-bit) [20]. Pymatgen is a robust, open-source, stand-alone Python library that offers extensive functionality for structure generation, symmetry analysis, file conversion, and high-throughput workflow automation across diverse materials applications [19]. Notably, it is designed specifically to facilitate the creation of surface models that are suitable for electronic structure calculations. VESTA is a versatile visualization program widely used in crystallography and materials science for constructing, analyzing, and rendering three-dimensional crystal structures, electron densities, and surface models [21].
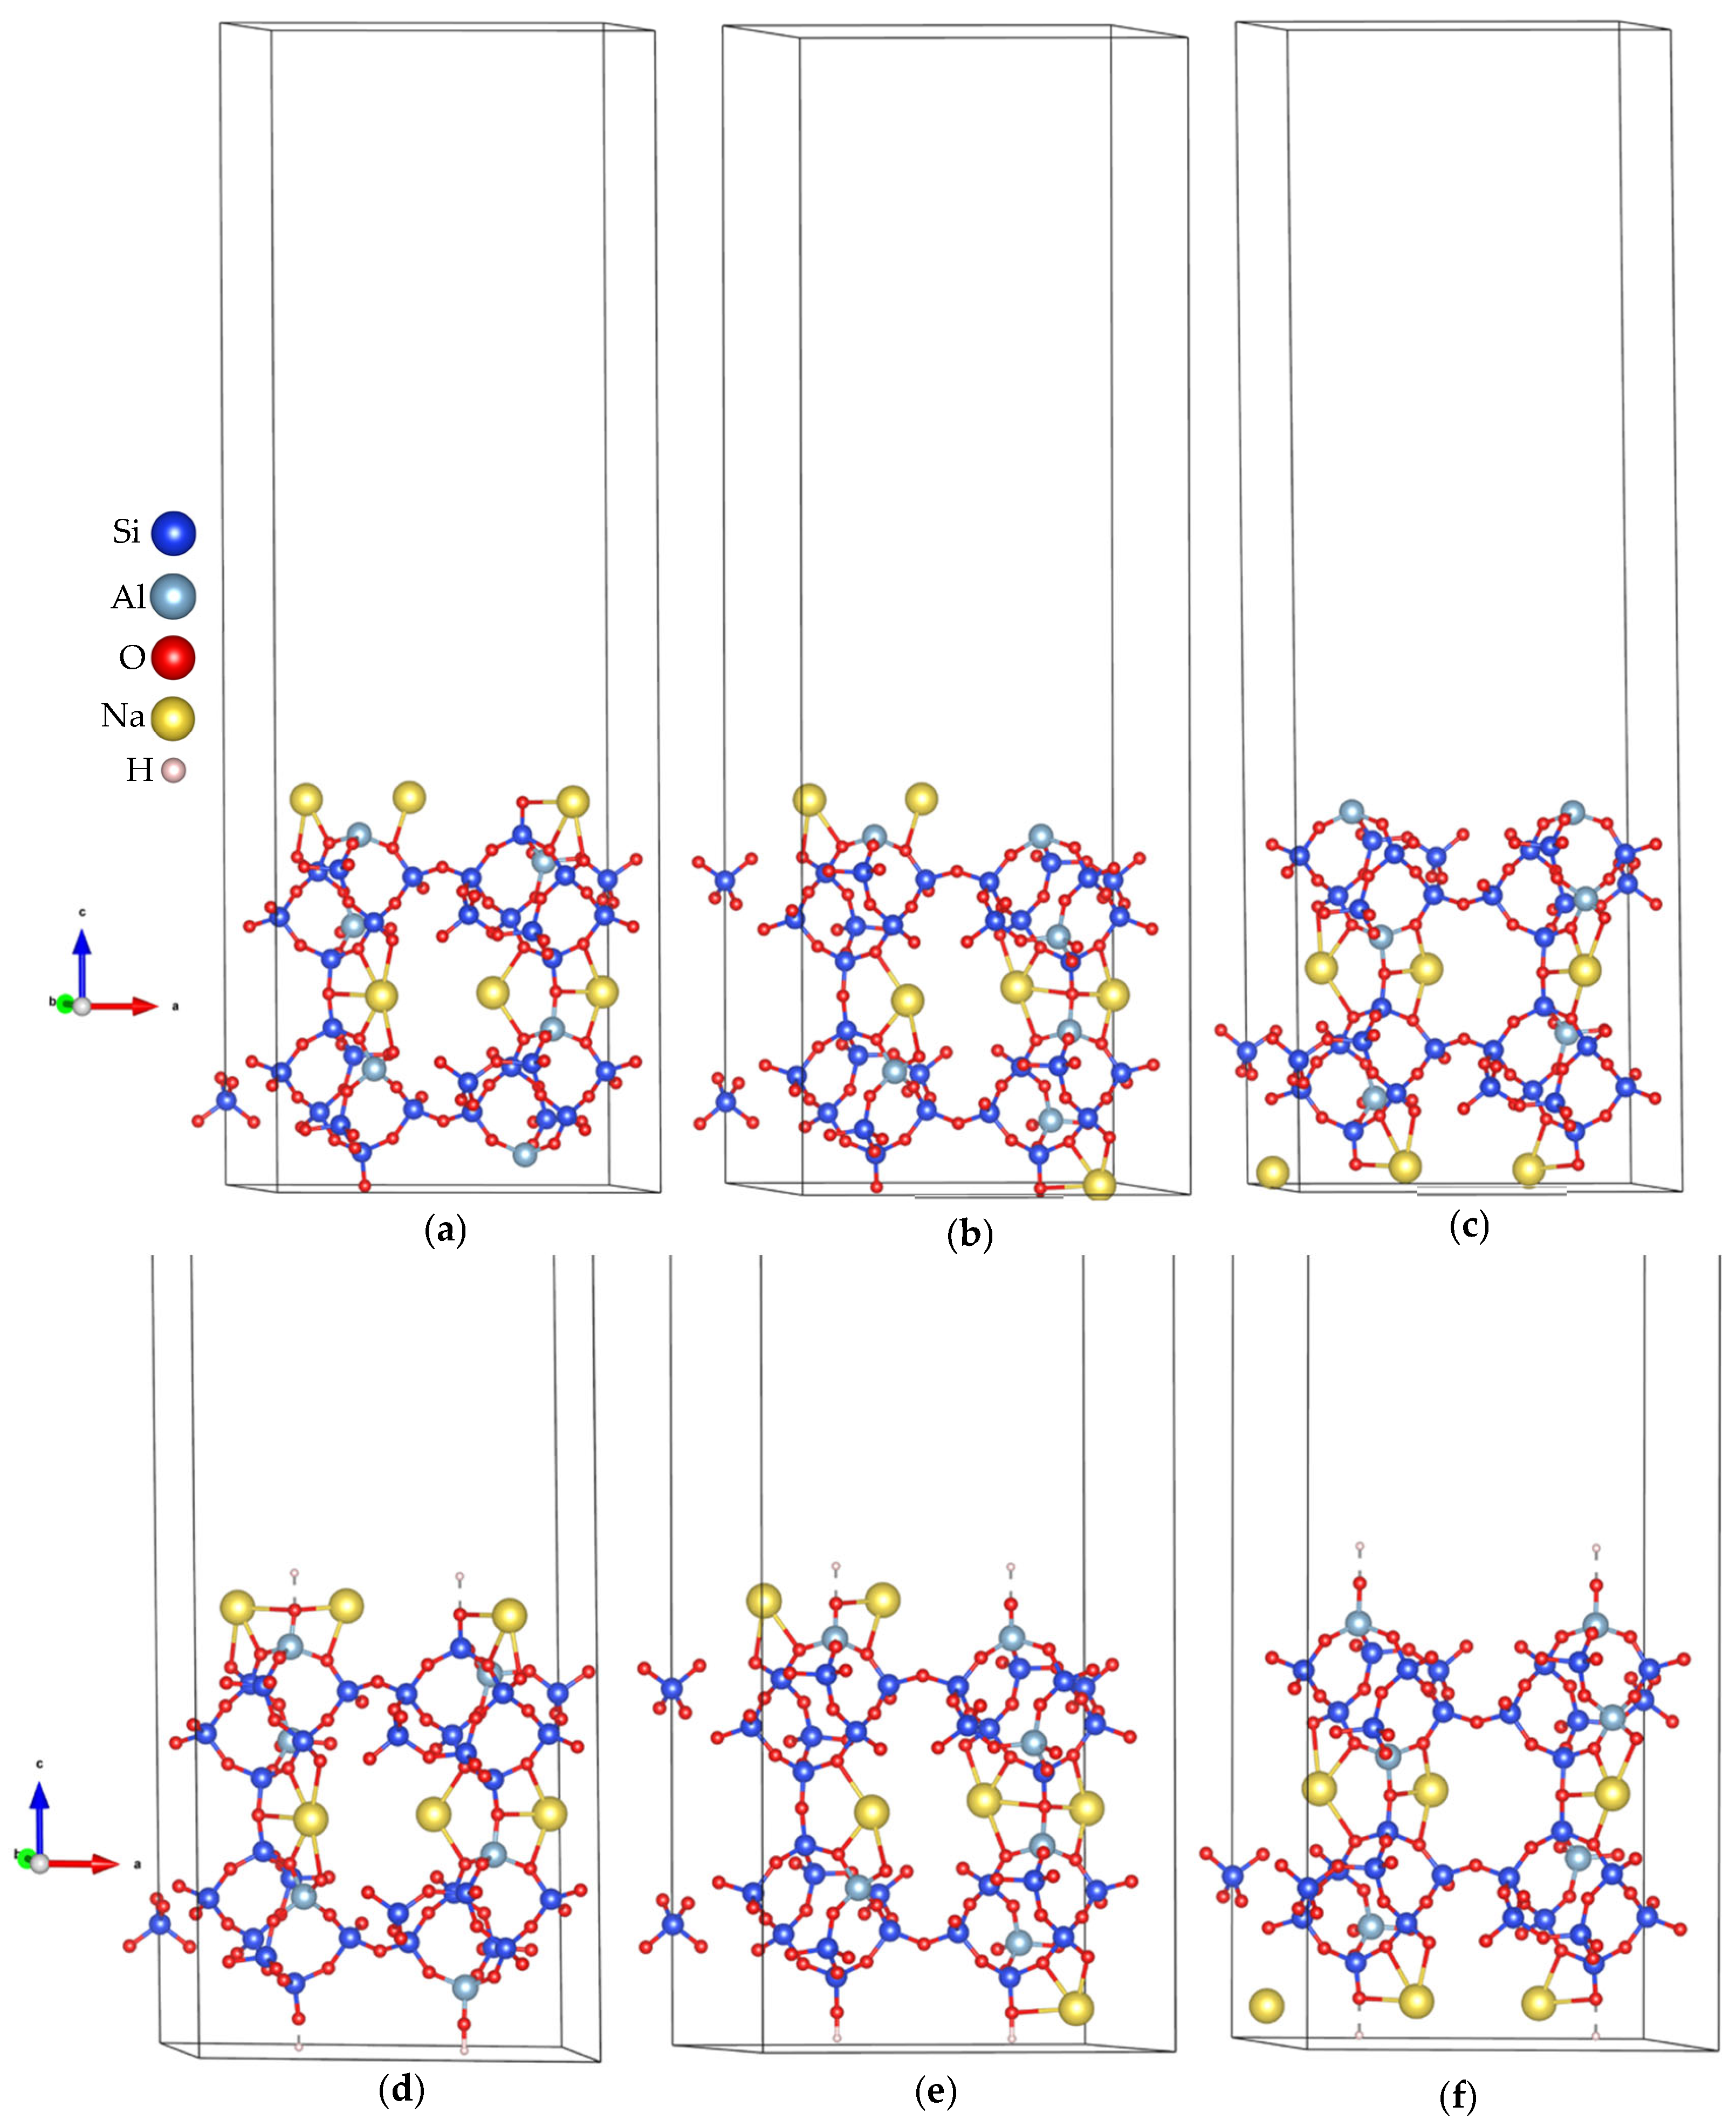
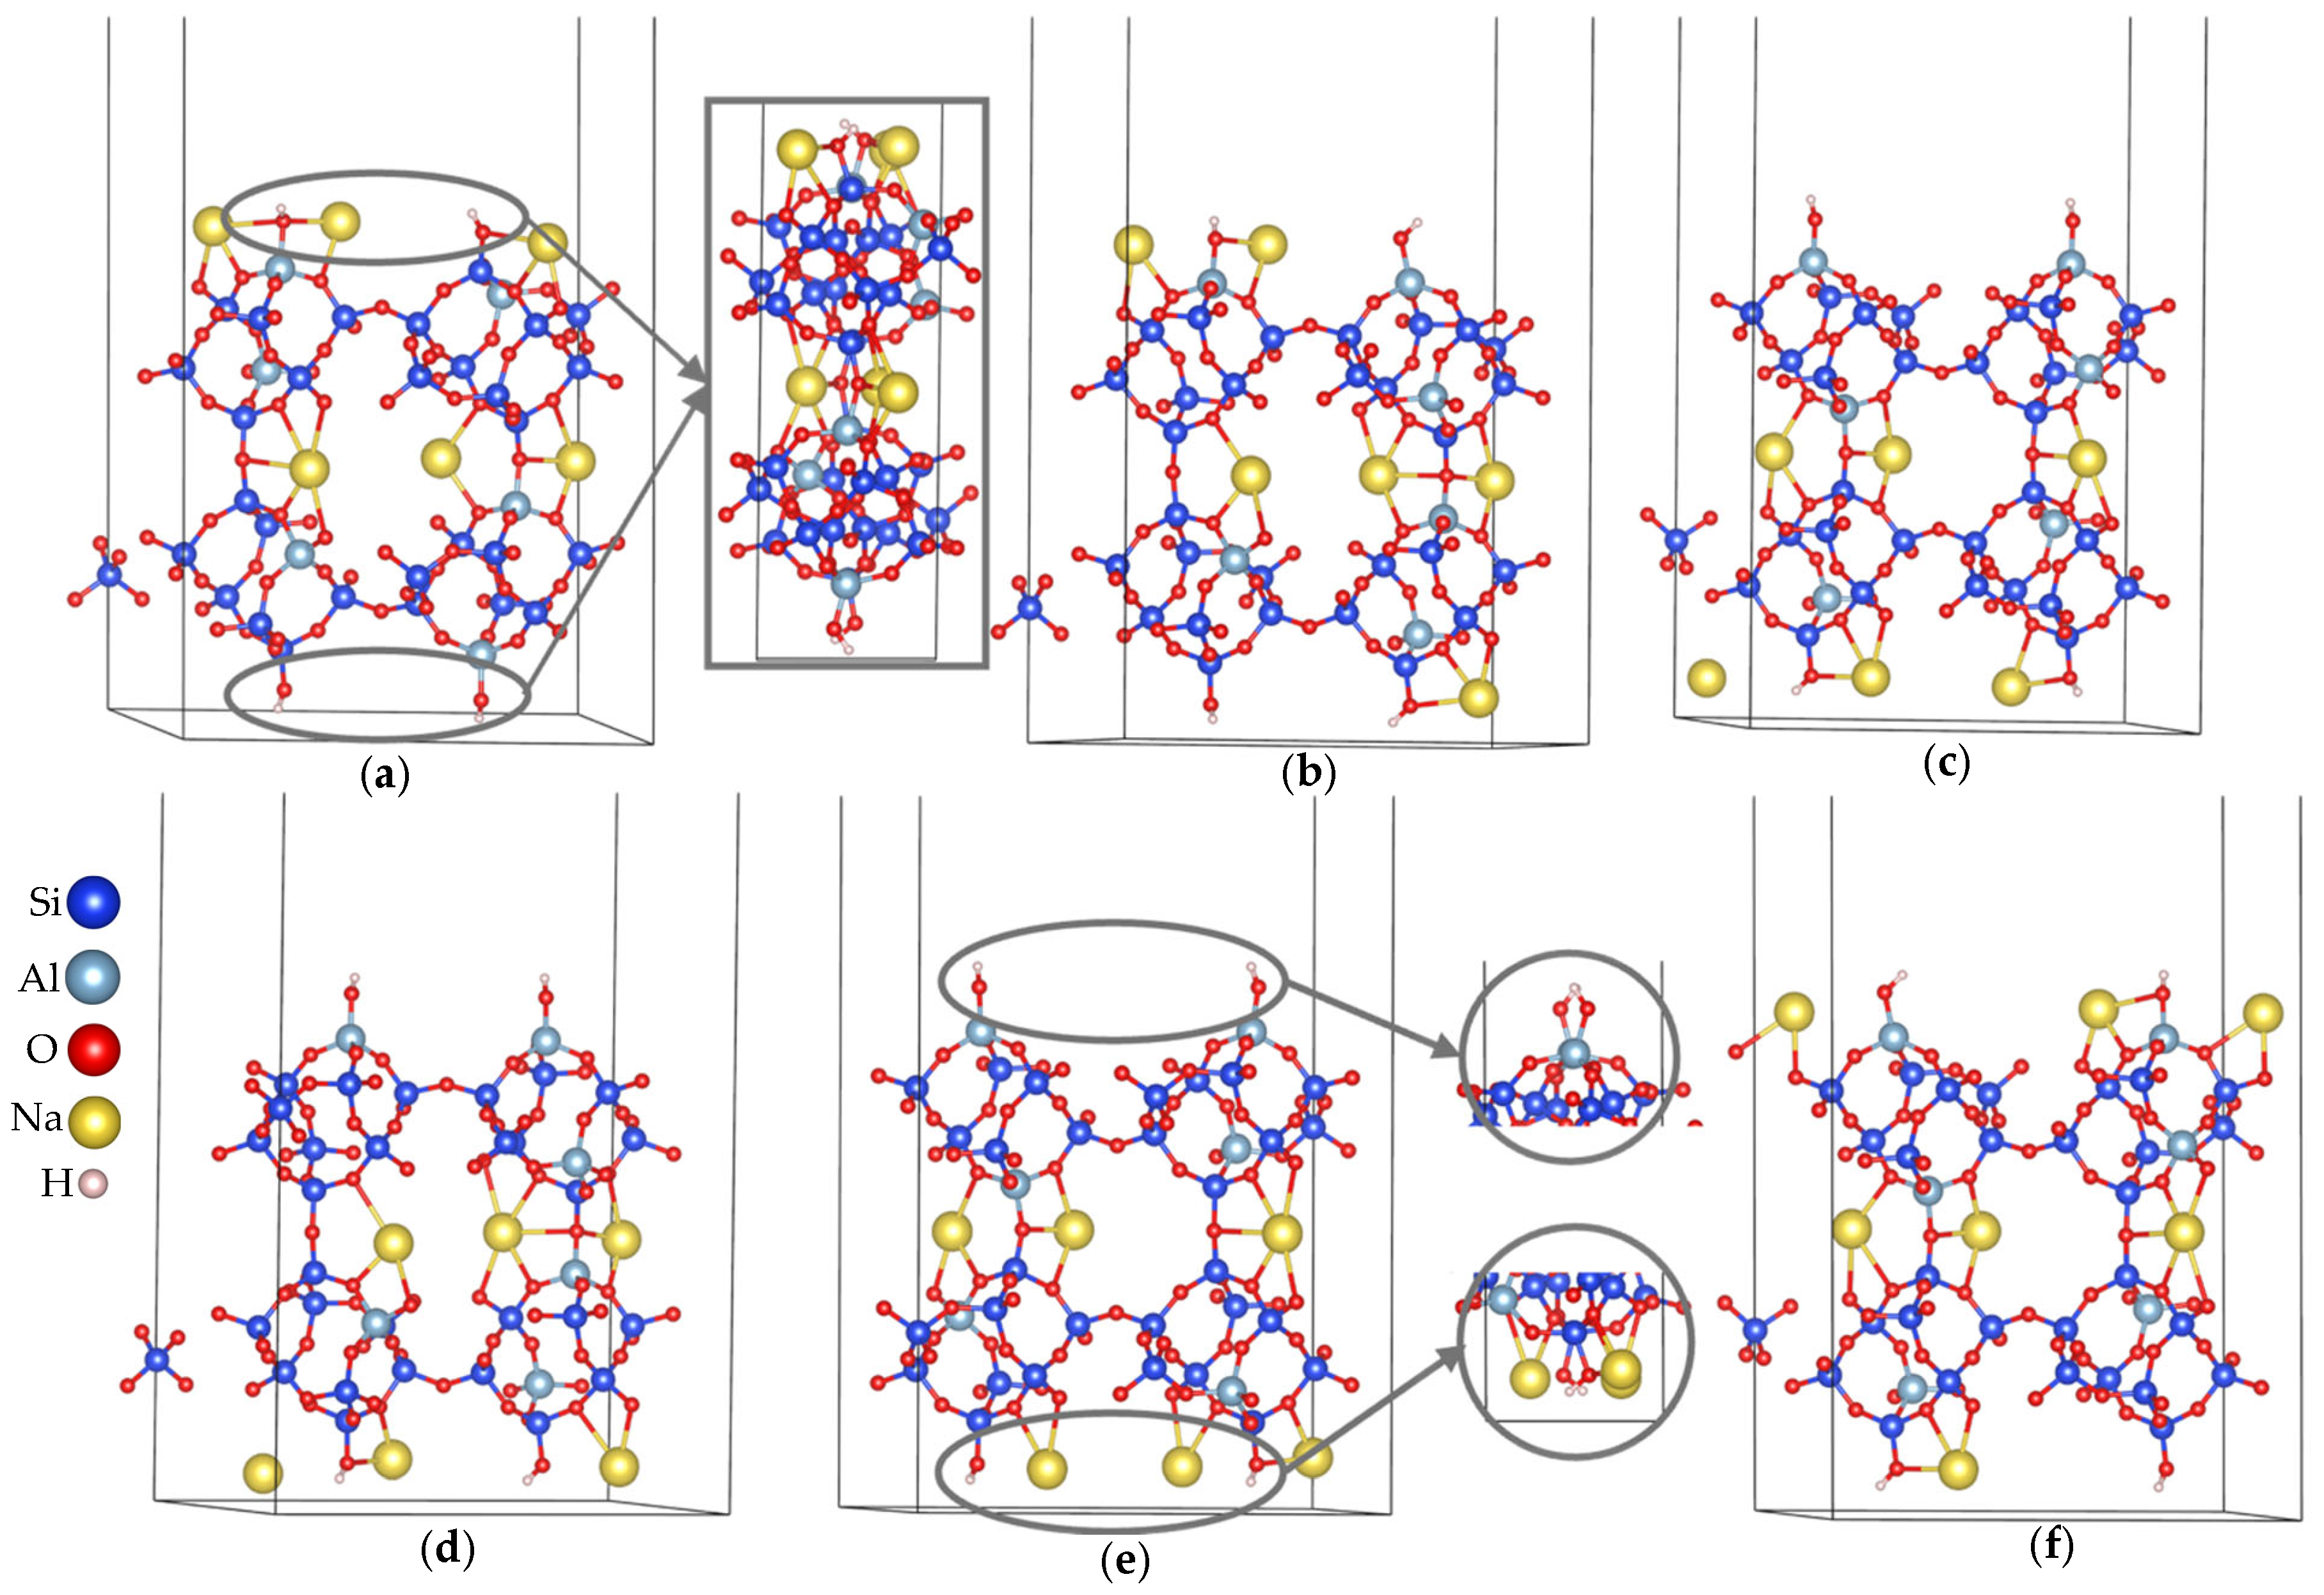
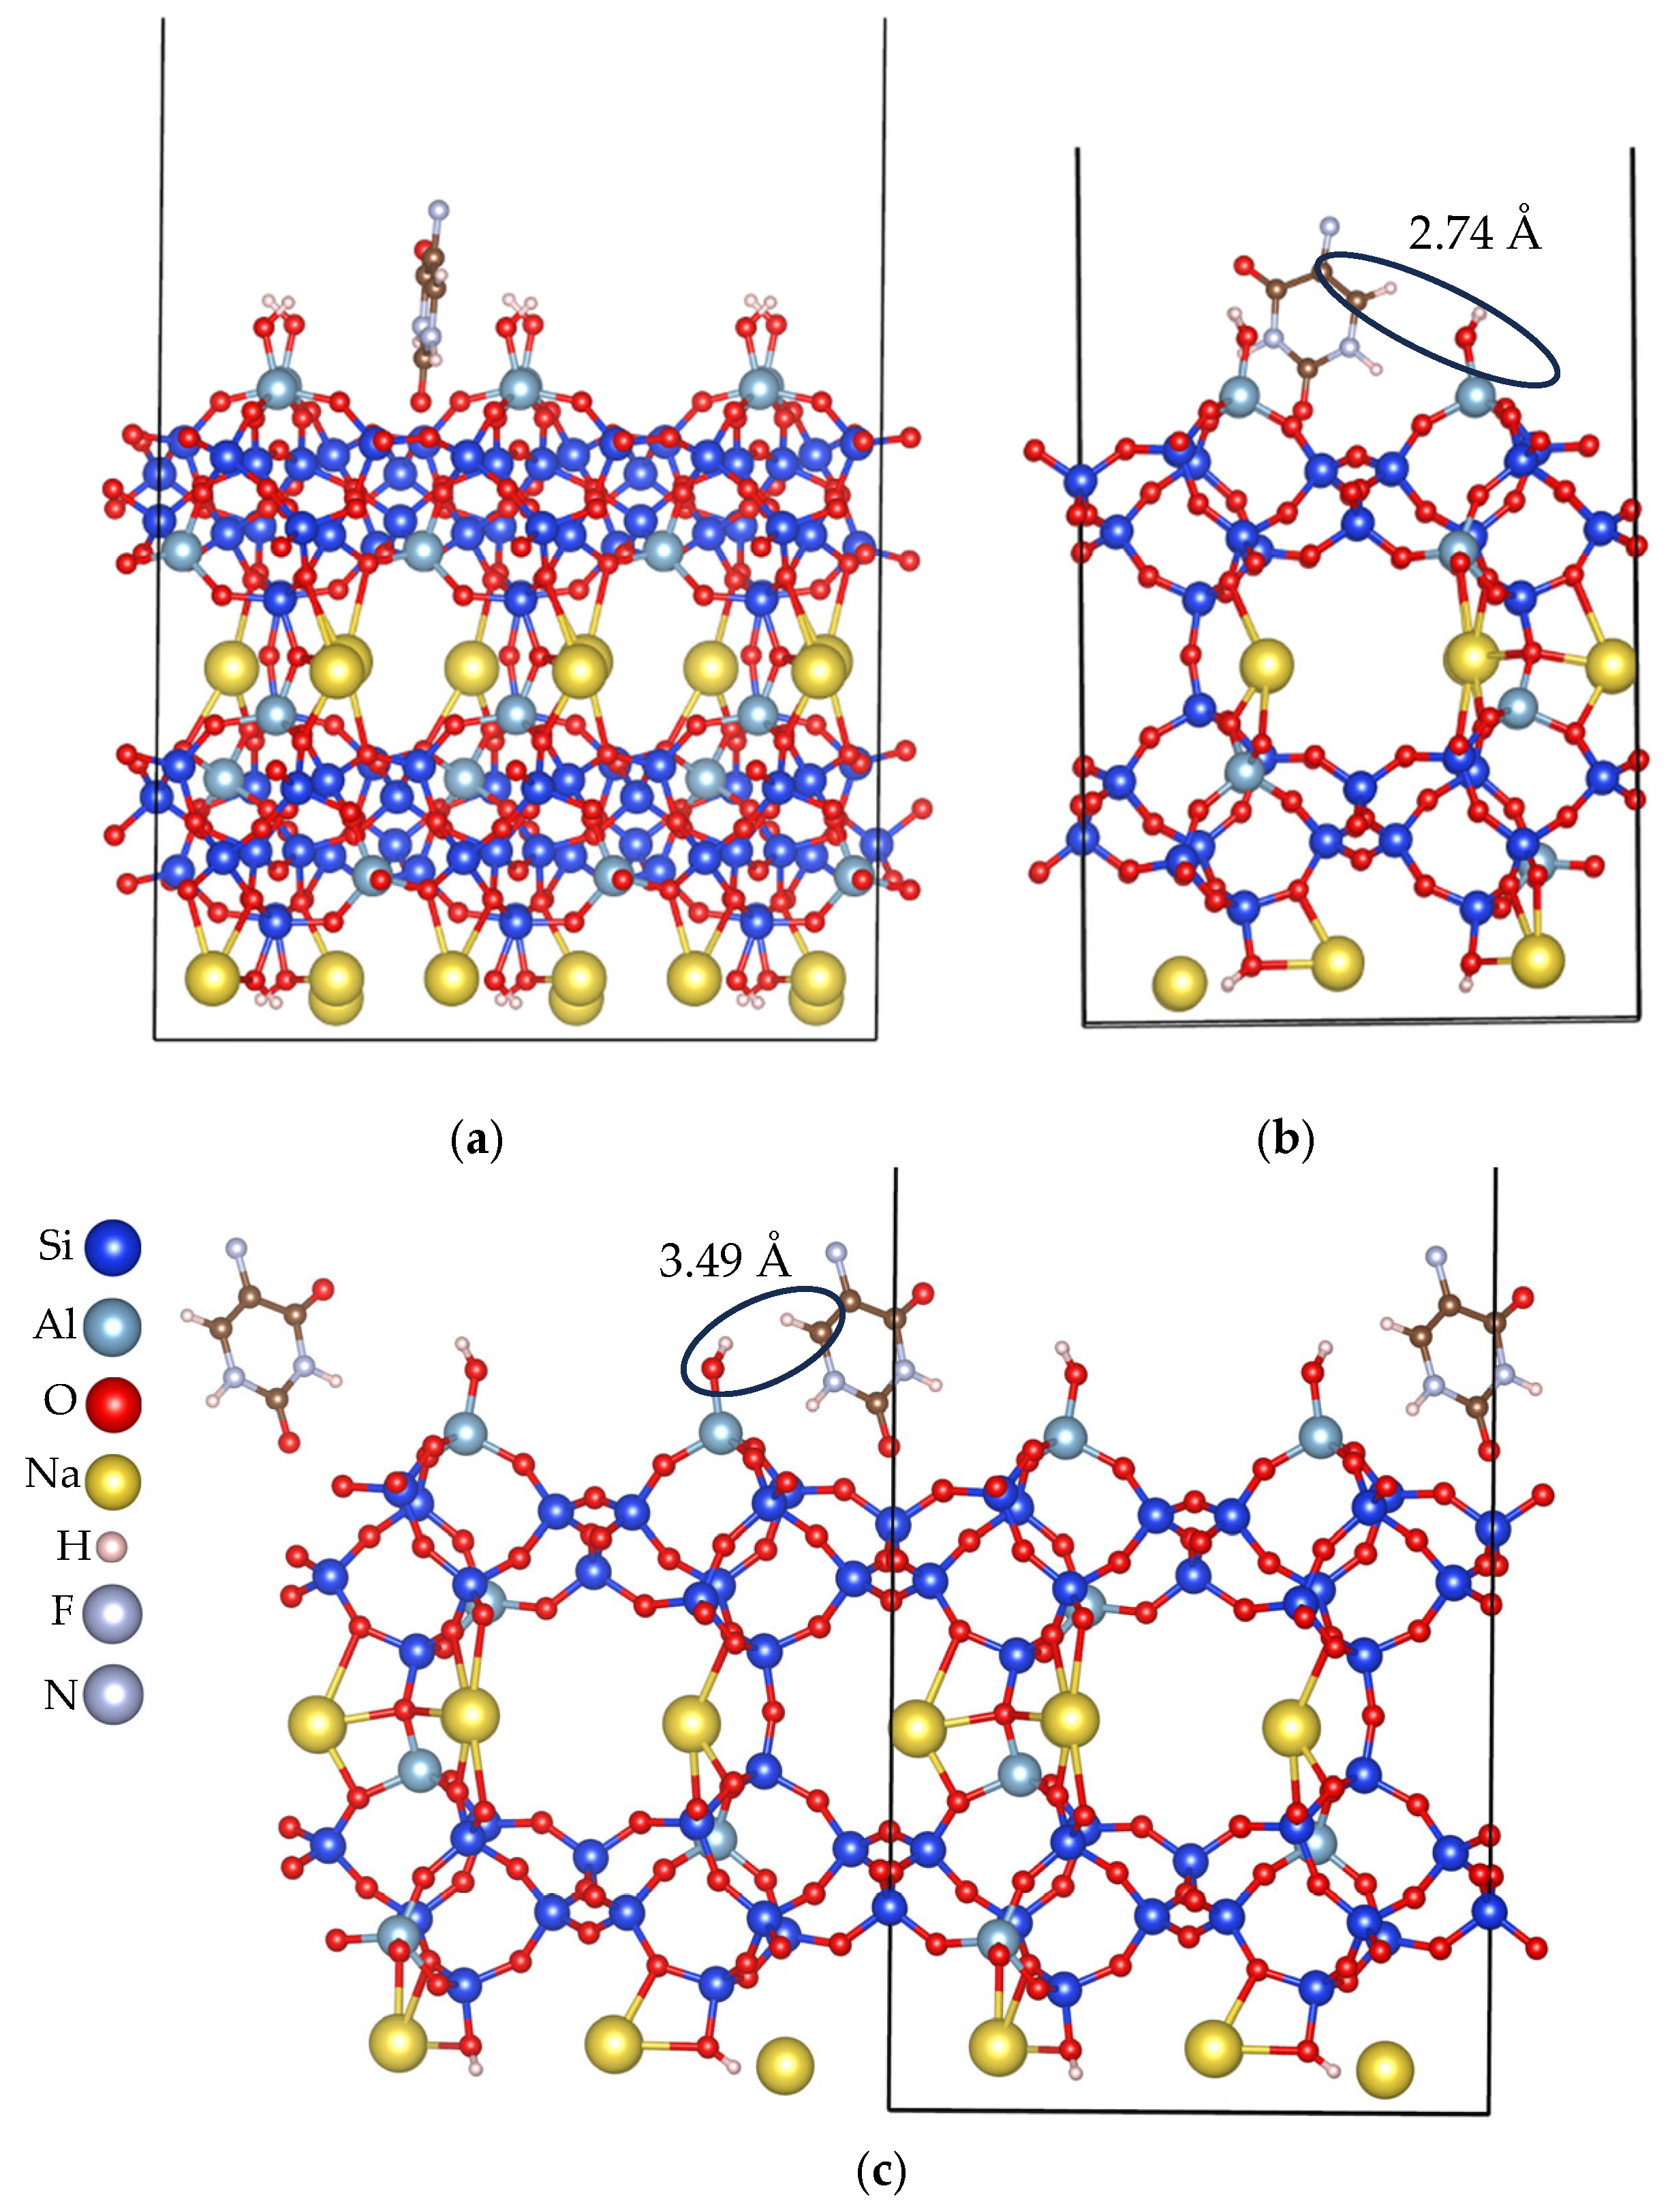
To construct surface models suitable for first-principles simulations, the most stable configurations of the fully optimized bulk clinoptilolite structures were cleaved along the (010) crystallographic plane, corresponding to the direction perpendicular to the b-axis. The (010) Miller index was selected as it is a perfect cleavage plane, a typical more prominent plane in natural clinoptilolite zeolites, and maintains the connectivity of the channel system [16,17,22,23]. In the current study, we focus only on Na-clinoptilolite and cleave the bulk model through cutting the Al-O bonds, and several examples are shown in Figure 2; we do not recommend cutting any Na-O bonds or the strong covalent Si-O bonds. Essentially, the Na-O bonds are crucial for the stability of the structure since those extra-framework cations neutralize the negative charge of the system that arises from the substitution of the framework Si with Al. The distribution of Na cations and its influence on the adsorption energy will be thoroughly examined in the Results and Discussion section. Cleaving was performed by defining a supercell containing several unit cell repetitions along the a and b directions and introducing a vacuum layer perpendicular to the c-axis to break the periodicity along the surface normal. This vacuum region, typically set to 20 Å, ensures that no spurious interactions occur between the slab and its periodic images. The resulting slab model preserves the internal channel structure while providing a realistic termination suitable for adsorption studies. It should be noted that the final c-axis length of the simulation cell exceeded the simple sum of the bulk thickness and vacuum layer (e.g., total of c ≈ 54 Å instead of ≈38 Å). This arises because pymatgen automatically ensures complete atomic coordination at the slab surfaces by including additional atomic layers beyond a single unit cell. As a result, the generated slab is often thicker than the original bulk unit along the cleaving direction. This leads to a physically meaningful slab with realistic surface terminations and a vacuum spacing sufficient for accurate surface calculations.
After cleaving the bulk, we are left with a highly reactive surface, due to the broken bonds, that needs to be terminated with OH groups to saturate dangling bonds [22,24,25,26,27], preserve the charge neutrality of the whole structure, and mimic interaction with water as in a realistic environment. The addition of hydroxyl (–OH) groups to terminate the surface is illustrated in Figure 2d–f, corresponding to the same structural models shown in Figure 2a–c. Hydroxyl termination prevents further artificial surface polarization, the propagation of unphysical electrostatic potential to the bulk and side walls of the system, and also structural distortions that would otherwise arise in vacuum-based simulations of polar surfaces. Importantly, in general, surface polarity may still influence the total energy of the system and thereby affect conclusions regarding the relative adsorption strength of different surface terminations. This aspect is addressed and carefully handled in our DFT calculations, as detailed later in the computational details section.
  • General guidelines for surface models construction:
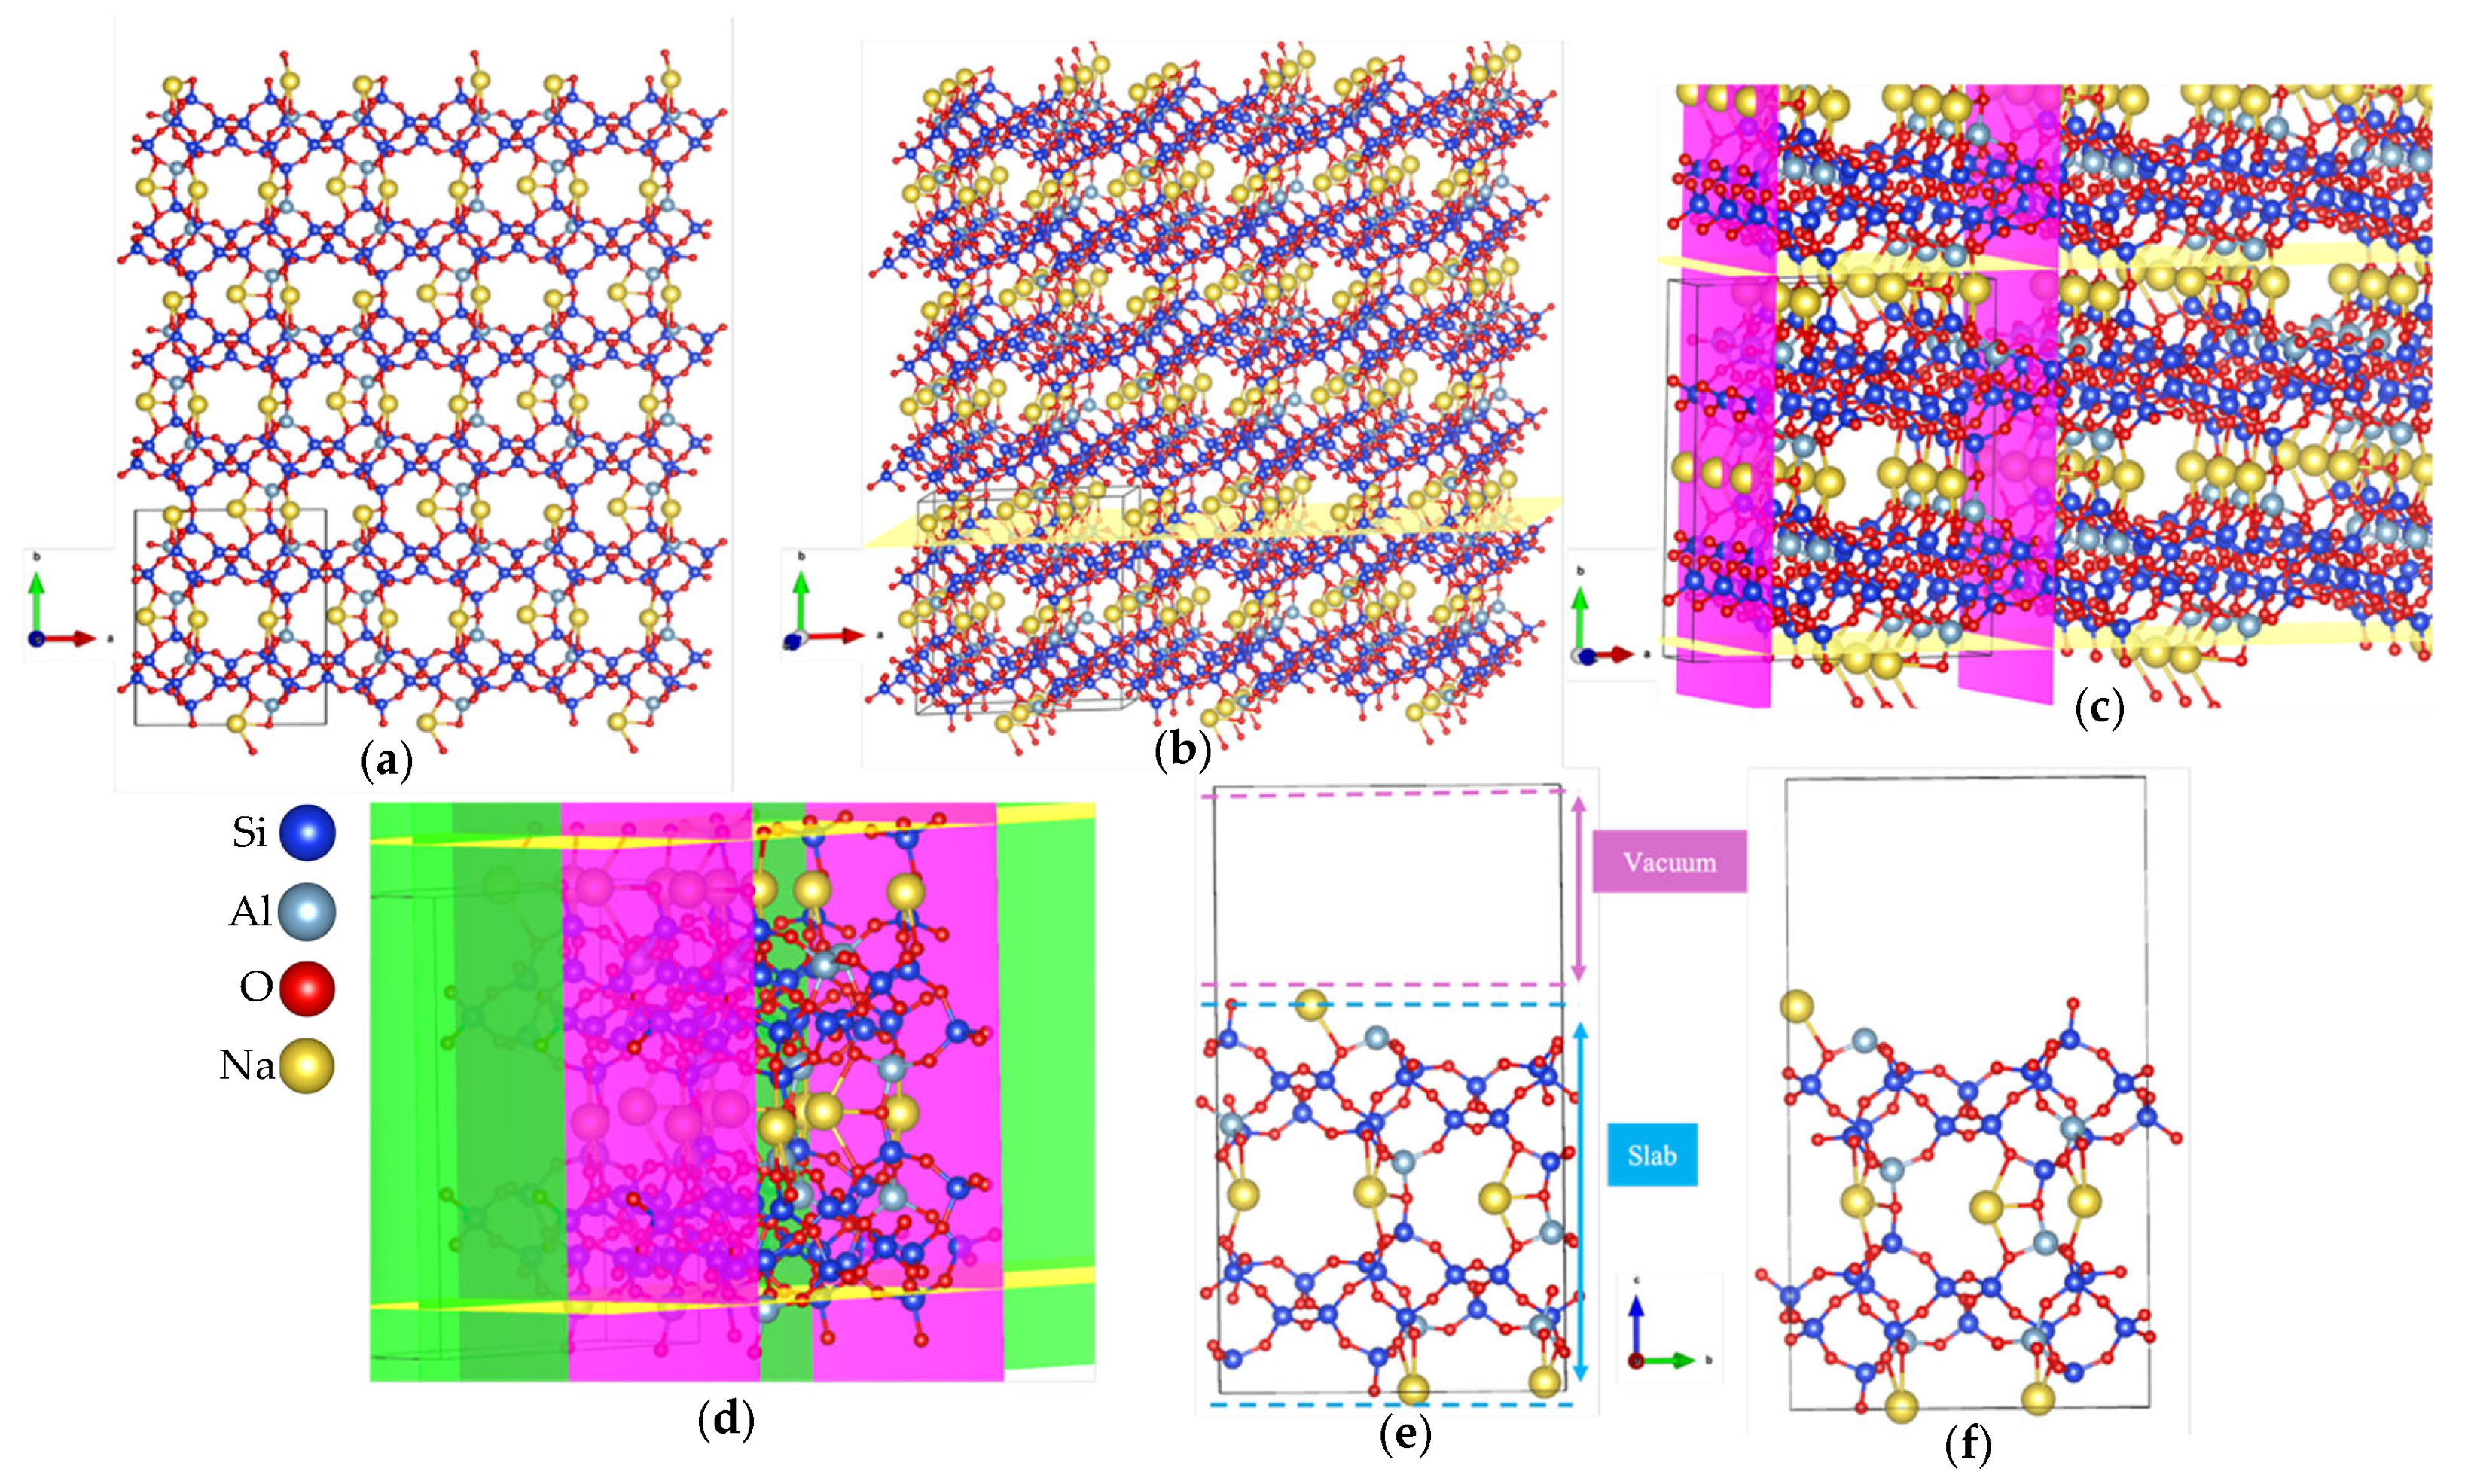
Surface models can be created by following a series of structured steps in VESTA as shown in Figure 3 and outlined below:
  • Build a supercell by repeating the fully optimized bulk unit cell along all three spatial directions to ensure adequate size for surface termination and convergence testing: in Figure 3a, the fully optimized bulk unit cell is shown inside the grey box.
  • Select the crystallographic plane of interest—ideally one that represents a natural cleavage surface or has been previously studied in the literature (either experimentally or theoretically). This aids in validating the structural and energetic features of the generated surface model (Figure 3b).
  • Orient the crystal structure such that the chosen Miller plane is aligned horizontally or vertically; this eases the imagination and visualization of the cleaving process and the trimming of atoms (Figure 3c).
  • Define a parallel plane to the selected crystallographic plane to control slab thickness. This plane should be placed to preserve the periodicity and symmetry of the bulk structure (Figure 3c).
  • Add two bounding planes perpendicular to the initial pair, as well as two additional planes along the third spatial dimension. These define the three-dimensional boundaries of the slab (Figure 3d).
  • Trim atoms outside the defined volume and apply the appropriate transformation matrix—typically a covariant transformation or a linear combination of the original lattice vectors—to generate the correct supercell orientation (Figure 3d).
  • Export the resulting model in Vienna Ab initio Simulation Package (VASP) format with Cartesian coordinates, which facilitates the addition of vacuum spacing (usually along the z-axis) for subsequent DFT calculations. Some resulting models are shown in Figure 3e,f for the (010) plane.
This protocol yields a realistic, converged, and physically meaningful surface model suitable for investigating adsorption, surface relaxation, and interfacial reactivity in first-principles simulations. The reader can also find valuable information in those references [28,29,30]. In addition, we provide a sample code for generating surface models in the Supplementary Material.

2.2. Computational Details

2.2.1. Workflow for Surface Models Optimizations

Building on the central theme of our previous work [18], we present an extended approach to study the complex microporous natural zeolites while maintaining a computationally elegant framework: one that balances accuracy with high computational efficiency.
In the present work, first-principles calculations based on DFT [31,32] in the framework of dispersion correction [33] were performed and carried out employing CP2K/Quickstep code (version 7.1) [34,35]. The hybrid Gaussian and plane wave (GPW) [36] approach and Goedecker–Teter–Hutter (GTH) pseudopotentials [37] were utilized. Exchange-correlation effects were handled within the generalized gradient approximation using the robust B97-D3 functional [38,39]. The refined B97-D functional builds on Becke’s original B97 power series formulation from 1997 and is specifically reparametrized to include damped, semi-classical dispersion corrections for interatomic interactions. Notably, in a benchmarking test of 200 DFs [39], B97-D was recommended as the best choice from the category of local GGAs, followed by revPBE-D, as was also proved in our previous work [18].
Geometry optimizations were performed using the limited memory Broyden–Fletcher–Goldfarb–Shanno (LBFGS) minimization algorithm [40,41,42,43]. The convergence thresholds were set to 4.5 × 10⁻³ Hartree/Bohr for the force and 3.0 × 10⁻² Bohr for atomic displacements. The self-consistent field (SCF) equations were solved using the diagonalization method with Broyden mixing and the SCF procedure was converged to an accuracy of 1 × 10⁻¹⁰ Hartree. In our previous work [18], we performed convergence tests for both the plane wave cutoff and relative cutoff, which were set to 350 Ry and 70 Ry, respectively. The full convergence procedure and supporting data are available in [18].
Integration over the surface Brillouin zone [17,44] was performed using a gamma-centered scheme with a full grid and a k-points mesh of 5 × 5 × 1, which was the most suitable according to our convergence tests. Some figures and data for our convergence tests are given in the Supplementary Material. Since clinoptilolites possess polar crystal structures, cleaving the material introduces surface polarity, further intensified by the anti-symmetry between the top and bottom layers of the slab and bond disruption at the interface: pymatgen [19] could be utilized to calculate the polarity of the surfaces in each spatial coordinate. Yet, to properly address such an issue so that it does not affect the total energies and thus the free energies of the surface models, periodicity was applied only in the X and Y directions, while the Z-direction was treated as non-periodic using an analytical Poisson solver. This solver employs Green’s function boundary conditions to ensure that the electrostatic potential vanishes in the open direction, and it offers an exact solution as well. Moreover, to eliminate spurious interactions between slabs, a vacuum layer of 20 Å was added along the Z-axis in all surface models; based on our experience, vacuum spacings smaller than 15 Å are not recommended as also stated here [45].
To ensure proper convergence of the k-points grid, an electronic temperature of 3000 K, which corresponds to 0.26 eV, was applied using the Fermi–Dirac smearing scheme, along with 100 unoccupied molecular orbitals (MOs). While this artificial temperature is not essential for the physical properties of insulators as it is for metals, it is introduced to enhance computational efficiency. Therefore, it was set high enough to improve the tractability of the calculations, yet not so high as to distort the total energy or introduce unacceptable errors in the results [46,47].
For the relaxations of the surface models, we employed the molecularly optimized (MOLOPT) basis sets [48] that come with the distribution of CP2K, exactly as described in our previous work [18]. For Si atoms (3s2,3p2): TZVP, O atoms (2s2,2p4): DZVP, Al atoms (3s2,3p1): TZV2P, Na atoms (2s2,2p6,3s1): SZV, and H (1s1): TZVP.

2.2.2. Force Fields and Molecular Dynamics Workflow for Adsorption Simulations

The spatial and temporal scales involved in studying molecular adsorption on surfaces are often beyond the ‘practical’ limits of DFT or other ab initio methods. In such scenarios, it becomes necessary to employ a higher level of approximation, turning to empirical force field (FF) approaches to enable efficient exploration of the system [49]. In this study, we employ classical force fields as a preliminary step to efficiently sample and pre-optimize a wide range of adsorption configurations via molecular dynamics (MD) simulations (statistical Newtonian mechanics [50]). The most promising candidates from the force field screening were then refined using further DFT calculations, ensuring both efficiency and accuracy in capturing the key interactions governing adsorption.
All the classical molecular dynamics simulations in this study were performed within the canonical (NVT) ensemble using the LAMMPS [51,52,53] open-source package (version LAMMPS 64-bit 29 August 2024 with GUI for windows and stable_29 August 2024 for Linux) [54], employing the interface force field (IFF) [55] for the surface models and polymer consistent force field (PCFF) [56,57,58] for the molecule—both of which utilize the 9–6 Lennard–Jones potential. The IFF is an all-atom, flexible force field specifically developed to model interfaces between inorganic materials and organic or biological molecules with high accuracy. It is parameterized using quantum mechanical data and experimental observations to capture surface interactions, crystal structures, and mechanical properties reliably. On the same note, the PCFF is designed for simulating polymers, organic molecules, and biomolecular systems, providing detailed treatment of torsional, non-bonded, and electrostatic interactions. It is particularly effective for modeling flexible molecular geometries and adsorption behavior in soft matter and organic–inorganic hybrid systems, also parameterized at the quantum mechanical level with Hartree–Fock level of theory.
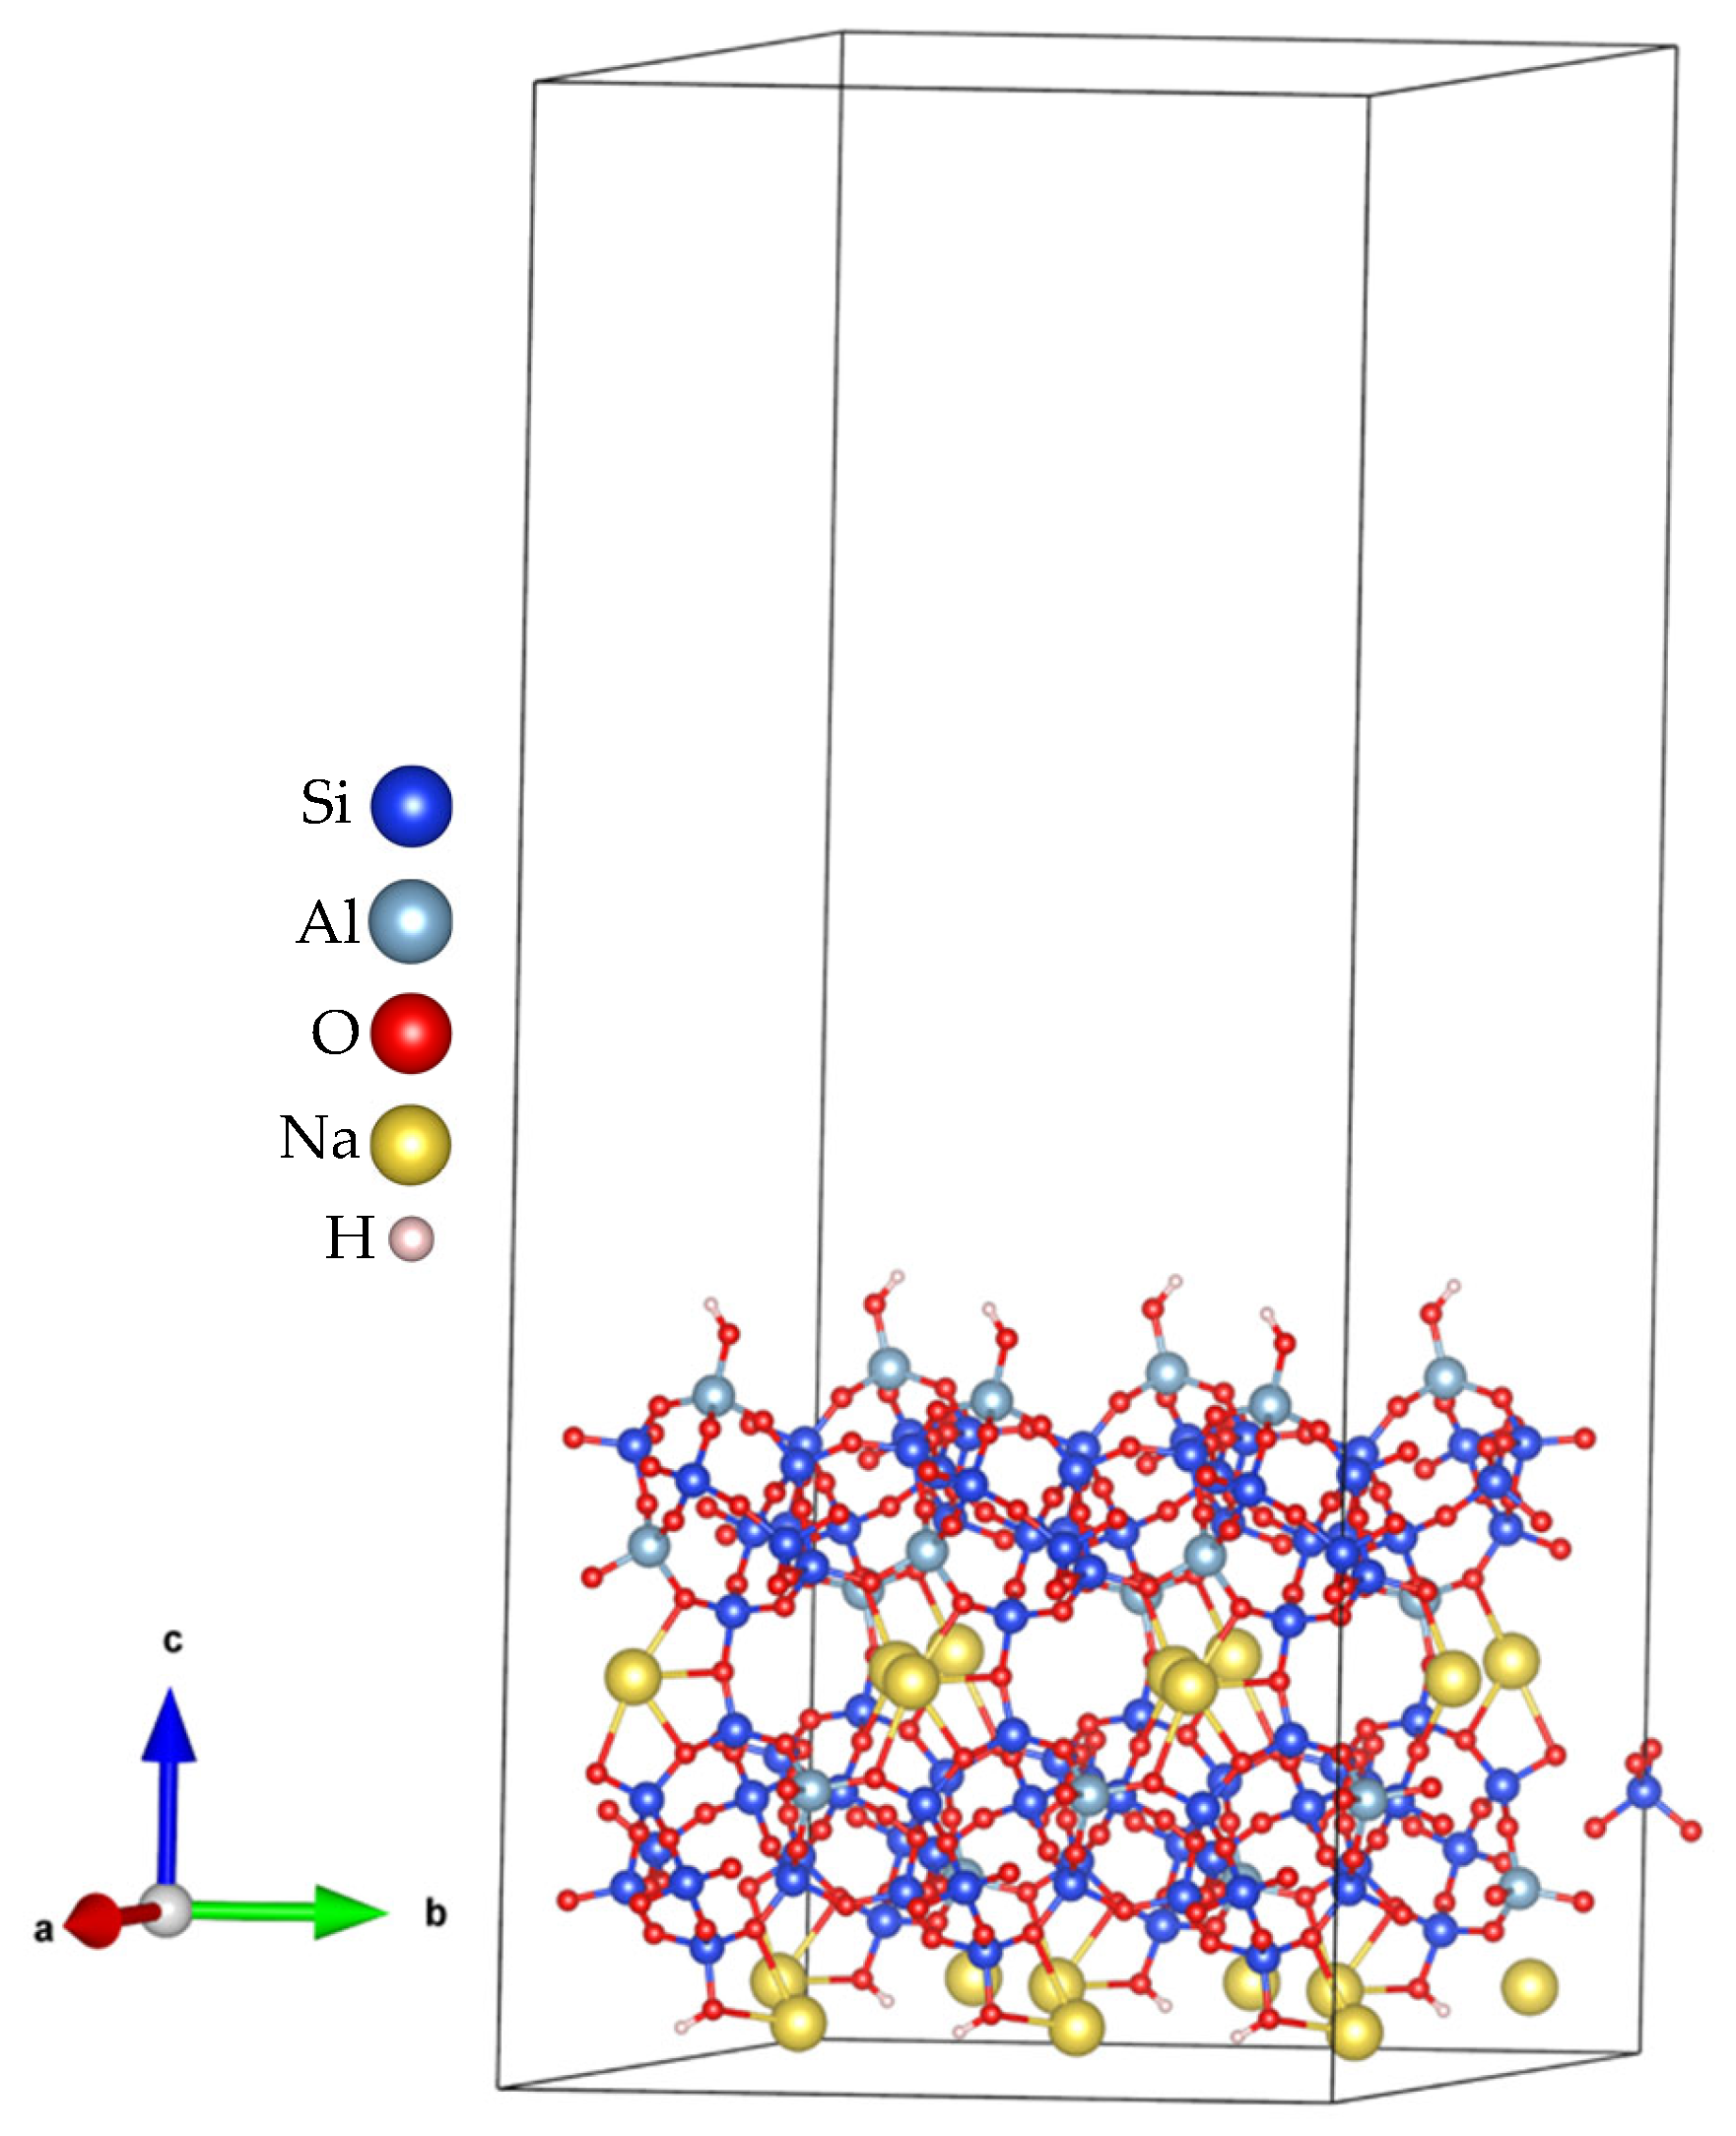
After constructing the surface models from the most stable structures of the fully optimized bulk models and running DFT optimizations on the corresponding surfaces, we increase the size of the model in the b direction so that we have a 1 × 3 × 1 supercell (because the b axis in clinoptilolites is the smallest lattice parameter), as can be envisaged below in Figure 4.
The sequence in which LAMMPS input is structured is described in the following in order. Simulations using IFF and PCFF were carried out in real units in LAMMPS, as required by the force field’s parameterization, and they were carried out in a restricted triclinic simulation box and periodic boundary conditions in all spatial coordinates. Bonded interactions—bonds, angles, dihedrals, and impropers—were all handled using class II styles to remain consistent with the parameterization of both IFF and PCFF. Additionally, special_bonds settings were used to correctly scale 1–4 nonbonded interactions. The short-range interactions are truncated with a cutoff radius of 14 Å [59]. Analytical tail corrections are deactivated and the shift in pair_modify command was utilized to ensure a continuous potential energy curve at the cutoff. Long-range columbic interactions were computed via Ewald summation with dispersion (ewald/disp) as the kspace solver, with an accuracy of 1 × 10⁻⁶; this is more efficient for our case here than the standard Ewald style.
The next critical step involves generating the LAMMPS data files for the surface. This was accomplished using the msi2lmp tool for IFF (version 3.9.10/10 March 2023) [60], which converts structural and FF information into a LAMMPS-compatible format. It should be noted that the ‘−i’ option in the msi2lmps tool is very useful to avoid unnecessary complications with some of the FF parameters that are not available. Prior to this, the appropriate atom types must be assigned within Materials Studio [61], ensuring full consistency with the selected force field. Additionally, we emphasize a key limitation when using class II force fields in LAMMPS: the software does not support automatic generation of cross terms for ε (epsilon) and γ (gamma) parameters between nonbonded atom types, even though the log file may state “Generated cross terms…”. Here, ε refers to the well depth of the Lennard–Jones potential, representing the strength of van der Waals attraction, and γ is the distance parameter specific to the 9–6 Lennard–Jones formulation, analogous to σ in the 12–6 form, which governs the distance at which the potential energy is zero [55]. To accurately account for these interactions between non-identical atom types, we manually applied the sixth-power mixing rule to compute the ε and γ parameters as shown below in Equation (1). Compared to conventional geometric or arithmetic mixing rules, this sixth power mixing rule improved greatly the interaction between the molecule and the surface in our system.
x i j = x i 6 + x j 6 2 1 6
where in this expression, xi and xj denote the Lennard-Jones parameters (ε or γ) of species i and j, respectively, and xij is the corresponding cross-interaction parameter obtained from the sixth-power mixing rule. A custom Python script to assist with the manual calculation of those cross-interaction parameters is provided in the Supplementary Material along with an example of the full set of force field parameters used in this work: FF_types, atomic charges, and all relevant bonded and non-bonded terms. On the same note, we provide a sample molecule file that was created specifically to meet LAMMPS criteria for defining molecules in simulations.
To generate PCFF parameters for the adsorbate molecule, we recommend using the readily available Python tool (version 1.7, 3 September 2021), available on NanoHUB [62], which produces data files fully compatible with LAMMPS; a sample data file is provided in Supplementary Material. To avoid introducing artifacts during simulation, it is essential to ensure that the molecule and the surface model share the same simulation cell dimensions. In particular, mixing restricted triclinic—as for the surface—and orthogonal simulation boxes—as for the molecule—within LAMMPS is not supported and can lead to unphysical results.
  • Hybrid Simulated Annealing and Parallel Tempering Approach
To efficiently explore the complex configurational space of the molecule–surface interaction, we employed a multi-stage simulation protocol combining classical force field-based molecular dynamics with advanced sampling techniques. Simulated annealing (SA) was used to thermally excite the system and facilitate large-scale configurational rearrangements, followed by gradual cooling to encourage relaxation into low-energy adsorption states [63]. During those SA simulations, temperature control was achieved using the Nosé–Hoover thermostat with a damping constant of 150 fs. A representative temperature profile from a selected simulation is presented in the Supplementary Material along with an example input parameter file for LAMMPS.
SA, in theory, converges to the global optimum solution, while in practice, it can be limited by its tendency to become trapped in local minima due to the finite simulations time [64], and sometimes due to systems with rugged potential energy surfaces (PES) (multiple adsorption sites and strong local variations in surface electrostatics). While zeolites may not have rugged PES in the same way as proteins or glasses, there are valid reasons why adsorption processes in zeolites—especially when involving surfaces—can present a complex energy landscape. First is the structural complexity: Clinoptilolites have highly anisotropic frameworks with multiple inequivalent adsorption sites, especially on cleaved or reconstructed surfaces. These surfaces feature different coordination sites, cations, and hydroxyl groups, all contributing to a complex potential landscape. Second is cation distribution: The presence and position of extra-framework cations such as Na, Ca, etc… introduce strong electrostatic fields that vary locally. Adsorbates such as 5-FU interact differently depending on cation position or type, leading to many local adsorption minima. Third is molecule flexibility and orientation: Due to the asymmetric structure and multiple functional groups of 5-FU, the molecule can adopt many distinct orientations relative to the surface. While it does not possess internal conformational flexibility, its geometry allows for various rotational and positional alignments that result in different interaction strengths and adsorption sites, each with its own local minimum. The fourth reason is surface heterogeneity: Upon cleavage, especially along polar planes, the resulting surfaces are heterogeneous, featuring exposed Al, silanols, and potentially under-coordinated oxygen and/or Al atoms. This further complicates the interaction potential landscape.
Parallel tempering (PT) [65]—also known as replica exchange Markov Chain Monte Carlo (MCMC) sampling—is a replica exchange approach that simulates multiple replicas at different temperatures and periodically swaps configurations between them using a Metropolis criterion [66] as shown in the below equation.
P s w a p i j = m i n 1 , e [ ( 1 k B T i 1 k B T j ) ( E i E j ) ] ,
with Pswap here as the probability of accenting a swap between the heat bath temperatures Ti and Tj and energies Ei and Ej and kB as the Boltzmann constant. This technique enhances sampling efficiency by allowing low-temperature replicas to escape metastable states via exchanges with higher-temperature ones. While PT significantly enhances sampling, it can become computationally inefficient when applied on its own. This is because PT requires many replicas to span a sufficiently broad temperature range and maintain effective exchange rates between neighboring replicas. The number of replicas needed scales approximately with the square root of the system size [67].
To avoid local trapping while maintaining computational efficiency, we implemented both approaches: simulated annealing with parallel replica [68,69], shortened in this work as PR. As we will demonstrate in the Results and Discussion section, this combined approach yields stronger adsorption interactions relative to SA alone for many configurations of interest. It is worth noting that, in the original work by Norman and Schwartzentruber [68], annealing and tempering were integrated into a single LAMMPS command (anneal_temper). However, this functionality is not available in the version of LAMMPS used in the present study, or any other version. A representative temperature profile and further details on the implementation are provided in the Supplementary Material (S4 & S8) along with a complete LAMMPS input file.

2.2.3. From Force Fields to DFT Optimization and Adsorption Energy Evaluation

Because DFT energies are inherently relative and not absolute, maintaining consistent computational parameters and procedures across all systems is essential for having reliable conclusions. The isolated molecule was treated using the exact same setup as used for the surface and the complete complex calculations (diagonalization, smearing, same box dimensions and k-points grid, etc.) to ensure consistency. This approach showed excellent computational efficiency of 58 min relative to other approaches we tested such as the orbital transformation (OT) [70] method with Perdew, Burke, and Ernzerhof (PBE) [71] or OT with B97-D3 density functional, which did not converge in the case of PBE and consumed two or more hours in the latter case of B97-D3. Each calculation of those were executed on a high-performance computing cluster using a single compute node equipped with 96 processors.
For the bare surface models, single-point energy calculations were performed using the same DFT parameters, as the geometries of the surfaces were already optimized beforehand and the underlying bulk structures were fully relaxed through prior cell optimization. In other words, the underlying bulk structures were first fully relaxed, after which the cleaved surface slabs were also optimized according to the criteria we discussed above. For the purpose of computing reference energies in adsorption energy calculations, only single-point energies of these already-optimized clean slabs are required. In the case of the adsorption complexes, we again used the same DFT settings, incorporating the adsorbate molecule in energetically favorable starting configurations derived from the classical MD analysis. For the 5-FU molecule, DZVP-MOLOPT basis sets [48] were employed for all constituent elements to balance accuracy and computational efficiency.
The adsorption energy (Eads) [10,72] then was calculated as the difference between the DFT total energy of the adsorption complex and the sum of the DFT total energies of the isolated surface and the isolated molecule:
E a d s = E D F T , c o m p l e x   ( E D F T , s u r f a c e + E D F T , m o l )
where EDFT,complex is the DFT total energy of the adsorbed system, EDFT,surface is the DFT total energy of the isolated surface slab, and EDFT,mol is the DFT total energy of the isolated 5-FU molecule, all computed using identical DFT parameters. A negative value of Eads indicates an exothermic, thermodynamically favorable adsorption process.

3. Results and Discussion

3.1. Optimizations of Surface Models

We begin by examining the structural and energetic characteristics of the bare clinoptilolite surface models, constructed as detailed in the previous sections. A comparative analysis of free energies and structural features is first presented to assess the relative stability of the slab models. This serves as a foundation for understanding the adsorption behavior explored in the following sections. However, before comparing relative energies, it is essential to ensure that the computed free energies are not artificially influenced by surface polarity or long-range electrostatic artifacts. Clinoptilolite slabs are structurally polar due to intrinsic asymmetry between the top and bottom surfaces—arising from framework Al substitution and the spatial distribution of compensating cations in the bulk. This polarity, if left uncorrected, can introduce artificial dipoles in vacuum-based slab calculations, skewing total energies and compromising the reliability of relative stability and adsorption analyses.
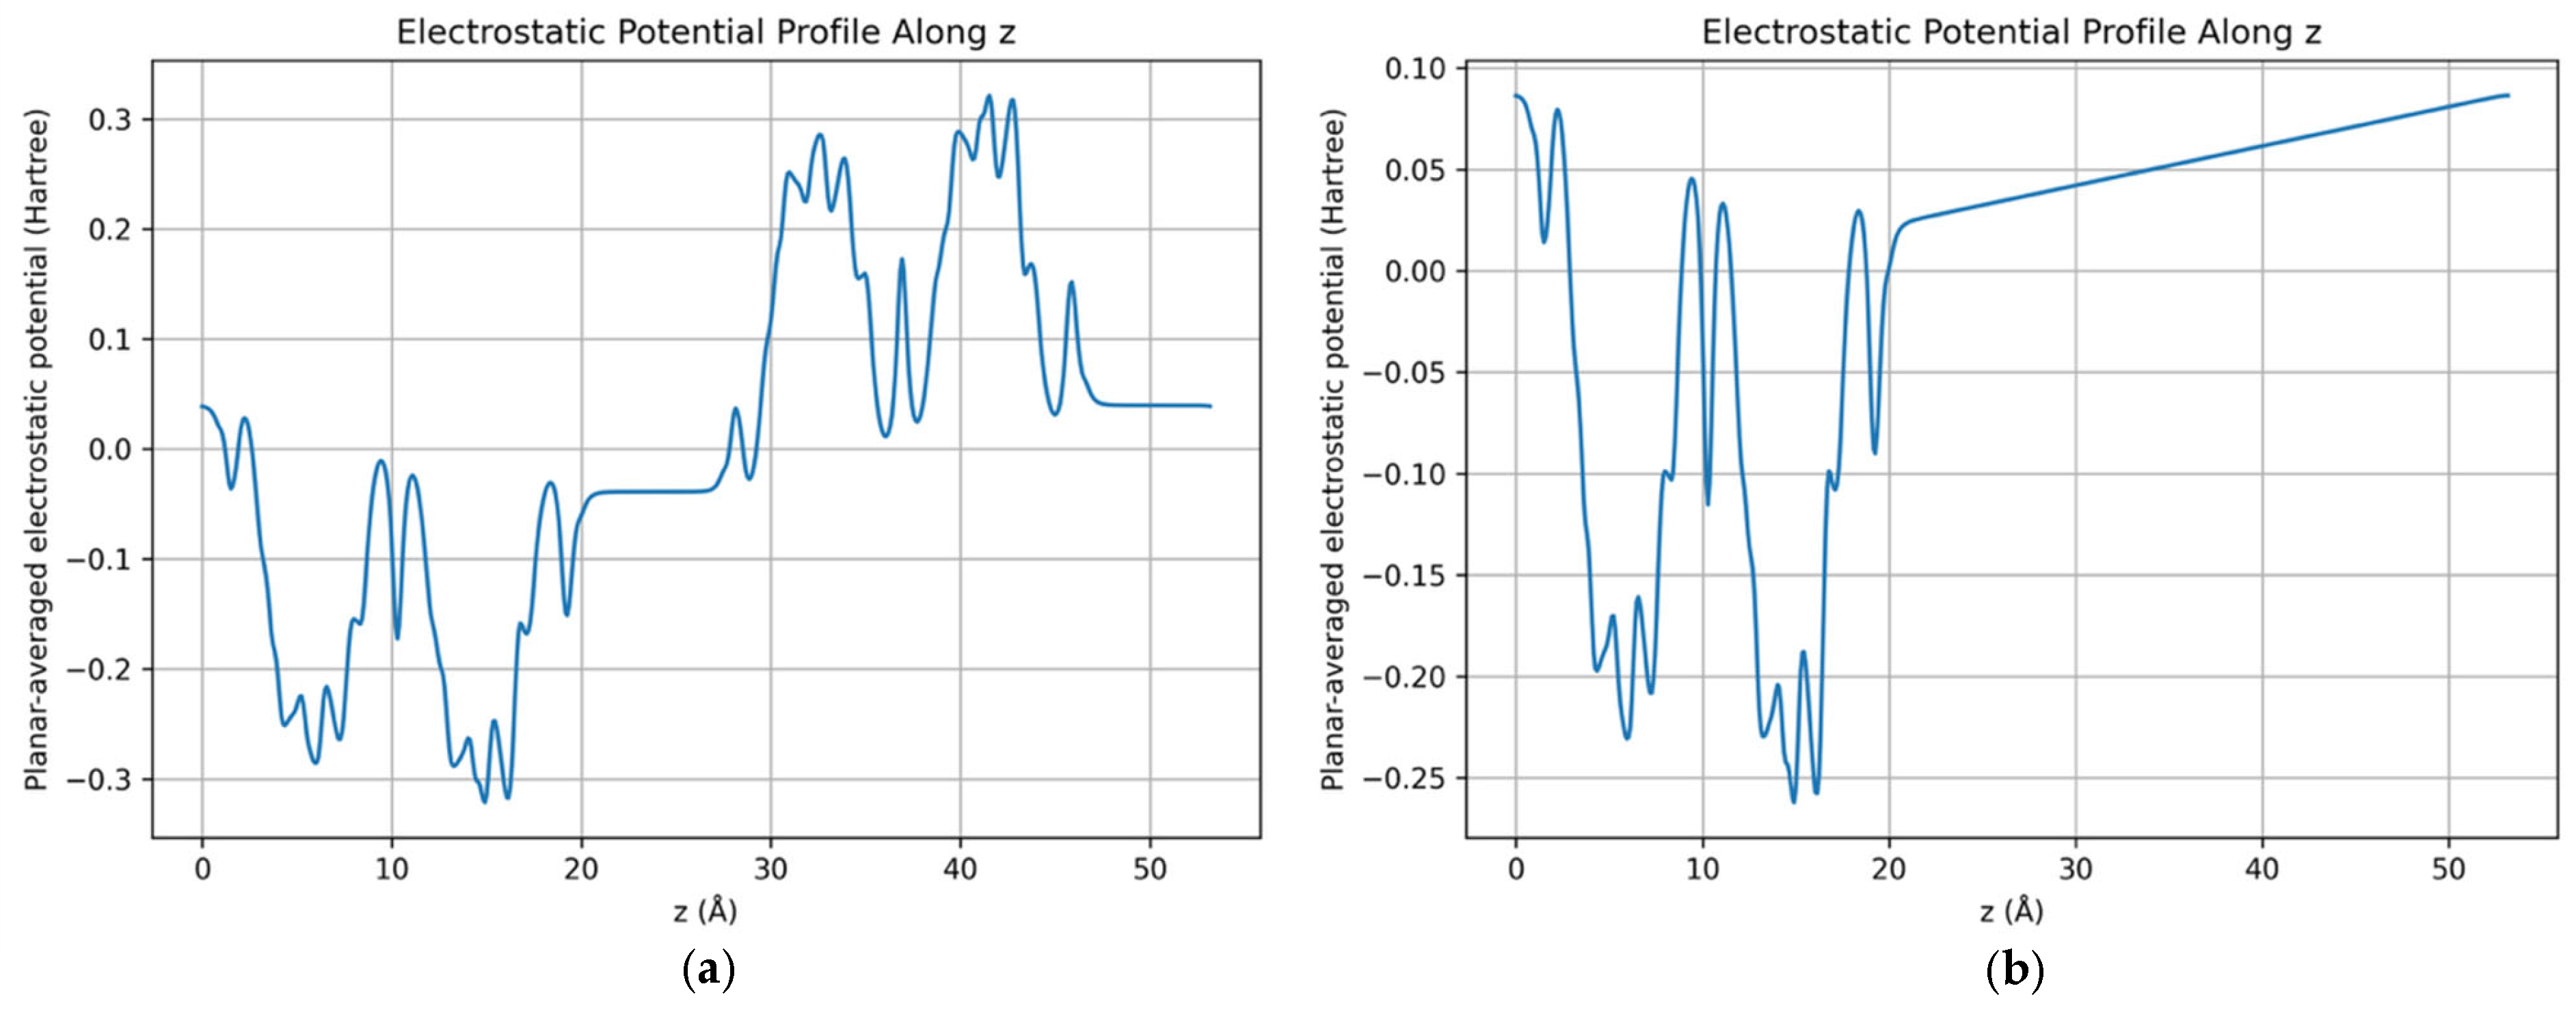
To this end, all DFT calculations were performed using non-periodic boundary conditions along the slab normal (z-direction) in conjunction with CP2K’s analytical Poisson solver, as detailed in the computational methodology. This setup ensures that the electrostatic potential in the vacuum region vanishes at infinity, effectively mimicking a surface exposed to open space rather than interacting with its periodic image. An example CP2K input file can be found in the Supplementary Material.
To highlight the significance of this correction, Figure 5 presents the electrostatic potential profile for one representative surface model, comparing results with and without the Poisson correction. As demonstrated, neglecting this correction leads to a net potential gradient across the vacuum region, while the corrected setup produces a flat potential—ensuring electrostatic neutrality and physically meaningful energy comparisons.
To plot this figure, we computed the planar-averaged electrostatic potential profile along the z-direction (the slab normal). This was achieved by printing the Hartree potential on a 3D real-space grid using the following directives in the &DFT &PRINT section of the CP2K input file:
&DFT
&PRINT
&V_HARTREE_CUBE
STRIDE 1 1 1
&END V_HARTREE_CUBE
&END PRINT
&END DFT
This outputs the Hartree potential as a .cube file (V_HARTREE.cube), which contains the electrostatic potential values sampled over the simulation cell. The STRIDE 1 1 1 ensures full resolution along all grid directions. The resulting cube file was post-processed using atomistic simulation environment (ASE)’s read_cube_data function and NumPy to compute the planar average of the potential along the z-axis. This yields a 1D electrostatic profile that can reveal structural polarity or spurious electric fields in a vacuum.
With the electrostatic environment properly corrected, we now turn to evaluating the relative thermodynamic stability of the Na-clinoptilolite slab models. In this study, six distinct Na-clinoptilolite surface models are investigated, all corresponding to the chemical composition Na6H4(Si30Al6O74), derived from the most stable bulk structures. The configurations of these models are illustrated in Figure 6.
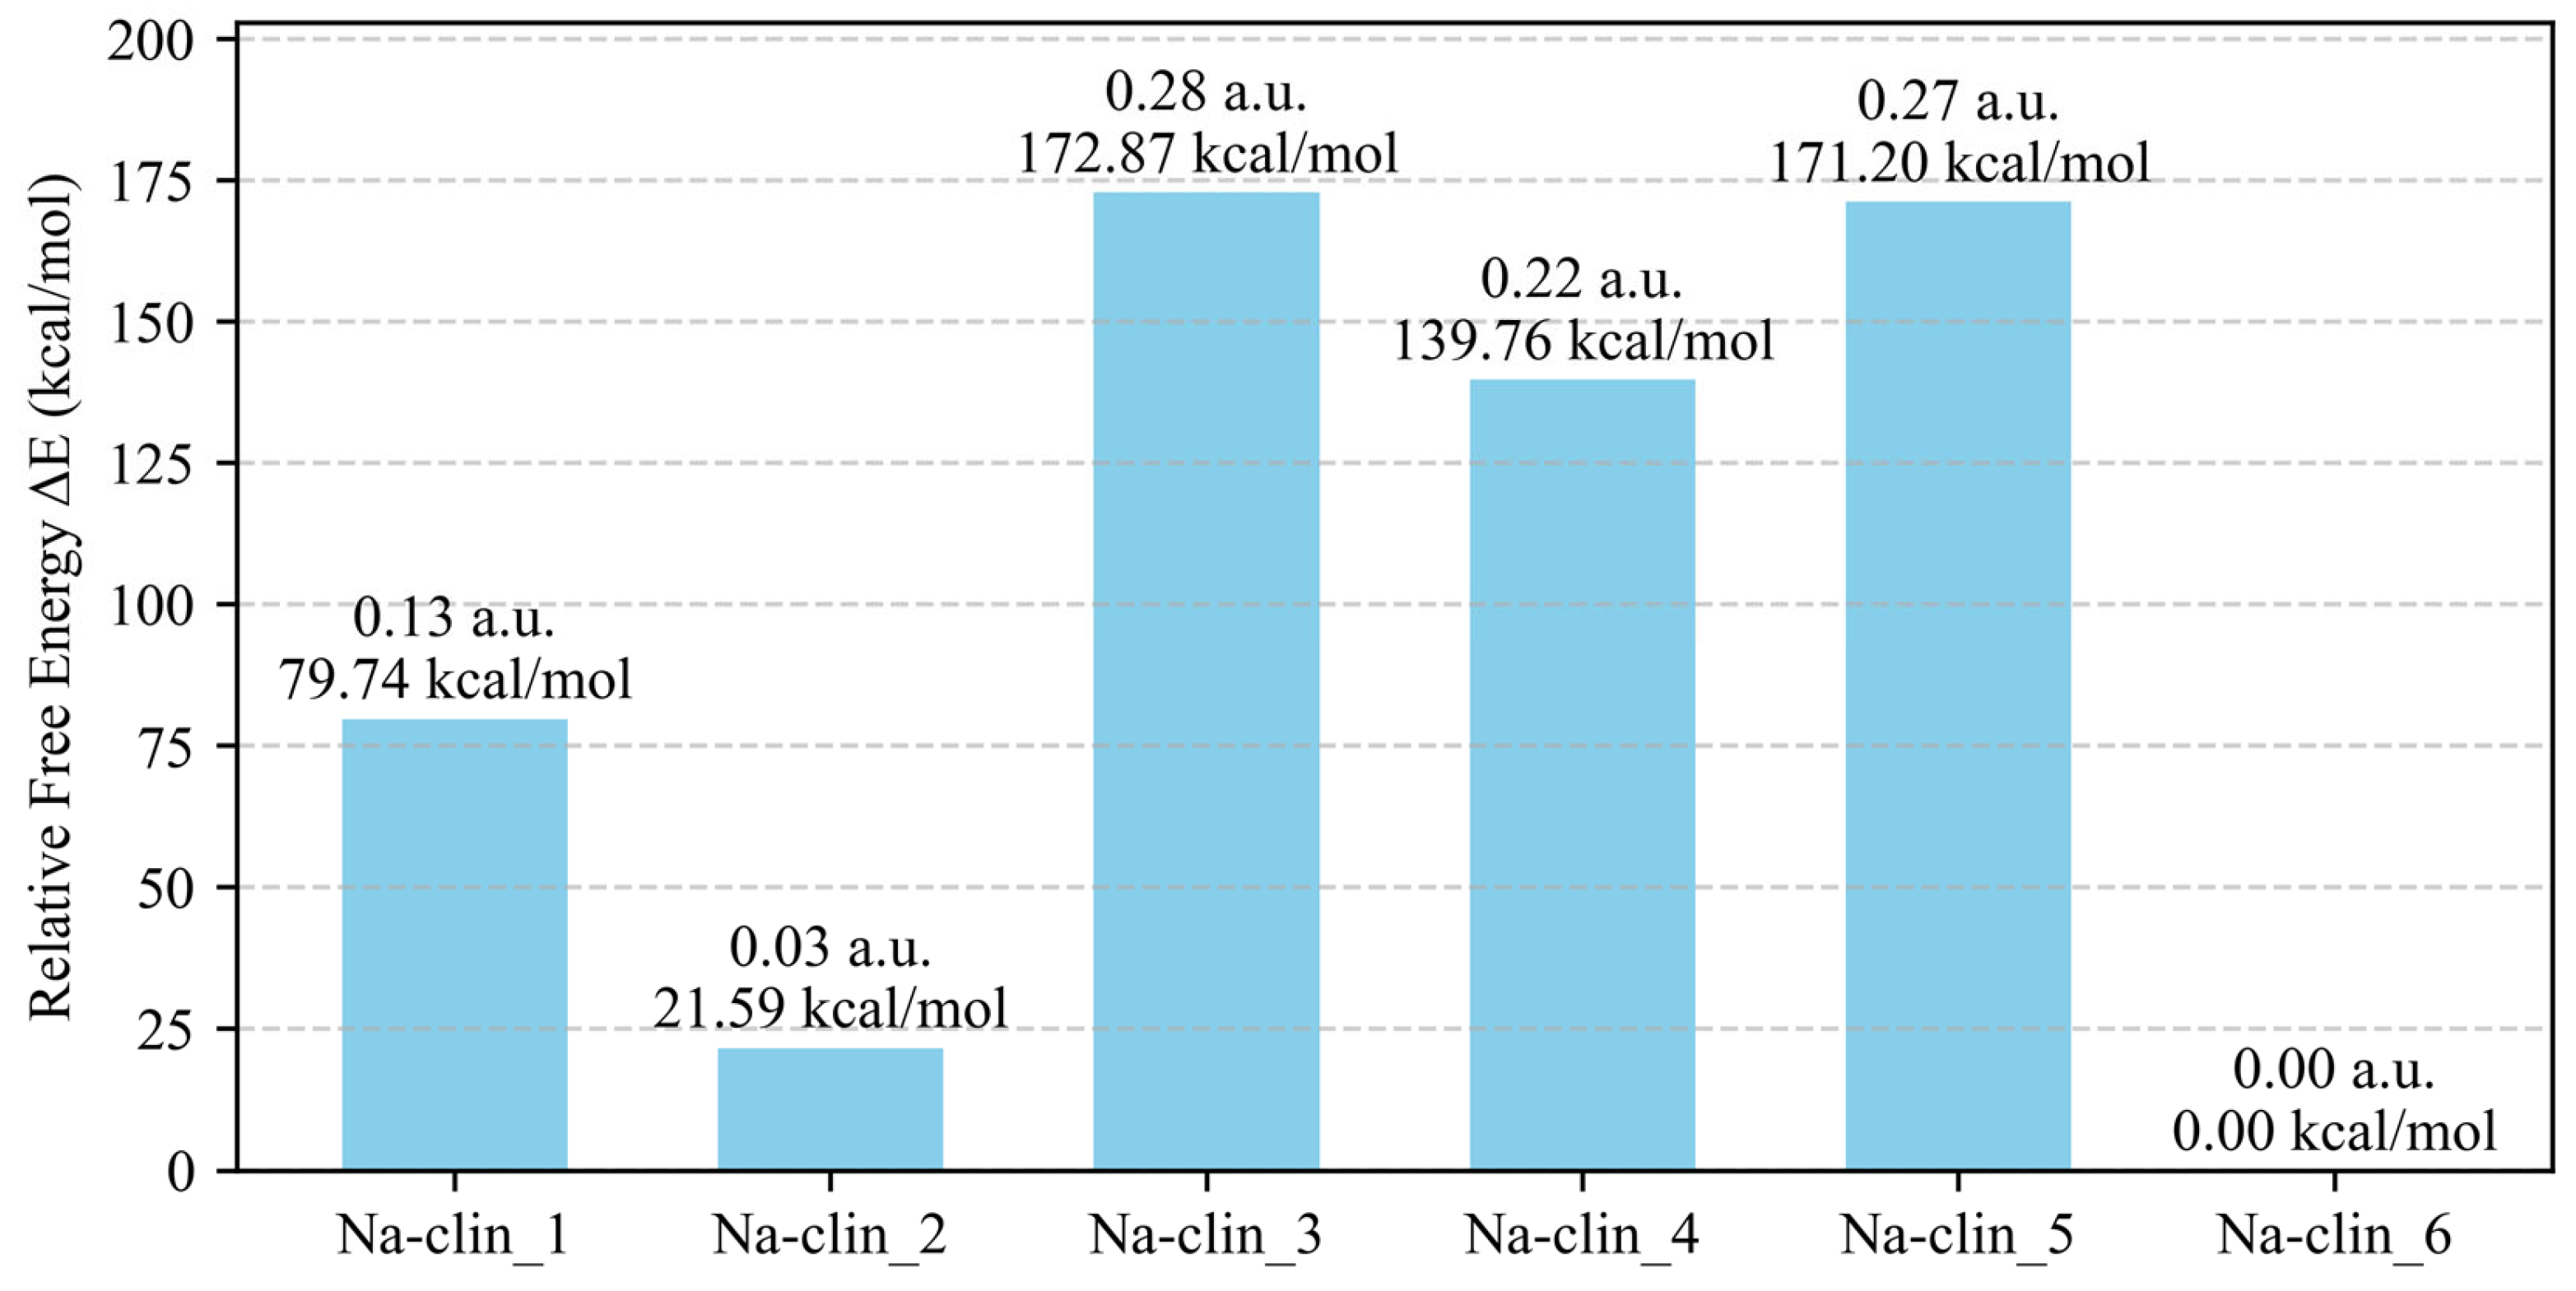
All energies reported in this work are taken from the final ‘FORCE_EVAL’ output in the CP2K log file, which corresponds to the free energy (EtotT·S), not the total energy printed during SCF steps. For insulating systems such as clinoptilolite, the entropic contribution arising from electronic smearing is negligible, and the free energy effectively converges to the ground-state total energy. On the other hand, in systems with significant density of states near the Fermi level (e.g., metallic or asymmetric surfaces), the total energy can be slightly lowered due to smearing effects. In such cases, comparing total energies without entropic correction may lead to misleading conclusions about the relative stability. Therefore, we consistently use the term free energy, as it is the correct thermodynamic quantity in the context of k-point sampling with Fermi–Dirac smearing—whether applied to insulating or metallic systems. This approach provides a reliable and consistent reference across surface models while accounting for the artificial electronic temperature used in the calculations. The relative stability is shown as bar plots in Figure 7. For completeness, the absolute total energies of all models are provided in the Supplementary Material.
When comparing the six Na-clinoptilolite surface models, a clear trend emerges. Models in which all framework regions are well populated with Na cations, rather than showing cation-depleted zones, tend to be more stable energetically, such as Na-clin_6 followed by Na-clin_2. In those models, the cations are relatively evenly distributed throughout the structure—avoiding unoccupied regions—both near the surface and within the bulk. Notably, some Na cations exhibit five-fold coordination with framework oxygens, further contributing to the energetic stabilization. It is important to note at this point that the Na cations exhibiting five-fold coordination at the surface were originally only two-or three-fold coordinated in the bulk models. This transformation highlights the value of adopting a fully ‘self-consistent’ framework. In the approach described in [18] and expanded to surface models in the present work, we begin from the most fundamental building block—namely, the all-silica bulk unit cell—which is first optimized using DFT. The system is then systematically expanded in complexity, from Al and cations to supercells and cleaved surface slabs, with each level subjected to further DFT optimization. Crucially, no atoms were fixed at any stage of the structural optimization process, ensuring that all atomic rearrangements are physically meaningful and not artificially constrained.
In contrast, models that show regions of the structure lacking cation occupancy exhibit higher relative free energies; for instance, Na-clin_1 and Na-clin_4, where regions near the top or bottom surfaces lack cation coverage. This suggests that the spatial distribution of cations—particularly their presence at or near the surface—plays a critical role in stabilizing the slab energetically. As will be shown in subsequent sections, the absence of surface cations correlates with relatively weaker molecule–surface interactions.
Furthermore, configurations that promote stronger coordination between Na cations and the surrounding framework oxygen atoms—particularly those involving multi-site or symmetrical binding—tend to display enhanced relative stability. For instance, Na cations coordinated to five framework oxygen atoms (such as Na-clin_6, then Na-clin_1, Na-clin_4, followed by Na-clin_5) exhibit more favorable energetics, likely due to improved charge compensation and electrostatic balance. These findings underscore the importance of both cation distribution and local coordination environments in determining the relative stability of cleaved zeolite surfaces.
Understanding these stabilization mechanisms is essential not only for interpreting slab energetics, but also for anticipating how cation positioning (and cation type too, which will be discussed in our upcoming work) may influence the adsorption behavior of molecules, as explored in the subsequent sections.

3.2. Adsorption Energy Evaluation of 5-Fluorouracil on Clinoptilolite Surfaces

3.2.1. Cation-Rich Surfaces

Following the structural analysis and relative stability assessment of the six Na-clinoptilolite surface models, we now evaluate the adsorption behavior of 5-FU on these surfaces. Adsorption energies were computed for selected configurations derived from classical molecular dynamics and force field-based screening, as described in the computational methodology. These representative adsorption complexes were further optimized using DFT-D3 calculations to obtain accurate adsorption geometries and binding energetics. The adsorption energy, Eads, was calculated using the standard expression in Equation (3), but with all energy terms corresponding to the free energies, rather than the total energies, obtained from the final FORCE_EVAL outputs of DFT calculations, as discussed in the previous section.
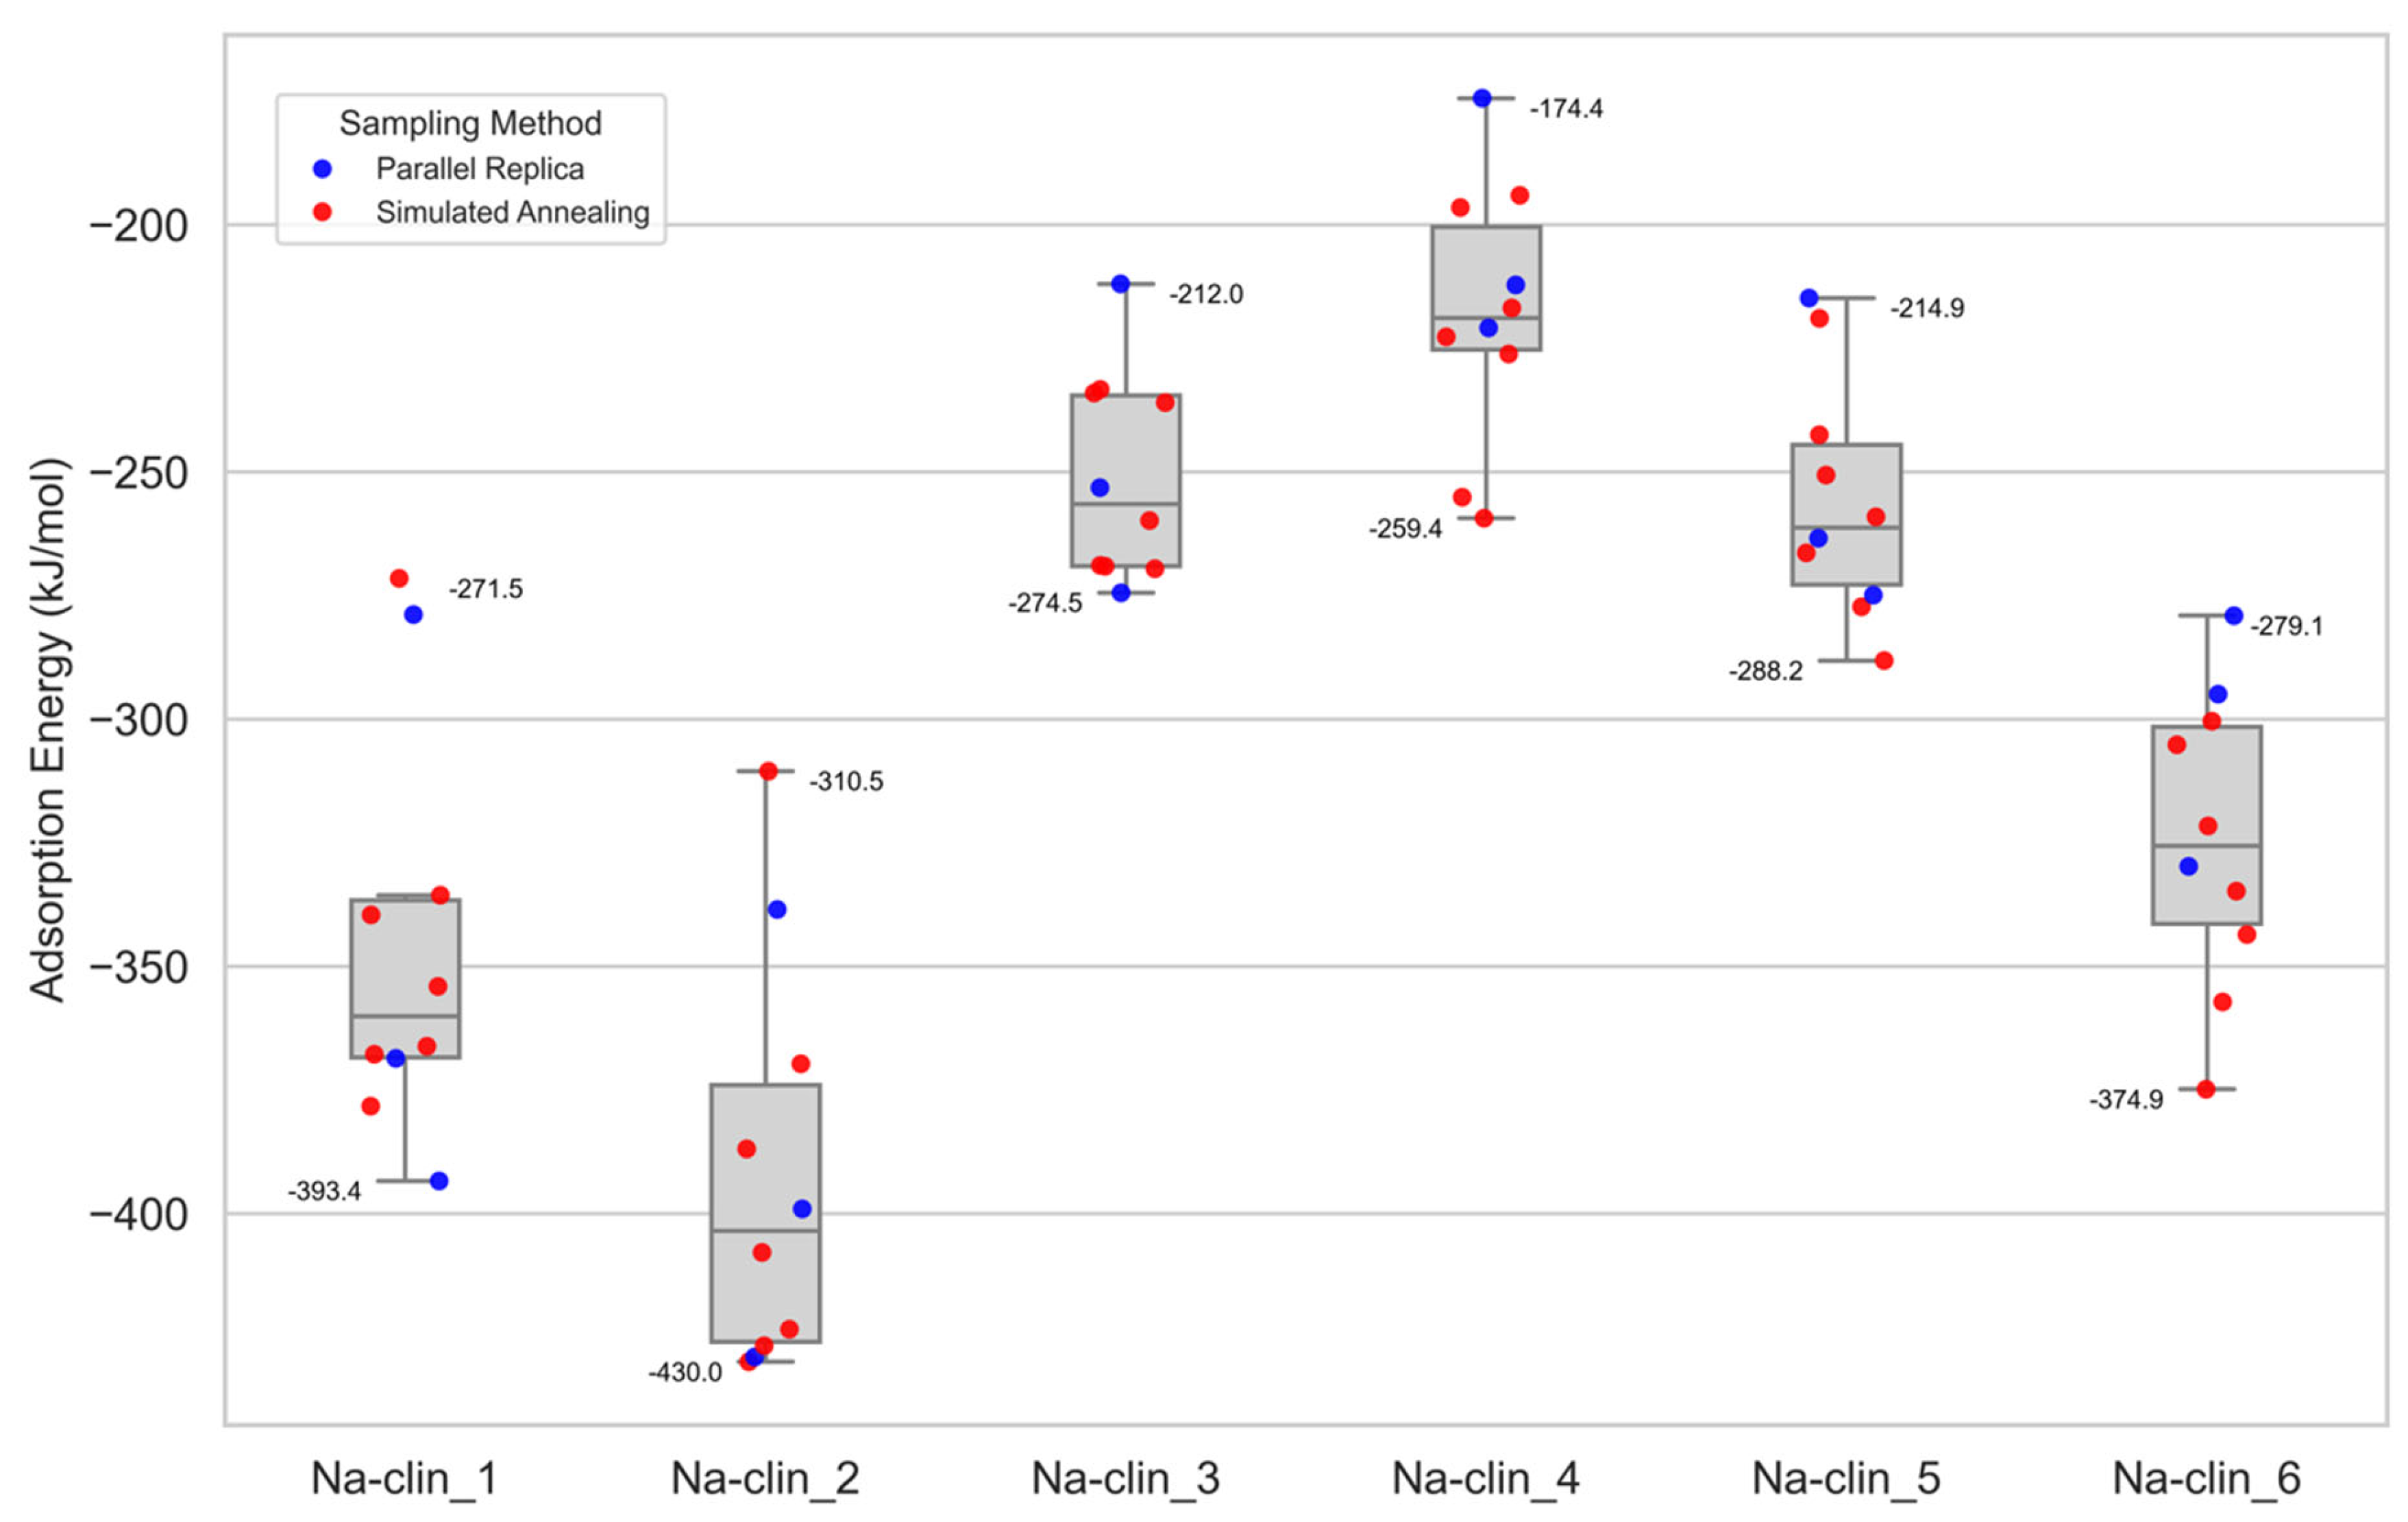
A comparative analysis of adsorption energies for the various Na-clinoptilolite surface models is presented in Figure 8: the adsorption energy distributions were visualized using Python, with box plots and scatter overlays created using the Seaborn (version 0.13.2) and Matplotlib (version 3.9.2) libraries. Each model includes multiple configurations obtained via SA and PR sampling techniques. A total of 10 configurations per surface model was generated using SA, and 3 configurations using PR, resulting in 13 configurations per model and 78 configurations overall across six surface models. These configurations represent the most promising candidates, chosen from an exhaustive configurational search that explored a wide range of molecular orientations and adsorption geometries. The selection criteria involved identifying low-energy structures with favorable binding distances and clear interaction between the molecule and the surface. The goal of this extensive sampling was to capture diverse binding scenarios and avoid local trapping in unfavorable minima. The selected configurations were subsequently refined using DFT-D3 geometry optimizations. All adsorption energies obtained from DFT-D3 optimizations are provided in the Supplementary Material in organized Excel sheets, labeled by the sampling method (SA or PR), and the slab ID. The lowest adsorption energies for each surface model are highlighted in yellow, corresponding directly to the configurations illustrated and discussed in the figures. We also provide a Python script that transforms LAMMPS trajectories to a proper crystallographic information file (CIF) for visualization in the Supplementary Material, along with the actual CIFs for all the figures discussed below.
The central gray box in each group represents the interquartile range and median of the adsorption energies, while individual configurations are overlaid as red (SA) and blue (PR) points. This visualization highlights the variability in adsorption strength for each surface model and demonstrates how both sampling approaches explore distinct regions of the potential energy surface. In general, PR configurations tend to cluster near the lower-energy end of the distribution, confirming their effectiveness in locating deeper minima. The spread of values across models also reflects the influence of cation arrangement and surface polarity on binding strength.
From the figure, it is evident that the Na-clin_2 surface model (corresponding to Figure 6b) exhibits the strongest adsorption performance among all examined surfaces, with adsorption energies ranging from approximately −430 kJ/mol to −310 kJ/mol. This relatively broad yet strongly negative energy range suggests that Na-clin_2 provides multiple favorable binding sites and orientations for 5-fluorouracil, likely due to the optimal distribution of Na cations at the surface. These cations enhance electrostatic stabilization and hydrogen-bonding interactions with the adsorbate. Notably, Na-clin_2 maintains a balance in cation placement—particularly with cations located near, but not densely packed at, the slab perimeters (on the left and the right)—allowing sufficient space for a molecular approach and surface interaction. It is worth mentioning that the left, right, up, and down movements mentioned in this study are relative to the projections of the corresponding figures. In contrast, models such as Na-clin_6 show cations clustered at the edges of the unit cell, which may sterically hinder deeper molecular penetration and limit adsorption strength; the case would be worse for larger molecules. The spatial arrangement in Na-clin_2 thus represents a favorable compromise: surface accessibility is preserved while key cation–adsorbate interactions remain strong and hence offers the best adsorption performance.
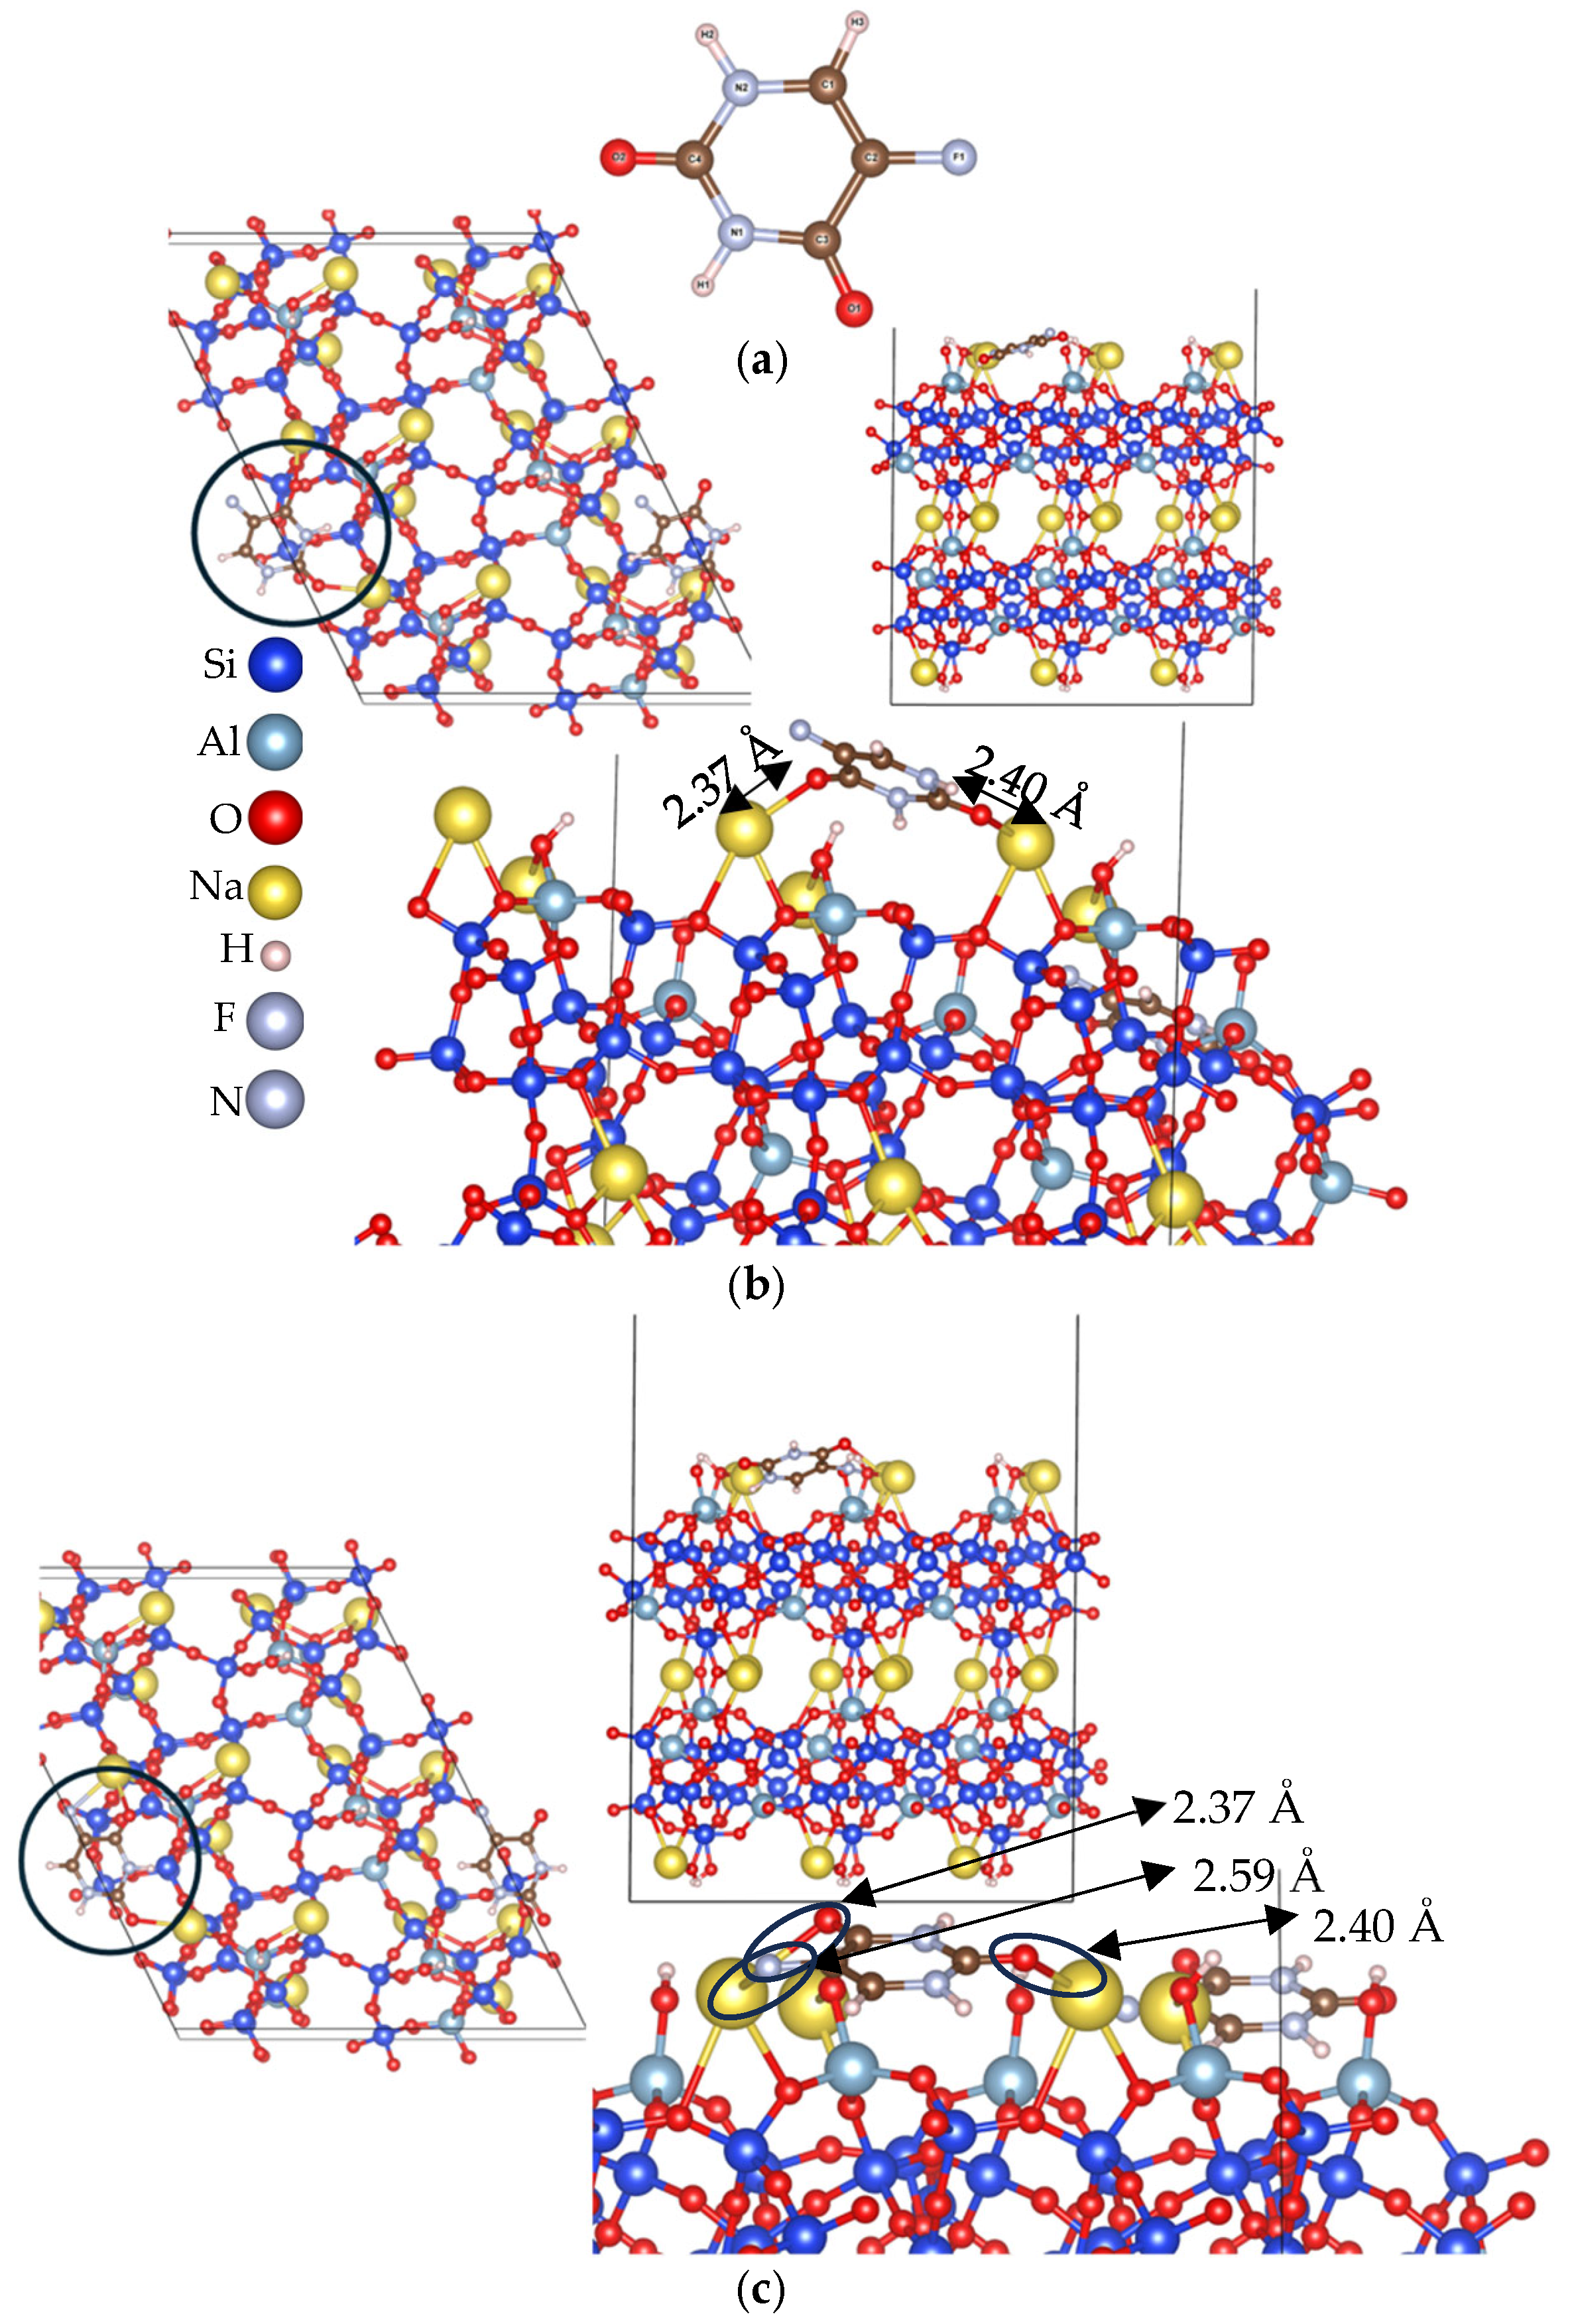
The lower bound of −430 kJ/mol, obtained from a SA configuration, represents the most stable geometry observed in this study, indicating a highly favorable thermodynamic interaction between the molecule and this particular surface model. This is followed by a PR configuration with an adsorption energy of −429.0 kJ/mol. Both are shown below in Figure 9 alongside the structure of 5-FU. In all the below figures, we present the most favorable adsorption configuration from each surface model after DFT optimizations—specifically, the structure with the lowest adsorption energy identified from all sampled geometries. The models are ordered by adsorption performance, with the strongest-binding surface (e.g., Na-clin_2) appearing first.
The SA configuration in Figure 9a,b shows how the molecule effectively embeds itself into the surface, positioning between two surface Na cations and forming strong interactions via its oxygen atoms. After DFT optimization, the Na–O bond lengths were refined to 2.37 Å and 2.40 Å, down from 2.47 Å and 2.50 Å in the initial force field sampling. The next most favorable configuration was obtained via PR sampling. As shown in Figure 9c, this PR sampling led to a distinct local minimum not visited by SA, where the fluorine atom participates directly in surface binding—a rare but notable observation given fluorine’s known role in the biochemical mechanisms of 5-FU. In this configuration, two oxygen atoms and one fluorine atom coordinate with surface cations, exhibiting DFT-optimized bond lengths of 2.37 Å, 2.40 Å, and 2.59 Å, respectively, compared to 2.67 Å, 2.66 Å, and 2.59 Å from force field sampling.
The Na-clin_1 surface model, corresponding to Figure 6a, exhibits the next most favorable adsorption performance after Na-clin_2. Although its Na distribution is similar to that of Na-clin_2, the adsorption energies are overall less favorable. Among the sampled configurations, PR sampling yielded the strongest interaction with an adsorption energy of −393.4 kJ/mol, while the weakest came from SA at −271.6 kJ/mol. This energy spread is reflected in the box plot (Figure 8), where the data points are distributed nearly evenly above and below the median line, indicating a relatively symmetrical distribution of sampling outcomes for Na-clin_1. In general, a widespread variability in the values shown by the scatter points reflects complex energy landscapes or differences in how well our SA and PR analyzes sample local minima.
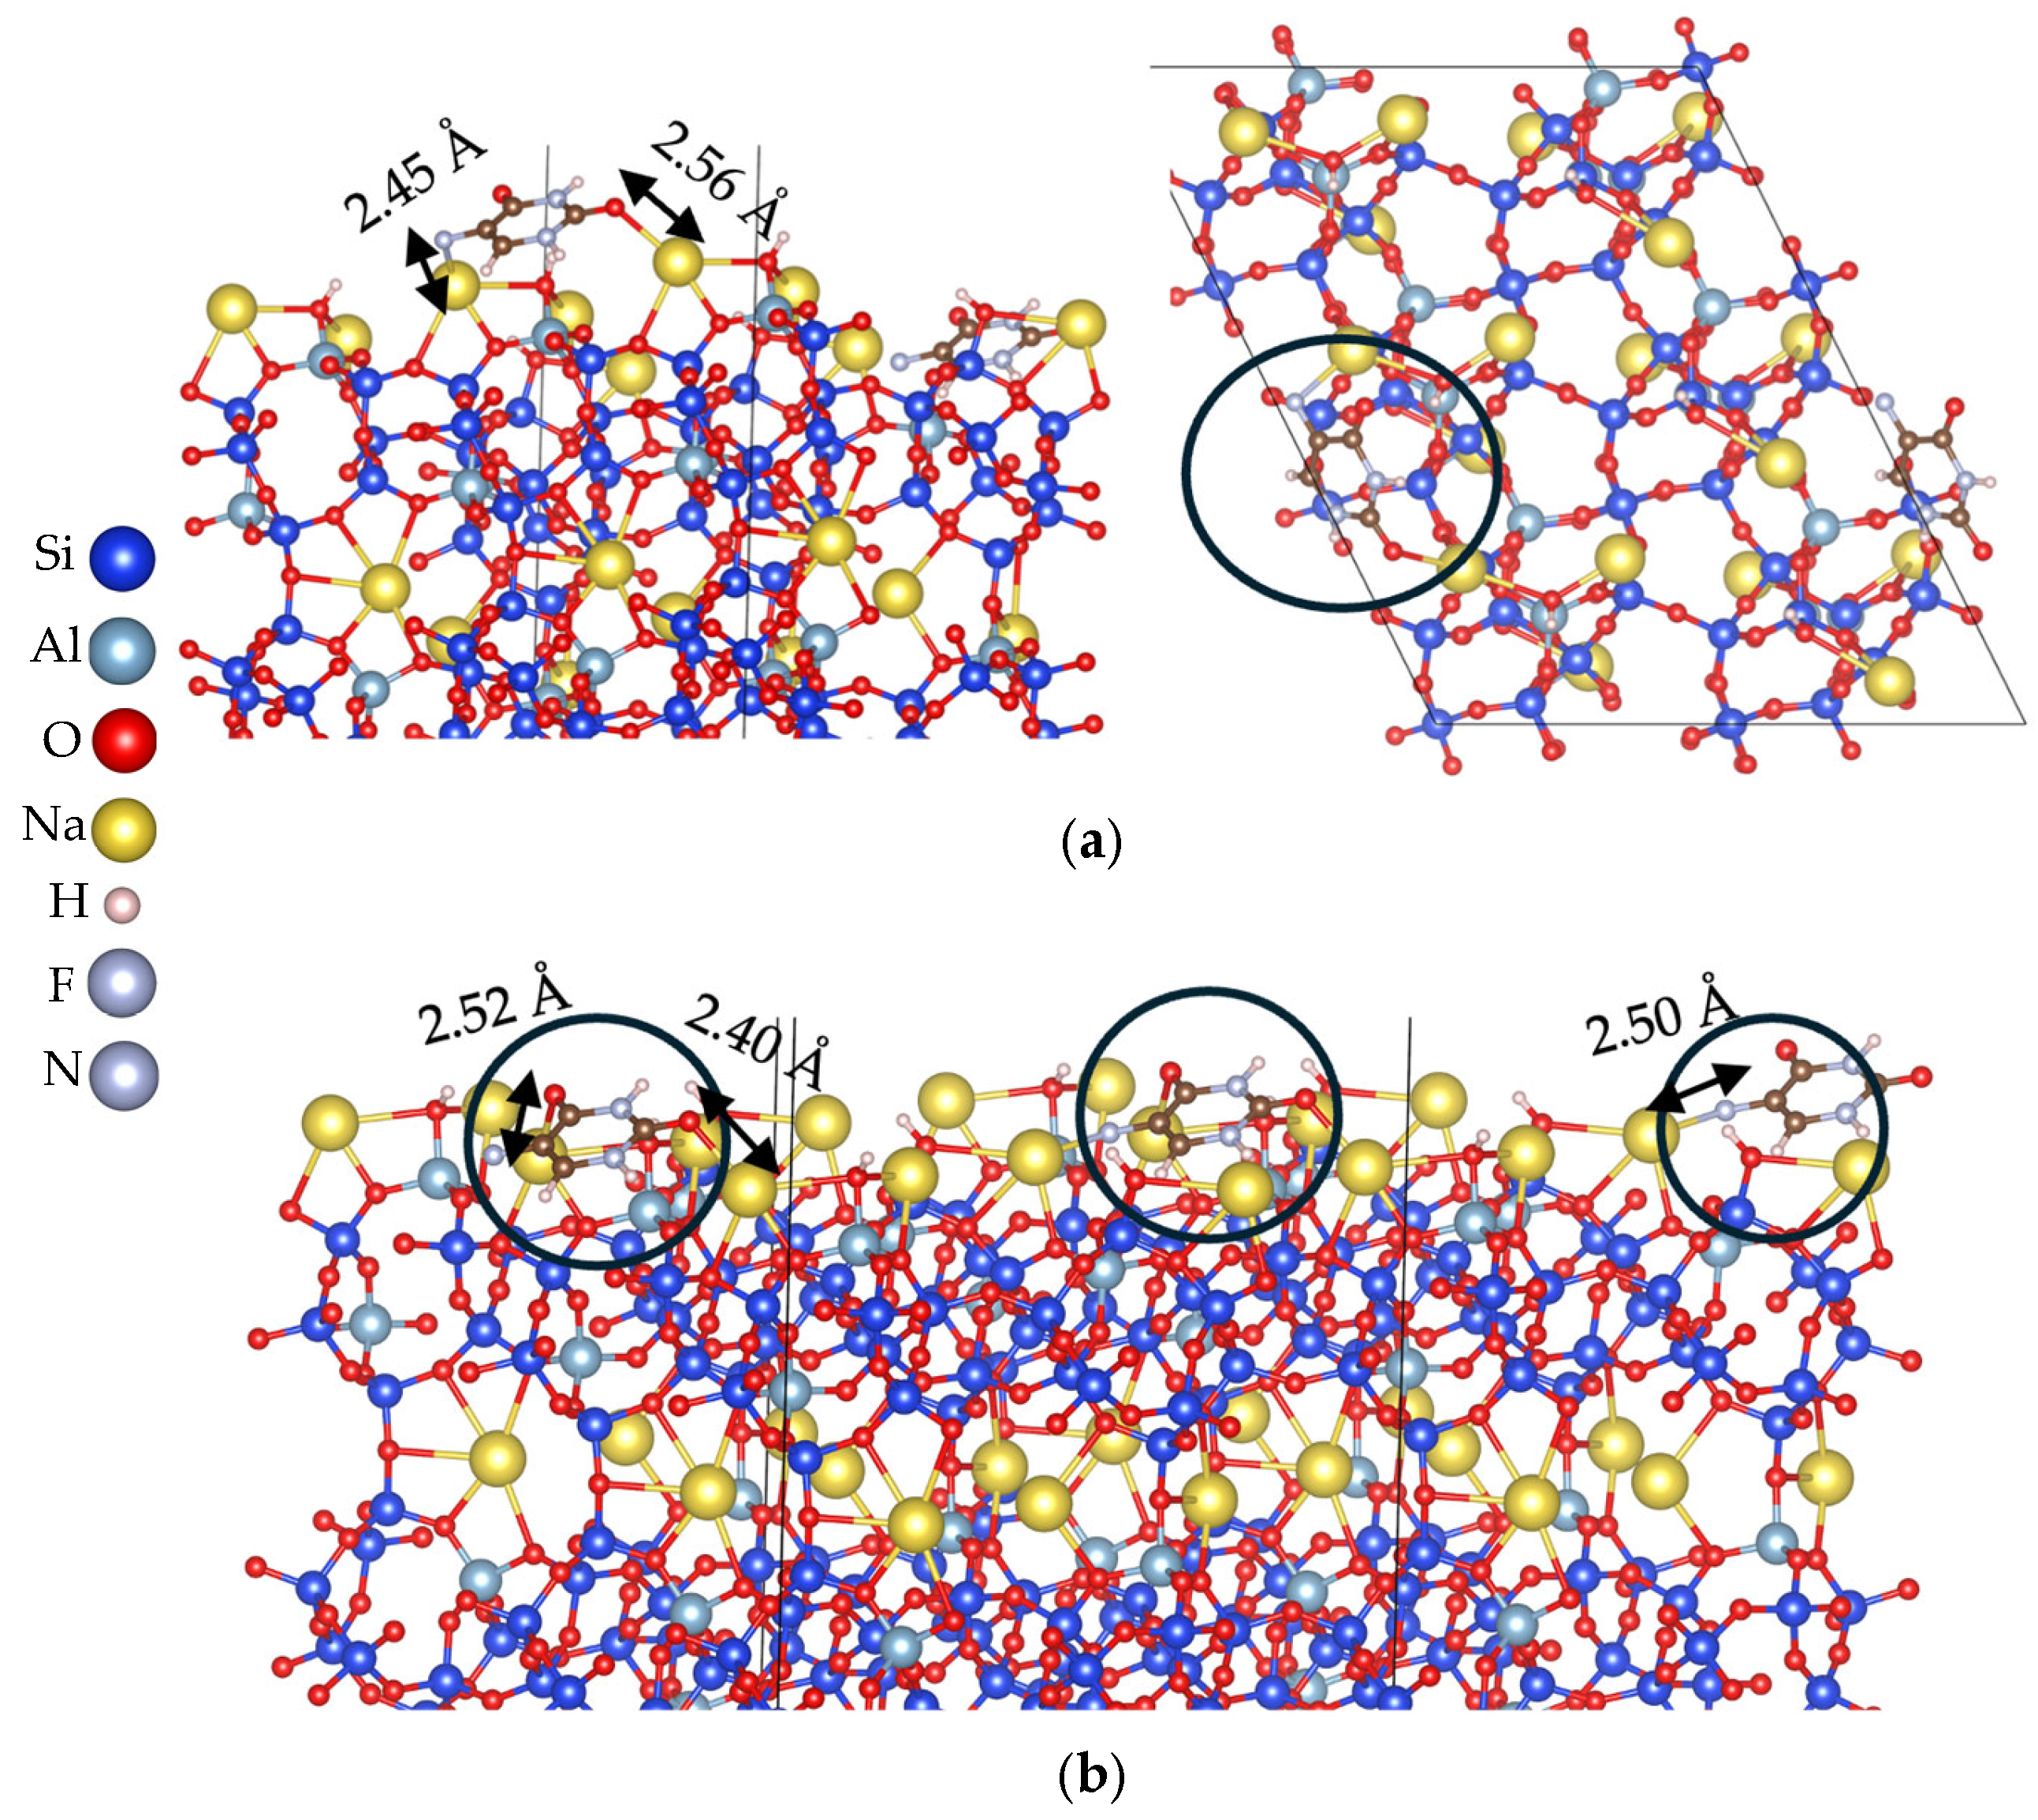
The corresponding geometries are shown in Figure 10. In the PR configuration (Figure 10a), the molecule again deeply penetrated the surface and interacted via one fluorine and one oxygen atom, forming Na–F and Na–O bonds with DFT-optimized lengths of 2.45 Å and 2.56 Å, respectively. In the SA configuration (Figure 10b), 5-FU binds through two oxygen atoms and one fluorine atom, forming Na–O and Na–F bonds of 2.52 Å, 2.40 Å, and 2.50 Å, respectively. Na-clin_1 exhibits longer bond lengths with the molecule and is therefore energetically less favorable than Na-clin_2, relatively. Shorter bond lengths (particularly for electrostatic interactions such as Na–O and Na–F) are a well-established indicator of stronger adsorption or binding affinity. These longer Na–O and Na–F distances, relative to those observed in Na-clin_2, contribute to the comparatively weaker adsorption strength. In Na-clin_2, the molecule is able to bind more tightly to the surface, as reflected in both the shorter bond lengths and lower adsorption energy.
Now we turn to Na-clin_6 (Figure 6f), which exhibited the most stable slab configuration among all models prior to adsorption, and after adsorption ranks the third. The most favorable configuration arises from SA with an adsorption energy of −374.9 kJ/mol, while the least stable among its top configurations is from PR sampling at −279.1 kJ/mol. The distribution of Na in this slab model leads to a complex situation. The presence of cations is not only at the center, but also near the periodic boundaries of the cell and hinders effective adsorption, limiting the space available for the 5-FU molecule to embed itself into the surface.
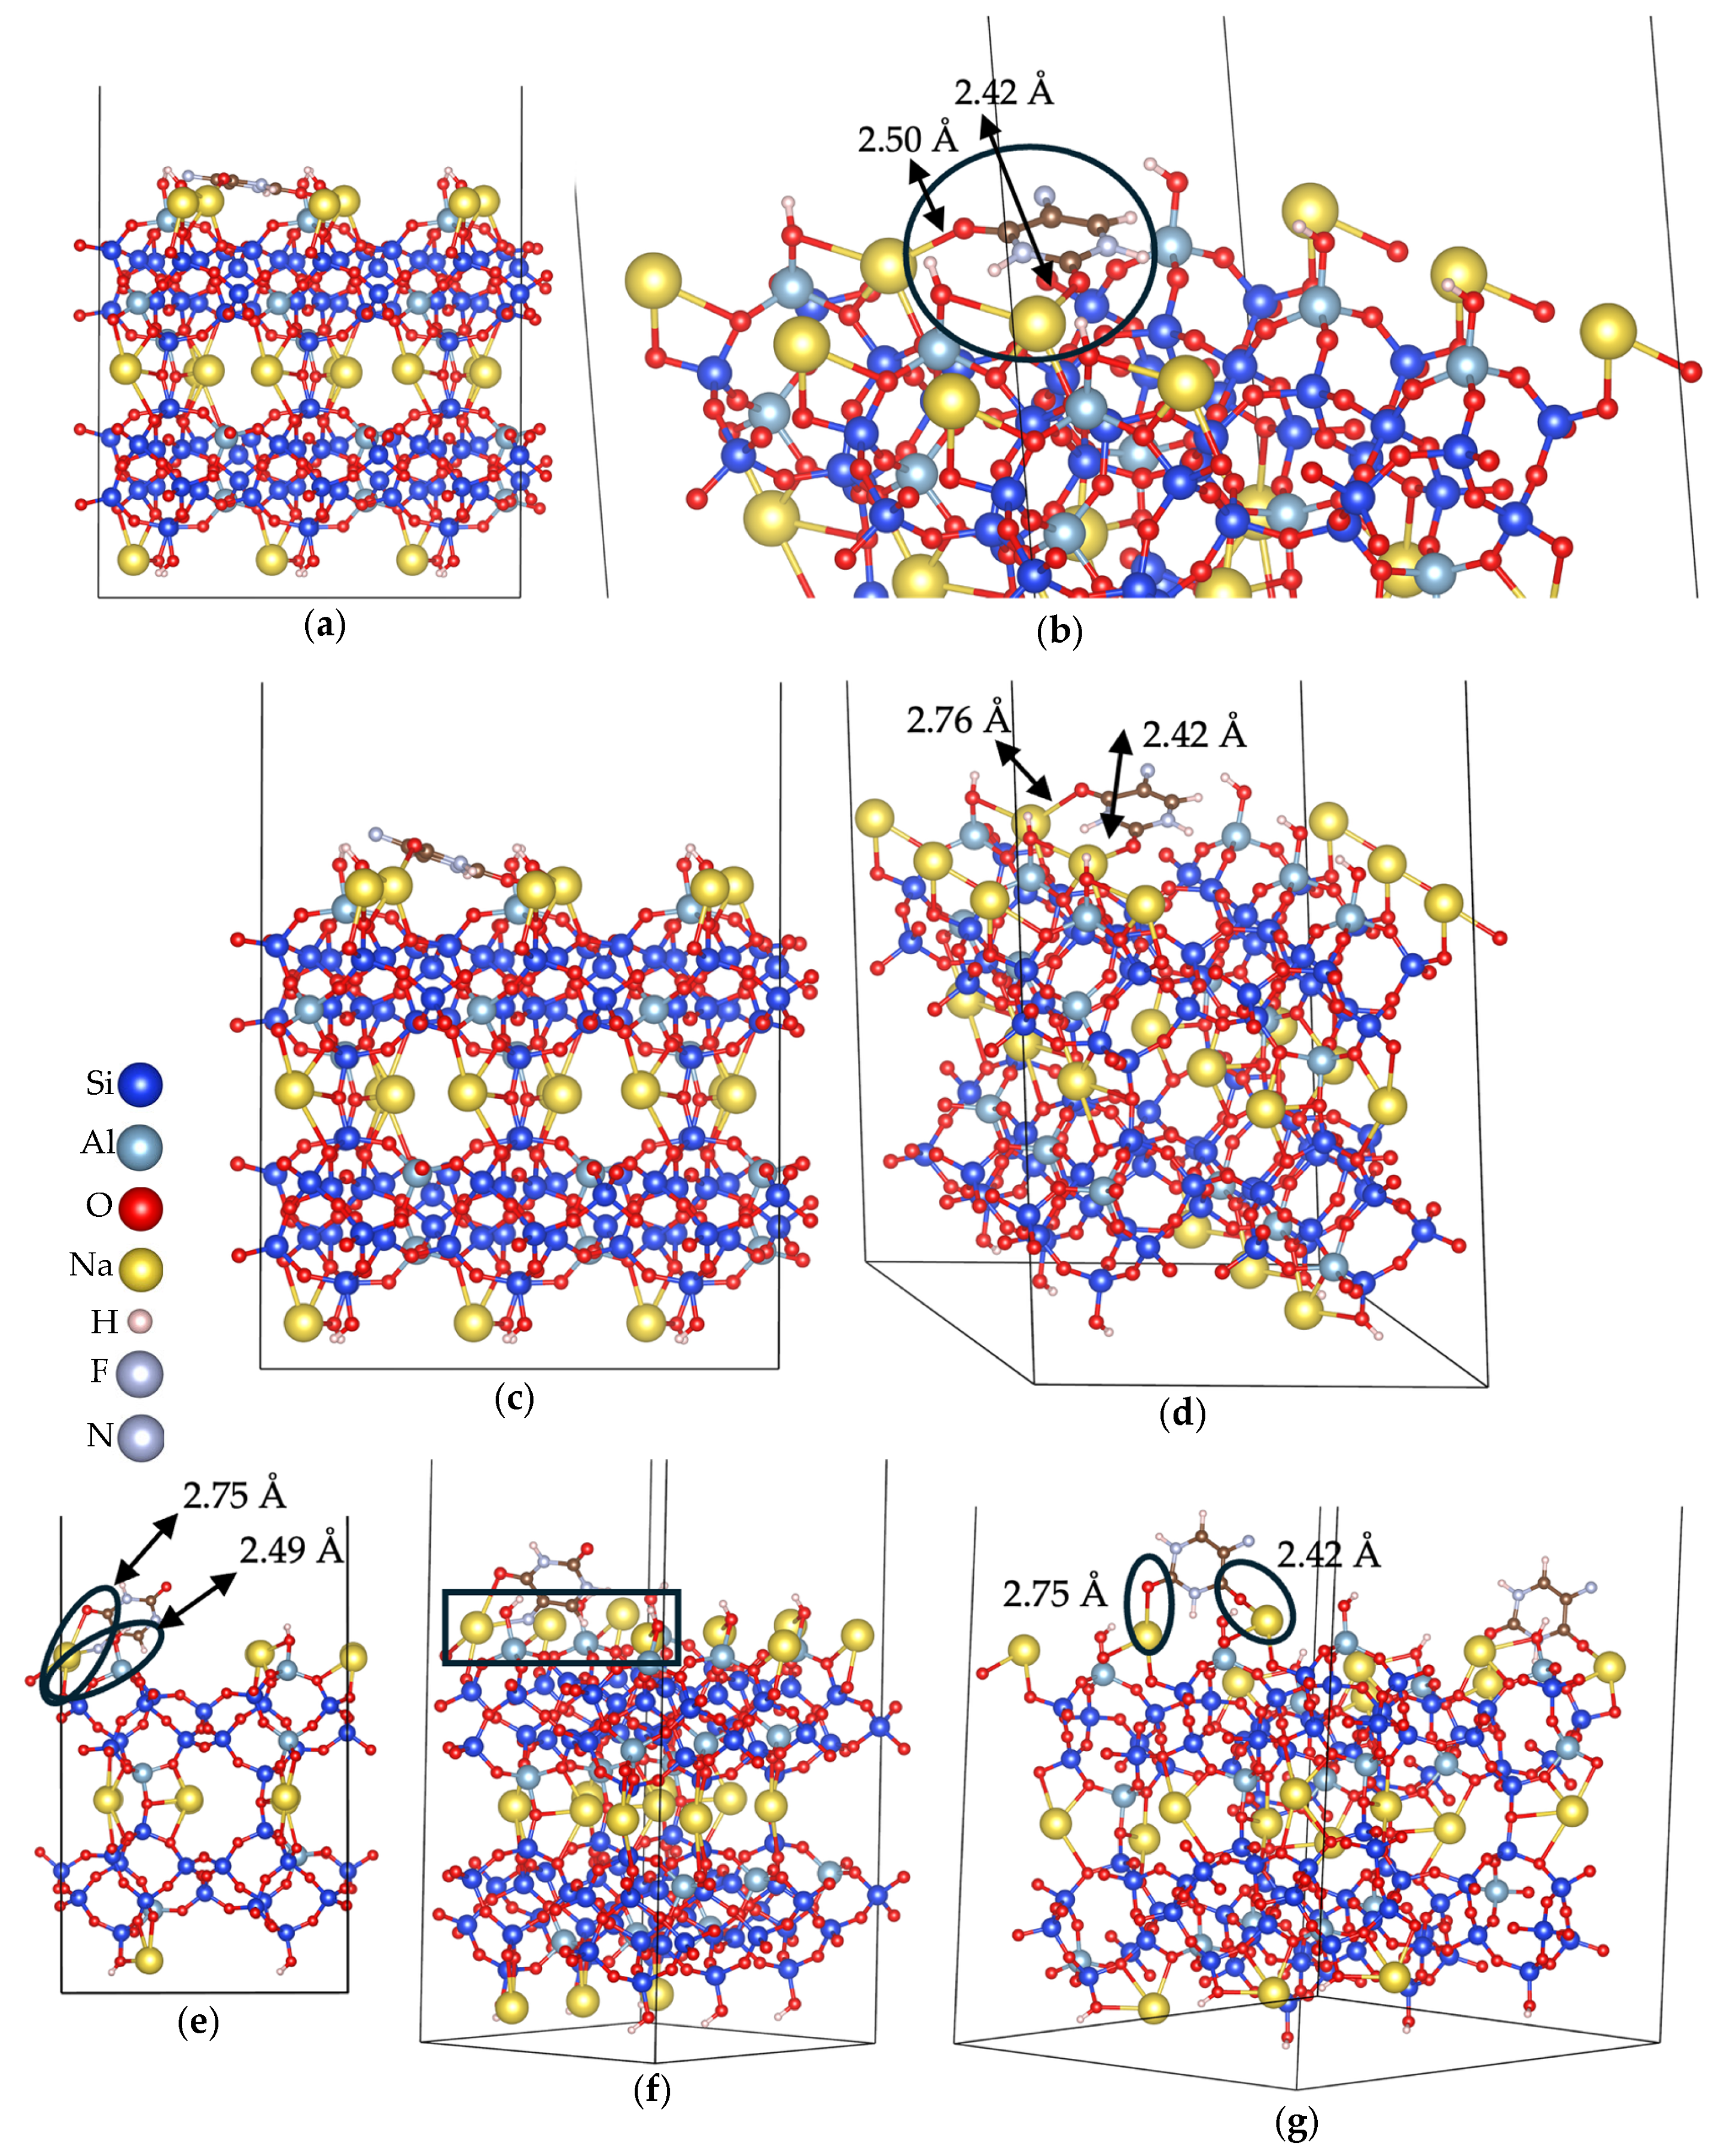
If we look at Figure 11a and Figure 11c (for SA and PR, respectively), both from the a-direction, we can see that the molecule is not as embedded in the surface between the two cations as in Figure 9 and Figure 10. Instead, it remains atop surface cations, unable to settle between them due to steric hindrance, though it still lies almost flat ‘on’ the surface, hence Figure 11b,d. This partial embedding is only feasible at the center of the slab, where some space remains. In contrast, Figure 11e,f shows configurations where the molecule is placed at a different position and is surrounded by four cations, forcing it to adopt an upright orientation and bind vertically rather than lying flat. This behavior is further influenced by the asymmetric placement of Al atoms and hydroxyl groups on one side of the cell, and the opposing cations on the other side (if we think about periodic boundary conditions), preventing the molecule from freely moving to those two sides and finally residing in an upright position in the middle between the two cations. The molecule in such cases was forced to bind in a less favorable configuration and/or stay farther away. Another representative configuration is shown in Figure 11g. The configurations shown in Figure 11e–g correspond to some of the least favorable adsorption cases for this surface model, with adsorption energies of −305.2 kJ/mol and −300.4 kJ/mol, respectively.
These structural features ultimately explain why Na-clin_6, despite being the most stable in its isolated form, ranks below Na-clin_2 in adsorption performance. The same reasoning also applies to Na-clin_1, where densely packed surface cations and hydroxyl groups create a cluttered electrostatic environment, preventing optimal molecular orientation and interaction. The DFT-optimized bond lengths further support this interpretation: in the SA configuration (Figure 11a,b), Na–O distances are 2.50 Å and 2.42 Å, whereas in the PR configuration (Figure 11c,d), they are 2.76 Å and 2.42 Å. These longer bond lengths reflect weaker electrostatic interactions relative to those observed in Na-clin_2, particularly considering the nature of Na as a coordinating cation. Among various extra-framework cations examined in our ongoing study, Na uniquely allows the molecule to embed more deeply into the surface, enabling stronger lateral interactions. In contrast, divalent cations such as Ca typically favor weaker, more vertical binding modes and this is their coordination preference. Additional bond length data and structural visualizations for all models are provided in the Supplementary Material for interested readers.
We also want to emphasize that the spread of adsorption energies from the lower to upper interquartile, as can be seen in Figure 8, observed for Na-clin_6 and/or other models, reflects the efficiency of the sampling methodologies employed in this study. Both SA and PR protocols successfully explored a diverse range of local minima, capturing not only the most favorable binding geometries, but also a distribution of less optimal configurations. This broad sampling is essential for robustly evaluating adsorption behavior across structurally complex surfaces. A complete discussion on how we conducted the PR sampling is available in the Supplementary Material.

3.2.2. Cation-Free Surfaces

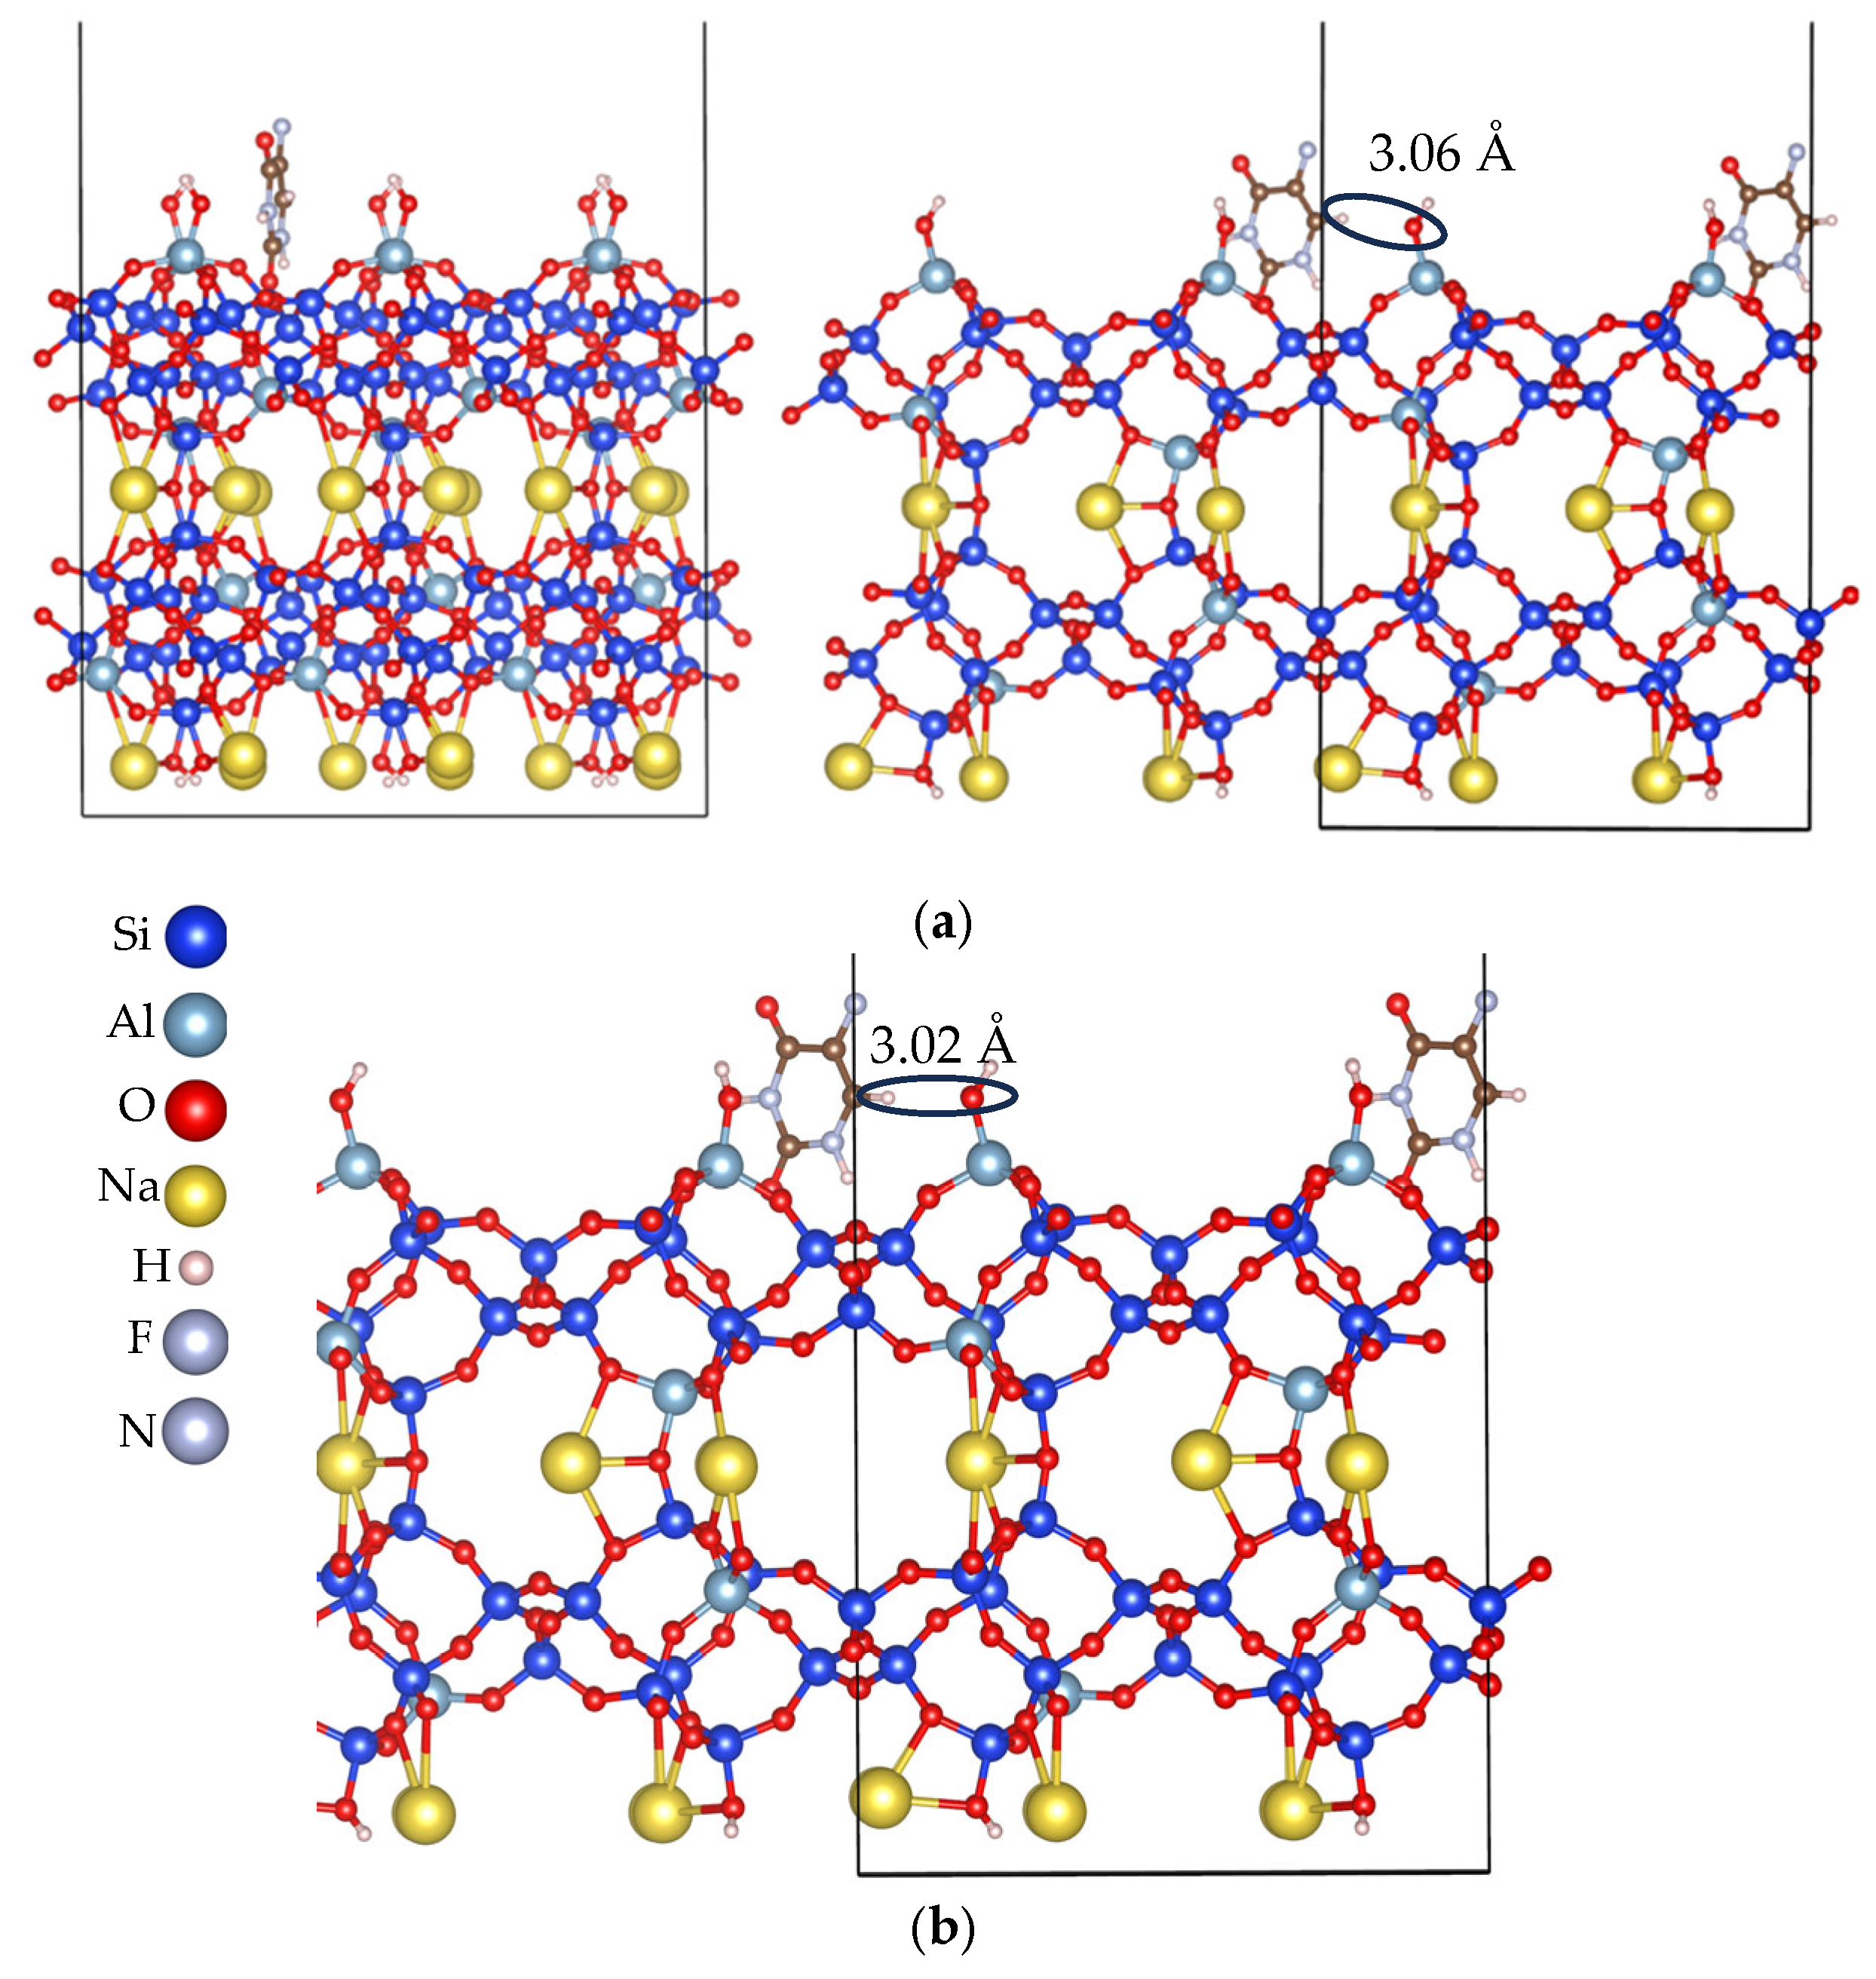
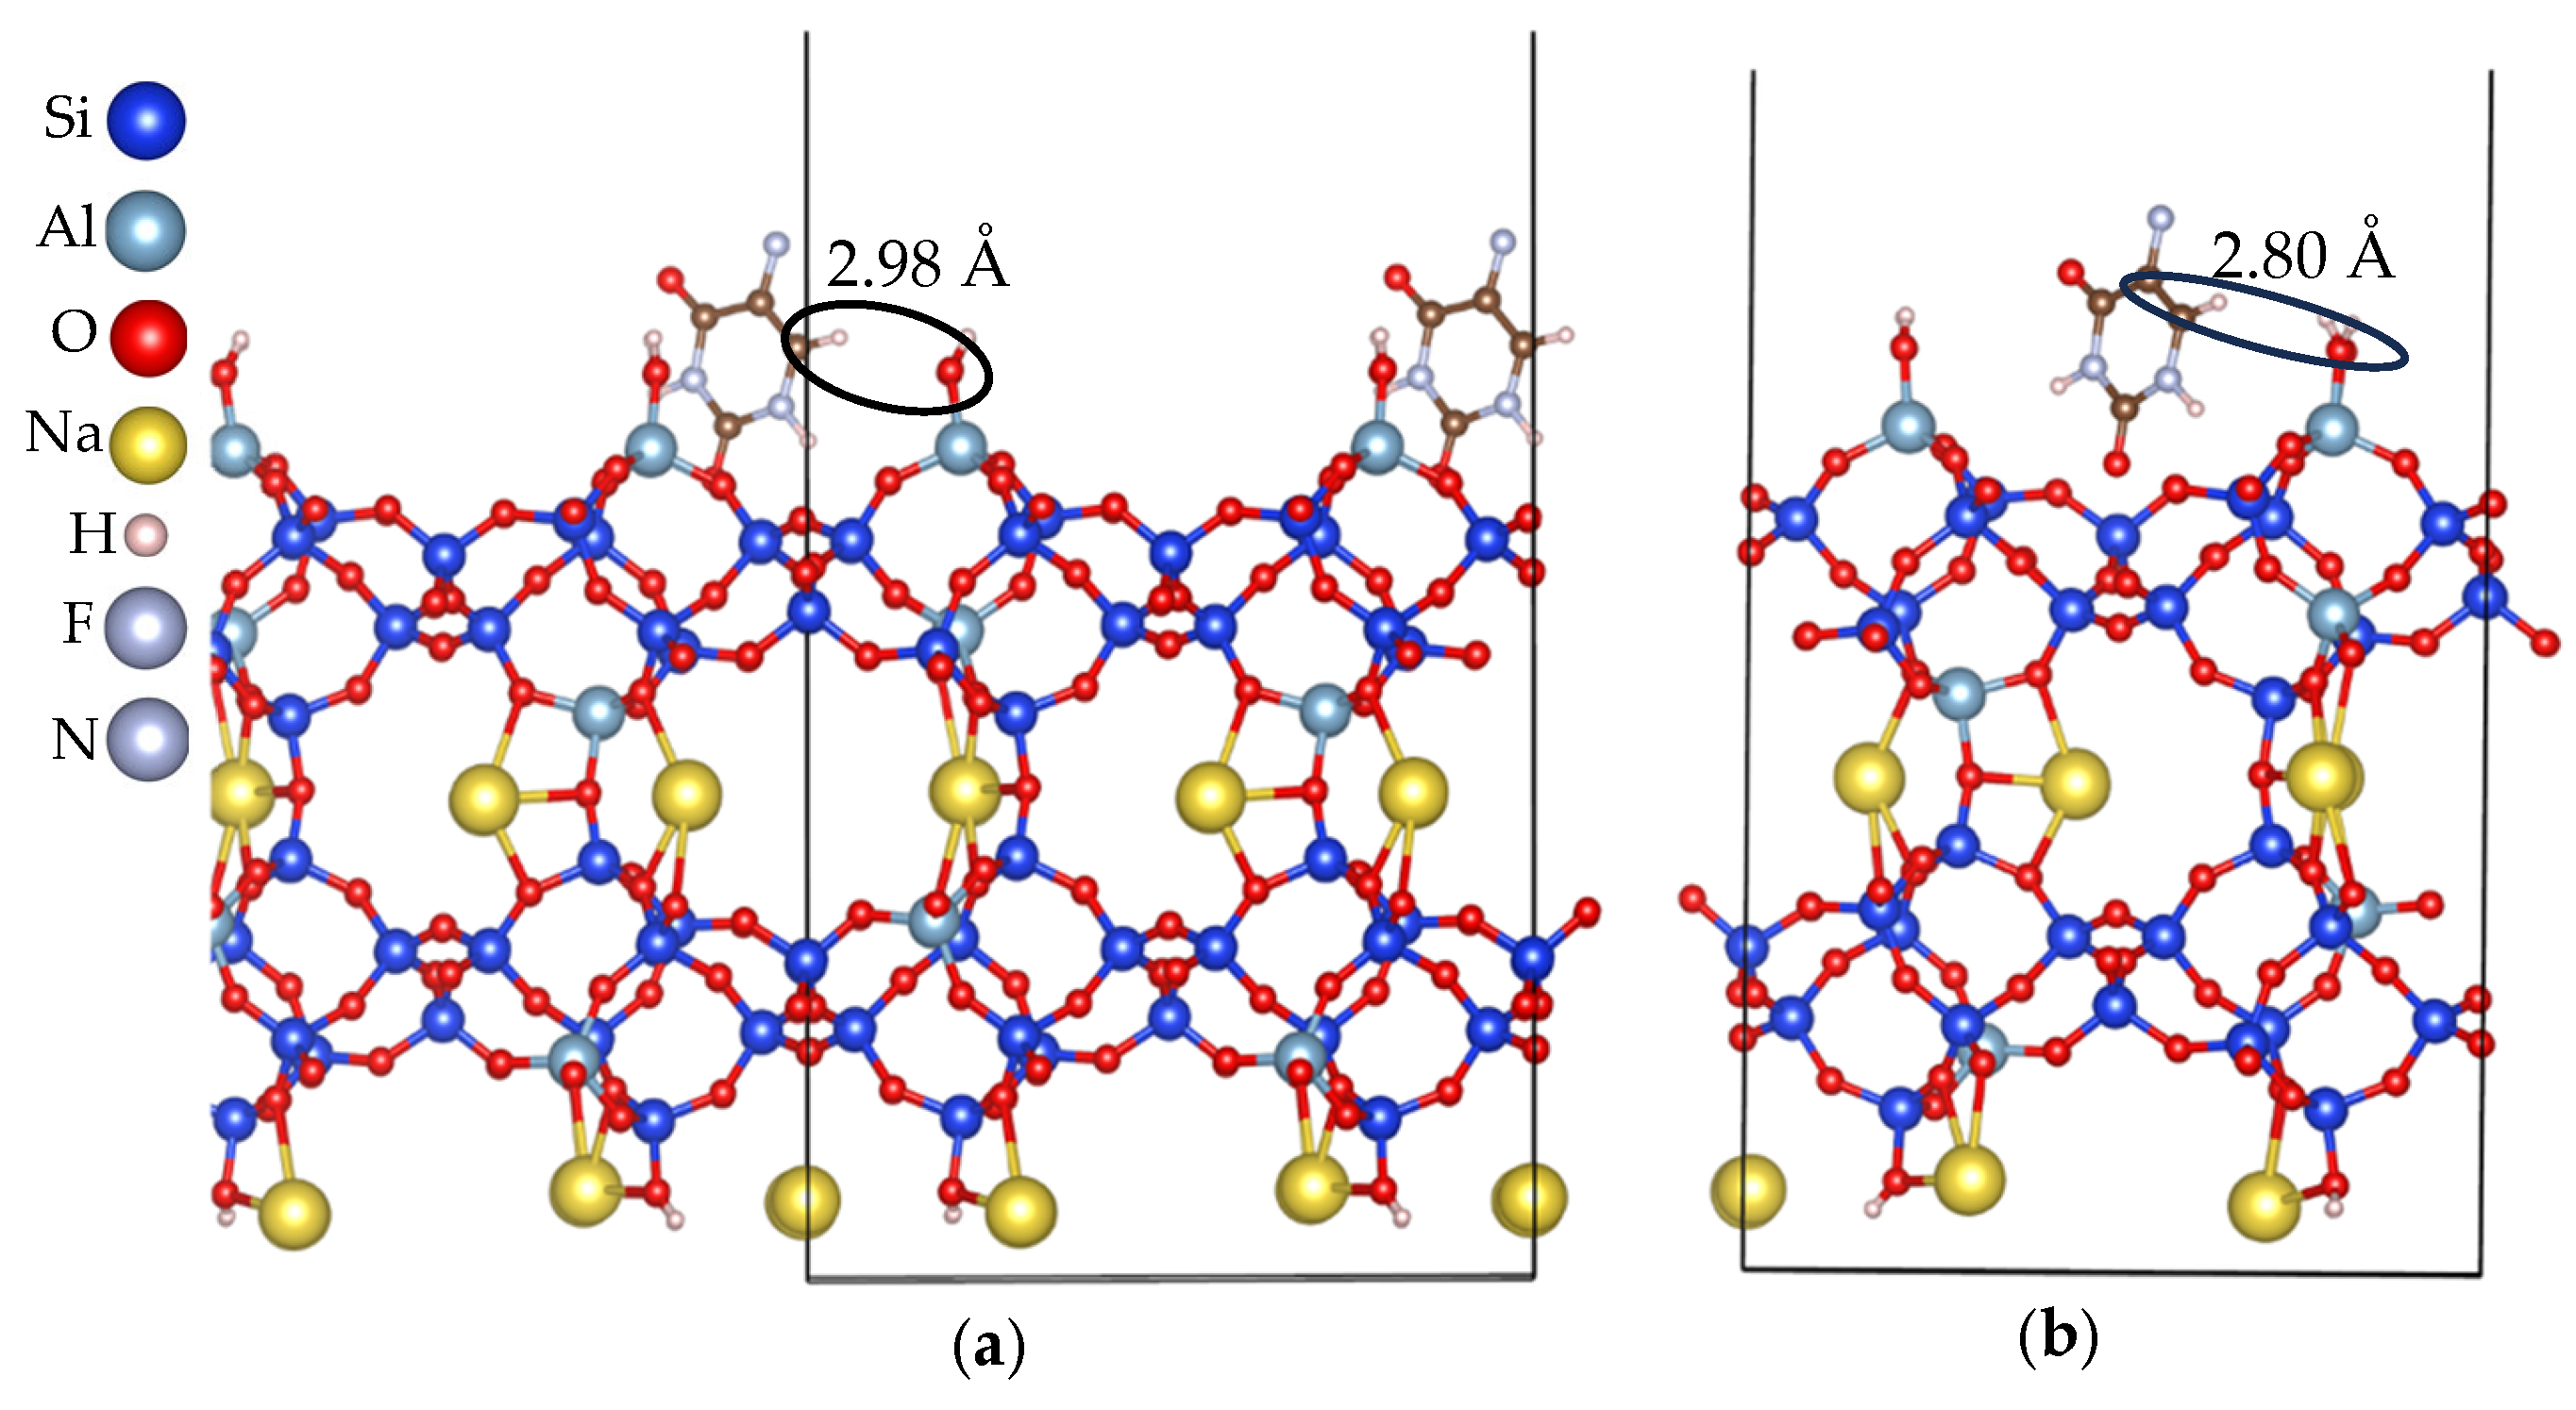
Now turning to the structures that lack surface-exposed cations—namely Na-clin_5, Na-clin_3, and Na-clin_4, corresponding to the slab models in Figure 6e, Figure 6c and Figure 6d, respectively—we observe a consistent trend of weaker adsorption performance, as illustrated in Figure 12, Figure 13 and Figure 14. These models exhibit the highest (i.e., least negative) adsorption energy values among the set, ranging from −288.2 kJ/mol to −174.4 kJ/mol. There could be several contributing factors for this. First, the reduction in adsorption strength stems primarily from the absence of cations at the surface. On the one hand, Na cations on the surface provide positively charged coordination sites that can interact strongly with electronegative atoms in 5-FU, such as oxygen atoms (from carbonyl groups) or fluorine atoms (highly electronegative). Without surface cations, there is a lack of strong electrostatic “anchors” to pull the molecule close and hold it in place. Surface cations enable specific directional interactions (e.g., Na–O bonds). When absent, 5-FU may only interact through weaker forces such as van der Waals interactions and hydrogen bonding. These are much weaker than direct ion–dipole or ion–lone-pair interactions. Without cations, the molecule does not become close enough to the surface framework for strong adsorption, hence no direct binding sites, causing the molecule to remain loosely associated or simply hover near the surface. In natural zeolites, extra-framework cations such as Na+, K+, or Ca2+ often serve as the active sites for adsorption of molecules; hence, removing them—or burying them too deep in the bulk—reduces surface reactivity.
On the other hand, without surface cations, the molecule can still show some level of adsorption due to weaker but still operative secondary interactions. Even in the absence of strong electrostatics or coordination, dispersion forces (London forces) between the molecular surface of 5-FU and the oxygen/silicon framework of the zeolite can cause weak physisorption. Moreover, if the surface has OH groups, which we added to terminate the dangling bonds, 5-FU can still donate hydrogen bonds via its N–H groups (H-bond donors) and accept hydrogen bonds via its carbonyl or fluorine atoms: this is also evident from the bond lengths analysis for our models here (see Supplementary Materials). These interactions are weaker than Na–O coordination but still contribute to a negative adsorption energy. Another contributing factor is the microporous or channel-like structure of clinoptilolite, which can reduce the entropic penalty of adsorption due to geometric confinement, and thus the molecule fits better into a cavity than in a vacuum. That is, those clinoptilolite channels restrict motion too, allowing the molecule to be gently held even in the absence of cations. Moreover, neutral frameworks can polarize in response to a nearby polar molecule such as 5-FU, and vice versa. This mutual polarization can create weak attractive interactions. Therefore, the adsorption is weaker than those of surfaces with cations, and the binding geometry is suboptimal with fewer contact points. Even these modest effects can yield adsorption energies of −100 to −200 kJ/mol or more—but are still much less favorable than cation-rich surfaces. As a matter of fact, the polarity of 5-FU will always make it responsive to charged or polar surfaces such as our zeolite slabs.
Interestingly, among the cation-free slab models, surfaces exposing the 8 MR channels exhibited stronger adsorption compared to those with 10 MR exposure, despite the latter offering larger pores. For example, Na-clin_5, shown in Figure 12, has its 8 MR exposed at the surface and shows an adsorption energy of −288.2 kJ/mol, followed by Na-clin_3, in Figure 13, that has again the 8 MR exposed and an adsorption energy of −274.5 kJ/mol. In contrast, Na-clin_4, which exposes the 10 MR channel in Figure 14, exhibits a relatively weaker adsorption energy of −220.9 kJ/mol.
Upon closer structural inspection, this counterintuitive trend can be rationalized by examining the spatial arrangement of the surface hydroxyl groups introduced after slab termination. In the absence of cations, an 8 MR-exposed surface can offer better adsorption than the 10 MR since it presents a better curvature or orientation for hydrogen bonding, aligns better with the electrostatic features of 5-FU, allows for closer multi-point surface interactions, and more importantly creates subtle entropic confinement at the surface. In the 8 MR models, the OH groups are positioned more closely together, creating a more confined and cooperative hydrogen bonding environment. That is, they are oriented in opposite directions, creating a better polar environment that enhances hydrogen bonding with 5-FU. This allows the 5-FU molecule to form multiple simultaneous interactions, including N–H···O and F···H–O hydrogen bonds, effectively anchoring the molecule more strongly to the surface.
In contrast, on the 10 MR-exposed surfaces, the wider spacing of functional groups results in fewer stabilizing contacts and a more diffuse interaction landscape. The OH groups in this channel tend to point in the same direction, possibly reducing their net dipolar contribution and weakening their ability to stabilize the adsorbate. This highlights how not only the presence of surface terminations, but also their geometric arrangement, critically govern adsorption strength, particularly in systems lacking cationic coordination sites.
While both the center and boundary regions of the slab may expose similar structural units, such as 8 MR or 10 MR rings, the boundaries often exhibit enhanced local polarity or electrostatic asymmetry. First, this arises due to termination effects; that is, when cleaving the crystal, atoms at the slab boundaries (especially at the corners or edges) may have unsaturated coordination or altered local environments, leading to stronger localized dipoles. Second, hydroxyl terminations: these OH groups, especially near edges, can be more densely packed or differently oriented, producing a more polar microenvironment. Third, field gradients: polar or charged terminations at the slab boundaries can create electrostatic potential gradients that enhance molecular anchoring. This increased polarity near slab boundaries could indeed promote stronger adsorption, even without cations—especially for polar molecules such as 5-FU, which can engage via hydrogen bonding or dipole–dipole interactions; therefore, we can observe better adsorption performance in Na-clin_3 and Na-clin_5 than in Na-clin_4, even though they all have some configurations that confined the molecule in the 8 MR. The below Table 1 summarizes the most stable configurations, the number of Na cations exposed at each surface structure, the exposed channels for cation-free surfaces, and the corresponding lowest adsorption energies.

3.3. Comparison with Other Experimental and Computational Works

Experimental loading data of zeolite Y (HY) experiments report ≈0.1 g 5-FU per g zeolite (90–110 mg g−1) across Si/Al = 2.5–30, but release is strongly suppressed in the most Al-rich sample, consistent with strong binding to EFAL (extra-framework Al)/Lewis sites [12]. More Si-rich samples release >50% of 5-FU within minutes. For clinoptilolite, Na-”green”-functionalized samples show much higher experimental loadings, ≈291–462 mg g−1, again pointing to strong host–guest affinity in Na-rich HEU pores [2]. Dispersion-corrected DFT for FAU finds adsorption energies ranging from −73 kJ/mol (all-silica FAU) to ≈−144 kJ/mol with one Brønsted proton per 12 MR, and up to ≈−179 kJ/mol when two protons cooperate (“multi-site” H-bonding) [10]. More studies are presented in the below Table 2 that compiles representative adsorption energies reported in the literature for various reactive surfaces and compares them with the values obtained in this work for clinoptilolite surfaces.
The comparison in Table 2 positions our most stable 5-FU adsorption configuration on Na-clinoptilolite (−430 kJ/mol) at the lower bound of the “very strong chemisorption” regime, confirming that the magnitudes we observe are physically reasonable. In general, surface adsorption energies are higher (more negative) than those in bulk environments; one of the main contributing factors is that surface atoms are undercoordinated and thus more chemically reactive, offering stronger binding sites for adsorbates. Our most negative Eads (−430 kJ/mol) occurs for a configuration where 5-FU simultaneously coordinates to multiple Na cations, i.e., a multi-point, cation-assisted binding motif. Such multi-site coordination can yield substantially more negative energies than the FAU cases dominated by H-bonding to Brønsted sites. While our magnitude is more negative than the FAU values reported above, the qualitative trend—stronger binding with more local cationic/acidic contacts and tighter confinement—is consistent with both DFT trends in zeolites and the high experimental loadings observed for Na-rich clinoptilolite carriers. Methodological differences—functional, BSSE treatment, supercell size, and definition of Eads—also contribute to cross-study offsets.
Our most negative Eads (−430 kJ/mol) is also attributed to an optimal, well-spaced distribution of Na cations that maximizes electrostatic stabilization and hydrogen-bonding potential without sterically blocking access to the surface. In contrast, models with cations clustered at slab edges, such as Na-clin_6, restrict molecular approach and reduce adsorption strength. Furthermore, the inherent polarity of the clinoptilolite slabs—arising from their asymmetric cation distribution and exposed framework oxygens—enhances the surface’s ability to interact strongly with polar functional groups in the adsorbate, further contributing to the high adsorption energies observed.
As a matter of fact, the strong adsorption of 5-FU on Na-clinoptilolite surfaces in general arises from multiple concurrent donor–acceptor interactions. The carbonyl oxygen atoms of 5-FU act as electron pair donors, coordinating to extra-framework Na cations, which serve as strong electron pair acceptors. In addition, N–H groups in 5-FU function as hydrogen bond donors to framework oxygen atoms, which in turn act as hydrogen bond acceptors, thus having a directional electrostatic attraction type of bonding along with some induction and some dispersion contributions. Likewise, weaker C-H···O interactions may occur, where polarized C-H groups of 5-FU provide supplementary hydrogen bonds to framework oxygens. In our configurations, several of these interactions occur simultaneously (multiple donor–acceptor interactions happen at the same time), resulting in cooperative stabilization that significantly exceeds the strength of individual Na+–O or N–H···O contacts. This multi-site binding mode, dominated by strong electrostatic coordination complemented by hydrogen bonding, explains the exceptionally large adsorption energies obtained for Na-rich surfaces.

3.4. Implications of Our Trends for Experimental Design

This work can offer valuable insights for guiding experimental strategies; for example, enriching Na near 8 MR windows (M2 sites or channel B [18]) via ion exchange protocols that favor Na over K at those positions. This can also avoid K buildup at M3 to limit pore blocking. Second: tailoring slab preparation to preferentially expose 8 MR terminations may be advantageous, as these consistently yield lower Eads and stronger binding. Third: controlling hydration—through pre-drying or employing low-water processing during drug loading—is critical, since co-adsorbed water strongly competes for acidic/cationic sites and can displace 5-FU in protonic zeolites; minimizing water content therefore improves effective binding. Fourth: moderating the Al distribution (Si/Al ratio) so that placing framework Al near 8 MR windows helps stabilize Na at M2 positions and strengthen local electrostatic interactions with 5-FU carbonyls; excessive EFAL in highly Al-rich HY zeolites, for example, leads to over-stabilization and hinders drug release.

3.5. Charge Transfer/Protonation State of 5-FU at the Surface

For our Na-clinoptilolite context, in the absence of framework Brønsted protons, 5-FU remains predominantly neutral and interacts via electrostatics and polarization (carbonyl-O···Na+, occasional F···Na+, and H-bonding to framework O). Substantial net charge transfer is not expected for Na+–carbonyl coordination—i.e., the binding is ionic/coordination-dominated rather than redox/charge transfer-driven.

3.6. Entropic Effects

At the end of our discussion, we need to highlight an important point. While adsorption energies reported in this work correspond to 0 K electronic energies, finite-temperature corrections—such as vibrational and configurational entropy—are generally modest for rigid, strongly bound adsorbates in such zeolitic environments. Vibrational entropy losses upon adsorption are limited because most intramolecular modes of 5-FU remain largely unchanged, with only a subset stiffening due to surface coordination, leading to corrections typically <4–8 kJ/mol as reported by Galimberti et al. for small alkane adsorption in zeolites [78]. Another work [79], introducing a descriptor-based model to predict adsorption entropy variations with confinement, showed how entropy is reduced systematically in tighter or more restricted environments such as zeolites.
Configurational entropy is also reduced in the adsorbed state; however, the comprehensive sampling strategies employed in this work already covered nearly the entire accessible configurational space, thereby implicitly accounting for the range of possible orientations and binding modes. For these reasons, we expect entropic effects to very slightly shift absolute adsorption energies, but not to alter the qualitative trends discussed in this study.

4. Conclusions and Outlook

In this study, we presented a robust and computationally efficient multiscale approach for investigating the adsorption behavior of 5-FU on various Na-clinoptilolite surface models. By combining classical force field methods, exhaustive sampling strategies—specifically simulated annealing and parallel replica—and subsequent DFT-D3 refinement, we identified key structural and energetic trends that govern molecular adsorption in natural zeolites.
Our findings demonstrate that, in most cases, surface models with the lowest slab-free energies also exhibit the strongest adsorption performance. However, additional factors—including cation distribution at the surface and the nature of the exposed channel (8 MR vs. 10 MR)—can play a decisive role. Notably, surface-exposed cations significantly enhance adsorption by offering strong electrostatic interaction sites. Surfaces with well-distributed Na cations, or in other words, surfaces with no clutter of cations, yield significantly more stable configurations.
We observed too that even in the absence of surface cations, weaker but non-negligible adsorption arises due to hydrogen bonding and dispersion interactions, particularly when 8 MR channels and polar OH terminations are exposed. Interestingly, surface terminations exposing 8 MR channels offered stronger adsorption than those with larger 10 MR openings.
The proposed workflow not only highlights the value of different methods for discovering low-energy geometries but also provides a transferable and reproducible framework for studying surface reactivity across a wide range of zeolitic materials and adsorbates. In our future work, we will extend this methodology to examine the role of different extra-framework cations to better understand how cation type and distribution influence adsorption dynamics. Based on preliminary insights, Na-clinoptilolite—owing to its mono-cationic nature and the type of cation itself—emerges as the most favorable candidate for adsorption among the other cationic systems considered.

Supplementary Materials

The following supporting information can be downloaded at: https://www.mdpi.com/article/10.3390/app15179535/s1. They appear as follows in the text. Surface models Python script: Supplementary_Material.pdf (S1), Kpoints convergence tests comparison: 1. KPOINTS.xlsx. Calculation of cross-terms: Supplementary_Material.pdf (S2). LAMMPS input parameters: Supplementary_Material.pdf (S3 and S4), files (FU_box_PCFF.data, Na-surface_IFF.data & fluorouracil.txt). Adsorption energies: 2.adsorption_energies_for_all_6_models folder. Python script for visualizations of the MD trajectories: Supplementary_Material.pdf (S5). CIFs of the most stable structures: 3.CIF_most-stable_after-DFT-optimiz folder. CP2K input for surface models: Supplementary_Material.pdf (S6). Calculated free energies of the slab models: Supplementary_Material.pdf (S7). Bond lengths: 4. Bond-lengths-of-all-models folder. LAMMPS acceptance ratio script and PR discussion: Supplementary_Material (S8 & S9). References [80,81] are cited in the ‘Supplementary_Material’ PDF document.

Author Contributions

Conceptualization, L.S. and M.F.; Methodology, L.S.; Formal analysis, L.S.; Investigation, L.S.; Data curation, L.S.; Writing—original draft, L.S.; Writing—review & editing, L.S. and M.F.; Supervision, M.F.; Project administration, M.F.; Funding acquisition, M.F. All authors have read and agreed to the published version of the manuscript.

Funding

MF is funded by the Deutsche Forschungsgemeinschaft (German Research Foundation, DFG) through a Heisenberg fellowship (project no. 455871835). The authors thank the Central Research Development Funds of the University of Bremen for funding in the context of the funding line 05: Focus Projects.

Institutional Review Board Statement

Not applicable.

Informed Consent Statement

Not applicable.

Data Availability Statement

The original contributions presented in this study are included in the article/supplementary material. Further inquiries can be directed to the corresponding author.

Acknowledgments

The authors gratefully acknowledge the computing time granted by the Resource Allocation Board and provided on the supercomputer Lise and Emmy at NHR@ZIB and NHR@Göttingen as part of the NHR infrastructure. The calculations for this research were conducted with computing resources under project hbc00062. LS gratefully acknowledges Mustafa Awd for taking the time to read and proof the manuscript, and for the thoughtful remarks that helped improve its quality. Special thanks to Paul Klar for his insightful guidance and constructive discussions on crystallography. We thank Jakob Brauer too for the fruitful discussions on LAMMPS.

Conflicts of Interest

The authors declare no conflicts of interest.

References

  1. PubChem Fluorouracil. Available online: https://pubchem.ncbi.nlm.nih.gov/compound/3385 (accessed on 7 July 2025).
  2. Sayed, M.A.; El-Zeiny, H.M.; Khim, J.S.; Ajarem, J.S.; Allam, A.A.; Abukhadra, M.R. Insight into the Loading Properties of Na+ Green-Functionalized Clinoptilolite as a Potential Carrier for the 5-Fluorouracil Drug, Its Release Kinetics, and Cytotoxicity. ACS Omega 2022, 7, 6991–7001. [Google Scholar] [CrossRef]
  3. Zhang, N.; Yin, Y.; Xu, S.-J.; Chen, W.-S. 5-Fluorouracil: Mechanisms of Resistance and Reversal Strategies. Molecules 2008, 13, 1551–1569. [Google Scholar] [CrossRef] [PubMed]
  4. Azwar, S.; Seow, H.F.; Abdullah, M.; Faisal Jabar, M.; Mohtarrudin, N. Recent Updates on Mechanisms of Resistance to 5-Fluorouracil and Reversal Strategies in Colon Cancer Treatment. Biology 2021, 10, 854. [Google Scholar] [CrossRef]
  5. Ghafouri-Fard, S.; Abak, A.; Tondro Anamag, F.; Shoorei, H.; Fattahi, F.; Javadinia, S.A.; Basiri, A.; Taheri, M. 5-Fluorouracil: A Narrative Review on the Role of Regulatory Mechanisms in Driving Resistance to This Chemotherapeutic Agent. Front. Oncol. 2021, 11, 658636. [Google Scholar] [CrossRef]
  6. Long, S.; Wang, J.; Weng, F.; Pei, Z.; Zhou, S.; Sun, G.; Xiang, D. ECM1 Regulates the Resistance of Colorectal Cancer to 5-FU Treatment by Modulating Apoptotic Cell Death and Epithelial-Mesenchymal Transition Induction. Front. Pharmacol. 2022, 13, 1005915. [Google Scholar] [CrossRef]
  7. Noordhuis, P.; Holwerda, U.; der Wilt, C.L.V.; Groeningen, C.J.V.; Smid, K.; Meijer, S.; Pinedo, H.M.; Peters, G.J. 5-Fluorouracil Incorporation into RNA and DNA in Relation to Thymidylate Synthase Inhibition of Human Colorectal Cancers. Ann. Oncol. 2004, 15, 1025–1032. [Google Scholar] [CrossRef]
  8. Hao, J.; Stavljenić Milašin, I.; Batu Eken, Z.; Mravak-Stipetic, M.; Pavelić, K.; Ozer, F. Effects of Zeolite as a Drug Delivery System on Cancer Therapy: A Systematic Review. Molecules 2021, 26, 6196. [Google Scholar] [CrossRef]
  9. Spanakis, M.; Bouropoulos, N.; Theodoropoulos, D.; Sygellou, L.; Ewart, S.; Moschovi, A.M.; Siokou, A.; Niopas, I.; Kachrimanis, K.; Nikolakis, V.; et al. Controlled Release of 5-Fluorouracil from Microporous Zeolites. Nanomedicine 2014, 10, 197–205. [Google Scholar] [CrossRef]
  10. Fischer, M. Adsorption of 5-Fluorouracil, an Anticancer Drug, in Faujasite-Type Zeolites: Understanding Storage and Release with Density Functional Theory Calculations. CrystEngComm 2024, 26, 3795–3807. [Google Scholar] [CrossRef]
  11. Vilaça, N.; Amorim, R.; Machado, A.F.; Parpot, P.; Pereira, M.F.R.; Sardo, M.; Rocha, J.; Fonseca, A.M.; Neves, I.C.; Baltazar, F. Potentiation of 5-Fluorouracil Encapsulated in Zeolites as Drug Delivery Systems for in Vitro Models of Colorectal Carcinoma. Colloids Surf. B Biointerfaces 2013, 112, 237–244. [Google Scholar] [CrossRef] [PubMed]
  12. Datt, A.; Burns, E.A.; Dhuna, N.A.; Larsen, S.C. Loading and Release of 5-Fluorouracil from HY Zeolites with Varying SiO2/Al2O3 Ratios. Microporous Mesoporous Mater. 2013, 167, 182–187. [Google Scholar] [CrossRef]
  13. Abd-Elsatar, A.G.; Farag, M.M.; Youssef, H.F.; Salih, S.A.; Mounier, M.M.; El-Meliegy, E. Different Zeolite Systems for Colon Cancer Therapy: Monitoring of Ion Release, Cytotoxicity and Drug Release Behavior. Prog Biomater 2019, 8, 101–113. [Google Scholar] [CrossRef]
  14. Klimeš, J.; Tew, D.P. Efficient and Accurate Description of Adsorption in Zeolites. J. Chem. Phys. 2019, 151, 234108. [Google Scholar] [CrossRef]
  15. Simonetti, S.; Compañy, A.D.; Pronsato, E.; Juan, A.; Brizuela, G.; Lam, A. Density Functional Theory Based-Study of 5-Fluorouracil Adsorption on β-Cristobalite (1 1 1) Hydroxylated Surface: The Importance of H-Bonding Interactions. Appl. Surf. Sci. 2015, 359, 474–479. [Google Scholar] [CrossRef]
  16. Tran, R.; Xu, Z.; Radhakrishnan, B.; Winston, D.; Sun, W.; Persson, K.A.; Ong, S.P. Surface Energies of Elemental Crystals. Sci Data 2016, 3, 160080. [Google Scholar] [CrossRef]
  17. Sun, W.; Ceder, G. Efficient Creation and Convergence of Surface Slabs. Surf. Sci. 2013, 617, 53–59. [Google Scholar] [CrossRef]
  18. Saeed, L.; Fischer, M. Computational Insights into Aluminum and Cation Placement in Clinoptilolite: Optimizing DFT Parameters for Natural Zeolites, Part I. Appl. Sci. 2025, 15, 3955. [Google Scholar] [CrossRef]
  19. Ong, S.P.; Richards, W.D.; Jain, A.; Hautier, G.; Kocher, M.; Cholia, S.; Gunter, D.; Chevrier, V.L.; Persson, K.A.; Ceder, G. Python Materials Genomics (Pymatgen): A Robust, Open-Source Python Library for Materials Analysis. Comput. Mater. Sci. 2013, 68, 314–319. [Google Scholar] [CrossRef]
  20. Momma, K.; Izumi, F. VESTA 3 for Three-Dimensional Visualization of Crystal, Volumetric and Morphology Data. J Appl Cryst 2011, 44, 1272–1276. [Google Scholar] [CrossRef]
  21. VESTA. Available online: https://jp-minerals.org/vesta/en/ (accessed on 23 June 2025).
  22. Sun, W.; Ceder, G. A Topological Screening Heuristic for Low-Energy, High-Index Surfaces. Surf. Sci. 2018, 669, 50–56. [Google Scholar] [CrossRef]
  23. Armbruster, T. Clinoptilotite-Heulandite: Applications and Basic Research. Stud. Surf. Sci. Catal. 2001, 135, 13–27. [Google Scholar] [CrossRef]
  24. Witman, M.; Ling, S.; Boyd, P.; Barthel, S.; Haranczyk, M.; Slater, B.; Smit, B. Cutting Materials in Half: A Graph Theory Approach for Generating Crystal Surfaces and Its Prediction of 2D Zeolites. ACS Cent. Sci. 2018, 4, 235–245. [Google Scholar] [CrossRef] [PubMed]
  25. Lunevich, L.; Sanciolo, P.; Smallridge, A.; Gray, S.R. Silica Scale Formation and Effect of Sodium and Aluminium Ions-29Si NMR Study. Environ. Sci. Water Res. Technol. 2016, 2, 174–185. [Google Scholar] [CrossRef]
  26. El-Manharawy, S.; Hafez, A. Dehydration Model for RO-Membrane Fouling: A Preliminary Approach. Desalination 2003, 153, 95–107. [Google Scholar] [CrossRef]
  27. El-Manharawy, S.; Hafez, A. Technical Management of RO System. Desalination 2000, 131, 173–188. [Google Scholar] [CrossRef]
  28. Tasci, E.S. How to Prepare an Input File for Surface Calculations. 2013. Available online: https://www.emresururi.com/physics/wp-content/uploads/2013/09/ETasci_2013_SurfacePreparationHowTo.pdf (accessed on 29 April 2024).
  29. Tasker, P.W. The Stability of Ionic Crystal Surfaces. J. Phys. C Solid State Phys. 1979, 12, 4977–4984. [Google Scholar] [CrossRef]
  30. Finnis, M.W. The Theory of Metal—Ceramic Interfaces. J. Phys. Condens. Matter 1996, 8, 5811–5836. [Google Scholar] [CrossRef]
  31. Hohenberg, P.; Kohn, W. Inhomogeneous Electron Gas. Phys. Rev. 1964, 136, B864–B871. [Google Scholar] [CrossRef]
  32. Kohn, W.; Sham, L.J. Self-Consistent Equations Including Exchange and Correlation Effects. Phys. Rev. 1965, 140, A1133–A1138. [Google Scholar] [CrossRef]
  33. Grimme, S.; Antony, J.; Ehrlich, S.; Krieg, H. A Consistent and Accurate Ab Initio Parametrization of Density Functional Dispersion Correction (DFT-D) for the 94 Elements H-Pu. J. Chem. Phys. 2010, 132, 154104. [Google Scholar] [CrossRef]
  34. Kühne, T.D.; Iannuzzi, M.; Del Ben, M.; Rybkin, V.V.; Seewald, P.; Stein, F.; Laino, T.; Khaliullin, R.Z.; Schütt, O.; Schiffmann, F.; et al. CP2K: An Electronic Structure and Molecular Dynamics Software Package—Quickstep: Efficient and Accurate Electronic Structure Calculations. J. Chem. Phys. 2020, 152, 194103. [Google Scholar] [CrossRef]
  35. VandeVondele, J.; Krack, M.; Mohamed, F.; Parrinello, M.; Chassaing, T.; Hutter, J. Quickstep: Fast and Accurate Density Functional Calculations Using a Mixed Gaussian and Plane Waves Approach. Comput. Phys. Commun. 2005, 167, 103–128. [Google Scholar] [CrossRef]
  36. Lippert, G.; Hutter, J.; Parrinello, M. The Gaussian and Augmented-Plane-Wave Density Functional Method for Ab Initio Molecular Dynamics Simulations. Theor. Chem. Acc. Theory Comput. Model. (Theor. Chim. Acta) 1999, 103, 124–140. [Google Scholar] [CrossRef]
  37. Hartwigsen, C.; Goedecker, S.; Hutter, J. Relativistic Separable Dual-Space Gaussian Pseudopotentials from H to Rn. Phys. Rev. B 1998, 58, 3641–3662. [Google Scholar] [CrossRef]
  38. Grimme, S. Semiempirical GGA-type density functional constructed with a long-range dispersion correction. J. Comput. Chem. 2006, 27, 1787–1799. [Google Scholar] [CrossRef]
  39. Mardirossian, N.; Head-Gordon, M. Thirty Years of Density Functional Theory in Computational Chemistry: An Overview and Extensive Assessment of 200 Density Functionals. Mol. Phys. 2017, 115, 2315–2372. [Google Scholar] [CrossRef]
  40. BROYDEN, C.G. The Convergence of a Class of Double-Rank Minimization Algorithms 1. General Considerations. IMA J. Appl. Math. 1970, 6, 76–90. [Google Scholar] [CrossRef]
  41. Fletcher, R.; Powell, M.J.D. A Rapidly Convergent Descent Method for Minimization. Comput. J. 1963, 6, 163–168. [Google Scholar] [CrossRef]
  42. Goldfarb, D. A Family of Variable-Metric Methods Derived by Variational Means. Math. Comput. 1970, 24, 23–26. [Google Scholar] [CrossRef]
  43. Shanno, D.F. Conditioning of Quasi-Newton Methods for Function Minimization. Math. Comput. 1970, 24, 647–656. [Google Scholar] [CrossRef]
  44. Bilal, M.; Alay-e-Abbas, S.M.; Sluydts, M.; Batool, J.; Laref, A.; Abbas, G.; Amin, N. DFT Insights into Surface Properties of Anti-Perovskite 3D Topological Crystalline Insulators: A Case Study of (001) Surfaces of Ca3SnO. Phys. Lett. A 2021, 408, 127469. [Google Scholar] [CrossRef]
  45. Reid, T.K.; Alpay, S.P.; Balatsky, A.V.; Nayak, S.K. First-Principles Modeling of Binary Layered Topological Insulators: Structural Optimization and Exchange-Correlation Functionals. Phys. Rev. B 2020, 101, 085140. [Google Scholar] [CrossRef]
  46. Schultz, P.A. First-Principles Calculations of Metal Surfaces. I. Slab-Consistent Bulk Reference for Convergent Surface Properties. Phys. Rev. B 2021, 103, 195426. [Google Scholar] [CrossRef]
  47. Martin, R.M. Electronic Structure: Basic Theory and Practical Methods, 2nd ed.; Cambridge University Press: Cambridge, UK, 2020; ISBN 978-1-108-55558-6. [Google Scholar]
  48. Vande Vondele, J.; Hutter, J. Gaussian Basis Sets for Accurate Calculations on Molecular Systems in Gas and Condensed Phases. J. Chem. Phys. 2007, 127, 114105. [Google Scholar] [CrossRef]
  49. González, M.A. Force Fields and Molecular Dynamics Simulations. JDN 2011, 12, 169–200. [Google Scholar] [CrossRef]
  50. Frenkel, D.; Smit, B. Understanding Molecular Simulation: From Algorithms to Applications, 2nd ed.; Physics Today; Elsevier: Amsterdam, The Netherlands, 1996; Volume 50. [Google Scholar]
  51. Thompson, A.P.; Aktulga, H.M.; Berger, R.; Bolintineanu, D.S.; Brown, W.M.; Crozier, P.S.; In’ T Veld, P.J.; Kohlmeyer, A.; Moore, S.G.; Nguyen, T.D.; et al. LAMMPS—A Flexible Simulation Tool for Particle-Based Materials Modeling at the Atomic, Meso, and Continuum Scales. Comput. Phys. Commun. 2022, 271, 108171. [Google Scholar] [CrossRef]
  52. LAMMPS Molecular Dynamics Simulator. Available online: https://www.lammps.org/#gsc.tab=0 (accessed on 5 July 2025).
  53. LAMMPS Tutorials. Available online: https://lammpstutorials.github.io/ (accessed on 5 July 2025).
  54. Brauer, J.; Fischer, M. Computational Screening of Hydrophobic Zeolites for the Removal of Emerging Organic Contaminants from Water. ChemPhysChem 2024, 25, e202400347. [Google Scholar] [CrossRef] [PubMed]
  55. Heinz, H.; Lin, T.-J.; Kishore Mishra, R.; Emami, F.S. Thermodynamically Consistent Force Fields for the Assembly of Inorganic, Organic, and Biological Nanostructures: The INTERFACE Force Field. Langmuir 2013, 29, 1754–1765. [Google Scholar] [CrossRef] [PubMed]
  56. Sun, H. Force Field for Computation of Conformational Energies, Structures, and Vibrational Frequencies of Aromatic Polyesters. J. Comput. Chem. 1994, 15, 752–768. [Google Scholar] [CrossRef]
  57. Sun, H. COMPASS: An Ab Initio Force-Field Optimized for Condensed-Phase ApplicationsOverview with Details on Alkane and Benzene Compounds. J. Phys. Chem. B 1998, 102, 7338–7364. [Google Scholar] [CrossRef]
  58. Sun, H.; Ren, P.; Fried, J.R. The COMPASS Force Field: Parameterization and Validation for Phosphazenes. Comput. Theor. Polym. Sci. 1998, 8, 229–246. [Google Scholar] [CrossRef]
  59. Sekulla, M.; Kohns, M.; Richter, M. Adsorption of CO2 on Gold Surfaces: Adsorbate Density Assumption Investigated Using Molecular Dynamics Simulations. Ind. Eng. Chem. Res. 2023, 62, 19884–19892. [Google Scholar] [CrossRef]
  60. Lammps/Tools/Msi2lmp/README at Develop Lammps/Lammps. Available online: https://github.com/lammps/lammps/blob/develop/tools/msi2lmp/README (accessed on 5 July 2025).
  61. BIOVIA, Dassault Systèmes. DS BIOVIA Materials Studio 2024; Dassault Systèmes: San Diego, CA, USA, 2024. [Google Scholar]
  62. Patiño, C.M.; Alzate-Vargas, L.; Li, C.; Haley, B.P.; Strachan, A. LAMMPS Data-File Generator. 2021. Available online: https://nanohub.org/resources/struc2lammpsdf (accessed on 7 May 2025).
  63. Kirkpatrick, S.; Gelatt, C.D.; Vecchi, M.P. Optimization by Simulated Annealing. Science 1983, 220, 671–680. [Google Scholar] [CrossRef] [PubMed]
  64. Mitra, D.; Romeo, F.; Sangiovanni-Vincentelli, A. Convergence and Finite-Time Behavior of Simulated Annealing. In Proceedings of the 1985 24th IEEE Conference on Decision and Control, Fort Lauderdale, FL, USA, 11–13 December 1985; pp. 761–767. [Google Scholar]
  65. Geyer, C.J. Markov Chain Monte Carlo Maximum Likelihood. In Computing Science and Statistics, Proceedings of the 23rd Symposium on the Interface, Seattle, WA, USA, 21–24 April 1991; Interface Foundation of North America: Atlanta, Georgia.
  66. Sugita, Y.; Okamoto, Y. Replica-Exchange Molecular Dynamics Method for Protein Folding. Chem. Phys. Lett. 1999, 314, 141–151. [Google Scholar] [CrossRef]
  67. Rathore, N.; Chopra, M.; De Pablo, J.J. Optimal Allocation of Replicas in Parallel Tempering Simulations. J. Chem. Phys. 2005, 122, 024111. [Google Scholar] [CrossRef] [PubMed]
  68. Norman, P.; Schwartzentruber, T. Using Simulated Annealing with Parallel Tempering to Create Low-Defect Silica Surfaces. Available online: https://www.lammps.org/workshops/Aug11/Norman/poster.pdf (accessed on 25 March 2025).
  69. Kannan, S.; Zacharias, M. Simulated Annealing Coupled Replica Exchange Molecular Dynamics—An Efficient Conformational Sampling Method. J. Struct. Biol. 2009, 166, 288–294. [Google Scholar] [CrossRef]
  70. VandeVondele, J.; Hutter, J. An Efficient Orbital Transformation Method for Electronic Structure Calculations. J. Chem. Phys. 2003, 118, 4365–4369. [Google Scholar] [CrossRef]
  71. Perdew, J.P.; Burke, K.; Ernzerhof, M. Generalized Gradient Approximation Made Simple-PBE. Phys. Rev. Lett. 1996, 77, 3865–3868. [Google Scholar] [CrossRef]
  72. Qian, Y.; Yang, H. Computational Insight into the Bioapplication of 2D Materials: A Review. Nano Today 2023, 53, 102007. [Google Scholar] [CrossRef]
  73. Hammer, B.; Nørskov, J.K. Electronic Factors Determining the Reactivity of Metal Surfaces. Surf. Sci. 1995, 343, 211–220. [Google Scholar] [CrossRef]
  74. Greeley, J.; Mavrikakis, M. Competitive Paths for Methanol Decomposition on Pt(111). J. Am. Chem. Soc. 2004, 126, 3910–3919. [Google Scholar] [CrossRef] [PubMed]
  75. Bai, Y.; Kirvassilis, D.; Xu, L.; Mavrikakis, M. Atomic and Molecular Adsorption on Ni(111). Surf. Sci. 2019, 679, 240–253. [Google Scholar] [CrossRef]
  76. Xu, L.; Kirvassilis, D.; Bai, Y.; Mavrikakis, M. Atomic and Molecular Adsorption on Fe(110). Surf. Sci. 2018, 667, 54–65. [Google Scholar] [CrossRef]
  77. Liu, H.; Liu, F.; Zong, H.; Ding, X.; Sun, J. Initial Oxidation Behavior of α-U and γ-U Surfaces. J. Nucl. Mater. 2024, 592, 154964. [Google Scholar] [CrossRef]
  78. Galimberti, D.R.; Sauer, J. Chemically Accurate Vibrational Free Energies of Adsorption from Density Functional Theory Molecular Dynamics: Alkanes in Zeolites. J. Chem. Theory Comput. 2021, 17, 5849–5862. [Google Scholar] [CrossRef]
  79. Dauenhauer, P.J.; Abdelrahman, O.A. A Universal Descriptor for the Entropy of Adsorbed Molecules in Confined Spaces. ACS Cent. Sci. 2018, 4, 1235–1243. [Google Scholar] [CrossRef]
  80. Patriksson, A.; Van Der Spoel, D. A Temperature Predictor for Parallel Tempering Simulations. Phys. Chem. Chem. Phys. 2008, 10, 2073. [Google Scholar] [CrossRef]
  81. Replica Exchange. Available online: https://epcced.github.io/archer2-advanced-use-of-lammps/05-replica-exchange/index.html (accessed on 15 January 2025).
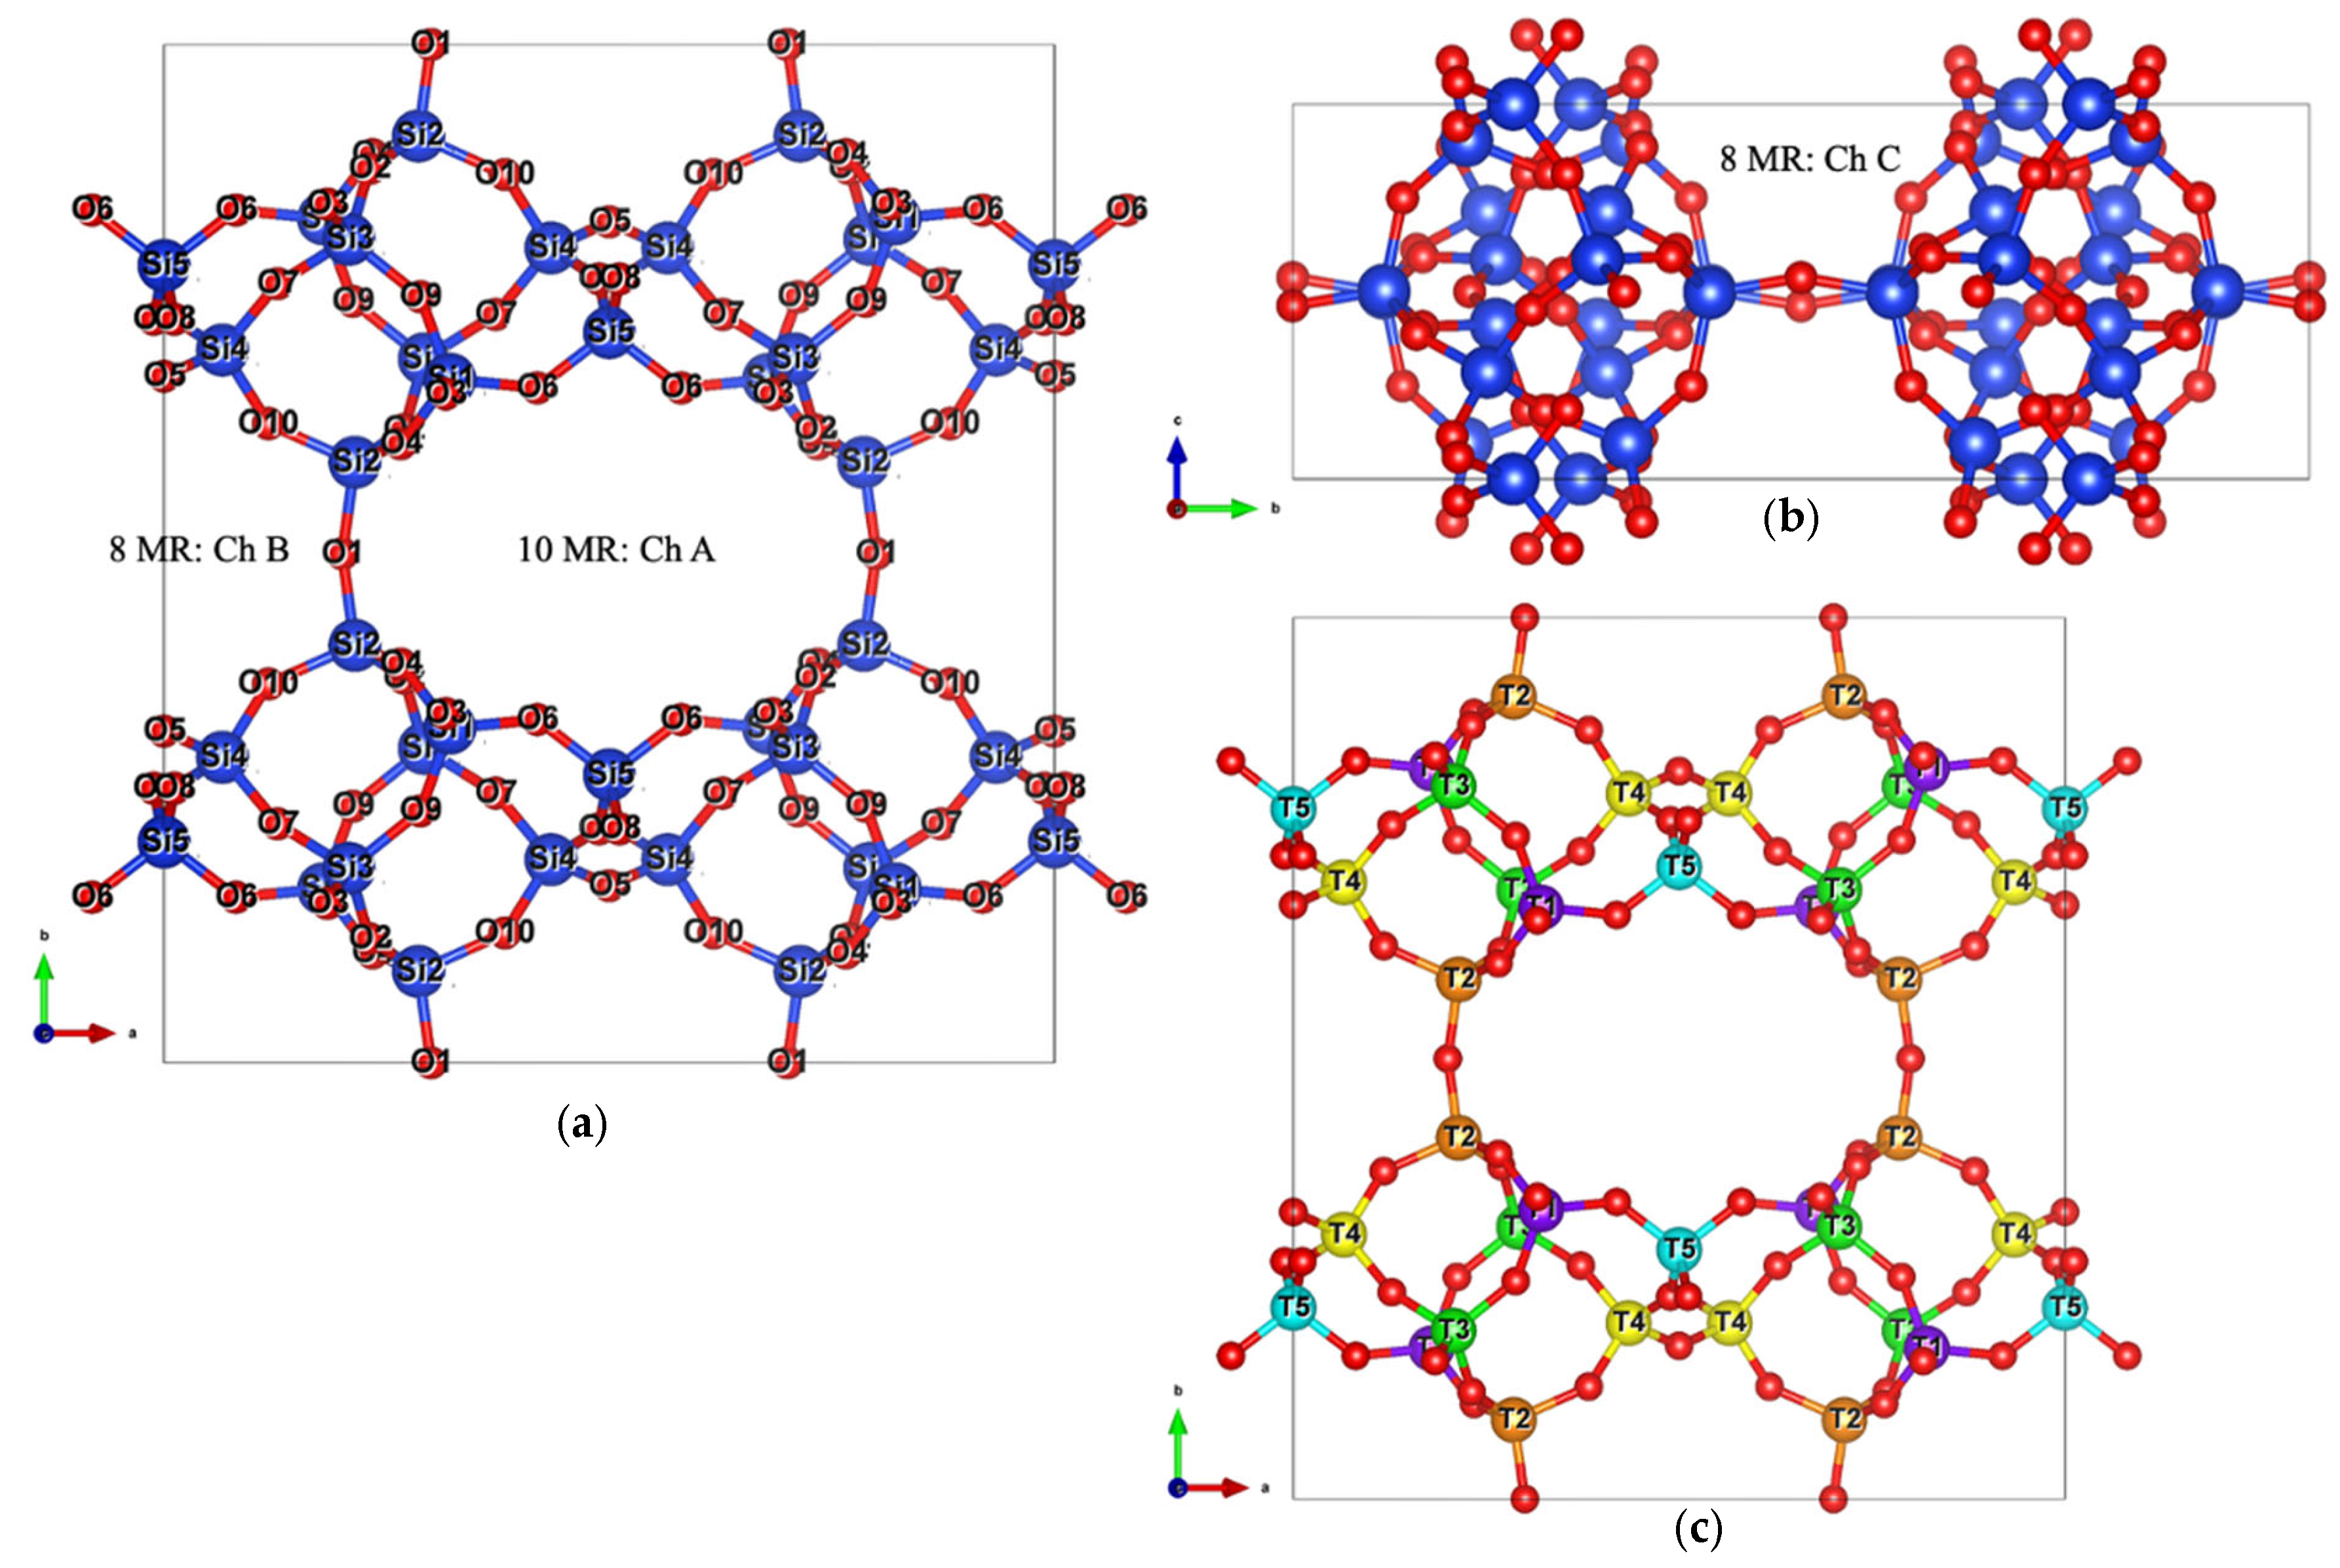
Figure 1. (a) All-silica framework of clinoptilolite, from our previous work [18], showing 10 MR and 8 MR of channels A and B, respectively, oriented along the c-axis. (b) Eight MR of channel C, parallel to the a-axis. Silicon and oxygen atoms are depicted as dark blue and red spheres, respectively. (c) Distinct tetrahedral (T) sites within the framework are highlighted by color: T1 (purple), T2 (orange), T3 (green), T4 (yellow), and T5 (cyan). The all-silica model is used here to simplify visualization of the clinoptilolite framework topology.
Applsci 15 09535 g001
Figure 2. Schematic representation of (010) surface slabs generated from various DFT-optimized bulk clinoptilolite models, each separated by a 20 Å vacuum layer. Si, O, Al, Na, and H atoms are depicted as dark blue, red, light blue, yellow, and white spheres, respectively. (a) In Na-clin_1, the bulk model is cleaved by breaking Al–O bonds such that one undercoordinated Al site appears on the top and another at the bottom. Moreover, this was one of our more interesting models since Na is observed in a five-fold coordination with framework oxygen atoms. (b) Na-clin_2 is similarly cleaved, but with a distinct distribution of Na cations in the bulk and at the surface, and two Al atoms are exposed at the top surface. (c) In Na-clin_3, the slab is generated with broken Al–O bonds but deliberately excludes any surface cations. It is also important to note that models (b,c) originate from the same bulk structure but demonstrate how different surface terminations can be generated from identical starting geometries. (d) In Na-clin_1, the undercoordinated surface Al atoms are terminated with hydroxyl groups—oxygen atoms placed at the top and bottom, each bonded to hydrogen—to restore local coordination. (e) In Na-clin_2, the surface is similarly passivated to preserve charge neutrality with a different surface termination. (f) In Na-clin_3, the same OH termination protocol is applied; however, no cations are present at the surface.
Applsci 15 09535 g002
Figure 3. Schematic representation of surface slab construction from an optimized bulk crystal. (a) A supercell is constructed. (b) A crystallographic plane of interest is selected, (c) then parallel and perpendicular bounding planes are defined to isolate the slab region. (d) Atoms outside the defined volume are removed, and a transformation matrix is applied to realign the supercell. The resulting structures are exported in Cartesian coordinates with an added vacuum layer perpendicular to the surface for use in first-principles simulations as in (e,f), where different terminations of the same surface model cleaved at (010) plane are shown.
Applsci 15 09535 g003
Figure 4. An example of one of the reoriented Na-clinoptilolite surface models after supercell construction. The original DFT-optimized slab was expanded in the y-direction to a 1 × 3 × 1 supercell to provide sufficient lateral spacing and accommodate adsorption sampling.
Applsci 15 09535 g004
Figure 5. Electrostatic potential profiles along the slab normal (z-direction) for a representative Na-clinoptilolite surface model. (a) The corrected case, computed using the analytical Poisson solver, shows ‘exactly’ mirrored potential jumps: a downward jump on one side, flat central region, and upward jump on the other side, indicating full cancellation of dipole effects. (b) The uncorrected case, computed without electrostatic correction, exhibits a continuous linear rise in potential across the vacuum: a signature of residual electric fields arising from the slab’s intrinsic dipole. This highlights the importance of applying proper boundary conditions to avoid unphysical electrostatic artifacts in polar slab models.
Applsci 15 09535 g005
Figure 6. Schematic representation of DFT-D3-optimized surface slabs of Na-clinoptilolite. (a) Na-clin_1: three Na cations are located at the surface along with one Al and one Si atom. (b) Na-clin_2: features two Na cations at the top surface with two Al atoms, and a third Na at the bottom. (c) Na-clin_3: Al atoms in the 10MR are exposed at the surface without any accompanying cations. (d) Na-clin_4: similar to (c), with Al at the surface but exposing channel B and a different Na distribution in the bulk. (e) Na-clin_5: again, features Al at the surface, but with yet another distinct Na arrangement in the bulk. Finally, a final model, Na-clin_6 in (f), with both Al and Na at the surface, similar in composition to Na-clin_1, but with a different local Na distribution at the surface and in the bulk. In all models, we can see how H atoms from surface hydroxyl groups, top-to-bottom, are aligned unless disrupted by the presence of a nearby cation, in which case the H orientation flips to accommodate local electrostatics.
Applsci 15 09535 g006
Figure 7. Bar plot comparing the relative free energies (ΔE) of Na-clinoptilolite surface slab models referenced to the most stable configuration (Na-clin_6). Energies are presented in both atomic units (a.u.) and kilocalories per mole (kcal/mol). All models were optimized using identical DFT-D3 parameters. Each model shares the same stoichiometry (Na6(Si30Al6O74)H4) but differs in cleavage strategy and cation distribution. Therefore, this comparison provides insight into the influence of cleavage and surface cation distribution on slab stability.
Applsci 15 09535 g007
Figure 8. Box-and-scatter plot showing the distribution of adsorption energies for six different Na-clinoptilolite surface models. Gray boxes indicate the interquartile range and median for each model, while overlaid red and blue points represent individual configurations obtained from simulated annealing and parallel replica methods, respectively. Numerical values for the lowest and highest adsorption energies in each model are annotated. The figure illustrates both the energetic variability within each surface and the relative stability across models.
Applsci 15 09535 g008
Figure 9. Most favorable adsorption configurations of 5-FU on Na-clin_2, the surface model exhibiting the strongest adsorption performance. Black circles are used to mark the location of the 5-FU molecule within the surface model. (a) Structure of 5-FU optimized with DZVP basis sets. (b) SA configuration with the lowest adsorption energy observed in the study (−430.0 kJ/mol), showing the molecule nestled between two Na cations and forming strong Na–O interactions. (c) PR configuration with an adsorption energy of −429.0 kJ/mol, revealing a distinct local minimum in which the fluorine atom participates in surface binding alongside two oxygen atoms, forming Na–F and Na–O bonds. Configurations are ordered according to adsorption strength.
Applsci 15 09535 g009
Figure 10. Most favorable adsorption configurations of 5-FU on the Na-clin_1 surface model, which exhibits the second-best adsorption performance among the studied slabs. Black circles are used to mark the Na-O and/or Na-F bonds at the surface. (a) PR configuration with an adsorption energy of −393.4 kJ/mol, where 5-FU binds via one oxygen and one fluorine atom, forming Na–O and Na–F interactions. (b) SA configuration with an adsorption energy of −271.6 kJ/mol, showing coordination via two oxygen atoms and one fluorine atom. In this configuration, we can see how the molecule lies almost flat across the surface, with its fluorine atom interacting at the cell boundary. Compared to the Na-clin_2 configurations, both geometries exhibit longer bond lengths, contributing to their ‘relatively’ less adsorption strength.
Applsci 15 09535 g010
Figure 11. Selected adsorption configurations of 5-fluorouracil on the Na-clin_6 surface model, which, despite being the most stable bare slab, ranks third in adsorption performance. Black circles, ellipses or rectangles are used to mark the bonds between the 5-FU molecule and the surface. (a,b) SA configuration with the strongest adsorption energy of −374.9 kJ/mol, where the molecule interacts with two Na+ cations through Na–O bonds. (c,d) PR configuration with an adsorption energy of −279.1 kJ/mol, showing similar limited surface embedding and thus longer Na–O bond lengths. (e,f) Alternative PR configuration where the molecule is surrounded by four cations and forced to adopt a vertical orientation, reducing binding effectiveness. (g) Another representative configuration further illustrating how the distribution of cations and hydroxyl groups limits optimal surface interaction. These geometries reflect how spatial constraints and electrostatics influence adsorption behavior in Na clinoptilolites surfaces.
Applsci 15 09535 g011
Figure 12. Adsorption geometries of 5-FU on the Na-clin_5 surface model, which exposes the 8 MR channel. Black ovals are used to mark the OH bond of the 5-FU molecule and the surface atoms. (a) The SA configuration shows the strongest adsorption with −288.2 kJ/mol, where the molecule is deeply confined within the channel. (b) The PR configuration exhibits a slightly weaker adsorption energy of −274.9 kJ/mol, with the molecule less embedded. If we look at the orientation of the OH-termination groups in the 8 MR, they are positioned closer together and point in opposite directions, creating a more polar and confined environment that favors hydrogen bonding with 5-FU, in contrast to the co-directional OH arrangement in 10 MR-exposed models.
Applsci 15 09535 g012
Figure 13. Adsorption geometries of 5-FU on the cation-free Na-clin_3 surface model. (a) PR configuration shows the strongest adsorption (−274.4 kJ/mol), where the molecule binds near the 8 MR channel, benefiting from stronger confinement and closer interaction with surface hydroxyls. (b) In contrast, the SA configuration exhibits a slightly weaker adsorption (−269.6 kJ/mol), interacting through the more open 10 MR channel, where reduced confinement and less favorable OH orientation may lead to diminished stabilization. The comparison underscores the role of channel geometry and local hydrogen-bonding environments in tuning adsorption strength in cation-free surfaces.
Applsci 15 09535 g013
Figure 14. Adsorption geometries of 5-FU on the Na-clin_4 surface model. (a,b) The SA configuration yields the weakest adsorption energy among all six surface models (−259.4 kJ/mol). In this case, the molecule interacts with the surface through the 8 MR, but it is located near the center of the slab, rather than at the boundaries, which appears to limit stabilizing interactions. (c) PR configuration with the exposure of the 10 MR channel likely contributing to the overall reduced adsorption performance (adsorption energy of −220.9 kJ/mol), as its broader geometry and less confined environment result in weaker hydrogen-bonding and van der Waals stabilization compared to the more compact 8 MR regions.
Applsci 15 09535 g014
Table 1. Summary of the structural and energetic characteristics of the most stable adsorption configurations for each surface model, all corresponding to the chemical composition Na6H4(Si30Al6O74). For each slab, the number of surface Na cations, the exposed ring type (8 MR or 10 MR) for cation-free surfaces, and the lowest adsorption energy (Eads) obtained after DFT optimization is reported. Regardless of whether the configuration originates from PR or SA sampling, the 8 MR exposure consistently yields more favorable adsorption energies than the 10 MR; therefore, 10 MR results are omitted from this table since this table lists only the most stable configurations.
Slab IDNumber of Na Cations at the Surface or Exposed Ring TypeLowest Eads (kJ/mol)
Na-clin_13 Na cations −393.4
Na-clin_22 Na cations −430.0
Na-clin_38 MR (PR sampling) −274.5
Na-clin_48 MR (SA sampling)−295.4
Na-clin_58 MR (both sampling)−288.2
Na-clin_63 Na cations−374.9
Table 2. Literature examples for moderate molecular chemisorption, strong atomic/dissociative chemisorption, and very strong chemisorption/initial oxidation, with reported adsorption enthalpy/energy ranges and representative systems.
Bonding ClassExample SystemReferenceReported Adsorption Enthalpy/Energy
Moderate molecular chemisorption (−80 to −200 kJ/mol)CO chemisorption on Ni(111)[73]−1.19 eV (≈−115 kJ/mol)
Strong atomic/dissociative chemisorption (~−200–−400 kJ/mol)OH adsorption on Pt(111)[74]~−2.1 eV (≈−204 kJ/mol)
Atomic O from dissociative O2 adsorption on Ni(111)[75]−2.28 eV(≈−220 kJ/mol)
Very strong chemisorption/initial oxidation (−400 to −700 kJ/mol)5-FU adsorption on Na-clinoptilolite (this work)This study−174.4 to −430 kJ/mol
Adsorption on Fe(110): lowest—NH3 (molecular) = −0.62 eV (−59.8 kJ/mol); highest—CH (molecular) =−5.24 eV(−505.6 kJ/mol)[76]Overall range: −59.8 to −505.6 kJ/mol (molecular fragments and atomic species)
Atomic O on U surfaces (α-U and γ-U) across sites and facets[77]Range: −4.64 to −5.96 eV (−448 to −575 kJ/mol), atomic species.
Disclaimer/Publisher’s Note: The statements, opinions and data contained in all publications are solely those of the individual author(s) and contributor(s) and not of MDPI and/or the editor(s). MDPI and/or the editor(s) disclaim responsibility for any injury to people or property resulting from any ideas, methods, instructions or products referred to in the content.