Abstract
Foam concrete is examined for use as a lightweight aggregate in concrete for building slabs. Crushed foam concrete should substitute LECAs in areas where LECAs are inaccessible. Suitable foam concrete mixes with and without admixtures and fine aggregates (limestone, stone dust, and micro silica) are tested to determine the densities (approx. range 550–1100 kg/m3), compressive strengths (approx. 0–8 MPa), and crushing potential measures as Percentage Mass of Useful Material After Crushing (approx. 70–90%). A mixing technique is developed using high revolutions. Some mixes show potential by providing a combination of density below 800 kg/m3, an adequately high compressive strength to be handled (>1 MPa), a low cement content (below 300 kg/m3), and a sufficiently high level of larger fragments above 4 mm when crushed (>80%). The results show that oven curing and curing beyond one day do not have a significant benefit. The investigation shows potential for two mixes, though developing the desired mixes further and studying a more consistent industrialised crushing method is recommended.
1. Introduction
Foam concrete is a lightweight concrete that was first patented in 1923 [1], with its base mix consisting of cement paste (cement, fine aggregate, and water) and foam (foaming agent (FA), water, and air). The foam is responsible for the air voids in the mix (see Figure 1) [2]. The sizes and spacing of the air voids influence the density and strength, but the shape of the air voids has no impact on the properties [3,4].
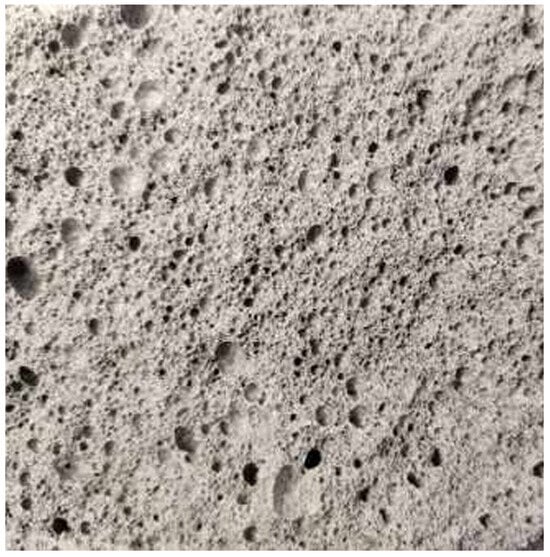
Figure 1.
An example of a hardened foam concrete surface with visible pores. Photograph by the authors.
The durability properties of foam concrete are improved by increasing the number of closed pores, reducing the number of surface pores, and creating a uniform distribution. The durability can also be positively impacted by adding Supplementary Cementitious Materials (SCMs) such as silica fume, fly ash, or limestone [5]. Adding different synthetic and natural fibres to foam concrete can also enhance durability [6]. Foam concrete has several beneficial properties when used in buildings:
- Fire resistance, thermal and sound insulation [7];
- Low density and high strength-to-weight ratio [8];
- Low cost [9];
- It can be produced almost anywhere due to the simplicity and availability of the required materials.
Foam concrete is widely used in the building industry worldwide in an extensive range of densities and for various purposes [10]. Densities in the interval from 300 to 600 kg/m3 can be used as insulation, filling, and in sub-bases of roads [11]. It can be used towards non-load-bearing structures for 600 to 1200 kg/m3 densities [12]. For a density above 1200 kg/m3, foam concrete can be used for structural and load-bearing applications [13]. Both fresh and hardened properties of foam concrete rely on the type of foaming agent (FA), the techniques employed to produce the foam, the mix design, and the chosen dry materials (cement type and SCMs) [2]. SCMs are added when producing foam concrete to substitute part of the cement. For instance, the use of fly ash [14], slag [15], silica fume [16], limestone [17], and recycled glass powder [18] has been documented in foam concrete studies. Thairy et al. [19] investigated the compressive strength of foam concrete panels with and without fibres. They found a strength without fibres of between 1 and 6 MPa after seven days of curing, depending on the added SCMs and fine aggregates in the mix. The density was approximately 700 to 1000 kg/m3 with a fixed water-to-cement (wc) ratio of 0.5.
To create a workable foam concrete mix, the water content should be adjusted based on the used admixtures and purpose. A lower water content leads to a denser mix, causing the foam’s bubbles to break, while a higher water content results in a thinner mix and segregation [20]. Admixtures (e.g., superplasticisers) have been used in foam concrete [21]. However, the consequence of applying admixtures must be closely monitored, as many products are incompatible with the foam’s structure and can lead to instability [9]. Several additives are not compatible with foam concrete mixing, but a few can aid the early hardening and stability of the foam structure [22].
Regarding foam production, two techniques can be distinguished [13]:
- The pre-foaming process: the foam is created by blending FA, water, and compressed air and adding it to the base mix.
- The mix-foaming process: the FA is added directly to the base mix.
When looking into the pre-foaming process, two main foam types are typically used:
- Wet foam is created by spraying a solution of FA and water over a fine mesh, resulting in a foam structure. The air void diameter is between 2 mm and 5 mm, which is not recommended for foam concrete with a density below 1100 kg/m3 [23].
- Dry foam is produced using a foam generator, where the FA and water solution are intermixed with compressed air. This creates a thick, tight foam structure, with an air void diameter below 1 mm [24].
The most used foam type is dry foam because it should be ensured that it is firm enough to resist the mortar’s pressure until the cement reaches its initial setting point [25]. All FAs are either protein-based or synthetic-based. Two thousand years ago, the Romans were using animal blood to entrain air into concrete mixes, which led to the technology used to produce protein FAs today [26]. Contrastingly, synthetic FAs are made using artificial chemicals; they can be stored for a longer time, are more affordable, and require less energy to be produced. Nonetheless, they often provide lower strength than protein-based FAs [23].
The CO2 emissions from the production of foam concrete depend primarily on the fine aggregate type and the cement content (a small contribution from the foam production is ignored here). The following emissions are examples used in the present analysis (the CO2 data varies with production method, location, etc.):
- Cement (assuming ordinary fossil-fueled Portland cement production [27]): 0.9 kg CO2 eq/kg.
- CaCO3 (from EPD from an Italian producer [28]): 0.483 kg CO2 eq/kg.
- Stone dust (no CO2 data): assumed to be the same as CaCO3.
- Micro silica (from EPD from a Chinese producer [29]): 0.660 kg CO2 eq/kg.
1.1. The Super-Light (SL) Concrete Deck
The SL deck (also known as the T-slab) is a mass-produced precast concrete deck element for buildings, made of a combination of light and strong concrete. The lightweight aggregate concrete is positioned at the bottom of the slab, increasing the fire resistance when used in buildings; hence, the slab becomes lighter and has a lower total carbon footprint than other concrete slab solutions [27]. The slab consists of lightweight aggregate blocks at the bottom with lightweight concrete of 800 kg/m3 density and a compressive strength of around 3.0 MPa. On top of the lightweight aggregate concrete blocks is self-compacting concrete with a 2400 kg/m3 density and compressive strength of around 55 MPa. The lightweight concrete blocks are cast by a machine in a special curved geometry, leaving both lengthwise and transversal grooves, which form the ribbed structural shape of the self-compacting concrete, see Figure 2. In Figure 2, a part of the self-compacting concrete is removed to give a better view of the reinforcement and lightweight aggregate concrete blocks. Production of fossil-fueled LECA has a CO2 emission of 0.179 kg CO2 eq/kg [27].
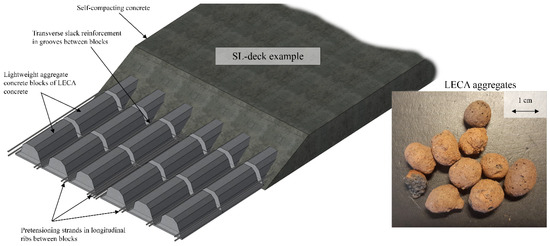
Figure 2.
Left: example geometry of an SL-deck with exposed lightweight aggregate concrete (LECA) blocks at the bottom of the cross-section. Right: size and form of LECAs. Illustration and photograph by the authors.
The lightweight aggregate concrete blocks insulate and stabilise the stronger self-compacting concrete. Pretension reinforcement is placed in the lengthwise grooves of the slab, while regular slack reinforcement can be placed in all the transversal grooves. As a result, a resilient, lightweight structure of cross-reinforcement is established [30]. The aggregates in the lightweight aggregate concrete blocks are Lightweight Expanded Clay Aggregates (LECAs), seen in Figure 2. Crushed foam concrete has the potential to substitute the LECA in the lightweight aggregate blocks in SL-decks in areas of the world where expanded clay is not available or not affordable. To the best of the authors’ knowledge, no literature is currently available on the utilisation of foam concrete as an aggregate. This study seeks to generate initial data regarding its potential as an aggregate.
1.2. Scope
It is investigated whether a low-density foam concrete mix for crushing can be developed, so that the crushed foam concrete can substitute expanded clay aggregates currently in SL-decks. The purpose is to experimentally study different essential parameters, such as fine aggregates, admixtures, and curing conditions, to provide recommendations to produce crushed lightweight foam concrete aggregates. The criteria for a successful mix include the following:
- An optimal mixing technique (mixer type, durations, and speeds).
- Determining the best curing method (assessment of two different curing conditions and three curing durations).
- An investigation of the compatibility of FAs with different admixtures.
- A study of fine aggregates’ effect (monitoring the effect on the density and compressive strength).
- An evaluation of the potential of crushing the foam concrete types.
Because the aim is to crush the foam concrete, using fibres is not considered. The paper does not concern the direct application of crushed foam concrete in a mix to create lightweight aggregate concrete. It is assumed that a foam concrete mix can be used as a lightweight aggregate if it can be crushed manually to the desired size. Furthermore, the experiments are performed in a lab, and it is only considered to a low degree how to scale the applied test method to a larger production, e.g., with mechanical crushing. Durability of the mixes is not considered.
2. Materials and Methods
Experiments were conducted to investigate whether foam concrete was suited for use as a lightweight aggregate in the lightweight aggregate blocks in SL-decks. The requirements for the foam concrete to work as a substitute for LECAs were chosen pragmatically and partly in cooperation with the manufacturer of the SL-decks in Denmark (Abeo, Beredskabsvej 12, 2640 Hedehusene, Denmark):
- The density should preferably be low (LECA has a density of 300 to 500 kg/m3) and stay below 800 kg/m3.
- The desired size of crushed foam concrete aggregates was 4–10 mm (like LECA).
- The compression strength should be comparable to LECAs’ compressive strength (>0.28 MPa).
- The initial acceptable crushing mass loss was 20% or below.
- Simple and inexpensive methods were preferred:
- o
- Fast curing.
- o
- Curing at room temperature.
- o
- Least use of materials.
- No odours were accepted.
- Least possible use of cement and admixtures to reduce environmental impacts.
Different foam concrete specimens, to obey these requirements, were developed and tested in the Concrete Lab at the Technical University of Denmark.
2.1. Materials
The type of cement selected for the preparation of all specimens was Rapid Aalborg Portland cement (CEM I 52.5N) (Aalborg Portland, Rørdalsvej 44, 2640 Aalborg, Denmark), the most used type of cement in Denmark, which complies with the European Standard EN 197-1 [31].
Different types of fine aggregates were examined. Firstly, the addition of limestone (CaCO3) with a particle size distribution of 0–30 µm was assessed and was purchased from the company Lhoist in Denmark (Industrivej 2, 4683 Rønnede, Denmark). Secondly, stone dust was used, crushed to a size fragment of 0–50 µm in the lab using a ring crushing machine by Fritsch (model Pulverisette9; Industriestrasse 8, 55743 Idar-Oberstein, Germany) and a sieve shaker by Retsch (model AS200; Retsch-Allee 1-5, 42781 Haan, Germany) with a 50 µm sieve. The original stone was purchased from NCC (Tobaksvejen 2A, 2860 Søborg, Denmark) and collected in the Nyrand gravel pit in Denmark. The original stone size fragment was 0–1 mm. Lastly, some mixes were added with micro silica 920 (SiO2) from Elkem (Bygstubben 13, 2950 Vedbæk, Denmark). It came in a powder form with a particle size of approximately 150 nm.
Some admixtures were also investigated, including two superplasticisers (HE-230 ViscoCrete and VC-510P, both by SIKA(Hirsemarken 5, 3520 Farum, Denmark)) and an accelerator (DK-SDS by SIKA). The accelerator completely deflated the foam structure, so the results of this admixture are not presented. Additionally, a liquid binder designed to produce foam concrete by Luca Industries (LithoFoam NWF-S; Knesebeckstrasse 62/63, 10719 Berlin, Germany) was assessed. Although limited information was available regarding the composition of this admixture, NWF-S aimed to increase foam concrete’s stability while offering a fine pore structure and distribution. All examined admixtures are presented in Table 1.

Table 1.
Properties of the used admixtures.
Protein-based and synthetic FAs were examined to assess their effects on the foam concrete (see Table 2). The three chosen types for testing were the protein-based FA SL-200L by Luca Industries, which was recommended to be used with a target foam density of 80 kg/m3, while the remaining two (EABASSOC, protein/synthetic-based, and LightCrete400 by SIKA, synthetic) were to be used with a target foam density of 40 kg/m3.

Table 2.
Properties of the used admixtures.
The density of the foam was measured volumetrically before every foam concrete mixing. The target densities and dilution ratios used were the recommendations provided by the manufacturer of each product. The water temperature was measured before foam production and mixing to ensure that it was below 20 °C because higher temperatures interfere with the FA’s performance. All FAs were stored and sealed at room temperature in ventilated cabinets.
2.2. Equipment for Mixing
Three mixing machines were initially investigated, see Figure 3. A hand mixer from Festool (model MX1000; Wertstraße 20, 73240 Wendlingen, Germany) offered a varying speed between 250 and 600 rpm, Figure 3C. A conventional low-speed (28 rpm) concrete mixer by Limex was also tested (Figure 3A), and lastly, “Lithopore 100” (Figure 3B), manufactured by Luca Industries, was tested. The latter was commercialised solely towards the production of foam concrete. Nevertheless, based on several attempts, the high-speed Festool mixer always gave the best homogeneity of the mix, which is aligned with the literature [16]. Therefore, it was used for all the laboratory tests in this paper. All three mixer types deflated the wet mix of foam concrete to some extent, but this effect of mixing was unavoidable.
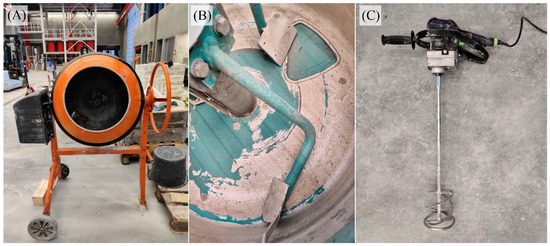
Figure 3.
Mixers used. (A) Ordinary concrete mixer; (B) vertical axis foam-concrete mixer; (C) high revolution hand mixer. Photographs by the authors.
2.3. Mix Design
The mix design was studied in two parts.
- Part 1: initial investigation of the FAs and assessing the possibility of producing foam concrete without fine aggregates.
- Part 2: investigate the effects of fine aggregates and admixtures while experimenting with different densities.
2.3.1. Part 1: Without Fine Aggregates
Three FAs were analysed to assess the possibility of producing foam concrete with low densities (200–600 kg/m3) without fine aggregates, as shown in Table 3. Moreover, the initial evaluation of the admixture NWF-S took place, as the product was also suggested for lower densities by the manufacturer. A total of eight mixes were made.

Table 3.
Part 1 of the foam-concrete mix designs with different FAs (per m3).
The results of Part 1 showed that the SL-200L FA was the only applicable one in this study. Therefore, it was chosen to proceed with only SL-200L in Part 2. This is elaborated in the Section 3. All mixes were with a water-to-cement ratio of 0.5. The foam density was close to 80 kg/m3.
2.3.2. Part 2: With Fine Aggregates
The foam-concrete mix designs are seen in Table 4, including the three fine aggregate types used in the study: CaCO3, SiO2, and stone dust with a fixed 0.5 w/c ratio. In the far-right column of the table, based on the material quantities, the CO2 emission is compared with LECA for each mix design.

Table 4.
Part 2 of the foam-concrete mix designs (per m3).
2.4. Methodology
The experimental process is shown in Figure 4. The first step was to ensure a proper mixing technique. Then, the actual mix was performed, and the poured foam concrete hardened under different conditions and for various durations. After demoulding, the specimens’ densities were measured, and they were investigated for flaws that could affect the results (e.g., large holes). If no flaws were detected, the specimens were tested for compressive strength and crushed to determine their potential as a crushed lightweight aggregate.
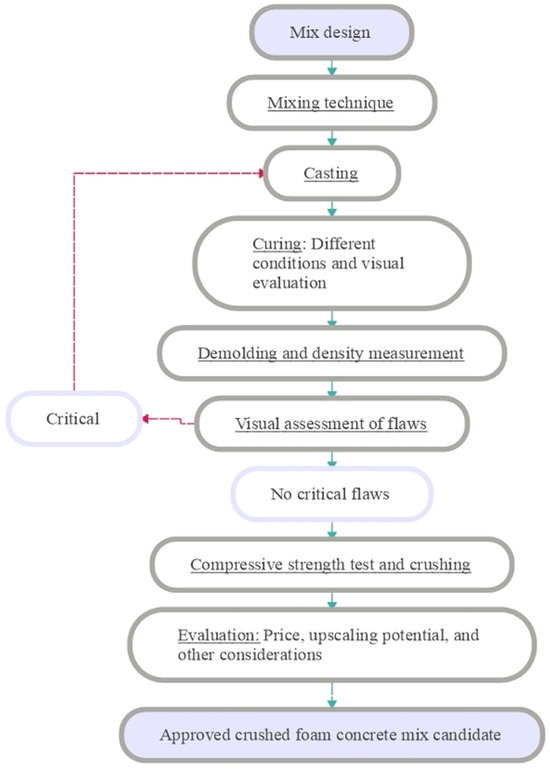
Figure 4.
The experimental process.
2.4.1. Mixing
The laboratory production procedure is illustrated in Figure 5. The procedure was as follows:

Figure 5.
Procedure. (A) Cement paste; (B) foam; (C) mixing of cement paste and foam; (D) final product for casting. Photographs by the authors.
- Mix of cement paste (cement and fine aggregates, water, admixtures);
- Producing the foam using a foam generator (pre-foaming);
- Adding the foam to the slurry;
- Casting the final foam concrete.
The dry materials and water containing the admixtures were mixed at a speed of 600 rpm for 75 s (Figure 5A) with the Festool mixer from Figure 3. Based on a visual assessment, checking for sufficient homogeneity, the mixing time could be extended to 120 s. Then, the foam was produced (Figure 5B) by adjusting the dosatron unit according to the user manual (usually around 2.5%) on the foam generator. The foam generator used was a Gertec SG-200-E. After production and before adding it to the cement slurry, the density of the foam was measured volumetrically to ensure that it was close to the target (cf. Section 2.1). Finally, the foam was added to the cement slurry (Figure 5C) and mixed for 120 s at a speed of 600 rpm (Figure 5D). The mixing speeds and durations were established after conducting a trial-and-error procedure to visually assess the homogeneity of the mix while avoiding interfering with the foam’s structure as little as possible. Nevertheless, the mix did in all cases shrink in volume due to some deflation of the pores, which gave higher demoulding densities than the calculated expected densities from the mix design. The Section 3 presents and evaluates the measured demoulding densities.
2.4.2. Casting and Curing
To cast the mixes, cylindrical Ø60 mm/120 mm moulds were used, complying with the required specimen sizes of the machine used for the subsequent strength tests. In Part 1 of the study, only one specimen was cast per curing condition per mix. In Part 2, three specimens were cast per curing condition per mix to increase the precision of the results. Every mix type was also cast in a block-shaped mould of 300 mm × 300 mm × 100 mm. The block-shaped specimens were used to visually assess the foam concrete mix’s homogeneity and quality and measure the size of the air voids. Furthermore, the crushing tests were done with functional parts of the block-shaped specimens or the cylinders.
All specimens were cured inside the moulds due to their fragility. Two curing conditions and three curing durations were examined. Some samples were cured horizontally at room temperature (Figure 6A), and some were cured at an elevated temperature of 40 °C in an oven inside a sealed plastic bag with a wet cloth (providing a 100% RH environment), see Figure 6B. The option of submerged curing was dismissed because the specimens of lower densities were too fragile.
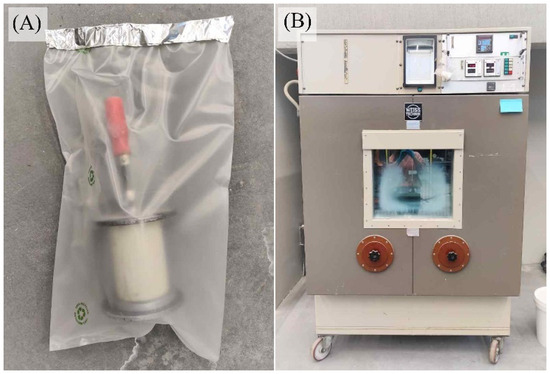
Figure 6.
(A) A cylindrical specimen is curing at room temperature inside the mould in a plastic bag; (B) samples are curing in the oven. Photographs by the authors.
The three curing durations examined for both curing conditions were 1, 3, and 7 days. As mentioned in the requirements, based on the method of the production of SL-decks, it was judged that the potential of SL-decks with lightweight aggregates of crushed foam concrete would improve for short curing times. Longer curing times would make the foam concrete take up too much factory space during mass production.
2.4.3. Compressive Strength Testing and Crushing
After curing, the specimens were tested to find the compressive cylinder strength and the crushing properties. The machine to test the compressive strength was a Stenhøj and was operated manually, as seen in Figure 7. Crushing was performed with an ordinary hand-held hammer in this initial lab-scale investigation, although large-scale industrial machinery for crushing would have to be applied for future applications. The target size fragment obtained after crushing was 4–10 mm, which is the approximate size of LECAs used in the SL decks.
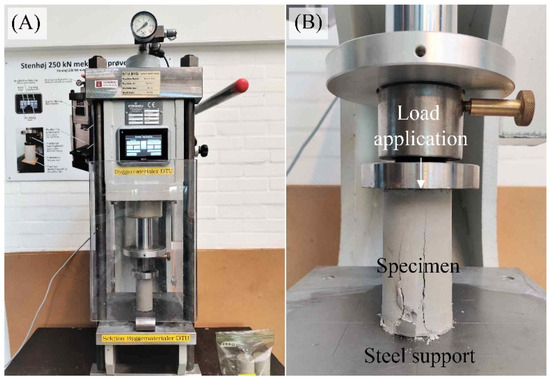
Figure 7.
(A) Machine for testing compressive strength with manual handle; (B) specimen at failure. Photographs by the authors.
The crushing loss was measured as the relative mass of particles less than 4 mm. The crushing was performed by hammering perpendicular to the surface until all fragments were below 10 mm. The crushed material was then sieved to separate the functional fragments (4–10 mm) from the lost material “dust” < 4 mm. As mentioned, a 20% mass of lost material was chosen as the maximum limit for a satisfactory result, but that might change depending on the specific application in a factory. The term Percentage Mass of Useful Material After Crushing (PMUMAC), meaning the mass percentage of the crushed foam concrete above 4 mm, is used to evaluate the mixes in the Section 3. The crushing stages are presented in Figure 8.
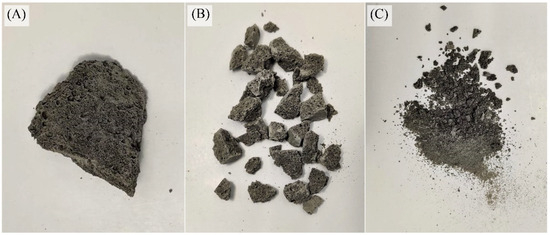
Figure 8.
Crushing a sample fragment: (A) original piece; (B) pieces 4–10 mm for use as aggregates in SL Decks; (C) “dust” < 4 mm. Photographs by the authors.
3. Results and Discussion
3.1. Part 1: Behaviour Without Fine Aggregates
3.1.1. Foaming Agents
Three different FAs were investigated in Part 1 of the experiments, cf. Table 3. Mixes P1.M3 and P1.M6 were identical, with the former produced using the foaming agent SL-200L and the latter EABASSOC. The samples cured for one day at room temperature (20 °C) are seen in Figure 9. The EABASSOC foaming agent sample had approximately 20% shrinkage and an unpleasant odour. The odour was considered a problem because the foam concrete was targeted for use in residential buildings. The same result was seen for the similar mixes P1.M4 (SL-200L) and P1.M7 (EABASSOC), which had a higher cement content. The use of the EABASSOC FA was therefore rejected.
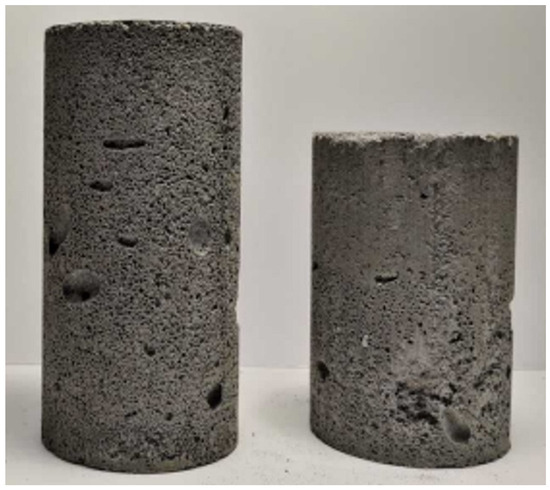
Figure 9.
Samples made using SL-200L (left) and EABASSOC (right) and cured for one day at room temperature. Photograph by the authors.
The FA by SIKA (LightCrete400) was examined as well. However, the mix could not be cast, as the foaming agent led to inhomogeneity with chunks of enclosed cement. Therefore, the SL-200L FA was chosen as the only relevant one in the subsequent tests with fine aggregates in Part 2.
3.1.2. Admixtures
“Part 1” of the experimental campaign aimed to investigate foam concrete types without fine aggregates. Generally, all samples of Part 1 (cf. Table 3) of the experimental campaign showed varying heights after curing, cracks, and a fragility that did not allow sufficiently precise monitoring of density and compressive strength. However, much information on the general behaviour of foam concrete without aggregates could be obtained.
The first two samples of “Part 1” (P1.M1 and P1.M2) were only cast in square blocks, as the aim was to evaluate the homogeneity visually. Both samples had densities below 250 kg/m3, see Figure 10. The figure shows a significant height difference, as the P1.M2 sample shrank while curing. P1.M1 did not shrink, and this was due to the addition of the admixture NWF-S to the mix. The additive benefited the foam concrete’s structure significantly at such low densities. P1.M1 had up to 4 mm voids, while P1.M2 had larger than 8 mm, which indicated that the addition of NWF-S avoided the collapse of many smaller pores into fewer larger pores. However, both samples were highly fragile, and the blocks were leaving excessive remains of “dust” particles (<4 mm). The material strength was too low for the specimens to be handled properly. Similar behaviour was observed in samples P1.M4 and P1.M5, where the foam content was reduced.
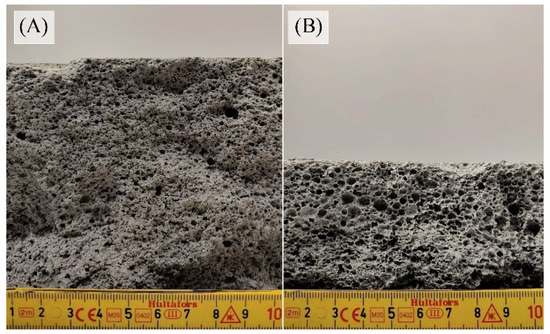
Figure 10.
Block samples: (A) P1.M1 with the admixture NWF-S; (B) P1.M2 without NWF-S. Photographs by the authors.
The initial mixes without fine aggregates were unsuitable for crushing, leading to Part 2 of the experiments.
3.2. Part 2: Behaviour with Fine Aggregates
The use of fine aggregates was investigated with a setup according to Table 4. Figure 11 shows a visual representation of the results of the different tested combinations. PMUMAC is the mass percentage of crushed foam concrete fragments larger than 4 mm. It was directly evident across all tests (from Figure 11) that the following was observed:
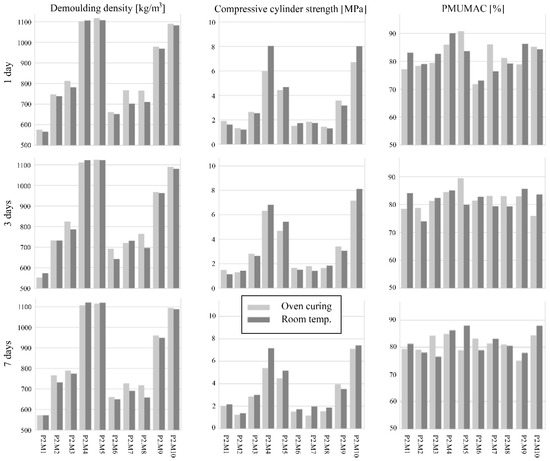
Figure 11.
Part 2 results: demoulding density, compressive strength, and PMUMAC for 1, 3, and 7 days of curing under two curing conditions (oven and room temperature).
- The demoulding densities of all the mixes did not change significantly from 1 to 7 days of curing.
- The PMUMAC in the specimens did not increase from 1 to 7 days, except for a few mixes, which could most likely be random due to the modest batch sizes or the arbitrary nature of the crushing method.
- A significant effect of oven curing could not be detected, though a tendency for an increase in demoulding density was observed with a maximum increase of 7% after curing for 1 day.
Based on the above bullets, the focus was limited to the fastest curing time of one day, and the specimens were cured at room temperature.
3.2.1. The Influence of Admixtures
The chosen admixtures from Table 1 were added to different mix designs, and it was found that the superplasticisers HE230 and NWF-S were advantageous by providing a higher compressive strength, which is favourable when demoulding and handling the foam concrete before crushing.
An example of this was seen by studying mixes P2.M2 and P2.M3. The mixes were equal except for adding the superplasticiser HE230 in the latter. The mix containing superplasticiser HE230 exhibited a 77% higher compressive strength and had 5% higher PMUMAC on average.
The 510-P superplasticiser was studied by comparing mixes P2.M4 and P2.M5, which were identical except for the type of superplasticiser. P2.M4 was produced using HE230, while P2.M5 used 510-P. The demoulding densities for both mixes were close to 1100 kg/m3, but the compressive strength of P2.M4 was close to 2 MPa higher on average.
When comparing HE230 and the liquid binder NWF-S in mixes P2.M6 and P2.M7, samples delivered similar compressive strength and demoulding densities. The dosage (% mass) of HE230 was smaller than for NWF-S, and therefore, a reduction in the use of chemicals could be achieved by choosing HE230. Nevertheless, there were indications that NWF-S would decrease the shrinkage of the mix compared to HE230, which should be investigated further in the future selection of an optimal mix design.
3.2.2. The Influence of Fine Aggregates and Mix Recommendations
In foam concrete production, it is impossible to use larger aggregates (>1 mm) due to the lightweight consistency, where the larger aggregates would “drop” and lead to an inhomogeneous mix.
Fine aggregates were tested in the foam concrete mixes to examine whether an effect could be achieved. The Part 1 experiments showed that it was impossible to produce lightweight foam concrete for crushing without fine aggregates and admixtures. The different fine aggregates (limestone, stone dust, and micro silica) tested were all possible to add while maintaining a homogeneous mix.
Figure 12 shows the compressive strength and corresponding PMUMAC of the tested samples. The horizontal red line shows the required minimum PMUMAC, and based on the linear regression of the results, a level of desired minimum compressive strength is found to be 2 MPa (the vertical red line).
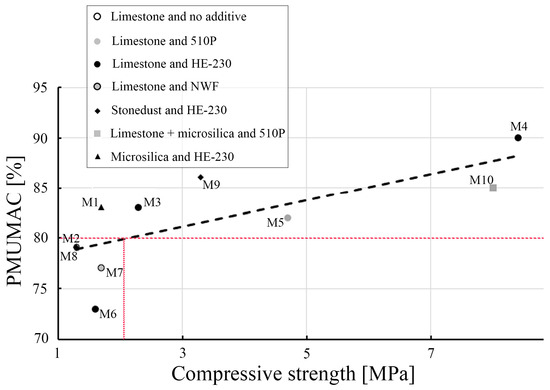
Figure 12.
Compressive strength and PMUMAC of Part 2 mixes after curing for one day at room temperature. The linear regression line has R2 = 0.54. The red line shows the required minimum PMUMAC, giving a minimum compressive strength of 2 MPa.
Figure 13 shows the relation between demoulding densities and compressive strengths after one day of curing at room temperature. Similar to the results in Figure 12, the compressive strength had a clear tendency to increase with the demoulding density, no matter what kind of fine aggregate was used.
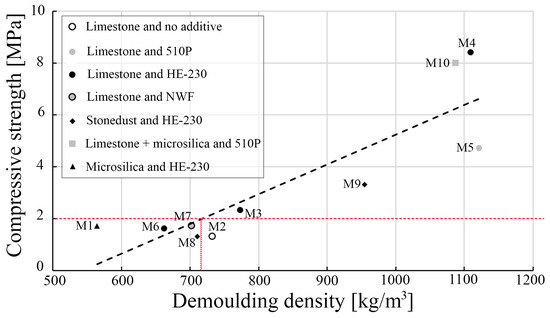
Figure 13.
Demoulding density and compressive strength of Part 2 mixes after curing for one day at room temperature. The linear regression line has R2 = 0.76. The red line shows that the expected minimum compressive strength of 2 MPa gives a minimum demoulding density of 715 kg/m3, cf. Figure 12.
Mixes P2.M8 and P2.M9 used stone dust as the fine aggregate, and both had a compressive strength below the linear tendency line in Figure 13. Because stone dust was time-consuming and costly to produce, and showed samples with the highest CO2 emissions, the recommendation, based on the results, would be to use one of the other fine aggregates instead.
The P2.M1 mix explored silica fume (micro silica) as fine aggregate. The product was costly, but the mix gave a low demoulding density of 565 kg/m3 when utilising the recommended amount of up to approximately 10% mass of the cement. The compressive strength of 1.7 MPa was relatively high for the density, and the mix also showed a relatively high PMUMAC, see Figure 12. Furthermore, the samples’ CO2 emission relative to LECA was lower than most other mixes (Table 4).
P2.M2 to P2.M7 were designed with limestone (CaCO3) as the fine aggregates. The mixes had a varying content of cement and different cement-to-limestone ratios (between 0.85 and 2.0), see Figure 14. The samples with the highest cement content exhibited a density higher than desired, but P2.M4, which had 303 kg cement/m3, also showed the highest compressive strengths and the best PMUMAC.
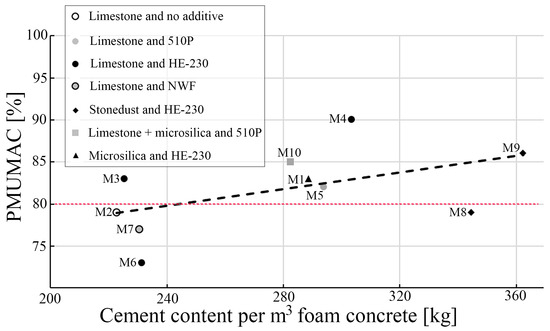
Figure 14.
Cement content and PMUMAC of Part 2 mixes after curing for one day at room temperature. The linear regression line has R2 = 0.26. The red line shows the required minimum PMUMAC.
P2.M3 had the lowest cement-to-limestone ratio of 0.85 and a cement content of 225 kg cement/m3. This mix showed a low demoulding density, adequate compressive strength, and PMUMAC. Nevertheless, the relatively high limestone content affected the texture of the samples, and the durability and properties of such a mix should be thoroughly investigated before being used as crushed aggregates in building slabs.
P2.M6 had the highest cement-to-limestone ratio of 2.0 and a cement content of 231 kg cement/m3. The lower limestone content meant the samples had an ordinary foam concrete texture. Still, the compressive strength and PMUMAC were less good compared with the above-mentioned specimens with higher limestone content.
Figure 14 provides a correlation (relatively low R2-value) between the cement content and the PMUMAC regardless of the type of fine aggregates and additives. There was no clear tendency for one of the fine aggregates to provide a superior mix regarding PMUMAC or CO2 emission. Therefore, the limestone could be considered exceptional due to its availability and low cost.
A foam-concrete mix design which fulfils a PMUMAC > 80%, cf. Figure 14 gives an expected minimum compressive strength of 2 MPa, cf. Figure 12. It would require an expected demoulding density of 715 kg/m3 as shown in Figure 13. Table 5 shows the possible candidates having a PMUMAC > 80% and includes all results. In the table, results outside the optimal range are highlighted (beyond a demoulding density of 715 to 800 kg/m3). P2.M3 had the lowest cement content pr. m3 foam concrete and a low CO2 eq, while P2.M1 provided the lowest CO2 eq and density, but with high cost due to the content of micro silica. P2.M3 could therefore be considered the optimal choice in this study.

Table 5.
Part 2 candidates for the foam-concrete mix design. Blue colour shows a demoulding density below the expected, and orange samples are above the required.
4. Conclusions
In the study, several different foam concretes are tested and assessed for use as aggregates (4 to 10 mm) in SL concrete decks’ light blocks.
Based on the experimental procedure and the proposed mixes, the following can be concluded:
- In Part 1, with no fine aggregates added to the mixes, the foaming agent SL-200L is the best choice to avoid foul odours and maintain a homogenous mix.
- In Part 2, with mixes containing admixtures and fine aggregates:
- o
- The mixing technique is optimal using a hand mixer tool with high revolutions.
- o
- The mix P2.M3 with low cement content, limestone and admixture HE-230 based on polycarboxylates has sufficiently large crushing potential (PMUMAC), adequate compressive strength, and low demoulding density.
- o
- The samples are cured inside the moulds in a tight plastic bag short time (one day) and at room temperature before demoulding.
- o
- The crushing method gives a high degree of deviations in the PMUMAC results, and the development of an optimised method is recommended in any further studies.
Overall, mixes with no fine aggregates of lower density resulted in a high amount of crushing loss. Additionally, a higher strength was not found to be directly correlated with the crushing percentage, and a curing time of more than 24 h is not necessary. All satisfactory samples leading to a loss (dust remains) of approximately 10% had a density of 1100 kg/m3 or higher, which is significantly more than the target LECA density of 300 to 500 kg/m3. Future studies must be conducted to further evaluate the potential of these mixes.
Author Contributions
A.K.: conceptualisation, methodology, formal analysis, investigation, writing—original draft, and visualisation. P.S.H.: conceptualisation, resources, supervision, writing—original draft, writing—review and editing, and visualisation. K.K.H.: conceptualisation, methodology, supervision, and writing—review and editing. All authors have read and agreed to the published version of the manuscript.
Funding
This research received no specific grant from public, commercial, or not-for-profit funding agencies. The materials for testing were donated by the Danish company Abeo (Beredskabsvej 12, DK-2640, Denmark).
Data Availability Statement
The original contributions presented in this study are included in the article. Further inquiries can be directed to the corresponding author.
Acknowledgments
The authors would like to thank Abeo for providing the materials for the laboratory tests. We also wish to thank the staff at the Concrete Lab in DTU for their help during the experimental work.
Conflicts of Interest
The authors declare no conflicts of interest. Abeo did not contribute to the work and writing, and they did not have any influence on the decision to submit the article.
Abbreviations
The following abbreviations are used in this manuscript:
| LECA | Lightweight Expanded Clay Aggregate |
| FA | Foaming Agent |
| SCM | Supplementary Cementitious Material |
| PMUMAC | Percentage Mass of Useful Material After Crushing |
References
- Valore, R.C. Cellular Concretes Part 1 Composition and Methods of Preparation. ACI J. Proc. 1954, 50, 773–796. [Google Scholar] [CrossRef] [PubMed]
- Ramamurthy, K.; Nambiar, E.K.K.; Ranjani, G.I.S. A classification of studies on properties of foam concrete. Cem. Concr. Compos. 2009, 31, 388–396. [Google Scholar] [CrossRef]
- Nambiar, E.K.K.; Ramamurthy, K. Air-void characterisation of foam concrete. Cem. Concr. Res. 2007, 37, 221–230. [Google Scholar] [CrossRef]
- Wee, T.H.; Babu, D.S.; Tamilselvan, T.; Lim, H.S. Air-void system of foamed concrete and its effect on mechanical properties. ACI Mater. J. 2006, 103, 45–52. [Google Scholar] [CrossRef] [PubMed]
- Zhou, G.; Su, R.K.L. A Review on Durability of Foam Concrete. Buildings 2023, 13, 1880. [Google Scholar] [CrossRef]
- Khan, M.; Shakeel, M.; Khan, K.; Akbar, S.; Khan, A. A Review on Fiber-Reinforced Foam Concrete. Eng. Proc. 2022, 22, 13. [Google Scholar] [CrossRef]
- Laukaitis, A.; Fiks, B. Acoustical properties of aerated autoclaved concrete. Appl. Acoust. 2006, 67, 284–296. [Google Scholar] [CrossRef]
- Yang, K.H.; Lee, K.H.; Song, J.K.; Gong, M.H. Properties and sustainability of alkali-activated slag foamed concrete. J. Clean. Prod. 2014, 68, 226–233. [Google Scholar] [CrossRef]
- Jones, M.R.; McCarthy, A. Heat of hydration in foamed concrete: Effect of mix constituents and plastic density. Cem. Concr. Res. 2006, 36, 1032–1041. [Google Scholar] [CrossRef]
- Jones, M.R.; McCarthy, A. Behaviour and assessment of foamed concrete for construction applications. In Proceedings of the International Conference on the Use of Foamed Concrete in Construction, Dundee, UK, 5 July 2005; pp. 61–88. [Google Scholar]
- Kadela, M.; Kozłowski, M.; Kukiełka, A. Application of Foamed Concrete in Road Pavement—Weak Soil System. Procedia Eng. 2017, 193, 439–446. [Google Scholar] [CrossRef]
- Jones, R.; Zheng, L.; Yerramala, A.; Rao, K.S. Use of recycled and secondary aggregates in foamed concretes. Mag. Concr. Res. 2012, 64, 513–525. [Google Scholar] [CrossRef]
- Raj, A.; Sathyan, D.; Mini, K.M. Physical and functional characteristics of foam concrete: A review. Constr. Build. Mater. 2019, 221, 787–799. [Google Scholar] [CrossRef]
- Kearsley, E.P.; Wainwright, P.J. The effect of high fly ash content on the compressive strength of foamed concrete. Cem. Concr. Res. 2001, 31, 105–112. [Google Scholar] [CrossRef]
- Pickford, C.; Crompton, S. Foamed concrete in bridge construction. Concrete 1996, 30, 14–15. [Google Scholar]
- Fujiwara, H.; Sawada, E.; Ishikawa, Y. Manufacture of high-strength aerated concrete containing silica fume. In Fly Ash, Silica Fume, Slag, and Natural Pozzolans in Concrete—Proceedings, Fifth International Conference, Vols 1 and 2, 153; American Concrete Institute: Farmington Hills, MI, USA, 1995; pp. 779–794. [Google Scholar]
- Aldridge, D.; Ansell, T. Foamed concrete: Production and equipment design, properties, applications and potential. In Proceedings of the One Day Seminar on Foamed Concrete: Properties, Applications and Latest Technological Developments, Loughborough University, Loughborough, UK, 19–26 July 2001; pp. 1–7. [Google Scholar]
- Khan, Q.S.; Sheikh, M.N.; McCarthy, T.J.; Robati, M.; Allen, M. Experimental investigation on foam concrete without and with recycled glass powder: A sustainable solution for future construction. Constr. Build. Mater. 2019, 201, 369–379. [Google Scholar] [CrossRef]
- AL-Thairy, H.; Zareei, S.A.; Sallal, A.K.; Hanoon, D.S. Behavior of foam concrete flat panel and applications of foam concrete in construction works. Innov. Infrastruct. Solut. 2023, 8, 186. [Google Scholar] [CrossRef]
- Nambiar, E.K.K.; Ramamurthy, K. Influence of filler type on the properties of foam concrete. Cem. Concr. Compos. 2006, 28, 475–480. [Google Scholar] [CrossRef]
- Jones, M.R. Foamed concrete for structural use. In Proceedings of the One Day Seminar on Foamed Concrete: Properties, Applications and Latest Technological Developments, Loughborough University, Loughborough, UK, 19–26 July 2001; pp. 27–60. [Google Scholar]
- Tarasenko, V.N. Non-autoclaved Foam Concrete with Improved Foam Characteristics. In Environmental and Construction Engineering: Reality and the Future; Lecture Notes in Civil Engineering; Springer: Cham, Switzerland, 2021; Volume 160, pp. 75–81. [Google Scholar] [CrossRef]
- Aldridge, D. Introduction to foamed concrete: What, why, how? In Proceedings of the International Conference on the Use of Foamed Concrete in Construction, Dundee, UK, 5 July 2005; pp. 1–14. [Google Scholar]
- Amran, Y.H.M.; Farzadnia, N.; Ali, A.A.A. Properties and applications of foamed concrete; a review. Constr. Build. Mater. 2015, 101, 990–1005. [Google Scholar] [CrossRef]
- Koudriashoff, I.T. Manufacture of reinforced foam concrete roof slabs. Am. Concr. Inst.-J. 1949, 21, 37–48. [Google Scholar]
- Bindiganavile, V.; Hoseini, M. Foamed concrete. In Developments in the Formulation and Reinforcement of Concrete; Elsevier: Amsterdam, The Netherlands, 2019; pp. 365–390. [Google Scholar] [CrossRef]
- Hertz, K.D.; Halding, P.S. Sustainable Light Concrete Structures; Springer: Berlin/Heidelberg, Germany, 2022. [Google Scholar] [CrossRef]
- Environmental Product Declaration. Carbonates from quarry. Gola della Rossa Mineraria S.p.A. valid from 2022 to 2027. Available online: https://www.environdec.com/library/epd5876 (accessed on 30 August 2025).
- Environmental Product Declaration. Silica fume. Quanzhou Winitoor Import and Export Co., LTD. Valid from 2024 to 2029. Available online: https://www.environdec.com/library/epd5963 (accessed on 30 August 2025).
- Hertz, K.D. Super-light SL-Deck elements with fixed end connections. In Proceedings of the Fib Symposium 2015, fib, the International Federation for Structural Concrete, Copenhagen, Denmark, 18–20 May 2015; pp. 465–466. [Google Scholar]
- CEN, EN 197-1; Cement—Part 1: Composition, Specifications and Conformity Criteria for Common Cements. European Committee for Standardization: Brussels, Belgium, 2011; p. 38.
Disclaimer/Publisher’s Note: The statements, opinions and data contained in all publications are solely those of the individual author(s) and contributor(s) and not of MDPI and/or the editor(s). MDPI and/or the editor(s) disclaim responsibility for any injury to people or property resulting from any ideas, methods, instructions or products referred to in the content. |
© 2025 by the authors. Licensee MDPI, Basel, Switzerland. This article is an open access article distributed under the terms and conditions of the Creative Commons Attribution (CC BY) license (https://creativecommons.org/licenses/by/4.0/).