Article

Research on Distribution DSS Conceptual Framework of Textile Logistics in Textile Markets †

School of Economics and Management, Zhejiang University of Science and Technology, Hangzhou 310023, China
*
Author to whom correspondence should be addressed.
① “Cloth” up! Textile city turnover exceeded 360 billion yuan. https://www.sx.gov.cn/art/2024/1/15/art_1462941_59530502.html (accessed on 6 March 2025). (In Chinese).
Appl. Sci. 2025, 15(17), 9755; https://doi.org/10.3390/app15179755
Submission received: 28 March 2025 / Revised: 21 April 2025 / Accepted: 22 May 2025 / Published: 5 September 2025
(This article belongs to the Special Issue Optimization and Simulation Techniques for Transportation)

Abstract

This paper aims to study a distribution decision support system (DSS) conceptual framework for textile logistics, combining the operational requirements of logistics enterprises in textile markets to optimize vehicle surplus tonnage usage and distribution flexibility, using the integrated computer-aided manufacturing definition (IDEF) method and developing a comprehensive conceptual framework for textile logistics distribution decisions, complemented by an in-depth analysis of its underlying database structure. Further, this paper constructs the model base and proposes two vehicle-loading models and their solving algorithms, including one model with constraints on the maximum loading rate and the other with constraints on the smallest vehicle numbers, with these algorithms implemented by linear programming in operational research and performed by programming techniques. This paper also constructs the method base and designs some methods, such as the method of vehicle surplus tonnage utilization, the method of vehicle-loading priority order selection, and the simultaneous loading method of multi-freight cargo and multiple vehicles; these methods are implemented by the database principle and technological or programming techniques. We use a test distribution DSS conceptual framework to run the data example and obtain a good test result. The findings indicate that the DSS conceptual framework can integrate the model and method bases and can also solve the hard problems of the use of surplus tonnage vehicles and simultaneous loading.

1. Introduction

There are many different types and a large variety of textiles in China. Common textiles include clothing fabrics, household textiles, etc. The main sale sources are large textile markets. Large-scale textile markets include Shaoxing China Textile City, China Nantong Home Textile City, Jiangsu Wujiang Oriental Silk Market, and so on. Among them, the annual transaction volume of the Shaoxing China Textile City market exceeds CNY 100 billion , which has a significant impact. At present, the textile trade in China is mainly based on offline trade in the textile market, and the proportion of online trade is not large. In 2023, the turnover of Zhejiang (Shaoxing) China Textile City group was CNY 271.636 billion, and the turnover of the Textile City online market was CNY 89.309 billion, indicating most of it was carried out offline . One reason why textiles differ from other commodities is that they are non-standard products with softness, thickness, color variation, texture, and other qualities. If a buyer (such as a clothing company, trader, wholesaler, independent contractor, etc.) wants to buy a large quantity of textile fabrics, they typically go to the location to make the purchase. Another reason is that, in order to reduce the possibility of counterfeit goods, new textile fabrics are typically not listed online. As a result, offline or on-site transactions account for the greatest bulk of transactions. The business flow in a textile market is shown in Figure 1.
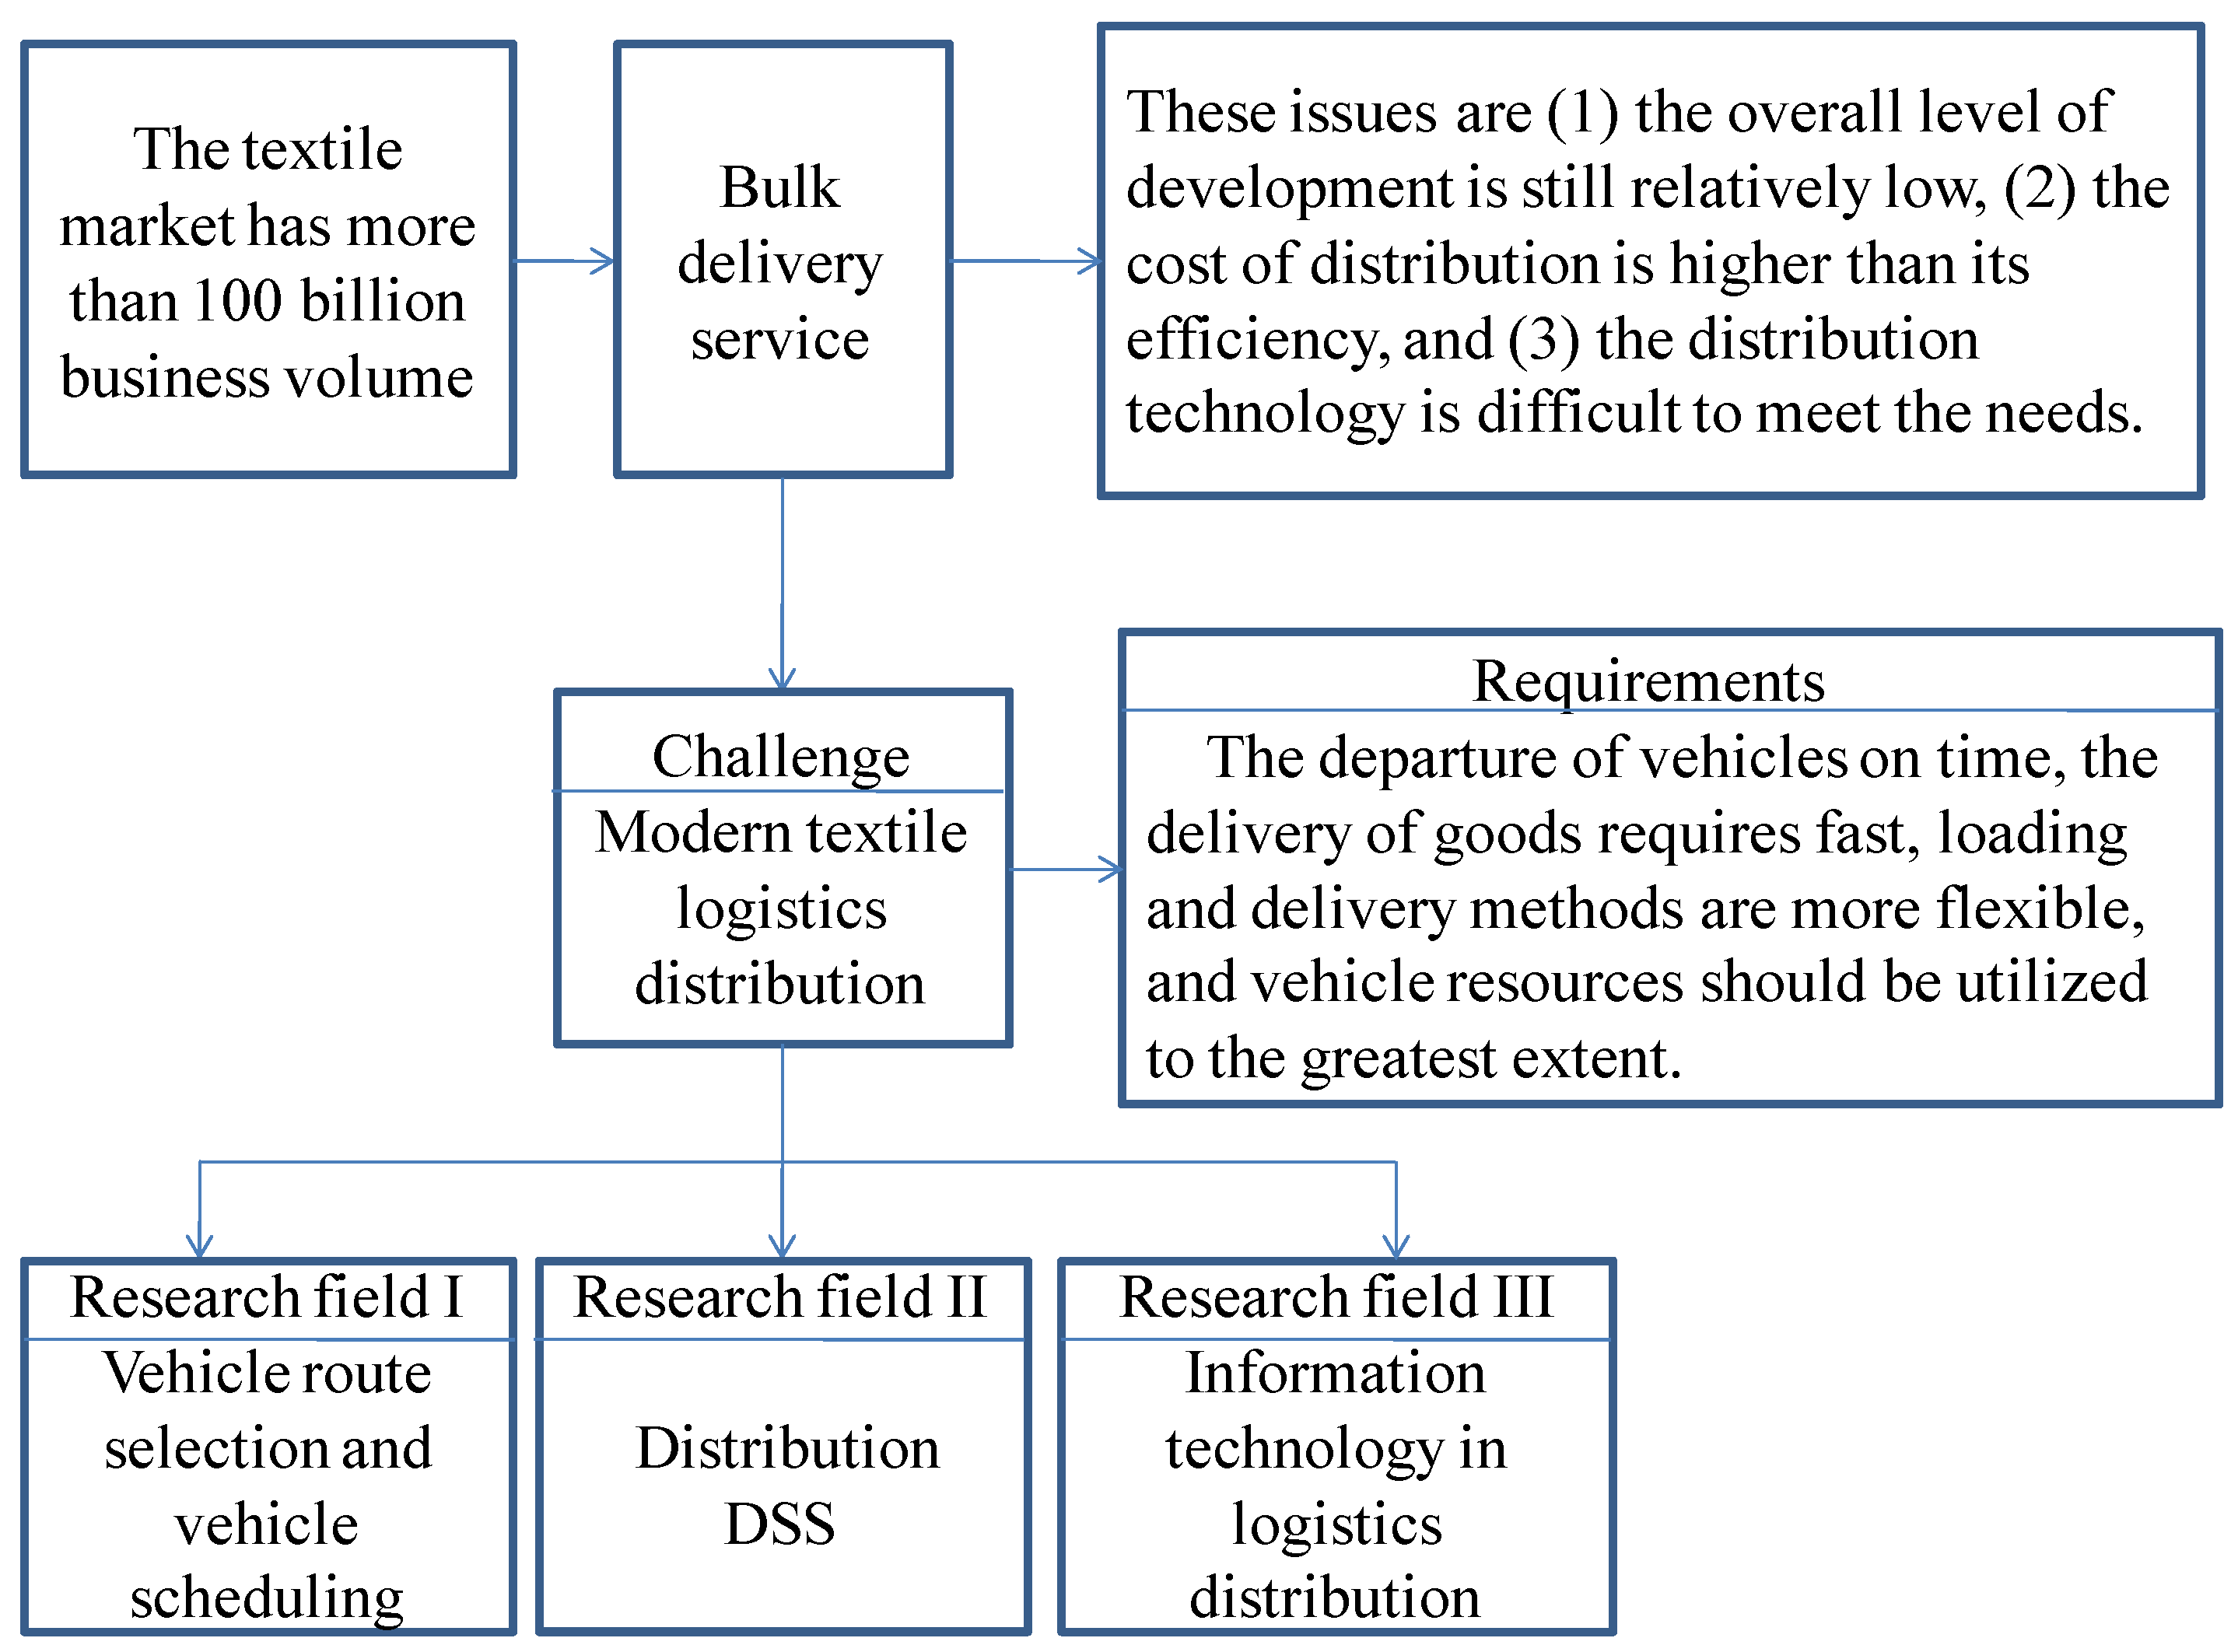
While substantial progress has been made in textile logistics within various markets, several challenges persist when compared with practices in more developed nations or regions. These issues are that (1) the overall level of development is still relatively low, (2) the cost of distribution is higher than its efficiency, and (3) the distribution technology struggles to meet its needs.
Textile logistics needs modern logistics distribution; a logical structure and flow are shown in Figure 2.
There are relatively few studies on textile logistics because it is mainly based on bulky transportation and, in reality, it is very difficult for the delivery to be made in a very short time (a few hours or a day). Therefore, this research has tried to improve efficiency and effectiveness through a decision support system, from the receipt of goods and loading to departure. However, constructing a modern textile logistics distribution is a challenge, as it requires the departure of vehicles on time, the delivery of goods requires fast loading and more flexible delivery methods, and vehicle resources should be utilized to the greatest extent.
Due to the complexities of vehicle loading and vehicle resource recycling, distribution DSSs for textile logistics are still relatively rare. In academic circles, domestic and foreign scholars’ research on logistics distribution mainly focuses on three fields: vehicle route selection and vehicle scheduling, distribution DSSs, and the application of information technology in logistics distribution.
The first field, namely, the research on vehicle route selection and vehicle scheduling, began in the 1920s and 1930s. Up to now, more research results have been achieved in this field abroad. Recent examples include Jbili et al. [1], Hintsch et al. [2], Kulkarni et al. [3], Gansterer et al. [4], Noorizadeganr et al. [5], Bruglieri et al. [6], Breunig et al. [7], and other scholars. Erfan Babaee Tirkolaee et al. [8,9] have made contributions in this field, and most of their research focused on an algorithm and its improvement. We think that today’s vehicle routing can be performed by navigation systems. In China, the related research started late, but a number of representative research results have emerged. For example, Guo et al. [10], Wang et al. [11], Yao et al. [12], Guo et al. [13], Yang et al. [14], Jiang et al. [15], Ge et al. [16], Hua et al. [17], Miao et al. [18], Song et al. [19], and Yang et al. [20] have also recently carried out a lot of research on vehicle scheduling and modeling, and some of them began to study the textile or garment logistics distribution problem. For textile and garment logistics, Hua et al. [17] proposed a time-efficient route model for garments and vehicles, which was solved by using the improved ant colony algorithm to obtain better results. The problem of vehicle routing and selection in Chinese textile logistics has begun to increase, but compared with China’s textile industry, the relevant studies are slightly insufficient.
In the second field, namely the study of distribution DSSs (or distribution decision optimization), Kengpol et al. [21] designed a DSS to evaluate the logistics distribution network operation in Greater Mekong Subregion countries. It could provide a reference for the Greater Mekong Subregion economic cooperation countries on how to reduce transportation costs between distribution centers and customers and how to improve customer satisfaction. Accorsi et al. [22] proposed a DSS for warehouse system design, management, and control. The DSS adopted a top-down design method and considered both strategic warehouse design and feasible operation management. Through this DSS, the logistics and material handling efficiency of the warehouse system could be simulated. Fikar [23] addressed the high cost and food waste (such as spoilage) caused by delays and inefficiencies in e-commerce grocery delivery. In order to optimize inventory and improve distribution efficiency, a DSS for investigating e-commerce food distribution losses was proposed, which could be used to analyze and support sustainable food supply. In terms of textile and garment logistics, there are few relevant studies. Wang et al. [24] proposed a distribution decision-making method based on the shortest distance and maximum supply matching criterion for garment enterprises to achieve the shortest distribution mileage, which was also a feasible distribution strategy. However, few people have studied distribution DSSs in detail for the textile industry.
In the third field, namely the research of information technology in logistics distribution, research involves a wide range of areas, more achievements, and most of them tend to technical application. Regarding Extensible Markup Language (XML), electronic data interchange (EDI), location-based service (LBS), electronic ordering systems (EOSs), as well as logistics geographic information systems (GISs), the Global Positioning System (GPS), and other key logistics distribution information technologies, such as metaheuristics (Zhang et al. [25]) or AI (Ye et al. [26]), these technologies play an important supporting role in the realization of the entire logistics distribution system function. In addition, barcodes, radio frequency, simulation, and other technologies have also been widely used in logistics distribution. In recent years, the Internet of Things technology has been assigned great importance by the Chinese government. Not only are the National Development and Reform Commission, the Ministry of Industry and Information Technology, and the Academy of Engineering planning to use the Internet of Things, but also some literature in Chinese academic circles has studied the application of Internet of Things technology in logistics distribution (Han and Du [27]; Li et al. [28]; Lu [29]; Li [30]). In terms of textile and garment logistics, there are also some scholars who try to combine the Internet of Things (IOT) technology with logistics distribution for research, but for now, the relevant studies are not deep enough and still need to be strengthened. However, we are also optimistic that IOT technology will be widely used in textile logistics distribution.
Based on the analyses above, there are research gaps: (1) there is relatively little literature on textile logistics distribution DSSs, and it is necessary to study an integrated research framework in DSSs. (2) There is relatively little literature discussing the hard problems of using surplus tonnage vehicles and simultaneous loading. (3) There is relatively little literature discussing distribution knowledge criteria.
The contributions of this paper include: (1) design of a DSS framework tailored for textile logistics. A database and model base and method base are also integrated into it and the algorithms are implemented by linear programming. (2) Solving the hard problems of using surplus tonnage vehicles and simultaneous loading of multi-freight bills and multi-vehicles. (3) The design of distribution knowledge criteria and improvement in the efficiency of DSSs.
The contributions are different from the current literature. Therefore, based on the logistics business in the textile market, the authors of this paper conduct a theoretical study of the textile logistics DSS and finally design a systematic DSS, solving the above hard problems skillfully.

2. Theoretical Model of Distribution DSS Conceptual Framework of Textile Logistics

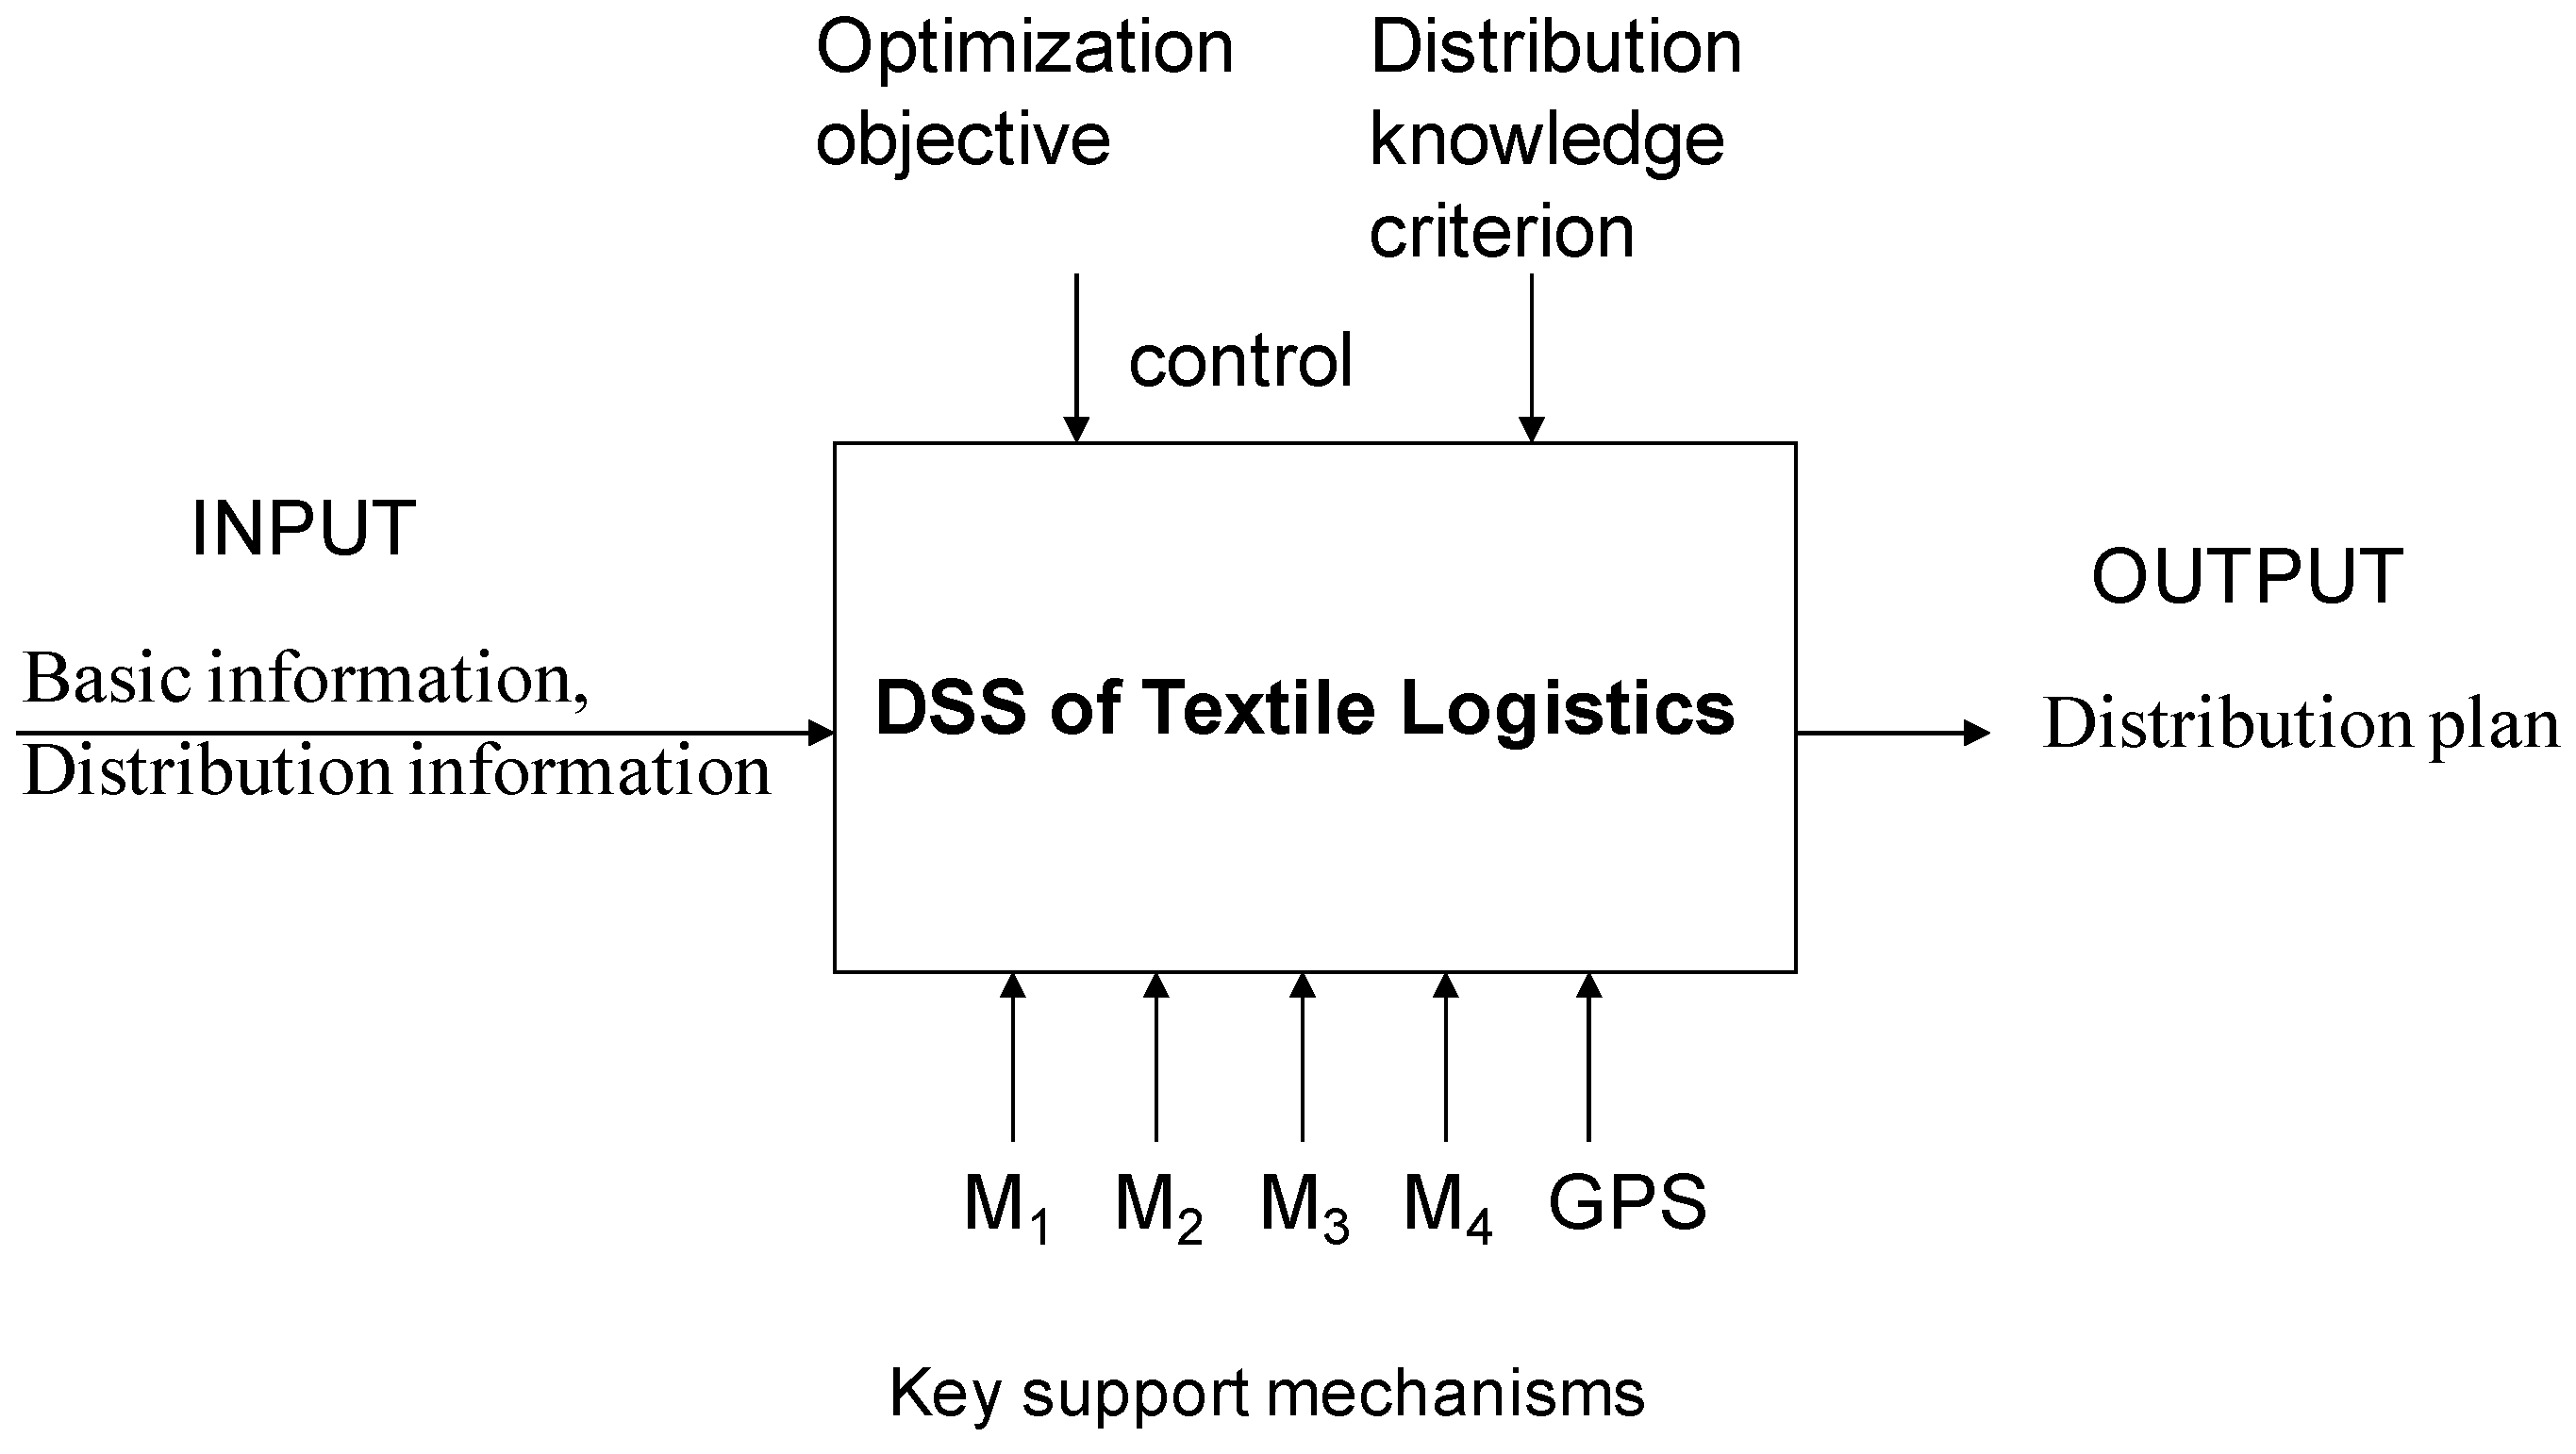
The paper uses an integrated computer-aided manufacturing definition (IDEF) method for reference and proposes a theoretical model of a textile logistics DSS, as shown in Figure 3 below:
Figure 3 mainly includes input, control, mechanism, and output, which are introduced in detail below.

2.1. Input Link

The input link mainly includes the input of basic information, distribution information, and other information. Due to the relatively developed on-board navigation system, this system can solve the less container load (LCL) problem of the same destination (or similar destinations), while the geographic information and vehicle route problems are optimized by an on-board navigation system (such as AmAP). Basic information includes customer information, vehicle information, user login information, etc. Distribution information includes receiving goods information, freight bill information, etc.

2.2. Control Link

In the control link, the optimization objective refers to the highest loading rate or the lowest use of vehicles, and the optimization objective is set according to the actual situation of each distribution. Distribution knowledge criteria include: vehicle status management criteria, freight bill service criteria, vehicle-loading criteria.
(1) Vehicle status management criteria: In the distribution task, the total number of vehicles is set to n, and the vehicles are sorted and serial-numbered according to the order of tonnage from large to small, expressed by a tuple as ( i , u i , w i , y i ) , i = 1 , 2 , , n . Here, i is the vehicle serial number, u i indicates the tonnage of the i t h vehicle, w i indicates the status of the i t h vehicle, w i { 0 , 2 , 4 , 6 } , and the vehicle statuses are divided into four types: empty status ( w i = 0 ), not fully loaded status ( w i = 2 ), fully loaded status ( w i = 4 ), and dispatching status ( w i = 6 ). y i = 1 indicates that the i t h vehicle is owned, and y i = 0 indicates that the i t h vehicle is non-owned (external vehicle). The serialization of vehicles in this way is called the vehicle status management criteria. The changes of vehicle usage status are shown in Figure 4 below:
(2) Freight bill service criteria: Assign freight bill to each customer’s goods (textile fabrics), and then arrange transport vehicles for each freight bill. “Urgent priority, large amount priority, LCL priority” is the order in which decision makers allocate the freight bill. In detail, according to the delivery time, quantity, and location requirements of the freight bill, the delivery shall be carried out according to the following priority criteria. ① Urgent delivery freight bills should be prioritized to distribute. ② In the delivery time of similar freight bills, the largest loading quantity of freight bills will be prioritized to distribute. ③ Under the LCL conditions, delivery date is similar will be prioritized to distribute.
(3) Vehicle-loading criteria: In the process of vehicle loading, for the determined distribution place and the determined freight amount, in the case of the same loading capacity and a variety of vehicle combinations, decision makers should choose the largest tonnage of vehicles (in other words, decision makers choosing a large tonnage of vehicles can reduce the number of vehicles dispatched under the same loading rate).
Vehicle loading criteria can help decision makers balance the number of vehicles dispatched according to the actual situation and fine-tune the selection of vehicles before the execution of the distribution decision operation to avoid the occurrence of dispatching one vehicle more than others. When a vehicle has been selected, as far as possible a customer’s goods should not be separated into different vehicles to ensure the integrity and accuracy of the customer’s receipt.

2.3. Mechanism Link

The key support mechanism includes: decision-making personnel ( M 1 ), basic and distribution database ( M 2 ), model base ( M 3 ), method base ( M 4 ), Global Positioning System (GPS). As mentioned above, M 1 should follow the freight bill service criteria when carrying out the distribution decision service for the freight bill, and the vehicle-loading criteria should be followed in the vehicle loading. M 2 is the basis of DSS operation, M 3 and M 4 are conducive to intelligent distribution and providing decision support for distribution. The support of GDP is also essential. The paper uses an in-vehicle navigation system (such as AmAP) for route selection and optimization, which makes the system focus on the core issues of vehicle status, freight bill service, vehicle loading, and other aspects, especially to solve the use of surplus tonnage of vehicles. There are some important problems, such as multi-vehicle loading with a multi-freight bills, optimization of the vehicle-loading sequence, intermediate transfer loading, and return vehicle check-in. Among them, the problem of utilization of surplus vehicle tonnage is a difficult problem in distribution decision making, which will be solved skillfully in this paper and will be described in detail below.

2.4. Output Link

In the output link, the distribution plan mainly includes the distribution list of vehicle loading, the transfer loading list, and the output and printing of the departure history information of various vehicles. To sum up, in the overall functional model in Figure 3, the distribution decision is based on geographic information, basic information, and distribution information under the control of optimization objectives and distribution knowledge criteria and, through the operation of the distribution DSS, the optimal distribution scheme is obtained through the support mechanism of decision makers, basic and distribution databases, model base, method base, and GPS.

3. Research on Database, Model Base, and Method Base

3.1. Research on Basic and Distribution Database

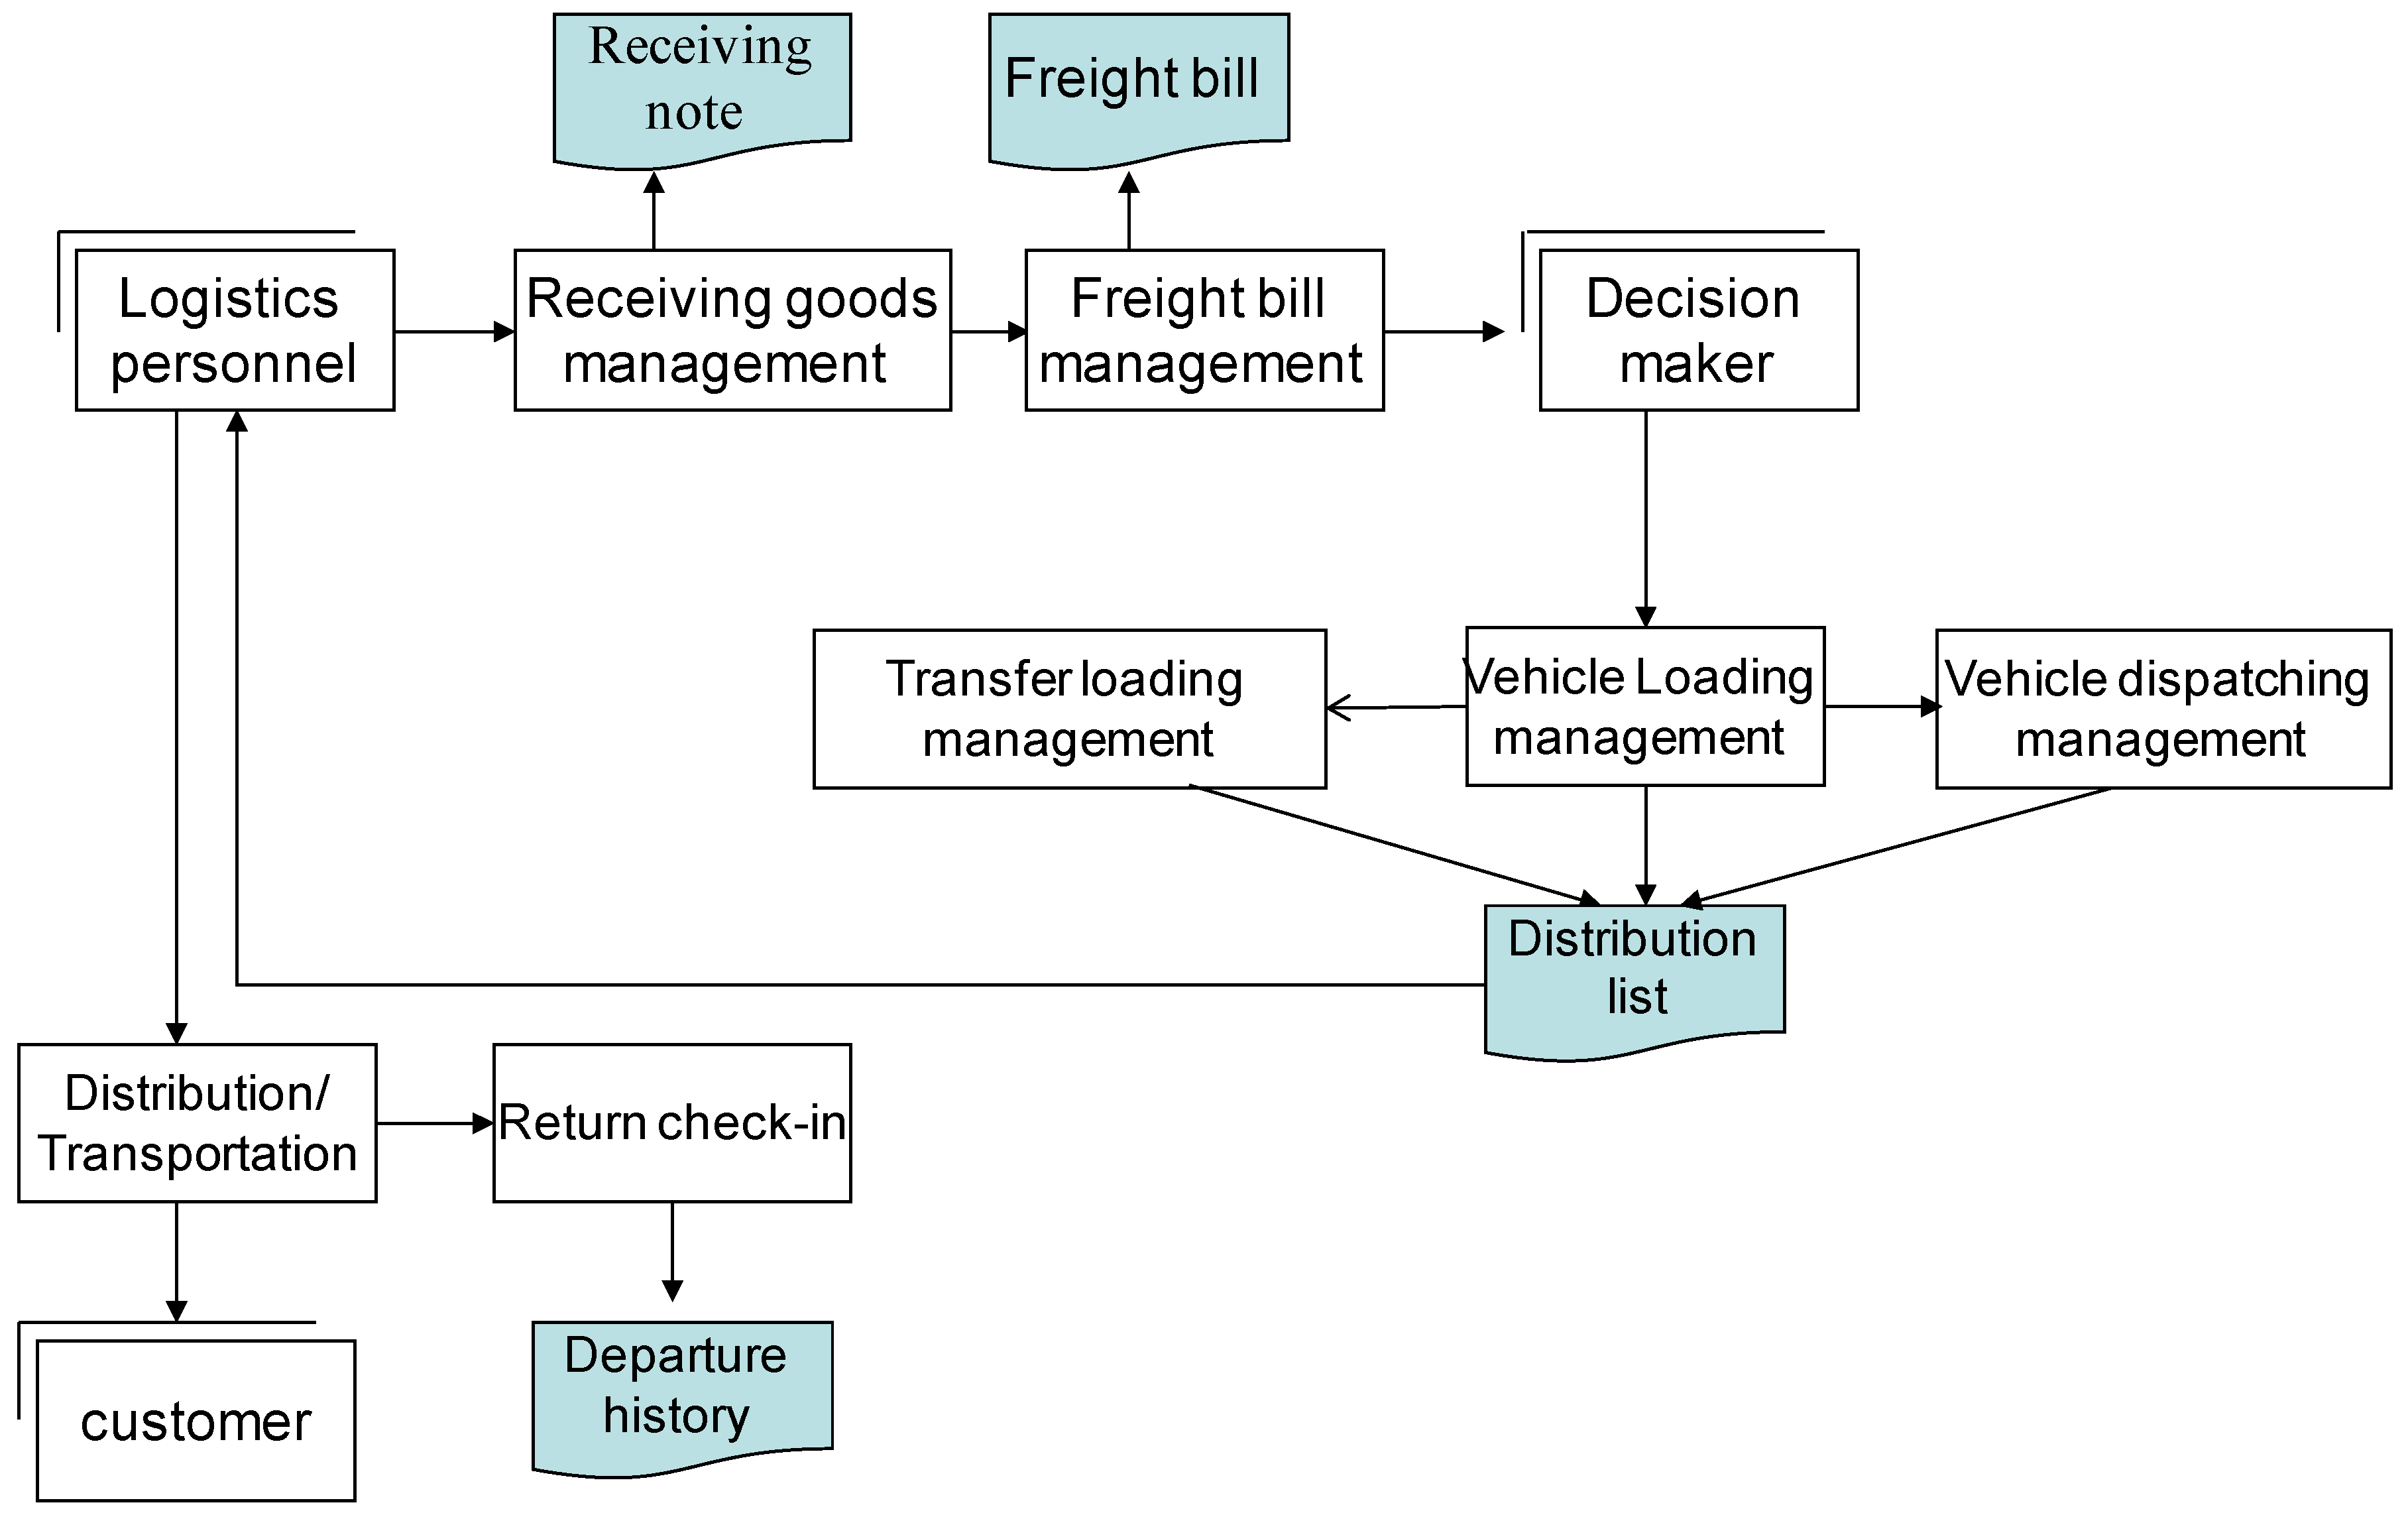
According to the characteristics and functions of the DSS, the data flow chart of the DSS is specially designed, as shown in Figure 5:
Figure 5 illustrates how logistics personnel must provide a receipt to the customer upon receiving the goods, enter all received goods data into the system, and then produce a freight bill. Decision makers follow the freight bill service criterion and vehicle-loading criterion to load the freight bill. After loading is completed, the DSS changes the status of the selected vehicles (not fully loaded or fully loaded status) and generates a distribution bill for the fully loaded vehicles and then dispatches the vehicles on time according to the company’s requirements (the vehicles that are not fully loaded can also be dispatched or wait for the next loading). Logistics personnel then deliver the goods to customers. After the delivery is completed, the vehicle returns, and the vehicle can be reconfigured as empty after the return check-in. Through this process, the resource of the vehicle is recycled. According to the function of the textile logistics distribution DSS, a more general database structure is designed. The built basic and distribution database is shown in Table 1.
In an environment of large volumes of data, we will design another three history data tables (TransRecordhistory, Billhistory, and BillDecohistory) to save the migration data from the original data tables (TransRecord, Bill, and BillDeco). Thus, the integrity and consistency of the data are guaranteed.

3.2. Research on Model Base and Method Base

3.2.1. Construction of Model Base

(1) The vehicle-loading model constrained by the maximum loading rate (model I).
The model takes into account the situation of maximum loading rate and extremely low freight turnover. The maximum loading rate is the primary objective, and the extremely low freight turnover is the secondary objective (the objective can be considered after the route is determined by the on-board navigation system). The definitions of variables are shown in Table 2.
According to the above variable definitions, the objective of model I is the maximum loading rate, and model I is designed as follows:
max Z 1 = j J i = 1 n f i x i ( j ) / i = 1 n f i u i
s.t. j J i = 1 n f i x i ( j ) = Q , equivalence constraint.
x i ( j ) f i u i , i = 1 , , n , j J , no-overload constraint.
f i { 0 , 1 } , i = 1 , , n , a 0–1 decision variable constraint.
x i ( j ) 0 , i = 1 , , n , j J , constraint of load number greater than zero.
In model I, the constraints include an equivalence constraint of decision variables (namely, the sum of the load capacity of the selected vehicle equals Q), a no-overload constraint, a 0–1 decision variable constraint, and a constraint of load number greater than zero.
The maximum loading rate is: Z 1 . The lowest value of freight turnover is: j J i = 1 n s i ( j ) f i x i ( j ) . It should be noted that a very low freight turnover is not necessarily the lowest, which is restricted by the maximum loading rate of the primary objective, and a very low freight turnover of the secondary objective is required to be completed with the assistance of the vehicle navigation system.
Obviously, model I has no restrictions on mixed goods loading, and it can be further expanded into the restricted mixed goods loading model (MGLM). For a specific h (such as the demand at the distribution place h is very high), one submodel of the MGLM is denoted as Z 1 h :
max Z 1 h = j J i = 1 n l L p P f i x h , i , l , p ( j ) / i = 1 n f i u i s . t . j J i = 1 n l L p P f i x h , i , l , p ( j ) = Q h j J l L p P f i x h , i , l , p ( j ) f i u i ,   i = 1 , , n , j J , l L , p P     f i { 0 , 1 } , i = 1 , , n     x h , i , l , p ( j ) 0 ,   i = 1 , , n , j J , l L , p P
For a specific p (such as there are an extremely large number of p types of goods), another submodel of the MGLM is denoted as Z 1 p :
max Z 1 p = j J h H i = 1 n l L f i x h , i , l , p ( j ) / i = 1 n f i u i s . t . j J h H i = 1 n l L f i x h , i , l , p ( j ) = Q p j J h H l L f i x h , i , l , p ( j ) f i u i   ,   i = 1 , , n , j J , l L , p P     f i { 0 , 1 } , i = 1 , , n     x h , i , l , p ( j ) 0 ,   i = 1 , , n , j J , l L , p P
For a specific l (such as a major client l ), the third submodel of the MGLM is denoted as Z 1 l :
max Z 1 l = j J h H i = 1 n p P f i x h , i , l , p ( j ) / i = 1 n f i u i s . t . j J h H i = 1 n p P f i x h , i , l , p ( j ) = Q l j J h H p P f i x h , i , l , p ( j ) f i u i ,   i = 1 , , n , j J , l L , p P     f i { 0 , 1 } , i = 1 , , n     x h , i , l , p ( j ) 0 ,   i = 1 , , n , j J , l L , p P
(2) A vehicle-loading model constrained by the minimum number of vehicles (model II).
The objective of model II is the minimum number of vehicles, and model II is designed as follows:
min Z 2 = i = 1 n f i s . t . j J i = 1 n f i x i ( j ) = Q x i ( j ) f i u i , i = 1 , , n , j J f i { 0 , 1 } , i = 1 , , n x i ( j ) 0 , i = 1 , , n , j J
In model II, the constraints are the same as those of model I. Minimum number of vehicles: Z 2 . The lowest value of freight turnover is: j J i = 1 n s i ( j ) f i x i ( j ) .
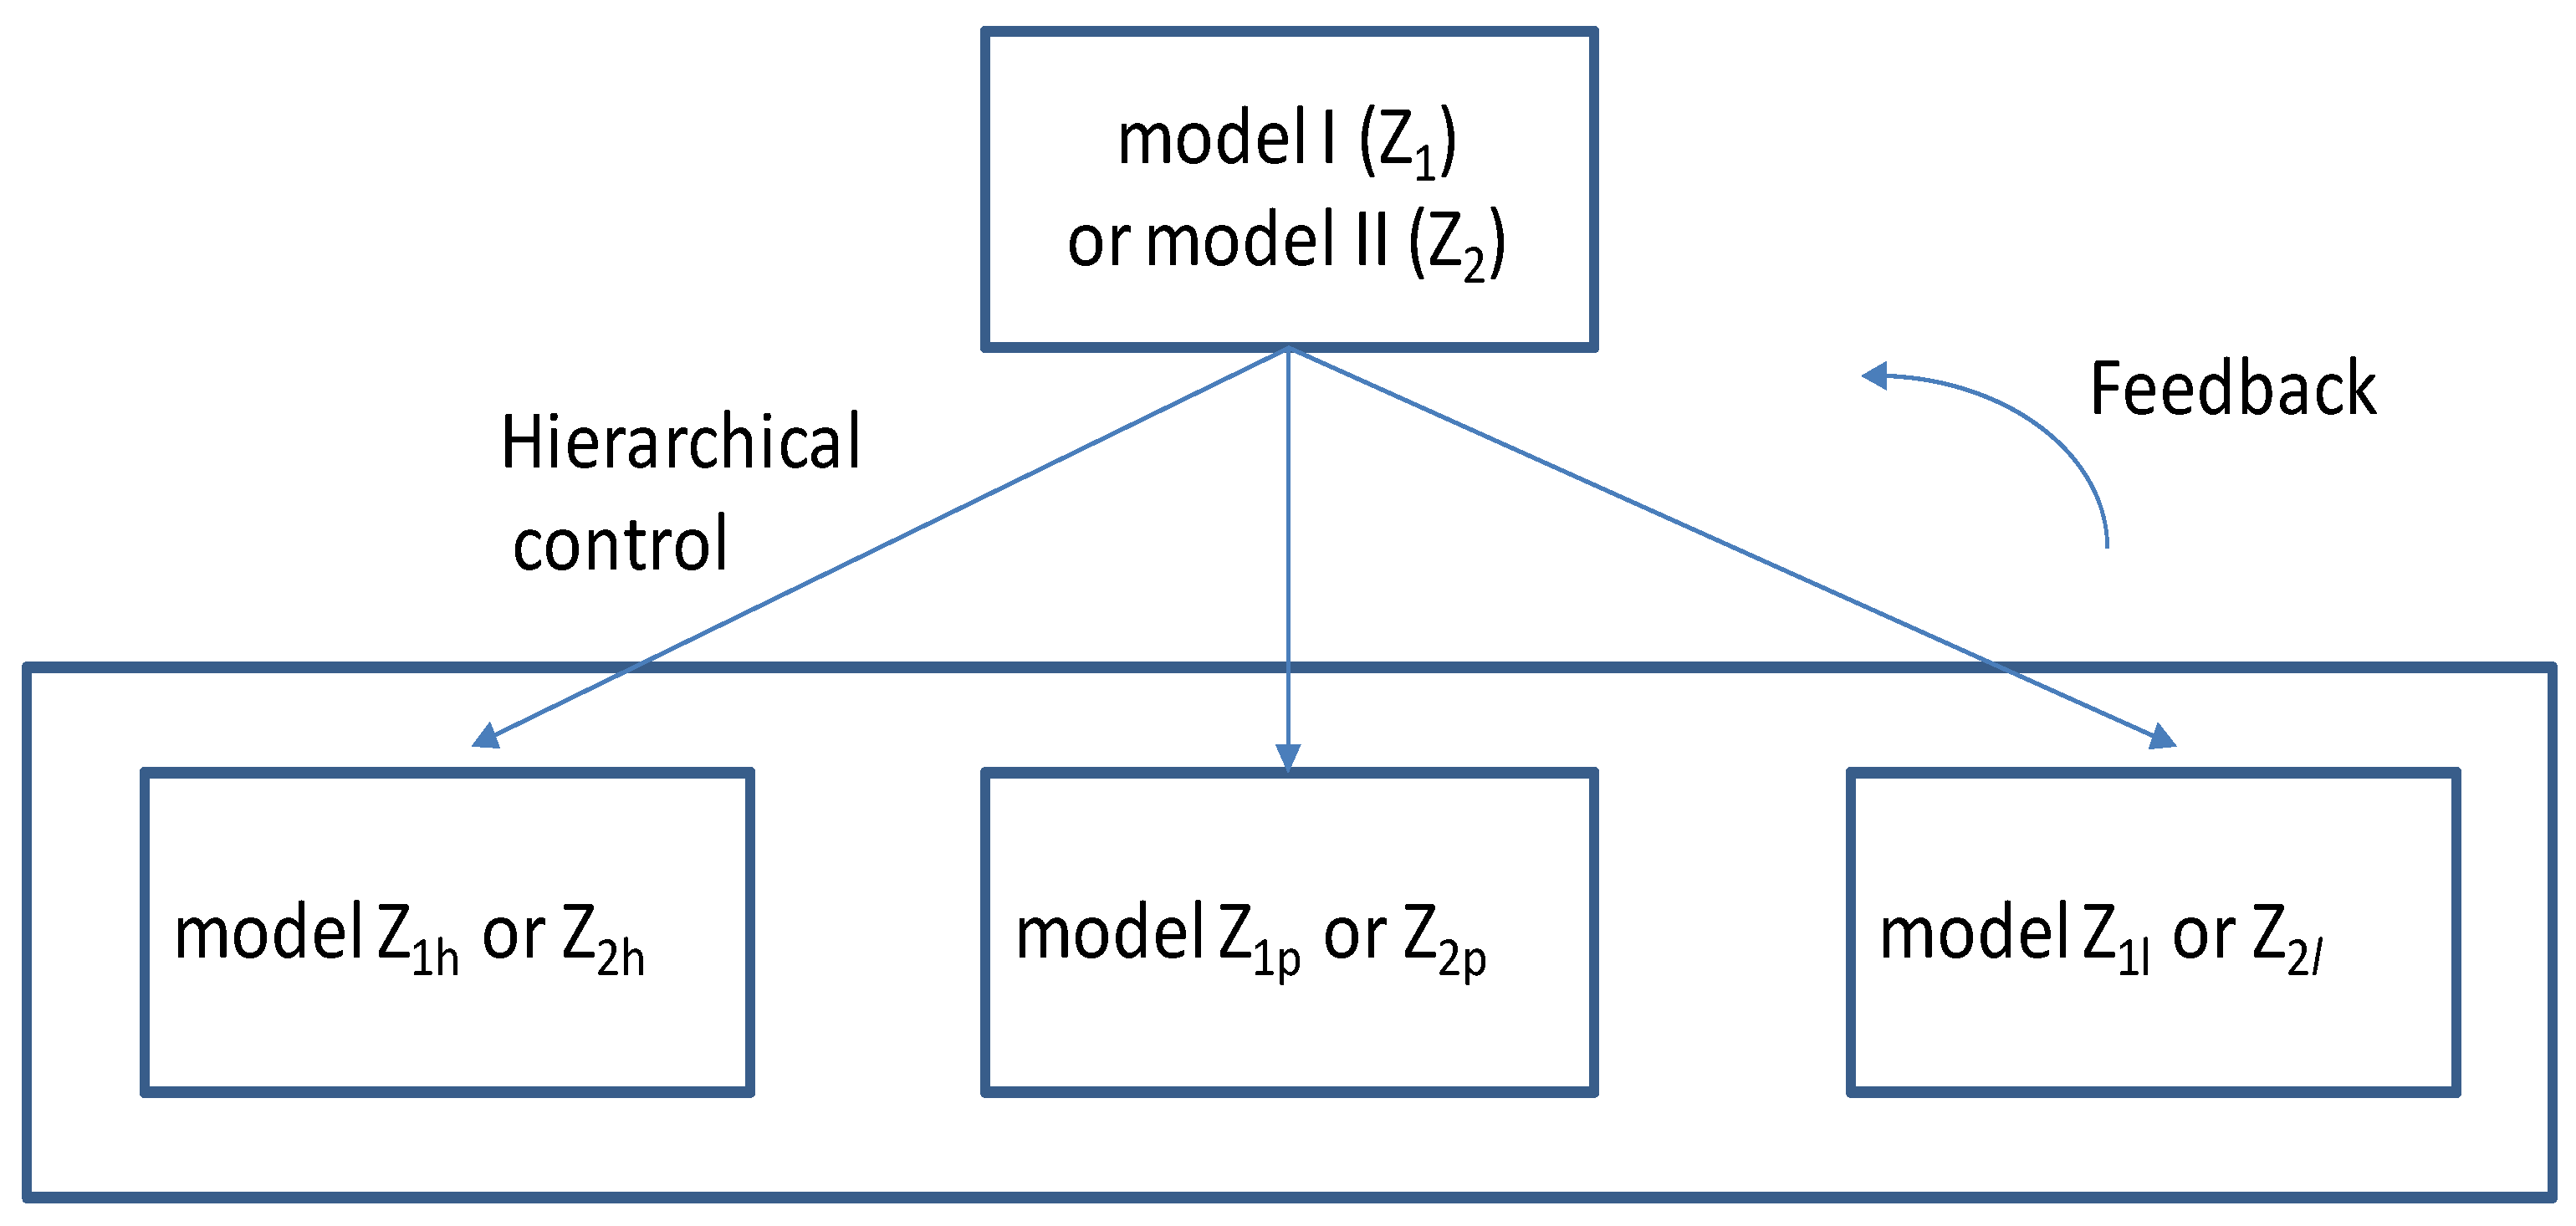
In the same way, model II can also be decomposed into similar submodels. Therefore, the hierarchical control of models I and II is as shown in Figure 6.
In Figure 6, model I or II can be decomposed into multiple submodels, and the running result of each submodel can be fed back to model I or II.
Because model I and model II can be used repeatedly, the scalabilities of the two models are good and can be oriented to many vehicles’ distribution demands. Additionally, the two models are linear programming models, their computational complexities are O(n*n), and they can be implemented by computer programming design.
Although only linear programming models are used in this paper, some genetic algorithms or cluster-based optimization will also be added into the DSS framework in the future.

3.2.2. Model-Solving Steps

This DSS conceptual framework is to be solved by means of computer programming. The solution method of computer programming requires specific solution steps. Therefore, the following solution steps are formulated:
The first step is to implement the vehicle status management criteria, supplement the detailed vehicle information, and obtain the serialized vehicle table. All empty and not fully loaded vehicles are counted as available vehicle set F .
The second step is to implement the freight bill service criteria, summarize the delivery time, quantity, and the freight bill close to the destination of the goods in the distribution place, and make a list.
The third step is to load for freight bills according to the freight bill service criteria and vehicle-loading criteria. The application of model I or model II generates multiple feasible vehicle combinations, allowing decision makers to select the most suitable vehicles or combinations based on specific operational requirements. Then, logistics personnel can receive their tasks and finish them according to the delivery order information, on-board navigation system, the departure time of the delivery, etc.
Step 4: On the return, the returning vehicle still makes the return route according to the on-board navigation system.
Compared with the literature, the models of this study make route decisions by the navigation system, reducing the complexity of the models, and the validation of the research can be guaranteed.

3.2.3. Construction of Method Base

(1)
The Method of Surplus Vehicle Tonnage Utilization
The method is designed as follows: (1) the information of the k t h not fully loaded vehicle is obtained from the vehicle information table. (2) From the vehicle-loading information table (BillDeco) according to the loading date, the loading summaries of the k t h not fully loaded vehicle are sorted by the loading date in reverse order. The first row of data in the loading summaries is the loading amount of the k t h not fully loaded vehicle (the other rows of data are the completed historical loading information). (3) The surplus tonnage of the k t h not fully loaded vehicle is obtained by subtracting the loaded amount from the approved tonnage, and the surplus tonnage list of each vehicle is generated in turn. For vehicles that are not fully loaded, they can also continue to be loaded before departure, so that the surplus tonnage is utilized to the maximum extent. The database relational algebraic operation steps are as follows:
Step 1: Select and project from the vehicle information table: k , u , w ( σ w = 2 ( v e h i c l e ) ) . The meaning of this formula is: obtain three columns of data of vehicle serial number (k), tonnage (u), and status (w) whose status is 2 (not fully loaded, w k = 2 ) from the vehicle table. After selection and projection, the collection of a vehicle’s serial number that is not fully loaded is K , k = { 1 , , K } , and u k is the approved tonnage of the k t h vehicle.
Step 2: Select and project from the vehicle-loading information table (BillDesc): t , s u m ( σ k ( B i l l D e s c ) ) . The meaning is: select the time column and load summary column of the k t h not fully loaded vehicle from the BillDesc table. Since the k t h vehicle may have multiple loading experiences, the result is sorted in reverse chronological order, and the first row of data is taken, that is the most recent loading amount of the k t h vehicle (denoted as v k ).
Step 3: Combine the above two steps, read in turn, calculate the surplus tonnage of the k t h vehicle: u k v k .
(2)
The Method of Vehicle Priority Loading Order Selection
The design of the vehicle priority loading order selection method is as follows: all empty and not fully loaded vehicles are listed, and the surplus tonnage of each not fully loaded vehicle is obtained in combination with the method of surplus vehicle tonnage utilization. At this time, the vehicle serial number includes all empty and not fully loaded vehicles, and the vehicle serial number is denoted as i in turn and its data tuple is denoted as: ( i , u i v i ) . The order of vehicles in the list can be moved forward ( E x c h a n g e ( i , i 1 ) ) and moved back ( E x c h a n g e ( i , i + 1 ) ). Vehicles ranked at the top of the data list are eligible for priority loading, thus solving the problem of vehicle priority selection. The advantage of this is that specific vehicles can be assigned urgently, and the problems of too many dispatching tasks for one vehicle and too few dispatching tasks for another vehicle can be balanced, and the contradictions of the dispatching tasks will be reduced.
(3)
The Simultaneous Loading Method of Multi-Freight Bills and Multi-Vehicles
The method is designed as follows: first, add new freight bill to the loading list. In accordance with the freight bill service criterion, let the freight bills with same delivery time and destination be close together for simultaneous loading. Suppose there are m freight bills that need to be loaded at the same time, according to the vehicle-loading criteria, one or more (empty or not fully loaded status) vehicles can be selected based on model I (maximum loading rate constraint) or model II (minimum number of vehicles constraint), and the priority loading order of vehicles can be adjusted before the distribution decision. Second, the DSS calculates the total loading amount of the freight bills in the loading list and judges whether the sum of the approved tonnage of the selected vehicles is sufficient. If not enough, a new vehicle needs to be selected. Third, according to the order of the loading list and the order of the selected vehicles, if the first freight bill is not completed on one vehicle, it must be continued on another vehicle (i.e., one freight bill serial number appears on two or more vehicles). After that, according to the load situation of the vehicle, modify the corresponding vehicle status to not fully loaded or fully loaded. Fourth, generate a new delivery list according to the utilization status of each vehicle.
(4)
The Method of Transfer Vehicle Loading
The method refers to the transfer of goods from one vehicle to another vehicle in order to make the decision of changing vehicles in response to a failure (or special circumstances) in the distribution. The loading method is designed as follows: first, for the original vehicle, select another empty or not fully loaded vehicle as the target vehicle. Second, determine whether the loading capacity of the target vehicle meets the needs of vehicle replacement. If not, select another target vehicle again. If yes, continue the next step. Third, batch change the original vehicle serial number of the freight bills to the new vehicle serial number, and the distribution bill is also modified.
The above four methods support the operation of this DSS. From the perspective of system implementation, the DSS designs many modules, including user login, customer management, vehicle management, receiving goods management, vehicle-loading management, transfer loading management, freight list query and output, etc. The interaction between each module and data table, model base, and method base is shown in Table 3:
In Table 3, login refers to the operation of the login information table (cuser). The next operation can be performed only after the user name and password are successfully verified. Customer management refers to the operation of the customer information table (Client), which is used to manage detailed customer information. Vehicle management mainly operates the vehicle information table (Vehicle) and the departure history table (TransRecord), which is mainly used to manage the usage status of the vehicle (empty, not fully loaded, fully loaded, dispatching) and manage the vehicle maintenance, departure, vehicle return check-in, departure history, and other information. In the receiving goods management, it is used to manage the receiving of goods and the goods information of each customer and generate the freight bill serial number for receiving information, which requires three tables, Product, Client, and Bill, respectively.
The above operations are basic data operations, which do not use the models and methods in the above model base and method base in this paper, and the following operations need to use the corresponding models and methods.
In the vehicle loading, the main operations are oriented to the vehicle information table (Vehicle), freight bill information table (Bill), and vehicle-loading information table (BillDesc). The tables need to be used by multiple freight bills and multiple vehicles at the same time. At this time, it is necessary to use model I or model II to solve the loading rate and assign vehicles but also to use the method of surplus vehicle tonnage utilization, the method of vehicle priority loading order selection, and the simultaneous loading method of multi-freight bills and multi-vehicles. These multi-models and multi-methods jointly serve the decision-making optimization of textile logistics distribution.
In the transfer loading, the main operations are oriented to the vehicle information table (Vehicle), freight bill information table (Bill), and vehicle-loading information table (BillDesc). Since the DSS deals with one-to-one vehicle replacement, it only runs model II. In this module, the method of surplus vehicle tonnage utilization and the method of transfer vehicle loading are also running to serve the distribution decisions of model II and the assigned vehicles.
The freight list view mainly involves the data table operation of the vehicle information table (Vehicle), departure history table (TransRecord), and vehicle-loading information table (BillDesc), which is used to view the freight bill information of each vehicle and each customer and the detailed loading information of each freight bill.

4. Test Data Example

4.1. Data

In order to better verify the models and methods proposed above, this study constructed the textile logistics distribution DSS conceptual framework (test version) and ran it according to the logistics business (non-express business) in Shaoxing China Textile City.
In order to save space, only a simple example of the operation of the system is presented. Assume that there is a textile logistics distribution enterprise and several distribution locations, and the customer demand information and goods type information table of each distribution location are summarized and put in a table, as shown in Table 4, while the current vehicle delivery is shown in Table 5 and Table 6.

4.2. Running Result

According to the above basic data, the operation data of the textile logistics distribution DSS can be obtained according to the vehicle status management criteria, freight bill service criteria, and vehicle-loading criteria. Let x h , i , l be the quantity of the i t h vehicle and the l t h customer at the distribution place h, without considering overload, all goods are classified into one type with unrestricted loading (p = 1, x h , i , l , p is simplified as x h , i , l ), and the distribution process is as follows:
Assume there are some vehicles in use, the new delivery (defined as the first) needs to be delivered to customers 1, 2, 3, and 4. The destination is Ganzhou, the time is delivery within 36 h, the quantity is 20.9 tons, according to the current vehicle data table, the available vehicle set F is F = { 1 , 2 , 4 , 5 } , and other vehicles are in use. To complete the distribution, at least two vehicles should be selected. According to the model Z 1 , select the fourth and fifth vehicles, the fourth vehicle is loaded first, and the loading order for the customers is 1, 2, 4. The fifth vehicle is loaded behind and only the freight bill of the third customer is loaded. The total loading rate of the two vehicles is 20.9/21 = 99.52%. The fifth vehicle is not fully loaded and is also dispatched out. Refresh the available vehicle set F , F = { 1 , 2 } . The loading list is: x 1 , 4 , 1 = 2.9 , x 1 , 4 , 2 = 6.3 , x 1 , 4 , 3 = 3.8 , x 1 , 5 , 3 = 4.1 , x 1 , 5 , 4 = 3.8 . By the method of vehicle priority loading order selection, the adjustment is more effective, such as x 1 , 4 , 1 = 2.9 , x 1 , 4 , 2 = 6.3 , x 1 , 4 , 4 = 3.8 , x 1 , 5 , 3 = 7.9 and, because the adjustment does not change the loading rate of the vehicle, the fifth vehicle only delivers to the third customer.
For the second delivery, it is necessary to distribute to customers 11~18, the destination is Nanjing, the time is delivery within 48 h, the quantity is 36 tons. At this time, the fourth and fifth vehicles were dispatched out, the other vehicles returned, and the available vehicle collection is: F = { 1 , 2 , 3 , 6 , 7 , 8 } . Because the first vehicle is not fully loaded, it will leave for Shanghai, with the same orientation to Nanjing, can be LCL, and the surplus tonnage (7 tons) can be prioritized. According to the model Z 1 , for the total freight amount of 36 tons, vehicles 1, 3, 6, and 7 can be selected, while vehicles 1, 2, and 3 can be selected according to the model Z 2 . The loading rate of the model Z 1 is: 36/36 = 100%, four vehicles are used, and the loading rate of the model Z 2 is: 36/37 = 97.3%. Although the loading rate of the model Z 2 is slightly lower, from the perspective of operating costs, with less use of a vehicle, the economic effect is more obvious, so the model Z 2 should be selected for vehicle loading. After that, refresh the available vehicle set F , F = { 6 , 7 , 8 } . The loading list is: x 2 , 2 , 11 = 1.5 , x 2 , 2 , 12 = 4.2 , x 2 , 2 , 13 = 3.8 , x 2 , 2 , 14 = 6.7 , x 2 , 2 , 15 = 0.8 , x 2 , 1 , 17 = 3.8 , x 2 , 1 , 18 = 2.2 , x 2 , 3 , 15 = 7.2 , x 2 , 3 , 16 = 4.6 , x 2 , 3 , 17 = 1.2 .
For the third delivery, 19~23 customers in Wuhan should be served, and 5~10 customers in Ganzhou should be served. The time is delivery within 72 h, the freight amount of Wuhan customers is 12.6 tons, and the freight amount of Ganzhou is 25.4 tons. The fourth and fifth vehicles that completed the delivery mission have returned and the available vehicle set is F = { 4 , 5 , 6 , 7 , 8 } . Directly arrange the fourth vehicle to serve customers in Wuhan, x 3 , 4 , 19 = 2.3 , x 3 , 4 , 20 = 3.4 , x 3 , 4 , 21 = 3.1 , x 3 , 4 , 22 = 2.2 , x 3 , 4 , 23 = 1.6 . The loading rate of the fourth vehicle in the direction of Wuhan is 12.6/13=96.92%, and the fourth vehicle is dispatched out again, then F = { 5 , 6 , 7 , 8 } . At this time, if Ganzhou customers 5~10 are served, at least four vehicles are needed, which is not suitable from the perspective of cost, because the return time from Nanjing is not long. The 1st, 2nd, and 3rd large tonnage vehicles can return and then dispatch, which is recorded as the next delivery.
For the fourth delivery, Ganzhou customers 5 to 10 need to be served, with a freight amount of 25.4 tons. At this time, the 1st, 2nd, and 3rd large tonnage vehicles that completed the delivery mission have returned, the available vehicle set is F = { 1 , 2 , 3 , 5 , 6 , 7 , 8 } , the delivery amount in Ganzhou requires three vehicles according to the model Z 1 , and vehicles 3, 5, and 6 can be selected. The total loading rate is 25.4/26 = 97.7%. According to the model Z 2 , only two vehicles are needed, and the first and third vehicles can be selected, and the total loading rate is 25.4/30 = 84.67%. Considering that Ganzhou is a bit far away, the operating cost of using two vehicles is better, so the first and third vehicles are selected according to the model Z 2 . The loading list is: x 1 , 1 , 5 = 6.8 , x 1 , 1 , 6 = 5 , x 1 , 1 , 7 = 2.6 , x 1 , 1 , 8 = 2.6 , x 1 , 3 , 8 = 2.9 , x 1 , 3 , 9 = 3.6 , x 1 , 3 , 10 = 1.9 . At this time, the first vehicle loads 17 tons, the loading rate is high, 17/17 = 100%, and decision-makers can start its dispatch, while the third vehicle loads 8.4 tons (surplus tonnage is 4.6 tons), the loading rate is low, and decision-makers let it wait for the next LCL loading according to the actual situation. It can also be dispatched in real time if necessary.

4.3. Comparative Analysis

We make a comparative analysis of the operations between logistics business applications in Zhejiang (Shaoxing) China Textile City group and the future application of the DSS, which shown in Table 7.
In Table 7, if the DSS will be used in the future, the number of contract transport enterprises will lessen, and multi-enterprise cooperation will increase in the aspects of goods receipt, freight bill management, loading plan, vehicle dispatching, etc. Vehicle status management, vehicle return check-in, and vehicle departure history will be recorded by information management in the DSS, and almost everything will be better.

4.4. Challenges of Implementing the DSS

Although we have solved many problems, there will still be challenges in implementing the DSS. First, we introduce the sellers, buyers, and transporters in Zhejiang (Shaoxing) China Textile City group. Second, we will introduce the transportation business and challenges. The group has thirteen large supermarkets and approximately 25,000 business rooms for rent. The tenants are the sellers, while the buyers are individual consumers, traders, or various companies all over the world (such as clothing enterprises, retail enterprises, individual business owners, etc.). The group has signed contractual relationships with over 100 transportation enterprises. The transportation business can be discussed in three categories: (1) transportation in domestic offline textile trading markets. When the actual order is generated, the buyer and seller of the business transaction will provide the type, quantity, and price of the goods, the designated carrier, freight fee, and transportation time. Therefore, these jobs can be accomplished by the DSS in the future. (2) Transportation in domestic online textile trading markets. If the volume of freight is large and needs to be handled by the designated transportation enterprise, the DSS can also serve for this task. If the volume of freight is too small, such as samples or small purchases by individual consumers, an express service will be arranged, which is not within the scope of DSS service. (3) Transportation in overseas online and offline textile trading markets. This situation is the most complicated because it involves customs declaration and inspection, and there are many links involved. However, it is difficult to integrate it into the DSS at this stage, and it can only be completed by professional port transportation enterprises. The challenges are as follows: (1) it is very difficult to persuade the group to uniformly use the DSS among over 100 contract-based transportation enterprises. (2) The purchase cost of the DSS, which affects the enthusiasm of various transportation enterprises to use it. Perhaps the correct way to promote it is to offer it to enterprises for free and charge service fees on an annual basis in the future.

5. Conclusions

This study highlights the importance of distribution DSSs in the textile market. According to the gaps addressed in the context above, first of all, it is hard to find literature on textile logistics distribution DSSs in China; second, it is hard to find literature on the usage of surplus loading vehicles; third, it is hard to find literature on the use of an integrated DSS framework and knowledge criteria to improve efficiency. Therefore, this study emphasizes critical DSS research aimed at significantly enhancing vehicle management and operational efficiency, enabling rapid vehicle-loading processes.
This paper designs a theoretical framework of textile logistics DSSs, focusing on the control and mechanism. In the control link, the maximum loading rate or the minimum amount of vehicles is proposed as the optimization objective, and the vehicle status management criteria, freight bill service criteria, and vehicle-loading criteria are also proposed to serve the optimization objective. In the mechanism link, the basic and distribution databases of the DSS are constructed, the data flow of the DSS is analyzed, and the model base and method base are constructed, which mainly rely on the method of surplus vehicle tonnage utilization, the method of vehicle priority loading order selection, and the simultaneous loading method of multi-freight bills and multi-vehicles for model solving and distribution decisions.
The test example shows that the textile logistics distribution DSS in this paper has achieved good results, the distribution process is clear, the loading rate is high, the not fully loaded vehicles can be loaded twice or multiple times, the surplus tonnage of the vehicles is fully utilized, and the utilization rate of the vehicles is really improved. It shows that the above models and methods supported by the distribution knowledge criteria have obtained good loading effects and supported the rapid solution and generation of textile logistics distribution decision schemes.
In contrast to previous studies in the field, this paper mainly studies the textile logistics distribution DSS based on knowledge criteria, model base, and method base, which is rare in textile logistics research. The design of this system is based on the business status of the logistics center in Zhejiang (Shaoxing) China Textile City group. The test DSS solves the hard problems of the surplus tonnage utilization of vehicles and the simultaneous loadings of multi-freight bills and multi-vehicles. The disadvantage is that the solving algorithm of the model base needs to be improved in the future, sometimes it is not always possible to select the most suitable vehicle set, and manual selection of vehicles is required to select the best vehicle set. It is hoped that more researchers and practical developers will further enhance the functions of the test DSS, and it is expected that it can be applied to practical logistics distribution decisions. Furthermore, it is expected that IOT and blockchain technology can be applied to the system integration of DSSs, and machine learning algorithms can be added to vehicle selection in the future. Overall, the research has a good reference value.

Author Contributions

F.W.: conceptualization, supervision, validation, methodology, software, writing—original draft, writing—review and editing. C.L.: writing—original draft, writing—review and editing. All authors have read and agreed to the published version of the manuscript.

Funding

This research received no external funding.

Institutional Review Board Statement

Not applicable.

Informed Consent Statement

Not applicable.

Data Availability Statement

The original contributions presented in the study are included in the article, further inquiries can be directed to the corresponding author.

Acknowledgments

The authors express sincere gratitude to reviewers for their valuable comments and suggestions.

Conflicts of Interest

The authors declare that they have no known competing financial interests or personal relationships that could have appeared to influence the work reported in this paper.

References

  1. Jbili, S.; Chelbi, A.; Radhoui, M.; Kessentini, M. Integrated Strategy of Vehicle Routing and Maintenance. Reliab. Eng. Syst. Saf. 2018, 170, 202–214. [Google Scholar] [CrossRef]
  2. Hintsch, T.; Irnish, S. Large Multiple Neighborhood Search for the Clustered Vehicle-routing Problem. Eur. J. Oper. Res. 2018, 270, 118–131. [Google Scholar] [CrossRef]
  3. Kulkarni, S.; Patil, R.; Krishnamoorthy, M.; Ernst, A.; Ranade, A. A New Two-stage Heuristic for the Recreational Vehicle Scheduling Problem. Reliab. Eng. Syst. Saf. 2018, 170, 202–214. [Google Scholar] [CrossRef]
  4. Gansterer, M.; Hartl, R.F. Collaborative Vehicle Routing: A Survey. Eur. J. Oper. Res. 2018, 268, 1–12. [Google Scholar] [CrossRef]
  5. Noorizadegan, M.; Chen, B. Vehicle Routing With Probabilistic Capacity Constraints. Eur. J. Oper. Res. 2018, 270, 544–555. [Google Scholar] [CrossRef]
  6. Bruglieri, M.; Mancini, S.; Pezzella, F.; Pisacane, O.A. Path-based Solution Approach for the Green Vehicle Routing Problem. Comput. Oper. Res. 2019, 103, 109–122. [Google Scholar] [CrossRef]
  7. Breunig, U.; Baldacci, R.; Hartl, R.F.; Vidal, T. The Electric Two-echelon Vehicle Routing Problem. Comput. Oper. Res. 2019, 103, 198–210. [Google Scholar] [CrossRef]
  8. Tirkolaee, E.B.; Goli, A.; Mardani, A. A novel two-echelon hierarchical location-allocation-routing optimization for green energy-efficient logistics systems. Ann. Oper. Res. 2023, 324, 795–823. [Google Scholar] [CrossRef]
  9. Tirkolaee, E.B.; Goli, A.; Faridnia, A.; Soltani, M.; Weber, G.-W. Multi-objective optimization for the reliable pollution-routing problem with cross-dock selection using Pareto-based algorithms. J. Clean. Prod. 2020, 276, 122927. [Google Scholar] [CrossRef]
  10. Guo, N.; Qian, B.; Shen, Q.Y.; Na, J.; Hu, R.; Geng, Y. Hyper-heuristic Ant Colony Optimization Algorithm for Green Two-echelon Multi-period Vehicle Routing Problem with Flexible Time Windows. Control. Decis. 2025, 40, 745–753. [Google Scholar] [CrossRef]
  11. Wang, Y.; Xie, H.X.; Gou, M.Y.; Zhao, X.Q. Fresh Commodity Multi-compartment Loading Distribution Routing Optimization Problem Based on Vehicle Sharing. Packag. Eng. 2025, 46, 210–222. [Google Scholar] [CrossRef]
  12. Yao, L.J.; Wang, K.J. Reinforcement Learning Based Path Optimization for Multi-Trip Green Vehicles with Soft Time Window. Comput. Technol. Autom. 2024, 43, 153–160. [Google Scholar] [CrossRef]
  13. Guo, R.J.; Fan, C.R.; Liu, Y.; Jiang, K.N. Vehicle Path Selection for Distribution of Incompatible Emergency Materials Based on Demand Urgency. J. Saf. Sci. Technol. 2024, 12, 150–158. [Google Scholar] [CrossRef]
  14. Yang, Q.; Wang, F.Y.; Lu, J.J.; Wang, Z.H.; Ma, B. Constrained Vehicle Routing Model for Emergency Relief Supplies Based on Demand Urgency. J. Tsinghua Univ. (Sci. Technol.) 2024, 64, 1082–1088. [Google Scholar] [CrossRef]
  15. Jiang, G.T.; Ji, J.Y.; Dong, J.W. Multi-vehicle Dynamic Vehicle Routing Optimization in Green Logistics Distribution. Syst. Eng.-Theory Pract. 2024, 44, 2362–2380. [Google Scholar] [CrossRef]
  16. Ge, F.; Min, S.; Qiu, H.; Dai, Z.Y.; Yang, Z.M. Research on an Algorithm for Solving Time-Dependent Green Vehicle Routing Problem. Comput. Eng. 2024, 50, 1–10. [Google Scholar] [CrossRef]
  17. Hua, Q.P.; Wang, X. Study on distribution model of clothing timeliness and modified ant colony algorithm. J. Text. Res. 2012, 33, 139–144. [Google Scholar] [CrossRef]
  18. Miao, Z.W.; Su, R.Z.; Zhang, J. An Adaptive Genetic Algorithm for the Truck Scheduling Problem in the CrossdockDistributionCenter. J. Ind. Eng./Eng. Manag. 2016, 30, 166–172. [Google Scholar] [CrossRef]
  19. Song, C.Y.; Wang, H.L.; Tian, Z.S.; Niu, X.Q. Review of demand-responsive transit vehicle scheduling models and algorithms. J. Beijing Jiaotong Univ. 2023, 47, 31–44. [Google Scholar] [CrossRef]
  20. Yang, K.; Wu, F.; Luo, W.Z. Research on Peak Hour Vehicle Scheduling Based on the Temporal and Spatial Distribution Law of Shared Electric Vehicles. J. Lanzhou Jiaotong Univ. 2023, 42, 32–38. [Google Scholar] [CrossRef]
  21. Kengpol, A. Design of a Decision Support System to Evaluate Logistics Distribution Network in Greater Mekong Subregion Countries. Int. J. Prod. Econ. 2008, 115, 388–399. [Google Scholar] [CrossRef]
  22. Accorsi, R.; Manzini, R.; Maranesi, F. A Decision-support System for the Design and Management of Warehousing Systems. Comput. Ind. 2014, 65, 175–186. [Google Scholar] [CrossRef]
  23. Fikar, C. A Decision Support System to Investigate Food Losses in E-grocery Deliveries. Comput. Ind. Eng. 2018, 117, 282–290. [Google Scholar] [CrossRef]
  24. Wang, F.Z.; Pang, H.Y. Selecting optimal warehousing location and distribution combination decision for sales logistics of garment enterprise. J. Text. Res. 2014, 35, 139–143. [Google Scholar] [CrossRef]
  25. Zhang, Y.X.; Lei, B.B.; Wang, X.F.; Zhu, X.J.; Song, J.H. Review of Metaheuristic Algorithms for Vehicle Routing Problem with Time Windows. Appl. Res. Comput. 2024, 42, 1–11. [Google Scholar] [CrossRef]
  26. Ye, C.S.; Wang, X.X.; Shi, Z.M.; Huang, C.C. Research on Optimization of Distribution Network under Artificial Intelligence Background. J. Chongqing Technol. Bus. Univ. (Nat. Sci. Ed.) 2018, 35, 22–26. [Google Scholar] [CrossRef]
  27. Han, J.D.; Du, Q.G. Research on the Internet of Things Application in Fresh Agricultural Product Distribution. China Bus. Mark. 2015, 12, 54–60. [Google Scholar] [CrossRef]
  28. Li, C.B.; Wang, E.J.; Yuan, J.B. Research on the Optimization of Logistics Distribution Route of Fresh Agricultural Produce under Internet of Things. Commer. Res. 2017, 4, 1–9. [Google Scholar] [CrossRef]
  29. Lu, J.C. Scheduling Distribution Vehicles in Internet of Things Based on Perturbation Contraction Particle Swarm Optimization. J. Highw. Transp. Res. Dev. 2020, 37, 111–117. [Google Scholar]
  30. Li, L.W. Construction of logistics distribution information sharing platform based on the Internet of Things technology. Mod. Electron. Tech. 2021, 44, 78–82. [Google Scholar] [CrossRef]
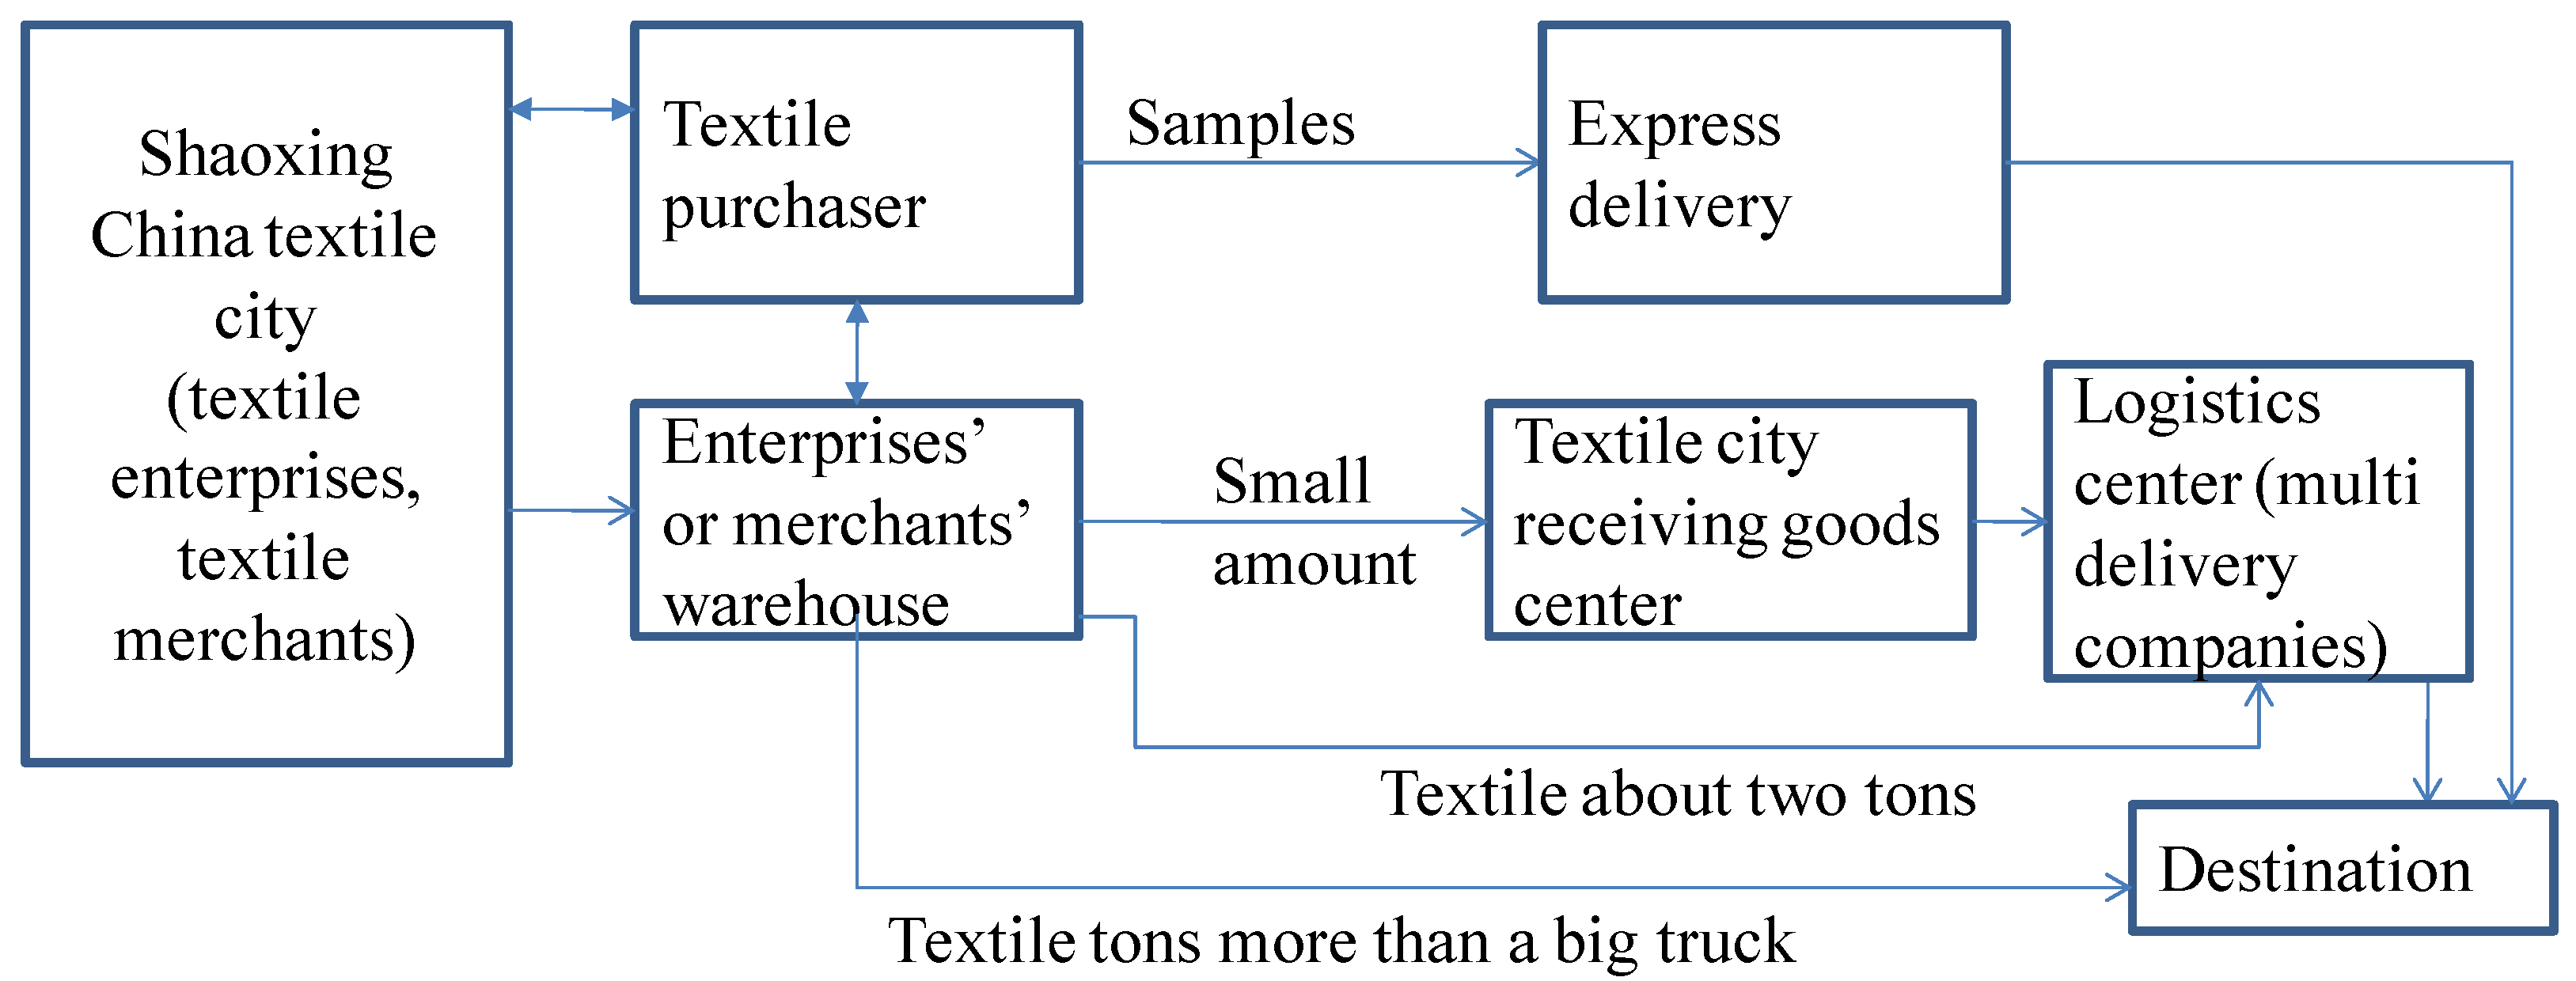
Figure 1. The business flow in a textile market.
Applsci 15 09755 g001
Figure 2. A logical structure and flow of introduction.
Applsci 15 09755 g002
Figure 3. Theoretical model of distribution DSS conceptual framework.
Applsci 15 09755 g003
Figure 4. Flow chart illustrating the status transitions of vehicle utilization in the distribution DSS conceptual framework.
Applsci 15 09755 g004
Figure 5. Data flow chart in the distribution DSS conceptual framework.
Applsci 15 09755 g005
Figure 6. The hierarchical control of model I or II.
Applsci 15 09755 g006
Table 1. Basic and Distribution database.
Table NameDescriptionRelated Criterion
CuserIt is a login user table, which is used to verify the system loginNone
ClientIt is a customer information data table, which is used to record the basic information of each customerNone
ProductIt is a textile fabric information data table, which is used to manage the receiving information of each customer’s textile fabricsNone
VehicleIt is a vehicle information data table, which is used to manage the basic information and operating status of the vehicle (empty, not fully loaded, fully loaded, dispatching)Vehicle status management criterion, vehicle-loading criterion
TransRecordIt is a departure history data table, which is used to manage departure history and return check-in. The status of the vehicle after the return check-in will be emptyVehicle status management criterion
BillIt is a freight bill information data table. It is used to generate the freight bill number for each customer’s textile fabric and record whether the goods in each freight bill are arranged to be loadedFreight bill service criterion
BillDecoIt is a vehicle loading information data table. It is used to record the loading time and quantity of each freight bill on each vehicleFreight bill service criterion, vehicle-loading criterion
Note: Table 1 contains only the key data tables in the basic and distribution database, other data tables such as user password tables and employee tables (logistics personnel and decision makers) are omitted.
Table 2. The definitions of variables.
VariableDescription
j the path number is j, and J represents the path sequence set, j J , which is obtained by the vehicle navigation system
h the maximum number of distribution places for one service is H , h H
i the vehicle serial number is represented as i , the available vehicle set is I = { i | i = 1 ,   2 ,   ,   n }
l the maximum number of customers for one service is L , l L
p the maximum quantity of goods types in one service is P , p P
f i f i is a 0–1 variable, which is also a decision variable, if f i = 1 means that i t h vehicle is selected, f i = 0 means that i t h vehicle is not selected
u i u i is the approved deadweight tonnage of i t h vehicle
Q Q represents the total amount of one delivery demand at all distribution points in a service cycle (such as the next 48 h)
s i ( j ) s i ( j ) represents the distance of i t h vehicle on route j
x i ( j ) x i ( j ) represents the loading number of the i t h vehicle running on the route j, which is also the decision variable
x h , i , l ( j ) For the specified path j by GPS, let the simplified x h , i , l be the quantity of the i t h vehicle and the l t h customer at the distribution place h
x h , i , l , p ( j ) For the specified path j by GPS, let the simplified x h , i , l , p be the quantity of the i t h vehicle and the l t h customer and the p t h goods at the distribution place h
Table 3. Interaction between each module and main data table, model base, and method base.
ModuleData Table for Each ModuleModel Running of the Model BaseMethod Running of the Method Base
LoginCuserNoneNone
Customer managementClientNoneNone
Vehicle management (maintenance, departure, departure history)Vehicle, TransRecordNoneNone
Receiving goods management (maintenance, generation of freight bill)Product, Client, BillNoneNone
Vehicle loading management (multi-freight bill and multi-vehicle loading method)Vehicle, Bill, BillDescModel I or model IIThe method of vehicle surplus tonnage utilization;
The method of vehicle priority loading order selection;
The simultaneous loading method of multi-freight bills and multi-vehicles
Transfer loading management (one-to-one transfer)Vehicle, Bill, BillDescModel IIThe method of vehicle surplus tonnage utilization;
The method of transfer vehicle loading
Loading list view and outputTransRecord, BillDescNoneNone
Note: In the design of this DSS, only the goods in one vehicle are transferred to another vehicle. Although it is possible to transfer the goods in one vehicle to multiple vehicles in practice, this is rarely the case (because one-to-one vehicle swapping already meets most of the actual needs).
Table 4. Distribution location, distribution demand information, and goods type.
Client iDelivery Amount (Unit: Ton)DestinationDelivery TimeClient iDelivery Amount (Unit: Ton)DestinationDelivery TimeClient iDelivery Amount (Unit: Ton)DestinationDelivery Time
12.9GanzhouWithin 36 h111.5NanjingWithin 48 h192.3WuhanWithin 72 h
26.3GanzhouWithin 36 h124.2NanjingWithin 48 h203.4WuhanWithin 72 h
37.9GanzhouWithin 36 h133.8NanjingWithin 48 h213.1WuhanWithin 72 h
43.8GanzhouWithin 36 h146.7NanjingWithin 48 h222.2WuhanWithin 72 h
56.8GanzhouWithin 72 h158NanjingWithin 48 h231.6WuhanWithin 72 h
65.0GanzhouWithin 72 h164.6NanjingWithin 48 h
72.6GanzhouWithin 72 h175.0NanjingWithin 48 h
85.5GanzhouWithin 72 h182.2NanjingWithin 48 h
93.6GanzhouWithin 72 h
101.9GanzhouWithin 72 h
Note: This table is a brief table, no data in empty cells. Each package (textile fabric) for each customer corresponds to a freight bill serial number, and the default departure point is Shaoxing. It is assumed that Ganzhou is distribution place 1, Nanjing is distribution place 2, and Wuhan is distribution place 3. There are no return delivery tasks at all distribution locations. All goods are classified into one type with unrestricted loading. Delivery unit: tons.
Table 5. Delivery data sheet-1.
Vehicle Serial NumberTonLoading QuantityVehicle StatusDestinationVehicle StatusLoading QuantityDestination
11710Not fully loaded statusShanghaiNot fully loaded status10Shanghai
217 Empty status Empty status
31312Dispatching statusHangzhouEmpty status
413 Empty status Dispatching status13Ganzhou
58 Empty status Dispatching status7.9Ganzhou
687Dispatching statusJinanEmpty status Return
788Dispatching statusNanningEmpty status Return
887.9Dispatching statusShanghaiEmpty status Return
Remarks The 0th delivery (before new delivery) The new 1st delivery
Table 6. Delivery data sheet-2.
Vehicle Serial NumberVehicle StatusLoading QuantityDestinationVehicle StatusLoading QuantityDestinationVehicle StatusLoading QuantityDestination
1Dispatching status16Shanghai, NanningDispatching status16ReturnDispatching status17Ganzhou
2Dispatching status17NanningDispatching status17ReturnEmpty status Ganzhou
3Dispatching status13NanningDispatching status13ReturnNot fully loaded status8.4Ganzhou
4Dispatching status ReturnDispatching status12.6ReturnDispatching status12.6Wuhan
5Dispatching status ReturnEmpty status Empty status
6Empty status Empty status Empty status
7Empty status Empty status Empty status
8Empty status Empty status Empty status
RemarksThe new 2nd delivery The new 3rd delivery The new 4th delivery
Note: This table is a summary table, no data in empty cells, omitting vehicle type, license plate number, and other information. “Dispatching” means the vehicle is in transport. Loaded unit: tons.
Table 7. Comparative analysis.
ItemsLogistics Business ApplicationsFuture Application of DSS
Number of contract transport enterprisesMore than 100Lessen
Goods receiptSingle enterprise conducts operation independently manually or by Excel or ordinary applicationsMulti-enterprise cooperation
Freight bill managementSingle enterprise conducts operation independently or several enterprises cooperate manually or by Excel or ordinary applications
Loading plan
Vehicle dispatching
Transfer loading planOne-to-one vehicle transfer loadingOne-to-one vehicle transfer loading
Vehicle status managementManaged by general experience for each enterpriseRecord all vehicles
Vehicle return check-inManaged manually or by Excel or parking management systemRecord all vehicles
Vehicle departure historyManaged manually or by Excel or ordinary applicationsRecord all vehicles
Disclaimer/Publisher’s Note: The statements, opinions and data contained in all publications are solely those of the individual author(s) and contributor(s) and not of MDPI and/or the editor(s). MDPI and/or the editor(s) disclaim responsibility for any injury to people or property resulting from any ideas, methods, instructions or products referred to in the content.