Article

Evaluating Earthquake-Induced Damage in Hatay Following the 2023 Kahramanmaraş Earthquake Sequence: Tectonic, Geotechnical, and Structural Engineering Insights

by
Ibrahim O. Dedeoglu
Department of Civil Engineering, Faculty of Engineering and Architecture, Batı Raman Campus, Batman University, Batman 72100, Türkiye
Appl. Sci. 2025, 15(17), 9704; https://doi.org/10.3390/app15179704
Submission received: 2 July 2025 / Revised: 18 August 2025 / Accepted: 1 September 2025 / Published: 3 September 2025
(This article belongs to the Special Issue Earthquake Prevention and Resistance in Civil Engineering)

Abstract

On 6 February 2023, two devastating earthquakes struck the Kahramanmaraş region in southeastern Türkiye, causing widespread destruction across multiple provinces. Among the most severely affected areas was Hatay, where this study conducted a comprehensive post-earthquake field investigation. The research integrates tectonic, geological, and seismic analyses with structural performance assessments of reinforced concrete and masonry buildings. Particular attention is given to the influence of local soil conditions and geomorphological features on damage distribution. Ground motion records are evaluated alongside observed structural failures to identify key vulnerability factors. The findings highlight critical deficiencies in construction practices and regulatory compliance, and the study concludes with recommendations aimed at enhancing seismic resilience through improved code enforcement, site-specific design strategies, and rigorous quality control during construction to reduce future loss of life and property.

1. Introduction

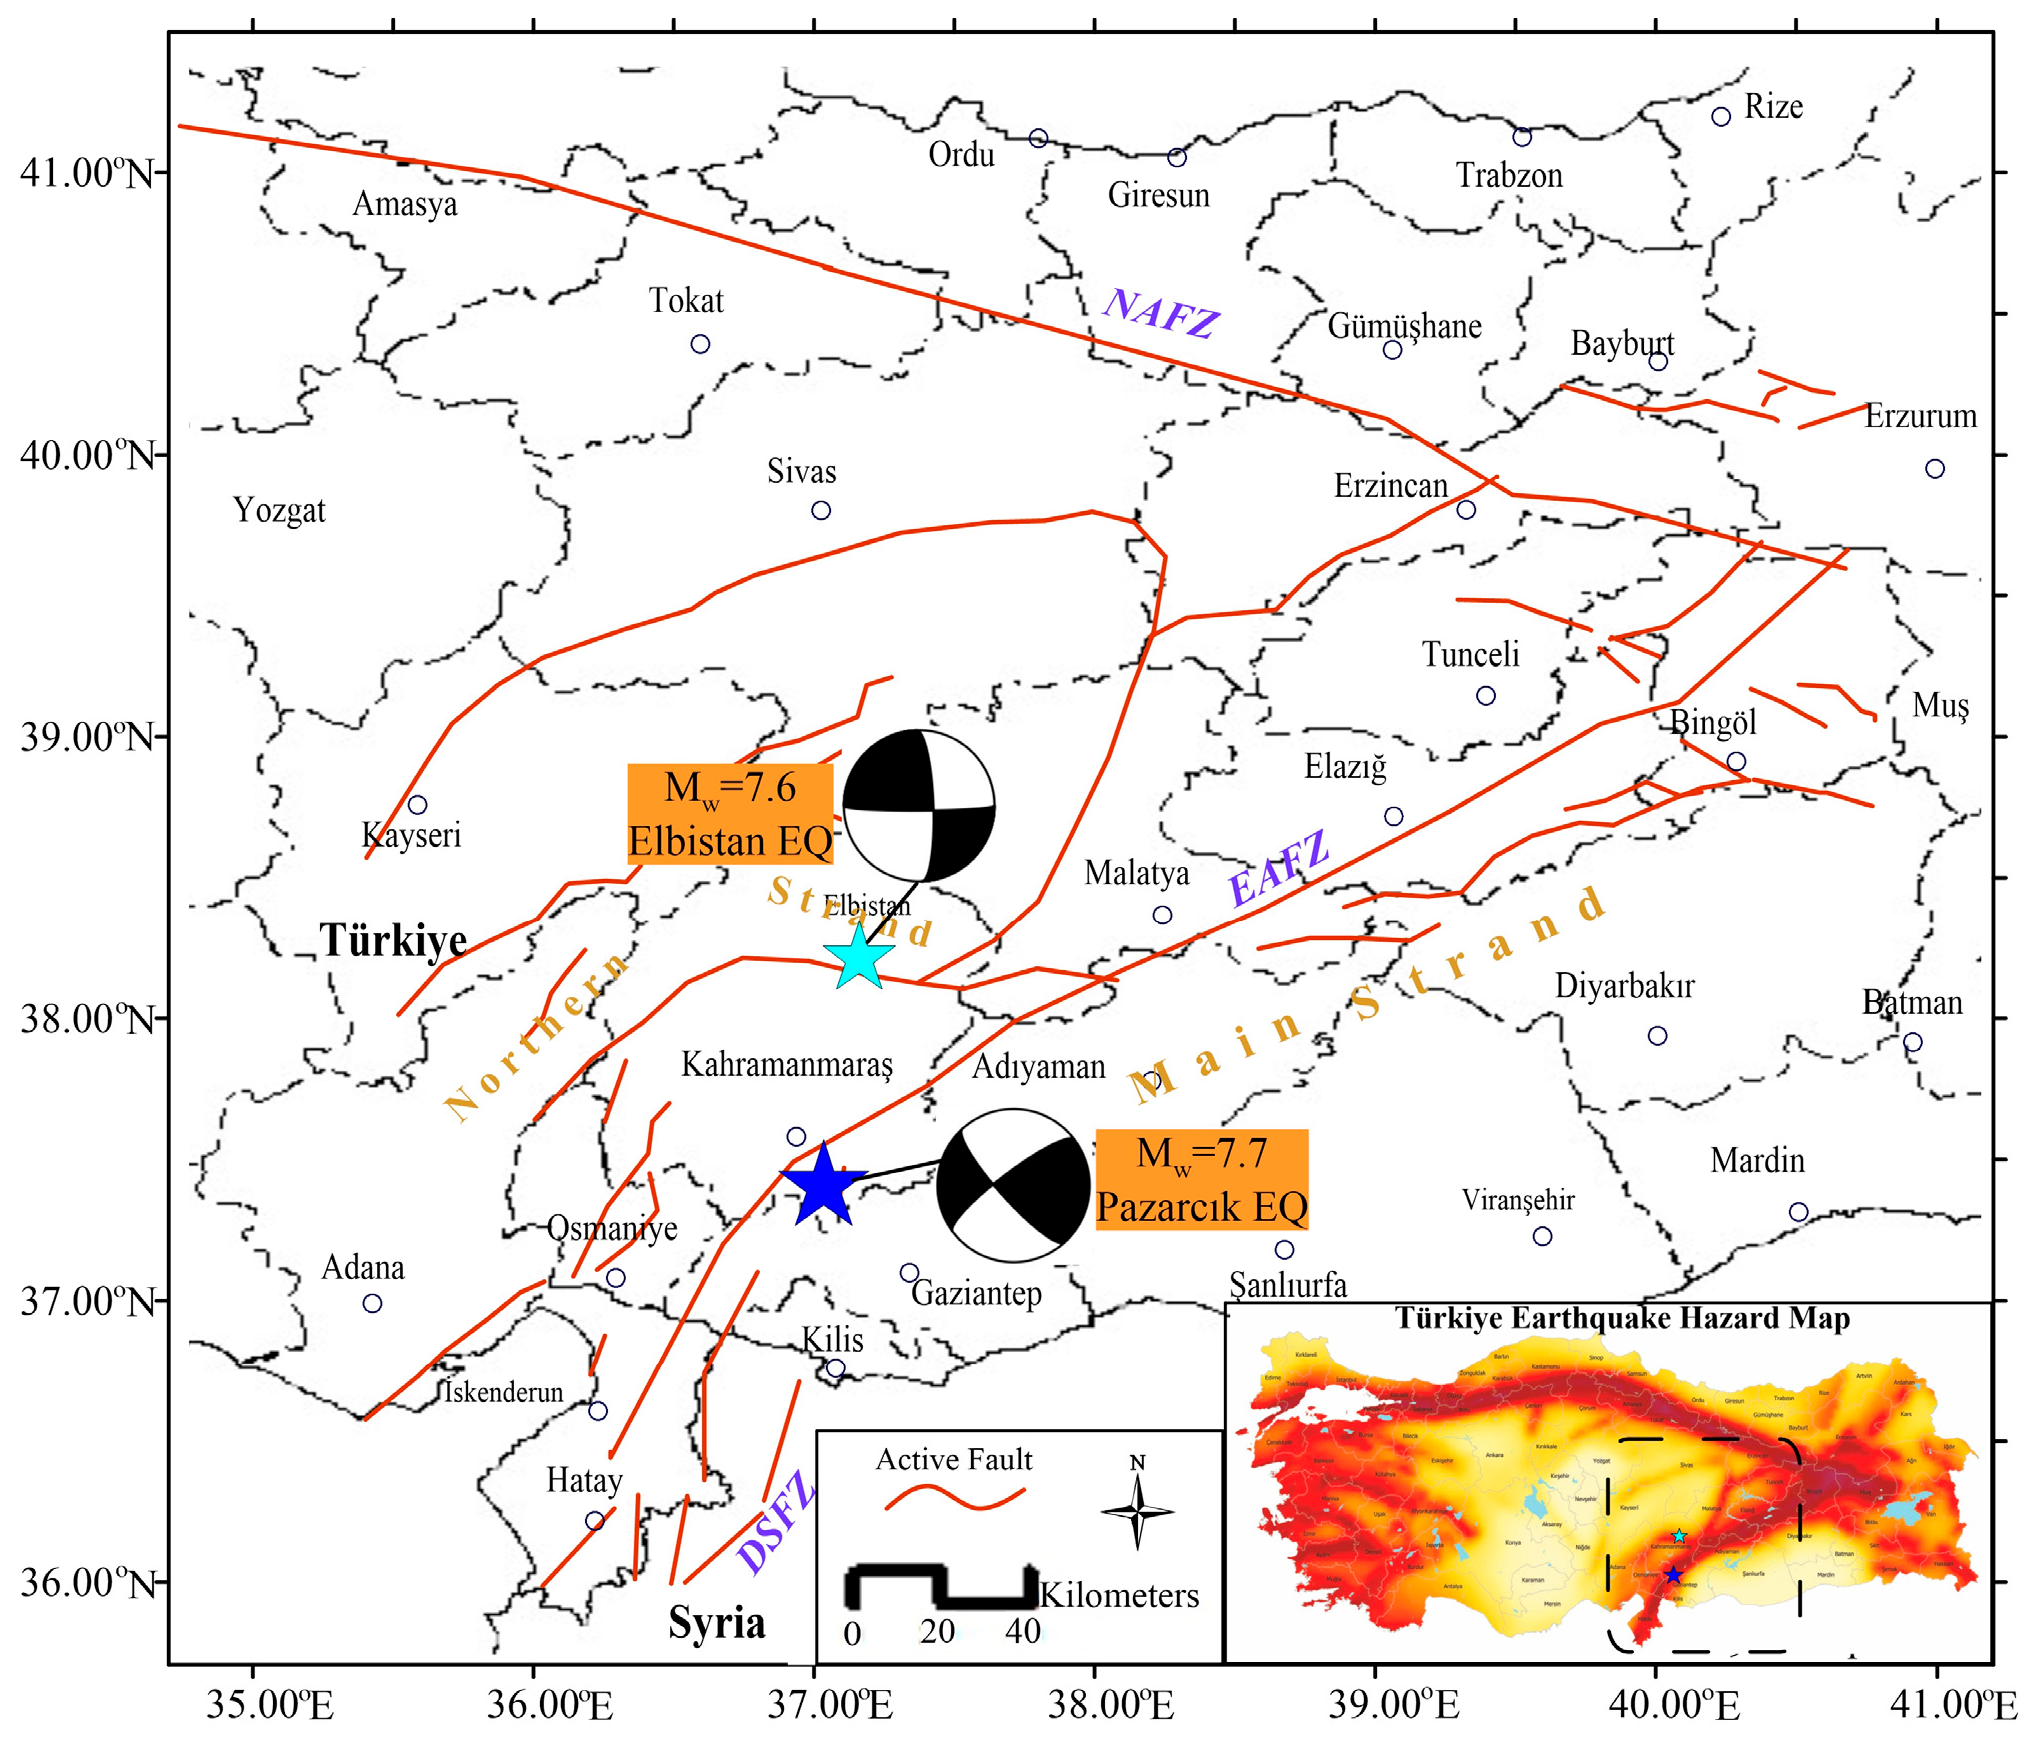
On 6 February 2023, two consecutive and devastating earthquakes struck the southeastern region of Türkiye, specifically along the East Anatolian Fault Zone (EAFZ). The first event occurred at 04:17 local time near Pazarcık (Kahramanmaraş), close to the tectonic triple junction involving the Dead Sea Fault Zone (DSFZ). According to the Disaster and Emergency Management Authority (AFAD) [1], the moment magnitude of this initial earthquake was reported as Mw = 7.7. Approximately nine hours after the initial event, a second major earthquake struck while aftershocks were still occurring. This subsequent event was associated with the Çardak Fault, with its epicenter located in Elbistan (Kahramanmaraş), and was assigned a moment magnitude of Mw = 7.6 by AFAD [1]. Figure 1 depicts the epicenters of the Kahramanmaras earthquakes and their location on the Turkiye Earthquake Hazard Map.
Figure 1. The epicenters of the Kahramanmaras earthquake doublet and their location on the Turkish Earthquake Hazard Map (active fault taken from Emre et al. [2]).
Applsci 15 09704 g001
According to the latest assessments by the World Bank and official Turkish institutions, the earthquakes of 6 February 2023 resulted in unprecedented destruction across 11 southern provinces of Türkiye. More than 50,000 people lost their lives, and 107,000 individuals were injured [1]. Approximately 1.9 million housing units were damaged or destroyed, displacing 3.3 million people, 2 million of whom required emergency shelter [1]. The World Bank’s Global Rapid Post-Disaster Damage Estimation (GRADE) report estimated the direct physical damage at USD 34.2 billion, equivalent to 4% of Türkiye’s 2021 GDP [3]. However, reconstruction and recovery needs are projected to reach USD 81.5 billion, considering broader economic disruptions and infrastructure restoration [1]. Notably, 81% of the total damage occurred in the provinces of Hatay, Kahramanmaraş, Gaziantep, Malatya, and Adıyaman, which collectively host over 6.45 million residents [3]. The majority of the damage was concentrated in residential buildings (USD 18 billion, 53%), followed by non-residential structures, such as schools and hospitals (USD 9.7 billion, 28%), and infrastructure, including roads and utilities (USD 6.4 billion, 19%) [3]. These figures underscore the scale of the disaster and highlight the urgent need for resilient reconstruction strategies.
Understanding seismic mechanisms and earthquake impacts is critically important in the fields of engineering and earth sciences. Among the most critical components of such investigations are post-earthquake field studies, which offer valuable insights into structural behavior under real seismic loading conditions. These studies yield essential data for evaluating engineering design, construction quality, workmanship, and on-site implementation, while also identifying deficiencies in existing standards and areas for improvement. Following nearly all major earthquakes, field investigations have consistently been conducted by various researchers to document and analyze structural performance and damage mechanisms.
Post-earthquake field surveys conducted in Türkiye and abroad have consistently identified recurring structural vulnerabilities. In Türkiye, studies following the Bala-Ankara (2007) [4,5], Kovancılar-Elazığ (2010) [6,7], Van (2011) [8,9,10,11,12,13,14], Sivrice-Elazığ (2020) [15,16,17,18,19,20], and Samos Island (2020) [21,22,23] earthquakes revealed that damage was primarily due to poor workmanship, use of substandard materials, lack of engineering input, and insufficient regulatory oversight. For instance, Bayraktar et al. [13] reported that a significant portion of the building stock lacked permits or failed to comply with approved structural designs.
International surveys have echoed with similar findings. In Italy, Indirli et al. [24] and Brandonisio et al. [25] highlighted the vulnerability of masonry structures during the L’Aquila (2009) earthquake, while Sorrentino et al. [26,27] and Penna et al. [28] emphasized the role of retrofitting and architectural features in improving seismic performance. Studies from Nepal [29,30], Afghanistan [31], and India [32] also pointed to inadequate seismic detailing and construction practices as key contributors to damage.
Geotechnical factors were also noted in several cases. Çelebi et al. [33] documented soil liquefaction in Erciş, while Taşkın et al. [14] reported slope failures in non-residential areas. Dedeoğlu et al. [18] further emphasized the influence of local soil conditions and structural irregularities on damage patterns.
These findings collectively underscore the need for integrated structural and geotechnical assessments, as well as improved construction practices and regulatory enforcement, to enhance seismic resilience.
The 6 February 2023 Kahramanmaraş earthquakes have been widely studied through both field investigations and analytical assessments. Researchers such as Avcil et al. [34] and Işık et al. [35,36] examined reinforced concrete and adobe buildings in Kahramanmaraş and Adıyaman, highlighting widespread vulnerabilities. Ozturk et al. [37,38] and Mercimek [39] focused on the performance of school buildings and masonry structures, respectively, while Kocaman [40] and Erkek and Yetkin [41] evaluated the impact on historical mosques and minarets. Structural damage assessments in Hatay were presented by Altunsu et al. [42], Kazaz et al. [43], and Kahya et al. [44], emphasizing near-fault effects and damage to government buildings. Broader seismic performance evaluations and code implications were discussed by Vuran et al. [45] and Ivanov and Chow [46]. Özkaynak and Çetin [47] contributed to this body of work by evaluating the performance of the Karasu Bridge, offering insights into the behavior of critical infrastructure under seismic loading. Additionally, ground motion characteristics and secondary effects were analyzed by Lashgari et al. [48] and Nemutlu [49]. Studies by Yetkin et al. [50] and Dedeoğlu et al. [51] contributed geotechnical and structural insights from Elazığ and Doğanşehir. Collectively, these works underline the necessity of constructing buildings in compliance with modern seismic codes and offer critical lessons for future earthquake resilience.
This study offers a comprehensive post-earthquake assessment for Hatay Province, one of the most severely affected regions during the 6 February 2023 Kahramanmaraş earthquake sequence. This study uniquely combines tectonic, geological, and geotechnical analyses with ground motion data and field observations to provide a comprehensive assessment of earthquake-induced damage in Hatay. The influence of local soil conditions, particularly the amplification effects of alluvial deposits and liquefaction potential, is examined in detail. Furthermore, the seismic performance of reinforced concrete and masonry structures is evaluated in relation to construction age, regulatory compliance, and workmanship quality. By focusing on Hatay’s unique geological setting and structural vulnerabilities, this study provides original insights into the mechanisms of earthquake-induced damage and contributes to the development of more resilient urban planning and seismic design strategies.

2. Tectonics and Seismicity of the Region

Türkiye is a key region for convergent plate deformation, primarily due to the collision of the Arabian, African, and Eurasian plates during the early Miocene period, approximately 16–23 million years ago or earlier, as indicated by previous studies [52,53,54]. Plate tectonic models, such as those proposed by [55,56,57,58], use spatial analyses to illustrate seafloor spreading, fault systems, and earthquake slip vectors, revealing the movement directions of the Arabian, African, and Anatolian plates. For example, the Arabian Plate has moved an average of 18–25 mm/year in a north-northwest direction relative to Eurasia over the last three million years, while the African Plate has moved about 10 mm/year northward relative to Eurasia. The relative motion between the African and Arabian plates is primarily left-lateral along the Dead Sea Transform Fault and is estimated at approximately 10–15 mm/year. This northward movement has created folds and thrust faults along the Bitlis–Zagros margin belt, leading to intense earthquake activity (Figure 2) and the formation of high topography in eastern Türkiye. The Anatolian Plate lies west of Karlıova, which is a triple junction point between the East Anatolian Fault and the North Anatolian Fault [59]. Furthermore, the northern edge of the African Plate subducts along the Hellenic Arc at a higher rate than its overall northward movement, suggesting that the Hellenic Arc migrates southward relative to Eurasia.
The left-lateral East Anatolian Fault marks the southern boundary of the westward-moving Anatolian block (Figure 1), as described by various researchers (e.g., refs. [61,62,63,64,65,66]). Geological and seismological evidence suggests that this fault zone has undergone substantial left-lateral displacement since the Miocene, with estimates ranging from 15–27 km [67,68] to 25–31 mm/year [65], while GPS-derived slip rate measurements indicate a slightly higher rate of 11 ± 2 mm/year [58]. However, this GPS-based estimate remains statistically consistent with geological and historical earthquake-based estimates of 6–10 mm/year, in contrast to some plate kinematic reconstructions suggesting a higher rate of around 30 mm/year [69].
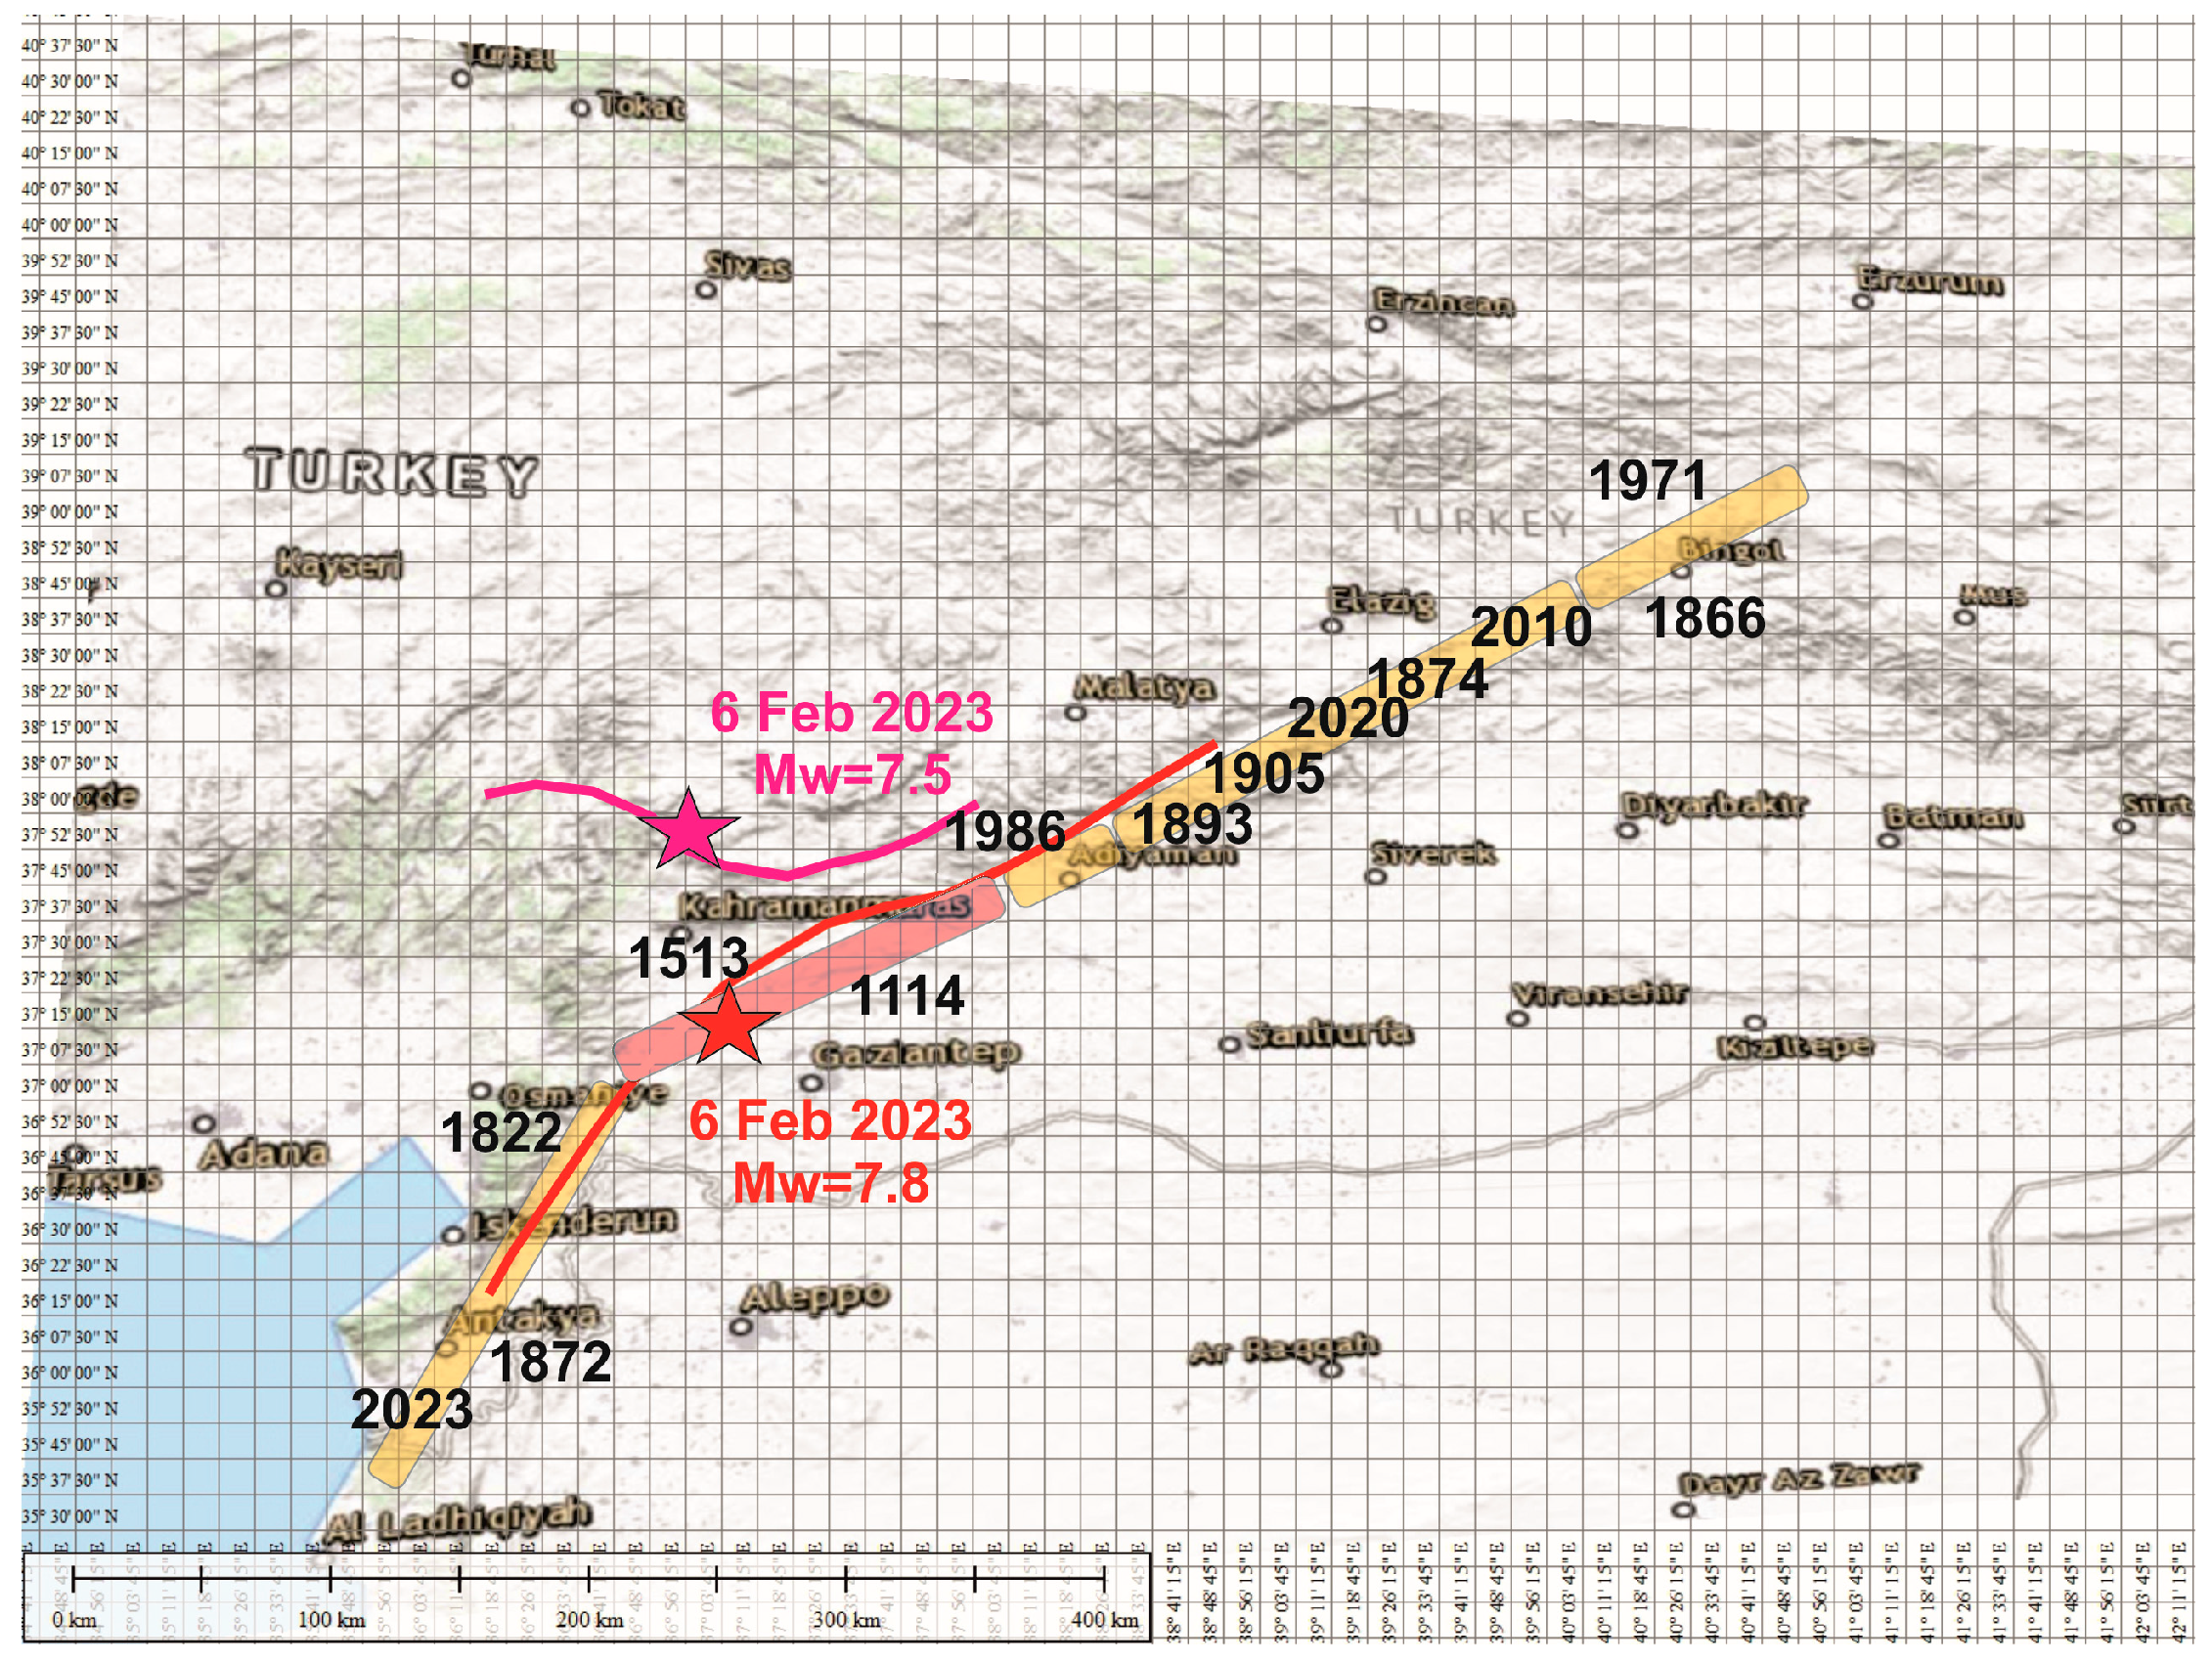
Several significant earthquakes have occurred along the East Anatolian Fault Zone, including the 1905 Sincik (M = 6.8), 1971 Bingöl (M = 6.7), and 1986 Sürgü (M = 6.1) earthquakes [67,68,69,70,71,72]. Even larger events occurred during the nineteenth century, such as the 1822 Afrin (M = 7.4), 1866 Gönek (M = 7.2), 1872 Amik Lake (M = 7.2), 1874 Gölcük Lake (M = 7.1), and 1893 South Malatya (M = 7.1) earthquakes, which collectively ruptured two-thirds of the fault zone [70]. Historical records also mention the 1114 Maraş (M = 6.9) and 1513 Tarsus–Malatya (M = 7.4) earthquakes [71]. When examining the approximate locations of these earthquakes along the East Anatolian Fault Zone (Figure 3), it can be inferred that a seismic gap of approximately 500 years existed near Kahramanmaraş and that this accumulated energy was released during the 6 February 2023 earthquakes.
The Cyprus Arc System constitutes a well-defined and currently active plate boundary and is essential for understanding the development of the Eastern Mediterranean region. The shallow structures associated with the Cyprus Arc align with a geotectonic model involving post-Miocene rotation of the South Anatolian–Cyprus Block, likely induced by “escape tectonics” resulting from continent–continent collision in eastern Türkiye and the formation of the Maraş triple junction in southeastern Türkiye. Unlike the Western Anatolia/Aegean region, subduction along the Cyprus Arc does not produce arc-parallel extension in the overriding Central Anatolia. This difference may indicate a distinct slab dip angle compared to the Hellenic Arc [72,73] (see Figure 2).
Southeastern Türkiye is characterized by unique geological features and high seismic activity. The region includes neotectonic structures such as thrust and blind thrust faults, asymmetrical folding, left-lateral shear zones, and strike-slip faults [74,75]. The Southeast Anatolian Wedge explains the thrust/blind thrust and asymmetrical folding relationships in southeastern Türkiye, Syria, and northern Iraq [75]. Recent seismic activity in southeastern Anatolia shows that north–south compression is accommodated by both thrusting and strike-slip faulting [74]. The Dead Sea Fault, originating in the Red Sea during the Miocene, propagated northwest into the Suez Gulf and north-northeast into southeastern Türkiye, influencing the structural evolution of the Gaziantep Basin [76]. The convergence of the Arabian, Anatolian, and Eurasian plates drives the formation of the Turkish Iranian Plateau, a high-elevation expanse reaching over 2 km in some areas and lying northeast of the Zagros belt [77].
The region is also known for its high seismicity. The wider area of Yalova, Gölcük, İzmit, Adapazarı, Düzce, Kaynaşlı, and Bolu, located south and east of Istanbul, was struck by two major earthquakes in 1999: one with a Mw = 7.4 on 17 August and one with a Mw = 7.2 on 12 November [78]. These earthquakes produced surface ruptures over a distance of at least 150 km, as well as settlement, soil fissures, liquefaction, landslides, tsunamis, and subsidence, with maximum intensities approaching XII [78]. Notably, after the 6 February 2023 Kahramanmaraş earthquakes, seismic activity in southeastern Türkiye has been significantly higher than previously documented.
The East Anatolian Fault Zone is a major neotectonic structure in the northeastern Mediterranean region [79]. It is approximately 550 km long, trending northeast, and exhibits left-lateral strike-slip characteristics [79]. The fault zone is divided into two main strands: southern and northern [66]. The main southern strand, approximately 580 km long, extends between Karlıova and Antakya and connects with the Dead Sea Fault Zone and the Cyprus Arc via the Amik triple junction [67]. The northern strand, known as the Sürgü–Misis Fault System, is approximately 350 km long and connects with the Kyrenia–Misis Fault Zone beneath the Gulf of İskenderun [66]. The Dead Sea Fault Zone is an active major left-lateral strike-slip fault forming the boundary between the Arabian Plate and the Sinai Block as part of the African Plate [79]. It extends from the Red Sea in the south to the East Anatolian Fault in the north [80]. The Cyprus Arc is another major neotectonic structure in the northeastern Mediterranean [79]. The East Anatolian Fault Zone accommodates approximately two-thirds of the lateral motion between the Arabian and Anatolian plates in the Çelikhan–Adana–Antakya region [67]. The overall slip rate on the East Anatolian Fault Zone is estimated at 29 mm/year, with a range of 25–35 mm/year [81]. Although historically less active than the North Anatolian Fault, the East Anatolian Fault Zone has exhibited strong seismicity in the last two decades [82].
Hatay Province occupies a critical position within this tectonic framework, lying at the intersection of the East Anatolian Fault Zone, the Dead Sea Fault Zone, and the Cyprus Arc. This unique setting creates a highly complex stress regime and significantly elevates seismic hazard in the region. The proximity of active fault segments and the presence of neotectonic structures strongly influence local ground motion characteristics and amplify earthquake risk. These tectonic factors, combined with the geological and geotechnical conditions discussed in the following section, played a decisive role in the severe damage observed during the 6 February 2023 earthquake sequence.

3. Geology of Hatay

The study area is situated within the region designated as a first-degree earthquake zone in Türkiye. Hatay Province lies at the intersection of the Anatolian, Arabian, and African tectonic plates [83], where the East Anatolian Fault, Dead Sea Fault, and Cyprus Arc converge [84]. This tectonically active setting has historically experienced significant seismic events, and similar earthquakes are anticipated in the future.
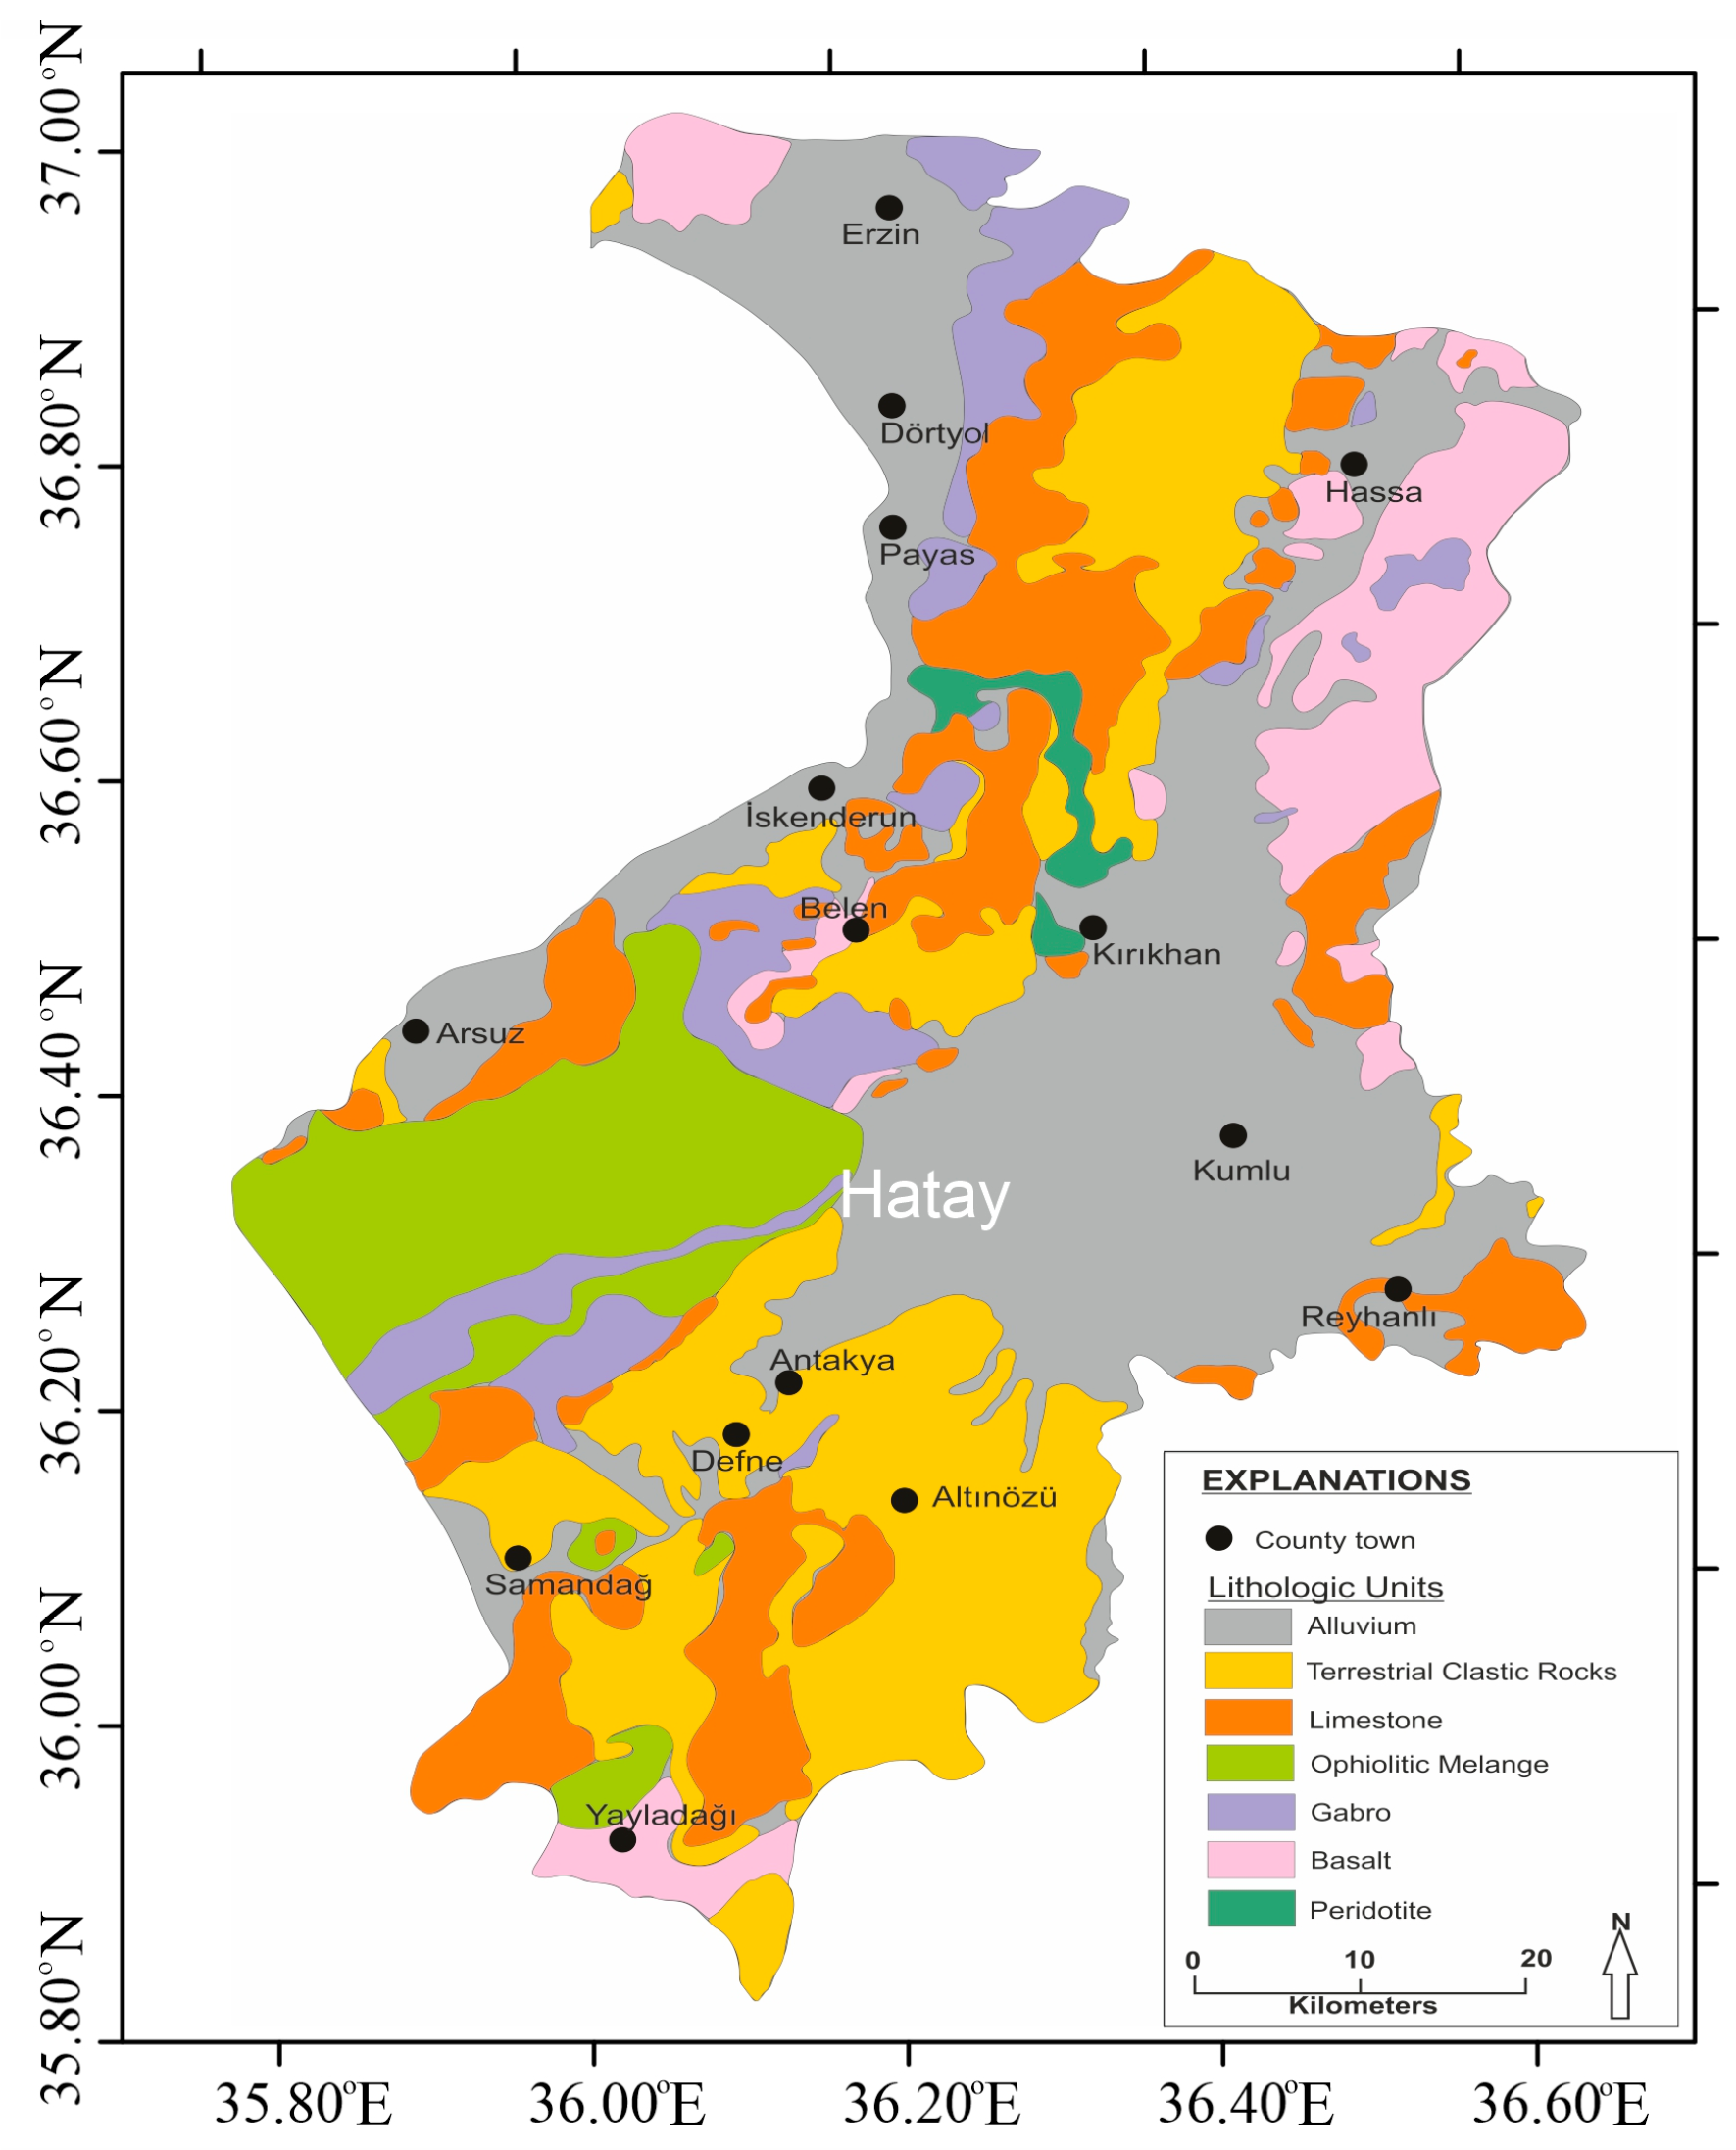
The lithological characteristics of Hatay Province are illustrated in the geological map presented in Figure 4, adapted from MTA [84]. According to this map, a substantial portion of Hatay consists of alluvial soil formations. The second most extensive lithological unit comprises terrestrial clastic rocks and formations such as limestone, which, although more stable than alluvium, remain loosely consolidated.
A notable geological feature is the presence of fault segments from both the East Anatolian Fault Zone and the Dead Sea Fault Zone traversing Hatay Province in a northeast–southwest orientation (Figure 17). Numerous districts within Hatay are constructed on substrates composed of alluvium and loosely consolidated terrestrial clastic rocks located between these fault segments.
Figure 4. Simplified geological map of Hatay (geological map of Hatay adapted from [85]).
Applsci 15 09704 g004

4. Evaluation of Strong Ground Motion Data

4.1. General Characteristics of Kahramanmaras Earthquakes
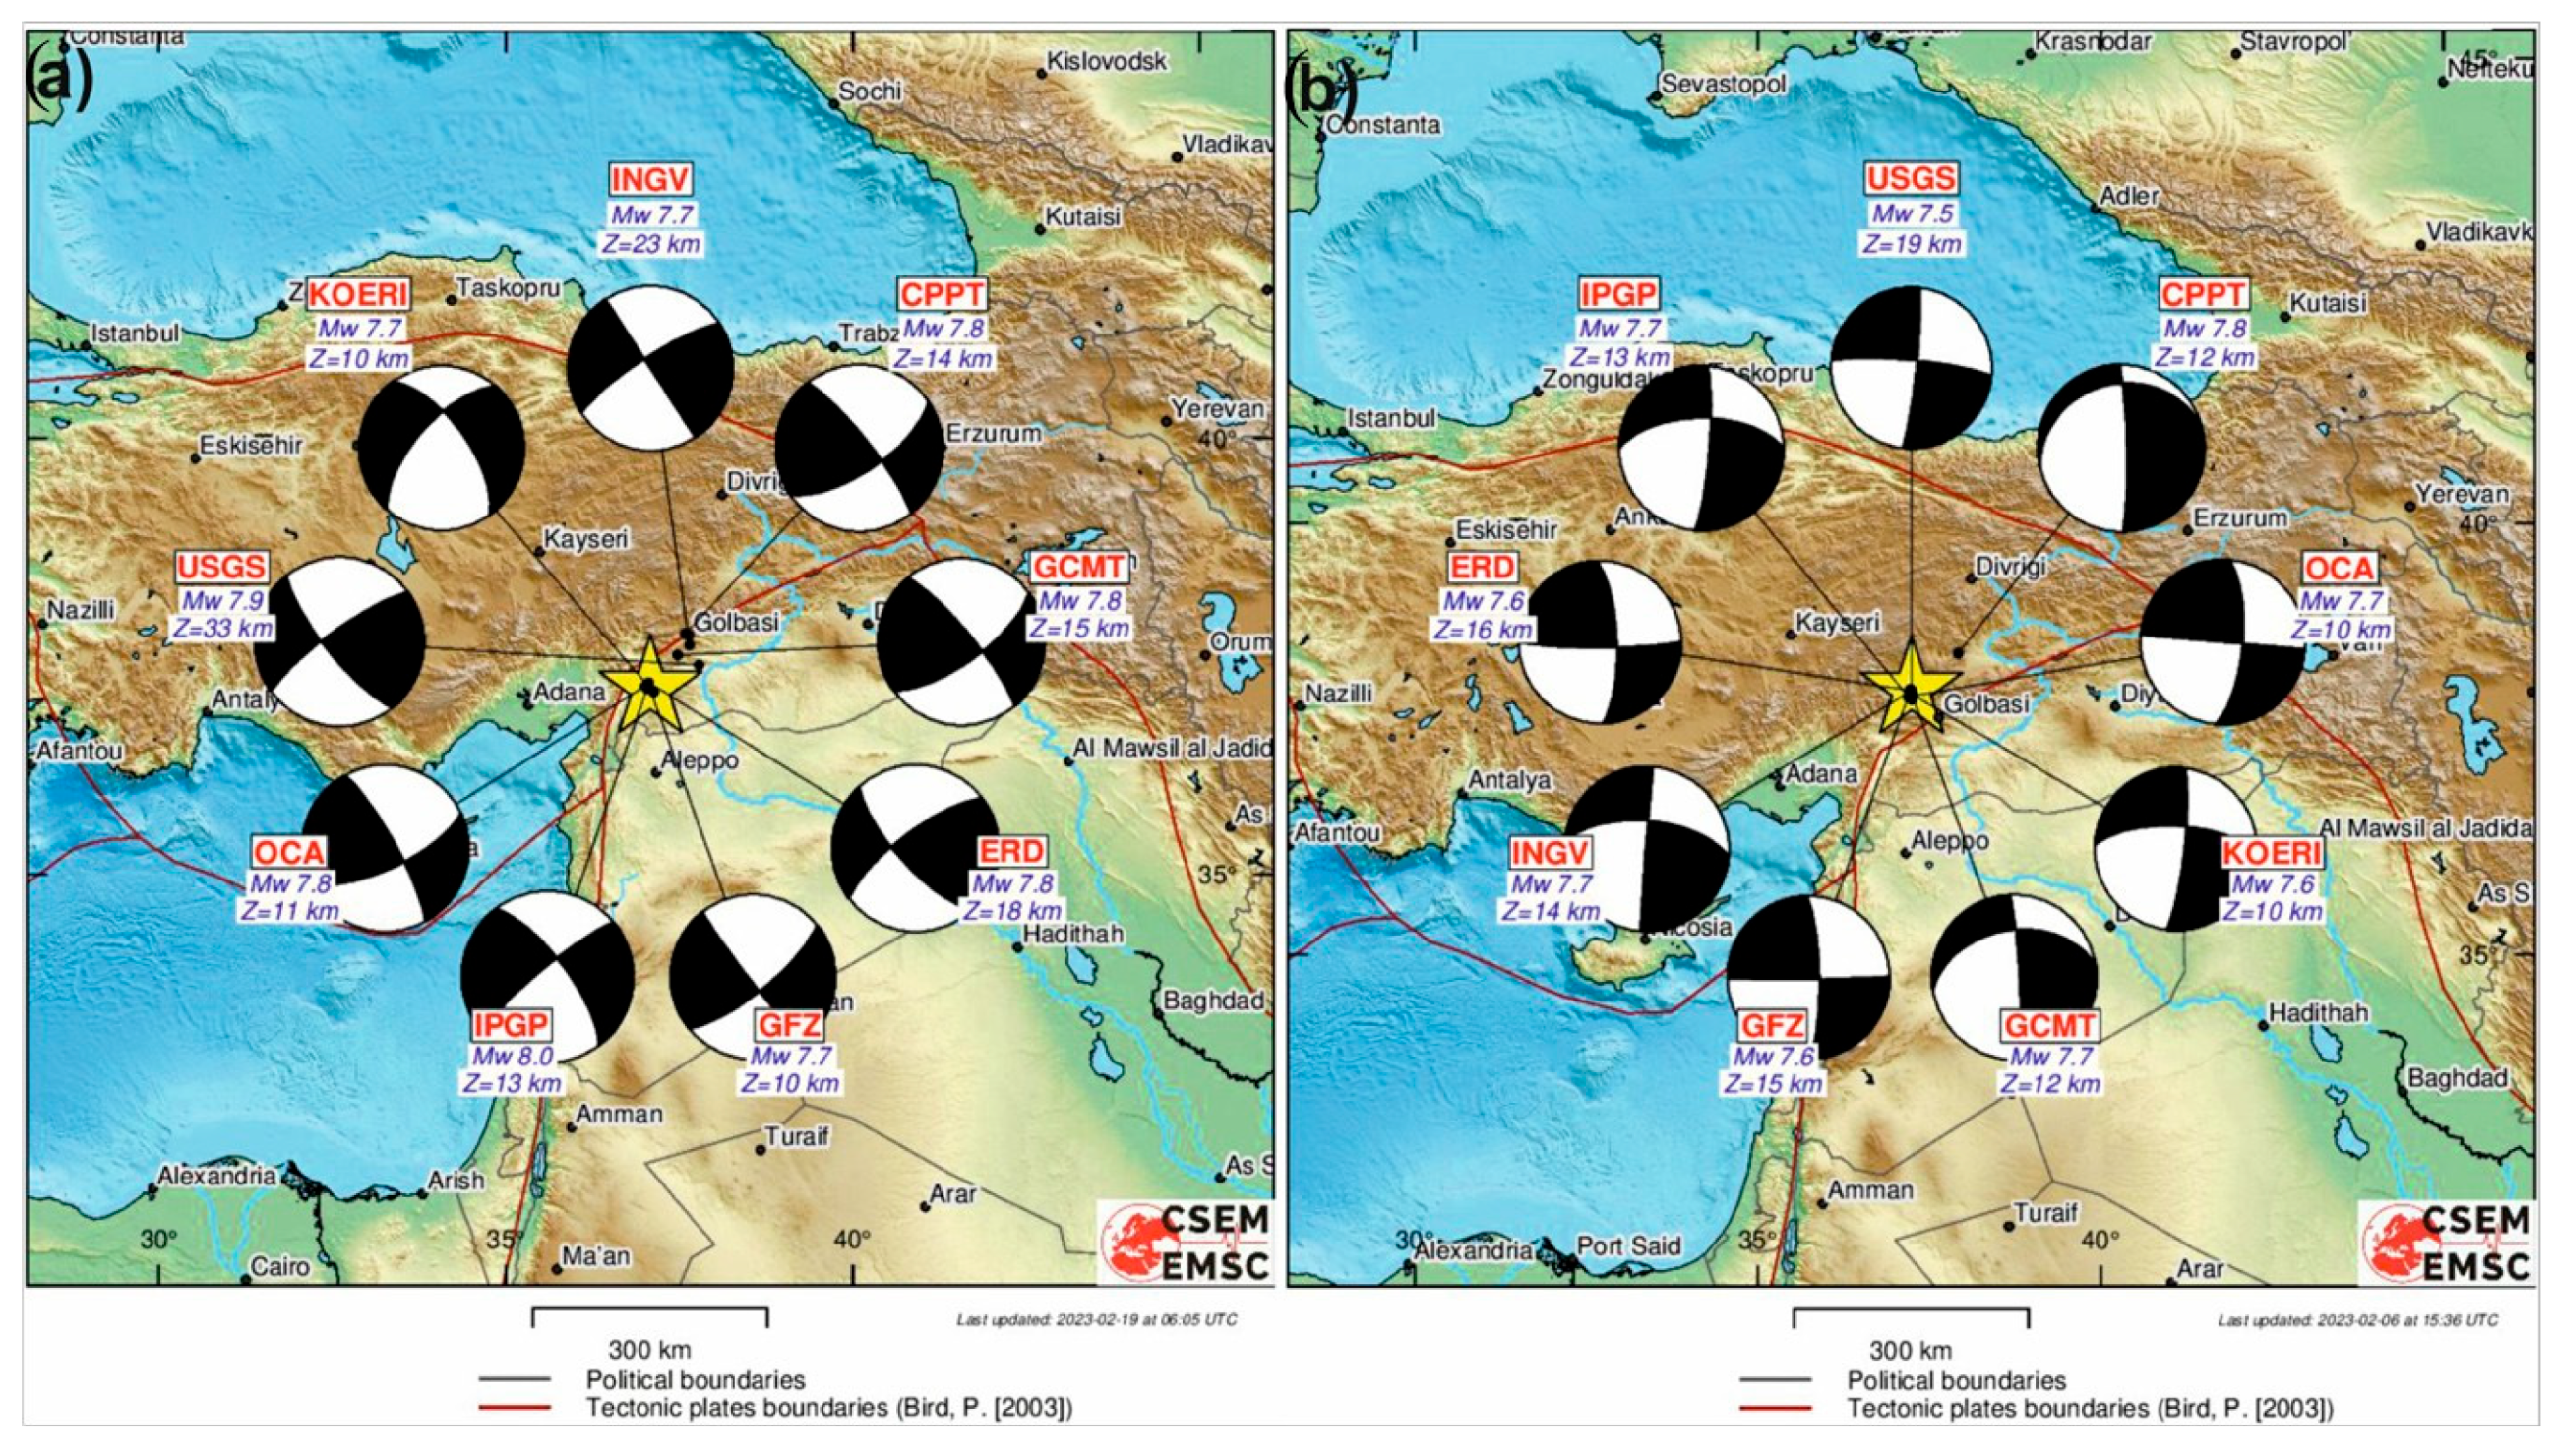
The twin earthquakes that struck southeastern Türkiye on 6 February 2023 are considered historically unprecedented due to their exceptional magnitudes, extensive geographical impact, and the rare occurrence of two major seismic events within a single day. The epicentral locations and moment tensor solutions of both earthquakes, as reported by various national and international institutions, are illustrated in Figure 5. In this study, the moment magnitudes (Mw) provided by AFAD are adopted for earthquake identification.
Figure 5. The epicenters of the devastating earthquakes on 6 February 2023 and their moment tensor solutions according to the different research centers: (a) 6 February 2023: proposed location and fast fault plane solutions of Pazarcik (Kahramanmaras) Earthquake; (b) 6 February 2023: proposed location and fast fault plane solutions of Elbistan (Kahramanmaras) Earthquake (taken from [86]). (Tectonic plates boundaries shown with red lines as in [87].)
Applsci 15 09704 g005
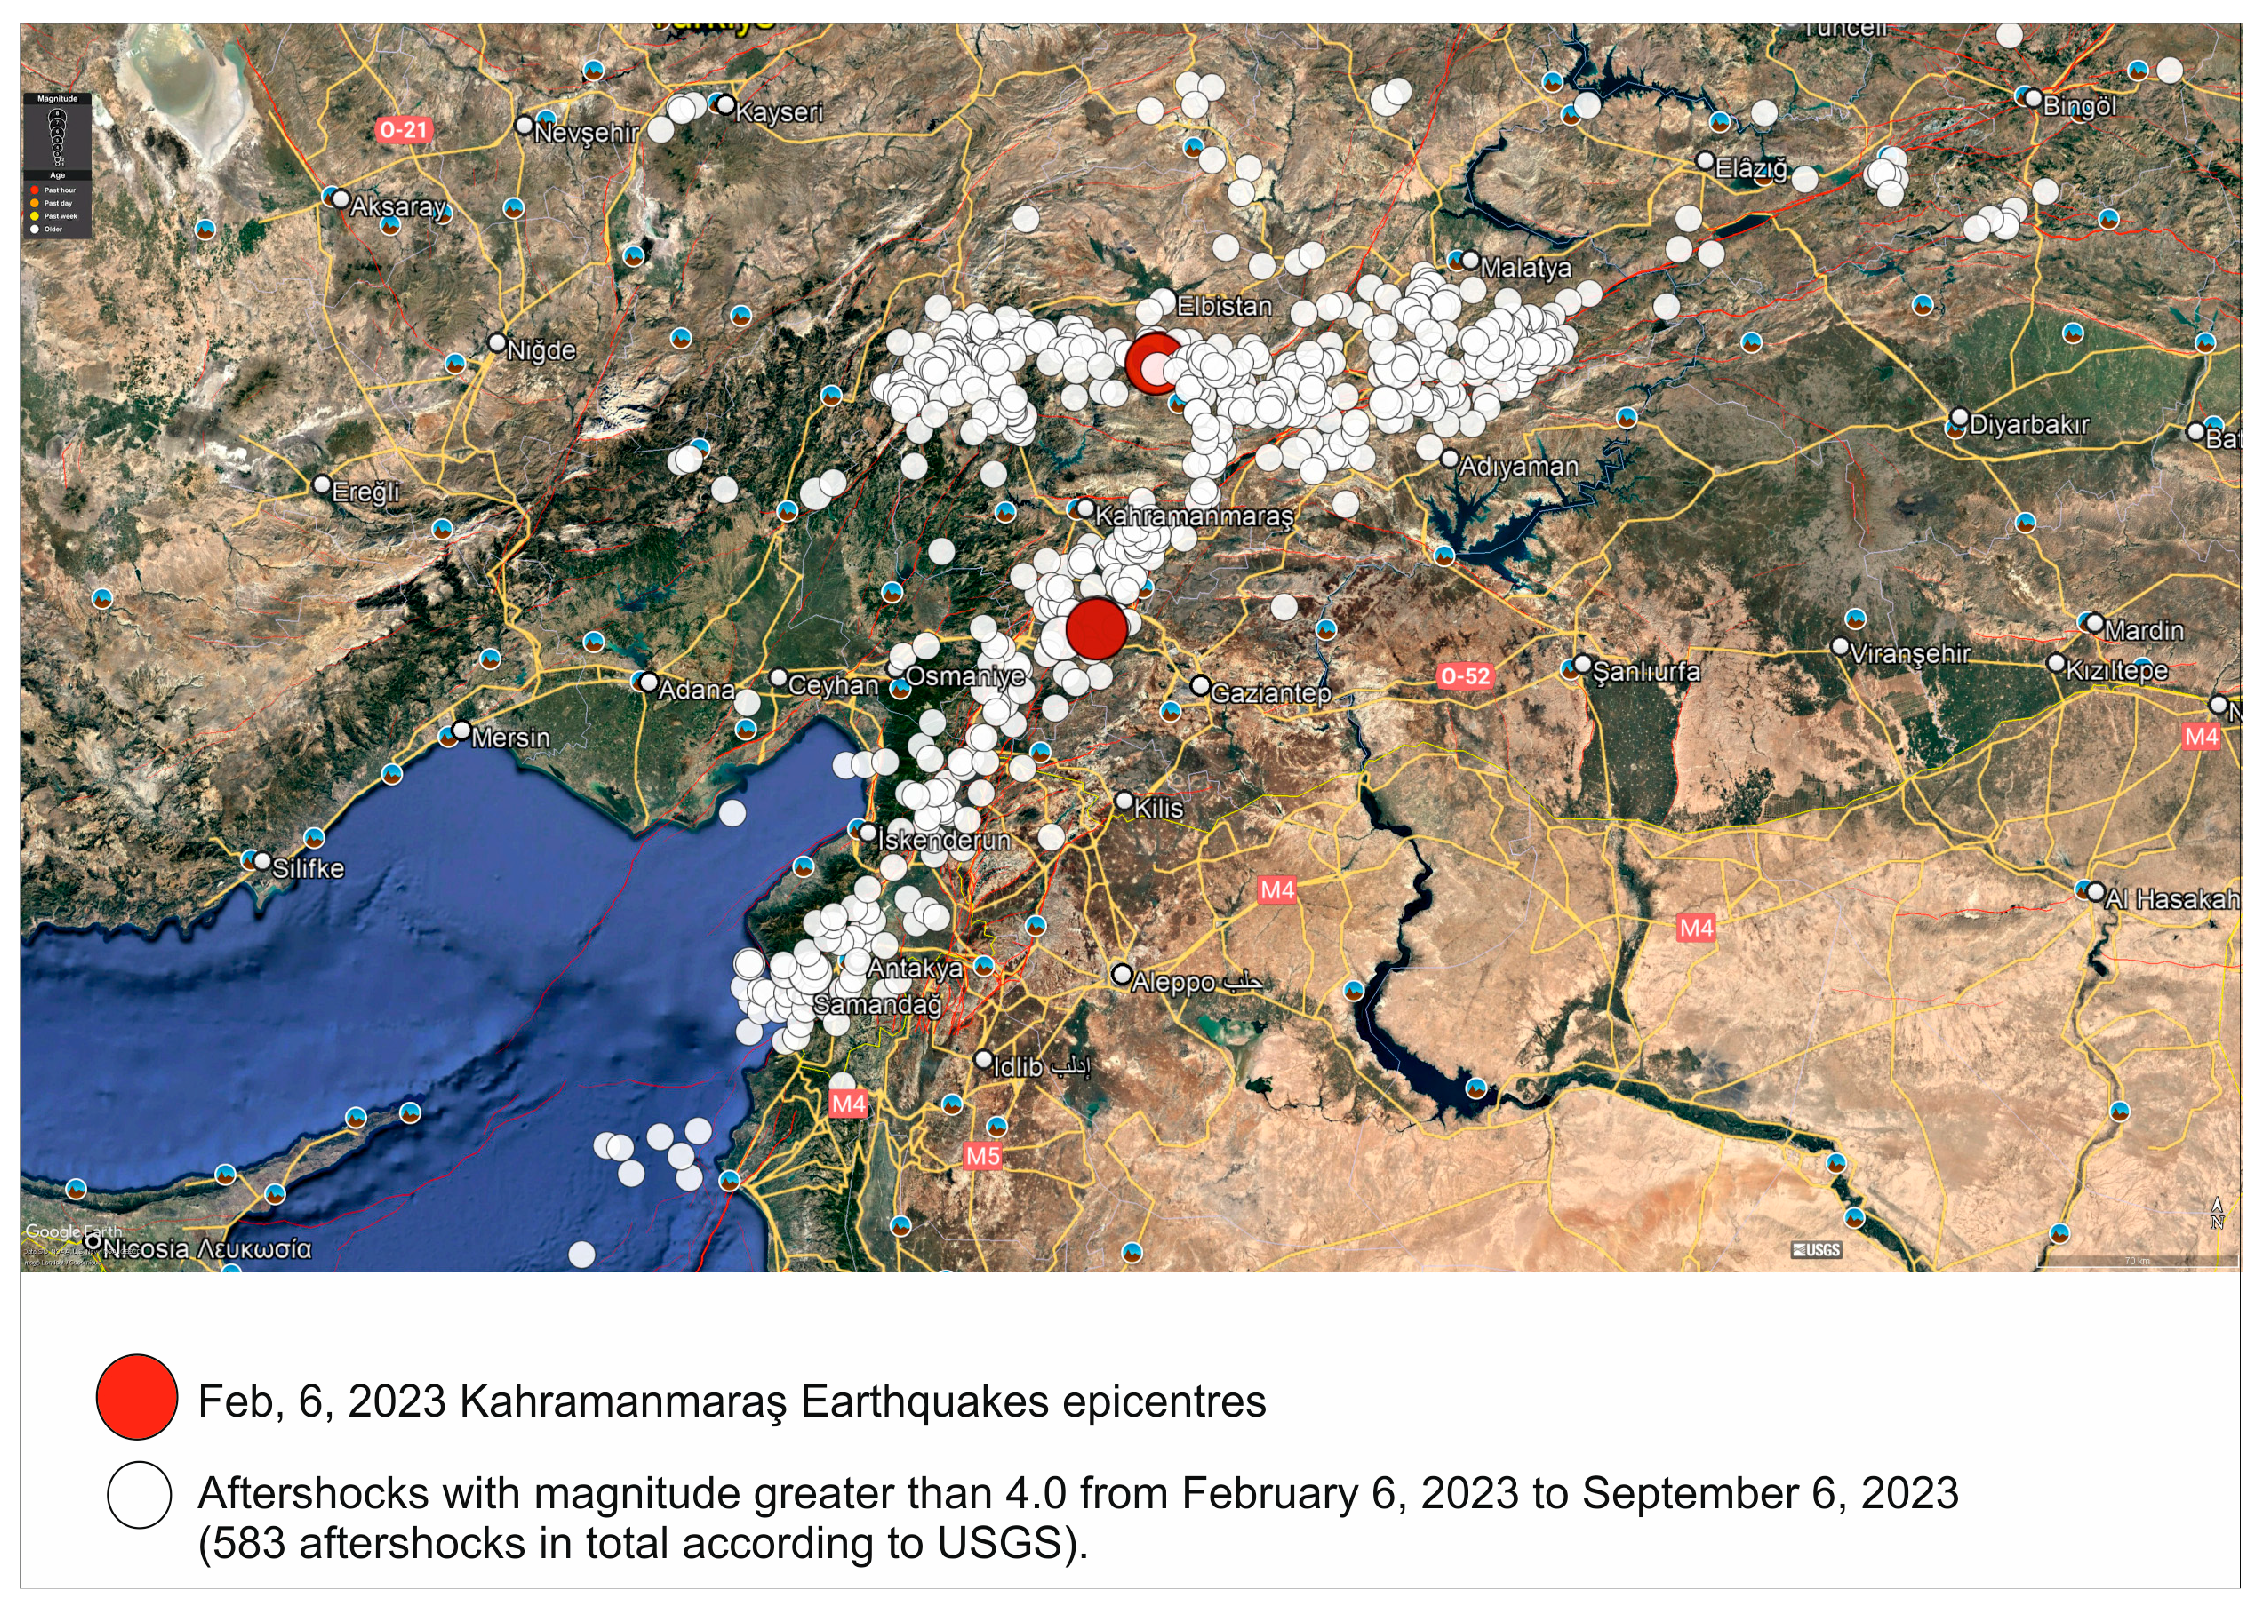
These successive and highly destructive earthquakes were strongly felt across a vast region, affecting numerous provinces, including Kahramanmaraş, Gaziantep, Hatay, Adıyaman, Osmaniye, Malatya, Elazığ, Adana, Kilis, Batman, Bingöl, Diyarbakır, Mardin, Siirt, Şırnak, Van, Muş, Bitlis, and Hakkâri. Seismic waves were also perceptible in neighboring countries such as Syria, Lebanon, Egypt, Iraq, Iran, Armenia, and Georgia (Figure 6a,b). The earthquakes directly impacted an area inhabited by approximately 15 million people, resulting in extensive loss of life, widespread structural damage, and severe disruption to infrastructure and natural resources. The epicenters and the distribution of aftershocks are presented in Figure 7.
Figure 6. The microseismic intensity shakes maps. (a) Pazarcik (Kahramanmaras) earthquake: Mw = 7.7 (b) Elbistan (Kahramanmaras) earthquake: Mw = 7.6 (taken from [88]).
Applsci 15 09704 g006
Figure 7. The 6 February 2023 Kahramanmaras earthquake epicenters and their aftershocks (data taken from [1]).
Applsci 15 09704 g007
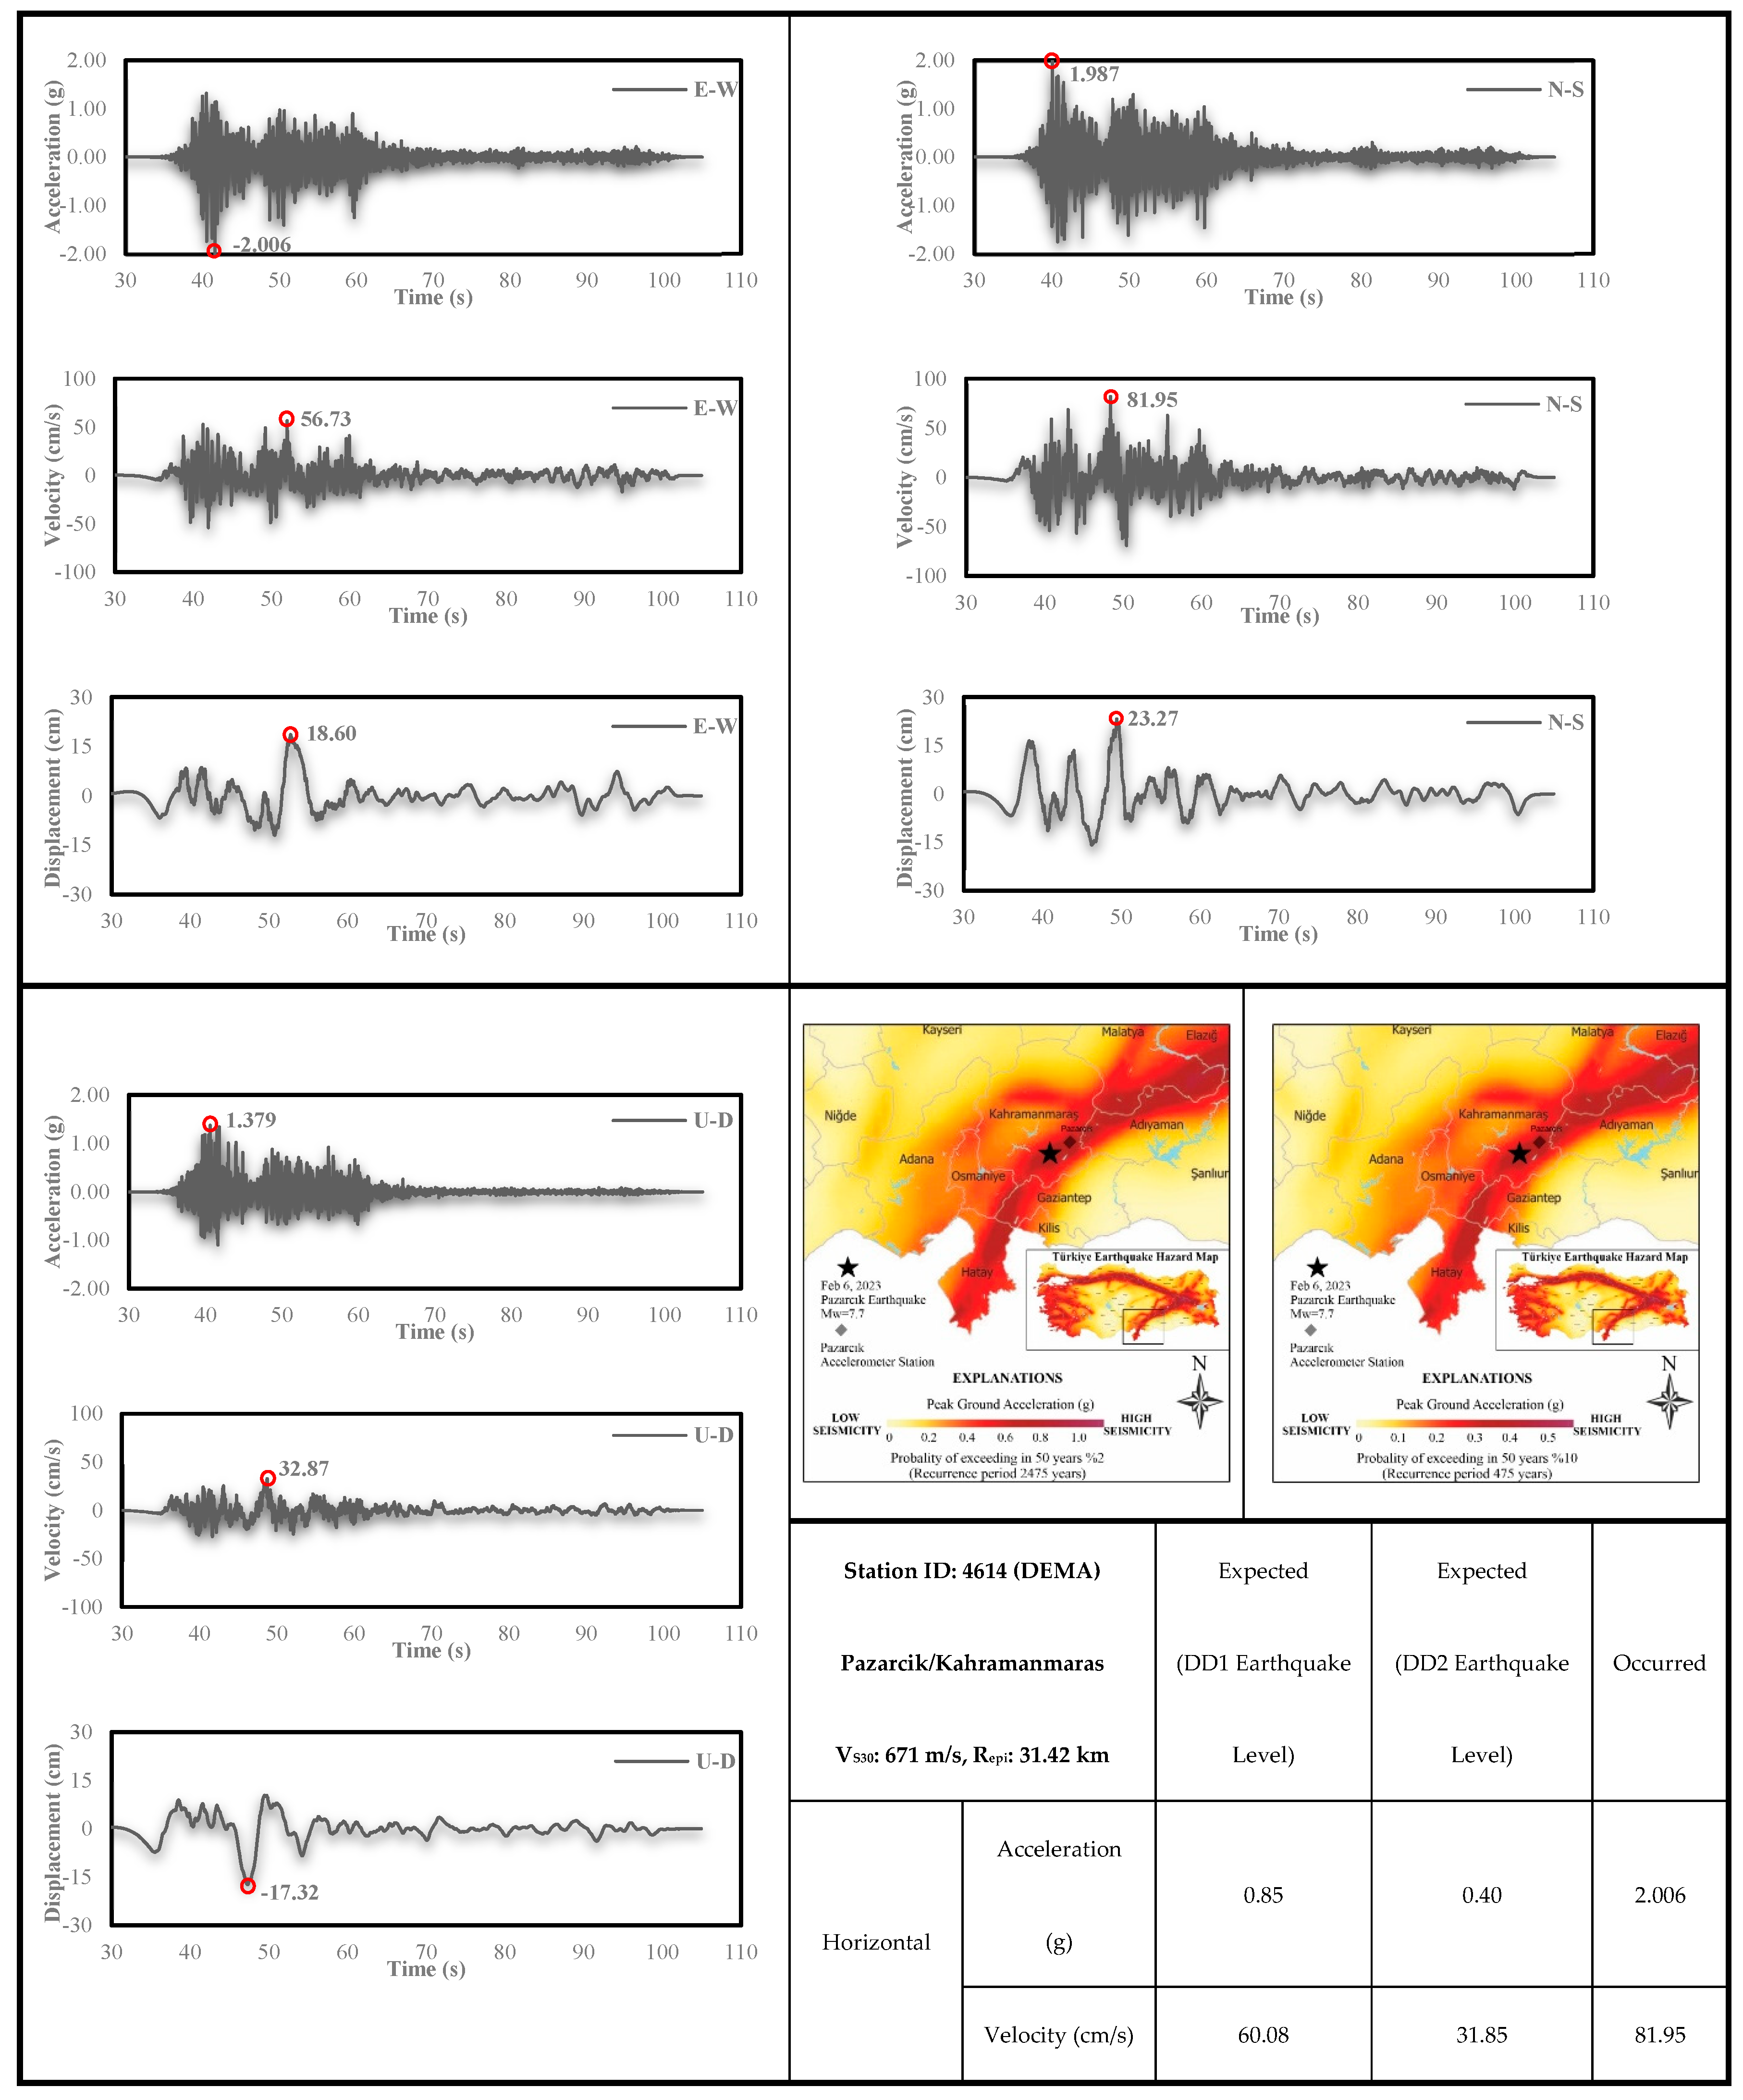
Key ground motion parameters of the Pazarcık (Kahramanmaraş) and Elbistan (Kahramanmaraş) earthquakes are presented in Table 1 and Table 2. In this context, RJB, Rrup, and Repi represent the Joyner–Boore distance (the perpendicular distance to the surface projection of the rupture), the closest distance to the rupture surface, and the epicentral distance, respectively. At the Pazarcık station (ID: 4614), located approximately 31.42 km from the epicenter of the first earthquake, peak ground acceleration (PGA) values were recorded as 1.987 g (N–S), 2.006 g (E–W), and 1.379 g (U–D). Similarly, at the Göksun station (ID: 4612), situated 66.68 km from the epicenter of the second earthquake, PGA values reached 0.640 g (N–S), 0.531 g (E–W), and 0.439 g (U–D). These recordings provide critical insights into the intensity and distribution of seismic forces across the region. Notably, the Pazarcık earthquake produced much higher horizontal accelerations compared to the Elbistan event, while the latter exhibited relatively higher velocity values at some stations. Furthermore, stations located at greater distances—such as Defne (Hatay) and Kırıkhan—also recorded high PGA values, indicating the influence of local site effects such as soil amplification and basin geometry.
Table 1. Ground motion characteristics of 6 February 2023 Pazarcik (Kahramanmaras) earthquake, as recorded by some accelerometer stations [1].
StationMeasured Acceleration
Values (g)
RJB
(km)
Rrup
(km)
Repi
(km)
CodeProvinceDistrictLatitudeLongitudeN-SE-WU-D
NarKahramanmarasNarlı37.391937.15740.6920.6380.2290.007.4715.35
4616KahramanmarasTürkoğlu36.8383637.375470.6220.4370.3954.0322.4220.54
2712GaziantepNurdağı36.7328337.1840.5670.6040.3202.7411.5829.79
4614KahramanmarasPazarcik37.2977537.485131.9872.0061.3790.008.2531.42
4621KahramanmarasDulkadiroğlu37.5934736.929090.3760.2290.67828.4936.3235.42
2718Gaziantepİslahiye36.626637.007770.6670.6430.6040.002.1048.30
3144HatayHassa36.7569136.4857420.6150.7890.48112.3612.3677.04
3142HatayKırıkhan36.3661236.497970.6650.7540.46638.0938.09106.49
0201AdıyamanMerkez38.2674237.761210.3830.2820.20645.7648.06120.12
3129HatayDefne36.134336.191171.3781.2220.73175.7175.71146.39
Table 2. Ground motion characteristics of 6 February 2023 Elbistan (Kahramanmaras) earthquake, as recorded by some accelerometer stations [1].
StationMeasured Acceleration
Values (g)
RJBRrupRepi
CodeProvinceDistrictLatitudeLongitudeN-SE-WU-D
4631KahramanmarasNurhak37.96632537.4276530.3240.4000.55911.6019.6921.43
4611KahramanmarasÇağlayancerit37.747237.284260.1960.1360.0730.006.8538.21
4612KahramanmarasGöksun38.0239536.481870.6400.5310.43962.1862.1866.68
0213AdıyamanTut37.7966737.929570.1230.1290.07255.1661.3568.73
3802KayseriSarız38.4781236.503590.1970.2220.12258.1258.1277.41
4406MalatyaAkçadağ38.3438837.973780.4540.3900.29060.6966.6470.17
The time histories of acceleration, velocity, and displacement components were recorded in horizontal and vertical directions at station 4614 (Pazarcık) for the Pazarcık (Kahramanmaraş) earthquake and station 4612 (Göksun) for the Elbistan (Kahramanmaraş) earthquake, and are presented graphically in Figure 8 and Figure 9, respectively. In addition, by showing the location of these stations on the Türkiye Earthquake Hazard Map (TEHM 2019 [89]), the maximum acceleration and velocity values expected as earthquake hazards in this region and the actual recorded values during the earthquakes are tabulated [1,89].
For the Pazarcık (Kahramanmaraş) earthquake, the highest recorded horizontal acceleration and velocity values were 2.006 g and 81.95 cm/s, respectively, at the Pazarcık station (ID: 4614). According to the Türkiye Earthquake Hazard Map (TEHM 2019) [89], the expected design-level acceleration values for this location are 0.853 g for Earthquake Level 1 (DD1, 2% probability of exceedance in 50 years) and 0.470 g for Earthquake Level 2 (DD2, 10% probability of exceedance in 50 years). Similarly, the expected velocity values are 60.08 cm/s (DD1) and 31.85 cm/s (DD2). The recorded acceleration was approximately 2.35 times greater than DD1 and 4.27 times greater than DD2, while the velocity exceeded DD1 by 1.36 times and DD2 by 2.57 times. These findings indicate that the seismic demand at this site significantly surpassed design expectations. Furthermore, the vertical acceleration reached 1.379 g, exceeding gravitational acceleration by 37.9%, underscoring the importance of vertical ground motion components.
For the Elbistan (Kahramanmaraş) earthquake, the Göksun station (ID: 4612) recorded horizontal acceleration and velocity values of 0.64 g and 170.78 cm/s, respectively. The TEHM 2019 [89] design values for this location are 0.624 g (DD1) and 0.296 g (DD2) for acceleration and 38.71 cm/s (DD1) and 17.56 cm/s (DD2) for velocity. While the acceleration was close to the DD1 threshold, it was more than double the DD2 value. The velocity, however, was significantly higher, approximately 4.4 times DD1 and nearly 10 times DD2, indicating an intense seismic energy release. The vertical acceleration component was measured at 0.439 g, again highlighting the relevance of vertical motion to structural response.
Although the moment magnitudes of the Pazarcık (Mw = 7.7) and Elbistan (Mw = 7.6) earthquakes were similar, the recorded ground motion parameters showed notable differences. The Pazarcık event produced higher acceleration values, likely due to its rupture mechanism, fault geometry, and proximity to recording stations [90]. In contrast, the Elbistan earthquake exhibited higher velocity and displacement values at certain sites, which may be attributed to longer rupture duration, directivity effects, and local site conditions [48]. These variations emphasize the complex nature of seismic wave propagation and the influence of both source and path effects on ground motion characteristics [89].

4.2. Evaluation of Strong Ground Motion Records Measured in Hatay
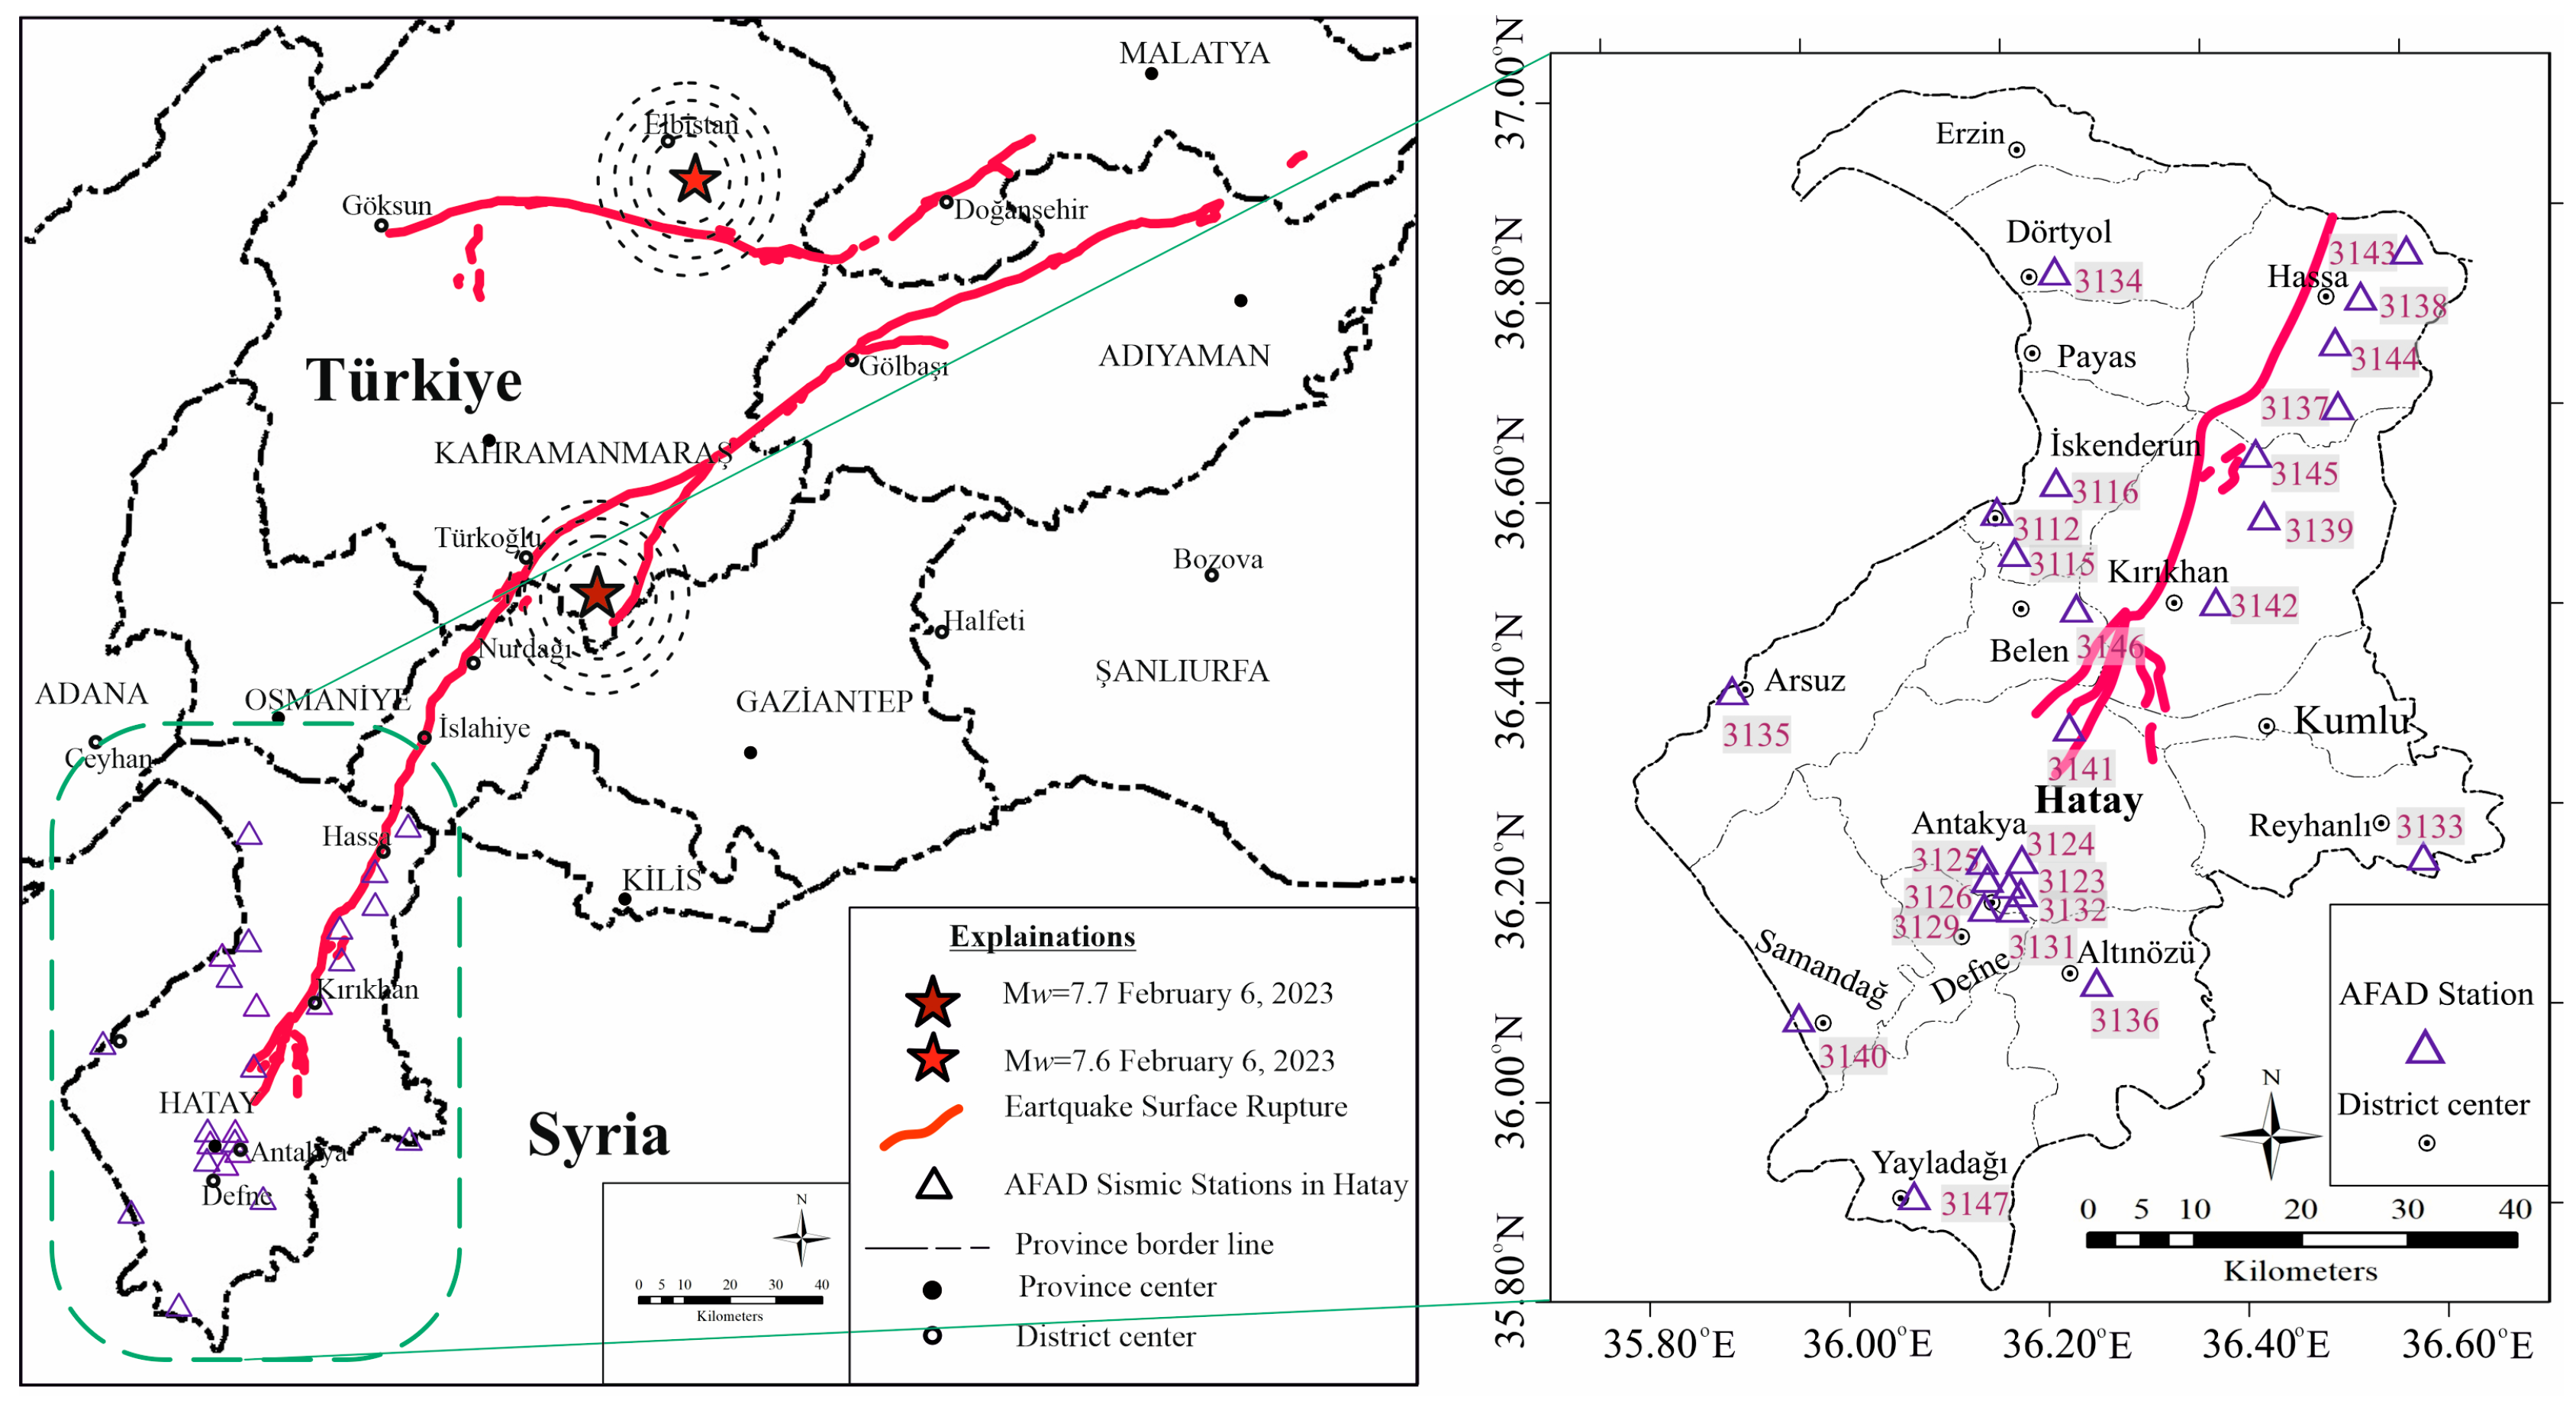
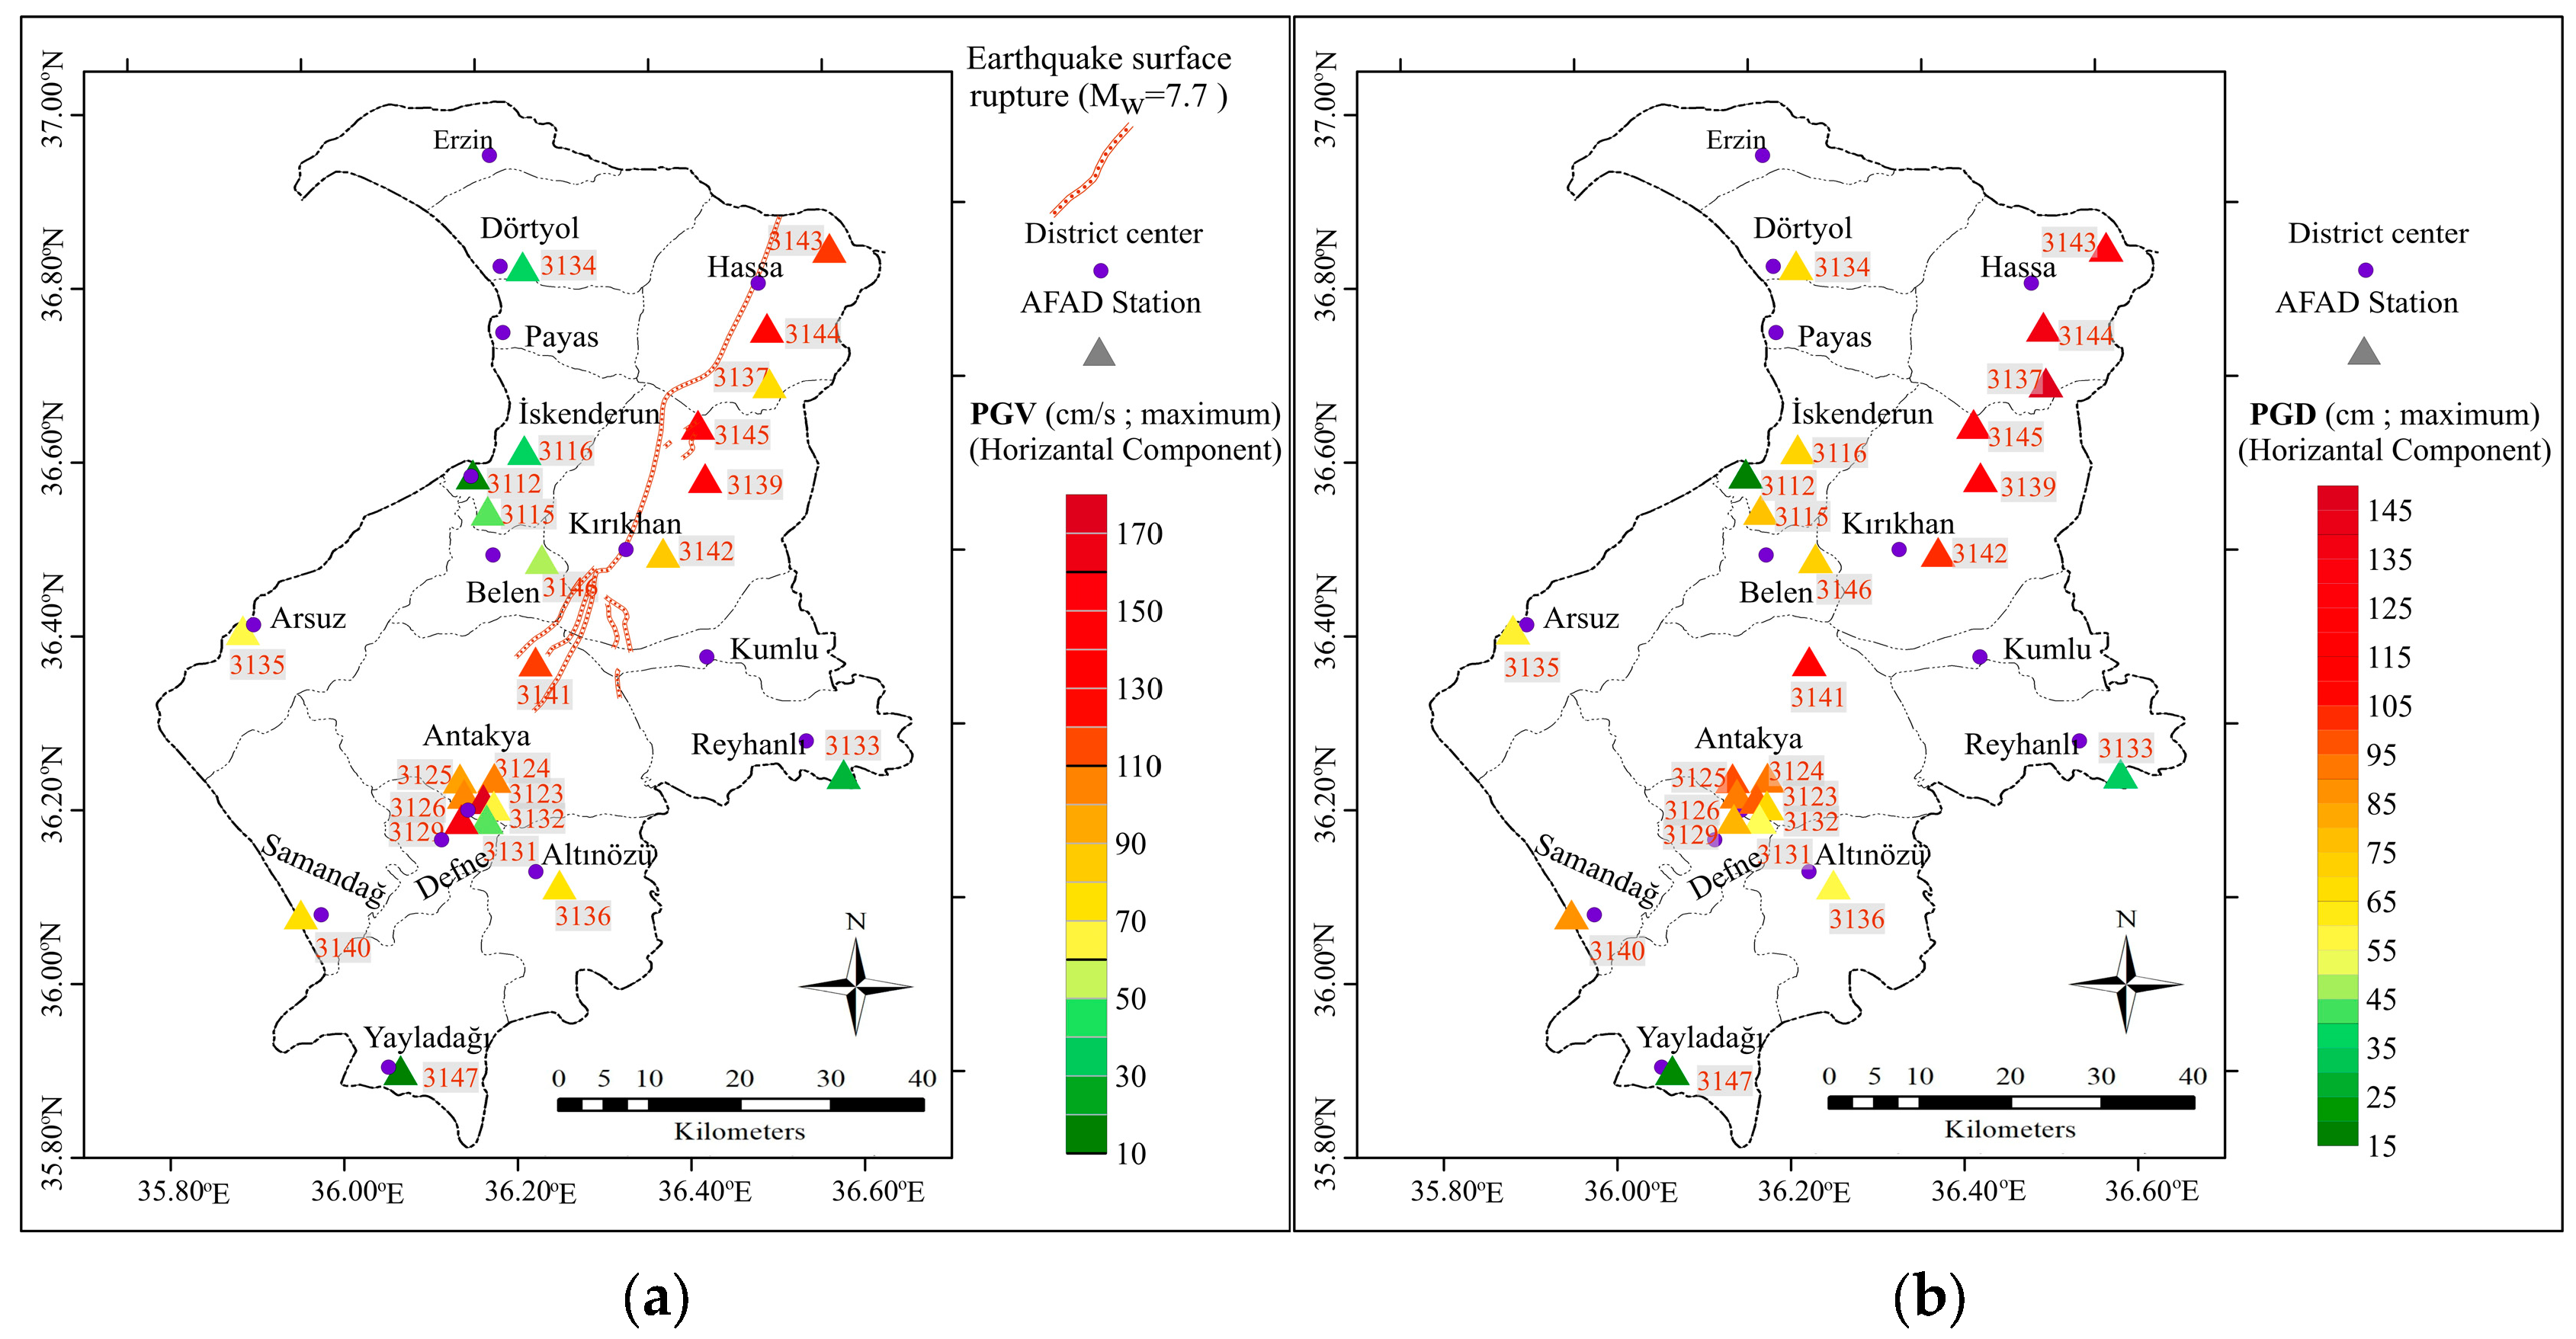
The first earthquake (Mw = 7.7) had a particularly severe impact on Hatay Province, with its surface rupture extending almost to the city center of Antakya. Compared to the second event, significantly higher acceleration values were recorded across Hatay during the initial shock. Consequently, this section focuses exclusively on the strong ground motion records obtained from seismic stations in Hatay during the first earthquake. The analysis includes the spatial distribution of peak ground acceleration (PGA), peak ground velocity (PGV), peak ground displacement (PGD), and acceleration response spectra. Figure 10 illustrates the geographical location of Hatay relative to the earthquake epicenters, along with the positions and identifiers of the seismic stations that provided reliable ground motion data. Table 3 summarizes key parameters measured in the ground motions recorded at these stations.
Figure 10. Seismic stations in Hatay with available measurements during Mw = 7.7 Pazarcik earthquake. (Earthquake surface rupture map taken from [91]).
Applsci 15 09704 g010
Table 3. Ground motion characteristics of 6 February 2023 Pazarcik (Kahramanmaras) earthquake, as recorded by Hatay seismic stations [1].
CodeLongitudeLatitudeProvinceDistrictPGA PGVPGDRJB
(km)
Rrup
(km)
Repi
(km)
E-W N-SU-DE-WN-SE-WN-SVs (30)
314336.557136.8489HatayHassa0.350.390.39104.41124.9090.64125.704448.108.1065.13
314436.485736.7569Hassa0.790.620.48133.43131.50132.73111.5648512.3612.3677.04
313436.204936.8276Dörtyol0.200.250.1239.5539.1466.3541.3537414.2416.7190.29
313736.488536.6929Hassa0.680.440.4676.8880.9054.25142.1168818.4418.4482.48
314536.406436.6454Kırıkhan0.710.600.62157.83116.51125.39125.8253321.6821.6891.13
313936.414436.5838Kırıkhan0.510.580.36145.32155.50119.04120.4027228.5428.5496.19
311636.206636.6162İskenderun0.160.160.1535.0239.7643.9968.9587029.9829.98105.38
311236.147736.5880İskenderun0.080.100.0910.1915.7513.3916.9723335.6135.61111.31
314236.366136.4980Kırıkhan0.750.660.4776.2390.5298.8580.0253938.0938.09106.49
311536.164636.5463Belen0.230.290.2248.3241.1374.0030.3342438.5338.53113.57
314636.227036.4908Belen0.330.470.2854.6442.2170.9251.94None41.5741.57114.57
314136.219736.3726Antakya0.851.010.68123.9980.61107.3960.9733854.2054.20125.42
313535.883136.4089Arsuz1.340.760.5965.4750.2248.4257.4446066.1866.18142.15
313336.573636.2432Reyhanlı0.150.230.0923.3829.1933.2920.3437768.2168.21123.47
312436.172236.2387Antakya0.630.580.5997.04112.3789.4347.2828369.6669.66140.11
312536.132636.2381Antakya1.090.791.08102.6874.6794.9466.0244870.8270.82142.15
312636.137536.2202Antakya1.021.200.9492.75110.2788.7050.9735072.5572.55143.54
312336.159736.2142Antakya0.590.660.8698.75186.8692.9063.6847072.5872.58143.00
313236.171636.2067Antakya0.520.510.3651.9967.4667.4431.7737773.0873.08143.12
313136.163336.1912Antakya0.360.360.1544.9348.0526.2052.2656774.9574.95144.98
312936.134336.1912Defne1.221.380.7375.90171.3576.6251.3644775.7175.71146.39
313636.247236.1159Altınözü0.390.530.2276.8951.8654.2535.0134481.4781.47148.38
314035.949836.0816Samandağ0.220.200.1879.1163.3784.0248.2121093.1493.14165.82
314736.064435.9024Yayladağı0.110.060.0312.8513.6913.7018.86None108.21108.21177.12
Figure 11 and Figure 12 present the spatial distribution of PGA, PGV, and PGD values across Hatay. The highest PGA values (≥1.0 g) cluster in the Antakya–Defne–Arsuz corridor, despite rupture distances of 55–75 km, indicating significant amplification within thick alluvial deposits of the Antakya Basin. In contrast, near-fault stations in Hassa and Kırıkhan, located on limestone and ophiolitic units, recorded moderate-to-high PGA values (0.5–0.8 g), consistent with their proximity to the mapped surface rupture but moderated by stiffer site conditions. Southeastern districts such as Reyhanlı and Yayladağı, underlain by more competent lithologies and located farther from the rupture, exhibit PGA values below 0.3 g. Vertical PGA reaches exceptional amplitudes approaching 1.0 g in Antakya and Defne, producing V/H ratios near or above unity at several stations. These elevated vertical motions, concentrated over alluvial deposits, suggest a strong high-frequency content and possible constructive interference within the basin.
Figure 11 displays the PGV and PGD values derived from seismic station acceleration records across Hatay Province. Horizontal PGV (Figure 11a) exhibits two dominant clusters: the Antakya–Defne corridor, where PGV exceeds 170 cm/s, occurring on thick alluvial sediments (Figure 3) at rupture distances exceeding 70 km, indicating long-period energy trapping and three-dimensional basin effects; the near-fault Hassa–Kırıkhan belt, where PGV ranges from 130 to 158 cm/s, aligning with the mapped surface rupture (Figures 15 and 16) and reflecting forward directivity and pulse-like motions. In contrast, Reyhanlı and Yayladağı, located on more competent lithologies and farther from the rupture, exhibit PGV values below 30 cm/s. Horizontal PGD (Figure 11b) shows the clearest distance decay among the three metrics, yet significant anomalies persist in the Antakya Basin. Maximum PGD values (~120–145 cm) occur along the Hassa–Kırıkhan near-fault corridor, coinciding with the surface rupture trace (Figure 16) and reflecting strong directivity effects. Elevated PGD (90–107 cm) in Antakya and Defne, despite rupture distances of 55–75 km, highlights the role of thick alluvial deposits (Figure 3) in amplifying long-period components. Southeastern districts, underlain by stiffer formations, exhibit PGD values below 35 cm, consistent with limited amplification and greater source-to-site distances.
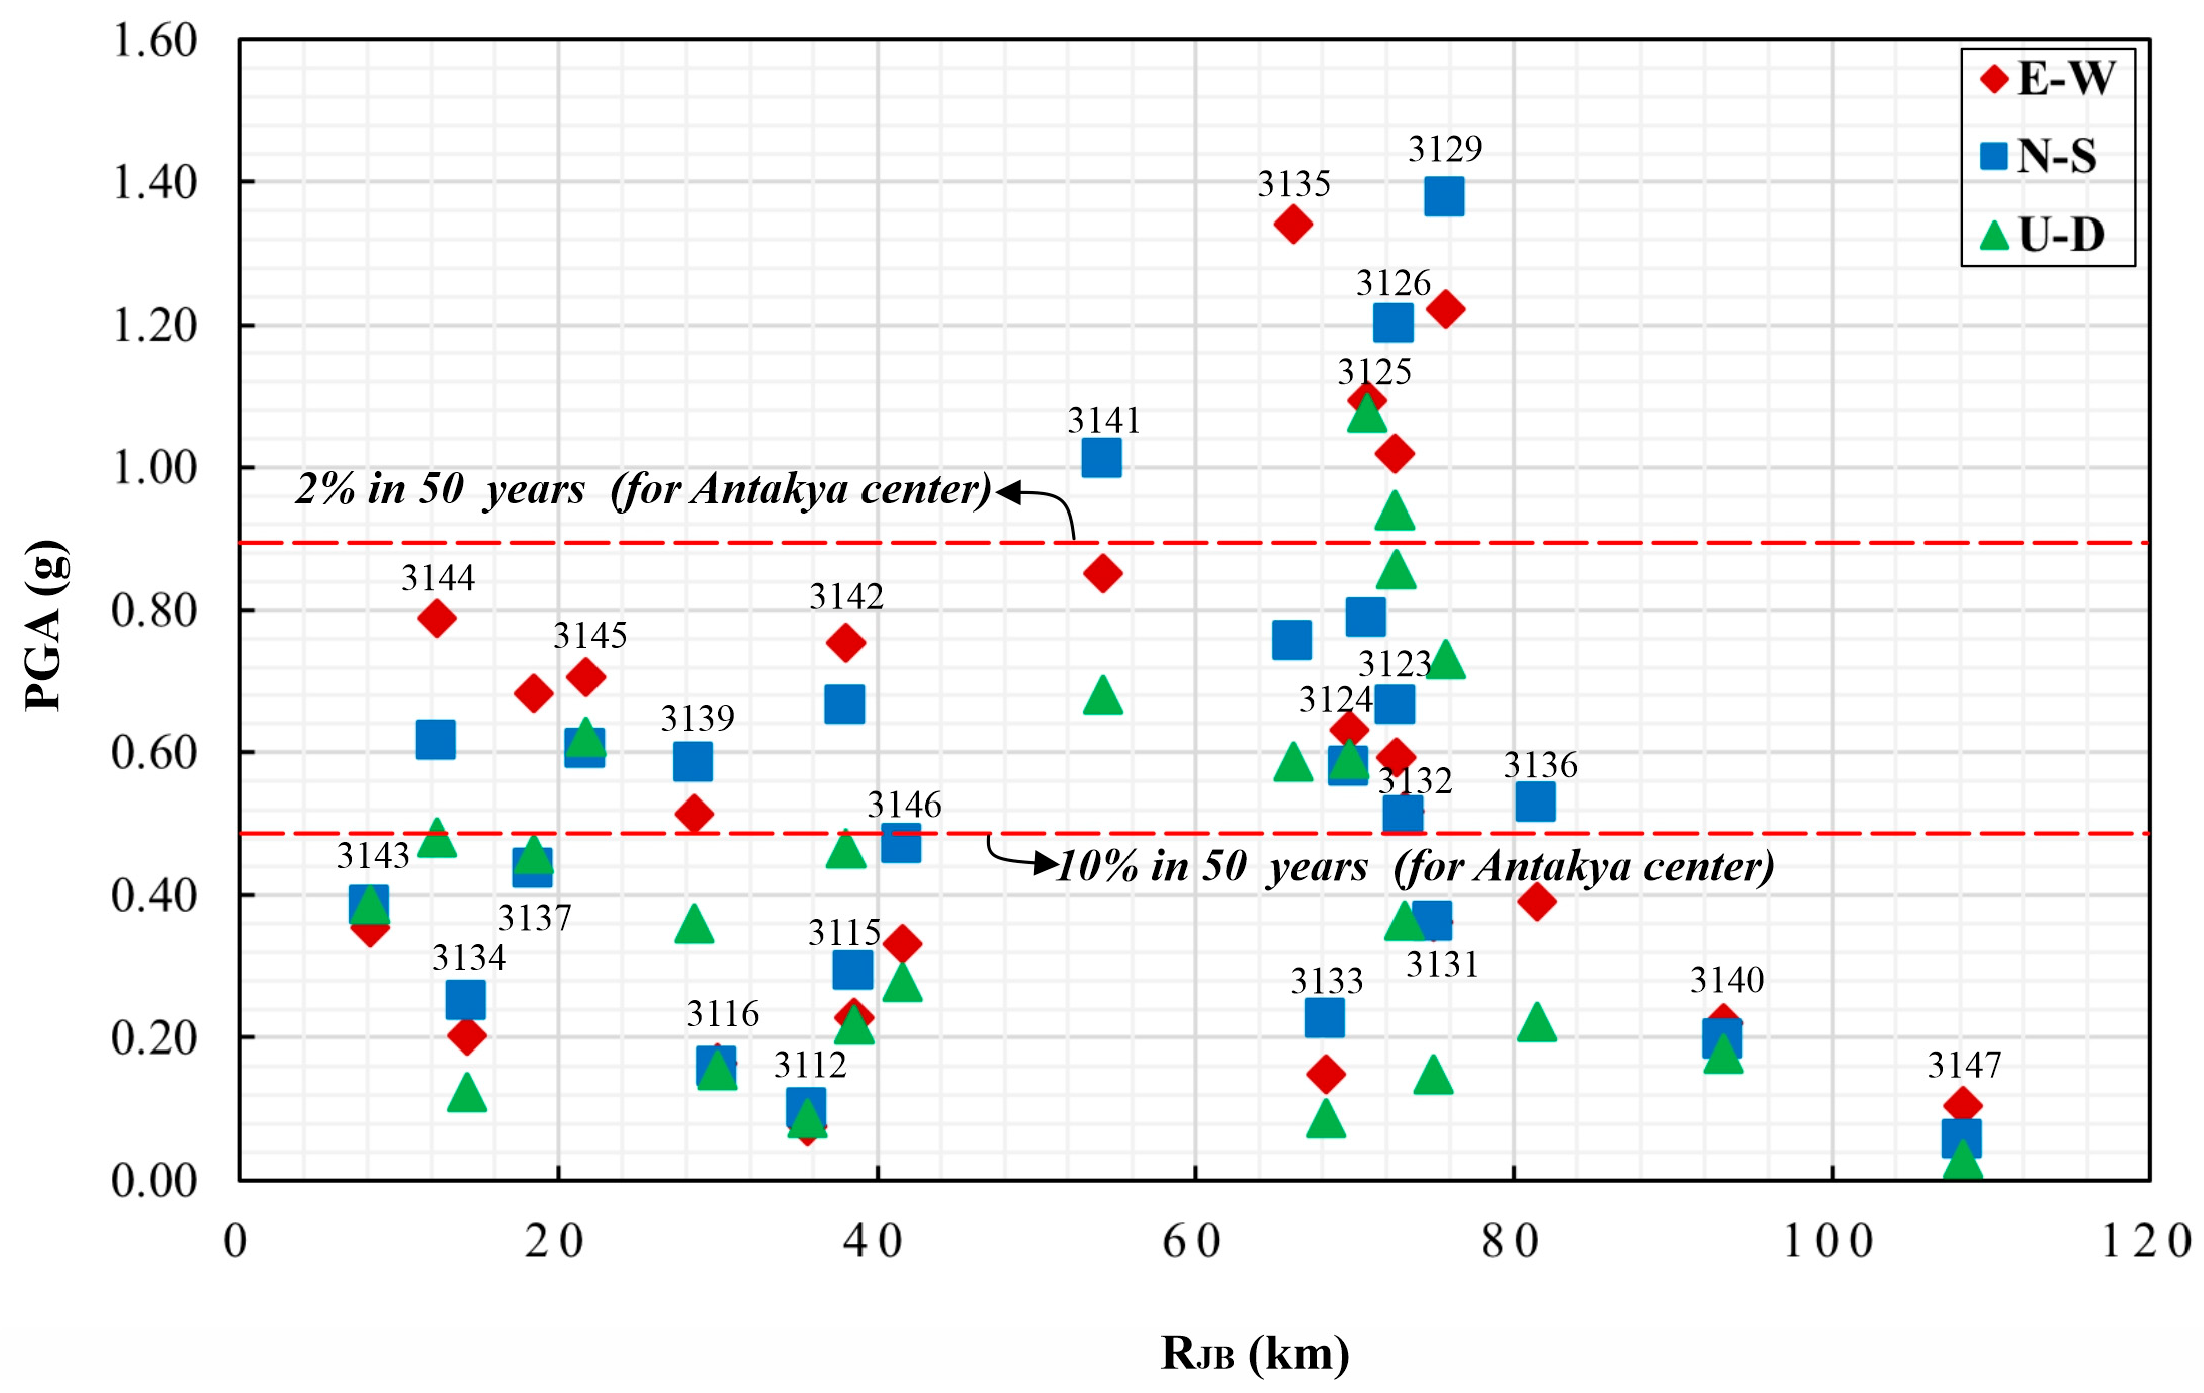
It is essential to evaluate the PGA and PGV values recorded at seismic stations in Hatay within the context of the design levels specified in the Turkish Earthquake Hazard Map (TEHM 2019 [89]). Figure 13 presents the horizontal and vertical PGA values observed at these stations, along with the reference design accelerations corresponding to 2% and 10% probabilities of exceedance in 50 years (return periods of 2475 and 475 years, respectively) for Antakya. The results indicate that several stations recorded PGA values exceeding the 0.50 g level associated with the 10% exceedance probability, and in some cases the measured values even surpassed the 0.9 g threshold specified for the 2% exceedance probability.
For PGV, the exceedance is even more pronounced (Figure 14). Most recorded PGV values significantly exceeded the 28 cm/s limit corresponding to a 10% probability of exceedance in 50 years, and in many stations the values also surpassed the 56 cm/s threshold associated with the 2% exceedance probability.
When PGA and PGV are considered together, it becomes evident that numerous stations experienced ground motions far exceeding the design levels prescribed by the current seismic code. This underscores the severity of the shaking and highlights the necessity of incorporating such extreme demands into future hazard assessments.
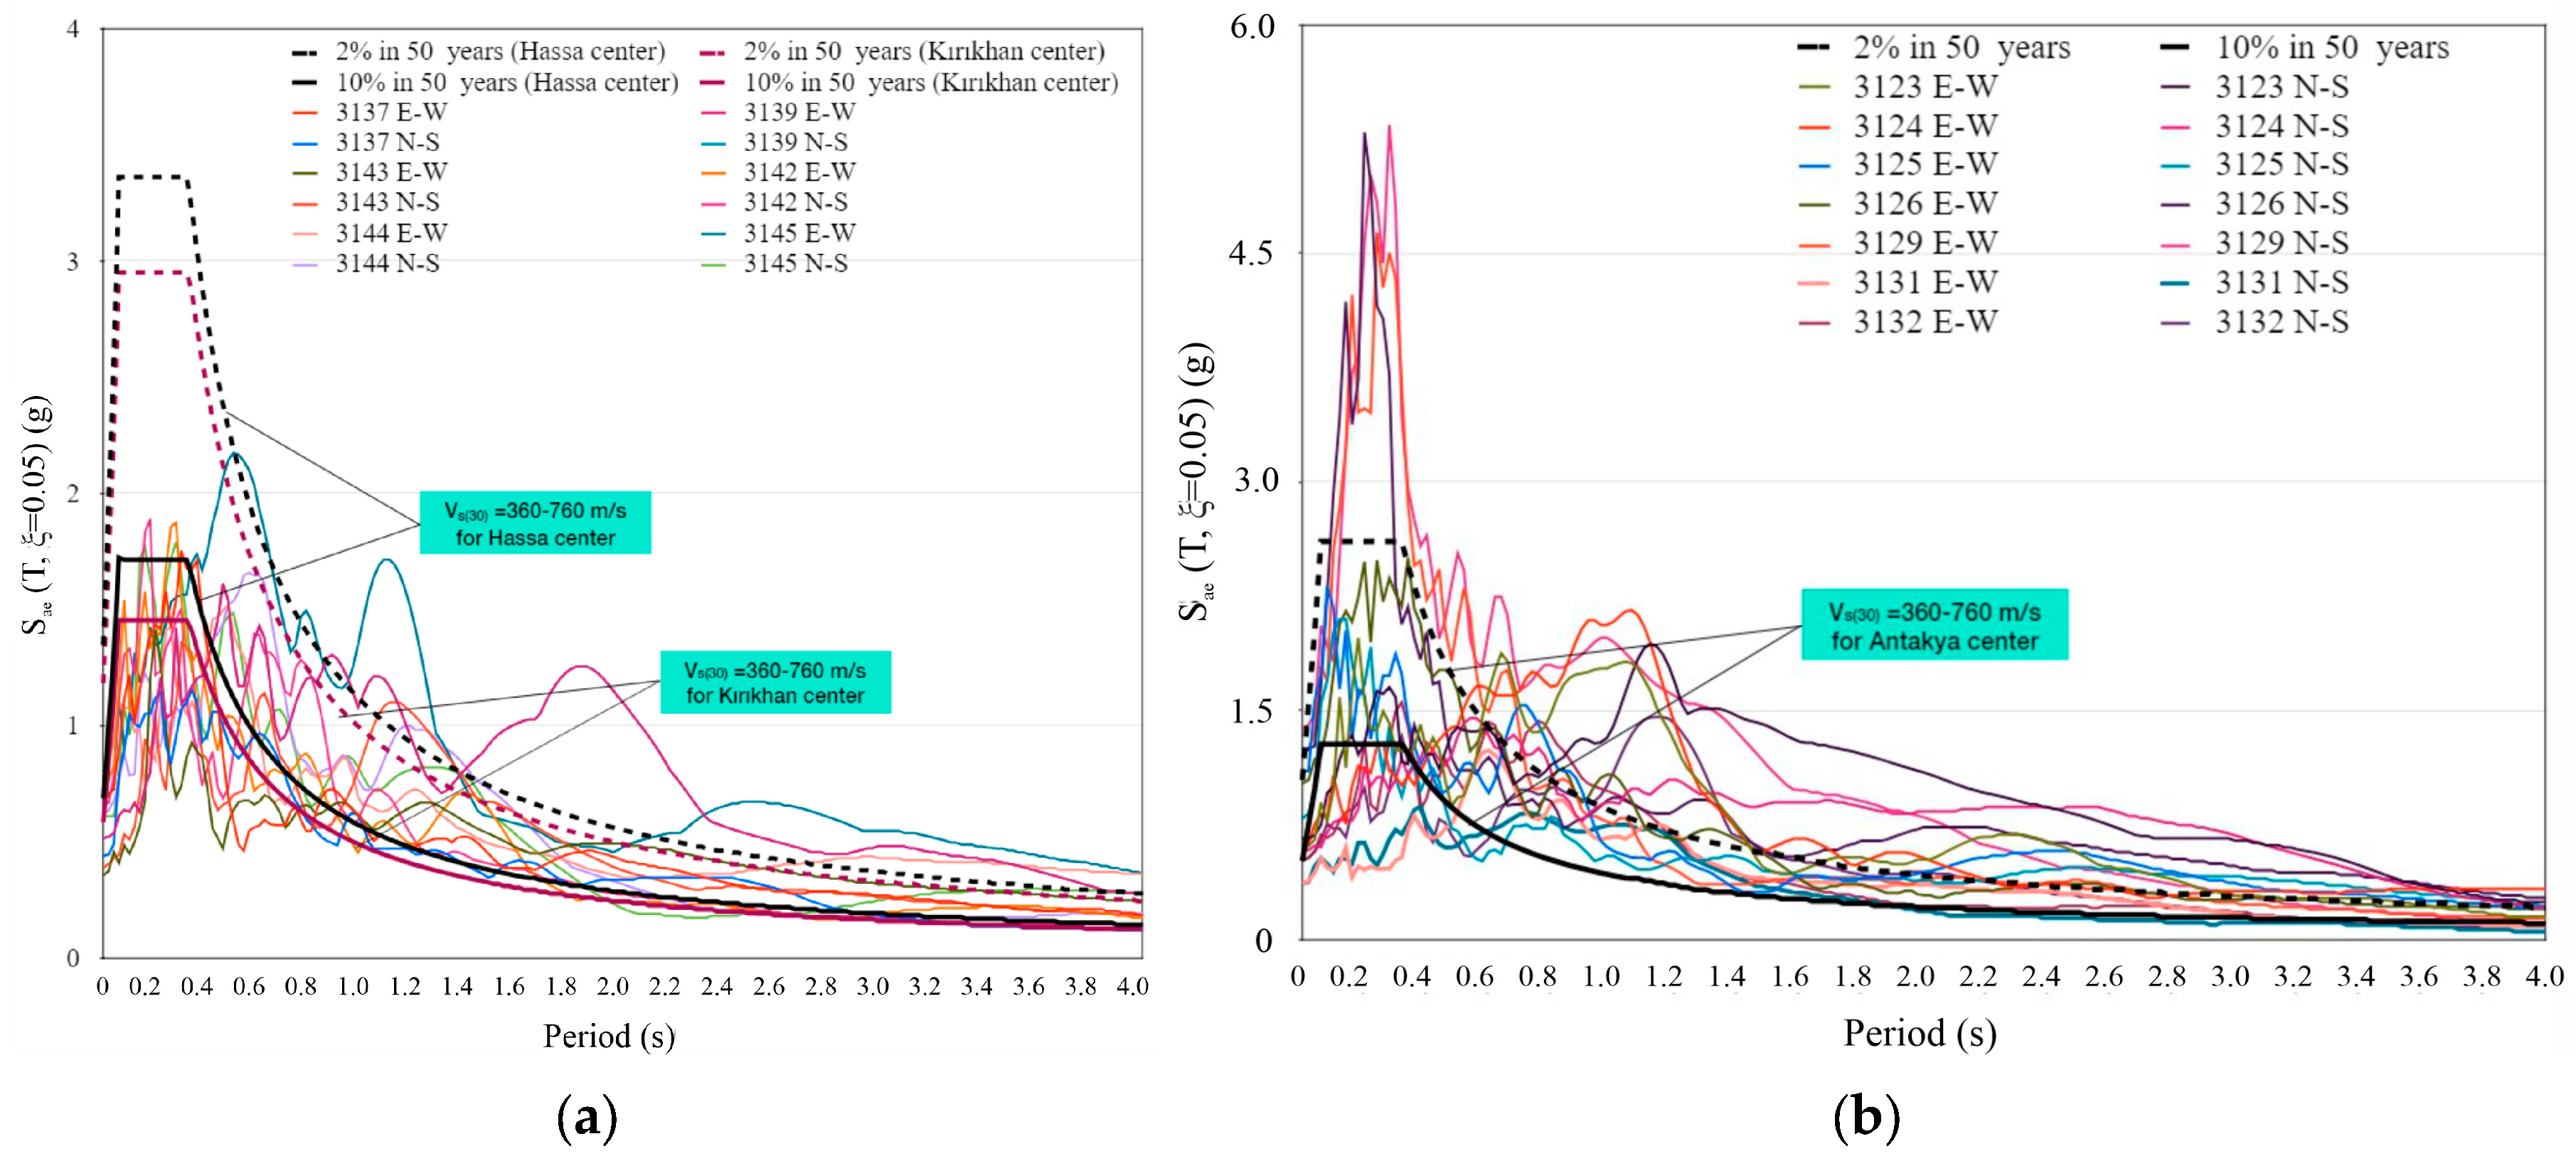
While PGA, PGV, and PGD values provide critical insights into the severity of ground shaking, the evaluation of response spectra is equally important, as seismic design codes rely on spectral ordinates to estimate seismic forces for earthquake-resistant structures. For the Mw 7.7 Pazarcık earthquake, Figure 15a illustrates the response spectra of ground motions recorded at stations in the Hassa and Kırıkhan districts, alongside the design spectra specified by the Turkish Earthquake Code and the spectrum for a severe earthquake scenario. The results indicate that spectral ordinates for these near-fault stations generally remain below or close to the design spectrum over short and intermediate periods, reflecting the influence of stiffer lithologies (limestone and ophiolitic units; Figure 4) and relatively high Vs30 values (>500 m/s). However, over longer periods, the recorded spectra exceed the design levels, suggesting a significant long-period energy content likely associated with rupture directivity effects.
In contrast, Figure 15b presents the response spectra for stations in Antakya and Defne, where the observed spectral ordinates substantially exceed the design spectrum across a wide period range, in some cases surpassing even the severe earthquake level. These stations are located on thick alluvial deposits within the Antakya Basin (Figure 3) characterized by low Vs30 values (<300 m/s), which amplify long-period components and contribute to the observed exceedances. This pronounced amplification highlights the combined effects of basin geometry and site conditions, emphasizing the need for site-specific response analyses in regions with complex subsurface structures.

5. Post-Earthquake Field Research

Large-magnitude earthquakes often expose critical vulnerabilities in the built environment, particularly in regions characterized by complex tectonic settings and aging building stock [92,93]. The Kahramanmaraş earthquake sequence of 6 February 2023 stands as one of the most destructive seismic events in recent decades, offering a unique opportunity to investigate the interplay between geological conditions, structural deficiencies, and regulatory shortcomings [89]. Previous studies have highlighted that the severity of earthquake-induced damage is strongly influenced by factors such as fault rupture characteristics, local site conditions, and construction quality [94,95].
In this context, the Kahramanmaraş earthquakes caused widespread structural damage and significant loss of life across southern Türkiye. Several factors contributed to this outcome, including the proximity of the earthquake epicenters, the magnitude and rupture length of the faults, lithological properties of the soil, and widespread non-compliance with seismic design codes during construction. Additionally, many buildings lacked adequate engineering oversight, further exacerbating their vulnerability [93].
Following the earthquakes, the Ministry of Environment, Urbanization, and Climate Change (MEUCC) conducted a comprehensive damage assessment [96]. Buildings were classified into six damage states: undamaged (DS0), slightly damaged (DS1), moderately damaged (DS2), heavily damaged (DS3), requiring immediate demolition (DS4), and collapsed (DS5). Additional categories included buildings that could not be inspected (O1) or were excluded from evaluation (O2). In Hatay—the most severely affected province—336,005 buildings were assessed (excluding O1 and O2), of which 75,817 were classified as heavily damaged, collapsed, or requiring urgent demolition.
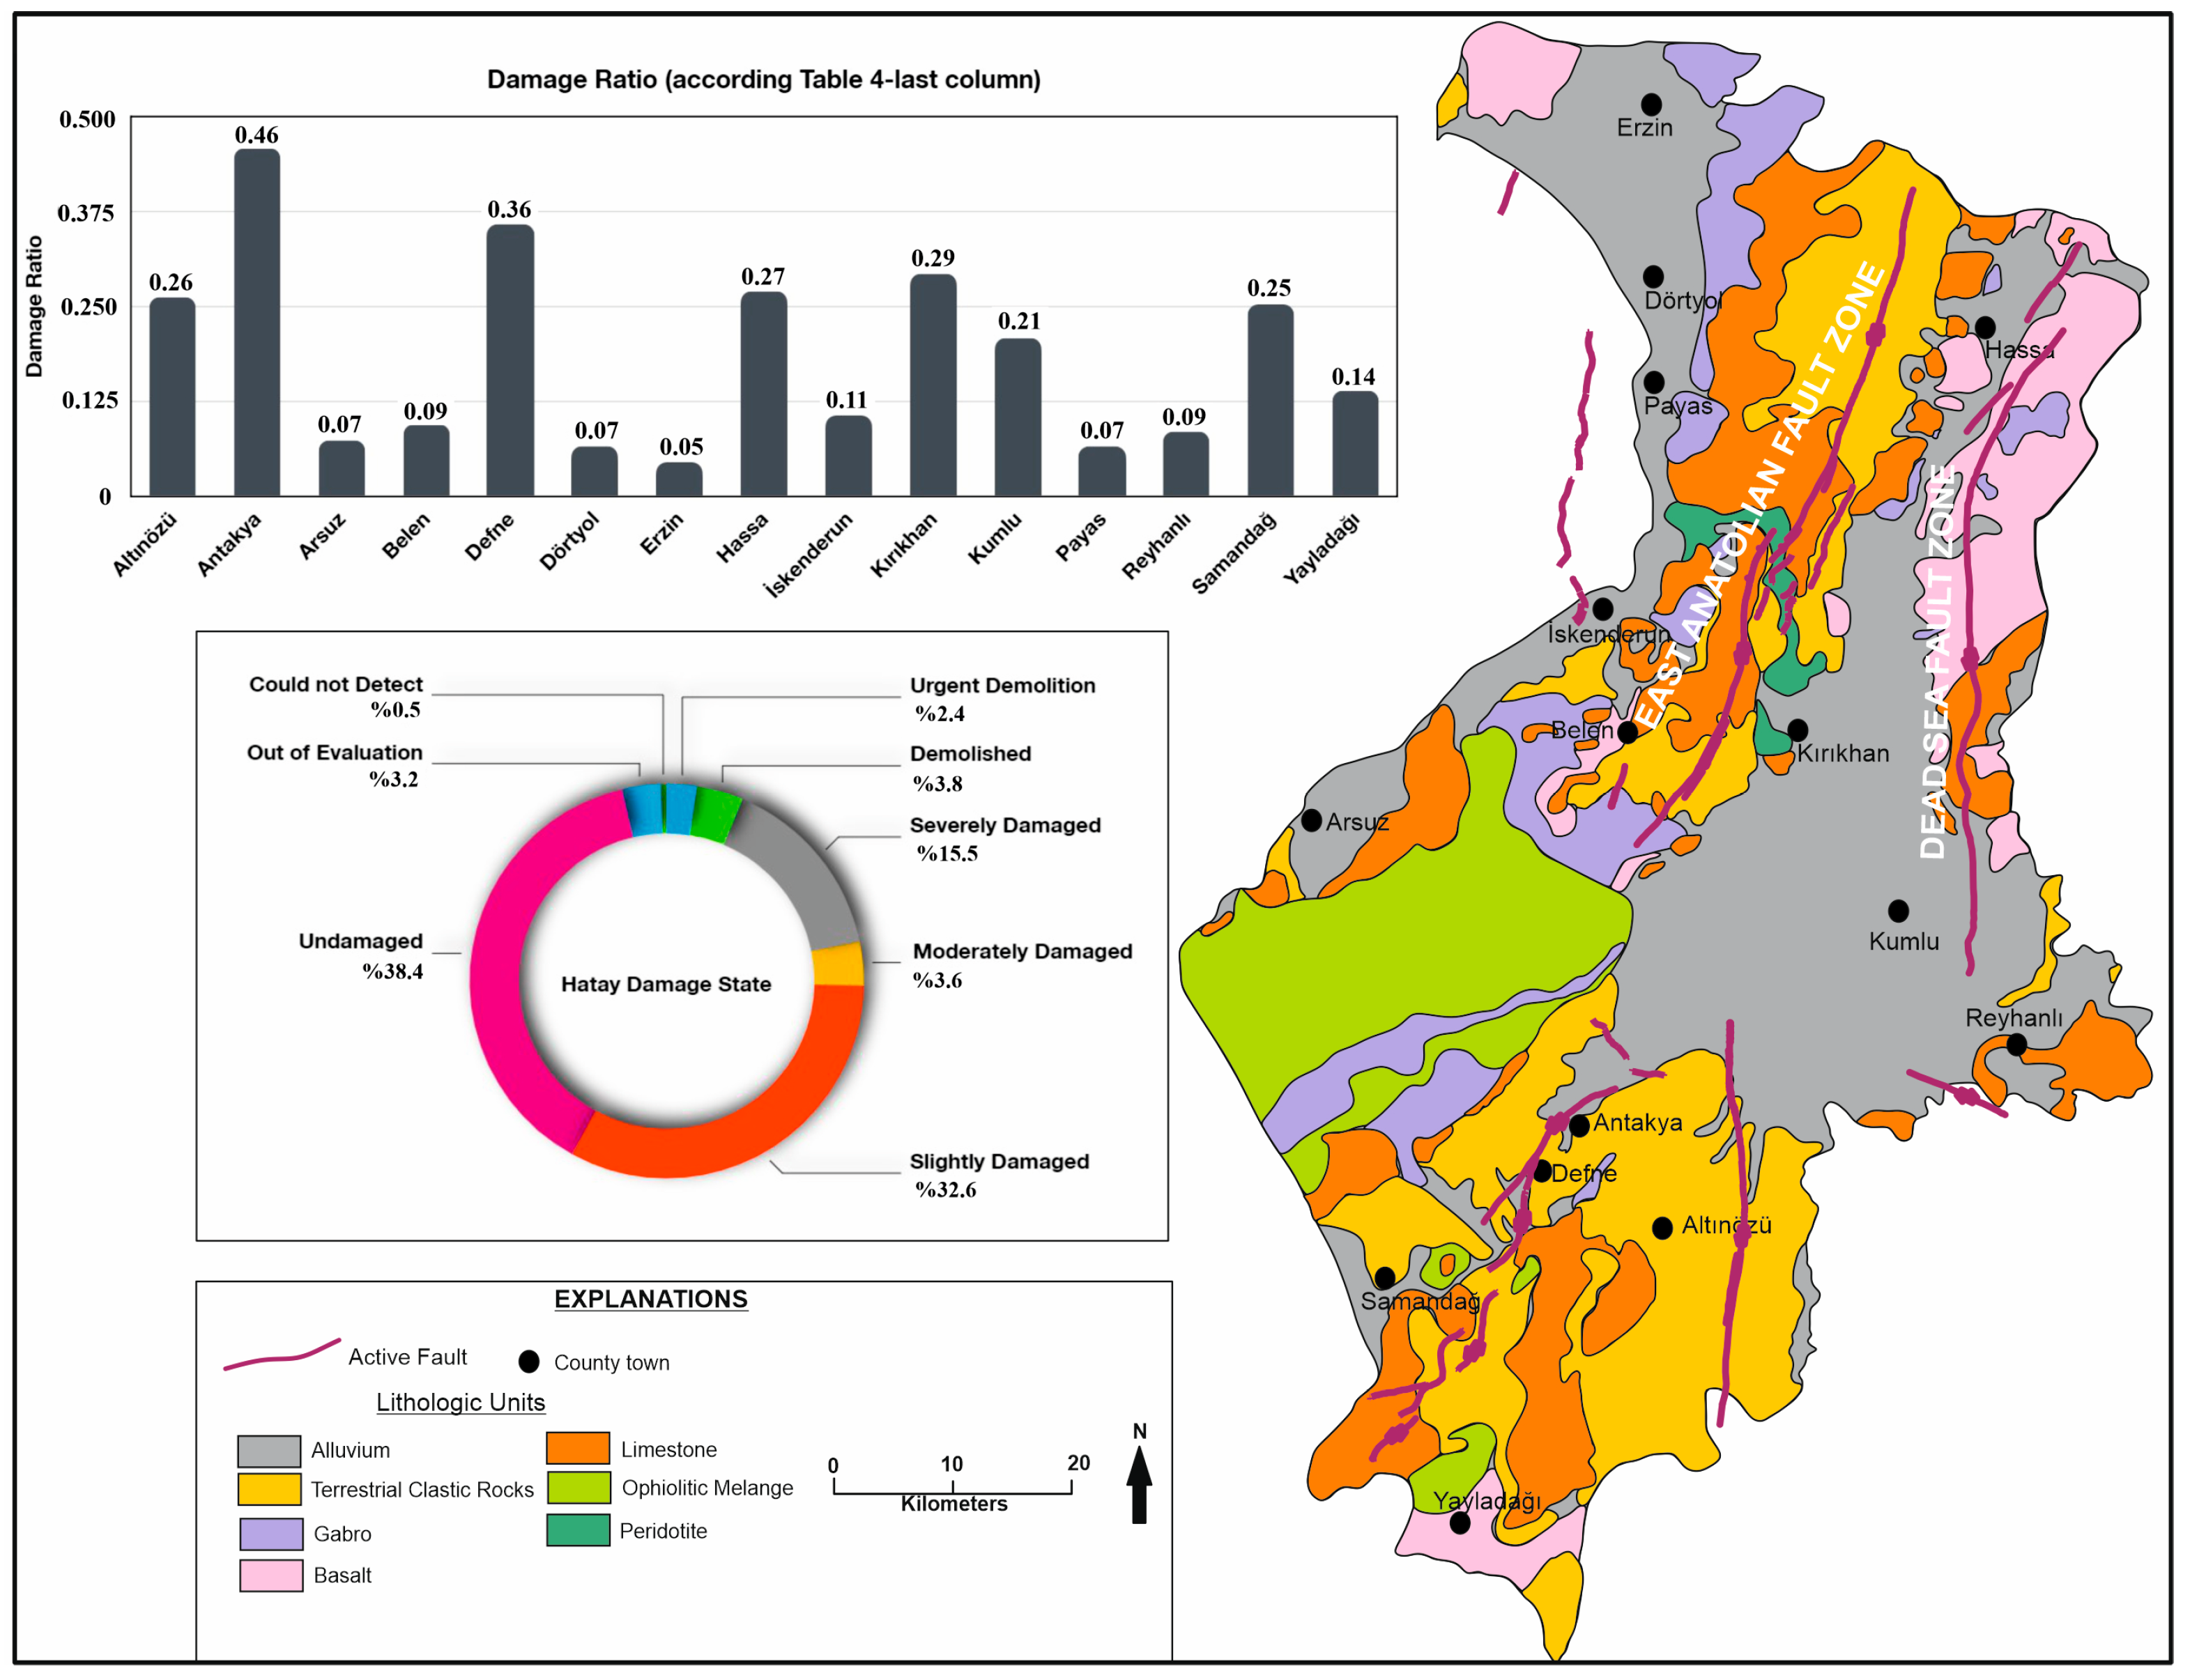
Table 4 provides a district-level breakdown of damage in Hatay, including the damage ratio, calculated as the proportion of DS3–DS5 buildings to the total evaluated stock (DS0–DS5). The highest destruction rates were observed in Antakya (45.8%), Defne (35.9%), Kırıkhan (29.4%), and Hassa (27.0%), indicating a strong correlation between local geological conditions and structural performance.
Table 4. Hatay damage state [95].
DistrictDamage StateDamage Ratio
DS5DS4DS3DS2DS1DS0O2O1
Altınözü6378553899595580687446951090.263
Antakya4070631817,829341320,120982116972960.458
Arsuz1901771694791906115,8689872400.074
Belen72138717157266160632091120.095
Defne10189837076175792295231601490.359
Dörtyol641051489636808114,5321150190.067
Erzin46583166342787706221630.046
Hassa55810312557310486960055841990.270
İskenderun3484683105112818,69313,13813691650.106
Kırıkhan60419215727112810,6837978971790.294
Kumlu74129657481040216796700.209
Payas385144812931834281348390.066
Reyhanlı1173211546364561815,052456490.086
Samandağ6156775276174193978185624130.254
Yayladağı1292061290275183480135991250.138
Total853813,38653,89312,638113,702133,84811,0081727
These values given for the district were obtained with the information collected from the neighborhoods in these districts.
This section first examines how the tectonic and geological characteristics of the region influenced structural damage in Hatay. Subsequently, field observations and analyses of damaged structures are presented and discussed in detail, with an emphasis on failure mechanisms and their relation to construction practices and soil conditions.

5.1. The Impact of Tectonic and Geological Properties of the Region on the Damage
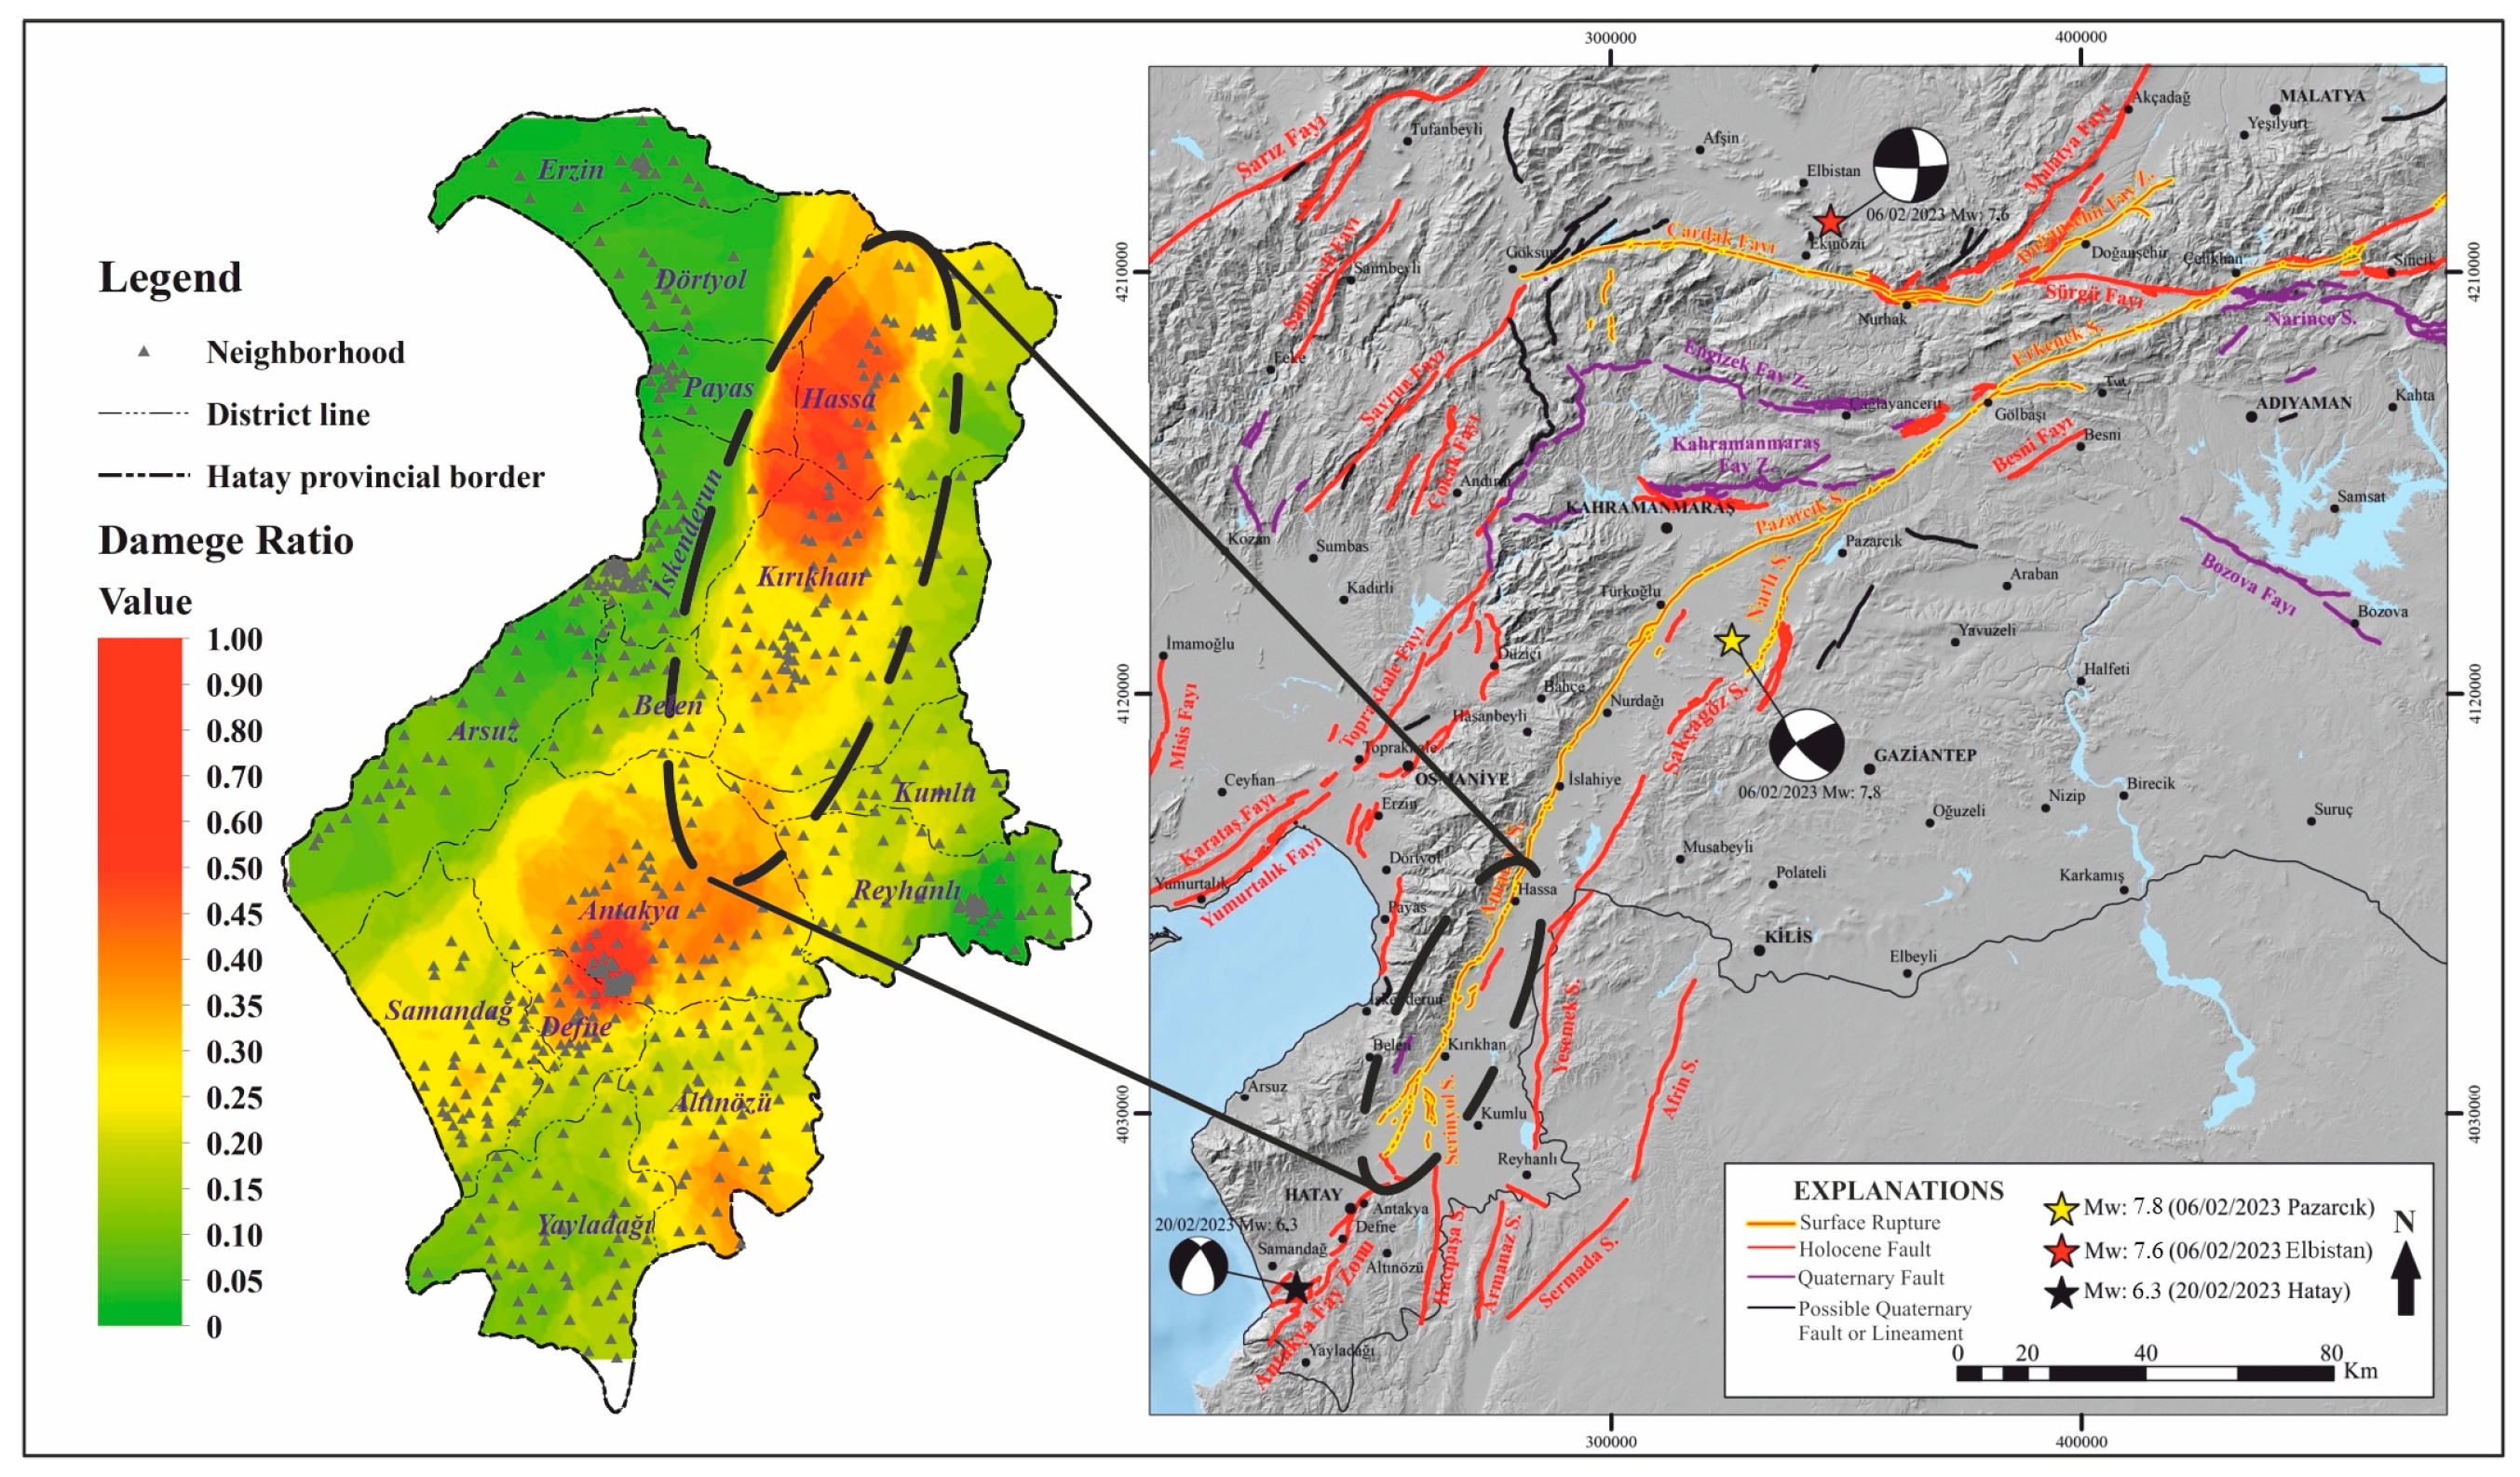
Hatay Province and its districts were severely affected by the Kahramanmaraş earthquakes. Although these areas were not located in close proximity to the epicenters, the surface rupture of the first earthquake extended almost to the center of Hatay, significantly increasing structural damage in the region. When the damage ratio—defined as the proportion of buildings in DS3–DS5 states to the total evaluated stock (Table 4)—is examined, it is evident that the highest values occurred in Hassa and Kırıkhan, where the surface rupture passed.
Furthermore, when the neighborhood-based damage density map (derived from 594 neighborhoods) is compared with the surface rupture map of the Kahramanmaraş earthquakes, the influence of fault rupture on structural damage becomes apparent (Figure 16). Structural damage was particularly severe in the Hassa and Kırıkhan districts, which were intersected by the rupture. The earthquake surface rupture map and field observations of surface deformation are presented in Figure 17.
Figure 16. Surface rupture distribution and fault system in the Hatay region following the 2023 Kahramanmaraş earthquakes. The left panel illustrates the spatial variation in building damage ratios across districts, while the right panel shows mapped surface ruptures, faults, and earthquake epicenters (Mw 7.8, Mw 7.6, and Mw 6.3). (Earthquake surface rupture map taken from [91]).
Applsci 15 09704 g016
Figure 17. Earthquake surface rupture map and earth reflections. (Earthquake surface rupture map taken from [91]).
Applsci 15 09704 g017
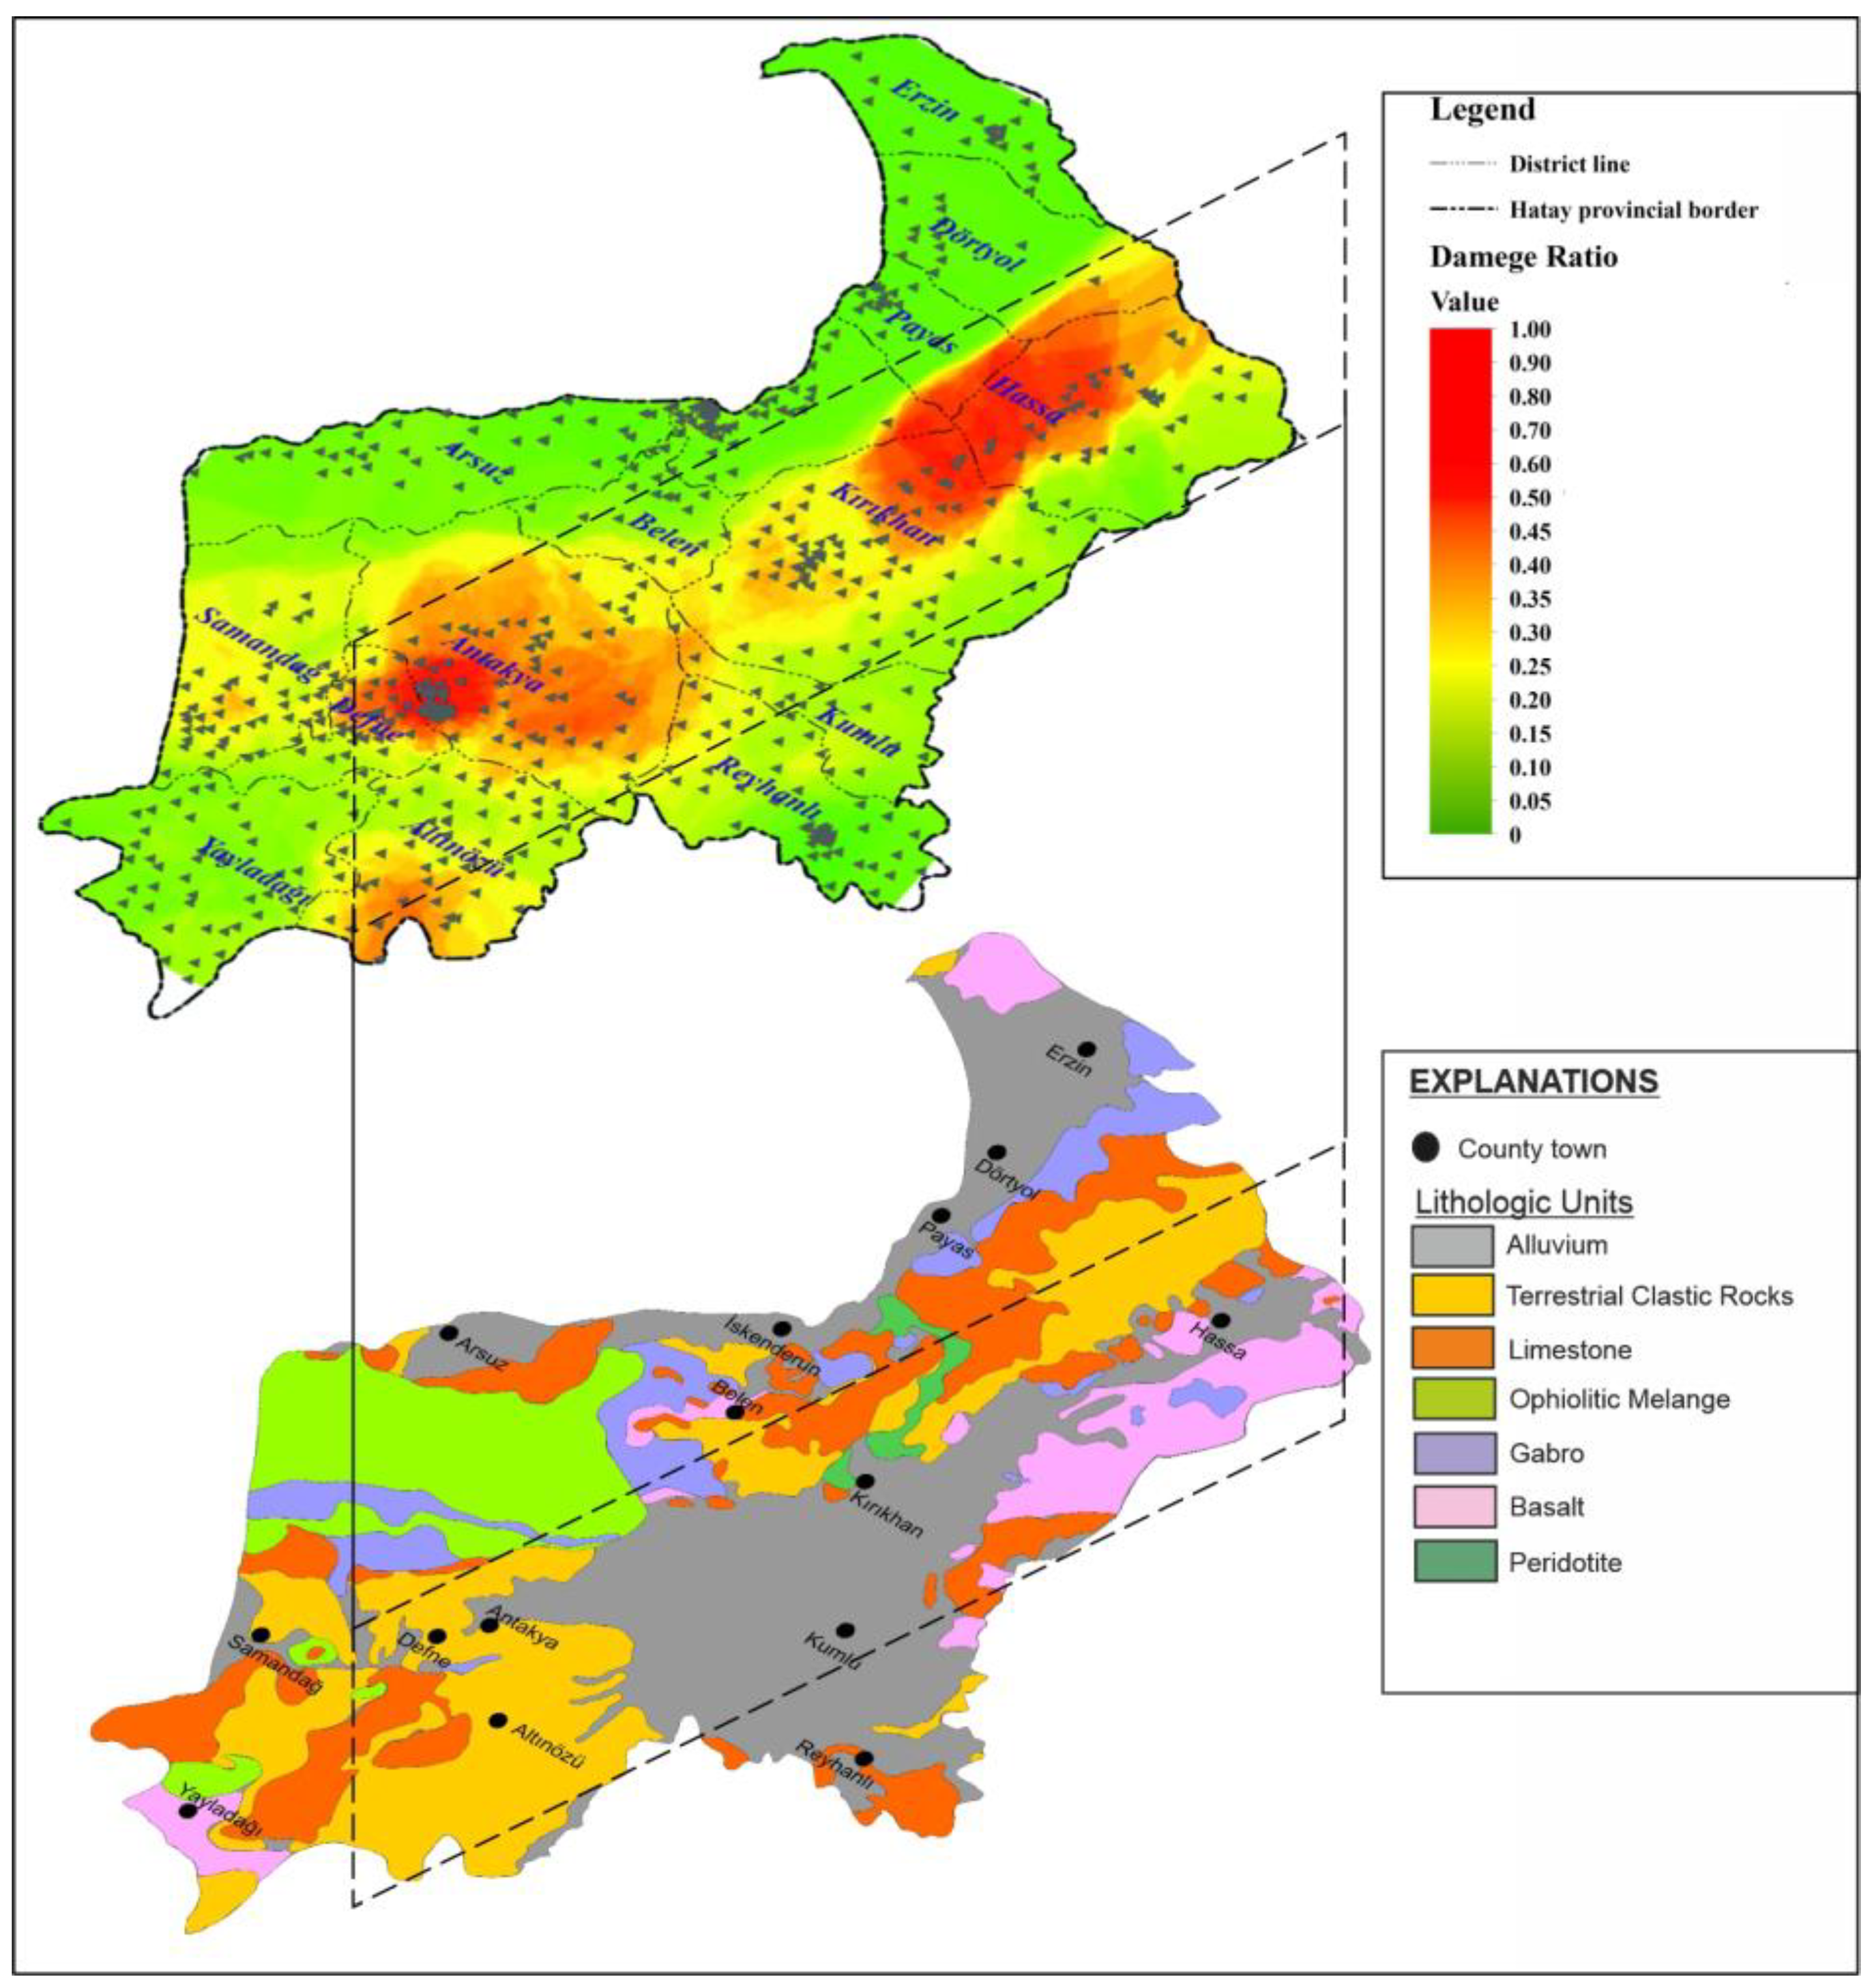
The majority of Hatay Province lies within the Amik Valley, characterized by thick alluvial deposits. Its location near both the East Anatolian Fault Zone and the Dead Sea Fault Zone allowed seismic waves to propagate almost without attenuation through these unconsolidated sediments. Ansal [97] emphasized that earthquakes of similar magnitude can produce significantly different ground motion accelerations at the same distance, primarily due to variations in subsurface conditions. The frequency characteristics of seismic waves are altered by refraction and reflection, depending on the mechanical contrast between soil layers. When the uppermost layer consists of soft soils, as in Hatay, ground motion on alluvium differs substantially from that on bedrock. Microtremor and ReMi studies by Över et al. [98] and Büyüksaraç et al. [99] revealed that the alluvial deposits in the region vary in thickness and density, with zones exhibiting high amplification potential. Consequently, the alluvial structure of Hatay amplified seismic waves during the 6 February 2023 earthquakes, increasing the intensity of ground shaking (Figure 18). High-period oscillations dominate on alluvial surfaces, while low-period (high-frequency) components diminish. As a result, horizontal ground motions and force spectra differ markedly between alluvial and rocky sites under the same earthquake [100].
Figure 18. Influence of lithological units on structural damage in Hatay Province following the 2023 Kahramanmaraş earthquakes. The upper panel shows the spatial distribution of building damage ratios (The grey triangles indicate the location of neighborhood at the Hatay), while the lower panel illustrates the geological units (geological map of Hatay adapted from [85]).
Applsci 15 09704 g018
The role of local soil conditions can be best observed through recorded ground motions and response spectra [101]. Acceleration response spectra from stations in Hatay during the Pazarcık event significantly exceeded the design spectra specified in Türkiye’s seismic hazard map, underscoring both the region’s seismicity and the amplification effect (Figure 14).
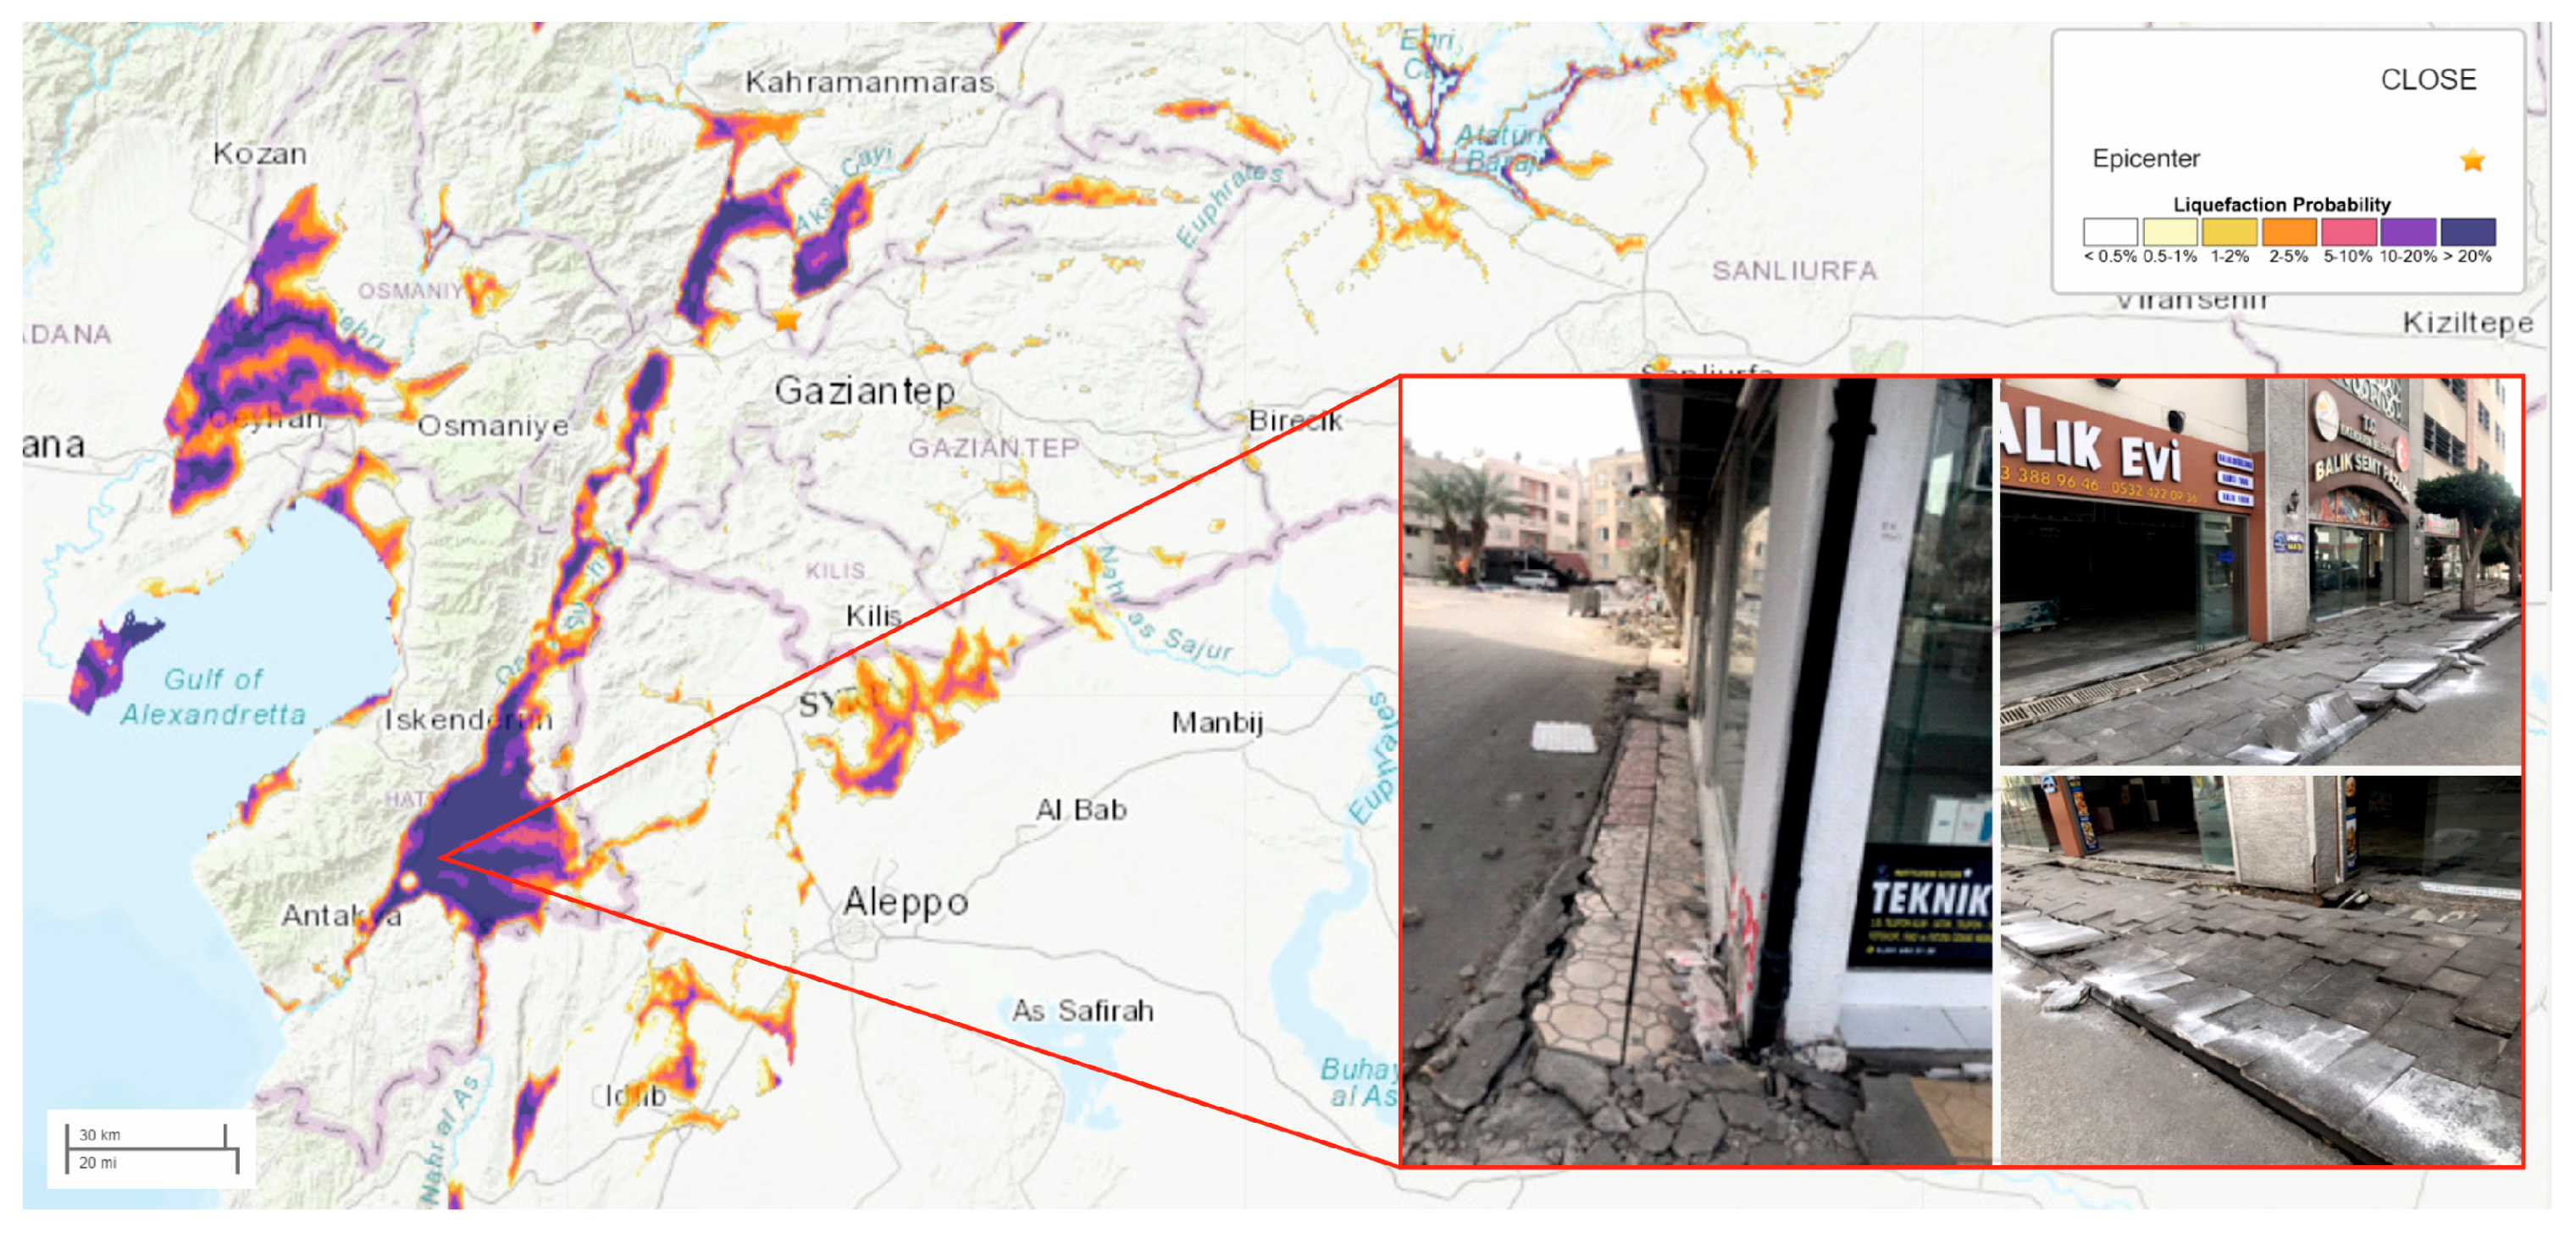
In addition to tectonic and geological factors, construction-related deficiencies also contributed to the extent of damage. Studies of soils in and around the Amik Valley indicate that areas with high liquefaction potential are widespread and largely urbanized [102]. Post-earthquake field surveys documented surface manifestations of liquefaction across Hatay (Figure 19).
Figure 19. Settlement and surface deformations due to liquefaction in Hatay Province (liquefaction map taken from [88]).
Applsci 15 09704 g019

5.2. Seismic Performance of Structures
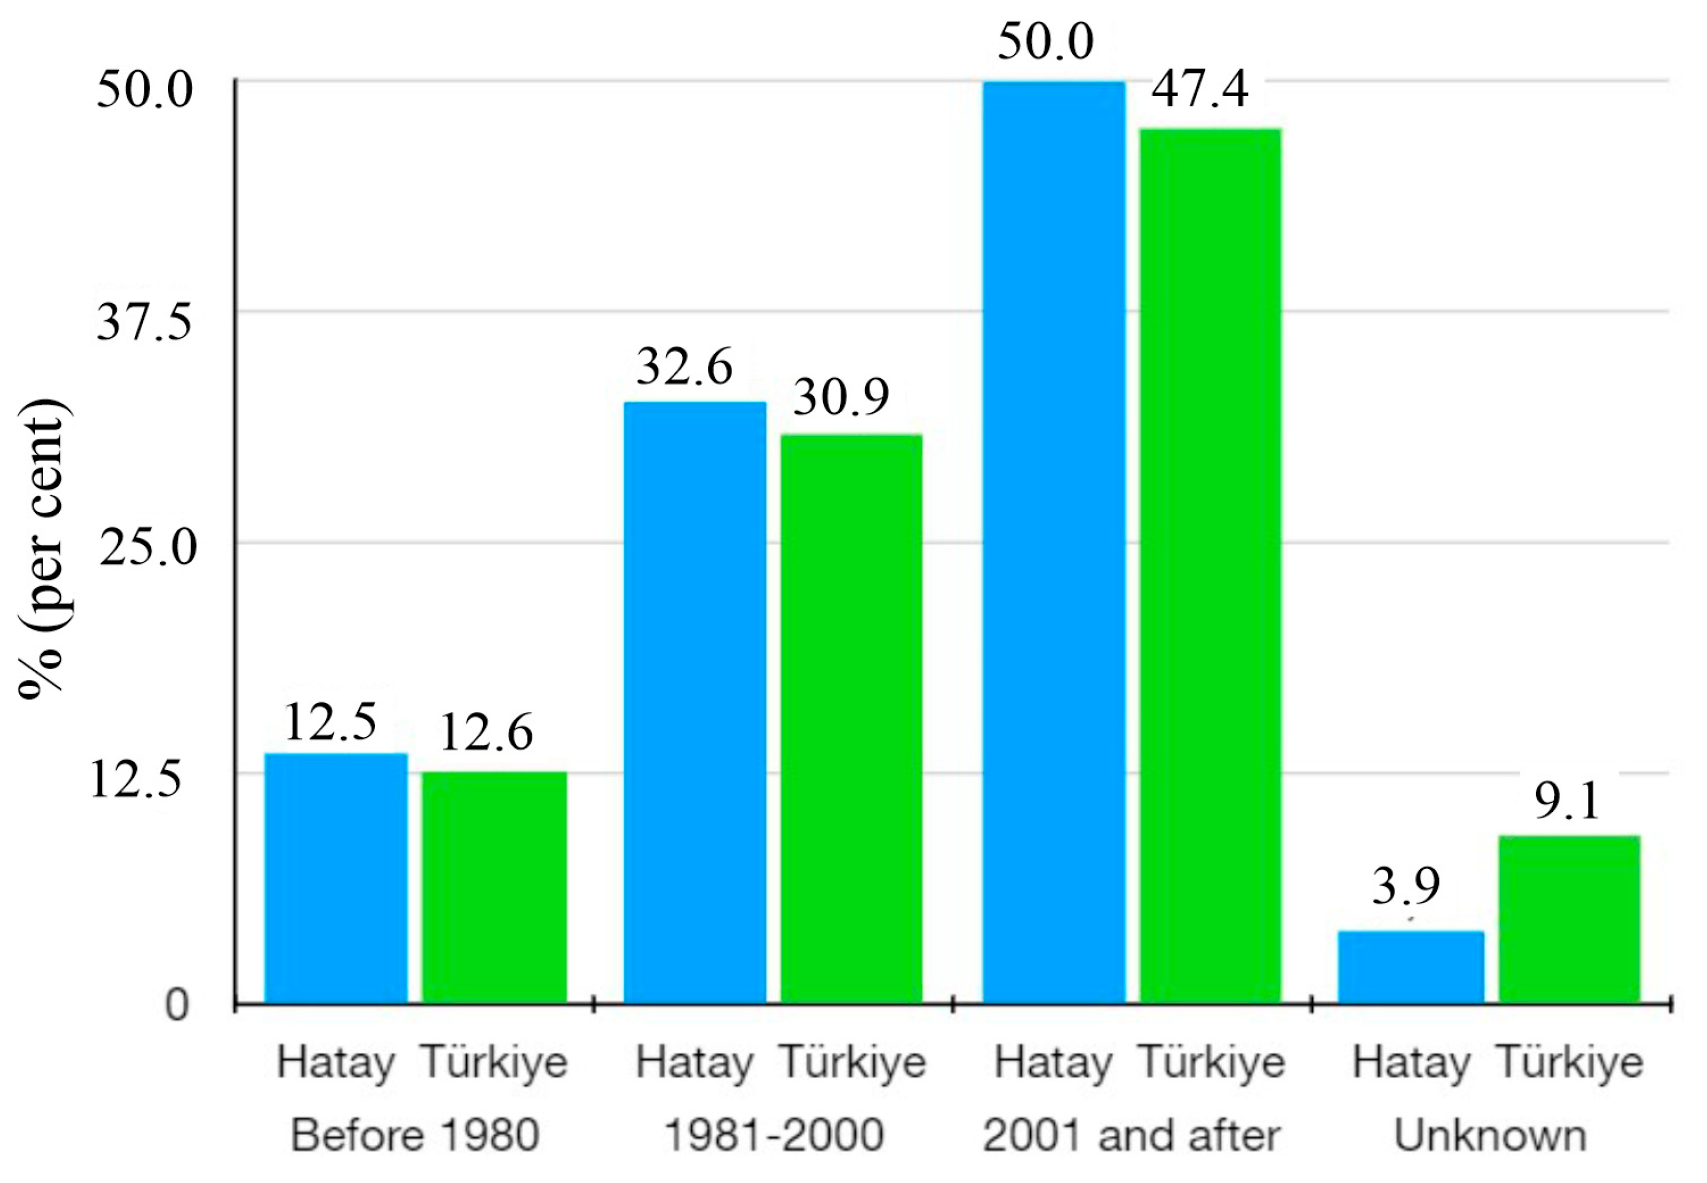
For Hatay Province, the impacts of the 6 February 2023 earthquakes were significantly greater than anticipated. The severity of damage was closely linked to the age and quality of the building stock. Among the 406,849 buildings in Hatay, 13.5% were constructed before 1980, 32.6% between 1981 and 2000, and 50.0% after 2001, while the construction years of the remaining 3.9% remain unknown. Compared to national averages, Hatay has a higher proportion of older buildings: 12.6% of households in Türkiye reside in buildings constructed before 1980, whereas this rate is notably higher in Hatay. Similarly, the proportion of households living in dwellings built between 1981 and 2000 is 30.9% nationwide, yet this value is lower in Hatay (Figure 20). These figures indicate that Hatay’s building stock is generally older than the national average, which contributed to the extent of earthquake-induced damage.
The total number of buildings classified as DS3 to DS5 (moderate to severe damage) reached 215,255, while 25,957 were moderately damaged and 189,317 were slightly damaged. The following section presents the observed damage patterns in reinforced concrete and masonry structures within the affected building stock.
Figure 20. Comparison of building construction years for Hatay and Türkiye (data taken from [103]).
Applsci 15 09704 g020
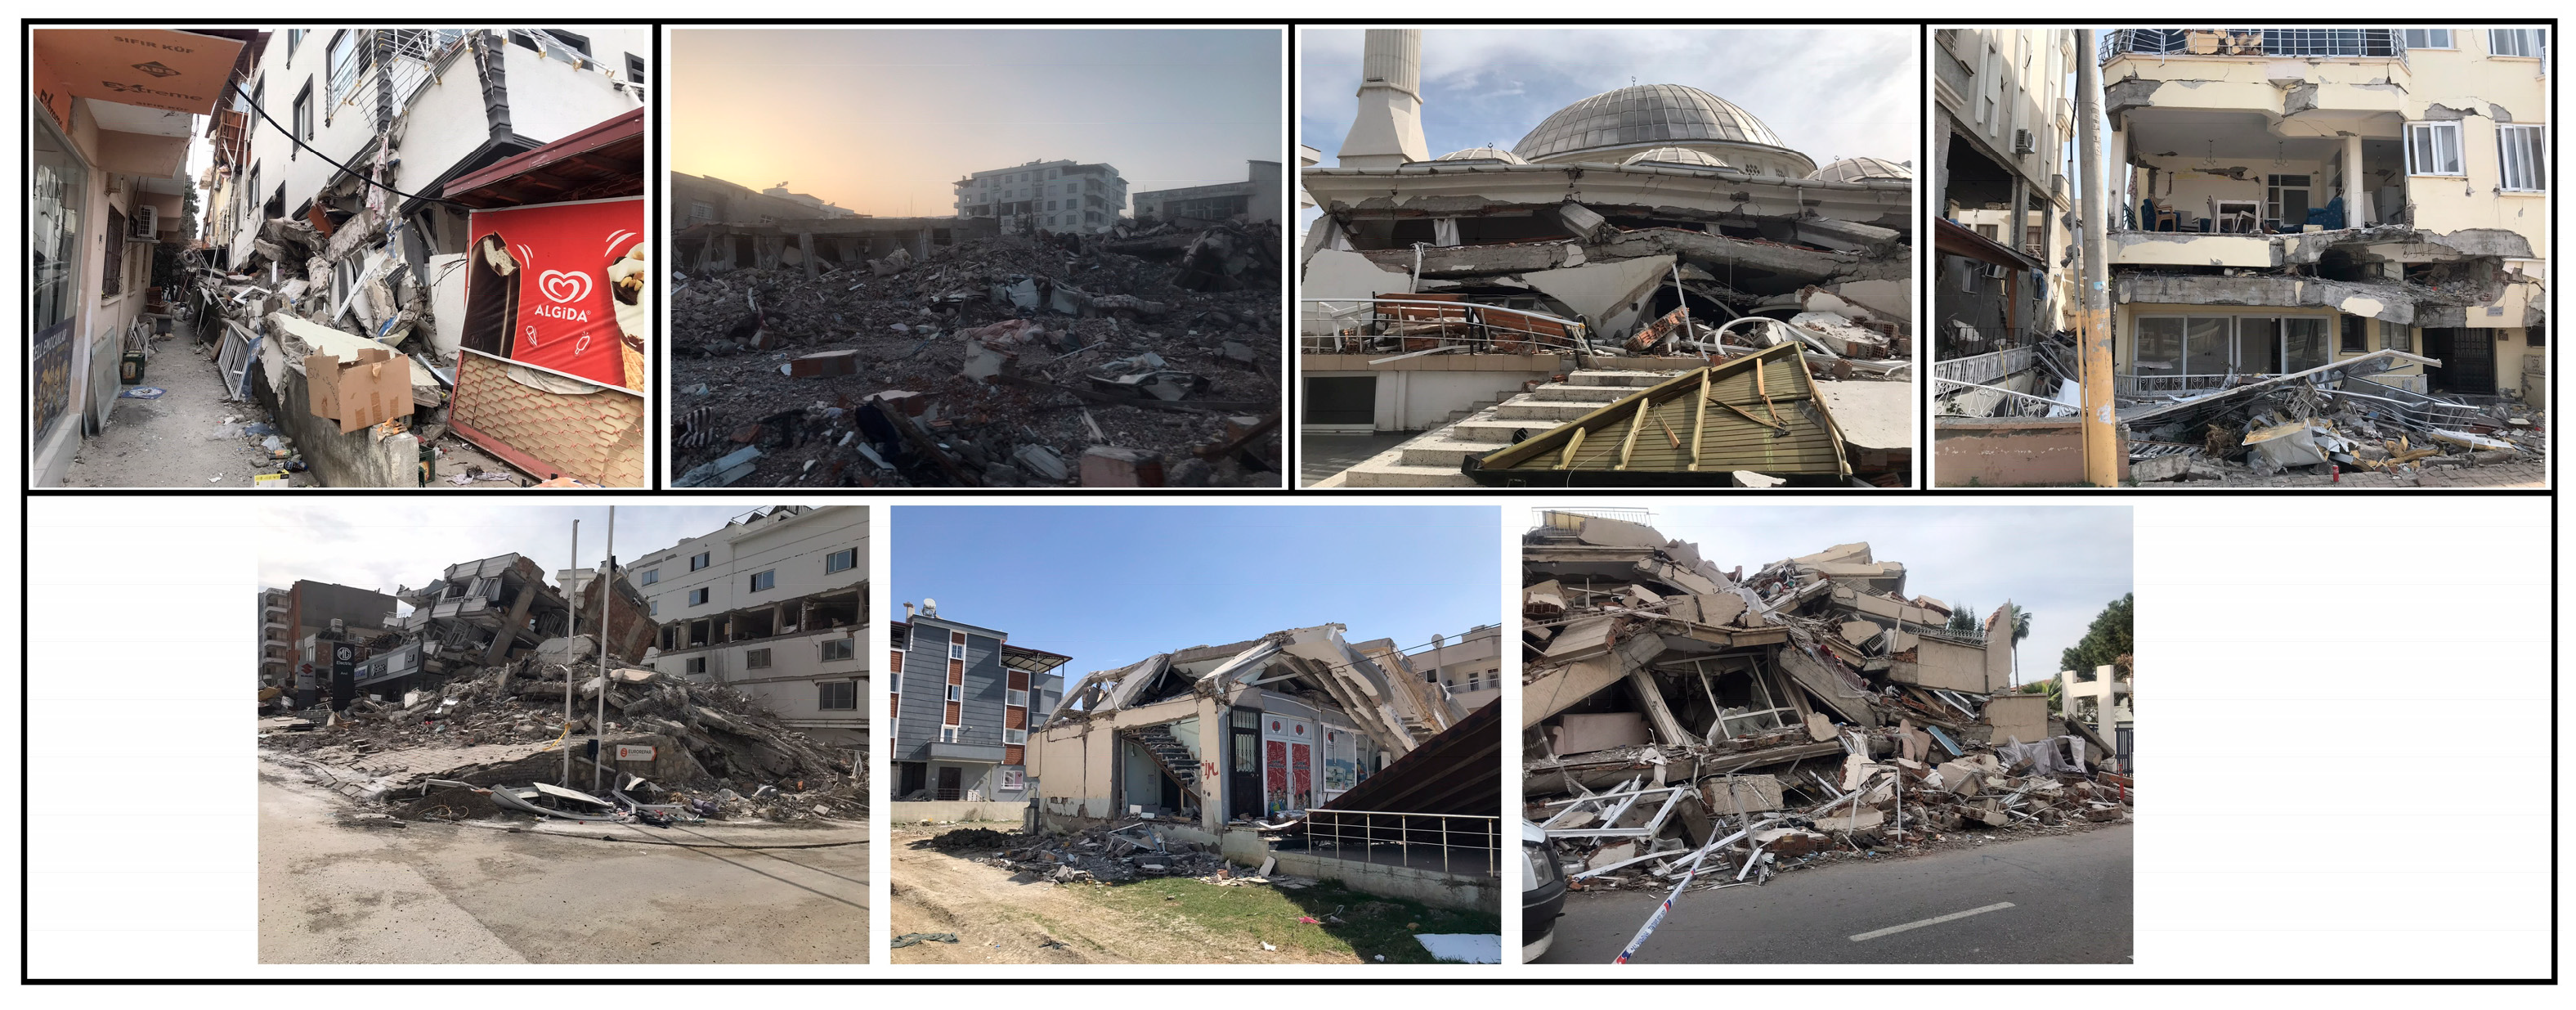
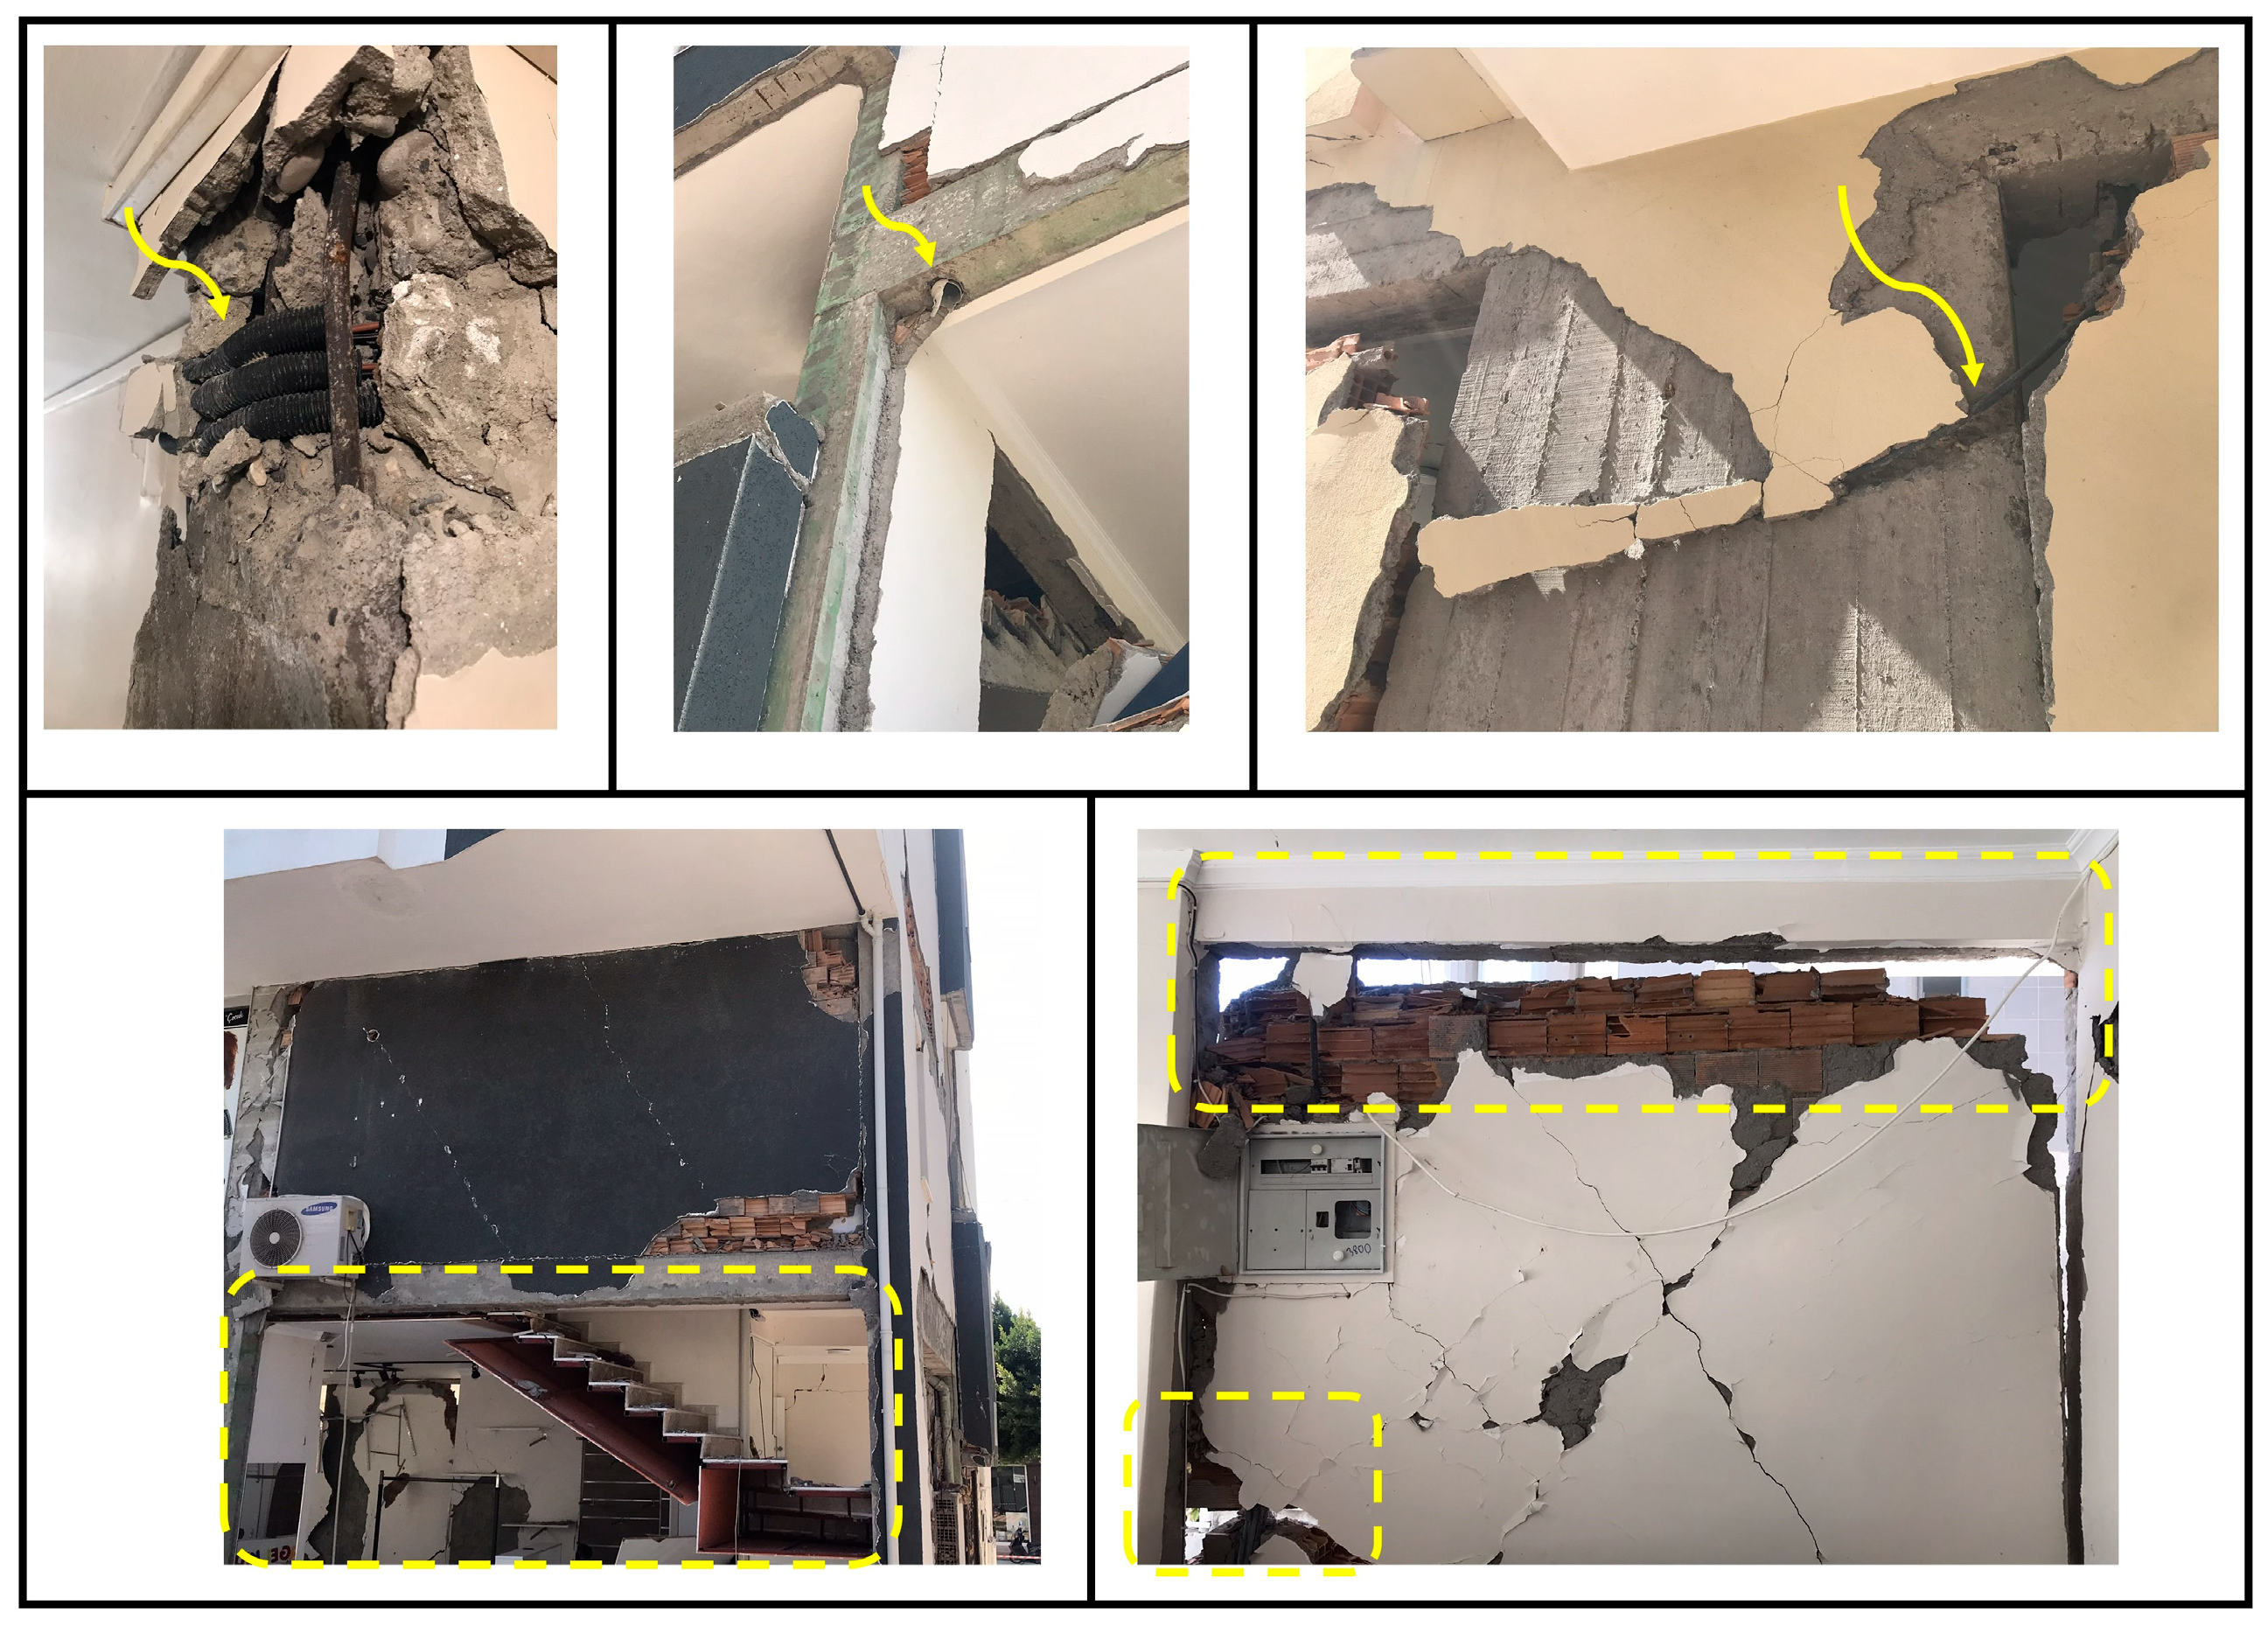
Reinforced concrete structures constitute approximately 87% of the building stock in Hatay Province. The main causes of damages observed in reinforced concrete structures are poor construction quality, poor workmanship, faulty design, weak concrete strength, insufficient detailing at beam–column joints, soft floors, weak floors, insufficient reinforcement, short lap splices, wrong end hook angles, short columns, torsion effects due to plan irregularities, hammering effects between neighboring buildings, inadequate and inadequate reinforcement detailing by the regulations, strong beam–weak column situations, heavy overhangs, wrong applications, and unrubbed reinforcing steel. Various visuals of the damage observed in reinforced concrete structures are shown in Figure 21.
Perhaps the easiest way to prevent the damage observed in reinforced concrete structures is to apply the requirements of the relevant earthquake regulations. For example, many of the buildings constructed according to the requirements of the TBEC-2018 [104] regulation published in recent years survived these major earthquakes with minor damage. The projects of these buildings are prepared by staying on the very reliable side, and these buildings are controlled by building inspection companies during the implementation phase. Accordingly, situations such as poor construction quality, poor workmanship, poor design, poor concrete strength, insufficient detailing at beam–column joints, soft floors, weak floors, insufficient reinforcement, short lap splices, wrong end hook angles, short columns, torsion effects due to plan irregularities, hammering effects between neighboring buildings, insufficient reinforcement detailing, strong beam–weak column situations, heavy overhangs, and unrubbed reinforcing steel are prevented. In addition, it is possible to make the following comments about the damage observed in reinforced concrete structures:
  • Ribbed reinforcement ensures complete adherence between concrete material and the reinforcement. If the reinforcement is not ribbed, this adherence cannot be provided sufficiently, and this situation adversely affects the behavior of the structure against earthquake forces (Figure 22).
  • Insufficient numbers of stirrups in columns and beam joints and not rotating the stirrup hooks 135° cause weakening of these joints (Figure 22). Numerous studies have emphasized that inadequate detailing and confinement in beam–column joints significantly compromise the seismic performance of reinforced concrete structures [105,106].
  • Exposure of reinforcements to corrosion significantly reduces the strength and stiffness of the structural element. In reinforced concrete structures, it was observed that the corrosion effect reached serious dimensions (Figure 22).
  • In multi-story buildings, the lower floors are generally used for commercial purposes. These floors are designed higher than other floors and have fewer infill walls. This situation creates a sudden decrease in the stiffness of the building system at ground-floor level and causes the formation of soft floors (Figure 23).
  • A common feature observed in the damaged buildings is that many exhibit poor workmanship and wrong applications (Figure 24). It is possible to prevent this with good inspection.
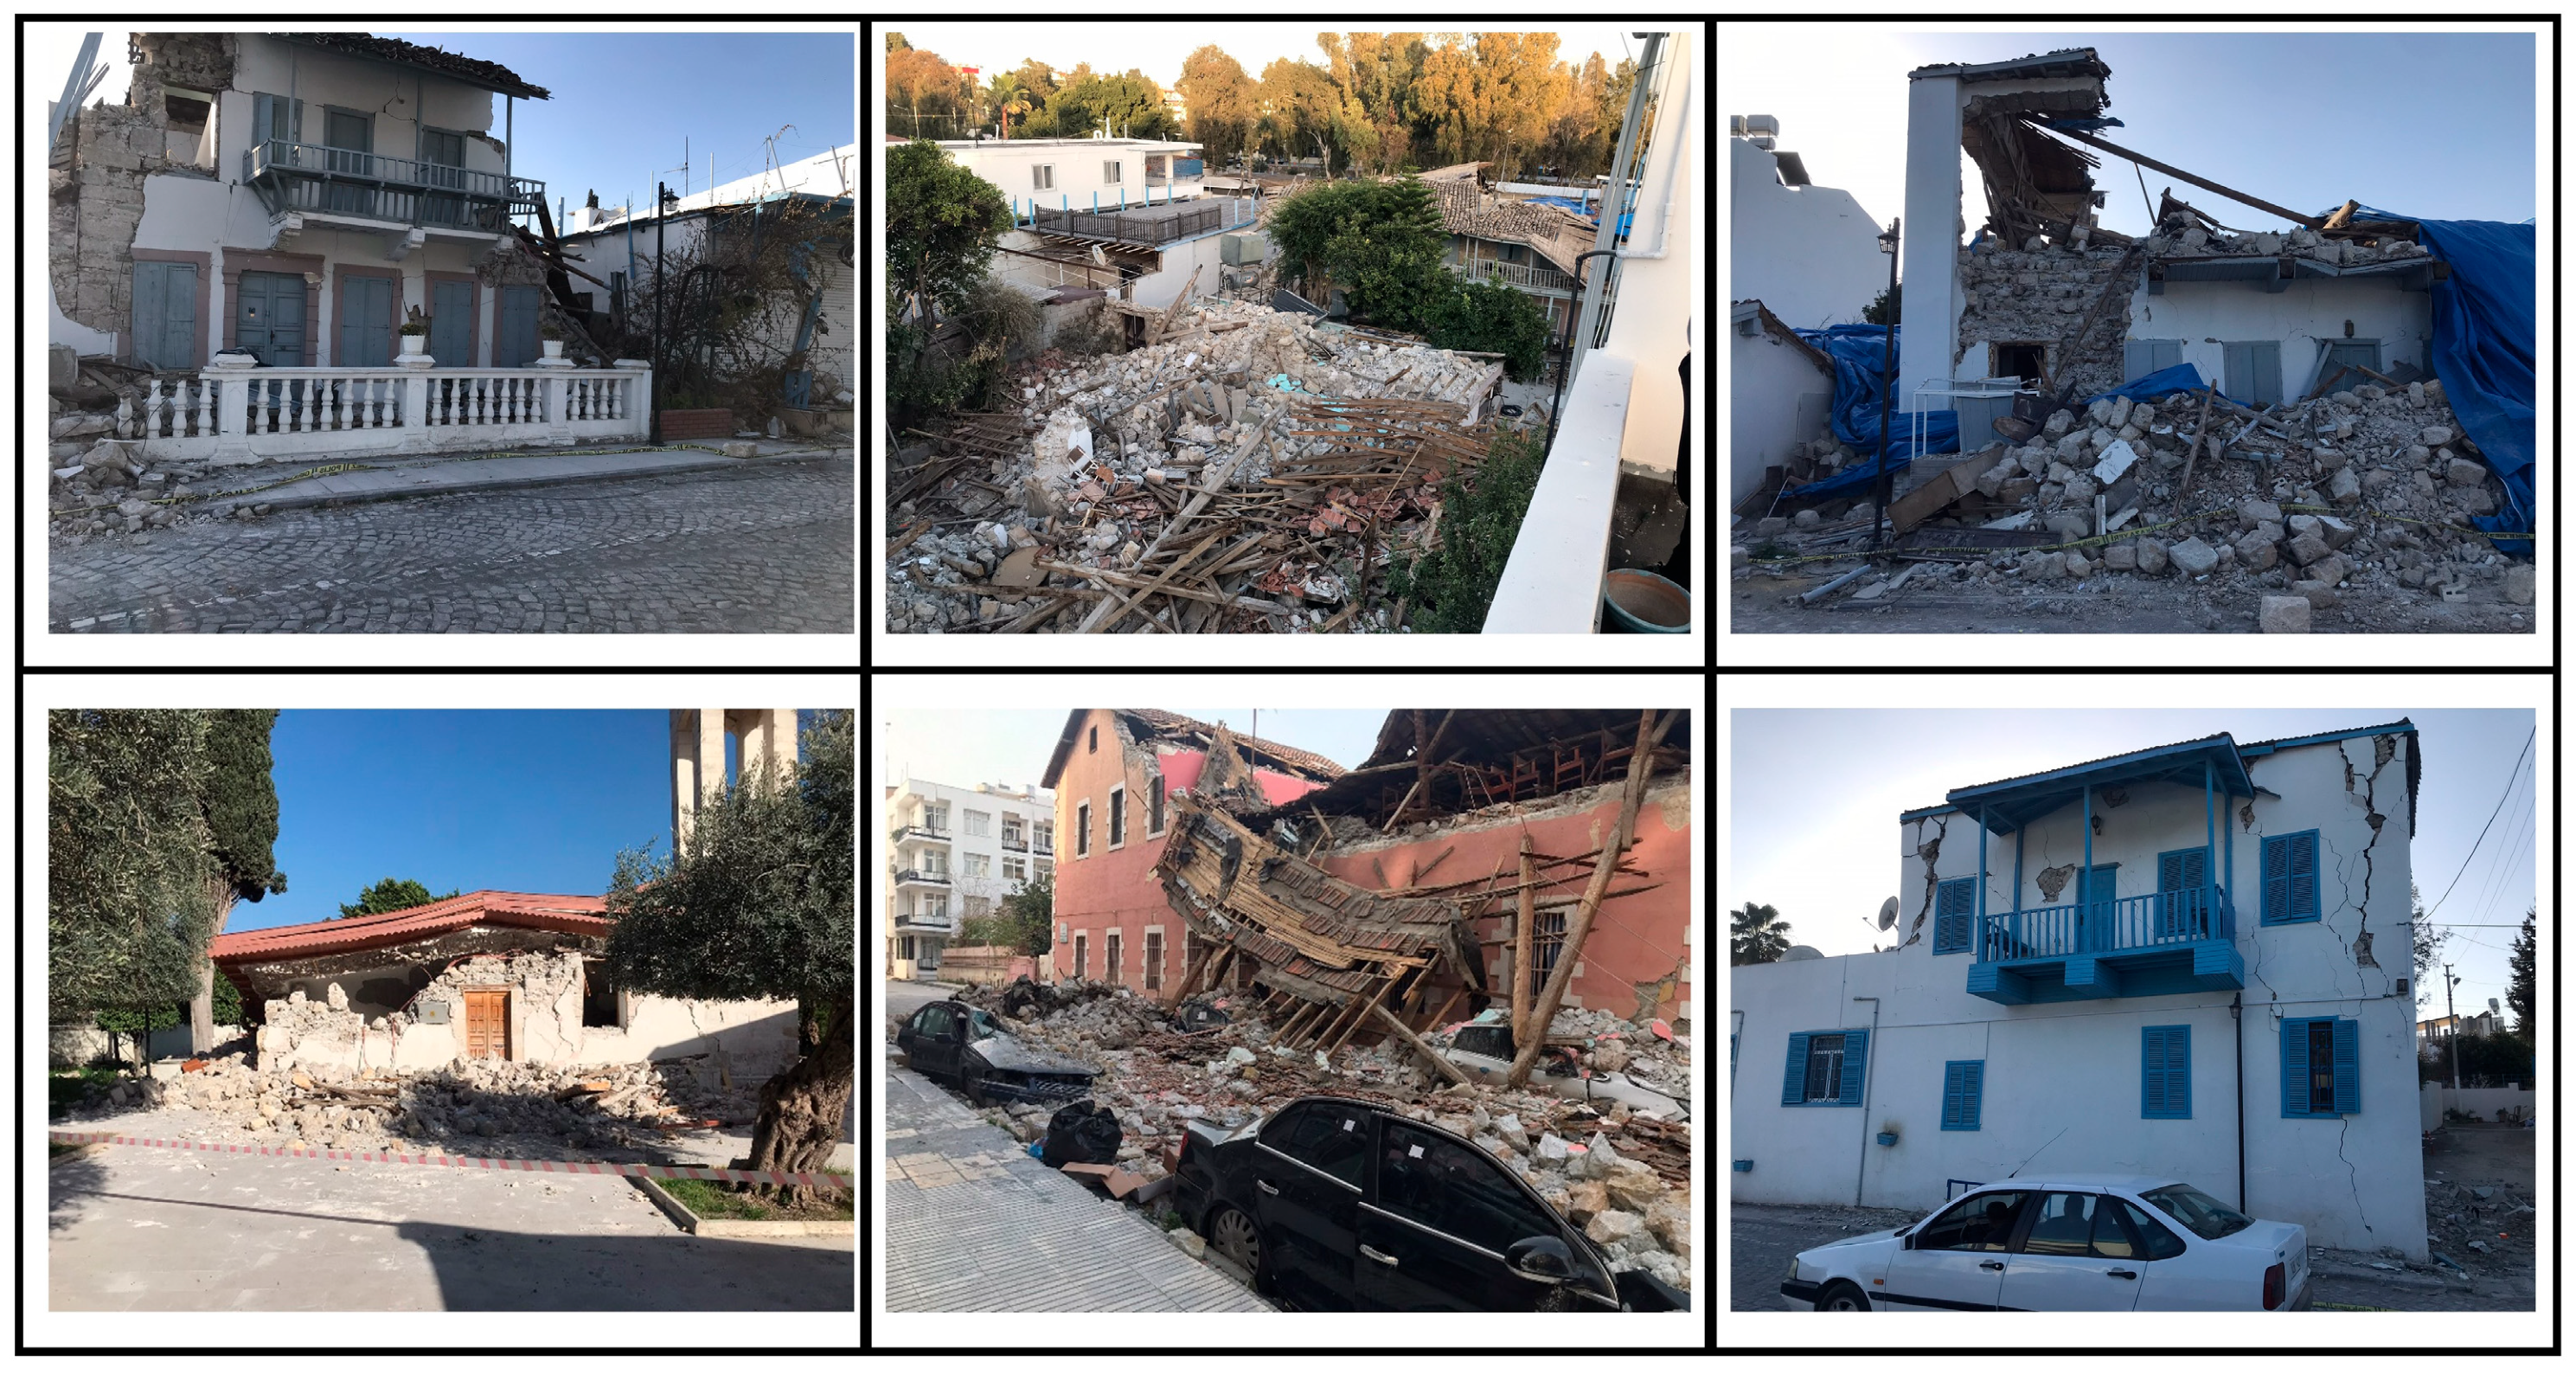
Approximately 4% of the building stock in Hatay Province consists of masonry structures. The damage observed in masonry structures is in-plane and out-of-plane wall damage, corner damage, shield wall damage, timber element damage, and damage due to wrong applications. Various visuals of the damage observed in masonry structures are presented in Figure 25.
It was observed that the masonry building stock was constructed mostly in rural areas and generally to meet housing needs. Most of these buildings were constructed without considering modern earthquake regulations and without adequate engineering services. Because these buildings were characterized by poor construction quality, workmanship, and design and the use of low-strength materials, damage to the structures in the face of such large earthquakes was invited. In order to prevent damage to masonry structures, structures that comply with current regulations (as mentioned for reinforced concrete structures) should be built.
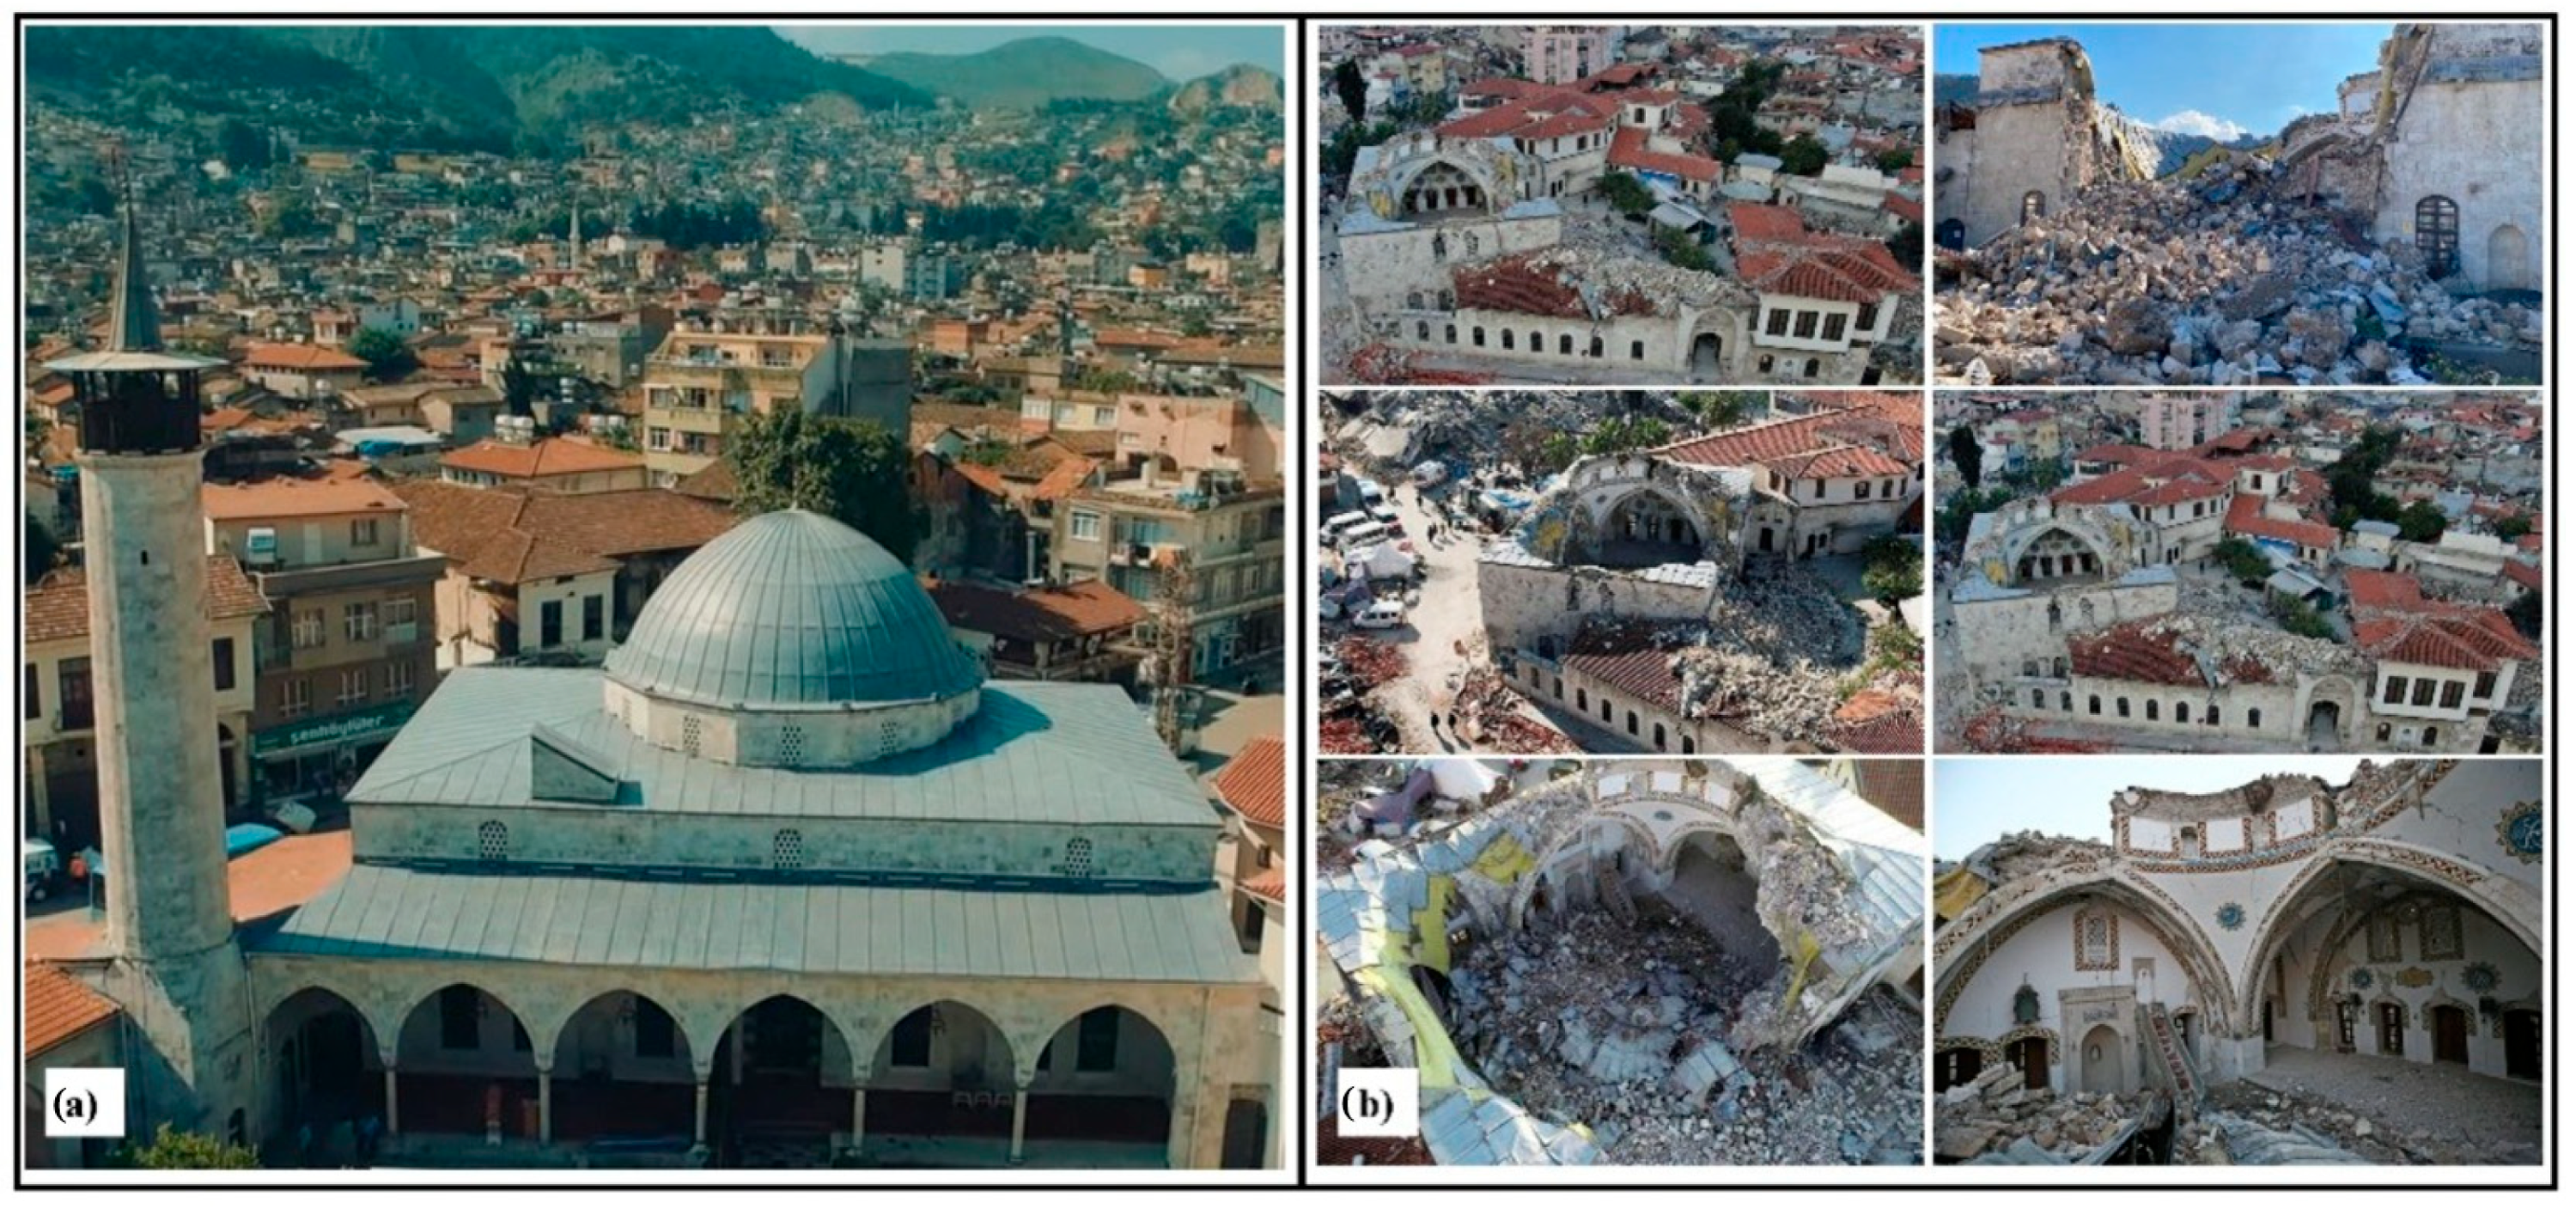
For Hatay Province, some buildings damaged in the 6 February 2023 earthquakes were historical buildings. Many historic buildings in and around Kurtuluş Street in the city center of Hatay were severely damaged in the earthquakes. Habib-i Neccar Mosque, accepted as one of the first mosques in Anatolia, has many historical mansions and historical bazaars located around this street. The historical Sarımiye Mosque, Ulu Mosque, İhsaniye Mosque, Mahremiye Mosque, Payas Selim II Mosque, Şeyh Ali Mosque, Synagogue, and Catholic Church were damaged in the earthquake. The building built by French architect Leon Benju in 1927 in the square known as Köprübaşı, which served as the parliament building until 29 June 1939, when Hatay joined Türkiye in 1938, was also destroyed. The Virgin Mary Church in Hatay’s Samandağ District and the historic St Georgios Greek Orthodox Church in Altınözü District were also damaged. A part of the Hatay Archeological Museum, which has the largest mosaic exhibition area in the world, was damaged. Images of some historical buildings damaged in the earthquake in Hatay are presented in Figure 26, Figure 27 and Figure 28.

6. Discussion

The seismic performance of a structure is primarily governed by three key factors: (i) the seismicity of the location (e.g., proximity to active faults and fault mechanisms), (ii) local soil conditions (e.g., lithology, geotechnical properties, and dominant period), and (iii) structural characteristics (e.g., strength, stiffness, and ductility) (Figure 28). The Hatay region, where this field study was conducted, lies within and around the East Anatolian Fault Zone and the Dead Sea Fault Zone, which significantly increases its seismic hazard. The surface rupture of the Pazarcık (Kahramanmaraş) earthquake extended almost to Hatay, amplifying the earthquake’s impact on structures (Figure 16).
Moreover, most settlement areas in Hatay Province are located on the Amik Plain, underlain by thick alluvial deposits. This geological setting allowed seismic waves to propagate with minimal attenuation and amplified ground motion at the surface. This amplification effect was clearly reflected in the response spectrum of recorded ground motions, which contributed to widespread structural damage (Figure 15). Districts situated near active fault lines and on alluvial soil exhibited the highest damage ratios, confirming the combined influence of fault proximity and site effects (Figure 26). Additionally, liquefaction was observed in the İskenderun region, further exacerbating structural damage (Figure 19).
Field observations also revealed corrosion in the reinforcement of damaged reinforced concrete elements. Corrosion significantly reduced the strength and stiffness of these elements, thereby diminishing the overall seismic performance of the structures.
Damage patterns commonly observed in previous earthquakes were also prevalent in Hatay during the 6 February 2023 events. One of the most critical failure mechanisms was the soft-/weak-story effect, caused by abrupt stiffness and strength discontinuities between stories (Figure 23). Ground floors, often designed for commercial use, had fewer infill walls and greater heights, creating a collapse mechanism during strong shaking. Consequently, ground-floor columns were severely damaged, leading to partial or total collapse. Furthermore, improper construction practices introduced additional weaknesses in structural elements, reducing their earthquake resistance (Figure 24).
In masonry structures, the absence or insufficient length of horizontal and vertical tie beams, lack of proper corner joints, and poor arrangement and mortaring of masonry units significantly increased vulnerability (Figure 25, Figure 26, Figure 27 and Figure 28). These deficiencies underscore the importance of strict compliance with the current Turkish Building Earthquake Code (TBEC-2018), which provides clear guidelines for seismic design and detailing.
Figure 29 provides a comprehensive visualization of how geological and tectonic factors contributed to structural damage in Hatay. Districts located on thick alluvial deposits and near active fault zones—such as Antakya and Defne—exhibited the highest damage ratios. The figure integrates statistical damage data, lithologic mapping, and fault traces, reinforcing the observed correlation between site conditions and seismic vulnerability. These insights underscore the necessity of site-specific seismic design and urban planning strategies in regions with complex subsurface structures.
Figure 29. The effects of the proximity of the settlements to the fault and the soil lithology on the structural damage in Hatay (active fault taken from [3]).
Applsci 15 09704 g029
The findings of the study align with previous research addressing structural and geotechnical vulnerabilities during the 6 February 2023 earthquakes. For example, Işık et al. [107] focused on reinforced-concrete-column failures and strengthening strategies, Işık et al. [108] compared seismic and structural parameters across the East Anatolian Fault Zone, and Cetin et al. [109] investigated liquefaction in Hatay. While these studies provide important insights, our approach extends beyond individual aspects by combining tectonic, geotechnical, and structural evaluations with recorded ground motion data, enabling a more holistic understanding of damage mechanisms and supporting evidence-based recommendations for seismic code revisions.

6.1. Conclusions and Recommendations

This study presents a comprehensive post-earthquake assessment of Hatay Province following the 6 February 2023 Kahramanmaraş earthquake sequence. The findings underscore the complex interplay between tectonic setting, local soil conditions, and structural vulnerabilities in shaping the extent of earthquake-induced damage.
Key Conclusions
  • The simultaneous occurrence of two high-magnitude earthquakes (Mw 7.7 and Mw 7.6) with closely located epicenters significantly amplified the seismic impact.
  • The surface rupture of the first event extended nearly to the center of Hatay, intensifying structural damage.
  • Hatay’s proximity to the East Anatolian Fault Zone and the Dead Sea Fault Zone contributed to widespread destruction.
  • Districts aligned along the northeast–southwest axis (e.g., Hassa, Kırıkhan, Antakya, and Defne) exhibited the highest damage ratios due to both fault proximity and the prevalence of loose alluvial and clastic soils.
  • The Amik Plain’s thick alluvial deposits facilitated seismic wave propagation, resulting in amplified ground motion and extended impact zones.
  • Ground motion records revealed significant exceedances of design-level accelerations and velocities, indicating that current seismic hazard maps may underestimate actual seismic demand.
  • The liquefaction potential and aging building stock further exacerbated structural vulnerabilities.
  • Common failure mechanisms included soft-story collapses, inadequate reinforcement detailing, and poor construction practices.
  • Historical and masonry structures suffered extensive damage due to lack of seismic design provisions and material deficiencies.

6.2. Recommendations

  • Revise the Turkish Earthquake Hazard Map to reflect observed ground motion exceedances and updated seismic risk assessments.
  • Implement stricter urban planning policies that consider fault proximity and soil characteristics, including liquefaction susceptibility.
  • Promote site-specific geotechnical investigations and foundation design tailored to local lithology and groundwater conditions.
  • Enforce the use of corrosion-resistant materials and adequate concrete cover in new constructions.
  • Ensure full compliance with modern seismic codes (e.g., TBEC-2018) in both design and construction phases.
  • Conduct rapid seismic performance evaluations of existing building stock and prioritize retrofitting or reconstruction of vulnerable structures.
  • Establish mandatory training programs for construction workers and site supervisors to improve workmanship and reduce implementation errors.

Funding

The author declares that no funds, grants, or other support were received during the preparation of this manuscript.

Data Availability Statement

The datasets generated during and/or analyzed during the current study are available from the author on reasonable request.

Conflicts of Interest

The author declares no conflicts of interest.

References

  1. DEMA. Earthquake Department of the Disaster and Emergency Management Presidency; DEMA: Ankara, Turkey, 2023. Available online: http://www.afad.gov.tr (accessed on 1 May 2023).
  2. Emre, Ö.; Duman, T.Y.; Olgun, Ş. 1:250.000 Scale Active Fault Map Series of Turkey, Antakya (NJ 37-13) Quadrangle; Serial Number: 39; General Directorate of Mineral Research and Exploration: Ankara, Turkey, 2012.
  3. World Bank. Earthquake Damage in Türkiye Estimated to Exceed $34 Billion: World Bank Disaster Assessment Report. 2023. Available online: https://www.worldbank.org/en/news/press-release/2023/02/27/earthquake-damage-in-turkiye-estimated-to-exceed-34-billion-world-bank-disaster-assessment-report (accessed on 1 July 2025).
  4. Ural, A.; Doğangün, A.; Sezen, H.; Angın, Z. Seismic performance of masonry buildings during the 2007 Bala, Turkey earthquakes. Nat. Hazards 2012, 60, 1013–1026. [Google Scholar] [CrossRef]
  5. Adanur, S. Performance of masonry buildings during the 20 and 27 December 2007 Bala (Ankara) earthquakes in Turkey. Nat. Hazards Earth Syst. Sci. 2010, 10, 2547–2556. [Google Scholar] [CrossRef]
  6. Akkar, S.; Aldemir, A.; Askan, A.; Bakir, S.; Canbay, E.; Demirel, I.O.; Erberik, M. 8 March 2010 Elazığ-Kovancılar (Turkey) Earthquake: Observations on ground motions and building damage. Seismol. Res. Lett. 2011, 82, 42–58. [Google Scholar] [CrossRef]
  7. Celep, Z.; Erken, A.; Taskin, B.; Ilki, A. Failures of masonry and concrete buildings during the March 8, 2010 Kovancılar and Palu (Elazığ) Earthquakes in Turkey. Eng. Fail. Anal. 2011, 18, 868–889. [Google Scholar] [CrossRef]
  8. Tapan, M.; Comert, M.; Demir, C.; Sayan, Y.; Orakcal, K.; Ilki, A. Failures of structures during the October 23, 2011 Tabanli (Van) and November 9, 2011 Edremit (Van) earthquakes in Turkey. Eng. Fail. Anal. 2013, 34, 606–628. [Google Scholar] [CrossRef]
  9. Yazgan, U.; Oyguç, R.; Ertaç Ergüven, M.; Celep, Z. Seismic performance of buildings during 2011 Van earthquakes and rebuilding efforts. J. Earthq. Eng. Eng. Vib. 2016, 15, 591–606. [Google Scholar] [CrossRef]
  10. Çelebi, E.; Aktas, M.; Çaǧlar, N.; Özocak, A.; Kutanis, M.; Mert, N.; Özcan, Z. October 23, 2011 Turkey/Van-Ercis earthquake: Structural damages in the residential buildings. Nat. Hazards 2013, 65, 2287–2310. [Google Scholar] [CrossRef]
  11. Yön, B.; Onat, O.; Öncü, M.E. Earthquake Damage to Nonstructural Elements of Reinforced Concrete Buildings during 2011 Van Seismic Sequence. J. Perform. Constr. Facil. 2019, 33, 04019075. [Google Scholar] [CrossRef]
  12. Oyguc, R.; Oyguc, E. 2011 Van Earthquakes: Lessons from Damaged Masonry Structures. J. Perform. Constr. Facil. 2017, 31, 04017062. [Google Scholar] [CrossRef]
  13. Bayraktar, A.; Altunişik, A.C.; Pehlivan, M. Performance and damages of reinforced concrete buildings during the October 23 and November 9, 2011 Van, Turkey, earthquakes. Soil Dyn. Earthq. Eng. 2013, 53, 49–72. [Google Scholar] [CrossRef]
  14. Taskin, B.; Sezen, A.; Tugsal, U.M.; Erken, A. The aftermath of 2011 Van earthquakes: Evaluation of strong motion, geotechnical and structural issues. Bull. Earthq. Eng. 2013, 11, 285–312. [Google Scholar] [CrossRef]
  15. Atmaca, B.; Demir, S.; Günaydin, M.; Altunişik, A.C.; Hüsem, M.; Ateş, Ş.; Adanur, S.; Angin, Z. Field Investigation on the Performance of Mosques and Minarets during the Elazig-Sivrice Earthquake. J. Perform. Constr. Facil. 2020, 34, 04020120. [Google Scholar] [CrossRef]
  16. Caglar, N.; Vural, I.; Kirtel, O.; Saribiyik, A.; Sumer, Y. Structural damages observed in buildings after the January 24, 2020 Elazığ-Sivrice earthquake in Turkiye. Case Stud. Constr. Mater. 2023, 18, e01886. [Google Scholar] [CrossRef]
  17. Dogan, G.; Ecemis, A.S.; Korkmaz, S.Z.; Arslan, M.H.; Korkmaz, H.H. Buildings Damages after Elazığ, Turkey Earthquake on January 24, 2020. Nat. Hazards 2021, 109, 161–200. [Google Scholar] [CrossRef]
  18. Dedeoğlu, İ.Ö.; Yetkin, M.; Calayır, Y. 24 January 2020 Sivrice-Elazığ Earthquake: Assessment of Seismic Characteristics of Earthquake, Earthquake Territory and Structural Performance of Reinforced Concrete Structures. Sak. Univ. J. Sci. 2022, 26, 1892–1907. [Google Scholar] [CrossRef]
  19. Yetkin, M.; Dedeoğlu, İ.Ö.; Calayır, Y. 24 Ocak 2020 Sivrice Depremi Sonrasında Elazığ İlinde Bulunan Minarelerde Meydana Gelen Hasarların Araştırılması ve Değerlendirilmesi. Fırat Üniversitesi Mühendislik Bilim. Derg. 2021, 33, 379–389. [Google Scholar] [CrossRef]
  20. Yurdakul, Ö.; Duran, B.; Tunaboyu, O.; Avşar, Ö. Field reconnaissance on seismic performance of RC buildings after the January 24, 2020 Elazığ-Sivrice earthquake. Nat. Hazards 2021, 105, 859–887. [Google Scholar] [CrossRef]
  21. Onat, O.; Yön, B.; Öncü, M.E.; Varolgüneş, S.; Karaşin, A.; Cemalgil, S. Field reconnaissance and structural assessment of the October 30, 2020, Samos, Aegean Sea earthquake: An example of severe damage due to the basin effect. Nat. Hazards 2022, 112, 75–117. [Google Scholar] [CrossRef]
  22. Yakut, A.; Sucuoğlu, H.; Binici, B.; Canbay, E.; Donmez, C.; İlki, A.; Caner, A. Performance of structures in İzmir after the Samos Island earthquake. Bull. Earthq. Eng. 2022, 20, 7793–7818. [Google Scholar] [CrossRef]
  23. Yön, B.; Onat, O.; Öncü, M.E.; Karaşın, A. Failures of masonry dwelling triggered by East Anatolian Fault earthquakes in Turkey. Soil Dyn. Earthq. Eng. 2020, 133, 106126. [Google Scholar] [CrossRef]
  24. Indirli, M.; Kouris, L.A.S.; Formisano, A.; Borg, R.P.; Mazzolani, F.M. Seismic damage assessment of unreinforced masonry structures after the Abruzzo 2009 earthquake: The case study of the historical centers of L’Aquila and Castelvecchio Subequo. Int. J. Archit. Herit. 2013, 7, 536–578. [Google Scholar] [CrossRef]
  25. Brandonisio, G.; Lucibello, G.; Mele, E.; Luca, A.D. Damage and performance evaluation of masonry churches in the 2009 L’Aquila earthquake. Eng. Fail. Anal. 2013, 34, 693–714. [Google Scholar] [CrossRef]
  26. Sorrentino, L.; Liberatore, L.; Liberatore, D.; Masiani, R. The behaviour of vernacular buildings in the 2012 Emilia earthquakes. Bull. Earthq. Eng. 2014, 12, 2367–2382. [Google Scholar] [CrossRef]
  27. Sorrentino, L.; Cattari, S.; da Porto, F.; Magenes, G.; Penna, A. Seismic behaviour of ordinary masonry buildings during the 2016 central Italy earthquakes. Bull. Earthq. Eng. 2019, 17, 5583–5607. [Google Scholar] [CrossRef]
  28. Penna, A.; Calderini, C.; Sorrentino, L.; Carocci, C.F.; Cescatti, E.; Sisti, R.; Borri, A. Damage to churches in the 2016 central Italy earthquakes. Bull. Earthq. Eng. 2019, 17, 5763–5790. [Google Scholar] [CrossRef]
  29. Gautam, D.; Chaulagain, H. Structural performance and associated lessons to be learned from world earthquakes in Nepal after 25 April 2015 (Mw 7.8) Gorkha earthquake. Eng. Fail. Anal. 2016, 68, 222–243. [Google Scholar] [CrossRef]
  30. Dutta, S.C.; Nayak, S.; Acharjee, G.; Panda, S.K.; Das, P.K. Gorkha (Nepal) earthquake of April 25, 2015: Actual damage, retrofitting measures and prediction by RVS for a few typical structures. Soil Dyn. Earthq. Eng. 2016, 89, 171–184. [Google Scholar] [CrossRef]
  31. Ismail, N.; Khattak, N. Observed failure modes of unreinforced masonry buildings during the 2015 Hindu Kush earthquake. Earthq. Eng. Eng. Vib. 2019, 18, 301–314. [Google Scholar] [CrossRef]
  32. Halder, L.; Chandra Dutta, S.; Sharma, R.P.; Bhattacharya, S. Lessons learnt from post-earthquake damage study of Northeast India and Nepal during last ten years: 2021 Assam earthquake, 2020 Mizoram earthquake, 2017 Ambasa earthquake, 2016 Manipur earthquake, 2015 Nepal earthquake, and 2011 Sikkim earthquake. Soil Dyn. Earthq. Eng. 2021, 151, 106990. [Google Scholar] [CrossRef]
  33. Göçer, C. Structural evaluation of masonry building damages during the April 24, 2014 Gökçeada earthquake in the Aegean Sea. Bull. Earthq. Eng. 2020, 18, 3459–3483. [Google Scholar] [CrossRef]
  34. Avcil, F.; Işık, E.; İzol, R.; Büyüksaraç, A.; Arkan, E.; Arslan, M.H.; Aksoylu, C.; Eyisüren, O.; Harirchian, E. Effects of the February 6, 2023, Kahramanmaras earthquake on structures in Kahramanmaras city. Nat. Hazards 2024, 120, 2953–2991. [Google Scholar] [CrossRef]
  35. Işık, E.; Avcil, F.; İzol, R.; Büyüksaraç, A.; Bilgin, H.; Harirchian, E.; Arkan, E. Field reconnaissance and earthquake vulnerability of the rc buildings in Adıyaman during 2023 Türkiye earthquakes. Appl. Sci. 2024, 14, 2860. [Google Scholar] [CrossRef]
  36. Işık, E. Structural failures of adobe buildings during the February 2023 Kahramanmaraş (Türkiye) earthquakes. Appl. Sci. 2023, 13, 8937. [Google Scholar] [CrossRef]
  37. Özturk, M.; Arslan, M.H.; Dogan, G.; Ecemis, A.S.; Arslan, H.D. School buildings performance in 7.7 Mw and 7.6 Mw catastrophic earthquakes in southeast of Turkey. J. Build. Eng. 2023, 79, 107810. [Google Scholar] [CrossRef]
  38. Özturk, M.; Arslan, M.H.; Korkmaz, H.H. Effect on RC buildings of 6 February 2023 Turkey earthquake doublets and new doctrines for seismic design. Eng. Fail. Anal. 2023, 153, 107521. [Google Scholar] [CrossRef]
  39. Mercimek, Ö. Seismic failure modes of masonry structures exposed to Kahramanmaras earthquakes (Mw 7.7 and 7.6) on February 6, 2023. Eng. Fail. Anal. 2023, 151, 107422. [Google Scholar] [CrossRef]
  40. Kocaman, İ. The effect of the Kahramanmaras earthquakes (Mw 7.7 and Mw 7.6) on historical masonry mosques and minarets. Eng. Fail. Anal. 2023, 149, 107225. [Google Scholar] [CrossRef]
  41. Erkek, H.; Yetkin, M. Assessment of the performance of a historic minaret during the Kahramanmaras earthquakes (Mw 7.7 and Mw 7.6). Structures 2023, 58, 105620. [Google Scholar] [CrossRef]
  42. Altunsu, E.; Güneş, O.; Öztürk, S.; Sorosh, S.; Sarı, A.; Beeson, S.T. Investigating the structural damage in Hatay province after Kahramanmaras-Turkiye earthquake sequences. Eng. Fail. Anal. 2024, 157, 107857. [Google Scholar] [CrossRef]
  43. Kazaz, İ.; Bilge, İ.H.; Gürbüz, M. Near-fault ground motion characteristics and its effects on a collapsed reinforced concrete structure in Hatay during the February 6, 2023 Mw7.8 Kahramanmaras earthquake. Eng. Struct. 2024, 298, 117067. [Google Scholar] [CrossRef]
  44. Kahya, V.; Genç, A.F.; Sunca, F.; Roudane, B.; Altunişik, A.C.; Yilmaz, S.; Günaydin, M.; Dok, G.; Kirtel, O.; Demir, A.; et al. Evaluation of earthquake-related damages on masonry structures due to the 6 February 2023 Kahramanmaras-Turkiye earthquakes: A case study for Hatay Governorship Building. Eng. Fail. Anal. 2024, 156, 107855. [Google Scholar] [CrossRef]
  45. Vuran, E.; Serhatoğlu, C.; Timurağaoğlu, M.; Smyrou, E.; Bal, I.E.; Livaoğlu, R. Damage observations of RC buildings from 2023 Kahramanmaras earthquake sequence and discussion on the seismic code regulations. Bull. Earthq. Eng. 2024, 23, 1153–1182. [Google Scholar] [CrossRef]
  46. Ivanov, M.L.; Chow, W.K. Structural damage observed in reinforced concrete buildings in Adiyaman during the 2023 Turkiye Kahramanmaras Earthquakes. Structures 2023, 58, 105578. [Google Scholar] [CrossRef]
  47. Özkaynak, M.I.; Cetin, K.O. The performance of Karasu Bridge following the February 6, 2023 Kahramanmaras-Turkiye earthquake sequence. Eng. Geol. 2024, 335, 107512. [Google Scholar] [CrossRef]
  48. Lashgari, A.; Soghrat, M.R.; Jafarian, Y.; Zafarani, H. The 2023 Turkey–Syria Earthquake Sequence: Ground-Motion and Local Site-Effect Analyses for Kahramanmaras City. Int. J. Civ. Eng. 2024, 22, 877–899. [Google Scholar] [CrossRef]
  49. Nemutlu, Ö.F. Loss analyses associated with the secondary effect in earthquake: A case study of Kahramanmaras earthquake sequences. Earthq. Struct. 2025, 28, 137. [Google Scholar] [CrossRef]
  50. Yetkın, M.; Dedeoğlu, I.Ö.; Tunç, G. February 6, 2023, Kahramanmaraş twin earthquakes: Evaluation of ground motions and seismic performance of buildings for Elazığ, southeast of Türkiye. Soil Dyn. Earthq. Eng. 2024, 181, 108678. [Google Scholar] [CrossRef]
  51. Dedeoglu, I.O.; Yetkin, M.; Tunc, G.; Ozbulut, O.E. Evaluating earthquake-induced damage in Dogansehir, Malatya after 2023 Kahramanmaras earthquake sequence: Geotechnical and structural perspectives. J. Build. Eng. 2025, 104, 112266. [Google Scholar] [CrossRef]
  52. Bozkurt, E. Neotectonics of Turkey–A synthesis. Geodin. Açta 2001, 14, 3–30. [Google Scholar] [CrossRef]
  53. Allen, M.; Jackson, J.; Walker, R. Late Cenozoic reorganisation of the Arabia-Eurasia collision and the comparison of short-term and long-term deformation rates. Tectonics 2004, 23. [Google Scholar] [CrossRef]
  54. Bayrak, E.; Yılmaz, Ş.; Softa, M.; Türker, T.; Bayrak, Y. Earthquake hazard analysis for East Anatolian fault zone, Turkey. Nat. Hazards 2015, 76, 1063–1077. [Google Scholar] [CrossRef]
  55. McKenzie, D. Active tectonics of the Mediterranean region. Geophys. J. Int. 1972, 30, 109–185. [Google Scholar] [CrossRef]
  56. DeMets, C.; Gordon, R.G.; Argus, D.F.; Stein, S. Current plate motions. Geophys. J. Int. 1990, 101, 425–478. [Google Scholar] [CrossRef]
  57. Jestin, F.; Huchon, P.; Gaulier, J.M. The Somalia plate and the East African Rift System: Present-day kinematics. Geophys. J. Int. 1994, 116, 637–654. [Google Scholar] [CrossRef]
  58. Reilinger, R.E.; McClusky, S.C.; Souter, B.J.; Hamburger, M.W.; Prilepin, M.T.; Mishin, A.; Guseva, T.; Balassanian, S. Preliminary estimates of plate convergence in the Caucasus collision zone from global positioning system measurements. Geophys. Res. Lett. 1997, 24, 1815–1818. [Google Scholar] [CrossRef]
  59. McKenzie, D. Plate Tectonics of the Mediterranean Region. Nature 1970, 226, 224–239. [Google Scholar] [CrossRef]
  60. Albini, P.; Musson, R.M.W.; Rovida, A.; Locati, M.; Capera, A.A.G.; Viganò, D. The Global Earthquake History. Earthq. Spectra 2014, 30, 607–624. [Google Scholar] [CrossRef]
  61. Şengör, A.M.C.; Görür, N. Strike-Slip Faulting and Related Basin Formation in Zones of Tectonic Escape: Turkey as a Case Study. In Strike-Slip Deformation, Basin Formation, and Sedimentation; Biddle, K., Christie-Blick, N., Eds.; Society for Sedimentary Geology: Tulsa, OK, USA, 1985. [Google Scholar] [CrossRef]
  62. Dewey, J.F.; Hempton, M.R.; Kidd, W.S.F.; Saroglu, F.; Şengör, A.M.C. Shortening of continental lithosphere: The neotectonics of Eastern Anatolia—A young collision zone. Geol. Soc. Lond. Spec. Publ. 1986, 19, 1–36. [Google Scholar] [CrossRef]
  63. Barka, A.A.; Kadinsky-Cade, K. Strike-slip fault geometry in Turkey and its influence on earthquake activity. Tectonics 1988, 7, 663–684. [Google Scholar] [CrossRef]
  64. Şaroğlu, F.; Emre, O.; Kuscu, I. The East Anatolian fault zone of Turkey. Ann. Tectonicae 1992, VI, 99–125. [Google Scholar]
  65. Taymaz, T.; Eyidoğan, H.; Jackson, J. Source parameters of large earthquakes in the East Anatolian Fault Zone (Turkey). Geophys. J. Int. 1991, 106, 537–550. [Google Scholar] [CrossRef]
  66. Westaway, R. Present-day kinematics of the Middle East and eastern Mediterranean. J. Geophys. Res. Solid Earth 1994, 99, 12071–12090. [Google Scholar] [CrossRef]
  67. Arpat, E.; Şaroğlu, F. Doğu Anadolu Fayı ile İlgili Bazı Gözlemler ve Düşünceler. Bull. Miner. Res. Explor. 1972, 78, 44–50. Available online: https://dergipark.org.tr/en/pub/bulletinofmre/issue/3904/52066 (accessed on 1 September 2024).
  68. Seymen, İ.; Aydın, A. The Bingöl earthquake fault and its relation to the North Anatolian fault zone. Bull. Miner. Res. Explor. 1972, 79, 1–12. Available online: https://dergi.mta.gov.tr/article/show/716 (accessed on 1 September 2023).
  69. Barka, A.; Reilinger, R. Active tectonics of the Eastern Mediterranean region: Deduced from GPS, neotectonic and seismicity data. Ann. Geofis. 1997, 40, 587–610. [Google Scholar] [CrossRef]
  70. Ambraseys, N.N.; Finkel, C.F. Seismicity of the Northeast Mediterranean region during early 20th century. Ann. Geophys. B 1987, 5, 701–726. [Google Scholar]
  71. Ambraseys, N.N. Temporary seismic quiescence: SE Turkey. Geophys. J. Int. 1989, 96, 311–331. [Google Scholar] [CrossRef]
  72. Kempler, D.; Ben-Avraham, Z. The tectonic evolution of the Cyprean Arc. Ann. Tecton. 1987, 1, 58–71. [Google Scholar]
  73. Wortel, M.J.R.; Spakman, W. Structure and dynamics of subducted lithosphere in the Mediterranean region. Proc. K. Ned. Akad. Van Wet. 1992, 95, 325–347. [Google Scholar]
  74. Şahbaz, N.; Seyitoğlu, G. The neotectonics of NE Gaziantep: The Bozova and Halfeti strike-slip faults and their relationships with blind thrusts, Turkey. Bull. Miner. Res. Explor. 2018, 156, 17–40. [Google Scholar] [CrossRef]
  75. Seyitoğlu, G.; Aktug, B.; Esat, K.; Kaypak, B. Neotectonics of Turkey (Turkiye) and surrounding regions: A new perspective with block modelling. Geol. Acta 2022, 20, 1–21. [Google Scholar] [CrossRef]
  76. Coşkun, B. The Dead Sea Fault and related subsurface structures, Gaziantep Basin, southeast Turkey. Geol. Mag. 2000, 137, 175–192. [Google Scholar] [CrossRef]
  77. Schultz, C. Charting the growth of the Turkish-Iranian plateau. Eos Trans. Am. Geophys. Union 2013, 94, 228. [Google Scholar] [CrossRef]
  78. Lekkas, E. Intensities distribution and parameters controlling their geographic differentiation during the earthquakes of Izmit and Düzce (Turkey 1999). Geol. Balc. 2002, 2–4, 199–208. [Google Scholar] [CrossRef]
  79. Alp, H.; Albora, A.M.; Tur, H. A view of tectonic structure and gravity anomalies of Hatay Region Southern Turkey using wavelet analysis. J. Appl. Geophys. 2011, 75, 498–505. [Google Scholar] [CrossRef]
  80. Hakimhashemi, A.; Grünthal, G. A Statistical Method for Estimating Catalog Completeness Applicable to Long-Term Nonstationary Seismicity Data. Bull. Seismol. Soc. Am. 2012, 102, 2530–2546. [Google Scholar] [CrossRef]
  81. Kavak, K.; Tatar, O.; Piper, J.; Koçbulut, F.; Mesci, L. Determination of neotectonic features of the Karasu Basin (SE Turkey) and their relationship with Quaternary volcanic activity using Landsat ETM+ imagery. Int. J. Remote Sens. 2009, 30, 4507–4524. [Google Scholar] [CrossRef]
  82. Yürür, T.; Chorowicz, J. Recent volcanism, tectonics and plate kinematics near the junction of the African, Arabian and Anatolian plates in the eastern Mediterranean. J. Volcanol. Geotherm. Res. 1998, 85, 1–15. [Google Scholar] [CrossRef]
  83. Şengör, A.M.C.; Yılmaz, Y. Turkiye’de Tetis’ in evrimi: Levha tektoniği açısından bir yaklaşım. Turk. Jeol. Kurumu Yerbilim. Özel Dizisi 1983, 1, 75. [Google Scholar]
  84. Karatas, A.; Korkmaz, H. Hatay İli’nin Su Potansiyeli ve Sürdürülebilir Yönetimi. Master’s Thesis, Mustafa Kemal Üniversitesi Yayin, Antakya, Turkey, 2010. [Google Scholar]
  85. Mineral Research and Exploration General Directorate. Hatay 1:500.000 Geological Map; Mineral Research and Exploration General Directorate: Ankara, Turkiye, 2002.
  86. EMSC. Euro-Mediterranean Seismological Centre. Available online: https://www.emsc.eu/ (accessed on 1 May 2023).
  87. Bird, P. An updated digital model of plate boundaries. Geochem. Geophys. Geosyst. 2003, 4, 1027. [Google Scholar] [CrossRef]
  88. USGS. United States Geological Survey. Available online: https://www.usgs.gov (accessed on 1 May 2023).
  89. TEHM. Turkey Earthquake Hazard Maps Interactive Web Application, DEMA. 2019. Available online: https://tdth.afad.gov.tr/TDTH/main.xhtml (accessed on 1 May 2023).
  90. Toprak, S.; Zulfikar, A.C.; Mutlu, A.; Tugsal, U.M.; Nacaroglu, E.; Karabulut, S.; Ceylan, M.; Ozdemir, K.; Parlak, S.; Dal, O.; et al. The aftermath of 2023 Kahramanmaraş earthquakes: Evaluation of strong motion data, geotechnical, building, and infrastructure issues. Nat. Hazards 2025, 121, 2155–2192. [Google Scholar] [CrossRef]
  91. Kürçer, A.; Elmacı, H.; Özdemir, E.; Güven, C.; Güler, T.; Avcu, İ.; Olgun, Ş.; Avcı, H.O.; Aydoğan, H.; Yüce, A.A.; et al. 06 Şubat 2023 Pazarcik (Kahramanmaras) Depremi (Mw 7,7) Saha Gözlemleri ve Değerlendirmeler. MTA Genel Müdürlüğü Rap. 2023, 187. Available online: https://www.mta.gov.tr/v3.0/bilgi-merkezi/2023-maras-depremi-raporlari (accessed on 1 May 2024).
  92. Atmaca, B.; Demir, S.; Günaydın, M.; Altunışık, A.C.; Hüsem, M.; Ateş, Ş; Adanur, S.; Angın, Z. Lessons learned from the past earthquakes on building performance in Turkey. J. Struct. Eng. Appl. Mech. 2020, 3, 61–84. [Google Scholar] [CrossRef]
  93. Fierro, E.; Perry, C. Preliminary Reconnaissance Report: 12 January 2010 Haiti Earthquake; Pacific Earthquake Engineering Research Center (PEER): Berkeley, CA, USA, 2010; Available online: https://apps.peer.berkeley.edu/publications/haiti_2010/documents/Haiti_Reconnaissance.pdf (accessed on 1 December 2024).
  94. National Information Center of Earthquake Engineering (NICEE). Structural Performance During Earthquakes; Indian Institute of Technology Kanpur: Kanpur, Indian, 2018; Available online: https://www.nicee.org/iaee/E_Chapter2.pdf (accessed on 1 July 2023).
  95. Zhang, J.; Bai, Z.; Ma, J.; Qu, S.; Tian, J.; Wang, S.; Zhang, R. Predictive analysis of seismic damage to buildings near-surface faults under the influence of multiple factors. PLoS ONE 2025, 20, e0320930. [Google Scholar] [CrossRef]
  96. MEUCC. Kahramanmaraş ve Hatay Depremleri Raporu, Türkiye Cumhuriyeti Cumhurbaşkanlığı Strateji ve Bütçe Başkanlığı. 2023. Available online: https://www.sbb.gov.tr/2023-kahramanmaras-ve-hatay-depremleri-raporu/ (accessed on 1 June 2024).
  97. Ansal, A. Depremlerde yerel zemin davranışları. Bilim Ve Tek. 1999, 384, 64–68. [Google Scholar]
  98. Över, S.; Büyüksaraç, A.; Bekta, Ö. Assessment of potential seismic hazard and site effect in Antakya (Hatay Province), SE Turkey. Environ. Earth Sci. 2011, 62, 313–326. [Google Scholar] [CrossRef]
  99. Büyüksaraç, A.; Över, S.; Geneş, M.C.; Bikçe, M.; Kaçın, S.; Bektaş, Ö. Estimating shear wave velocity using acceleration data in Antakya (Turkey). Earth Sci. Res. J. 2015, 18, 87–98. [Google Scholar] [CrossRef]
  100. Sucuoğlu, H. Yapılarda deprem kuvvetlerinin oluşması. In Deprem ve Sonrası; Karaesmen, E., Ed.; Turkiye Müteahhitler Birliği: Ankara, Turkey, 1996. [Google Scholar]
  101. Doğangün, A. Deprem-Zemin ve Depreme Dayanıklı Yapı Tasarımı; Birsen Yayınevi: İstanbul, Turkey, 2021. [Google Scholar]
  102. Toktanış, A.; Över, S. Konarlı Mahallesi’nde (İskenderun) Sıvılaşma Pilot Çalışması. Geosound 2021, 54, 1–14. [Google Scholar]
  103. TÜİK. Turkish Statistical Institute. Available online: https://www.tuik.gov.tr/ (accessed on 1 May 2025).
  104. TBEC. Turkiye Bina Deprem Yönetmeliği; Disaster and Emergency Management Presidency: Ankara, Turkey, 2018. (In Turkish)
  105. Nicoletti, V.; Carbonari, S.; Gara, F. Nomograms for the pre-dimensioning of RC beam-column joints according to Eurocode 8. Structures 2022, 35, 958–973. [Google Scholar] [CrossRef]
  106. Shen, X.; Li, B.; Chen, Y.T.; Tizani, W.; Jiang, Y. Relocating plastic hinges in reinforced concrete beam-column joints by mechanically anchored diagonal bars. Eng. Struct. 2021, 243, 113468. [Google Scholar] [CrossRef]
  107. Işık, E.; Radu, D.; Harirchian, E.; Avcil, F.; Arkan, E.; Büyüksaraç, A.; Hadzima-Nyarko, M. Failures in Reinforced-Concrete Columns and Proposals for Reinforcement Solutions: Insights from the 2023 Kahramanmaraş Earthquakes. Buildings 2025, 15, 1535. [Google Scholar] [CrossRef]
  108. Işık, E.; Hadzima-Nyarko, M.; Avcil, F.; Büyüksaraç, A.; Arkan, E.; Alkan, H.; Harirchian, E. Comparison of Seismic and Structural Parameters of Settlements in the East Anatolian Fault Zone in Light of the 6 February Kahramanmaraş Earthquakes. Infrastructures 2024, 9, 219. [Google Scholar] [CrossRef]
  109. Cetin, K.O.; Soylemez, B.; Guzel, H.; Cakir, E. Soil liquefaction sites following the February 6, 2023, Kahramanmaraş-Türkiye earthquake sequence. Bull. Earthq. Eng. 2024, 23, 921–944. [Google Scholar] [CrossRef]
Figure 2. Türkiye and its surrounding areas’ tectonic features. The figure also shows the most devastating earthquakes in and around Turkey over thousands of years. Red squares show magnitude >7.0 earthquakes according to the GEM (Global Historical Earthquake Catalog (1000–1903)) in [60]. Yellow dots show magnitude >6.0 earthquakes, and red dots show magnitude >7.0 earthquakes, according to the USGS (U.S. Geological Survey), between 1900 and May 2023.
Applsci 15 09704 g002
Figure 3. Approximate locations of historical and current earthquakes along the East Anatolian Fault Zone and seismic gap (red square) along the fault zone till February 2023.
Applsci 15 09704 g003
Figure 8. DD2 Comparison of the acceleration records of Pazarcik station of the Pazarcik (Kahramanmaras) earthquake (Mw = 7.7/DEMA) and some of their properties with the values given in the earthquake hazard map for DD1 and DD2.
Applsci 15 09704 g008
Figure 9. Comparison of the acceleration records of the Göksun station of the Elbistan (Kahramanmaras) earthquake (Mw = 7.6/DEMA) and some of their properties with the values given in the earthquake hazard map for DD1 and DD2.
Applsci 15 09704 g009
Figure 11. Intensity map of the peak values measured at the stations in Hatay Province for Mw = 7.7 Pazarcik (Kahramanmaraş) earthquakes: (a) PGA horizontal component; (b) PGA vertical component.
Applsci 15 09704 g011
Figure 12. Intensity map of the peak values measured at the stations in Hatay Province for Mw = 7.7 Pazarcik (Kahramanmaras) earthquakes: (a) PGV horizontal component; (b) PGD horizontal component.
Applsci 15 09704 g012
Figure 13. Peak ground accelerations measured at different seismic stations in Hatay with available measurements during Mw = 7.7 Pazarcik (Kahramanmaras) earthquakes.
Applsci 15 09704 g013
Figure 14. Peak ground velocities measured at different seismic stations in Hatay with available measurements during Mw = 7.7 Pazarcik (Kahramanmaras) earthquakes.
Applsci 15 09704 g014
Figure 15. Spectral accelerations for E-W and N-S components of ground motion records measured during the Mw = 7.7 Pazarcik (Kahramanmaras) earthquake at different seismic stations in (a) Hassa and Kırıkhan and (b) Antakya.
Applsci 15 09704 g015
Figure 21. Examples of common failure mechanisms in reinforced concrete buildings observed in Hatay after the 2023 earthquakes.
Applsci 15 09704 g021
Figure 22. Corrosion, plain reinforcement, insufficient stirrups, and improper hook point.
Applsci 15 09704 g022
Figure 23. Some examples of soft/weak stories.
Applsci 15 09704 g023
Figure 24. Some examples of incorrect applications and poor workmanship.
Applsci 15 09704 g024
Figure 25. Various visualizations of damage observed in masonry structures.
Applsci 15 09704 g025
Figure 26. Habib-i Neccar Mosque (a) before and (b) after the earthquake.
Applsci 15 09704 g026
Figure 27. Grand Mosque (a) before and (b) after the earthquake.
Applsci 15 09704 g027
Figure 28. Antakya Church of St Peter and Paul (a) before and (b) after the earthquake.
Applsci 15 09704 g028
Disclaimer/Publisher’s Note: The statements, opinions and data contained in all publications are solely those of the individual author(s) and contributor(s) and not of MDPI and/or the editor(s). MDPI and/or the editor(s) disclaim responsibility for any injury to people or property resulting from any ideas, methods, instructions or products referred to in the content.