Abstract
The layered composite roof of a coal mine roadway exhibits heterogeneity, with pronounced variations in layer thickness and strength. Fully grouted rock bolts installed in such layered roofs usually penetrate two or more strata and bond with them to form an integrated anchorage system. Roof failure typically initiates in the shallow strata and progressively propagates to deeper layers; thus, the mechanical properties of the rock at the free surface critically influence the overall stability of the layered roof and the load-transfer behavior of the bolts. In this study, a layered rock mass model was developed using three-dimensional particle flow code (PFC3D), and a triaxial loading scheme with a single free surface was applied to investigate the effects of free-surface rock properties, support parameters, and confining pressure on the load-bearing performance of the layered rock mass. The main findings are as follows: (1) Without support, the ultimate bearing capacity of a hard-rock-free-surface specimen is about 1.2 times that of a soft-rock-free-surface specimen. Applying support strengths of 0.2 MPa and 0.4 MPa enhanced the bearing capacity by 29–38% and 46–75%, respectively. (2) The evolution of axial stress in the bolts reflects the migration of the load-bearing core of the anchored body. Enhancing support strength improves the stress state of bolts and effectively mitigates the effects of high-stress conditions. (3) Under loading, soft rock layers exhibit greater deformation than hard layers. A hard-rock free surface effectively resists extrusion deformation from deeper soft rocks and provides higher bearing capacity. Shallow free-surface failure is significantly suppressed in anchored bodies, and “compression arch” zones are formed within multiple layers due to bolt support.
1. Introduction
Layered composite rock (LCR) refers to a stratified structure composed of two or more rock strata with significant differences in physical and mechanical properties. LCR exhibits distinctive features such as alternating soft and hard layers and varying thicknesses, which differentiate it from homogeneous rock masses. Consequently, its physical and mechanical behavior, as well as its deformation characteristics, differ substantially from those of uniform lithologies [1,2,3,4]. LCR is one of the most common formations encountered in geotechnical engineering and is widely distributed in coal mine roadways throughout China [5,6,7]. In coal mining environments, which are predominantly composed of sedimentary rocks, the roofs of drivage roadways often consist of layered composite structures. Different strata within these roofs exhibit distinct physical and mechanical properties, with marked variations in compressive strength, elastic modulus, and other relevant characteristics. The bonding strength along bedding planes is relatively weak, rendering these roofs highly susceptible to interlayer separation, sliding, and flexural deformation under the combined influence of overburden loads and horizontal tectonic stresses [8,9,10].
The physical and mechanical properties of LCR are complex, and their engineering response is influenced by factors such as the thickness of soft and hard rock layers [11], the spatial arrangement of strata [12], and the mechanical properties of bedding planes [13]. Due to the inherent contrasts among layers, incompatible deformation often arises during loading, which diminishes the overall load-bearing capacity of the rock mass. The mechanical properties of LCR, together with its deformation and failure mechanisms under loading, have therefore become a central focus of geomechanical research [14,15,16]. In coal mine roadway settings, the mechanical behavior and integrity of the free-surface rock layer play a decisive role in determining the global stability of the layered roof [17]. If the free-surface layer remains stable and intact, it can provide effective support for the overlying strata, restraining the propagation of cracks and separations into deeper layers. Accordingly, ensuring the stability of the free-surface rock has become a primary concern in roadway support design.
The support system of coal mine roadways constitutes a complex engineering scheme that results from the interaction among in situ stresses, geological conditions, and adopted reinforcement techniques [18,19]. In layered roofs, bolts often traverse multiple strata, making cross-layer anchorage a common phenomenon. Unlike end-anchored systems, fully grouted bolts bond integrally with the surrounding rock mass, enabling them to respond immediately to deformation tendencies by generating resistance, thereby offering superior adaptability and anchorage reliability in stratified environments [20,21]. The load distribution of fully grouted bolts is strongly governed by the physical and mechanical characteristics of the penetrated strata. Because the thickness and mechanical properties vary across layers, the bearing capacity and deformability of each bolt–rock interface differ, leading to a segmented distribution of load along the bolt length [22]. Therefore, the structural composition of LCR exerts a significant influence on both force transmission along the anchorage interface and the overall load-bearing performance of the support system. It is thus essential to conduct further investigations into the load-transfer behavior of bolts in LCR.
The stress loading path is also of critical importance and should not be overlooked [23,24,25,26]. After roadway excavation, a free surface develops in the layered composite roof, and the stress regime transforms from a true triaxial state to a triaxial condition with one free surface. Conventional uniaxial and triaxial compression tests cannot replicate the actual stress environment of the LCR during roadway excavation [27,28,29]. Even with sophisticated laboratory apparatus capable of reproducing realistic stress paths, it remains extremely challenging to monitor the internal stress distribution and progressive damage evolution of LCR specimens in real time. Numerical simulation provides an effective approach to overcome these limitations. The Particle Flow Code conceptualizes materials as assemblies of particles and clusters bonded through cementitious contacts, with bond breakage representing the initiation of microcracks. This method enables reliable simulation of discontinuous phenomena such as crack initiation, propagation, and disintegration. PFC further allows real-time monitoring of microcrack nucleation, coalescence into macroscopic fractures, and overall damage quantification, and has therefore been widely applied in geotechnical engineering [30,31,32,33,34]. More importantly, when bolts are incorporated into PFC models, the contacts formed between bolt particles and LCR particles can be assigned varying bond strengths, thereby simulating anchorage interfaces with distinct segmented characteristics. This provides a powerful means of investigating the segmented load-transfer mechanisms of bolts embedded in layered composite rock.
In this study, a numerical model of an LCR comprising alternating soft and hard strata was developed using PFC. The model was subjected to triaxial loading with one free surface to examine the influence of stratigraphic configuration, fully grouted bolt support parameters, and confining pressure on the load-bearing performance of LCR. The deformation and fracture mechanisms of the system were analyzed, and the evolution of load transfer along the bolt–rock anchorage interface was clarified. Based on these findings, support strategies were proposed for roadways excavated in layered composite roofs.
2. Experiment and Calibration
2.1. Calibration of Microstructural Parameters
PFC3D5.0 software is particularly effective for simulating discontinuous phenomena such as the initiation and propagation of rock fractures and instability. Accordingly, PFC3D was employed in this study to establish a numerical model of the LCR specimen and conduct tests. To ensure that the numerical responses were consistent with the physical behavior of the rock, uniaxial compression tests were first performed, and the calibrated micro-parameters derived from these tests served as the basis for subsequent simulations.
Because natural LCR specimens are difficult to obtain directly from engineering sites, cement–sand-based artificial rock-like materials were adopted to prepare the test specimens [35,36]. The LCR specimens were designed as combinations of soft and hard layers. The strengths of these two artificial rock-like materials were determined by uniaxial compression tests, and the results are listed in Table 1. Each LCR specimen measured 100 mm × 100 mm × 100 mm, with a thickness ratio of soft to hard layers of 1:1. The specimens were cast in layers, with the second layer poured 8 h after the first layer had undergone initial curing. Uniaxial compression tests were conducted using an MTS electromechanical servo universal testing machine at a loading rate of 0.2 mm/min, as illustrated in Figure 1a. A total of six specimens were tested, which exhibited consistent mechanical behavior. Representative results from three specimens are summarized in Table 1. The stress–strain curve of one LCR specimen is shown in Figure 1c. For clarity of comparison with numerical simulations, a single representative experimental curve is presented, given the high consistency observed among the specimens.

Table 1.
Mechanical parameters of soft rock, hard rock, and LCR samples.
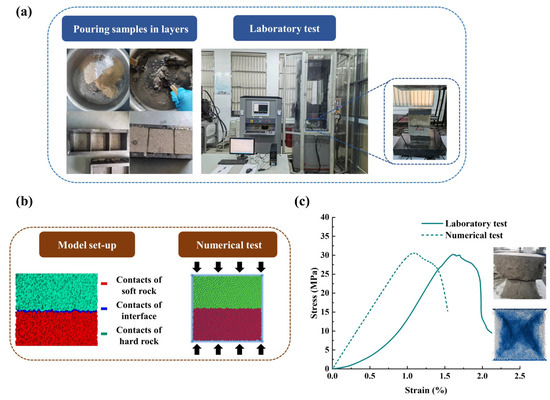
Figure 1.
Model for parameter calibration: (a) laboratory test for LCR samples; (b) numerical model for LCR samples; (c) calibration of LCR samples.
The parallel bond model was employed in the numerical simulations. To align the simulations with the laboratory tests, the model parameters were calibrated using a trial-and-error approach. A cubic uniaxial calibration model with dimensions of 100 mm × 100 mm × 100 mm was established, with a minimum radius of 1.2 mm and a maximum radius of 1.5 mm, as shown in Figure 1b, consisting of 78,644 particles. The model outputs were compared with the experimental results, and iterative parameter adjustments were performed until satisfactory agreement was achieved. In constructing the LCR model, particle properties were assigned according to the proportions of soft and hard rock. For contacts across the interfaces between layers, a FISH function was developed to reassign bonding parameters, thereby ensuring appropriate mechanical behavior at the layer boundaries. Figure 1b illustrates the grouping of contacts after redefinition.
Due to software limitations, the compression stage during sample loading cannot be effectively simulated. The comparative results between the calibrated model and experimental results are depicted in Figure 1c and Table 2, demonstrating favorable agreement between the simulated and experimental results. It should be noted that this comparison is not a curve-fitting process, but rather a calibration procedure conducted by trial-and-error to ensure that the simulated macroscopic mechanical responses. The final microstructural mechanical parameters of the model are presented in Table 3.
Table 2.
Comparison of simulated and experimental results.
Table 3.
Microstructural mechanical parameters of the model.
Bolt elements were added to the pre-calibrated layered rock mass model. The bolts were modeled using “Cluster”, which are composed of multiple spherical particles bonded together via defined inter-particle bonding parameters. In contrast to “Clamp”, where no relative deformation occurs between particles (thus making them non-failing), flexible clusters can fail when subjected to sufficient external force. Each bolt consists of 12 particles, each with a radius of 4 mm, as shown in Figure 2a. A low confining pressure was first applied through servo loading to ensure the compactness of the sample and to avoid contact breakage between bolt particles. The micro-parameters used for the bolt particles are provided in Table 3.
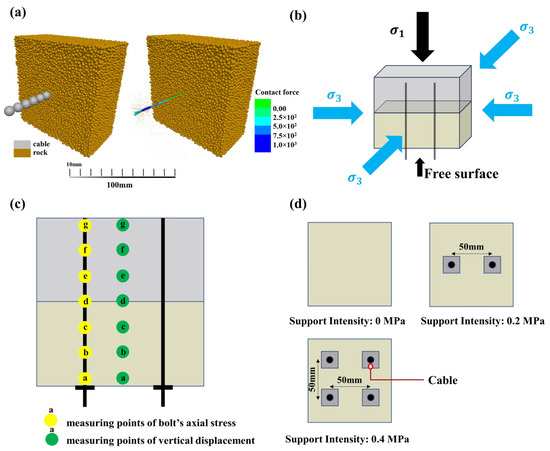
Figure 2.
Schematic diagram of the anchorage model: (a) rock bolt model and pretension application; (b) loading configuration; (c) arrangement of measurement points in the model; (d) arrangement of bolts.
To balance modeling precision and computational efficiency, the particles surrounding the bolts were not regrouped into a distinct anchorage medium. Instead, anchorage was achieved by explicitly defining contact interactions between the bolt particles and the surrounding rock particles. A custom Fish function was written to identify these contacts and assign mechanical properties according to the lithology of the adjacent rock particles. A pre-tension load of 1 kN was applied to the end particle of each bolt, and the resulting pretension diffusion effect is shown in Figure 2a.
2.2. Numerical Test Scheme
To investigate the failure process of LCR after roadway excavation and stress release, a triaxial loading model with five confined boundaries was established, as illustrated in Figure 2b. The model was loaded in three orthogonal directions, with one side left as a free surface. The confining stresses were servo-controlled at 10 MPa, 15 MPa, and 20 MPa to represent different in situ stress levels. After reaching the target stresses, the wall at the free surface was removed, and loading along the σ1 direction was continued, while the other two directions maintained their servo-controlled conditions. During the loading process, both the vertical displacement inside the model and the axial stress within the bolts were recorded. The monitoring locations are indicated in Figure 2c.
The LCR model consisted of alternating soft and hard layers in a 1:1 ratio, with either the soft rock or hard rock layer positioned at the free surface. The number of fully grouted bolts was set to 0, 2, and 4, corresponding to support intensities of 0 MPa, 0.2 MPa, and 0.4 MPa, respectively, as illustrated in Figure 2d. The detailed simulation schemes are summarized in Table 4.
Table 4.
Simulation schemes.
3. Simulation Results and Analysis
3.1. Load-Bearing Behavior and Crack Development
Figure 3 and Figure 4 illustrate the stress–strain responses and crack evolution curves of samples with soft and hard rock free surfaces, respectively. The development of cracks in the soft and hard rock regions was statistically extracted using a FISH-based tracking algorithm. As seen in Figure 3a–c and Figure 4a–c, the strength of unsupported LCR specimens increases with confining pressure, though the improvement is relatively limited. Because the triaxial five-face loading configuration includes one free surface, the rock mass tends to bulge outward toward the free surface after loading. Although increased confining pressure enhances the overall strength of the LCR, it simultaneously promotes deformation and failure at the free surface. This explains why the overall bearing capacity does not increase substantially with confining pressure. Even at 20 MPa confining pressure, the final strength of soft-rock-free-surface specimens was only 36.9 MPa, approximately 6.0 MPa greater than their uniaxial compressive strength. Thus, the strength of the free-surface layer is the key factor controlling the ultimate bearing capacity of the LCR.
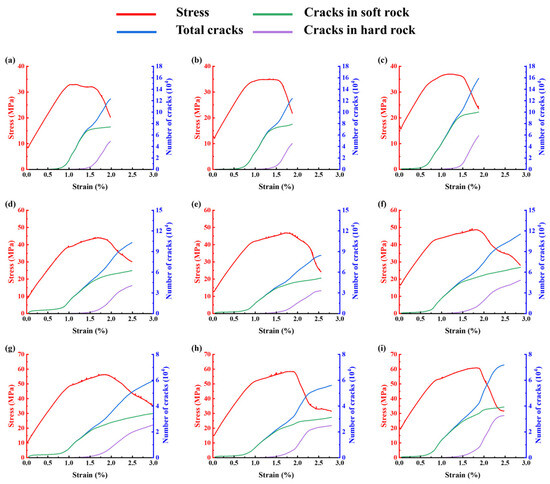
Figure 3.
Stress–strain curves and crack evolution of the LCR under soft rock free surface conditions: (a) support intensity = 0 MPa, σ3 = 10 MPa; (b) support intensity = 0 MPa, σ3 = 15 MPa; (c) support intensity = 0 MPa, σ3 = 20 MPa; (d) support intensity = 0.2 MPa, σ3 = 10 MPa; (e) support intensity = 0.2 MPa, σ3 = 15 MPa; (f) support intensity = 0.2 MPa, σ3 = 20 MPa; (g) support intensity = 0.4 MPa, σ3 = 10 MPa; (h) support intensity = 0.4 MPa, σ3 = 15 MPa; (i) support intensity = 0.4 MPa, σ3 = 20 MPa.
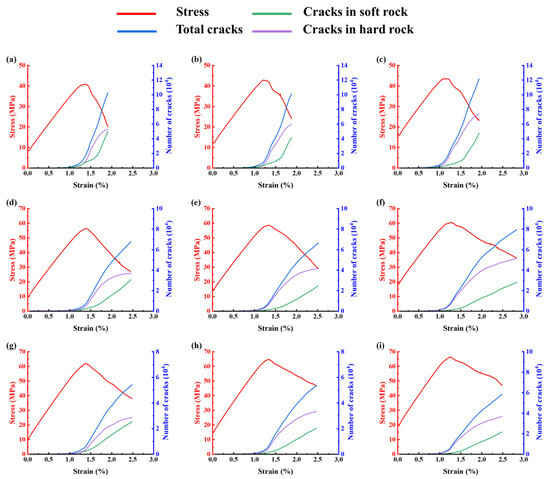
Figure 4.
Stress–strain curves and crack evolution of the LCR under hard rock free surface conditions: (a) support intensity = 0 MPa, σ3 = 10 MPa; (b) support intensity = 0 MPa, σ3 = 15 MPa; (c) support intensity = 0 MPa, σ3 = 20 MPa; (d) support intensity = 0.2 MPa, σ3 = 10 MPa; (e) support intensity = 0.2 MPa, σ3 = 15 MPa; (f) support intensity = 0.2 MPa, σ3 = 20 MPa; (g) support intensity = 0.4 MPa, σ3 = 10 MPa; (h) support intensity = 0.4 MPa, σ3 = 15 MPa; (i) support intensity = 0.4 MPa, σ3 = 20 MPa.
The crack evolution curves further demonstrate that fractures initiate preferentially in the free-surface layer. When the free surface is composed of soft rock, the soft layers undergo significant deformation under compression and bulge toward the free surface. Although the internal hard rock remains relatively intact and stable, the overall bearing structure is gradually weakened. When the free surface is composed of hard rock, its high strength leads to smaller deformations, effectively constraining the soft rock deformation within the specimen. The inability of the soft rock to expand further allows the LCR to retain structural integrity, with the soft rock sharing part of the applied load until the hard rock at the free surface ultimately fails.
Figure 3d–i and Figure 4d–i present the stress–strain responses and crack number evolution for LCR reinforced with fully grouted bolts under triaxial loading with five confined boundaries. The addition of bolts significantly enhanced the load-bearing capacity of the LCR and effectively suppressed internal crack growth. The fully bonded bolts function as additional constraints at the free surface, reducing deformation and failure in the free surface rock and improving the structural integrity of the system. Compared with the unreinforced condition, the number of cracks in the soft rock free surface specimens was reduced by 17.1–50.4%, 31.7–45.5%, and 27.6–54.7% under confining pressures of 10 MPa, 15 MPa, and 20 MPa, respectively. For hard rock free surface specimens, the corresponding reductions were 34.3–52.6%, 33.3–46.7%, and 35.2–52.3%. These findings suggest that the crack inhibition performance of fully grouted bolts remains effective under elevated stress conditions, exhibiting strong adaptability.
The influence of support intensity on the peak stress of fully bonded, cross-layer anchored LCR is shown in Figure 5. The deformation control effect of the bolts is more pronounced in soft rock than in hard rock. As a result, reinforced LCR with a soft rock free surface exhibits a greater enhancement in strength. At a support intensity of 0.4 MPa, the average increase in peak stress for soft rock free surface samples was 70.2%, while for hard rock free surface samples, it was 51.2%.
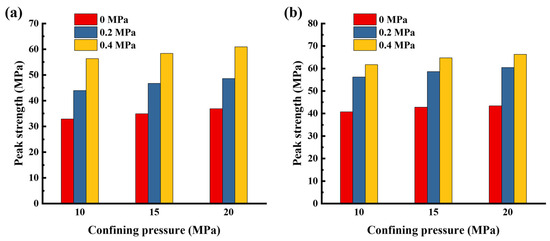
Figure 5.
Variation law of peak strength of anchored rock mass under different supporting strength: (a) soft rock free surface; (b) hard rock free surface.
3.2. Internal Vertical Displacement
Figure 6 and Figure 7 depict the distribution of vertical displacement across internal measurement points in the specimens. The monitoring points a–g in Figure 6 and Figure 7 correspond to the measurement points shown in Figure 2c. Without bolt support, the displacement decreases gradually from the free surface to the deeper layers, with the free-surface monitoring points exhibiting the largest deformations, while those in the deeper regions remain stable. As confining pressure increases, the overall deformation of the specimens also increases. The displacement trends across the monitoring points provide insights into the deformation coordination within the LCR during loading.
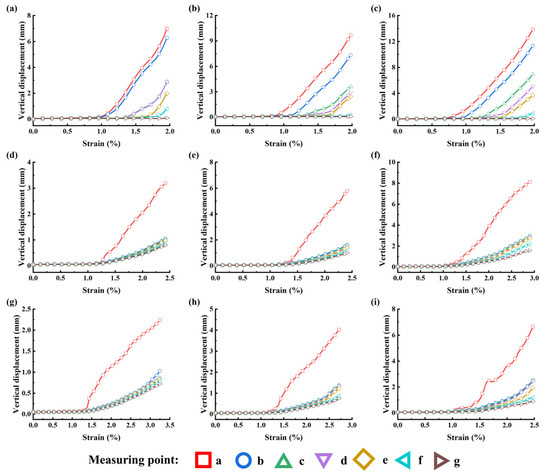
Figure 6.
Vertical displacement distribution curves of the LCR under soft rock free surface conditions: (a) support intensity = 0 MPa, σ3 = 10 MPa; (b) support intensity = 0 MPa, σ3 = 15 MPa; (c) support intensity = 0 MPa, σ3 = 20 MPa; (d) support intensity = 0.2 MPa, σ3 = 10 MPa; (e) support intensity = 0.2 MPa, σ3 = 15 MPa; (f) support intensity = 0.2 MPa, σ3 = 20 MPa; (g) support intensity = 0.4 MPa, σ3 = 10 MPa; (h) support intensity = 0.4 MPa, σ3 = 15 MPa; (i) support intensity = 0.4 MPa, σ3 = 20 MPa.
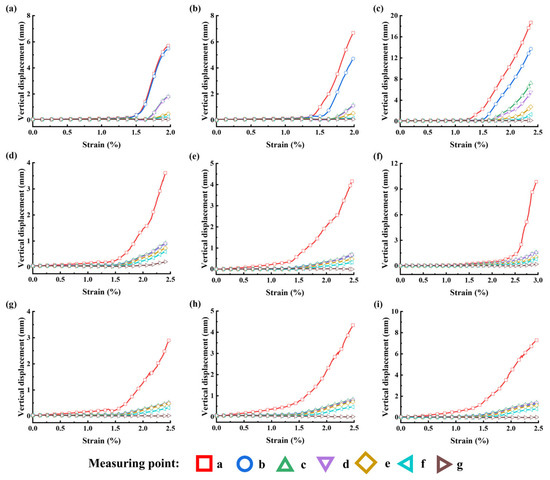
Figure 7.
Vertical displacement distribution curves of the LCR under hard rock free surface conditions: (a) support intensity = 0 MPa, σ3 = 10 MPa; (b) support intensity = 0 MPa, σ3 = 15 MPa; (c) support intensity = 0 MPa, σ3 = 20 MPa; (d) support intensity = 0.2 MPa, σ3 = 10 MPa; (e) support intensity = 0.2 MPa, σ3 = 15 MPa; (f) support intensity = 0.2 MPa, σ3 = 20 MPa; (g) support intensity = 0.4 MPa, σ3 = 10 MPa; (h) support intensity = 0.4 MPa, σ3 = 15 MPa; (i) support intensity = 0.4 MPa, σ3 = 20 MPa.
Taking the soft-rock-free-surface case as an example, the displacement values at points a and b in the free-surface soft rock differ only slightly, whereas a marked difference is observed between points b and c. This indicates the formation of delamination between these points, resulting in uncoordinated deformation. With increasing load, delamination not only occurs between b and c in the soft rock, but also gradually develops between e and f in the hard rock. Higher confining pressures exacerbate this phenomenon. Failure in LCR thus progresses from shallow to deep: after the shallow layers undergo bearing, damage, and delamination, the load is transferred to deeper layers, and the cycle continues until the entire rock mass loses its bearing capacity.
After reinforcement with bolts, delamination was confined to the shallow region between points a and b, and the displacement trends at other points became more consistent, indicating improved deformation coordination. Fully grouted bolts act as effective load-transfer elements between soft and hard rock layers, constraining their displacements relative to each other. Consequently, the two layers behave as an integrated system capable of sustaining greater loads.
3.3. Load Transfer Evolution in Fully Grouted Bolts
The axial stress of the bolts during loading was monitored using stress measurement circles. These circles calculated the average stress across all contacts within their radius. Because the circle radius was larger than that of the bolt particles, the measured values represented the average stress of both bolt–bolt contacts and bolt–rock contacts, rather than purely bolt axial stress.
The evolution of bolt axial stress under soft-rock-free-surface conditions is presented in Figure 8. The monitoring points a–g in Figure 8 and Figure 9 correspond to the measurement points shown in Figure 2c. Before the specimens reached peak stress, the axial stress of the fully grouted bolts increased gradually and then rose sharply. The stress distribution along the bolts reflects the current load-bearing state of the anchorage system. Once deformation tendencies arise within the rock mass, the fully grouted bolts immediately sense the load through the anchorage interface and develop resistance. Thus, increasing axial stress indicates that the interface at that location is actively bearing and transmitting load. The position of the maximum axial stress along the bolt can therefore be regarded as the current load-bearing core of the anchorage system.
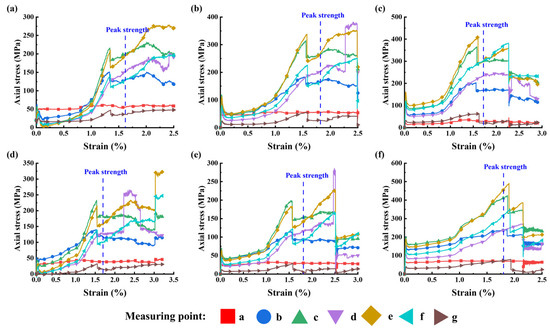
Figure 8.
Evolution of bolt axial stress in reinforced LCR under soft rock free surface conditions: (a) support intensity = 0.2 MPa, σ3 = 10 MPa; (b) support intensity = 0.2 MPa, σ3 = 15 MPa; (c) support intensity = 0.2 MPa, σ3 = 20 MPa; (d) support intensity = 0.4 MPa, σ3 = 10 MPa; (e) support intensity = 0.4 MPa, σ3 = 15 MPa; (f) support intensity = 0.4 MPa, σ3 = 20 MPa.
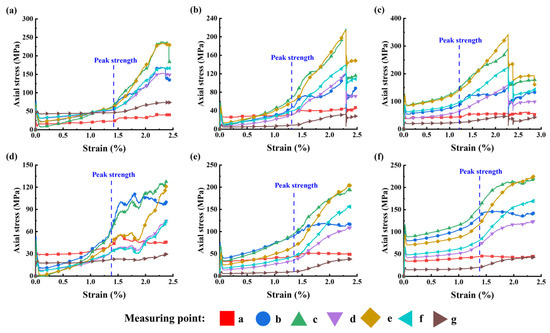
Figure 9.
Evolution of bolt axial stress in reinforced LCR under hard rock free surface conditions: (a) support intensity = 0.2 MPa, σ3 = 10 MPa; (b) support intensity = 0.2 MPa, σ3 = 15 MPa; (c) support intensity = 0.2 MPa, σ3 = 20 MPa; (d) support intensity = 0.4 MPa, σ3 = 10 MPa; (e) support intensity = 0.4 MPa, σ3 = 15 MPa; (f) support intensity = 0.4 MPa, σ3 = 20 MPa.
This phenomenon enables a detailed assessment of bolt force evolution. At 10 MPa confining pressure with a support intensity of 0.2 MPa, as shown in Figure 8a, the maximum axial stress remained at monitoring point c within the soft rock. After the reinforced specimen reached its peak strength, the maximum stress gradually shifted to point e in the hard rock. At 15 MPa confining pressure (Figure 8b), the maximum axial stress was located between points c and e, but closer to the hard rock. At 20 MPa confining pressure (Figure 8c), the maximum stress core shifted directly into the hard rock from the beginning of loading. This indicates that as confining pressure increases, deformation and failure of the free-surface soft rock intensify, reducing the effectiveness of its anchorage interface. The applied loads thus exceed its capacity, forcing the bolts to transfer resistance to the deeper, stronger hard rock layers.
When support intensity increased to 0.4 MPa, the capacity of the fully grouted bolts to control deformation was enhanced. The loads previously carried by two bolts were redistributed across four bolts, thereby improving their stress state. At 10 MPa and 15 MPa confining pressures, the soft-rock interfaces were still able to bear significant loads, showing good performance. However, at 20 MPa, the load-bearing core remained concentrated in the hard rock, indicating that the soft-rock interface could not effectively resist deformation under such high-stress conditions.
Figure 9 presents the axial stress evolution of bolts in reinforced LCR under hard-rock-free-surface conditions. In contrast to the soft rock case, where bolt stress rises rapidly before peak strain, the axial stress here increases gradually throughout the pre-peak stage. With a support intensity of 0.2 MPa, the peak axial stress remains within the hard rock region prior to failure. As the specimen enters the post-peak stage, the structural integrity of the hard rock deteriorates, causing the axial stress maximum to shift toward the soft rock. This behavior reflects the fact that the anchorage interface in the hard rock is initially strong enough to carry and transmit external loads. So long as the hard rock–bolt interface remains undamaged, the stress maximum does not shift inward. Once it moves into the soft rock, it signifies that the system has entered the failure phase. Hence, the load-bearing limit of the reinforced specimen is dictated by both the strength of the hard rock and the effectiveness of its anchorage interface. At a higher support intensity of 0.4 MPa, the load-bearing behavior of individual bolts is significantly improved. In some cases, the maximum axial stress is recorded at measurement point b near the free surface during early loading, suggesting enhanced load transfer capability.
Higher confining pressure increases the tendency of the LCR to deform and fail. Due to the differing deformation trends across various layers during loading, the stress environment of fully grouted bolts becomes more adverse, resulting in elevated axial stress levels and increased vulnerability of the anchorage interfaces. Increasing the support intensity helps to improve the mechanical response of the bolts and enhances their resistance to stress-induced damage.
The evolution pattern of axial stress in fully grouted bolts depends on the strength of the surrounding anchorage interfaces. As loading intensifies and the LCR sustains progressive damage, the bonded interface at the current load-bearing core eventually fails. Following this failure, the load-bearing core shifts deeper into the more intact and stable regions of the anchorage system.
The final load-bearing capacity of the fully reinforced system is governed by the structural integrity of the anchorage interface, with the hard rock interface being especially crucial. For reinforced LCR with a soft rock free surface, the hard rock interface lies in the deeper region. When the soft rock interface fails, the load is successfully transferred to the hard rock interface, which, due to its higher strength, is capable of sustaining elevated stress levels.
However, in the case of reinforced LCR with a hard rock free surface, the hard rock interface is located near the surface. Once this interface fails, the load shifts to the underlying soft rock interface. Since the stress at that point exceeds the capacity of the soft rock interface, the system experiences further degradation in its load-bearing performance.
3.4. Fracture Evolution
Figure 10a shows the crack development in the unsupported LCR model under soft-rock-free-surface conditions. Failure first developed in the soft rock at the free surface and along layer interfaces, while the hard rock remained intact. Under compressive loading, the central portion of the specimen bulged outward toward the free surface, initiating shear cracks at both upper corners. These eventually connected with central tensile cracks to form a crescent-shaped dominant fracture surface. The rock bounded by this surface tended to detach and spall. As confining pressure increased, crack propagation in the free-surface soft rock intensified, and multiple secondary cracks developed in addition to the dominant one. In the post-peak stage, cracks began to initiate and propagate within the hard rock. When the stress dropped to 75% of the peak load, the soft rock exhibited X-shaped conjugate fractures, while the hard rock developed multiple oblique shear fractures, some of which penetrated both soft and hard layers. These nearly parallel shear planes reflected the progressive failure process from shallow to deep. After shallow portions detached, the load was transferred to deeper strata, where new shear fractures gradually formed. This cycle repeated until complete failure, leaving a series of parallel oblique shear planes.
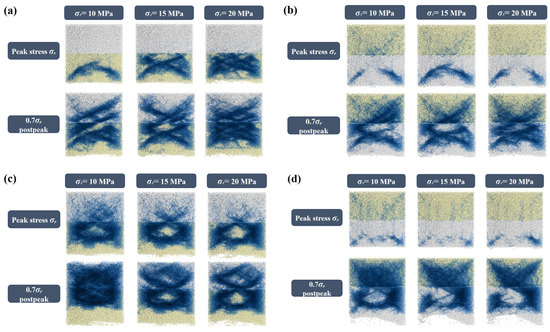
Figure 10.
Fracture evolution in the LCR model: (a) soft rock free surface, support intensity = 0 MPa; (b) hard rock free surface, support intensity = 0 MPa; (c) soft rock free surface, support intensity = 0.4 MPa; (d) hard rock free surface, support intensity = 0.4 MPa.
For hard-rock-free-surface specimens without support (Figure 10b), shear cracks also appeared in the hard rock at peak stress but did not fully penetrate, except at 15 MPa confining pressure, where a distinct dominant fracture plane formed. At this stage, microcracks also initiated within the soft rock and concentrated near the layer interfaces. In the post-peak stage, diagonal shear cracks propagated across the hard rock free surface, eventually forming an X-shaped fracture pattern. The soft rock, in turn, developed shear cracks along the interfaces, which then propagated obliquely upward as secondary fractures.
The fracture evolution of reinforced specimens is illustrated for the 0.4 MPa support condition in Figure 10c,d. Fully grouted bolts significantly suppressed crack propagation and altered the failure modes. In soft-rock-free-surface specimens, the bolts formed a “compression arch” zone near the free surface, where compressive stress enhanced stability and limited crack initiation. The central bulging deformation was also restrained. However, because the influence of bolts is spatially limited, cracks developed more readily farther away from them, especially near the specimen edges, ultimately forming a reverse crescent-shaped fracture surface that propagated inward. The reinforcement effect of fully grouted bolts extended through each anchored layer. In reinforced specimens with soft rock free surfaces, compression arch zones appeared in both soft and hard layers, indicating enhanced stability across the anchored regions. Moreover, no shear cracks penetrated across both layers, as observed in the unsupported case. Instead, the fully grouted bolts effectively bonded the strata into an integrated system, enabling joint load-bearing and greatly improving overall stability.
Figure 11 presents a comparison of the particle velocity vector fields between unreinforced and fully grouted LCR specimens after final failure. Given the similarity in failure behavior among all test cases, the analysis focuses on specimens subjected to a confining pressure of 20 MPa. For reinforced cases, only those with a support intensity of 0.4 MPa are included. In the unreinforced LCR, a significant outward movement is observed at the free surface, with the particle velocity gradually diminishing from shallow to deeper layers. The soft rock free surface exhibits more intense deformation than the hard rock case, particularly at the left side of the hard rock boundary, where localized failure is more prominent. When fully grouted bolts are introduced, both deformation and particle velocity are markedly reduced. The central region of the specimen is strongly restrained, making the left and right edges the dominant zones for deformation release. During the post-peak phase, the right end of the specimen clearly shows extrusion deformation.
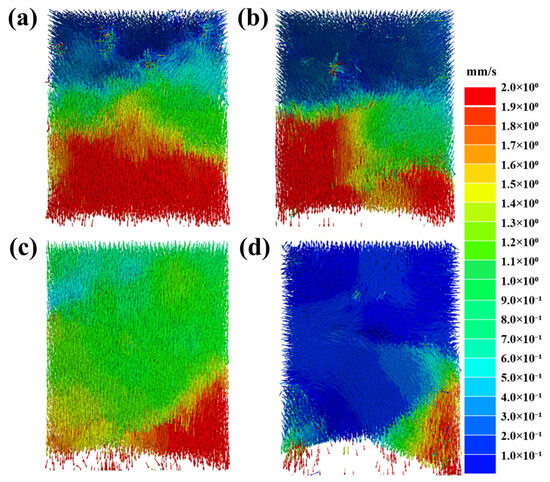
Figure 11.
Particle velocity vector field of the LCR under 20 MPa confining pressure: (a) soft rock free surface, support intensity = 0 MPa; (b) hard rock free surface, support intensity = 0 MPa; (c) soft rock free surface, support intensity = 0.4 MPa; (d) hard rock free surface, support intensity = 0.4 MPa.
Figure 12 illustrates the contact force chain network in the reinforced specimens. A noticeable arched force chain is present near the shallow portion of the free surface, representing the dispersion of bolt support force within the layered rock mass. In the case of hard rock free surface, the support force diffuses more uniformly, suggesting that stiffer rock strata enhance the effectiveness of force transmission from the bolts.
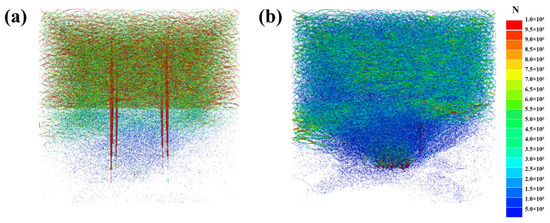
Figure 12.
Contact force chain distribution in the reinforced LCR: (a) soft rock free surface; (b) hard rock free surface.
4. Discussion
By summarizing the crack development and failure modes, it can be observed that the soft rock layers exhibit a higher density of fractures and are more prone to shear crack development, ultimately forming tensile–shear composite failures. Such composite failures often lead to spalling and detachment of rock blocks from the free surface. Therefore, in coal mine roadways, the greater the proportion of weak rock layers within the anchored section of the LCR roof, the poorer its self-supporting capacity under mining-induced and tectonic stresses. Furthermore, the tendency of soft rock to develop tensile–shear composite failures facilitates the connection of shear and tensile cracks, forming the incipient structure of a collapse arch, which may trigger large-scale roof falls.
However, the bearing performance of LCR roofs must be analyzed under varying conditions. Failure progresses progressively from shallow to deep: the shallow layers undergo bearing, damage, and delamination before the load is transferred to deeper layers, repeating the cycle until the overall capacity is exhausted. The free-surface layer almost always fractures first, meaning its strength determines the ultimate capacity of the roof. Consequently, the key to effective roadway support lies in maintaining the strength of the free-surface layer and controlling crack development, particularly when this layer consists of weak rock. High-prestress bolts and cables, together with stiff surface support elements (e.g., steel mesh), are effective solutions. The high prestress provided by bolts and cables helps restore a triaxial stress state within the free-surface layer, thereby suppressing crack propagation and enhancing its strength. At the same time, high-prestress bolts form an integrated anchorage structure within the roof, ensuring stress continuity across layers, reducing delamination, and effectively controlling surrounding rock deformation. Stiff surface support elements provide direct confinement to the roadway surface and improve the stress conditions of shallow layers. Because they resist bending and limit downward deflection of the free-surface rock, stiff elements also enhance the coordination of deformation among bolts, thus amplifying the overall effectiveness of bolt support. With increased surface support stiffness, the prestress within bolts is elevated and its diffusion range broadened, thereby strengthening the anchorage effect.
5. Conclusions
This study established a triaxial loading model with a single free surface in PFC3D to investigate the mechanical behavior of LCR under different free surface lithologies, support intensities, and confining pressures. The main conclusions are as follows:
(1) The free-surface lithology exerts a decisive influence on the overall stability of LCR. Without support, the ultimate capacity of a hard-rock-free-surface specimen was approximately 1.2 times that of a soft-rock-free-surface specimen. With fully grouted bolts, the capacity increased markedly, with increments of 29–38% and 46–75% at support intensities of 0.2 MPa and 0.4 MPa, respectively. Importantly, bolt reinforcement maintained its effectiveness in suppressing crack development and delamination even under high confining pressures.
(2) High-stress environments intensified failure and promoted uncoordinated delamination. Increasing support intensity effectively eliminated delamination and promoted coordinated deformation of both soft and hard layers. The evolution of bolt axial stress revealed shifts in the load-bearing core of the anchorage system. With increasing confining pressure, the core migrated deeper into the rock, with the hard rock layer acting as the decisive load-bearing stratum. Whether the free surface was hard or soft significantly influenced the stress evolution in bolts. Enhancing support strength improved the stress state of bolts and strengthened their resistance to high-stress conditions.
(3) Unsupported specimens developed crescent-shaped tensile–shear fractures at the free surface, serving as precursors to collapse arches. In reinforced specimens, compression arch zones formed in both shallow and deep layers, characterized by high stability and limited crack development. Furthermore, arched force chains were observed in the free-surface region of reinforced models, demonstrating the effective diffusion of bolt support forces.
Author Contributions
Investigation, Z.X. (Zhe Xiang); writing—original draft, S.J. and Y.A.; writing—review and editing, Y.A. and Z.X. (Zhengzheng Xie); methodology, Z.X. (Zhe Xiang); funding acquisition, Y.Z. All authors have read and agreed to the published version of the manuscript.
Funding
This research was financially supported by the Support Program for Youth Innovation and Entrepreneurship in Higher Education Institutions of Shandong Province (Grant No. 2022KJ101), the National Natural Science Foundation of China (52274146) and the Scientific Research and Innovation Team of Jining University (24KCTD12).
Data Availability Statement
The original contributions presented in this study are included in the article. Further inquiries can be directed to the corresponding author.
Conflicts of Interest
The authors declare no conflicts of interest.
References
- Tien, Y.M.; Kuo, M.C.; Juang, C.H. An experimental investigation of the failure mechanism of simulated transversely isotropic rocks. Int. J. Rock Mech. Min. Sci. 2006, 43, 1163–1181. [Google Scholar] [CrossRef]
- Zhang, J.C. Borehole stability analysis accounting for anisotropies in drilling to weak bedding planes. Int. J. Rock Mech. Min. Sci. 2013, 60, 160–170. [Google Scholar] [CrossRef]
- Li, J.G.; Yu, Z.Q.; Zhou, Z.Y.; Wang, Y.C.; Li, J.W. Mechanical analysis and failure modes prediction of composite rock under uniaxial compression. Sci. Rep. 2021, 11, 22826. [Google Scholar] [CrossRef] [PubMed]
- Zhang, T.; Chen, Q.Z.; Zhang, J.Z.; Zhou, X.P. Influences of Mechanical Contrast on Failure Characteristics of Layered Composite Rocks Under True–Triaxial Stresses. Rock Mech. Rock Eng. 2023, 56, 5363–5381. [Google Scholar] [CrossRef]
- Zhao, Z.H.; Wang, W.M.; Wang, L.H.; Dai, C.Q. Compression–shear strength criterion of coal–rock combination model considering interface effect. Tunn. Undergr. Space Technol. 2015, 47, 193–199. [Google Scholar] [CrossRef]
- Chen, Y.L.; Zuo, J.P.; Liu, D.J.; Wang, Z.B. Deformation failure characteristics of coal–rock combined body under uniaxial compression: Experimental and numerical investigations. Bull. Eng. Geol. Environ. 2019, 78, 3449–3464. [Google Scholar] [CrossRef]
- He, Z.; Xie, Z.Z.; Zhang, N.; Han, C.L.; Xiang, Z.; Yan, G.J.; Qiao, H.X.; Shao, C.Y. Research on Spatiotemporal Evolution Law of Surrounding Rock Fractures and Hierarchical Collaborative Control Technology in High–stress Soft Rock Roadway: A Case Study. Eng. Fail. Anal. 2023, 150, 107366. [Google Scholar] [CrossRef]
- Jiang, L.S.; Ma, N.J.; Bai, L.; Li, Y.J.; Zhang, L. Deformation and failure characteristics and roof caving hidden danger classification of roadways compound roof. J. China Coal Soc. 2014, 39, 1205–1211. [Google Scholar] [CrossRef]
- Hu, S.C. Characteristics and mechanism of deformation and failure of layered surrounding rock mass in deep roadway. Chin. J. Rock Mech. Eng. 2015, 34, 2376. [Google Scholar] [CrossRef]
- Xie, Z.Z.; Zhang, N.; Feng, X.W.; Liang, D.Y.; Wei, Q.; Weng, M.Y. Investigation on the evolution and control of surrounding rock fracture under different supporting conditions in deep roadway during excavation period. Int. J. Rock Mech. Min. Sci. 2019, 123, 104122. [Google Scholar] [CrossRef]
- Ma, Q.; Tan, Y.L.; Liu, X.S.; Gu, Q.H.; Li, X.B. Effect of coal thicknesses on energy evolution characteristics of roof rock–coal–floor rock sandwich composite structure and its damage constitutive model. Compos. Part B Eng. 2020, 198, 108086. [Google Scholar] [CrossRef]
- Liu, X.S.; Tan, Y.L.; Ning, J.G.; Lu, Y.W.; Gu, Q.H. Mechanical properties and damage constitutive model of coal in coal–rock combined body. Int. J. Rock Mech. Min. Sci. 2018, 110, 140–150. [Google Scholar] [CrossRef]
- Guo, L.W.; Latham, J.P.; Xiang, J.S. A numerical study of fracture spacing and through–going fracture formation in layered rocks. Int. J. Solids Struct. 2017, 110, 44–57. [Google Scholar] [CrossRef]
- Lin, Q.B.; Cao, P.; Wen, G.P.; Meng, J.J.; Cao, R.H.; Zhao, Z.Y. Crack coalescence in rock–like specimens with two dissimilar layers and pre–existing double parallel joints under uniaxial compression. Int. J. Rock Mech. Min. Sci. 2021, 139, 104621. [Google Scholar] [CrossRef]
- Zhang, H.W.; Elsworth, D.; Wan, Z.J. Failure response of composite rock–coal samples. Geomech. Geophys. Geo-Energy Geo-Resour. 2018, 4, 175–192. [Google Scholar] [CrossRef]
- Li, W.F.; Bai, J.B.; Cheng, J.Y.; Peng, S.D.; Liu, H.L. Determination of coal–rock interface strength by laboratory direct shear tests under constant normal load. Int. J. Rock Mech. Min. Sci. 2015, 77, 60–67. [Google Scholar] [CrossRef]
- Sun, Y.T.; Bi, R.Y.; Sun, J.B.; Zhang, J.F.; Taherdangkoo, R.; Huang, J.D.; Li, G.C. Stability of roadway along hard roof goaf by stress relief technique in deep mines: A theoretical, numerical and field study. Geomech. Geophys. Geo-Energy Geo-Resour. 2022, 8, 45. [Google Scholar] [CrossRef]
- Wu, Y.Z. Application research of full-length prestressed anchorage strong support system. Coal Sci. Technol. 2011, 39, 27–30+35. [Google Scholar]
- Sun, Y.T.; Wang, S.; Li, G.C.; Han, C.L.; Hao, H.R.; Li, J.H.; Zhao, H.S. Research and application of spatial distribution law of additional compressive stress field in surrounding rock of bolt support. J. China Coal Soc. 2025, 50, 2940–2960. [Google Scholar] [CrossRef]
- Wang, H.T.; Wang, Q.; Jiang, J.P.; Li, S.C.; Liu, P.; Yang, Y.; Zhang, X.; Yang, S.B. Research on mechanism and application of full-length prestressed grouting anchor support in deep roadway. J. Min. Saf. Eng. 2019, 36, 670–677+684. [Google Scholar] [CrossRef]
- Kang, H.P. Support technologies for deep and complex roadways in underground coal mines: A review. Int. J. Coal Sci. Technol. 2014, 1, 261–277. [Google Scholar] [CrossRef]
- Lu, T.K.; Dai, Y.H. Working characteristics of full-length bonded anchor bolt in layered roof of mining gateway. Chin. J. Rock Mech. Eng. 2010, 29, 3329–3335. [Google Scholar]
- Wang, P.; Zhang, N.; Kan, J.G.; Wei, Q.; Xie, Z.Z.; Li, A.R.; He, Z.; Qi, J.H.; Xu, X.L.; Duan, C.R. Accumulated damage failure mechanism of anchoring structures under cyclic impact disturbance. Int. J. Min. Sci. Technol. 2024, 34, 1693–1709. [Google Scholar] [CrossRef]
- Wu, X.Z.; Jiang, Y.J.; Gong, B.; Guan, Z.C.; Deng, T. Shear Performance of Rock Joint Reinforced by Fully Encapsulated Rock Bolt Under Cyclic Loading Condition. Rock Mech. Rock Eng. 2019, 52, 2681–2690. [Google Scholar] [CrossRef]
- Li, D.Q.; Masoumi, H.; Hagan, P.C.; Saydam, S. Experimental and analytical study on the mechanical behaviour of cable bolts subjected to axial loading and constant normal stiffness. Int. J. Rock Mech. Min. Sci. 2019, 113, 83–91. [Google Scholar] [CrossRef]
- Sun, Y.; Bi, R.; Chang, Q.; Taherdangkoo, R.; Zhang, J.; Sun, J.; Huang, J.; Li, G. Stability Analysis of Roadway Groups under Multi-Mining Disturbances. Appl. Sci. 2021, 11, 7953. [Google Scholar] [CrossRef]
- Zhou, X.P.; Zhang, J.Z.; Wong, L. Experimental study on the growth, coalescence and wrapping behaviors of 3Dcrossembedded flaws under uniaxial compression. Rock Mech. Rock Eng. 2018, 51, 1379–1400. [Google Scholar] [CrossRef]
- Zhao, Y.; Bi, J.; Wang, C.L.; Liu, P.L. Effect of unloading rate on the mechanical behavior and fracture characteristics of sandstones under complex triaxial stress conditions. Rock Mech Rock Eng. 2021, 54, 4851–4866. [Google Scholar] [CrossRef]
- Wu, G.S.; Yu, W.J.; Zuo, J.P.; Li, C.Y.; Du, S.H. Experimental investigation on rock–burst behavior of the rock–coal–bolt specimen under different stress conditions. Sci. Rep. 2020, 10, 7556. [Google Scholar] [CrossRef]
- Shi, C.; Zhang, Q.; Wang, S.N. Numerical Simulation Technology and Application with Particle Flow Code(PFC5.0). Rock Soil Mech 2018, 39, 43. [Google Scholar]
- Duan, K.; Kwok, C.Y.; Tham, L.G. Micromechanical analysis of the failure process of brittle rock. Int. J. Numer. Anal. Methods Geomech. 2015, 39, 618–634. [Google Scholar] [CrossRef]
- Valdez, A.V.; Morel, S.; Marache, A.; Hinojosa, M.; Riss, J. Influence of fracture roughness and micro-fracturing on the mechanical response of rock joints: A discrete element approach. Int. J. Fract. 2018, 213, 87–105. [Google Scholar] [CrossRef]
- Yang, S.Q.; Tian, W.L.; Jing, H.W.; Huang, Y.H.; Yang, X.X.; Meng, B. Deformation and Damage Failure Behavior of Mudstone Specimens Under Single-Stage and Multi-stage Triaxial Compression. Rock Mech. Rock Eng. 2019, 52, 673–689. [Google Scholar] [CrossRef]
- Yin, P.F.; Yang, S.Q. Discrete Element Modeling of Strength and Failure Behavior of Transversely Isotropic Rock under Uniaxial Compression. J. Geol. Soc. India 2019, 93, 235–246. [Google Scholar] [CrossRef]
- Chen, X.; Liao, Z.H.; Peng, X. Deformability characteristics of jointed rock masses under uniaxial compression. Int. J. Min. Sci. Technol. 2012, 22, 213–221. [Google Scholar] [CrossRef]
- Yang, X.X.; Jing, H.W.; Tang, C.A.; Yang, S.Q. Effect of parallel joint interaction on mechanical behavior of jointed rock mass models. Int. J. Rock Mech. Min. Sci. 2017, 92, 40–53. [Google Scholar] [CrossRef]
Disclaimer/Publisher’s Note: The statements, opinions and data contained in all publications are solely those of the individual author(s) and contributor(s) and not of MDPI and/or the editor(s). MDPI and/or the editor(s) disclaim responsibility for any injury to people or property resulting from any ideas, methods, instructions or products referred to in the content. |
© 2025 by the authors. Licensee MDPI, Basel, Switzerland. This article is an open access article distributed under the terms and conditions of the Creative Commons Attribution (CC BY) license (https://creativecommons.org/licenses/by/4.0/).