Article

Experimental Study on Damage and Degradation Mechanism of Biotite Granulite Under Freeze–Thaw Action

1
College of Mining Engineering, North China University of Science and Technology, Tangshan 063210, China
2
Hebei Provincial Laboratory of Mining Industry Development with Safe Technology Priority, Tangshan 063210, China
3
Hebei Green Intelligent Mining Technology Innovation Center, Tangshan 063210, China
4
Hebei Industrial Technology Institute of Mine Ecological Remediation, North China University of Science and Technology, Tangshan 063210, China
*
Author to whom correspondence should be addressed.
Appl. Sci. 2025, 15(17), 9665; https://doi.org/10.3390/app15179665
Submission received: 12 July 2025 / Revised: 18 August 2025 / Accepted: 29 August 2025 / Published: 2 September 2025
(This article belongs to the Special Issue Rock Mechanics and Mining Engineering)

Abstract

With the increasing intensity of resource development in alpine regions, numerous geotechnical engineering problems in cold regions have become increasingly prominent. In order to explore the damage and deterioration laws of rocks caused by freeze–thaw action, this paper takes the biotite granulite on the eastern slope of Yanshan Iron Mine as the research object. By analyzing the changes in mechanical and acoustic emission parameters of rock samples after freeze–thaw, and combining with existing freeze–thaw damage theories, the suitable freeze–thaw damage mechanism for this rock is further explored, and a freeze–thaw damage model for biotite granulite with low and high freeze–thaw cycles is established. The results of this study demonstrate that biotite granulite subjected to a lower number of freeze–thaw cycles exhibits significantly greater reductions in peak strength, elastic modulus, acoustic emission (AE) hit counts, cumulative ringing counts, and cumulative energy compared with specimens exposed to a higher number of cycles. As the freeze–thaw cycles increase, the formation of newly generated large-scale fractures during failure becomes progressively less pronounced, leading to a diminished resistance to deformation and a gradual increase in plastic deformation during loading. A coupled damage variable relationship was established for biotite granulite under both low and high freeze–thaw regimes based on cumulative AE ringing counts. In the early three stress stages, specimens subjected to fewer cycles exhibited fewer microcracks, with no clear spatial correlation between their distribution and the eventual fracture coalescence zones, whereas specimens exposed to a higher number of cycles showed a distinct sequential relationship between microcrack initiation sites and subsequent crack coalescence. Building upon existing freeze–thaw damage theories, the freeze–thaw damage mechanism specific to biotite granulite was further elucidated. Accordingly, a freeze–thaw damage model for low- and high-cycle conditions was developed and preliminarily validated.

1. Introduction

China is one of the countries with the most extensive distribution of cold regions in the world. Including seasonally frozen ground, cold regions cover approximately 70% of the country’s territory. Engineering, construction, and resource development in these areas play a significant role in the national economy [1]. In the process of repeated freezing and thawing due to seasonal changes or day and night alternation, the development [2,3,4], expansion, and increase in cracks in the rock lead to the instability and destruction of the rock structure, thereby causing freeze–thaw disasters such as rock slope landslides and tunnel rock frost heave cracking [5]. Therefore, freeze–thaw action has become one of the important factors affecting the construction and operation of cold region projects [6,7].
At present, many scholars have carried out a large number of experimental studies on the influence of freeze–thaw action on rock damage characteristics [8,9]. It is believed that the physical and mechanical parameters of rock [10], such as compressive strength, tensile strength [11], elastic modulus, longitudinal wave velocity, acoustic emission characteristic parameters, nuclear magnetic parameters [12], and CT parameters, show different change trends with the increase in freeze–thaw cycles [13]. Based on the change characteristics of each parameter [14], a constitutive model of rock freeze–thaw load damage degradation was established [15]. The elastic modulus is considered one of the most commonly used parameters to characterize freeze–thaw damage in rocks. Based on statistical damage mechanics and strain equivalence principles [16], many scholars have used elastic modulus to characterize rock freeze–thaw damage variables and constructed damage models with different freeze–thaw cycles and different freezing temperatures [17]. Moreover, Fang et al. [18] introduced the relationship between elastic modulus [19], peak strength [20], and peak strain and the times of freeze–thaw cycles and established a load damage model for rocks after freeze–thaw cycles [21]. At present, the main research methods for rock damage degradation include nuclear magnetic resonance [22], electronic scanning [23], CT scanning [24], and acoustic emission dynamic monitoring technology [25]. Acoustic emission technology is an effective method for real-time detection of microcrack signals in rocks [26]. It can effectively monitor the propagation of internal cracks during the loading and failure process of rocks [27] and is now widely used in the field of rock mechanics experimental research [28]. Based on acoustic emission signals during the loading process [29], the crack propagation patterns in rocks subjected to freeze–thaw cycles can be investigated. [30]. By analyzing the parameters such as acoustic emission energy rate [31], event rate [32], amplitude, and frequency during the damage evolution of frozen-thaw rocks [33]. The results indicate that the acoustic emission energy rate and event rate can effectively reflect the development of cracks in rocks. Momeni et al. [34] hold that the longitudinal wave velocity cannot be a physical quantity for describing the damage characteristics of hard rock under freeze–thaw cycles. This is because the direct indicators of hard rock (strength and porosity) significantly decline after freeze–thaw cycles, but the longitudinal wave velocity does not show obvious changes, indicating that the sensitivity of the longitudinal wave velocity of hard rock to freeze–thaw cycles is relatively low. Furthermore, for hard rock, multi-parameter or direct indicators should be adopted to describe the degree of freeze–thaw damage and deterioration. Gao et al. [35] studied the energy dissipation law of rocks after freeze–thaw cycles, indicating that the total strain energy, elastic energy, and dissipated energy of rocks after freeze–thaw cycles first increase and then decrease with the increase in the freeze–thaw cycle period. Moreover, the change of the dissipated energy ratio also varies in different freeze–thaw cycle stages. In the early stage of freeze–thaw, the dissipated energy ratio first increases and then decreases, and in the later stage, the dissipated energy ratio continues to decline linearly. Wang et al. [36] investigated the acoustic emission signal characteristics of granite under freeze–thaw cycles and found that as the freeze–thaw cycle period increased, the cumulative acoustic emission count and cumulative acoustic emission energy of granite showed a downward trend, with the low-frequency band width gradually decreasing and the high-frequency band width gradually increasing. This indicates that the pore structure of the rock developed and the crack information increased after freeze–thaw cycles. A sudden drop in the dynamic b-value suggests that large-scale cracking has occurred within the rock specimen [37], and the crack type transitions from shear cracks to tensile cracks [38]. The combination of acoustic emission and nuclear magnetic resonance techniques enables the investigation of crack propagation patterns at different scales, which is of great significance for gaining deeper insight into the crack evolution and damage mechanisms in rocks during loading [39]. Yang et al. [40] studied the characteristics of acoustic emission signals of sandstone during the melting stage and found that the four stages of stress changes in sandstone during the melting stage (closure stress, initiation stress, damage stress, and peak stress) respectively correspond to the calm period, growth period, frequent period, sharp increase period, and decline period of acoustic emission signals. With the increase in temperature, the variation range of acoustic emission signals is relatively small during the calm period and the sharp increase period, while it is more obvious during the growth period, the frequent period, and the decline period. The freeze–thaw cycle and crack inclination have an important influence on the rock crack propagation path [41], rock sample strength, deformation, and acoustic emission mode, and rock bridge fracture behavior [42]. Acoustic emission detection technology combined with CT scanning technology can reveal the fracture characteristics of rock bridges during the entire deformation process [43]. Based on the acoustic emission signals during the loading process of freeze–thaw rocks, the propagation patterns of cracks at different scales are studied, which is of great significance for further understanding the crack evolution and damage deterioration mechanisms in freeze–thaw rocks under load.
The above research results have an important role in the development of freeze–thaw damaged rock mechanics; these studies are mostly based on sandstone, granite, limestone, etc., with high homogeneity. However, the rock mass structure with obvious anisotropy, such as bedding, has a practical significance for the stability of the engineering. Therefore, this paper takes the biotite granulite on the east slope of Yanshan Iron Mine as the research object. By analyzing the change of the mechanical and acoustic emission parameters of the rock samples after freeze–thaw, the freeze–thaw damage mechanism is suitable for this study rock based on the freeze–thaw damage theory. Moreover, a freeze–thaw damage model of biotite granulite with low and high freeze–thaw cycles is established, in order to evaluate the freeze–thaw rock damage degradation and rock engineering stability.

2. Sample Preparation and Experimental Plan

2.1. Sample Collection and Preparation

The biotite granulite samples were taken from the eastern slope of Yanshan Iron Mine of Hebei Iron and Steel Group Mining Company. The mine site is located in a seasonal freeze–thaw zone, with the lowest temperature of −25 °C in winter and the highest temperature of 40 °C in summer. The eastern slope of the mine is close to the Xinhe River. The rock mass of the slope is in a water immersion all year round, and groundwater has a significant impact on the slope stability of the weathered rock. In order to avoid the influence of weather factors on the selection of rock samples, the fresh rock blocks of about 0.50m are taken in this paper, and the rock blocks are depth marked, wrapped, and then sent to the school for processing into standard specimens.
The rock blocks taken on site were processed into standard cylindrical samples of φ50 mm × 100 mm. The processing accuracy met the requirements of the “Rock Test Regulations for Water Conservancy and Hydropower Engineering” (published at the time). The bedding inclination of the slope is about 45°. Therefore, the inclination is set to 45° when the rock sample is processed. Before the formal test begins, the rock samples are pre-experimented to provide a basis for the grouping of the formal test and the determination of the number of freeze–thaw times. Some rock blocks and standard rock samples are shown in Figure 1.
After the rock specimens were prepared, those with obvious surface defects were discarded. The longitudinal wave velocity of the specimens was then measured using a ZBL-U5100 non-metallic ultrasonic detector (Beijing Zhibolian Company, manufactured in Beijing, China), and 64 specimens with similar wave velocities were selected. The purpose was to reduce the differences between rock samples and ensure the reliability of subsequent test results. The dry rock samples were placed in a drying box and dried continuously at 105 °C for 48 h. Rock samples were weighed using a 0.01 g high-precision electronic scale. The drying test was stopped when the mass of the rock sample did not change. The rock specimens were saturated with water using a vacuum saturation device. The rock sample was saturated with water at 0.10 MPa for 12 h, then the saturation instrument was turned off. After the rock sample was soaked at standard atmospheric pressure for 48 h, the rock sample was taken out, and the surface water was wiped off. The basic parameters of the biotite granulite samples are shown in Table 1.
Rocks are formed by the arrangement and combination of multiple minerals. Changes in mineral composition, arrangement, and pore and crack structure can lead to changes in the physical and mechanical properties of rocks. In order to understand the mineral composition, mineral content, and pore and crack orientation of biotite granulite, a polarizing microscope and the X-ray diffraction test (XRD) were used to determine the mineral composition and crystal structure of the rock. The polarizing microscope was used to determine the crack orientation on the surface, and the characteristics of its primary crack structure were analyzed.
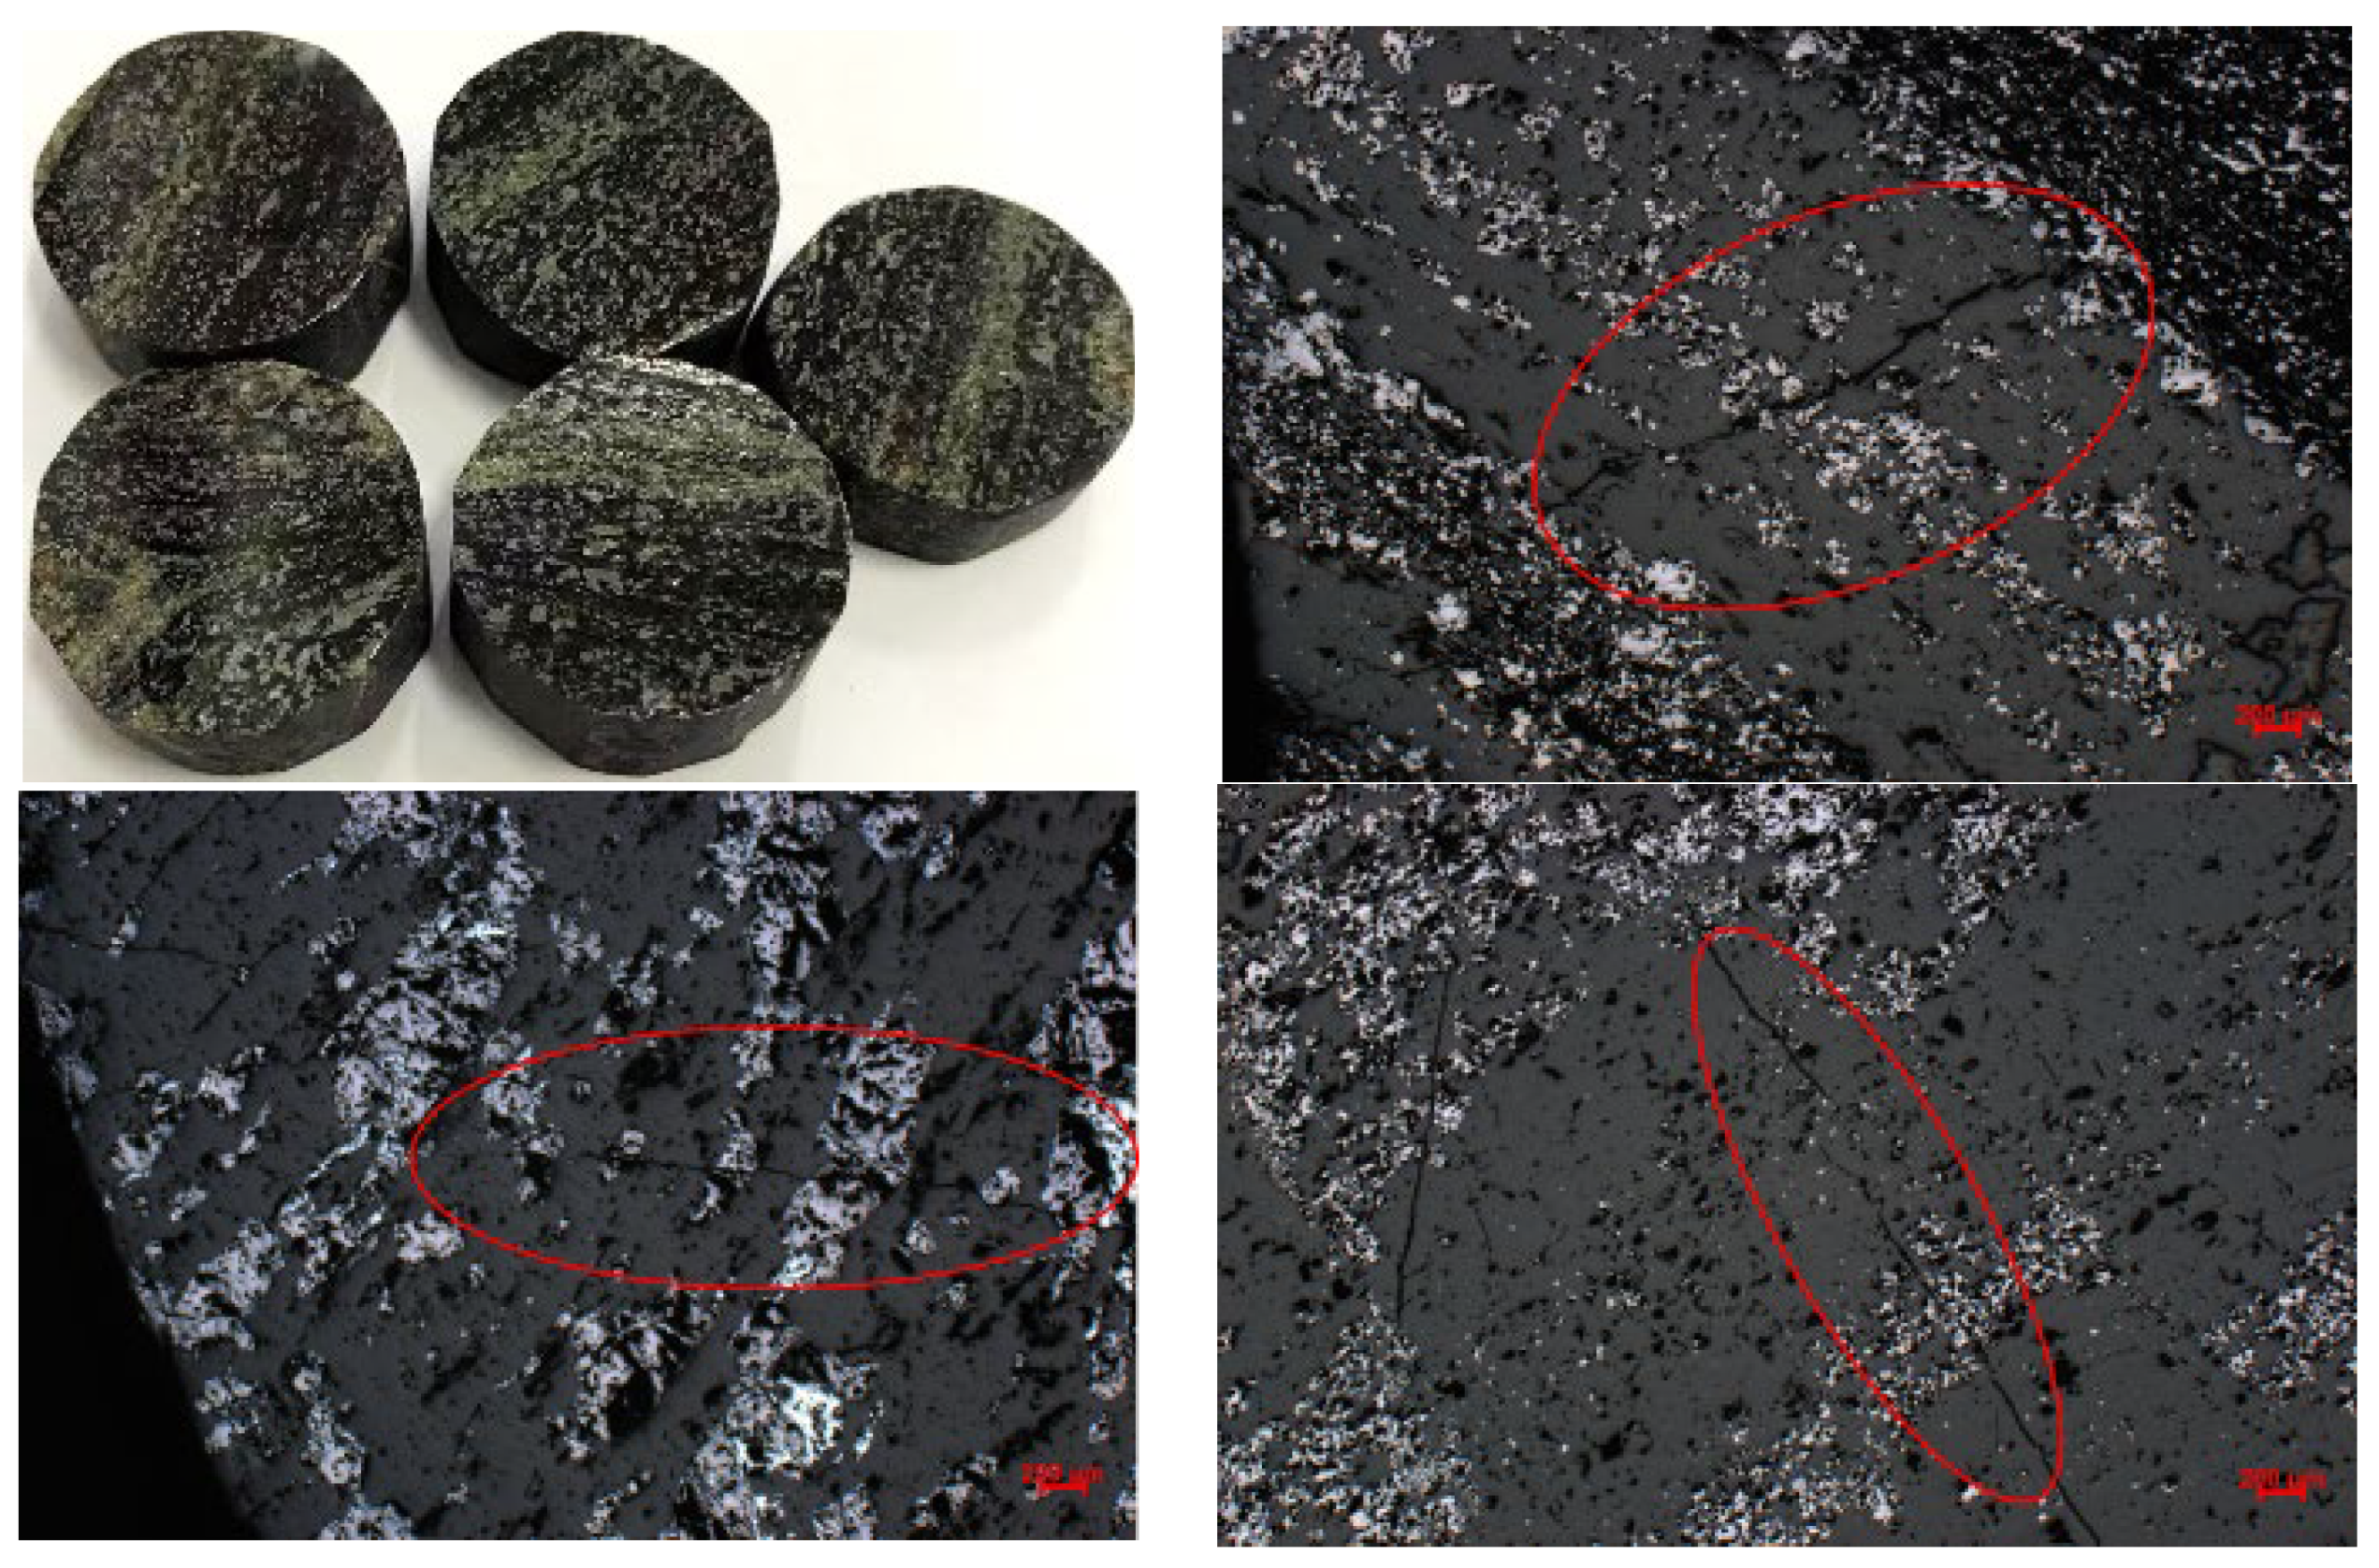
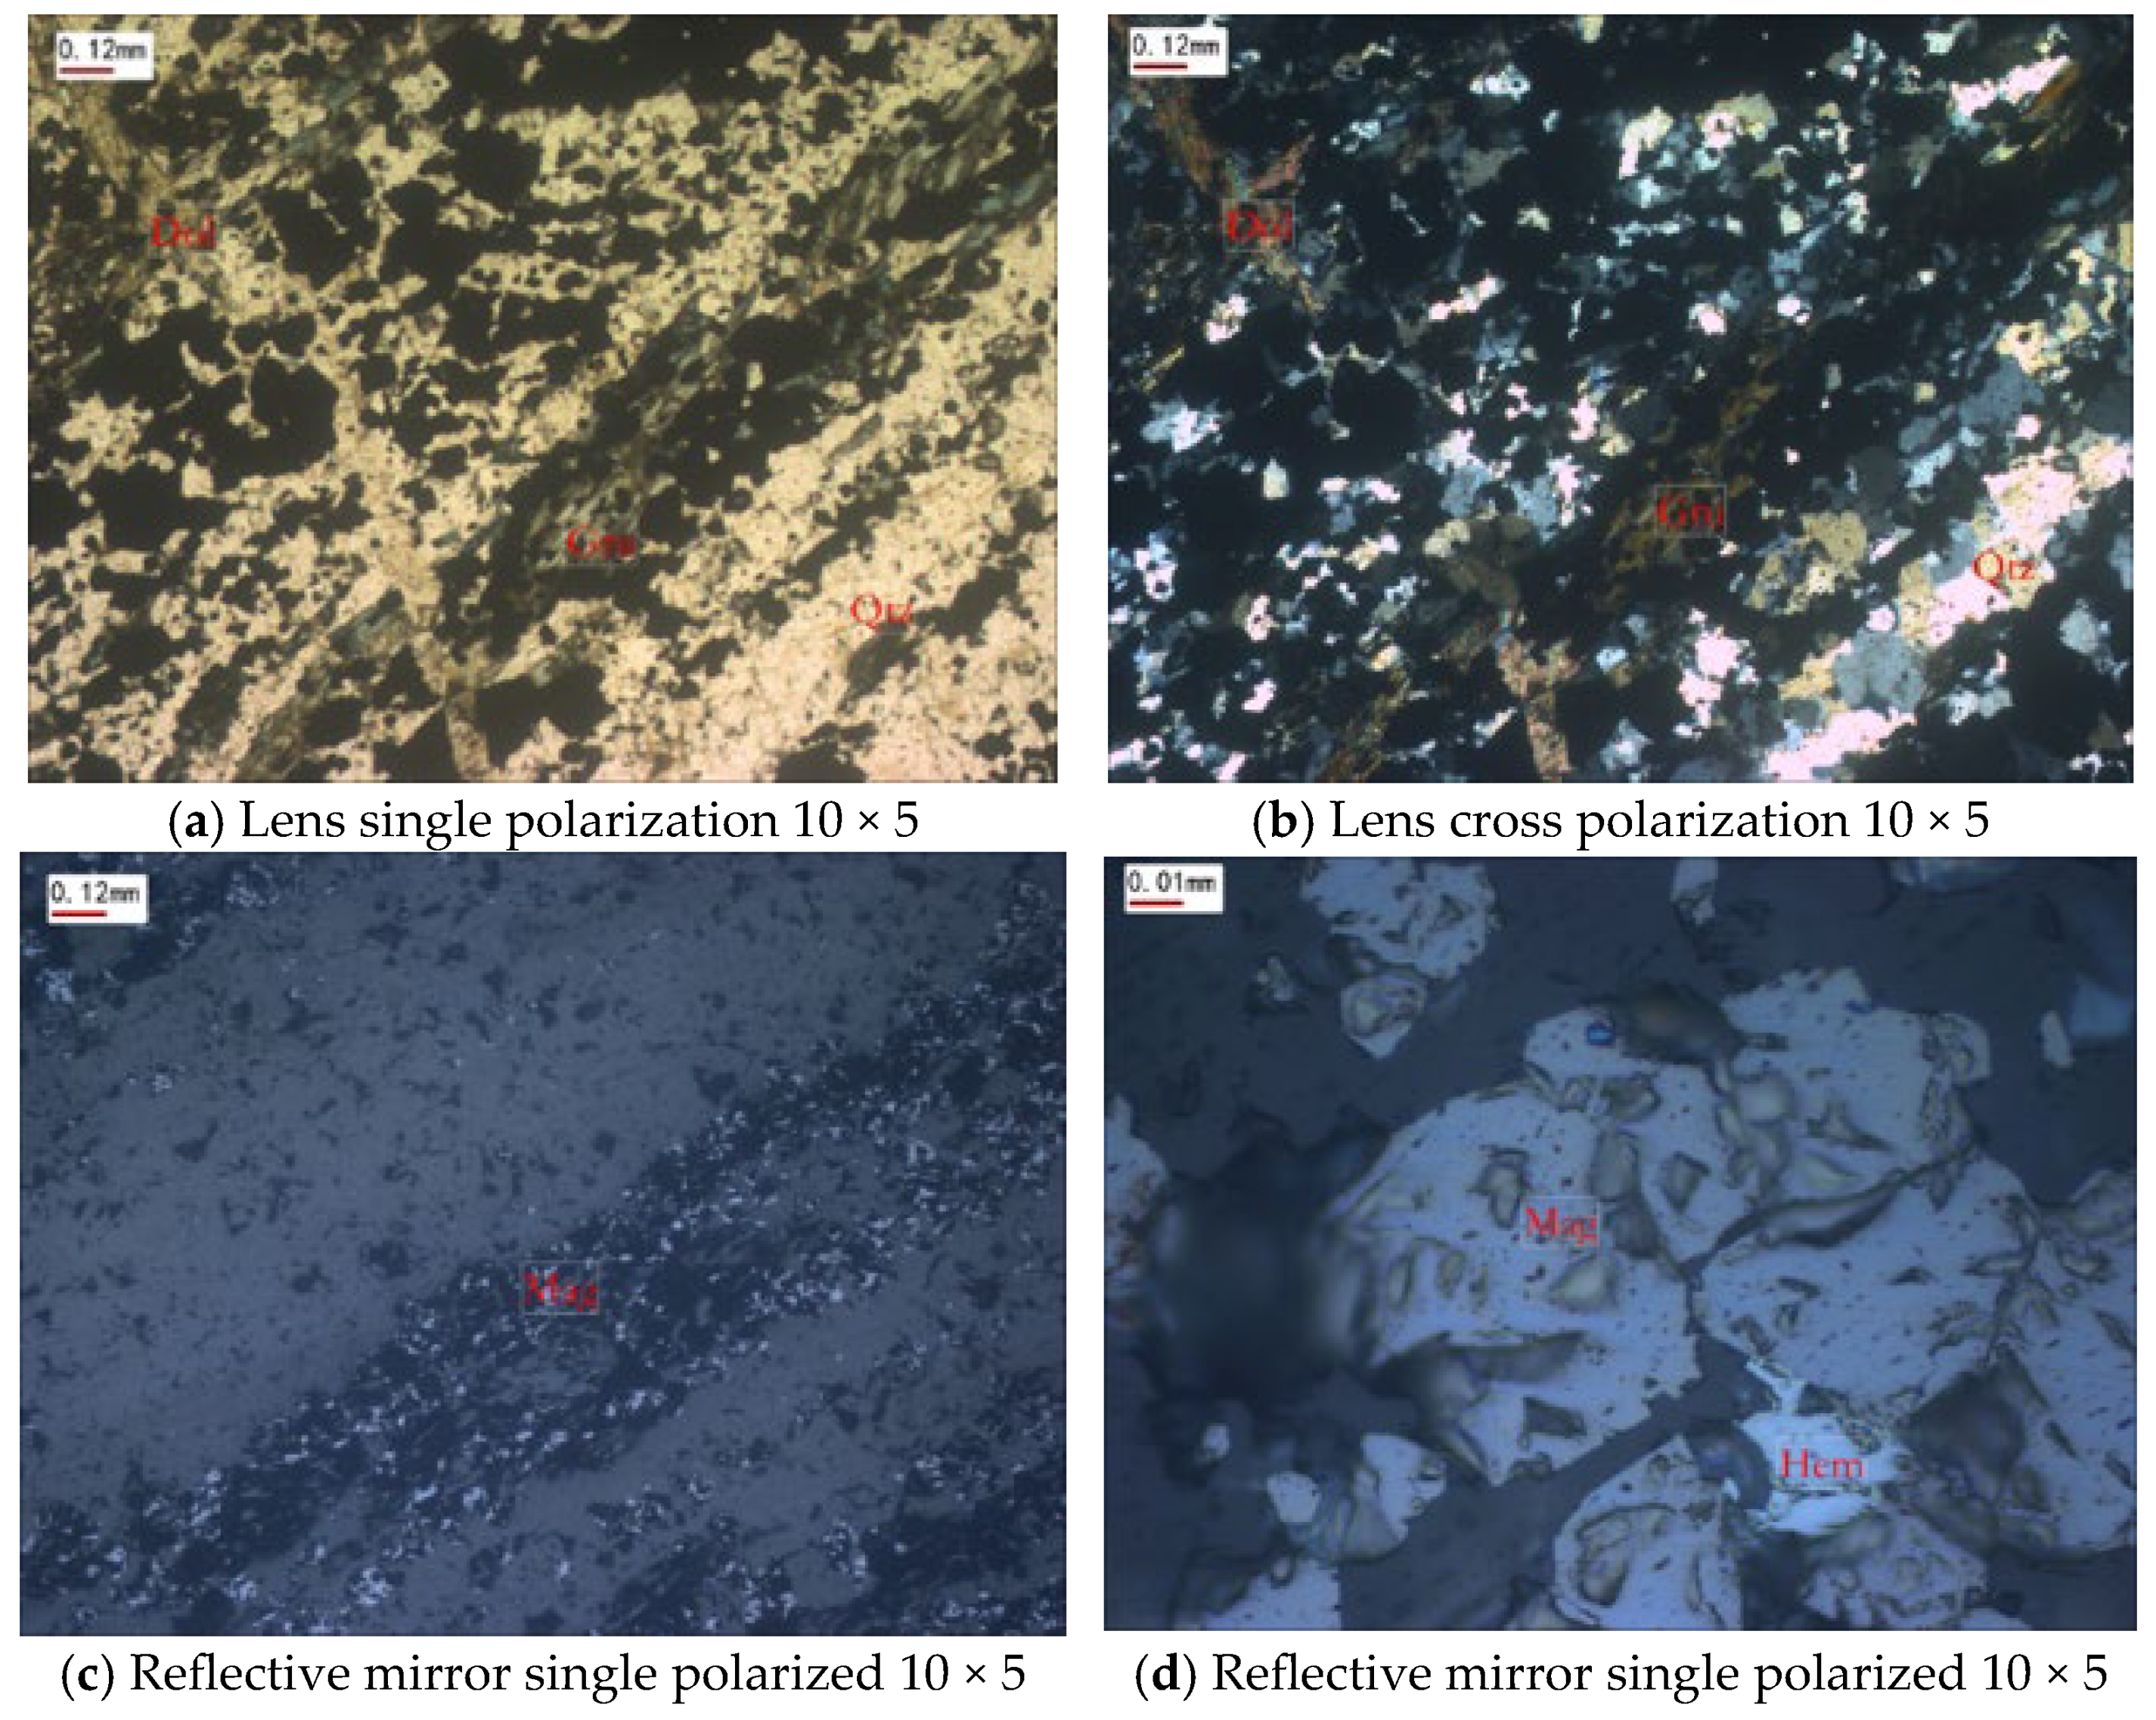
The biotite granulite was observed using a polarizing microscope, and the results are shown in Figure 2.
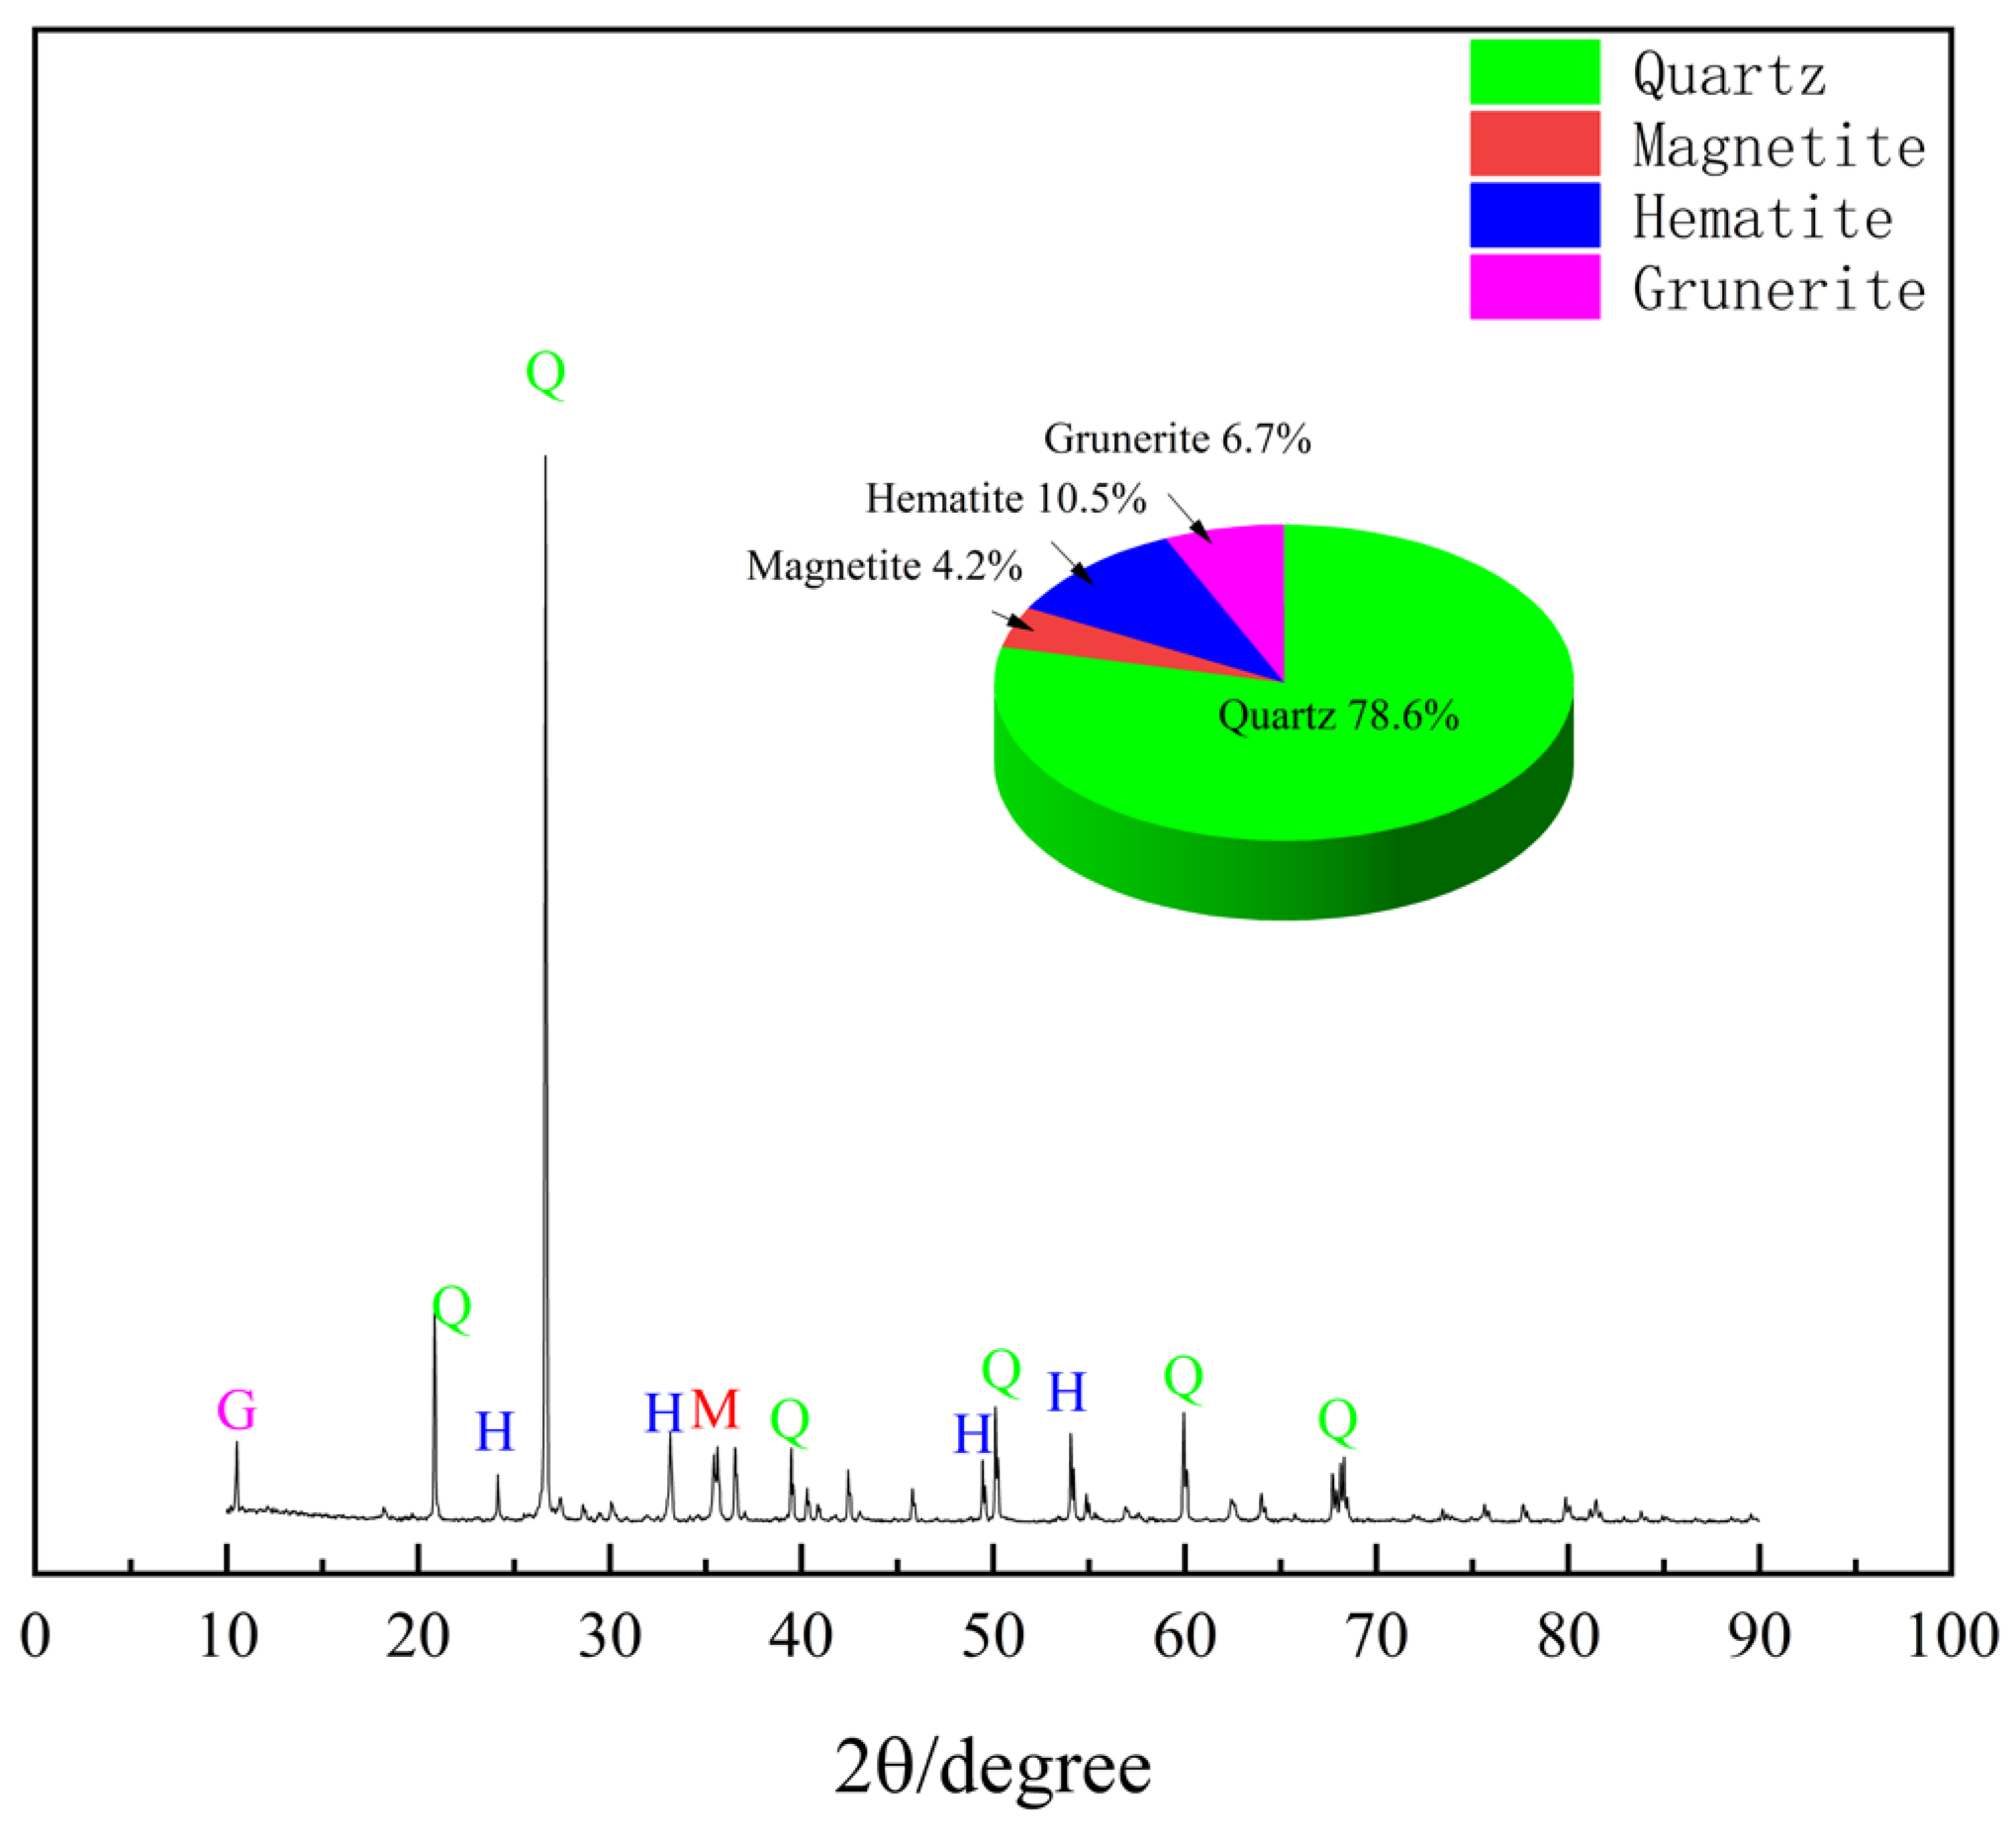
As can be seen from Figure 2, the biotite granulite has a columnar granular metamorphic structure and a banded structure including quartz (55%), ferroamphetite (10%), plagioclase (3%), dolomite (1%), and metallic minerals (30%). The metallic minerals (30%) are magnetite and hematite. Quartz is xenomorphic and granular, with a tight tooth-like mosaic structure between particles. Particles with a diameter of 0.05~0.30 mm form light-colored stripes; ferroamphidite is semi-automorphic and columnar with oblique extinction and amphibole cleavage. The color is light green to pale green, and some components are transitional phases between magnesium iron amphibole and iron amphibole. The long-axis orientation of ferroamphidite appears with varying degrees of dolomitization and forms dark bands associated with magnetite aggregation. The columnar grain sizes range from 0.20 to 2 mm. Magnetite appears as light brownish-gray bands, exhibiting euhedral and granular textures, aggregated in a banded pattern. Along its edges or fractures, varying degrees of hematitization are observed, with primary grain sizes ranging from 0.01 mm to 0.20 mm. Hematite is anhedral and granular, white in color, and replacement of magnetite, with primary grain sizes ranging from 0.01 to 0.05 mm. Quartz aggregates form light-colored bands, while actinolite and magnetite aggregates form dark-colored bands. The dark and light bands alternate in a banded pattern, with dolomite veins filling the fractures in the rock.
X-ray diffraction test (XRD) was used to identify the main components of biotite granulite. The results showed that the main mineral components of the rock are quartz, ferroamphibole, magnetite, and hematite, which is consistent with the results observed by polarizing microscope, as shown in Figure 3.
The distribution of mineral particles and crack orientation of biotite granulite were analyzed and studied using a Zeiss polarizing microscope (Jena, Germany). The size of the prepared optical slice is φ 22 mm × 5 mm with double-sided polished after high-temperature dried. The sample is shown in Figure 4.
As can be seen from Figure 4, the mineral particles are aggregated in stripes. The bright white is hematite, which is surrounded by the primary gray-white magnetite. And the dark grey matrix is quartz. The rock mineral crystal particles are large and independent, with low continuity. Mineral crystals are embedded in the quartz matrix, which is significantly different from the cementation method of layered rock mineral particles. In addition, the sample surface exhibits numerous black spots or black regions because he small-sized black spots may represent pores or defects in the rock sample, while the larger black areas or regions are likely caused by the fracturing or detachment of some mineral particles during the grinding and polishing processes, leaving pits or uneven crystal surfaces on the matrix. However, the three-dimensional nature of these features cannot be observed through an optical microscope, resulting in the appearance of prominent black spots or black regions on the surface in the photographs. Secondly, the cracks on the surface of the rock sample are generally distributed across the strips, not along the strips.
Based on the above phenomena, it can be preliminarily inferred that (1) the arrangement, distribution, aggregation, and cementation of mineral particles in banded structures and layered structures exhibit significant differences. Therefore, the fracturing mechanisms of layered rocks cannot be simply equated with those of banded magnetite-quartzite. Also, (2) by observing the distribution of fractures, it is preliminarily concluded that the fracturing mode of banded magnetite-quartzite may involve transgranular or intergranular tensile failure, or a mixed tensile-shear brittle failure.

2.2. Experimental Plan

2.2.1. Freeze–Thaw Cycle Test

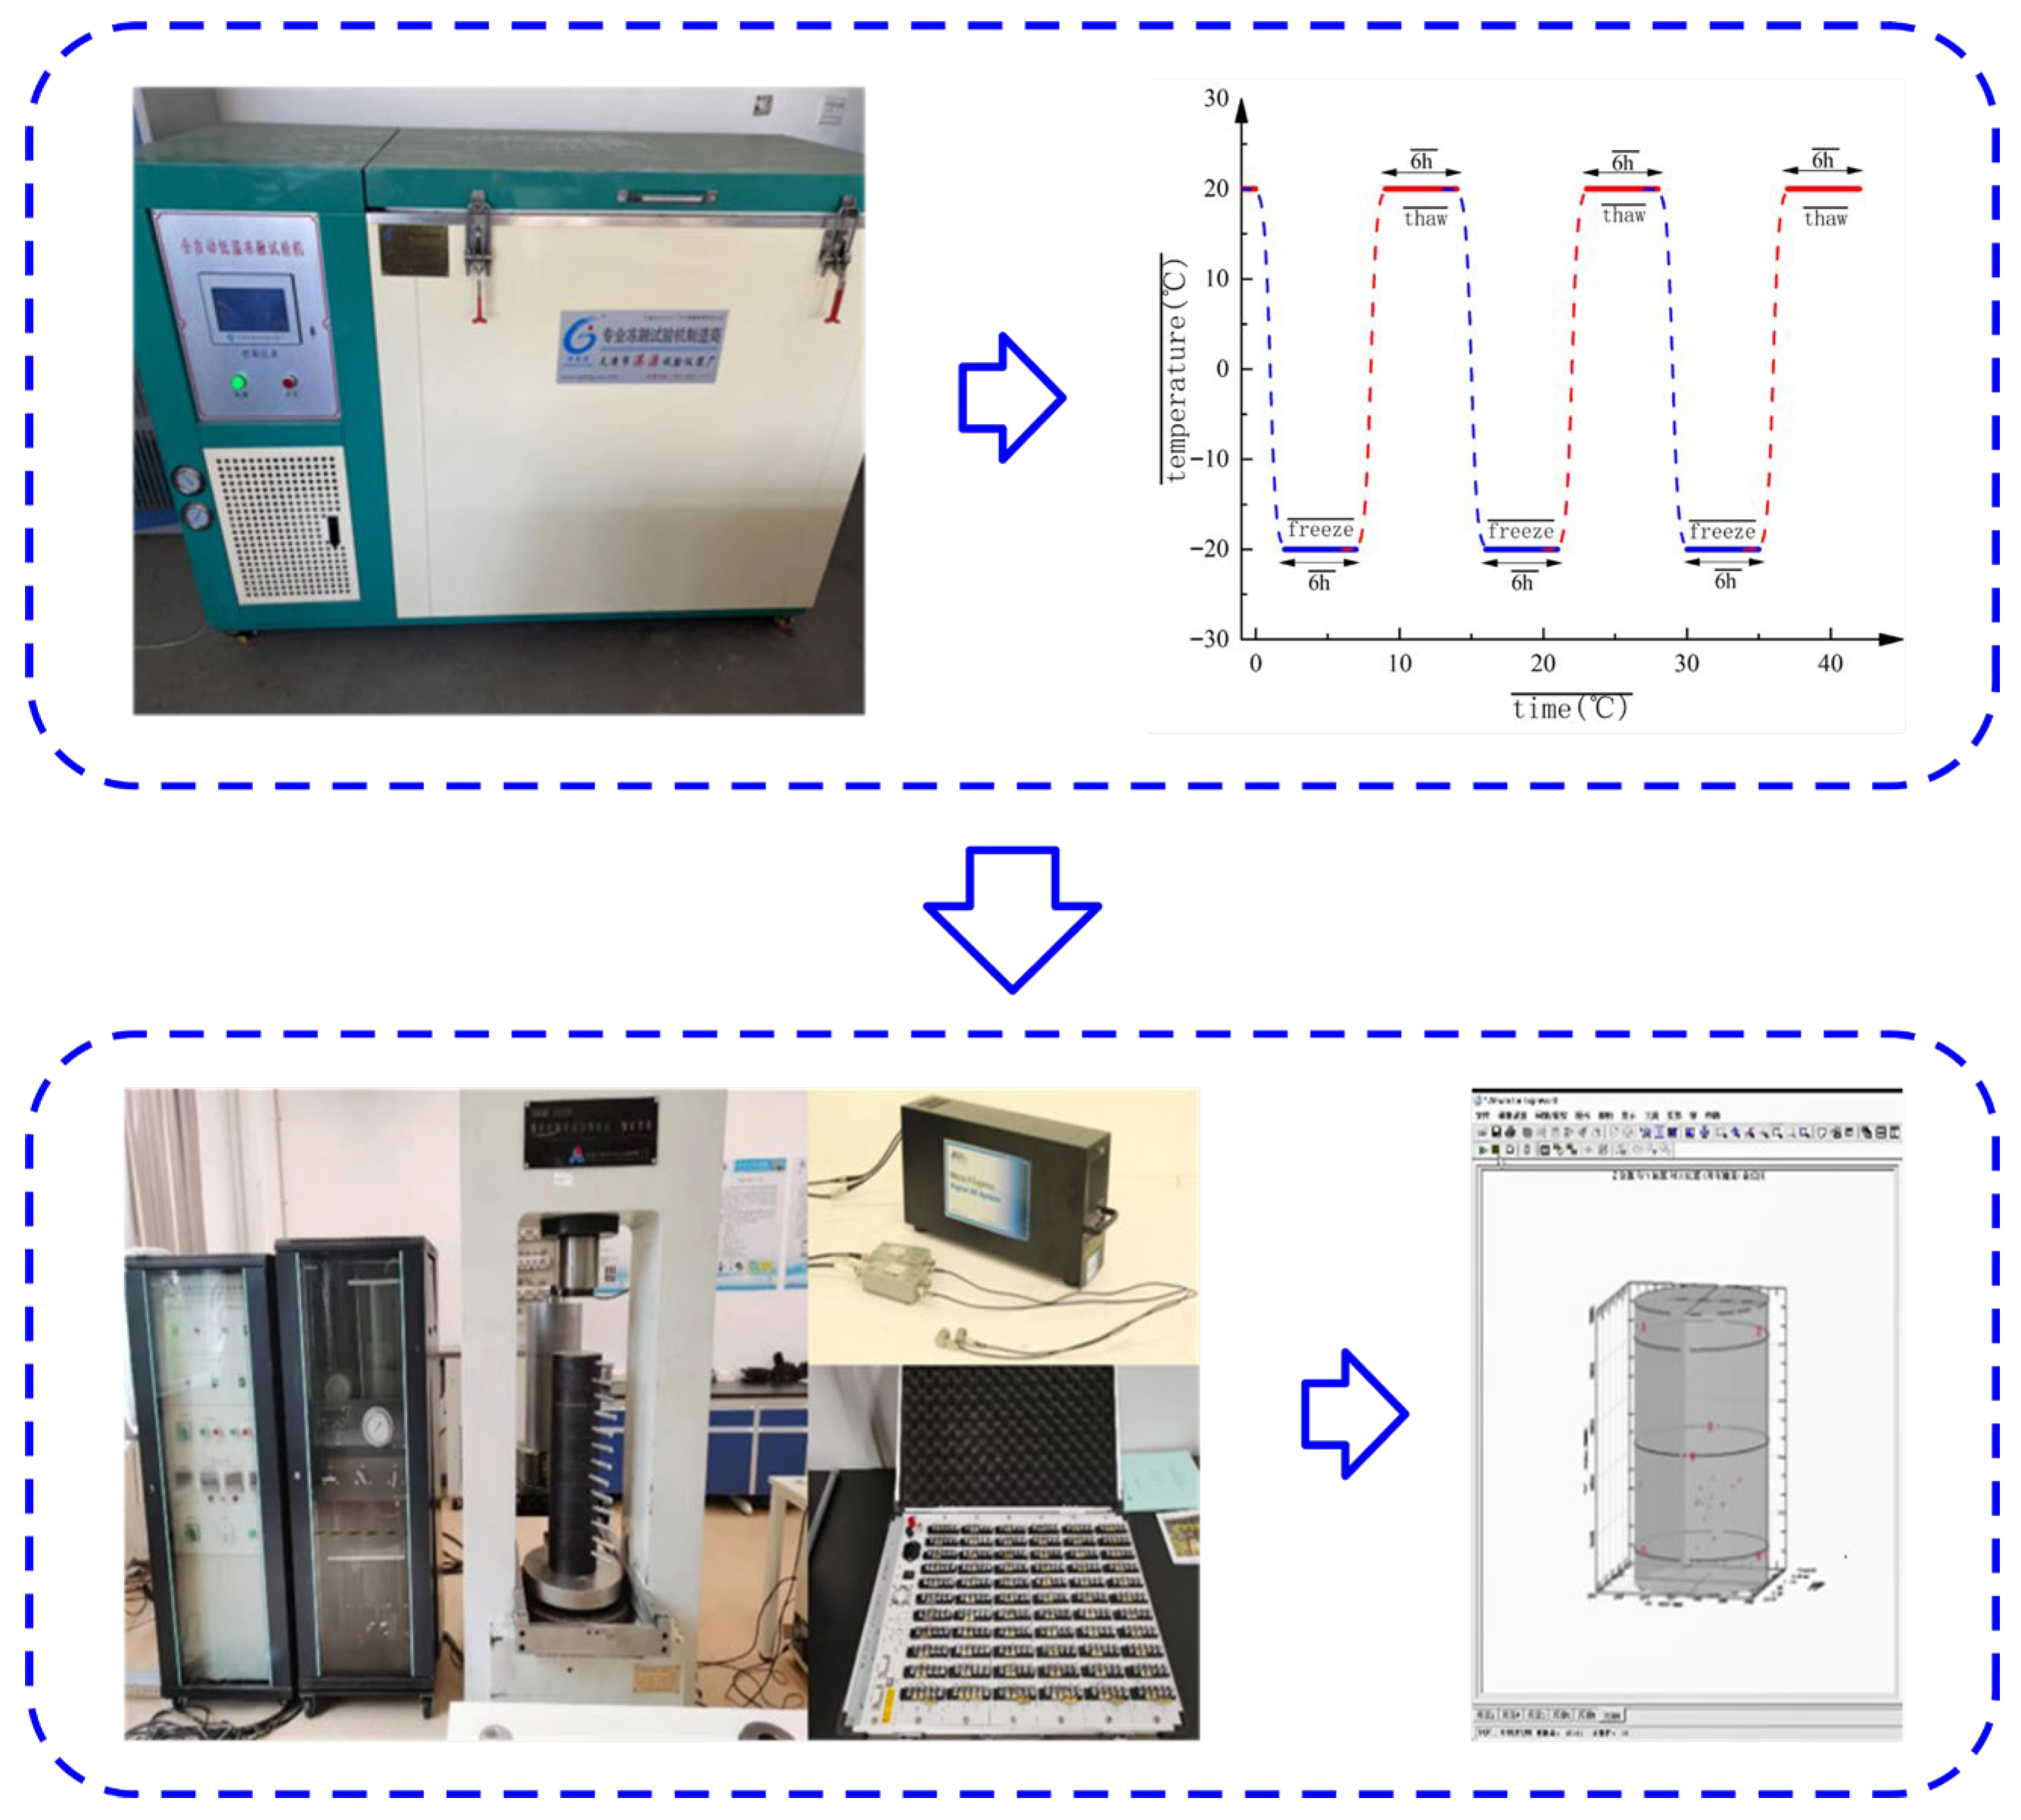
The freeze–thaw cycle test of rock samples was carried out by a CLD Automatic Low Temperature Freeze–Thaw test machine. The freezing and thawing temperatures were set to −20 °C and 20 °C, respectively. The saturated rock samples were frozen for 6 h and thawed for 6 h in pure water; every 12 h is a freeze–thaw cycle.
According to the above experiment, the specimens were categorized into different groups as follows: Group a consisted of dry specimens, and Group b consisted of water-saturated specimens, with four specimens in each group, both serving as control groups. The freeze–thaw test groups included Group c (10 cycles), Group d (20 cycles), Group e (40 cycles), Group f (70 cycles), Group g (100 cycles), Group h (130 cycles), Group i (180 cycles), Group j (230 cycles), and Group k (280 cycles), with six specimens in each group. (Due to occasional equipment malfunctions during testing, some groups contained only five valid data sets.) After each freeze–thaw cycle, obvious mineral particle shedding, crack formation, or strip color change were observed on the surface of the rock sample. Then the saturated mass, dry mass, and longitudinal wave velocity of the rock sample were recorded at the same time until the last freeze–thaw cycle.

2.2.2. Uniaxial Compression Acoustic Emission Test

The uniaxial compression test of rock samples was carried out by using the TAW-3000 (Changchun Chaoyang Experimental Instrument Co., Ltd., manufactured in Jilin, China) microcomputer-controlled electro-hydraulic servo rock testing machine. At the same time, the PCI-2 acoustic emission monitor (Beijing Wusheng Technology Co., Ltd., manufactured in Beijing, China) and DH3816 static strain gauge (Keyence (China) Co., Ltd., manufactured in Shanghai, China) are used to monitor the acoustic emission signal and deformation of the rock sample under the real-time load.
Before conducting the uniaxial compression test, spacers were attached to the rock samples, and petroleum jelly was applied to both sides of the samples as well as the contact points between the sensors and the samples to serve as a coupling agent. The purpose is twofold: first, to reduce offset friction signals caused by end-face effects, and second, to enhance the coupling effect between the sensors and the rock surface. Subsequently, strain gauges were cross-attached at opposite positions in the middle of the rock sample. After the above preparation work is completed, the rock sample is placed on the loading platform and preloaded to 1 kN at a loading rate of 300 N/s. When the value is stable, the displacement loading is carried out at 0.08 mm/min until the rock sample loses its bearing capacity.
During displacement loading, the acoustic emission monitoring system and static strain test system are turned on to collect the acoustic emission signal and deformation data of the rock sample. During the test, the environment is kept quiet to prevent noise pollution. The test equipment and process diagram are shown in Figure 5.

3. Changes in Basic Physical and Mechanical Parameters Law of Biotite Granulite Under Freeze–Thaw Action

3.1. Changes in Open Porosity

The open porosity n0 of five rock samples in group K with 280 freeze–thaw cycles after each freeze–thaw cycle was calculated by Formula (1). A scatter plot of the open porosity n0 of the rock samples under freeze–thaw action was drawn, as shown in Figure 6.
n 0 = V v 0 V × 100 % = 1 ρ d W a ρ w × 100 %
where
  • V v 0 —Open pore volume, cm3;
  • V —Specimen volume, cm3;
  • P d —Specimen dry density, g/cm3;
  • P w —Density of water ( ρ w = 1g/cm3);
  • W a —water absorption rate of the rock samples, %.
As can be seen from Figure 6, the open porosity of the rock sample increases nonlinearly with the increase in freeze–thaw cycles. After 280 freeze–thaw cycles, the open porosity increases by 83.38% compared with the initial state. The growth rate is more significant in the middle of the freeze–thaw cycle. The fitting degree is 0.99 by the asymptotic function. Combined with the changes in the saturated mass of the rock sample, it is found that in the early stage of the freeze–thaw cycle, the growth rate of the open porosity of the rock sample is slow, and the saturated mass shows a significant downward trend; during the mid-stage of freeze–thaw cycles, the growth rate of open porosity in the rock samples accelerated, and the saturated mass increased significantly. In the later stages of freeze–thaw cycles, the rate of increase in open porosity decreases, and the saturated mass gradually decreases. Therefore, the pore and fracture structures of the rock samples became more mature under prolonged freeze–thaw cycling. Repeated freeze–thaw actions caused fractures and pores to gradually expand, extend, and interconnect, forming a complex fracture network. This progression led to the gradual intensification of freeze–thaw-induced deterioration in the rock samples.

3.2. Variation of Longitudinal Wave Velocity

The ZBL-U5100 non-metallic ultrasonic detector (Beijing Zhibolian Company, manufactured in Beijing, China) is used to test the longitudinal wave velocity of the rock samples, which have completed the set number of freeze–thaw cycles according to the requirements of the specification. The longitudinal wave velocities of the K-group rock samples under different freeze–thaw cycles were measured and statistically analyzed in Figure 7.
As shown in Figure 7, with the increase in freeze–thaw cycles, the longitudinal wave velocity of rock samples increases first and then decreases. The longitudinal wave velocity of the rock sample increases to the highest value at the 70th cycle of freezing and thawing, increases by 2.10% relative to the saturated state, and decreases to the lowest value at the 280th cycle of freezing and thawing; compared with 70 freeze–thaw cycles and saturated state, its value decreased by 13.18% and 8.24%, respectively. Under the action of freezing and thawing, the change trend of longitudinal wave velocity of rock samples is divided into two stages, the reason for this phenomenon may be that in the early stage of freezing and thawing, the open pores on the surface of the rock sample gradually open, expand and gradually connect with the closed pores inside, and the water invades, filling the spatial position of the original closed pores, as a result, the p-wave velocity of rock samples tends to increase under low freeze–thaw cycles. With the further increase in freeze–thaw cycles, the pore structure in the rock sample continues to expand and derive, the development rate gradually accelerates, and the freeze–thaw damage accumulates significantly, the increase in wave velocity caused by water intrusion is much lower than the decrease in wave velocity caused by the deterioration of pore and fracture structure, and then the longitudinal wave velocity decreases nonlinearly after 70 cycles of freezing and thawing.

3.3. Variation of Uniaxial Compressive Strength

According to the variation trend of uniaxial compressive strength of rock samples with freeze–thaw cycles, the distribution maps of uniaxial compressive strength of biotite granulite under different freeze–thaw cycles are drawn, as shown in Figure 8.
As shown in Figure 8, the compressive strength of the rock sample shows a nonlinear decreasing trend with the increase in freeze–thaw cycles. The average peak stress decreases from 200.93 MPa in the dry state to 106.64 MPa after 280 freeze–thaw cycles, with a decrease of 46.93%. Due to the strong heterogeneity of rock samples, the difference in compressive strength of each group of rock samples changes greatly, but with the continuous influence of freeze–thaw action, the difference in compressive strength of rock samples gradually decreases, from 78.43 MPa in the dry group to 42.56 MPa in 280 freeze–thaw cycles. The attenuation formula of average peak stress with the number of freeze–thaw cycles is determined by the Levenberg–Marquardt optimization algorithm, as shown below:
σ A v e = 74.49 × e i 116.42 + 105.95 R 2 = 0.97
where: σ A v e —average peak stress, MPa; i —times of freeze–thaw cycles.
The rock sample has a dense structure, high rigidity, and strength. The strength of the rock sample gradually decays, and the decay law is similar to that of rocks with large porosity, such as sandstone and limestone, with an increase in the number of freeze–thaw cycles.
The strength extreme value of each group of rock samples also gradually decreases. Moreover, the pores and cracks of the biotite granulite gradually expand, extend, and penetrate under the repeated freeze–thaw action, leading to the progressive deterioration of the rock samples. The rate of deterioration is relatively rapid during the early and middle stages of freeze–thaw cycles, but slows down in the later stages.

3.4. Variation of Elastic Modulus

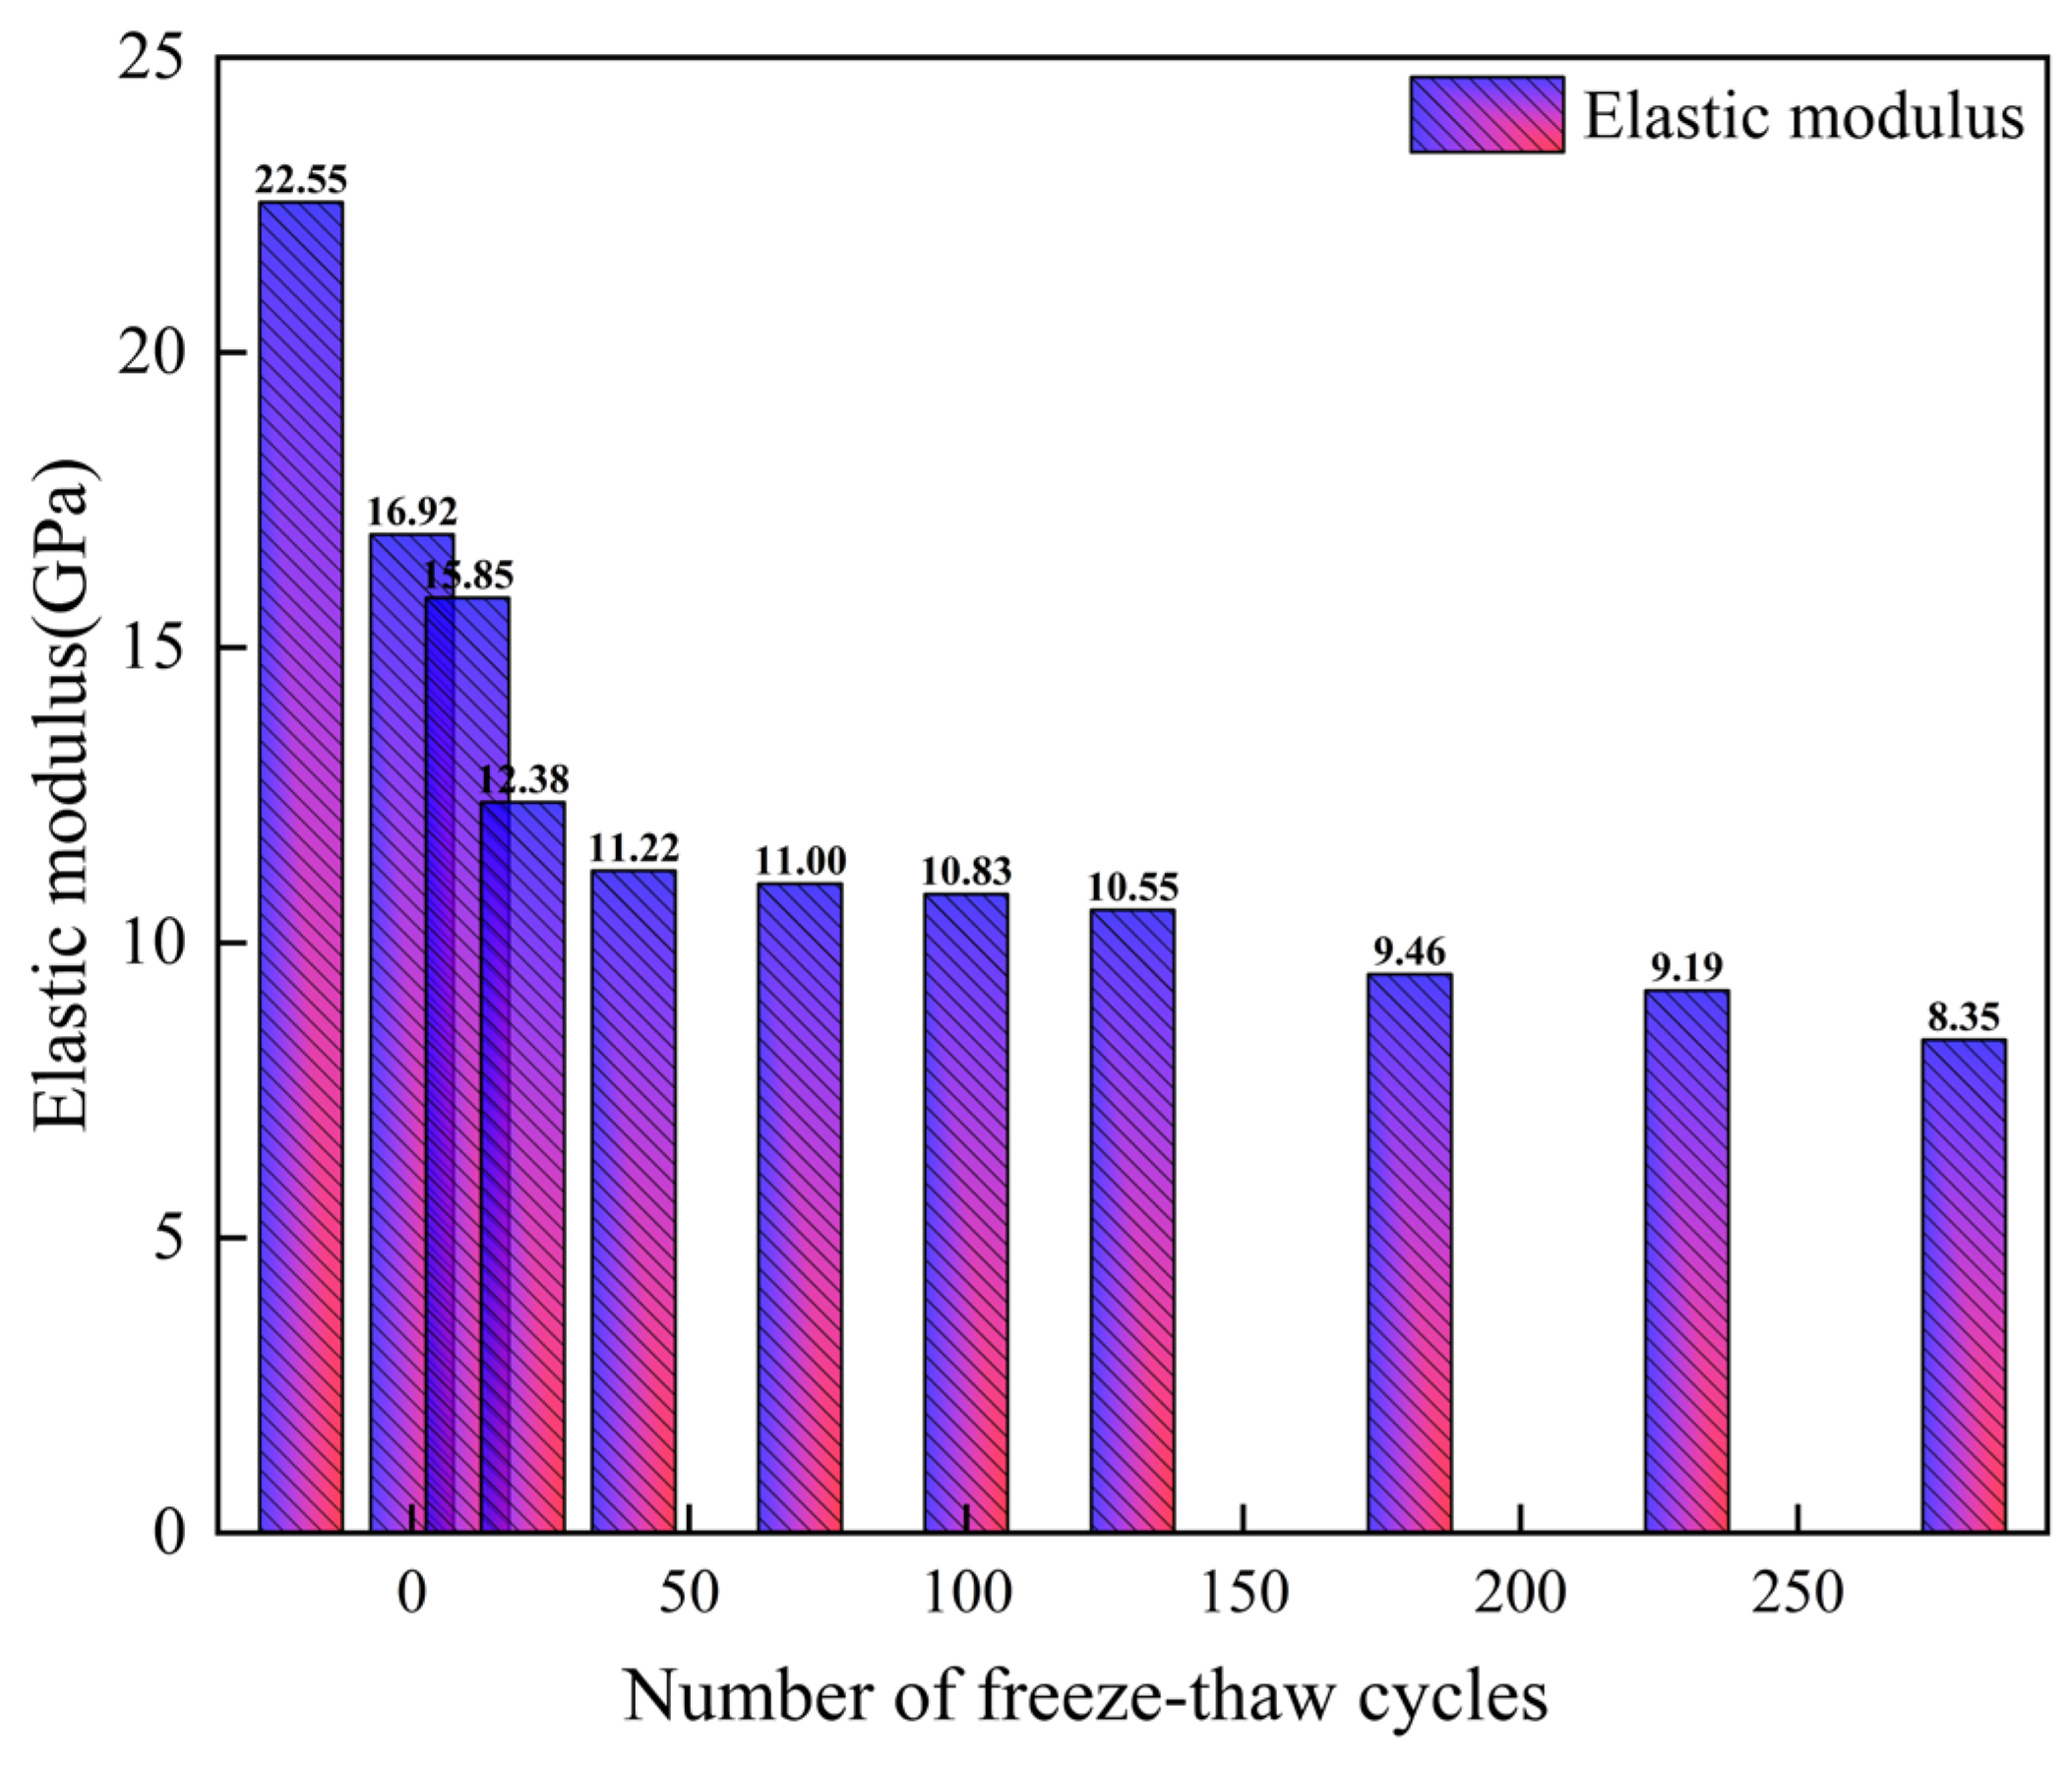
Based on the ability of biotite granulite to resist deformation during different freeze–thaw cycles, a statistical graph of the variation of the elastic modulus of the rock sample with the number of freeze–thaw cycles was drawn, as shown in Figure 9.
As can be seen from Figure 9, the elastic modulus of rock samples decreases gradually with the increase in freeze–thaw cycles, and the decrease in elastic modulus in the early stage of freeze–thaw is obviously higher than that in the later stage. The elastic modulus of the rock sample decreased from 22.55 GPa to 8.35 GPa from the dry state to the 280th freeze–thaw period, with a decrease of 61.98%. Therefore, the ability of the biotite granulite to resist elastic deformation and its stiffness are gradually weakened under the action of freeze–thaw. The deformation capacity of the rock sample is enhanced under the action of freeze–thaw. The main reason is that the internal microcracks of the rock sample gradually develop under the action of freeze–thaw, which reduces the density of the rock sample structure. After freeze–thaw cycles, the microcracks in the rock samples are more prone to expansion, extension, and interconnection during loading, facilitating the formation of fracture weakening planes. With the increase in the number of freeze–thaw cycles, the brittle failure of rock samples will gradually transform into ductile failure in the process of fracture.

4. Variation Characteristics of Acoustic Emission Parameters in Biotite Granulite Under Freeze–Thaw Conditions

Through the analysis of the acoustic emission characteristic parameters of rock samples during loading, the variation law of acoustic emission characteristic parameters of biotite granulite with the increase in load under different freeze–thaw cycles is explored. The time nodes and the corresponding microcrack evolution stage are determined when the acoustic emission parameters change before the rock sample breaks.
The mean and reduction rate of each group of rock samples are calculated when the cumulative times of acoustic emission impacts, cumulative ringing counts, and cumulative energy of 64 rock samples at the peak value after freeze–thaw are counted, as shown in Table 2. The corresponding relationship between the cumulative times of acoustic emission impacts and the times of freeze–thaw cycles is analyzed, contributing to preliminary preparations for analyzing the changing characteristics of the active state of the microcrack structure of rock samples after freeze–thaw.
It can be seen from Table 2 that the average cumulative impact numbers, cumulative energy, and cumulative ringing counts of rock samples decrease with the increase in freeze–thaw cycles. Moreover, the above values of the dry rock samples are the largest, with values of 143,362, 7.95 × 10⁹ aJ, and 2,833,865, respectively. After 280 freeze–thaw cycles, the above values of the rock samples decreased by 35.83%, 68.10% and 70.88%, respectively. Therefore, the acoustic emission activity, intensity, and frequency of the rock samples under load after freeze–thaw show a downward trend. The cumulative impact counts, cumulative ringing counts, and cumulative energy of the rock samples with low freeze–thaw cycles decreased by 28.13%, 53.34% and 45.80%, respectively. While the rock samples with high freeze–thaw cycles decreased by 7.70%, 17.54% and 22.30%, respectively. It can also be found that the degradation efficiency of the rock samples with low freeze–thaw cycles is higher than that of the rock samples with high freeze–thaw cycles. The above data all correspond to the peak stress. The differences between rock samples with low freeze–thaw cycles and high freeze–thaw cycles are further refined. The changes of various acoustic emission impact parameters in different crack evolution stages are observed. It is found that various acoustic emission parameters of rock samples with high freeze–thaw cycles are significantly higher than those of low freeze–thaw cycles.
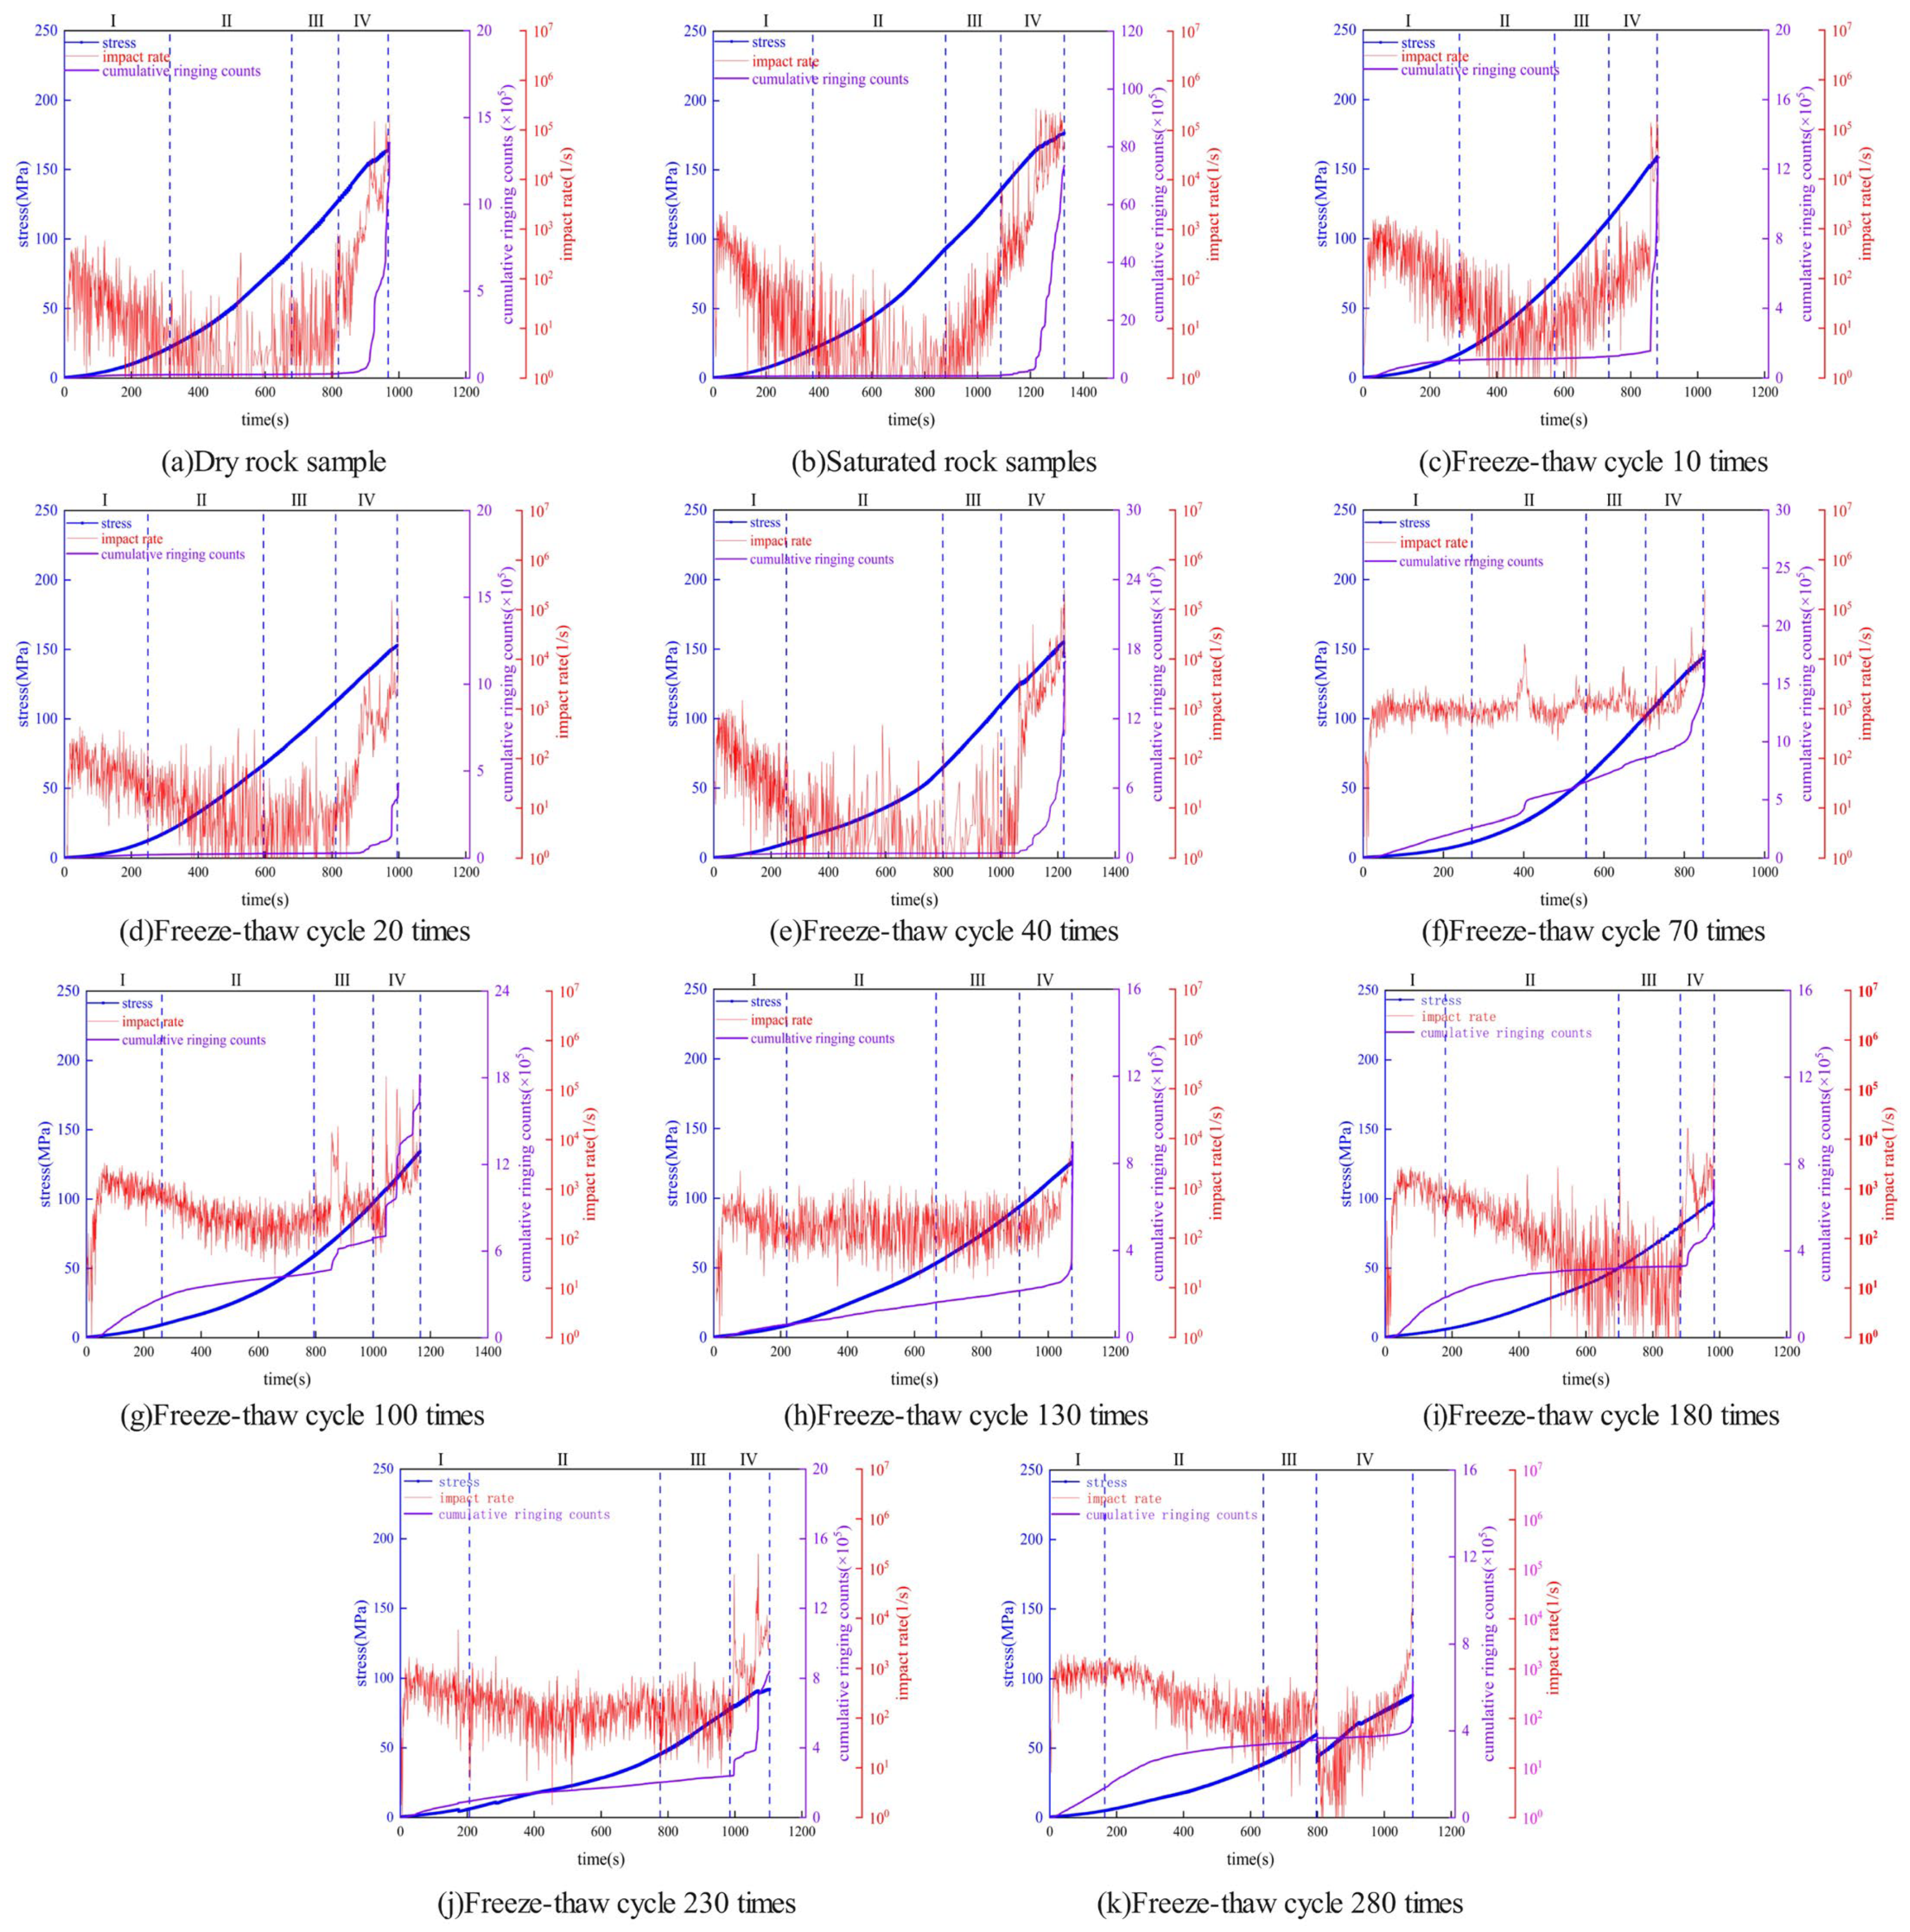
For each group, rock samples with acoustic emission parameters close to the average value were selected to plot the relationships between stress, count rate, cumulative ring counts, and time after freeze–thaw cycles. The fluctuation of counts and time is small. In order to more clearly reflect the fluctuation trend, the logarithmic coordinate system of count rate is established, as shown in Figure 10.
Figure 10 reveals significant differences in the acoustic emission characteristic parameters of rock samples subjected to high and low freeze–thaw cycles. Therefore, the acoustic emission characteristic parameters of rock samples under high and low freeze–thaw cycles were analyzed separately.
Rock samples in low freeze–thaw cycle:
(1) Compaction stage (I): The count rate of acoustic emission is at the highest level at the initial loading stage. The count rate gradually decreases to the lowest level with the increase in loading. The count rates of dry, saturated, and 10, 20, and 40 freeze–thaw cycles of rock samples in this stage are 2002 s−1, 730 s−1, 1554 s−1, 437 s−1, and 997 s−1, respectively. The cumulative ringing counts are 73,948, 19,609, 102,079, 19,411, 38,340, and 38,340, respectively. It is evident that during this stage, the maximum count rate of the rock samples decreases progressively with an increasing number of freeze–thaw cycles. This phenomenon can be attributed to the fact that, after a limited number of freeze–thaw cycles, the banded magnetite quartzite still contains a considerable amount of fine primary microcracks and pores. At the early loading stage, these defects rapidly close under stress, triggering numerous instantaneous events such as friction, slip, and localized crushing, which generate frequent acoustic emission signals. As the microcracks gradually close, the number of acoustic emission events diminishes, resulting in a progressive reduction in the count rate.
(2) Elastic deformation stage (II): The count rate fluctuates stably with the increase in loading in this stage. The cumulative ringing counts of the dry, saturated, 10-, 20-, and 40-times freeze–thaw cycle of rock samples were 77,801, 21,700, 111,649, 26,481, and 41,696 at the cracking stress, respectively, which increased by 5.0%, 9.6%, 8.6%, 26.7%, and 8.0% compared with the compaction stress. Moreover, with the increase in freeze–thaw cycle, the ringing count of rock samples decreases, indicating that the acoustic emission signal intensity of rock samples has a gradual weakening trend with the increase in freeze–thaw cycle. This phenomenon can be attributed to the progressive increase in the number of primary microcracks and the enlargement of pores within the rock as the number of freeze–thaw cycles increases. A portion of these cracks has already closed or undergone partial damage during the compaction phase or early loading. Consequently, during the elastic stage, the reduced availability of active microcracks results in a gradual attenuation of the acoustic emission signal intensity.
(3) Stable development stage of microcracks (III): The count rates of dry and 10 freeze–thaw cycles of the rock samples increased significantly. However, the count rates of saturated and 20 and 40 freeze–thaw cycles of the rock samples remained stable, which is similar to the changes in the elastic stage. The cumulative ringing counts of the dry, saturated, and 10, 20, and 40 freeze–thaw cycle rock samples are 87,199, 26,392, 124,625, 28,200, and 43,043 at the damage stress point, respectively, which are 10.8%, 17.8%, 10.4%, 6.1%, and 3.1% higher than the values at the crack stress. It can be seen that the cumulative ringing count and its growth rate at this stage gradually decrease with the increase in freeze–thaw cycles, indicating that the intensity and frequency of the transmitted signal decrease with the increase in freeze–thaw cycles. It is easy to promote the development, expansion, and extension of the internal crack structure of the rock sample under the action of load, when the number of microcracks inside the rock sample increases and the scale becomes larger under the action of freeze–thaw.
(4) Accelerated expansion stage of microcracks (IV): the counting rate and cumulative ring counts increased rapidly in this stage until the rock sample broke. The cumulative ring counts of the dry, saturated, and 10, 20, and 40 freeze–thaw cycle rock samples were 7,351,024, 1,354,909, 1,267,243, 428,434, and 1,317,137 when the rock sample broke. Therefore, the cumulative ring counts of dry, saturated, and different freeze–thaw cycles of rock samples are quite different. Although the water in the pores and fracture structures has a certain deterioration effect on the rock samples, the water weakens the friction effect during friction and sliding between rock mineral particles and plays a certain lubrication and buffering role. The cumulative ring counts in this stage increased by 98.8%, 98.1%, 90.2%, 93.4%, and 96.7%, respectively, compared with the damage stress. Moreover, the growth rate decreased slightly with the increase in the number of freeze–thaw cycles.
High freeze–thaw cycle rock samples:
(1) Compaction stage (I): The count rate fluctuates stably with the increase in loading after the count rate rises to the highest level. The maximum count rates of the rock samples with freeze–thaw cycles of 70, 100, 130, 180, 230, and 280 times are 2591 s−1, 3377 s−1, 2230 s−1, 2731 s−1, 1687 s−1, and 1956 s−1, respectively. Additionally, the cumulative ringing counts at the compaction stress are 79,317, 273,602, 59,951, 185,558, 84,256, and 136,701, respectively. It can be seen that the acoustic emission count rate and cumulative ring count of the rock samples with high freeze–thaw cycles are significantly higher than those with low freeze–thaw cycles. Furthermore, the cumulative ring count of the rock samples shows a trend of gradual decrease with the increase in freeze–thaw cycles. Therefore, the internal crack structures of the rock samples with high and low freeze–thaw cycles are different in terms of quantity, scale, and degree of connection between cracks. This behavior indicates that limited crack development at low freeze–thaw cycles leads to weak AE activity during compaction, whereas at high freeze–thaw cycles, the well-developed and interconnected crack network promotes rapid closure of microdefects, resulting in significantly higher AE responses.
(2) Elastic deformation stage (II): The rock samples subjected to 70, 130, and 230 freeze–thaw cycles exhibited stable fluctuations in count rate, while those subjected to 100, 180, and 280 freeze–thaw cycles showed a slight decrease. Overall, the variation trend in count rate was distinctly different from that of rock samples subjected to lower freeze–thaw cycles. The cumulative ringing counts of the rock samples with freeze–thaw cycles of 70, 100, 130, 180, 230, and 280 at the cracking of stress were 653,404, 449,549, 161,348, 318,850, 202,174, and 337,010, respectively, which increased by 60.3%, 39.1%, 62.8%, 41.8%, 53.4%, and 59.4% compared with the cumulative ringing counts at the compaction stress, respectively. It can be seen that the cumulative ringing counts and the growth rate of the rock samples with high freeze–thaw cycles are much higher than those of the rock samples with low freeze–thaw cycles, and the ringing counts decrease with the increase in freeze–thaw cycles. Therefore, the crack structures of the rock samples with high and low freeze–thaw cycles are quite different. During the elastic deformation stage, rock specimens subjected to high freeze–thaw cycles generate stronger acoustic emissions due to the larger number and higher connectivity of fractures, resulting in cumulative ringing counts and growth amplitudes much greater than those of low freeze–thaw cycle specimens. However, as the number of freeze–thaw cycles continues to increase, the fracture network becomes progressively saturated and stabilized, the formation of new fractures decreases, and the overall ringing counts show a declining trend.
(3) Stable development stage of microcracks (III): The count rate of the rock samples remained stably fluctuating, but the range of fluctuation significantly increased. The cumulative ringing counts for rock samples subjected to 70, 100, 130, 180, 230, and 280 freeze–thaw cycles were 859,729, 691,334,215,351, 358,082, 239,225, and 366,079, respectively, representing increases of 24.0%, 35.0%, 25.1%, 11.0%, 15.2%, and 8.0% compared to the values at the crack initiation stress point.
It can be seen that with the increase in freeze–thaw cycle, the ringing count and its growth rate decrease, and the growth rate in this stage is much smaller than that in the elastic deformation stage. This indicates that the regional crack network of the rock samples with high freeze–thaw cycles has matured, and the degree of interconnection between the cracks is also high. Additionally, the formation of macroscopic cracks in the rock samples under loading occurs more gradually.
(4) Accelerated expansion stage of microcracks (IV): The counting rate and cumulative ringing counts increase significantly with the increase in loading. Some rock samples have a sudden increase in counting rate, such as the rock samples with 100 and 180 freeze–thaw cycles. The cumulative ringing counts of the rock samples with 70, 100, 130, 180, 230, and 280 freeze–thaw cycles at the peak of stress were 1,450,170, 1,639,357, 547,891, 726,221, 840,654, and 624,272, respectively. It can be seen that the cumulative ringing count not only gradually decreases with the increase in the number of freeze–thaw cycles but also decreases significantly relative to the rock samples with low freeze–thaw cycles. The increase in the cumulative ringing count of the rock samples in this stage is also lower than that of the rock samples with low freeze–thaw cycles, with an average decrease of about 40%. This further illustrates that the fundamental differences in fracture development between rock samples subjected to high and low freeze–thaw cycles result in a significantly reduced severity during failure. The observed phenomenon can be attributed to the fact that, after prolonged freeze–thaw cycling, the high-cycle specimens had already developed a relatively mature fracture network, characterized by an increased number of medium- and large-scale fractures as well as their interconnections. Consequently, under loading conditions, fracture propagation in these specimens tended to proceed in a more stable and progressive manner, rather than exhibiting the concentrated, burst-type failure observed in low-cycle specimens. As a result, the growth amplitude of the cumulative acoustic emission ringing counts was markedly reduced, reflecting a lower degree of failure intensity.
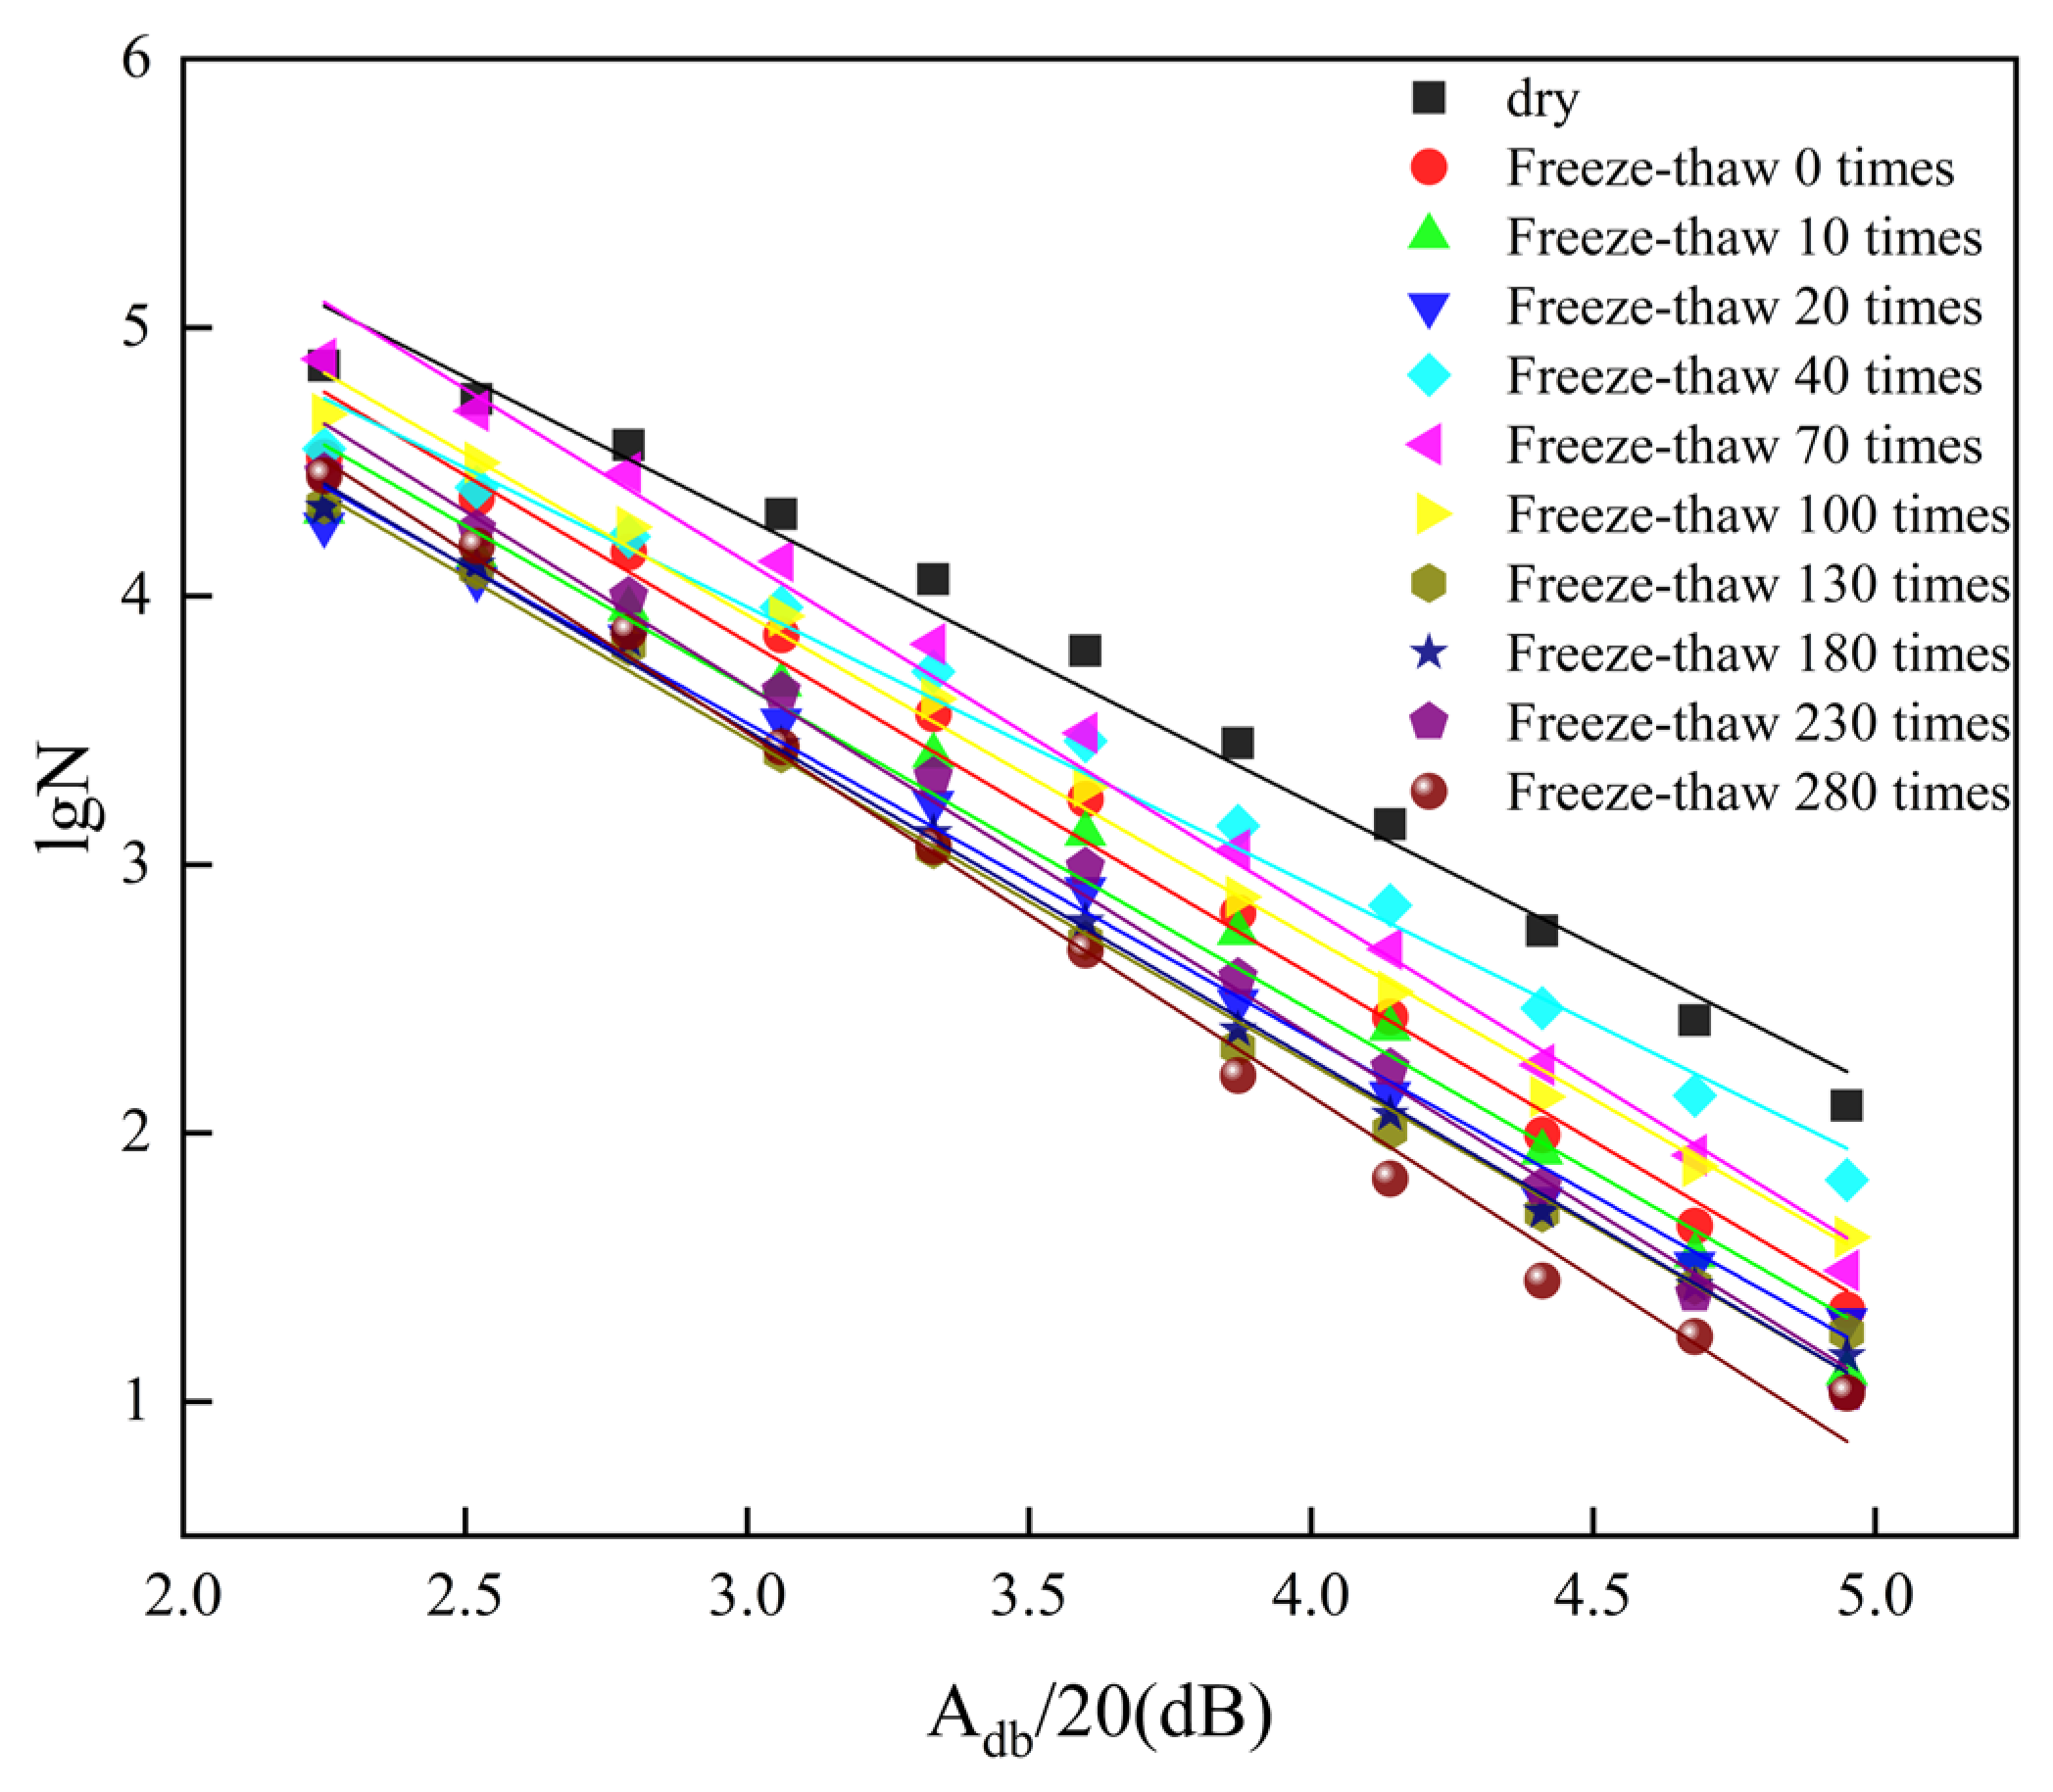
The magnitude of acoustic emission of rock samples is in a power law relationship with the number of impacts:
lg N = a b M
where N —number of impacts with magnitude greater than or equal to M; M —impact magnitude, M = A d b / 20 , A d b —impact amplitude, dB; a —undetermined parameter; b —undetermined parameter.
To ensure the calculation accuracy, the cumulative frequency method was used. The magnitude step was set to 5 dB, and the b value was calculated using the least squares method. The distribution diagram of acoustic emission magnitude-impact number of biotite granulite under different freeze–thaw times was drawn, as shown in Figure 11.
The distribution of acoustic emission magnitude-impact number can reflect the changes in the number of large and small magnitude impacts of rock acoustic emissions. These changes are closely related to the development and expansion process of microcracks inside the rock. As shown in Figure 11, both large and small magnitudes in rock samples decreased to varying degrees. Additionally, the decrease in the number of large magnitude impacts is more obvious. This shows that with the increase in freeze–thaw cycles, the number of new large-scale cracks in the fracture process of rock samples will gradually decrease.
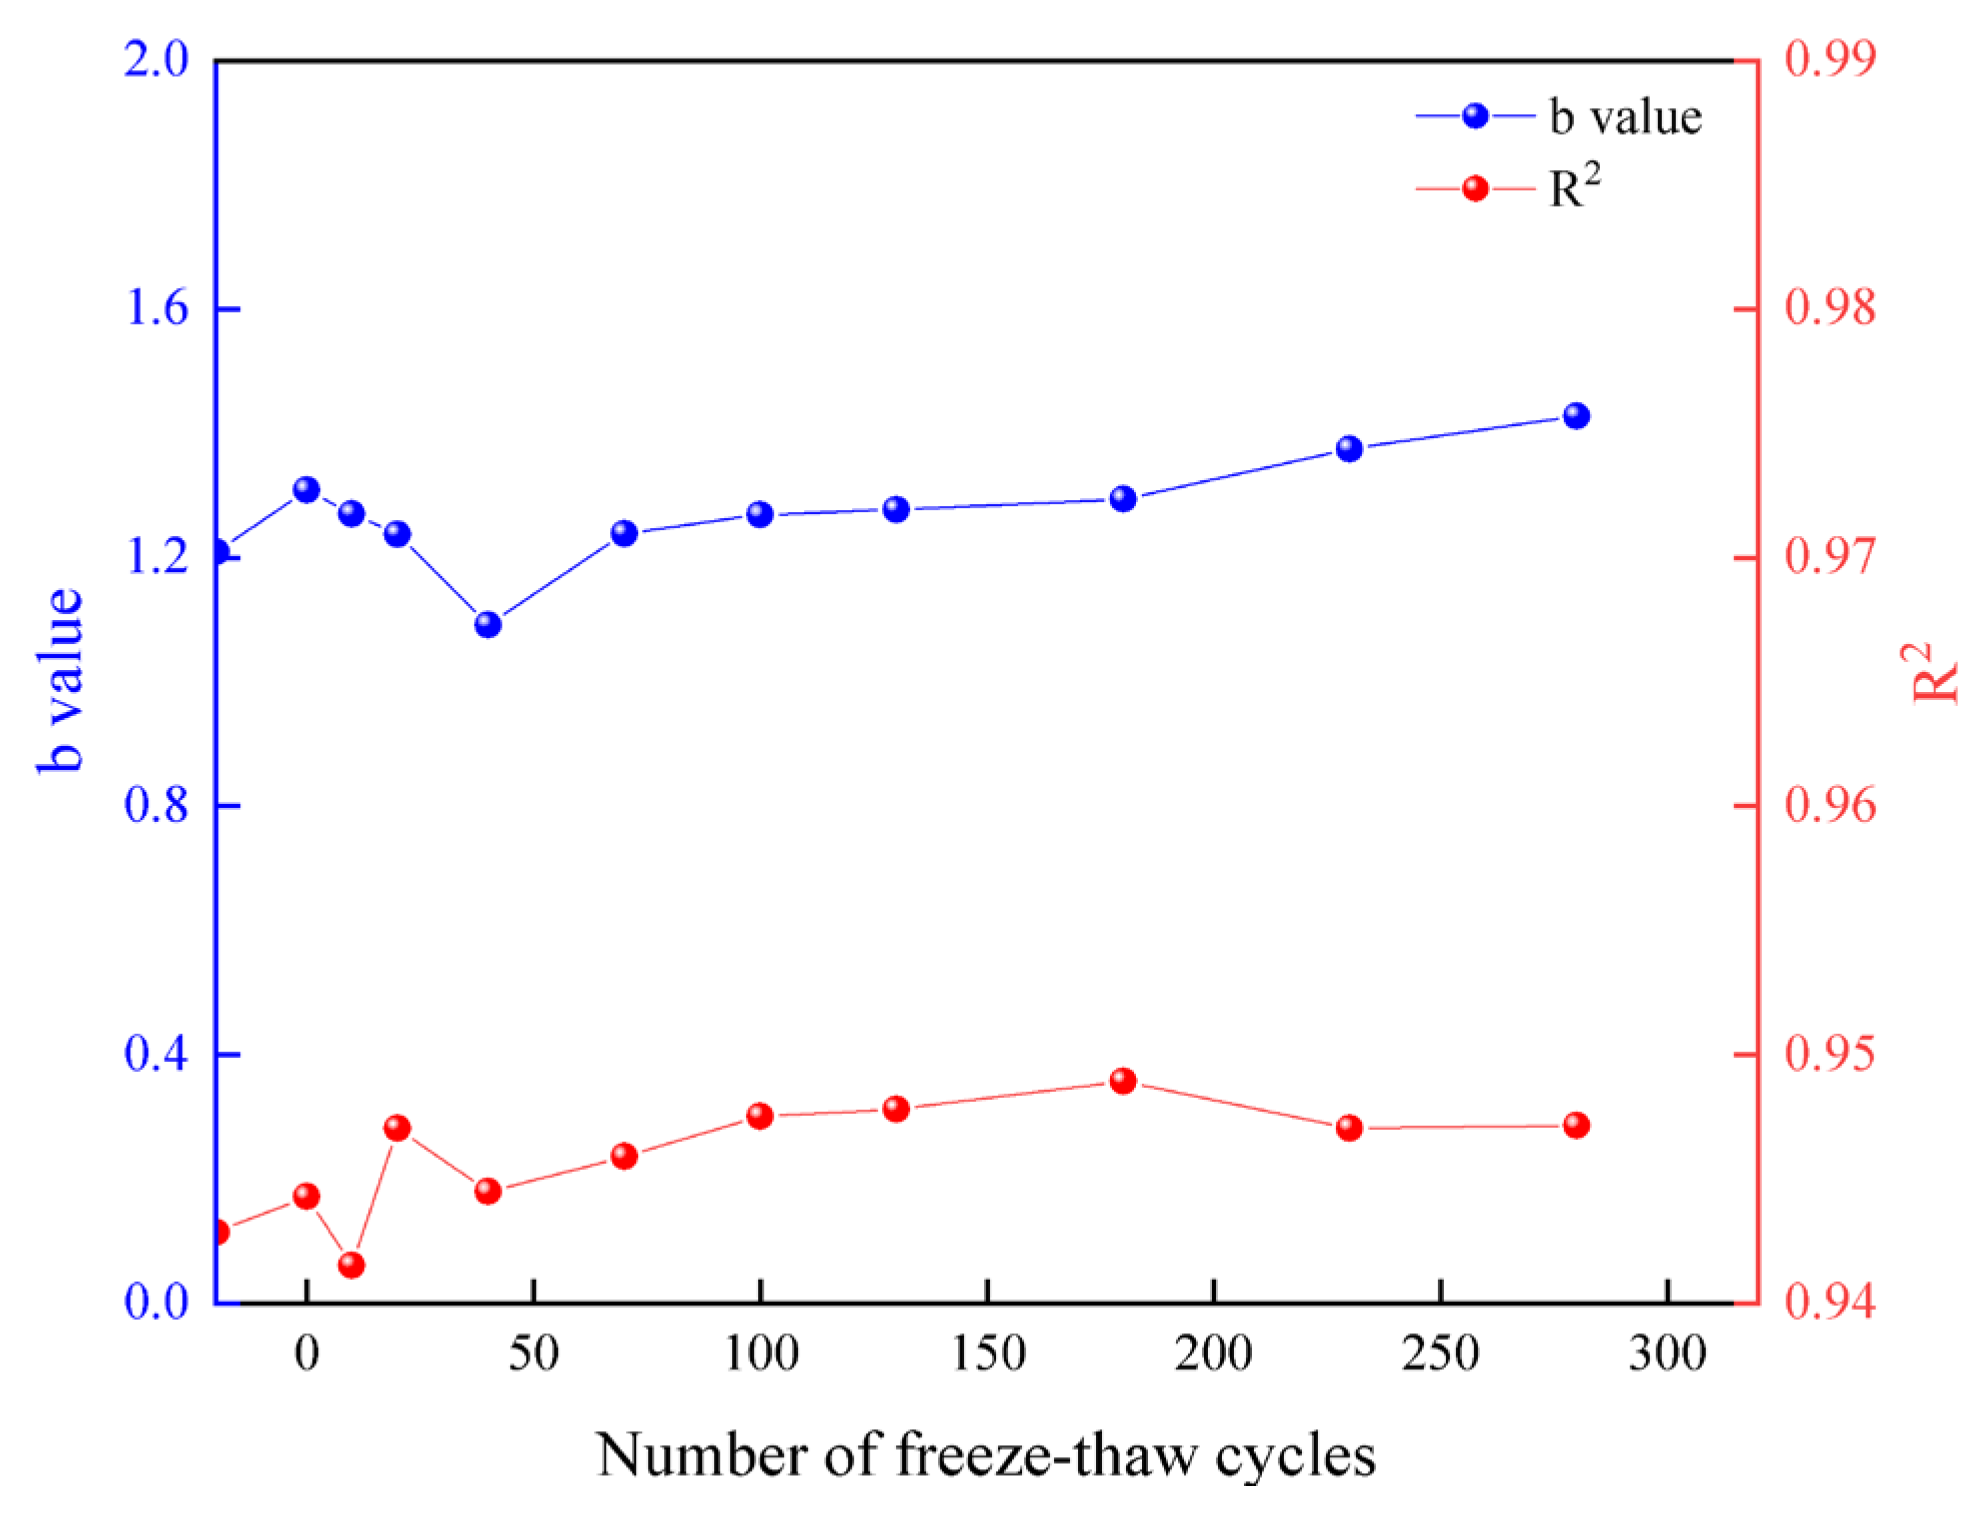
The ability to resist deformation gradually decreases. Therefore, the degree of plastic deformation of the rock sample during loading gradually increases, and the severity of the fracture decreases. The changes in the acoustic emission b value and R2 of the rock sample under different freeze–thaw cycles based on the test data are shown in Figure 12.
As can be seen from Figure 12, the b value of the dry rock sample is slightly smaller than that of the saturated rock sample. The main reason is that water weakens the saturated rock sample to a certain extent due to dissolution, lubrication, oxidation, etc., on the biotite granulite. The b value of the low freeze–thaw cycle rock sample gradually decreases from 1.2097 to 1.0918, which reveals that the number of large-magnitude impacts of the rock sample under the load is gradually increasing with the increase in freeze–thaw times. Moreover, the development and expansion speed of the microcracks of the rock sample under repeated freeze–thaw effects increase gradually. The b value of the rock sample with a high freeze–thaw cycle gradually increases with the increase in the number of freeze–thaw cycles, from 1.2390 to 1.4279. The number of overall cracks and fractures in the rock sample decreases significantly with the increase in the number of freeze–thaw cycles in Figure 6. Furthermore, the number of large-scale cracks and fractures is reduced the most. This indicates that the cracks in the rock samples with high freeze–thaw cycles are mature, and the cracks penetrate each other to form a local crack network, and the number of cracks has doubled. Moreover, the local crack network gradually penetrates and merges to form a larger-scale crack network as the number of freeze–thaw cycles continues to increase. Large-scale cracks are easier to penetrate and merge than small-scale cracks. It can be seen that the b value of the rock sample with a high freeze–thaw cycle increases significantly.

5. Temporal and Spatial Distribution of Acoustic Emission Events in Biotite Granulite Under Freeze–Thaw Action

Three-dimensional localization of acoustic emission can directly reflect the initiation, propagation, and spatial distribution of microcracks in rock samples.
The evolution laws of acoustic emission impact parameters and dominant frequency indicate significant differences in the freeze–thaw damage evolution mechanisms of biotite granulite under low and high freeze–thaw cycle conditions. Using the Geiger algorithm, the source locations of seismic events were traced, obtaining the activity locations of internal microcracks during the loading process of the rock samples.
The distribution of the source of the rock sample under low and high freeze–thaw cycles in the compaction stage (I), elastic deformation stage (II), stable development stage of microcracks (III), and accelerated expansion stage of microcracks (IV) is analyzed, as shown in Figure 13.
The size of the acoustic emission events (represented by spheres of different colors) in Figure 13 is determined by the energy level variations during the loading process, while the color indicates the changes in magnitude. As shown in Figure 13, the rock sample exhibits relatively low source energy levels and magnitudes during the compaction stage, elastic deformation stage, and stable microcrack development stage, with a relatively sparse distribution of acoustic emission events under low freeze–thaw cycle conditions; the number of seismic sources in the rock sample increases rapidly and is densely distributed in the accelerated expansion of microcracks stage. A large number of high-energy signals emerge during this stage, but their distribution shows little correlation with that of the seismic sources from the previous three stages. As the rock sample fractures, its internal multiscale cracks gradually connect to form macroscopic cracks, ultimately causing instability and failure. The failure mode mainly involves a combination of tensile and shear failures with multiple cracks. Under high freeze–thaw cycle conditions, the number of seismic sources in the rock sample increases significantly from the compaction stage to the stable microcrack development stage. The rock sample subjected to 70 freeze–thaw cycles exhibits the highest source energy level, magnitude, and distribution density during these three stages. However, as the freeze–thaw cycle count continues to increase, both the energy level and magnitude gradually decrease, and the number of acoustic emission events also drops noticeably. In the accelerated expansion stage of microcracks, the cracks in the rock sample continue to develop and extend along the evolution directions observed in the previous three stages. As a result, the number of microcracks in the sample gradually decreases with the increase in freeze–thaw cycles. Similarly, the occurrence of high-energy and high-magnitude signals also declines significantly. The failure mode of the rock sample is predominantly characterized by single-crack tensile-shear failure during fracture.
It can be observed that the multiscale cracks in the rock sample are mainly concentrated in the accelerated expansion stage of microcracks under low freeze–thaw cycle conditions. The concentrated locations show no significant correlation with the microcrack development under medium and low loads. This indicates that the load-bearing capacity of the rock sample primarily relies on the rigidity of its framework. The crack structures are predominantly composed of microcracks and small-scale cracks, with fewer large-scale cracks, and the cracks are relatively dispersed. Under high freeze–thaw cycles, large-, medium-, and small-scale cracks in the rock sample are prominently distributed throughout the entire loading process. The number of cracks under medium and low loads gradually decreases, along with reductions in energy levels and magnitudes. This illustrates that under high freeze–thaw cycles, the crack structure of the rock sample becomes more mature, with further expansion of medium- and large-scale cracks and a reduction in the number of small-scale cracks. Cracks continue to develop under medium and low loads, altering the internal stress equilibrium of the rock sample. This causes localized stress concentration at the crack, further accelerating crack propagation and development. Repeated freeze–thaw cycles rapidly exacerbate the deterioration of the rock’s internal structure, leading to a gradual decrease in the number, magnitude, and energy levels of seismic sources under high loads. Consequently, the rock sample fails along the more developed weakened planes.

6. Damage Variable Coupling Relationship Based on Cumulative Ring Counts

Rock, as a natural mineral material, inherently contains various primary defects (microcracks, micropores, voids, etc.), which are further exacerbated under freeze–thaw cycles or external loading. This accelerates the development of internal primary defects, leading to significant deterioration in the rock’s structure or properties. Based on the experimental results, it is evident that the mechanical parameters and acoustic emission characteristics of rock samples under high and low freeze–thaw cycles exhibit notable differences under loading conditions. Moreover, it can be inferred that the damage deterioration tendencies and failure modes of rock samples differ between high and low freeze–thaw cycles according to the patterns of parameter variation. Therefore, this study employs cumulative acoustic emission ring counts to quantify the loading-induced damage characteristics of rock samples under both high and low freeze–thaw cycles.
The damage variable can be used to characterize the degree of material degradation, essentially serving as a “degradation operator.” Its physical meaning is the ratio of the area that has lost its load-bearing capacity due to damage to the original intact area. The damage variables are divided into two categories: microscopic and macroscopic. The geometric features of cracks and pores are primarily used as damage variables at the microscopic level, while the material’s physical and mechanical parameters and other monitoring data serve as damage variables at the macroscopic level.
There is a good corresponding relationship between the cumulative ringing count of acoustic emission and the generation and expansion of micro-cracks in the internal structure of rock, as well as the dislocation and friction between mineral particles. Therefore, the cumulative acoustic emission ring count is selected to quantify the damage characteristics of biotite granulite under load across different freeze–thaw cycles.
The uniaxial compression test is conducted by controlling the displacement, where the strain of the rock increases linearly with time t. The calculation formula is as follows:
ε = k t + ε 0
where ε is the axial strain; k represents the strain rate; and ε 0 is the initial strain.
Wu Xianzhen [44] categorized rock failure into three types based on the distribution characteristics of cumulative acoustic emission ring counts with time: brittle failure, brittle-ductile failure, and ductile failure. Comparing the distribution characteristics of acoustic emission impact parameters of rock samples with time under the action of different freeze–thaw cycles, it is found that the rock samples with low freeze–thaw cycles are more in line with the characteristics of brittle failure. While rock samples subjected to high freeze–thaw cycles are more consistent with brittle-ductile or ductile failure characteristics. By fitting the cumulative acoustic emission ring count curves of rock samples after freeze–thaw cycles, it was observed that an exponential function can represent the relationship between the cumulative acoustic emission ring count N and time t for brittle failure, while a cubic function can represent the relationship for brittle-ductile or ductile failure. The specific formulae are expressed as Equations (5) and (6):
N = A 1 e B 1 t + C 1
where A1, B1, and C1 represent the fitting parameters.
N = A + B t + C t 2 + D t 3
where A, B, C, and D represent the fitting parameters.
By combining Equations (4)–(6), the coupling relationships between cumulative acoustic emission ring counts and strain for brittle, brittle-ductile, or ductile failure, corresponding to rock samples under low and high freeze–thaw cycles, can be determined. The relationships are expressed as Equations (7) and (8).
Rock sample with low freeze–thaw cycles (brittle failure):
N = A 1 e B 1 ( ε ε 0 ) k + C 1
Rock samples with high freeze–thaw cycles (brittle-ductile or ductile failure):
N = A + B ( ε ε 0 ) k + C ( ε ε 0 ) 2 k 2 + D ( ε ε 0 ) 3 k 3
Based on the heterogeneity of rock, the mechanical properties of its internal microelements are probabilistically distributed. The degree of rock damage is closely related to the distribution of its internal defects, while its internal defects affect the strength of the microelement. The relationship between the damage variable D of the rock sample and the statistical distribution density of microelement failure is expressed as Equation (9):
d D d ε = φ ( ε )
where φ (ε) is a measure of the damage rate of the rock’s microelements under loading.
Assuming that the micro-unit strength of rock obeys the Weibull distribution function, and according to the geometric conditions of the stress–strain relationship, the damage evolution equation of rock under load can be obtained from Equation (9), as Equation (10):
D = 0 ε φ ( x ) d x = 0 ε m α ε m 1 e ( ε α ) m d x = 1 e ( ε α ) m
where m and a represent the material characteristic parameters.
According to the rock damage constitutive model under uniaxial compression conditions established by Yang Minghui et al. [45], the parameters m and a are determined and expressed as Equations (11) and (12):
m = 1 ln ( E 0 ε c / σ c )
α m = m ε c m
where σ c is the peak stress of the rock, MPa;
  • ε c is the peak strain of the rock;
  • Ε 0 is the elastic modulus of the rock, GPa.
By combining Equation (7) with Equation (10), the coupling relationship between the cumulative acoustic emission ring count and the damage variable for rock samples under low freeze–thaw cycle conditions can be derived, as expressed in Equation (13):
D = 1 e 1 α m ( k B 1 ln N C 1 A 1 + ε 0 ) m
Substituting the experimental data into Equation (4), the slope k = 1.32 × 10⁻⁵ and the initial strain ε 0 = −4.28 × 10⁻⁶ are determined. It is evident that the initial strain value of the rock sample is extremely small when the biotite granulite is preloaded to 1 kN. Since this value is not a decisive parameter in the equation, the initial strain ε 0 is set to 0 for simplification. Equations (14) and (16) are obtained:
D k 3 ε 3 + C k 2 ε 2 + B k ε + A N = 0
a, b, c, and d are the coefficients of the equation, and the calculation method is shown in Formula (15):
a = D k 3 b = C k 2 c = B k d = A N
Then, Equation (8) is rewritten into its standard form, as shown in Equations (16)–(18):
Using Cardano’s general formula to solve the equation, if q2/4 + p3/27 > 0, the equation has one real root and two complex roots. Only the real root is calculated, while the complex roots are not considered.
ε 3 + p ε + q = 0
p = 3 a c b 2 3 a 2
q = 2 b 3 27 a 3 b c 3 a 2 + d a
ε = q 2 + q 2 4 + p 3 27 3 + q 2 q 2 4 + p 3 27 3
Through simultaneous Equations (10) and (14)–(19), the coupling relationship between acoustic emission cumulative ringing count and damage variable of rock samples with high freeze–thaw cycle is shown as Equation (20):
D = 1 e 1 α m ( q 2 + q 2 4 + p 3 27 3 + q 2 q 2 4 + p 3 27 3 ) m
The cumulative acoustic emission (AE) ring count with time distribution curves for rock samples under low and high freeze–thaw cycles are fitted using exponential and cubic functions, respectively. The fitting parameters, along with their corresponding mechanical parameters, are substituted into Equations (13) and (20) to determine the parameter values of the damage variable evolution functions for rock samples under low and high freeze–thaw cycle conditions.
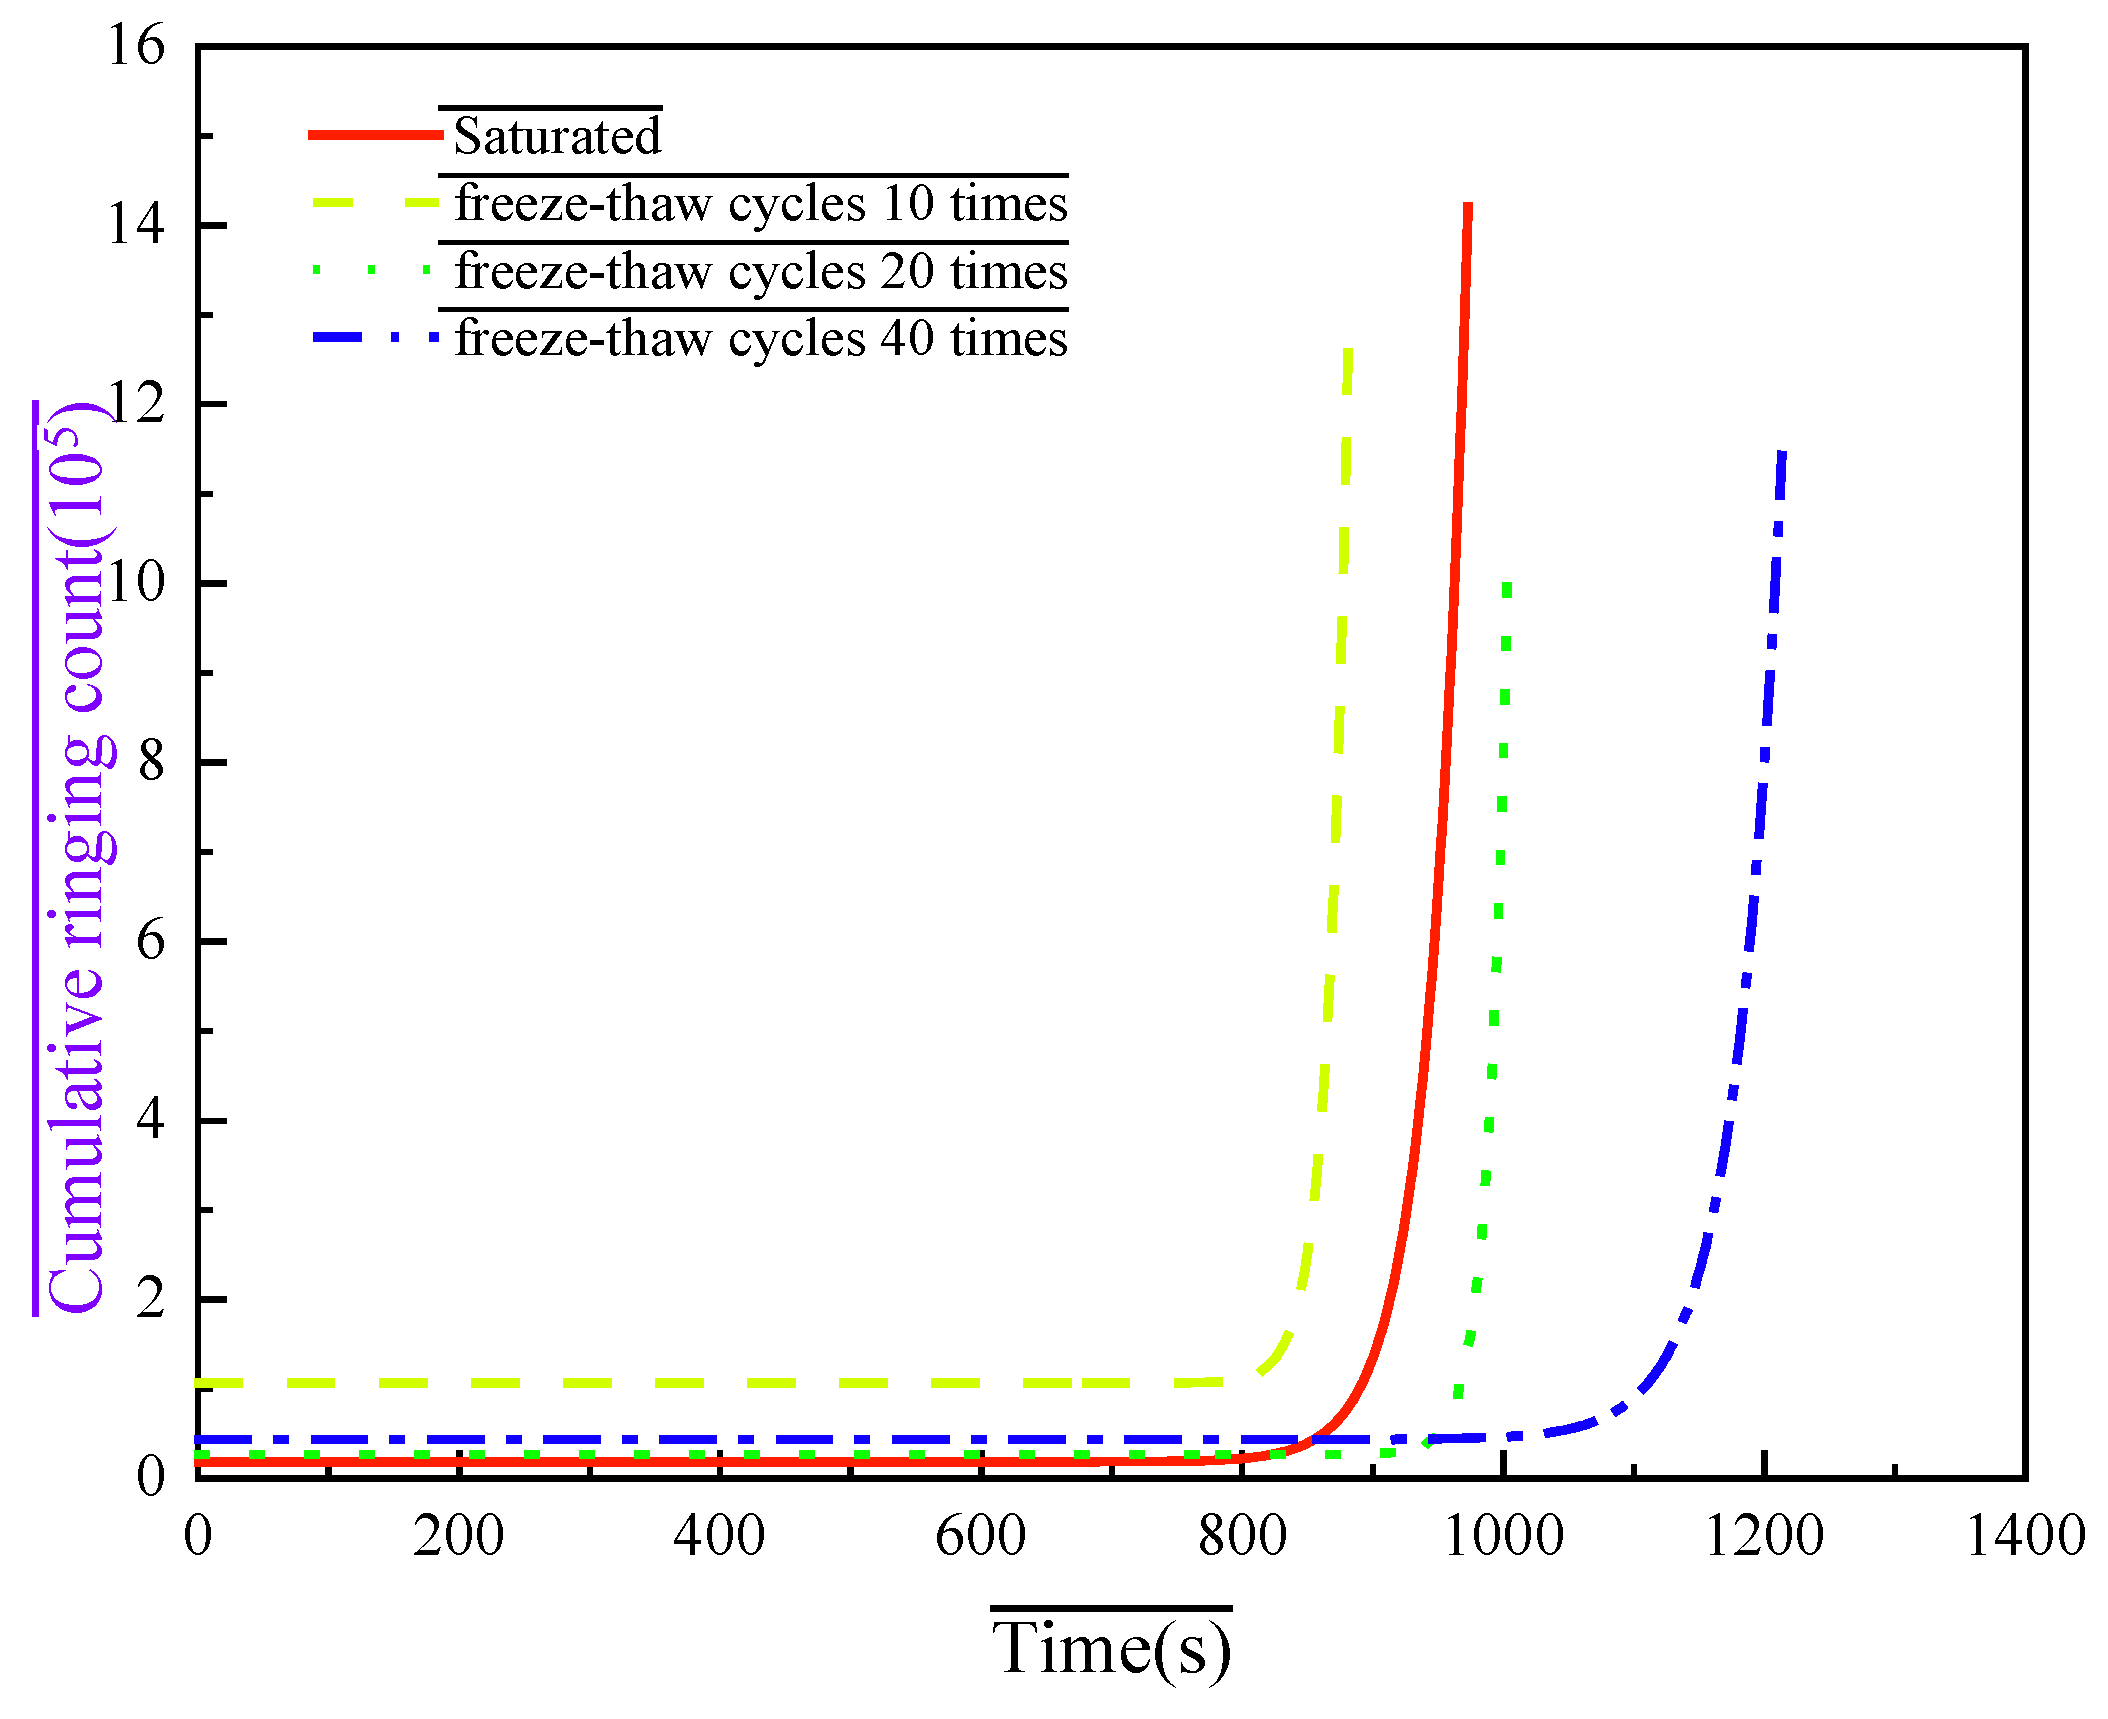
The parameters of the damage variable evolution function for rock samples under low freeze–thaw cycle conditions are shown in Table 3. To more intuitively illustrate the conclusion that the cumulative ring count of biotite granulite generally decreases with an increasing number of freeze–thaw cycles under low freeze–thaw cycle conditions, cumulative ring count curves for the rock under different freeze–thaw cycles were plotted, as shown in Figure 14.
The calculated damage variables corresponding to the cumulative ring counts at the time of fracture for the saturated, 10-cycle, 20-cycle, and 40-cycle freeze–thaw rock samples are 0.0016, 0.0189, 0.0193, and 0.0274, respectively. This indicates that the damage variable of the rock samples gradually increases with the number of freeze–thaw cycles. Simultaneously, the A1 value decreases with an increasing number of freeze–thaw cycles, while B1 and C1 values show an increasing trend in Table 3. As shown in Figure 8, the cumulative ring count of the rock samples at the time of fracture exhibits an overall decreasing trend with an increasing number of freeze–thaw cycles.
The parameters of the damage variable evolution function for rock samples under high freeze–thaw cycle are shown in Table 4.
The cumulative ring counts corresponding to the damage variables at the time of fracture for rock samples subjected to 70, 100, 130, 180, 230, and 280 freeze–thaw cycles are 0.0596, 0.0796, 0.1146, 0.1371, 0.1961, and 0.1979, respectively. It can be seen that the damage variable of the rock samples increases significantly with the number of freeze–thaw cycles.
The scatter plot of the damage variable corresponding to the freeze–thaw cycle was drawn, and the data were fitted. As shown in Figure 15, the freeze–thaw damage evolution equation for biotite granulite was obtained.
The damage evolution equation for rock samples under low freeze–thaw cycles can be expressed by
D n = 0.00689 + 5.65914 × 10 4 n
The damage evolution equation for rock samples under high freeze–thaw cycles can be expressed by
D n = 0.01428 + 7.06221 × 10 4 n
Based on the equivalence hypothesis proposed by LEMAITRE and the irreversible thermodynamics theory, the damage evolution constitutive equation for rock was derived. Its one-dimensional expression is given as Equation (23).
σ = ( 1 D ) E ε
Substituting Equations (21) and (22) into the above expression, the freeze–thaw damage models for biotite granulite under low and high freeze–thaw cycles are derived as follows:
σ = ( 0.99311 5.65914 × 10 4 n ) E ε
σ = ( 0.98572 7.06221 × 10 4 n ) E ε
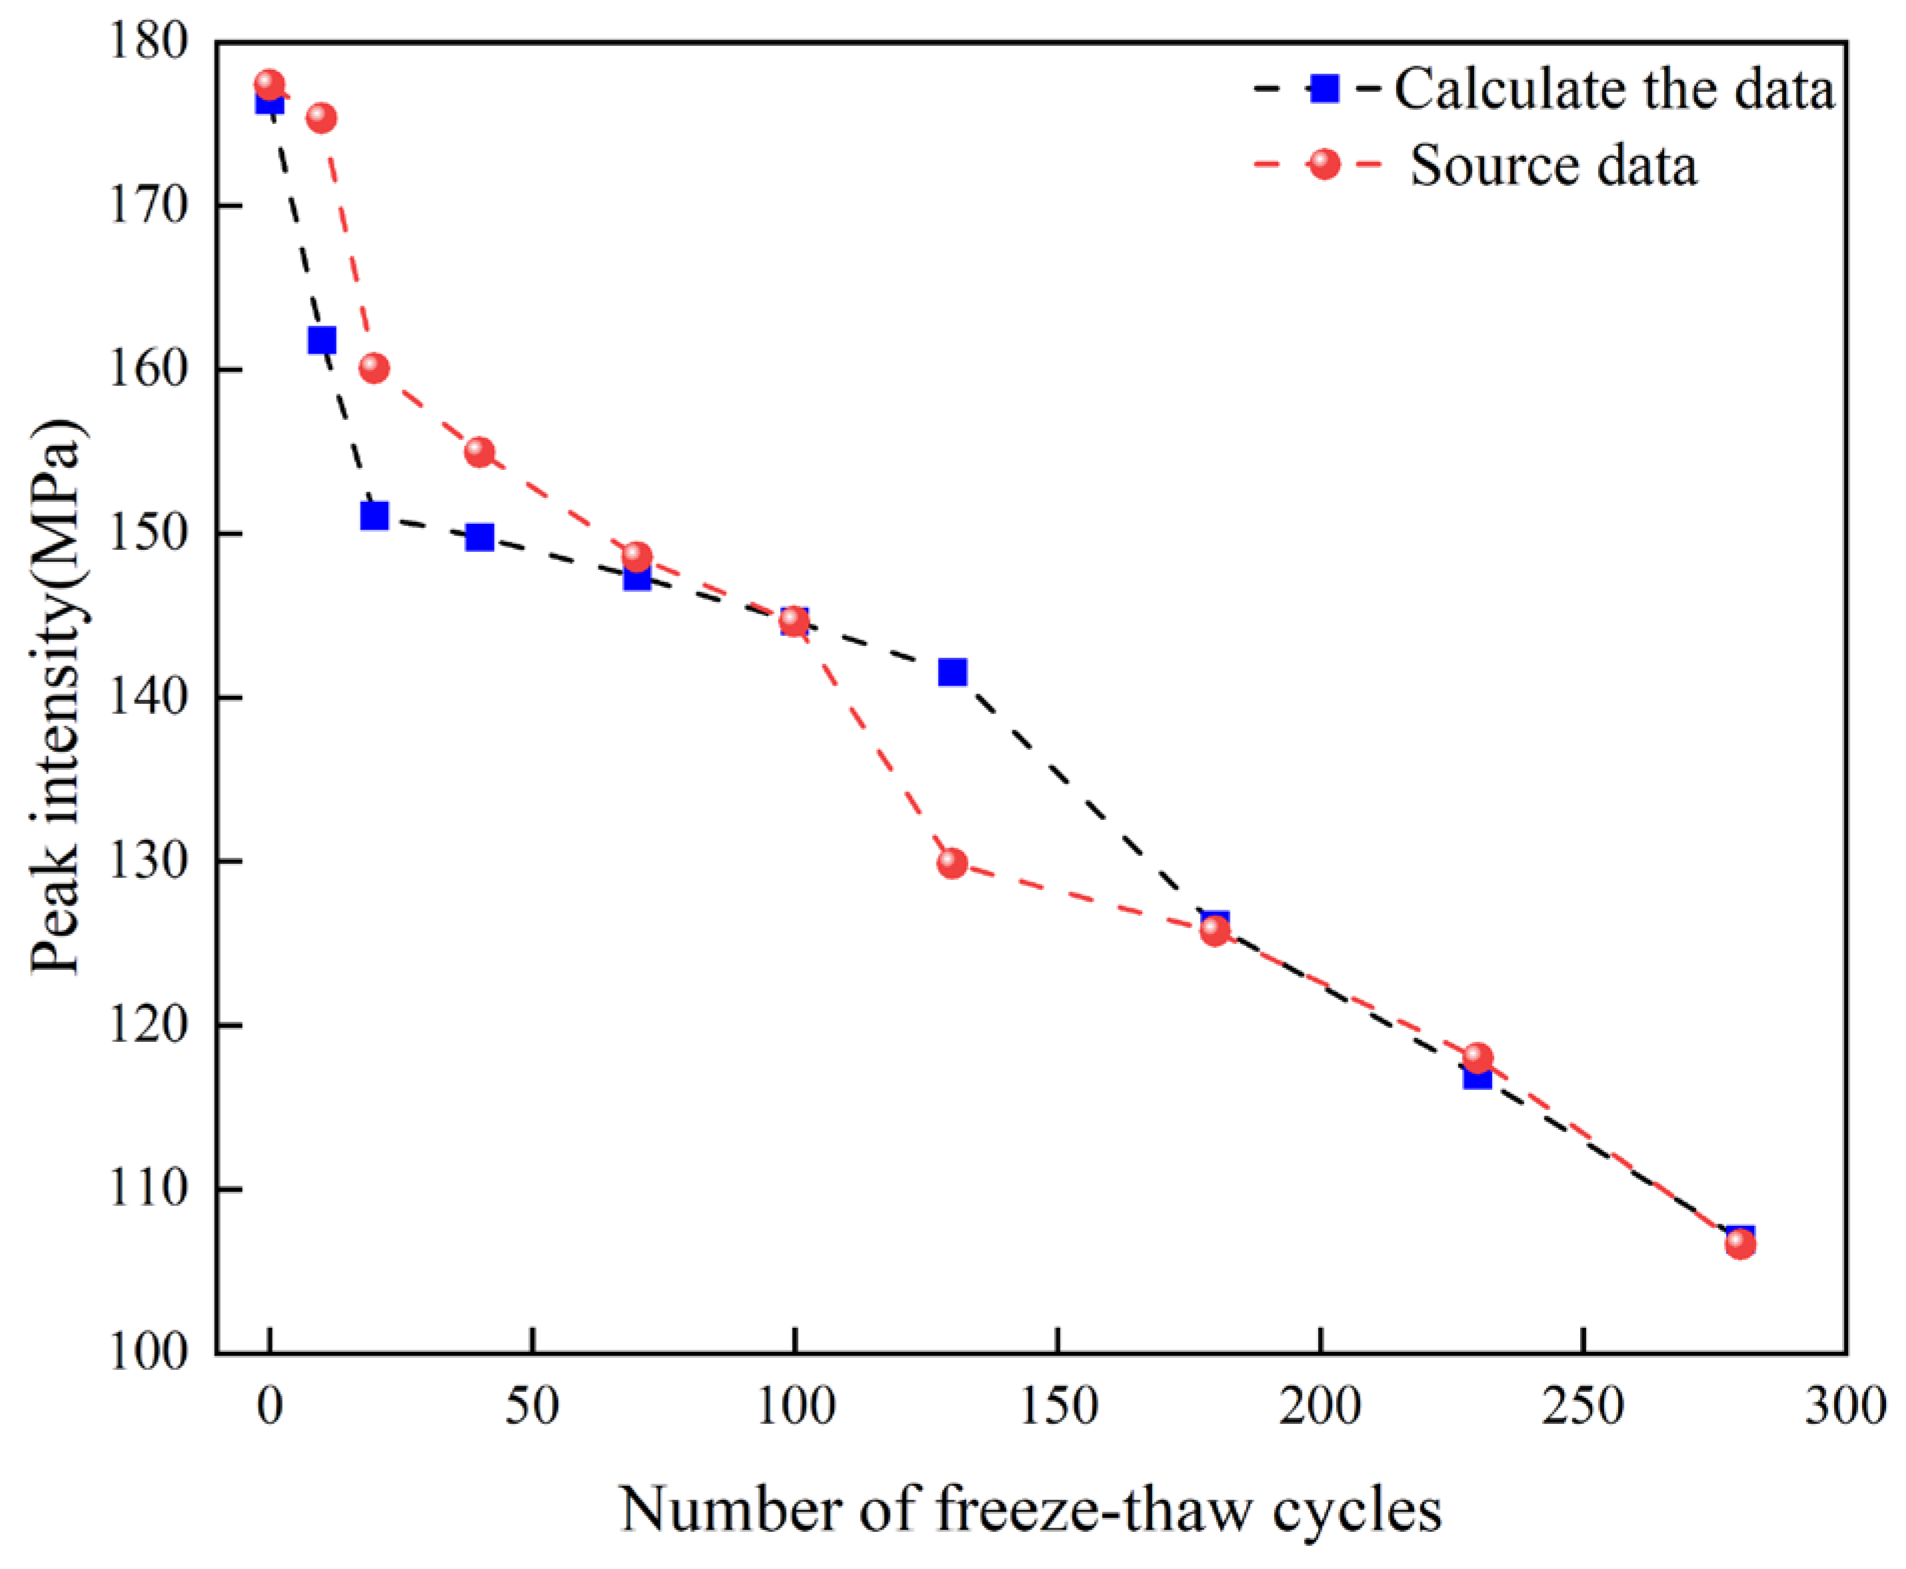
Substituting the data, the calculated results and the experimental results are plotted in Figure 16.
As shown in Figure 16, the calculated peak strength based on the damage variable is slightly different from the experimental results, indicating that the established damage model using cumulative acoustic emission ring counts is highly reliable. However, the damage variable under low freeze–thaw cycle conditions requires further adjustment.

7. Conclusions

(1) The reductions in peak strength, elastic modulus, acoustic emission impact count, cumulative ringing count, and cumulative energy of banded magnetite-quartzite under low freeze–thaw cycles are all significantly greater than those observed under high freeze–thaw cycles. Before and after 40 freeze–thaw cycles, the single b-value of the rock samples first decreases and then increases. As the number of freeze–thaw cycles increases, the decrease in the number of large-magnitude impacts is greater than that of small-magnitude impacts. This suggests that with more freeze–thaw cycles, the formation of new large-scale cracks during failure is gradually reduced. Moreover, the ability to resist deformation gradually decreases, while the amount of plastic deformation during the loading process steadily increases.
(2) Based on the variation characteristics of parameters such as peak strength, elastic modulus, acoustic emission impact metrics, and single b-value with the increase in freeze–thaw cycles, it is determined that the freeze–thaw damage mechanism of rock samples under low freeze–thaw cycles is primarily dominated by the first type of action (freeze–thaw damage theory). In contrast, for rock samples under high freeze–thaw cycles, the damage mechanism is induced jointly by the first and second types of actions.
(3) Based on the cumulative ringing count of acoustic emission, the coupling relationship between the damage variables of biotite granulite under low and high freeze–thaw cycles is established. The exponential function is used to express the functional relationship between the cumulative ringing count of acoustic emission and time. The rock samples with many freeze–thaw cycles are characterized by brittle-ductile or ductile failure. Cubic function is used to express the relationship between the acoustic emission cumulative ringing count and time.
(4) For rock samples under low freeze–thaw cycles, high-energy acoustic emission signals are primarily concentrated during the accelerated expansion stage of microcracks and are relatively abundant. In contrast, for samples under high freeze–thaw cycles, the distribution of high-energy acoustic emission signals is more scattered, and their quantity significantly decreases with the increase in freeze–thaw cycles. For rock samples under low freeze–thaw cycles, the number of microcracks in the first three stress stages is relatively low, with no apparent correlation to the crack concentration areas at failure. However, for rock samples under low freeze–thaw cycles, there is a clear sequential relationship between the locations where cracks form and the areas where cracks concentrate during failure.
(5) Coupled relationships for damage variables of banded magnetite-quartzite under low and high freeze–thaw cycles were established separately. The freeze–thaw damage evolution equations under respective loading conditions were calculated. Damage models for banded magnetite-quartzite under low and high freeze–thaw cycles were derived, and preliminary validation of these models was conducted.
This study conducted mechanical and acoustic emission tests on banded magnetite-quartzite, which plays a critical role in controlling the stability of the east-dip bedding rock slope of the Yanshan Iron Mine, after freeze–thaw cycles. By combining the existing freeze–thaw damage theory, the freeze–thaw damage mechanism suitable for banded magnetite-quartzite was further explored. Freeze–thaw damage models for low and high freeze–thaw cycle conditions were established, providing a reference for the study of damage deterioration mechanisms in anisotropic rocks and the stability of dip slopes under freeze–thaw effects. However, the findings of this study are primarily based on acoustic emission characteristic parameters of rocks under different freeze–thaw cycles. Future research should focus on the following aspects to comprehensively reveal the damage deterioration mechanisms of anisotropic rocks under freeze–thaw conditions.
(1) By analyzing the variation of acoustic emission parameters of rock samples with different freeze–thaw cycles during loading, the relationship between the number, scale, and energy dissipation of microcracks and freeze–thaw cycles was explored.
(2) Through mechanical tests and CT scanning experiments on banded magnetite-quartzite under different freeze–thaw cycles, rock mechanics parameters, as well as pore and fracture distribution characteristics of rock samples subjected to varying freeze–thaw cycles are obtained. Using multi-scale simulation methods, the formation and propagation mechanisms of micro-scale damage in rocks under the multi-field coupling effects of freeze–thaw cycles are explored.

Author Contributions

B.L. was associated with validation, the original draft, and literature collection. D.X. was associated with the validation, framework, and correction process. All authors have read and agreed to the published version of the manuscript.

Funding

This research was funded by “The Key Basic Research Project of Hebei Province”, grant number (22375403D).

Institutional Review Board Statement

Not applicable.

Informed Consent Statement

Not applicable.

Data Availability Statement

The original contributions presented in this study are included in the article. Further inquiries can be directed to the corresponding author.

Conflicts of Interest

The authors declare no conflicts of interest.

References

  1. Yun, M.; Ren, J.; Song, Y.; Zhang, L.; Sun, C.; Chang, P.; Cao, X. Fracture Mechanism and Damage Constitutive Model of Freeze–Thaw Fissured Granite Subjected to Fatigue Loading. Appl. Sci. 2024, 14, 6324. [Google Scholar] [CrossRef]
  2. Chen, L.; Li, K.; Song, G.; Zhang, D.; Liu, C. Effect of freeze–thaw cycle on physical and mechanical properties and damage characteristics of sandstone. Sci. Rep. 2021, 11, 12315. [Google Scholar] [CrossRef]
  3. Qiu, W.L.; Teng, F.; Pan, S.S. Damage constitutive model of concrete under repeated load after seawater freeze-thaw cycles. Constr. Build. Mater. 2020, 236, 117560. [Google Scholar] [CrossRef]
  4. Yang, G.S.; Shen, Y.J.; Jia, H.L.; Wei, Y.; Zhang, H.; Liu, H. Research progress and tendency in characteristics of multi-scale damage mechanics of rock under freezing-thawing. Chin. J. Rock. Mech. Eng. 2018, 37, 545–563. [Google Scholar]
  5. Xu, X.; Wang, Y.; Yin, Z.; Zhang, H. Effect of temperature and strain rate on mechanical characteristics and constitutive model of frozen Helin loess. Cold Reg. Sci. Technol. 2017, 136, 44–51. [Google Scholar] [CrossRef]
  6. Lan, H.; Zhang, Y.; Macciotta, R.; Li, L.; Wu, Y.; Bao, H.; Peng, J. The role of discontinuities in the susceptibility, development, and runout of rock avalanches: A review. Landslides 2022, 19, 1391–1404. [Google Scholar] [CrossRef]
  7. Chen, D.; Li, G.; Li, J.; Du, Q.; Zhou, Y.; Mao, Y.; Qi, S.; Tang, L.; Jia, H.; Peng, W. Mechanical characteristics and damage evolution of granite under freeze–thaw cycles. Front. Energy Res. 2023, 10, 983705. [Google Scholar] [CrossRef]
  8. Gao, F.; Xiong, X.; Xu, C.; Zhou, K. Mechanical property deterioration characteristics and a new constitutive model for rocks subjected to freeze-thaw weathering process. Int. J. Rock. Mech. Min. Sci. 2021, 140, 104642. [Google Scholar] [CrossRef]
  9. Yamabe, T.; Neaupane, K. Determination of some thermo-mechanical properties of Sirahama sandstone under subzero temperature condition. Int. J. Rock. Mech. Min. Sci. 2001, 38, 1029–1034. [Google Scholar] [CrossRef]
  10. Yavuz, H.; Altindag, R.; Sarac, S.; Ugur, I.; Sengun, N. Estimating the index properties of deteriorated carbonate rocks due to freeze–thaw and thermal shock weathering. Int. J. Rock. Mech. Min. Sci. 2006, 43, 767–775. [Google Scholar] [CrossRef]
  11. Fan, L.; Xu, C.; Wu, Z. Effects of cyclic freezing and thawing on the mechanical behavior of dried and saturated sandstone. Bull. Eng. Geol. Environ. 2020, 79, 755–765. [Google Scholar] [CrossRef]
  12. Hou, C.; Jin, X.; He, J.; Li, H. Experimental studies on the pore structure and mechanical properties of anhydrite rock under freeze-thaw cycles. J. Rock. Mech. Geotech. Eng. 2022, 14, 781–797. [Google Scholar] [CrossRef]
  13. Mutlutürk, M.; Altindag, R.; Türk, G. A decay function model for the integrity loss of rock when subjected to recurrent cycles of freezing–thawing and heating–cooling. Int. J. Rock. Mech. Min. Sci. 2004, 41, 237–244. [Google Scholar] [CrossRef]
  14. Yavuz, H. Effect of freeze–thaw and thermal shock weathering on the physical and mechanical properties of an andesite stone. Bull. Eng. Geol. Environ. 2011, 70, 187–192. [Google Scholar] [CrossRef]
  15. Zhang, H.; Meng, X.; Yang, G. A study on mechanical properties and damage model of rock subjected to freeze-thaw cycles and confining pressure. Cold Reg. Sci. Technol. 2020, 174, 103056. [Google Scholar] [CrossRef]
  16. Cao, J.; Hu, J.; Wang, X.; Yang, B.; Xia, Z.; Wang, H.; Zhang, L. Mechanical properties and acoustic emission characteristics of mixed granite after different numbers of freeze—thaw cycles. Sci. Rep. 2024, 14, 14074. [Google Scholar] [CrossRef]
  17. Huang, S.; Liu, Q.; Cheng, A.; Liu, Y. A statistical damage constitutive model under freeze-thaw and loading for rock and its engineering application. Cold Reg. Sci. Technol. 2018, 145, 142–150. [Google Scholar] [CrossRef]
  18. Fang, W.; Jiang, N.; Luo, X. Establishment of damage statistical constitutive model of loaded rock and method for determining its parameters under freeze-thaw condition. Cold Reg. Sci. Technol. 2019, 160, 31–38. [Google Scholar] [CrossRef]
  19. Niu, C.; Zhu, Z.; Zhou, L.; Li, X.; Ying, P.; Dong, Y.; Deng, S. Study on the microscopic damage evolution and dynamic fracture properties of sandstone under freeze-thaw cycles. Cold Reg. Sci. Technol. 2021, 191, 103328. [Google Scholar] [CrossRef]
  20. Liu, T.; Zhang, C.; Cao, P.; Zhou, K. Freeze-thaw damage evolution of fractured rock mass using nuclear magnetic resonance technology. Cold Reg. Sci. Technol. 2020, 170, 102951. [Google Scholar] [CrossRef]
  21. Zhang, H.M.; Xie, X.M.; Peng, C.; Yang, G.S.; Ye, W.J.; Sheng, Y.J. Constitutive model for damage of freeze-thaw rock under three-dimensional stress. Chin. J. Geotech. Eng. 2017, 39, 1444–1452. [Google Scholar]
  22. Meng, X.; Zhang, H.; Yuan, C.; Li, Y.; Liu, X.; Chen, S.; Shen, Y. Damage constitutive prediction model for rock under freeze–thaw cycles based on mesoscopic damage definition. Eng. Fract. Mech. 2023, 293, 109685. [Google Scholar] [CrossRef]
  23. Zhai, C.; Wu, S.; Liu, S.; Qin, L.; Xu, J. Experimental study on coal pore structure deterioration under freeze–thaw cycles. Environ. Earth Sci. 2017, 76, 1–12. [Google Scholar] [CrossRef]
  24. Luo, X.; Zhou, S.; Huang, B.; Jiang, N.; Xiong, M. Effect of freeze–thaw temperature and number of cycles on the physical and mechanical properties of marble. Geotech. Geol. Eng. 2021, 39, 567–582. [Google Scholar] [CrossRef]
  25. Wang, J.; Cui, D.; Chen, Q.; Chen, J.; Dai, M. Morphological damage and strength deterioration of red sandstone under freeze–thaw cycles. J. Rock. Mech. Geotech. Eng. 2023, 17, 671–687. [Google Scholar] [CrossRef]
  26. Zhang, C.; Tan, T.; Ke, B.; Ma, B.; Dai, B.; Fang, Z.; Zhao, E. CT measurement of damage characteristics of meso-structure of freeze-thawed granite in cold regions and preliminary exploration of its mechanical behavior during a single freeze-thaw process. Appl. Rheol. 2023, 33, 20230106. [Google Scholar] [CrossRef]
  27. Wang, Y.; Li, C.; Liu, H.; Han, J. Fracture failure analysis of freeze–thawed granite containing natural fracture under uniaxial multi-level cyclic loads. Theor. Appl. Fract. Mech. 2020, 110, 102782. [Google Scholar] [CrossRef]
  28. Liu, H.; Yang, G.; Yun, Y.; Lin, J.; Ye, W.; Zhang, H.; Zhang, Y.; Lin, H. Investigation of Sandstone Mesostructure Damage Caused by Freeze-Thaw Cycles via CT Image Enhancement Technology. Adv. Civ. Eng. 2020, 2020, 8875814. [Google Scholar] [CrossRef]
  29. Liang, Y.; Yang, Q.; Zhu, L.; Jiang, T.; Gao, M. Study on the acoustic emission and thermal infrared signal characteristics of granite with freeze-thaw damage in cycle loading process. Front. Earth Sci. 2022, 10, 1002888. [Google Scholar] [CrossRef]
  30. Zhang, X.; Luo, X.; He, X.; Niu, S. Pore structure expansion and evolution in sandstone with prefabricated crack under freeze-thaw cycles based on CT scanning. Front. Earth Sci. 2024, 12, 1394731. [Google Scholar] [CrossRef]
  31. Liu, B.; Ma, Y.; Zhang, G.; Xu, W. Acoustic emission investigation of hydraulic and mechanical characteristics of muddy sandstone experienced one freeze-thaw cycle. Cold Reg. Sci. Technol. 2018, 151, 335–344. [Google Scholar] [CrossRef]
  32. Wang, Y.; Han, J.Q.; Li, C.H. Acoustic emission and CT investigation on fracture evolution of granite containing two flaws subjected to freeze–thaw and cyclic uniaxial increasing-amplitude loading conditions. Constr. Build. Mater. 2020, 260, 119769. [Google Scholar] [CrossRef]
  33. Zhou, Y.; Li, L.; Liu, Y.; Zhang, Z.; Matsui, T. Clustering analysis of acoustic emission signals in the monitoring of stone monuments: Case of the freeze—thaw deterioration of tuffs. Herit. Sci. 2023, 11, 119. [Google Scholar] [CrossRef]
  34. Momeni, A.; Abdilor, Y.; Khanlari, G.R.; Heidari, M.; Sepahi, A.A. The effect of freeze–thaw cycles on physical and mechanical properties of granitoid hard rocks. Bull. Eng. Geol. 2016, 75, 1649–1656. [Google Scholar] [CrossRef]
  35. Gao, F.; Cao, S.; Zhou, K.; Lin, Y.; Zhu, L. Damage characteristics and energy-dissipation mechanism of frozen–thawed sandstone subjected to loading. Cold Reg. Sci. Technol. 2020, 169, 102920.1–102920.9. [Google Scholar] [CrossRef]
  36. Wang, Y.; Feng, W.; Wang, H.; Han, J.; Li, C. Geomechanical and Acoustic Properties of Intact Granite Subjected to Freeze–Thaw Cycles during Water-Ice Phase Transformation in Beizhan’s Open Pit Mine Slope, Xinjiang, China. Water 2019, 11, 2309. [Google Scholar] [CrossRef]
  37. Song, Y.Q.; Ma, H.F.; Liu, J.C.; Li, X.S.; Zheng, J.J.; Fu, H. Experimental investigation on the damage characteristics of freeze-thaw limestone by the uniaxial compression and acoustic emission monitoring tests. Chin. J. Rock. Mech. Eng. 2022, 41, 2603–2614. [Google Scholar]
  38. Liu, C.Y.; Zheng, D.Z.; Zhang, X.X.; Chen, C.H.; Cao, Y.B. Influence of freeze-thaw temperature change rate on mechanics feature of rock during loading process. Rock. Soil. Mech. 2022, 43, 2071–2082. [Google Scholar]
  39. Wang, C.; You, R.; Lv, W.; Sui, Q.; Yan, Y.; Zhu, H. Damage Evolution and Acoustic Emission Characteristics of Sandstone under Freeze–Thaw Cycles. ACS Omega 2024, 9, 4892–4904. [Google Scholar] [CrossRef]
  40. Yang, G.; Liang, B.; Liu, H.; Shen, Y.; Jia, H.; Kłosowski, P. Mechanical Properties and Acoustic Emission Characteristics of Thawing Frozen Sandstone. Adv. Mater. Sci. Eng. 2022, 2022, 2156710. [Google Scholar] [CrossRef]
  41. Maji, V.; Murton, J.B. Experimental observations and statistical modeling of crack propagation dynamics in limestone by acoustic emission analysis during freezing and thawing. J. Geophys. Res. Earth Surf. 2021, 126, e2021JF006127. [Google Scholar] [CrossRef]
  42. Abbas, H.A.; Mohamed, Z.; Kudus, S.A. Anisotropic AE attenuation in mapping of composite specimen progressive failure under unconfined loading. Int. J. Geomech. 2023, 23, 04023005. [Google Scholar] [CrossRef]
  43. Debecker, B.; Vervoort, A.; Lai, J.C.S. Localization by acoustic emission in transversely isotropic slate. Adv. Acoust. Vib. 2011, 2011, 735913. [Google Scholar] [CrossRef]
  44. Wu, X.Z.; Liu, J.W.; Liu, X.X.; Zhang, Y.B. Study on the coupled relationship between AE accumulative ring-down count and damage constitutive model of rock. J. Min. Saf. Eng. 2015, 32, 28. [Google Scholar]
  45. Yang, M.H.; Zhao, M.H.; Cao, W.G. Method for determining the parameters of statistical damage softening constitutive model for rock. J. Hydraul. Eng. 2005, 36, 345–349. [Google Scholar]
Figure 1. Rock block collection and preparation.
Applsci 15 09665 g001
Figure 2. Mineral composition and distribution of biotite granulite.
Applsci 15 09665 g002
Figure 3. XRD diffraction pattern of biotite granulite.
Applsci 15 09665 g003
Figure 4. Distribution of cracks in optical slice samples and dry rock slices. (Eyepiece × Objective [10 × 2.5]).
Applsci 15 09665 g004
Figure 5. Schematic diagram of test equipment and process.
Applsci 15 09665 g005
Figure 6. Scatter plot of open porosity of biotite granulite under freeze–thaw action.
Applsci 15 09665 g006
Figure 7. Longitudinal wave velocity distribution of biotite granulite under freeze–thaw action.
Applsci 15 09665 g007
Figure 8. Distribution of uniaxial compressive strength of biotite granulite after freeze–thawing.
Applsci 15 09665 g008
Figure 9. Modulus of elasticity–freeze–thaw cycle relationship for biotite granulite.
Applsci 15 09665 g009
Figure 10. Characteristics of stress, impact rate, and cumulative ringing counts over time in biotite granulite with different freeze–thaw frequencies.
Applsci 15 09665 g010
Figure 11. Acoustic emission magnitude-impact number distribution of striated biotite granulite with different freeze–thaw frequencies.
Applsci 15 09665 g011
Figure 12. Distribution of b-value and R2 of striped biotite granulite with different numbers of freezing and thawing times.
Applsci 15 09665 g012
Figure 13. Localization and distribution of acoustic emission events in biotite granulite with different freeze–thaw cycles.
Applsci 15 09665 g013
Figure 14. Cumulative ringing counts of biotite granulite.
Applsci 15 09665 g014
Figure 15. Damage variables of biotite granulite under different freeze–thaw times.
Applsci 15 09665 g015
Figure 16. Source peak intensity and calculated distribution.
Applsci 15 09665 g016
Table 1. Basic physical parameters of rock samples.
Sample NameLongitudinal Wave Velocity in Dry State
/m·s−1
Longitudinal Wave Velocity in Saturation
/m·s−1
Moisture Content
/%
Dry Density
/g·cm−3
Saturation Density
/g·cm−3
Biotite granulite413051000.3553.2553.259
Table 2. Acoustic emission averaging cumulative parameters.
Times of Freeze–Thaw CyclesAverage Cumulative Impact CountsReduction Rate/%Cumulative Energy/aJReduction Rate/%Cumulative Ringing CountsReduction Rate/%
Dry143,36207.95 × 10902,833,8650
Saturated126,19811.974.84 × 10939.201,959,89930.84
10110,74922.755.53 × 10930.531,421,00149.86
20101,42729.255.02 × 10936.911,168,97558.75
40103,03728.134.31 × 10945.801,322,32553.34
70100,51729.894.89 × 10938.531,285,37254.64
100103,53027.784.95 × 10937.781,451,98448.76
130104,72326.953.56 × 10955.301,318,30453.48
18096,64532.593.06 × 10961.481,087,26261.63
23092,69635.343.60 × 10954.741,181,08058.32
28091,99135.832.54 × 10968.10825,30970.88
Table 3. Parameter values of the damage variable evolution function for biotite granulite at low freeze–thaw counts.
Freeze–Thaw Cycles/TimesPeak Strength/MPaElastic Modulus/GPaPeak
Strain ε c
Fitting ParametersR2
A1B1C1
Saturated sample177.3816.920.01115.39 × 10−90.045118,701.460.98
10175.3215.850.01114.17 × 10−200.0789106,713.560.92
20160.0812.380.01152.28 × 10−250.089327,062.870.96
40154.9711.220.01282.14 × 10−410.122043,855.910.97
Table 4. Parameter values of the damage variable evolution function for biotite granulite at high.
Freeze–Thaw Cycles/TimesPeak Strength/MPaElastic Modulus/GPaPeak
Strain ε c
Fitting ParametersR2
ABC
70148.5411.000.01228−43,482.501467.12−1.050.98
100144.6010.830.01251−16,884.433457.36−6.960.96
130129.8610.550.01306−14,153.00510.78−0.650.86
180125.729.460.01331−48,136.912007.88−3.590.96
230117.989.190.01364−65,506.631534.23−3.280.83
Disclaimer/Publisher’s Note: The statements, opinions and data contained in all publications are solely those of the individual author(s) and contributor(s) and not of MDPI and/or the editor(s). MDPI and/or the editor(s) disclaim responsibility for any injury to people or property resulting from any ideas, methods, instructions or products referred to in the content.