Article

Infrared Drying of Banana Slices: Quality Evaluation Using Spectral and Microstructural Analysis

by
Melih Atmaca
1 and
Mehmet Burak Büyükcan
2,*
1
Department of Agricultural Machinery and Technologies Engineering, School of Graduate Studies, Çanakkale Onsekiz Mart University, Çanakkale 17100, Türkiye
2
Department of Agricultural Machinery and Technologies Engineering, Faculty of Agriculture, Çanakkale Onsekiz Mart University, Çanakkale 17100, Türkiye
*
Author to whom correspondence should be addressed.
Appl. Sci. 2025, 15(17), 9632; https://doi.org/10.3390/app15179632
Submission received: 9 August 2025 / Revised: 27 August 2025 / Accepted: 29 August 2025 / Published: 1 September 2025
(This article belongs to the Section Food Science and Technology)

Abstract

This study evaluates the drying kinetics of banana slices sliced at various infrared powers and measurable values, as well as the spectral and microstructural changes that some physical quality parameters present. Banana slices were dried at 300, 400, and 500 W (894, 1190 and 1410 W/m2 infrared radiation intensity) medium wavelength infrared (MWIR). In addition, banana samples were sliced to be 6–8 and 10 mm. The drying processes were terminated when the samples reached approximately 30% moisture level. After drying, banana samples’ quality values, such as color, shrinkage, and water loss were evaluated. FT-NIR (Fourier Transform-Near Infrared) spectroscopy and microstructure measurements were performed. For banana slices dried at different powers with medium-wavelength infrared, the shortest drying time is for 6 mm thick products and can be operated in the range of 33–36 min−1. When the color values were examined, it was determined that the lowest total color changes occurred at 500 W drying power. In shrinkage measurements, samples dried at 500 W power were observed at the highest frosting. In water loss analyses, statistically similar results were obtained at 500 W drying power for various thicknesses. While the microstructural configurations of sliced banana samples were observed to be smoother during drying, samples dried at 300 W power were detected in a tighter form during drying and they were combined more regularly at 500 W power. FT-NIR spectral measurements were again expressed independently of the reflection values due to the wide pore range in high-power infrared drying (500 W).

1. Introduction

Banana stands out as a tropical climate fruit. It can generally be grown in countries with tropical climate conditions in the southern hemisphere. India, China, and Indonesia are the leading countries in banana production [1]. There are more than 100 varieties of bananas in the world and they play an important role in the economy of the countries where they are produced and in the nutrition of people in the producing and importing countries [2].
Bananas are an essential tropical fruit and a good source of carbohydrates, minerals, vitamins, and other compounds. It is rich in potassium and calcium, but it contains low sodium levels. It also contains significant amounts of ascorbic acid, vitamins A and B, and phenolic compounds [3]. However, it is a product whose shelf-life is not very long in storage due to the high moisture content. In products with high moisture content, such as bananas, microorganisms play a more active role in the product, causing their shelf life to decrease. While many vegetables and fruits maintain their quality during shelf-life extensions, bananas cannot maintain their quality due to temperature changes [2,4].
Drying is a technique widely used in food preservation, offering advantages such as extending shelf life; reducing packaging, storage, transportation, and shipping costs; reducing storage requirements for comfortable transportation; and providing the opportunity to access products out of season [5,6]. The main purpose of drying food products is to reduce the volume of the food by removing the moisture in the food and to prevent various deteriorations such as mold that can reduce the shelf life of the products [7,8]. By reducing the water activity of the products, the physical-chemical effects and microbial activities that occur during storage are minimized [9]. Several methods are used in the drying industry, such as hot air, sun drying, microwave drying, freeze drying, vacuum drying, solar drying, and infrared drying. There are various studies on drying food products such as onions [10], tomatoes [11], potatoes [12], apples [13], mango [14], pumpkin [15], and carrot [16] in slice form.
Infrared drying involves the utilization of infrared radiation to dehydrate food. This method employs electromagnetic radiation, which possesses wavelengths that are longer than those of visible light but shorter than microwaves, to extract moisture from various food products [17]. Compared to conventional drying methods, infrared (IR) drying technology offers several advantages. These include high energy efficiency, reduced drying time, even heating of materials, precise control over material temperature, superior quality of end products, and cost effectiveness in terms of energy consumption. Additionally, IR heating provides versatility, adaptability, and simplicity in terms of equipment, as well as the ability to be easily integrated with other heating techniques such as convection, vacuum, and microwave heating. Furthermore, it is a relatively inexpensive and straightforward process to install and operate [18]. IR heating has been recognized as a potential technique for achieving superior dried food products, such as fruits, vegetables, grains, and other valuable items [9].
In the existing literature, research on banana drying typically focuses on methods such as hot air, microwave, or vacuum drying. These studies have primarily concentrated on drying kinetics, color changes, and individual quality parameters [19]. While there have been studies exploring the use of infrared radiation—such as mathematically modeling vacuum drying with far-infrared (FIR) [20] and an examination of microstructural changes during contact ultrasound-assisted FIR applications [21]—these investigations have largely been limited to either mathematical modeling or microstructural analysis alone. This study presents an innovative approach by comprehensively analyzing physical quality parameters alongside microstructural analyses and FT-NIR spectroscopic assessments. It systematically investigates MWIR applications at various infrared power levels (300, 400, and 500 W) and slice thicknesses (6, 8, and 10 mm). By doing so, we examine a range of parameters, such as drying time, color, water loss, and shrinkage, supported by spectral and microstructural evidence. This study synthesizes scattered findings in the banana drying literature from a holistic perspective, presenting a unique and multidimensional contribution to understanding the effects of infrared drying on product quality.
Previous studies on banana drying processes have mainly concentrated on hot air, microwave, or vacuum methods, focusing primarily on drying kinetics or limited quality parameters. The novelty of this study lies in its comprehensive evaluation of key physical quality indicators, such as drying time, color, water loss, and shrinkage. This is achieved by experimentally applying MWIR drying at various power levels (300, 400, and 500 W) and slice thicknesses (6, 8, and 10 mm), utilizing both FT-NIR spectroscopy and microscopic analyses. FT-NIR spectroscopy offers rapid and non-destructive insights into the intrinsic quality parameters of the product, including water content, sugar levels, cellulose, and functional groups. Meanwhile, microscopic analyses provide direct observations of changes in cell structure and pore formation. This study evaluates the drying process in an integrated manner, examining both chemical/molecular and structural levels, unlike previous studies that focused only on superficial quality parameters. As a result, findings dispersed throughout the literature are systematically brought together to illustrate the multidimensional effects of infrared drying on product quality. In conclusion, this study helps identify the optimal conditions for industrial-scale banana drying applications, focusing on energy efficiency and quality preservation. Additionally, it makes a unique contribution to the literature by demonstrating the effectiveness of combining FT-NIR spectroscopy and microscopy as quality control tools.

2. Materials and Methods

2.1. Materials

The local Anamur banana (Musa acuminata Colla (AAA Group)) variety was used in the experiment. Bananas were purchased from a local supermarket and brought to the laboratory, where they were kept in the refrigerator at +4 °C until the drying process was carried out. After peeling the bananas, they were cut into slices of 6, 8, and 10 mm thickness. The sliced bananas underwent no pre-treatment. The initial moisture content of the sliced bananas was determined to be 70% (wet basis) by keeping them at 105 °C for approximately 5 h in the oven.

2.2. Experimental Method

For each drying process, we utilized as many slices as would fit into the infrared drying system (n = 22 for each group), resulting in a total of 198 slice samples. The physical properties of the cut slices—such as color, length, diameter, and weight—were measured while the samples were still wet. Following this, we conducted FT-NIR spectroscopic and microscopic image measurements on the wet samples. After completing the measurements, the slices (6, 8, and 10 mm) were placed in the infrared drying system and dried at the predetermined medium wavelength powers of 300, 400, and 500 W. The dried samples were analyzed in the same order as the wet samples, and measurements for physical properties, FT-NIR, and microscopic images were repeated. A schematic representation of the experimental study is shown in Figure 1.

2.3. Drying Process

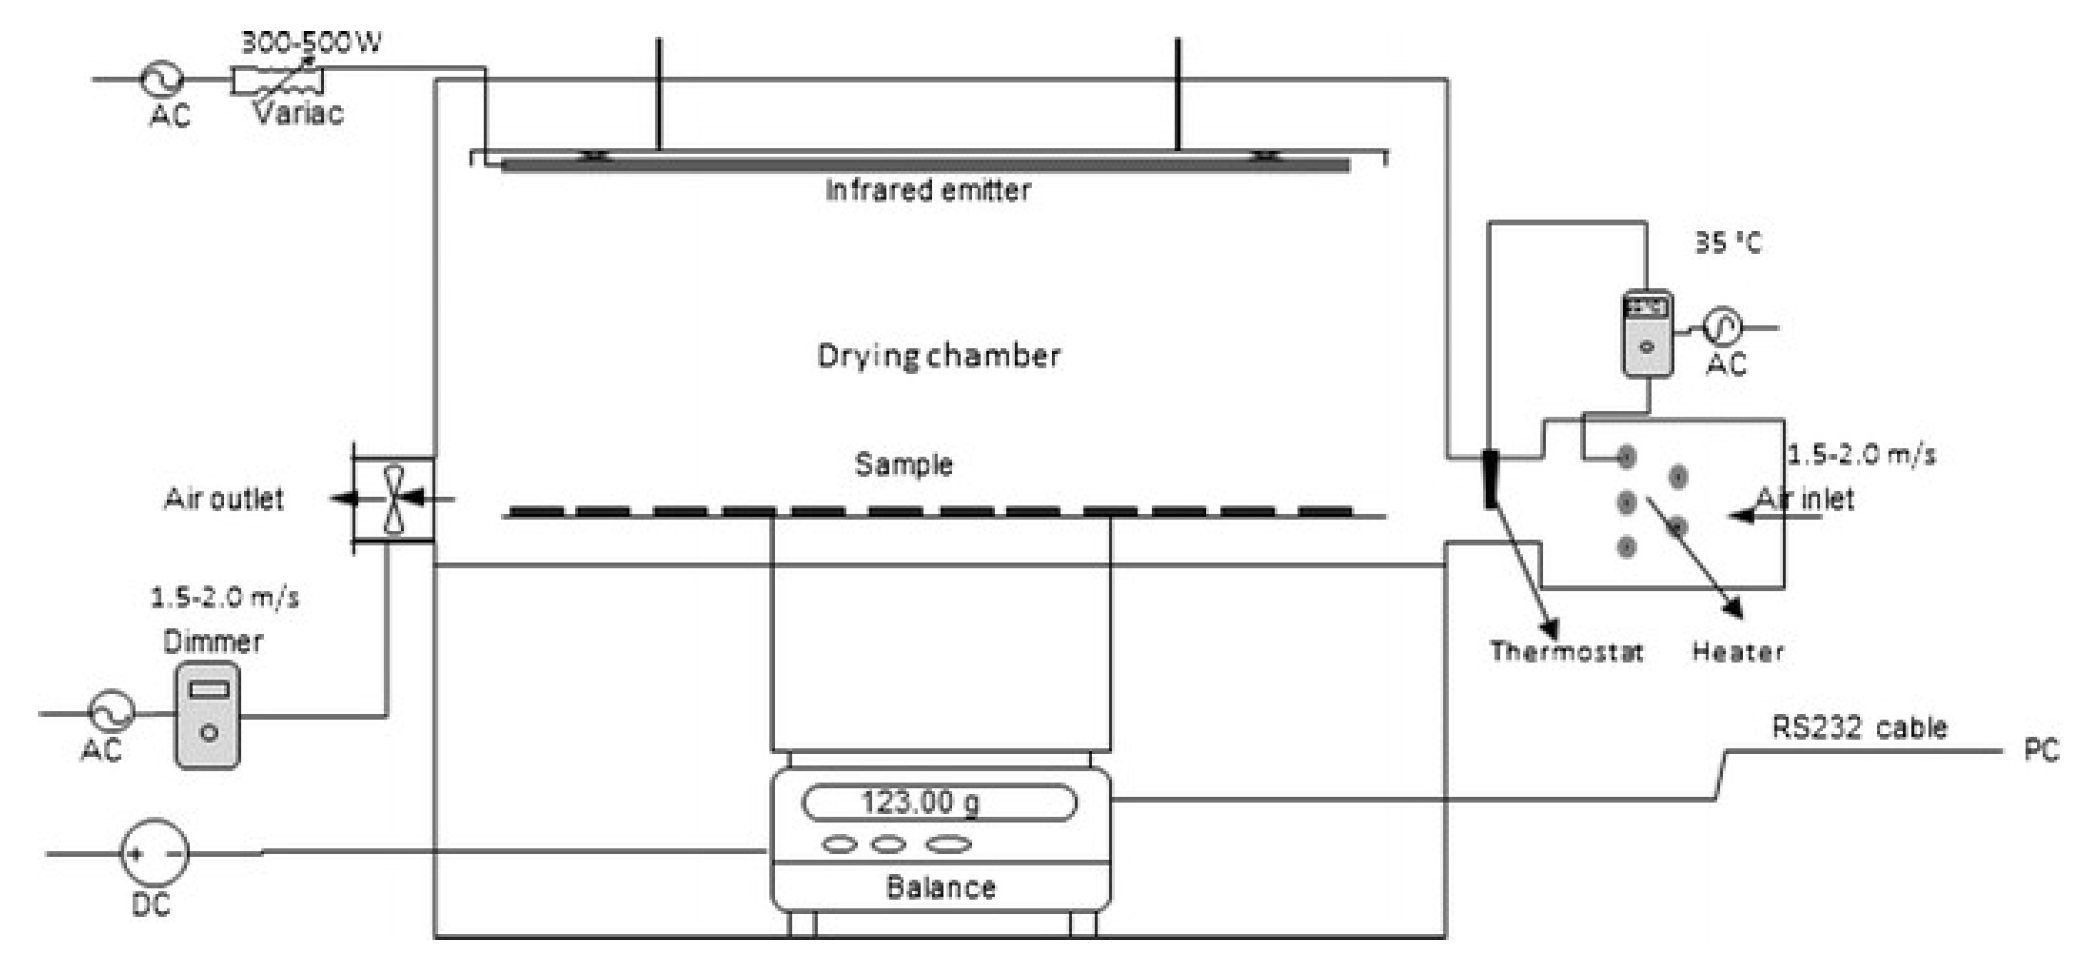
The infrared drying system located in the laboratory was utilized for the drying process (Figure 2). Infrared heater sources of 1250 W (2.4–2.7 μm) for medium wavelength (Heraeus-Noblelight, Kleinostheim, Germany) were employed in the drying system [22]. Drying experiments were conducted at medium-wavelength infrared radiation densities (894, 1190, and 1410 W/m2), corresponding to 300, 400, and 500 W of infrared heater power, respectively. Within the drying system, there is a shelf on a carrier platform with a Teflon wire grid (400 × 250 mm) to measure drying levels. The distance between the Teflon shelf used for drying samples and the infrared heaters is approximately 25 cm. The dryer was operated idle for approximately 10 min before each experiment to ensure the required drying conditions were achieved. To assess the mass loss of the samples during the drying process, the shelf holding the drying samples was positioned on a digital scale (Precisa XT 1200C, Dietikon, Switzerland) sensitive to 0.01 g. Mass changes occurring during drying were programmed to be recorded every 3 min, and all changes were instantly transferred to the computer system by connecting the digital scale to the computer using Balint Software (V 1.2.) [22]. The banana samples were dried until the final moisture content was 30% w.b.

2.4. Color Measurements

Color measurements were taken with a colorimeter (CR-200, Konica Minolta, Minolta Co.,Osaka, Japan). Before measuring the colors of the products, the colorimeter was calibrated using a reference made of ceramic material, which included the standard CIE XYZ color space system. Color measurement values were recorded in the CIE XYZ color space system. The values taken in the XYZ measurement format were then converted to L*a*b* absolute color space (CIE L* a* b*) format, and the values were recalculated, which included L* (brightness), a* (redness/greenness), and b* (yellowness/blueness). Chroma a * 2 + b * 2 ), hue (arc tan [b*/a*]), and ΔE ( Δ L * 2 + Δ a * 2 + Δ b * 2 ) values were obtained using the L*a*b* color system [23].

2.5. Spectral and Microstructure Measurements

The FT-NIR spectral measurements were conducted using a Bruker MPA (Multi-Purpose Analyzer) FT-NIR spectrometer (Bruker Optik, GmbH, Ettlingen, Germany) in reflectance mode. A fiber optic probe with an approximate detection area of 11.7 mm2 was employed for these measurements. The light source and detector fibers are integrated at the probe tip, directing light onto the sample at a 90-degree angle. The reflected light is then captured by TE-InGaAs detector tips positioned at the probe tip.
Spectral measurements and instrument control were managed using OPUS v.5.5. software (Bruker Optik, GmbH, Ettlingen, Germany). Reflectance data were acquired within the wavelength range of 780–2500 nm using the fiber optic probe. Each spectrum was collected with 32 scans over 30 s at a resolution of 8 cm−1. Before starting the measurement of each group, the spectrometer was calibrated with a white (ceramic) reference plate.
Relative spectra of the samples were obtained using the equation below, using the OPUS program:
R e l a t i v e   S p e c t r a = S a m p l e R e f e r a n c e
Microstructure image measurements were taken with a Nikon Eclipse E200 model LED binocular microscope. Measurements were obtained on fresh and dried banana samples by overhead illumination from the products’ surfaces. Measurements were made at 10× zoom.

2.6. Shrinkage and Weight Loss

The shrinkage ratio was expressed as the percentage change in diameter values of each banana slice before and after drying. The shrinkage ratio (S) of banana slices was calculated as follows:
% S =   D w D d D w
where Dw and Dd are the diameter of the wet and dried banana slices, respectively.
Weight loss values indicate the change in the weight of banana slices before and after drying. A precision scale with a sensitivity of 0.01 g (Precisa XT 1200C) was used to determine the weight loss.
W e i g h t   L o s s = W w W d W w * 100
In the formula above, Ww represents the weight of the wet product and Wd represents the weight of the dry product, respectively.

2.7. Statistical Methods

The data obtained at the end of the study were evaluated with the Minitab v.20.4 (StatSoft, Inc., Tulsa OK, ABD statistical package program. In the statistical analysis, the n, minimum, maximum, average, and standard error values of banana slices are shown. In this program, raw data were subjected to two-way ANOVA analysis of variance and evaluated with the comparison test at the p < 0.05 level.

3. Results and Discussion

Descriptive statistics of the weight, width, and diameter values of the banana slices used in the experiments are given in Table 1. In medium wavelength drying, wet samples (before drying) had values of 2.57–8.56 g, and after drying, it was observed that the values decreased to 0.83–3.66 g. Considering the average values, it was determined that the weight change decreased by 61.07% in medium-wave drying. When looking at the percentage change of the averages in width measurements, which are among the dimensional characteristics of the products, it was calculated as 14.61%, while diameter measurements tended to decrease by 13.7%.

3.1. Changes in Drying Time

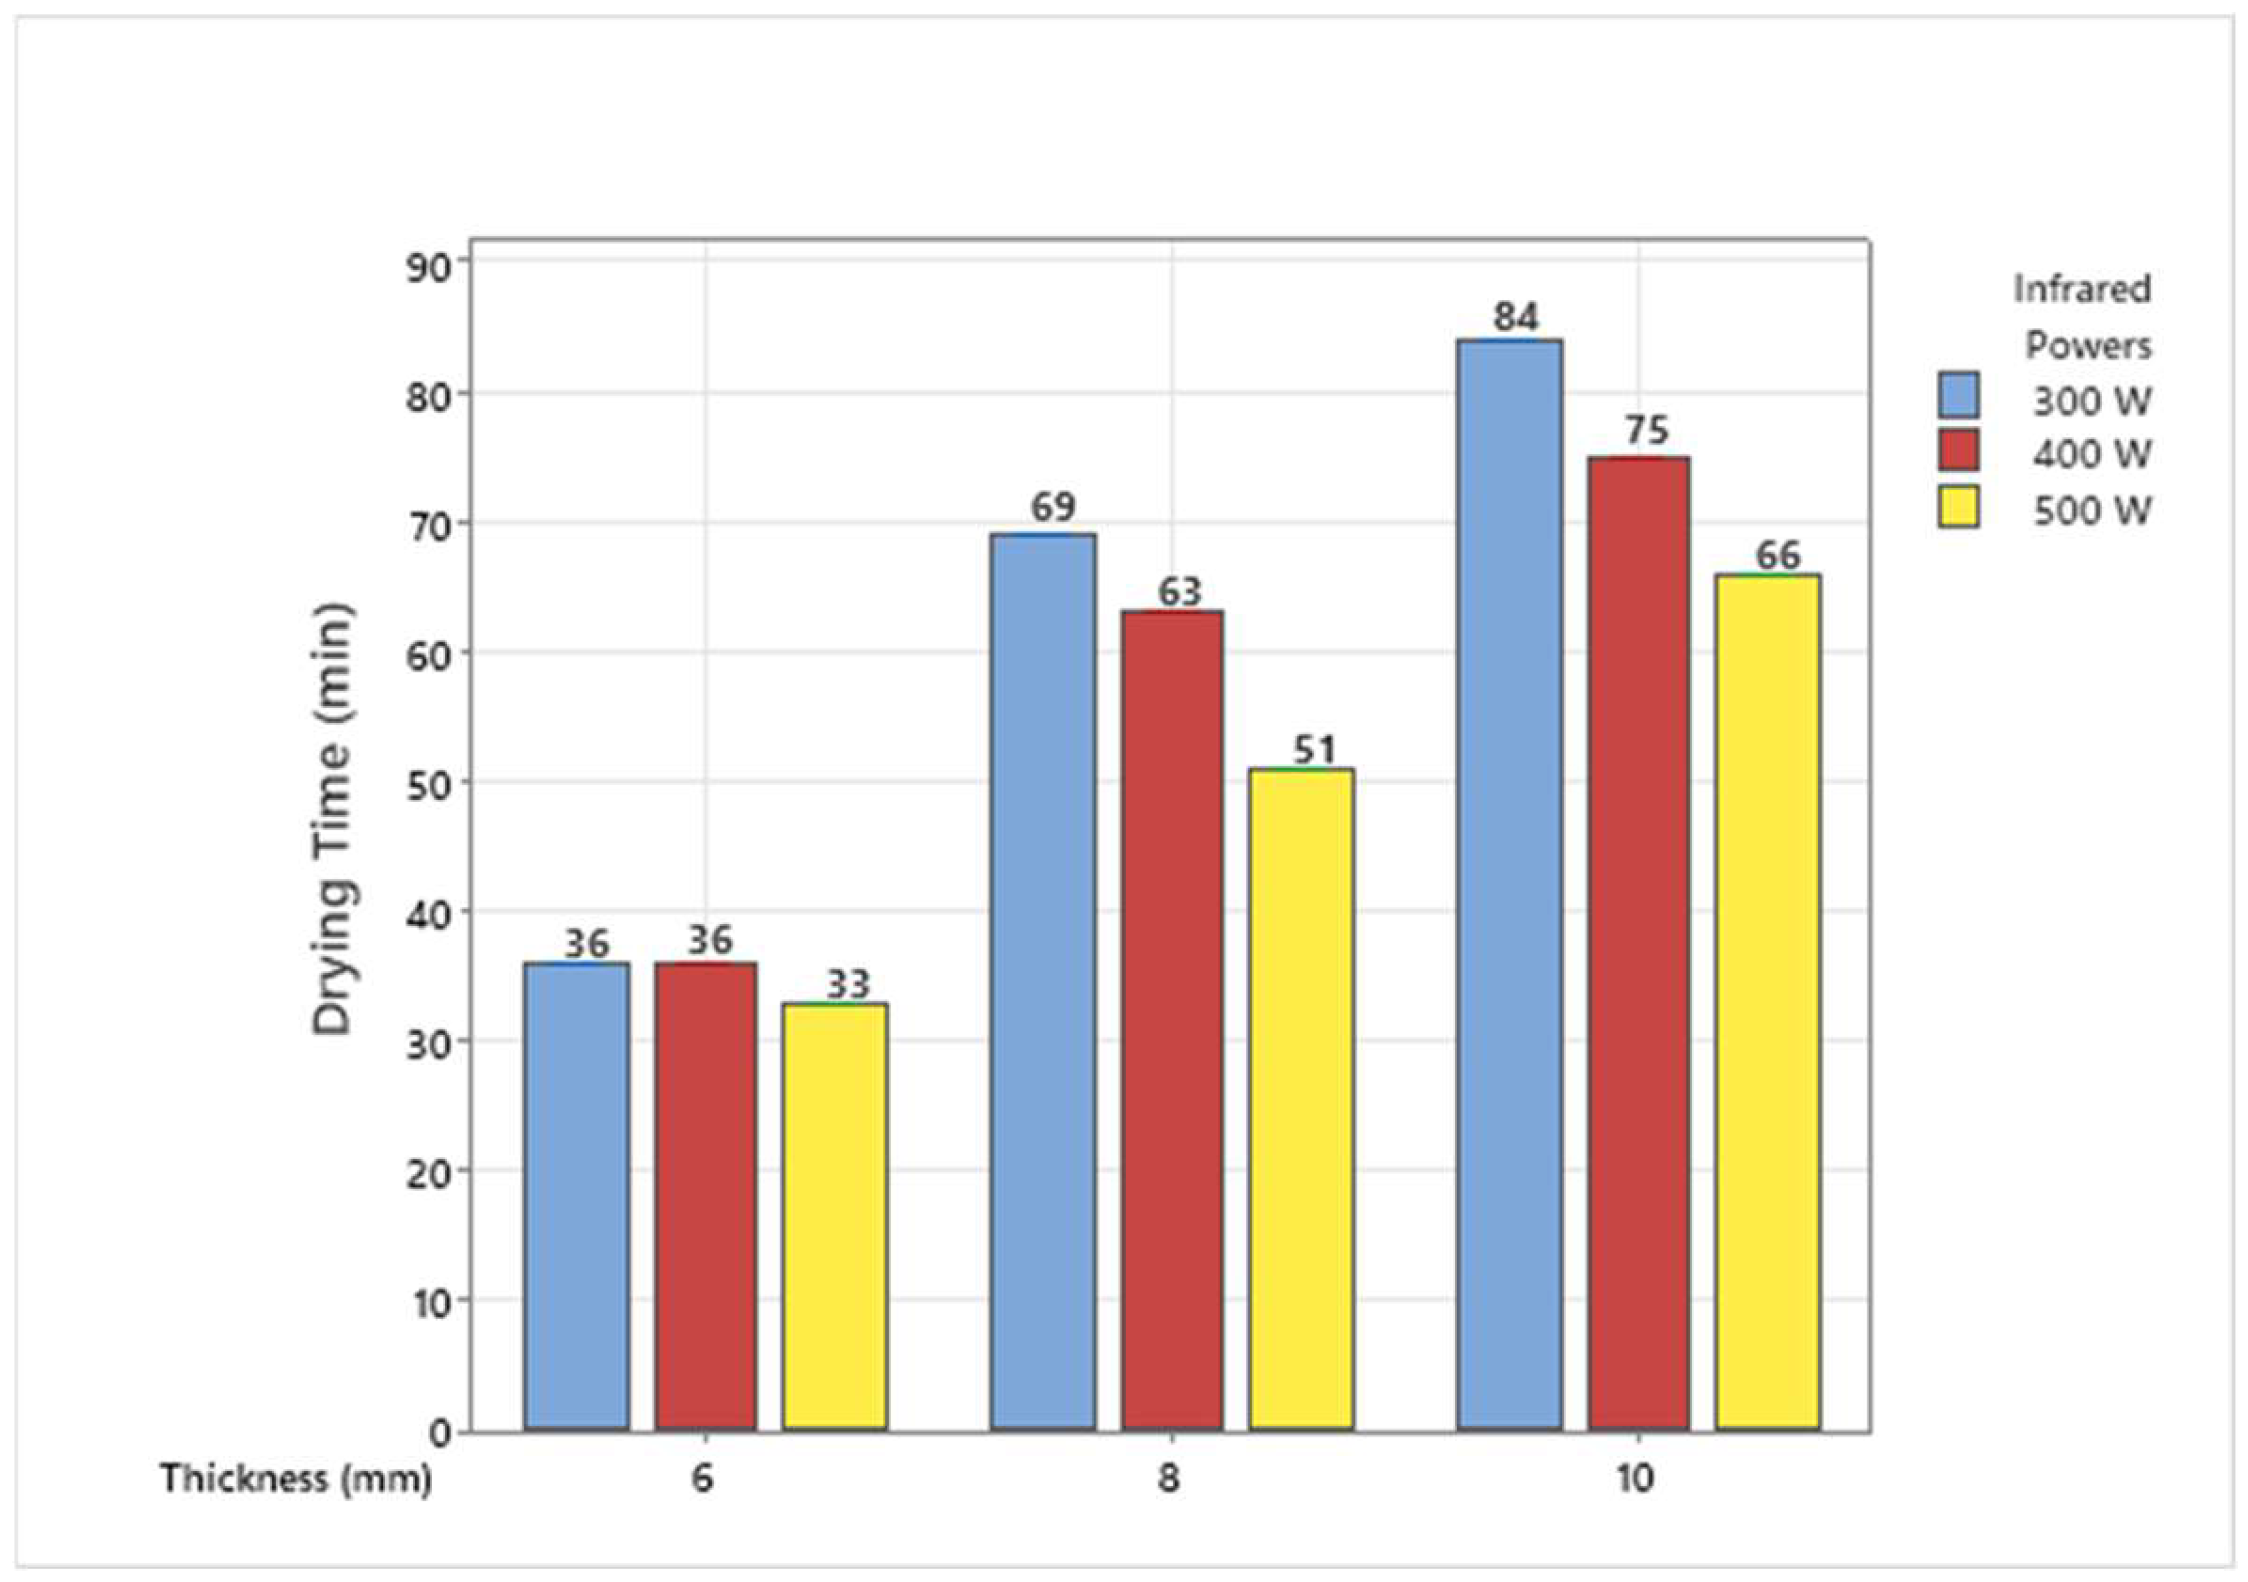
The study found that the lowest drying time was 33 min at 6 mm–500 W, while the longest was 84 min at 10 mm–300 W. Drying times obtained in medium wavelength infrared drying are shown in Figure 3. When compared statistically, 8 to 10 mm thick banana slices showed similar results at 300, 400, and 500 W drying powers, while 6 mm thick slices showed a statistical difference compared to the other groups (p < 0.05) (Figure 4). With the increase in infrared drying power, a decrease in the drying time of the products is observed. This may cause an increase in the movement of the molecules in the banana slices, causing the water in the molecules to spread faster and increase the drying speed. As the slice thickness increases, drying times increase too, as seen in Figure 3. It was noted that 6 mm thick slices at 300 W drying power dry 42.8% faster than 10 mm thick slices. The rate becomes 50% at 500 W power. Similar results were also observed in carrot slices [16]. It has been stated that a temperature of 70 °C provides a faster drying process compared to 50 °C in peach samples dried by slicing into 2 mm thick slices [24]. In potato products sliced in 2, 4, and 6 mm thickness, a high microwave energy/mass ratio also increases moisture drying rates and shortens the drying time by reducing the product moisture content. Thus, it causes more moisture to evaporate from the product at higher product temperatures [25]. For bananas, the relationship between moisture content and drying time with different slice thicknesses (2,3 and 4 mm) using vacuum infrared was examined [26]. The study observed that the drying time increased with increasing thickness. It was stated that banana slices dried at 40 °C had a higher drying speed, and the total drying time decreased significantly as the slice thickness decreased. The study stated that the drying time of 3 mm thick samples was 48.78% shorter than that of 5 mm thick samples [27]. Similar results have been reported for tomatoes, chili red peppers, and potatoes [28].

3.2. Color

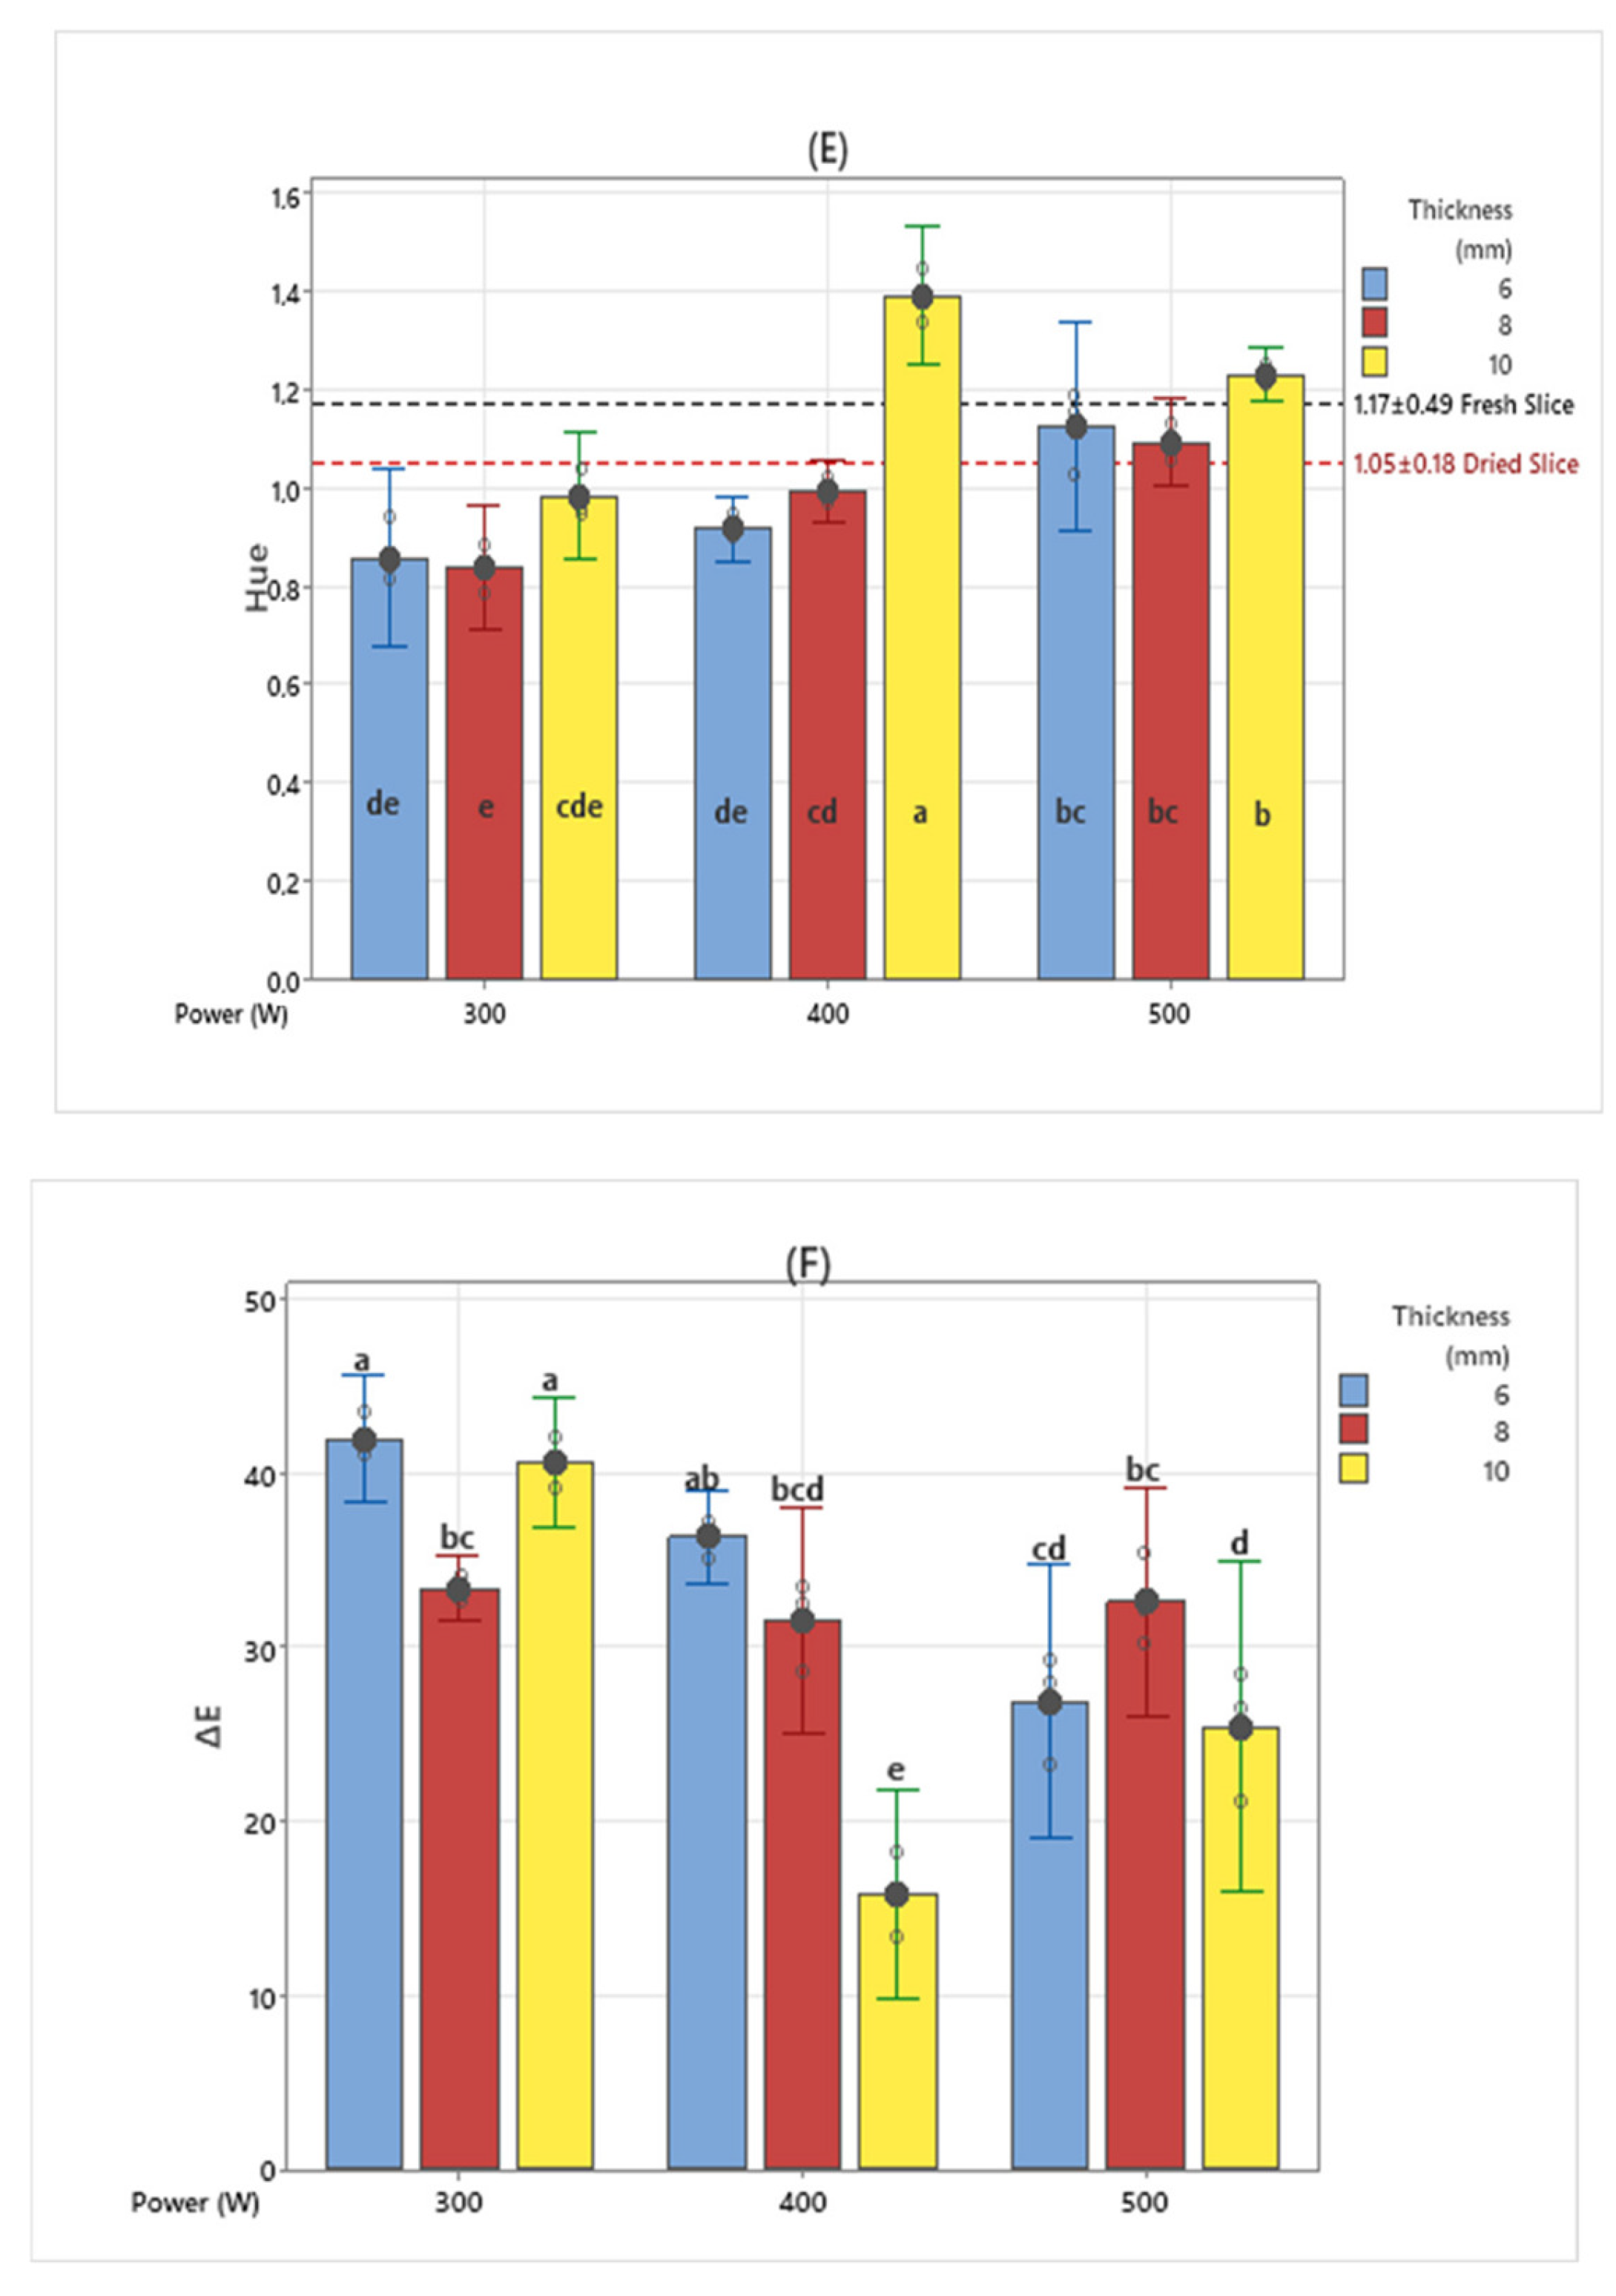
The parameters L*, a*, and b* of the Hunter color model and color properties such as chroma, hue angle, and ΔE have been extensively utilized for the characterization of color alterations that occur during the thermal processing of fruit and vegetable commodities [28]. Color change graphs of dried banana slices are given in Figure 5. L*, a*, b*, C, and hue values of dried banana slices were determined to be 36.28 ± 5.66, 8.02 ± 1.83, 16.04 ± 5.29, 18.42 ± 4.65, and 1.05 ± 0.18, respectively. When the L* (Brightness) parameters are examined, it is seen that the dried banana samples sliced at 10 mm thickness have the highest values compared to other thicknesses in all infrared powers. Similar results were obtained in dried banana slices using 540 W and 180 W microwave powers [29].
Nearly the same results were found in b*, hue, and chroma values. This situation can be associated with the drying time. Color changes according to slice thickness with increasing drying time also showing similar results. While more darkening was observed in 10 mm thick samples in the L* parameter, the longest drying time was seen in 10 mm thick samples. It can be seen that 6 and 8 mm thick slices reached higher a* values compared to 10 mm samples. During the drying process, non-enzymatic processes such as the Maillard reaction and the development of brown pigments contribute significantly to the formation of a red color [27]. When looking at the ΔE color change values, it can be seen that most of the color change was observed in banana slices dried at 300 W medium wavelength drying value and cut at 6 and 10 mm thicknesses. When b* values are examined, 400 W–10 mm thick banana slices demonstrate statistical differences compared to other samples. In samples dried with 500 W medium wavelength drying, it is revealed that there is no statistical difference in b* color parameters. When the average values of fresh banana slices are examined, it is determined that the closest value in terms of statistics is 400 W–10 mm thick samples.

3.3. FT-NIR Spectra Features

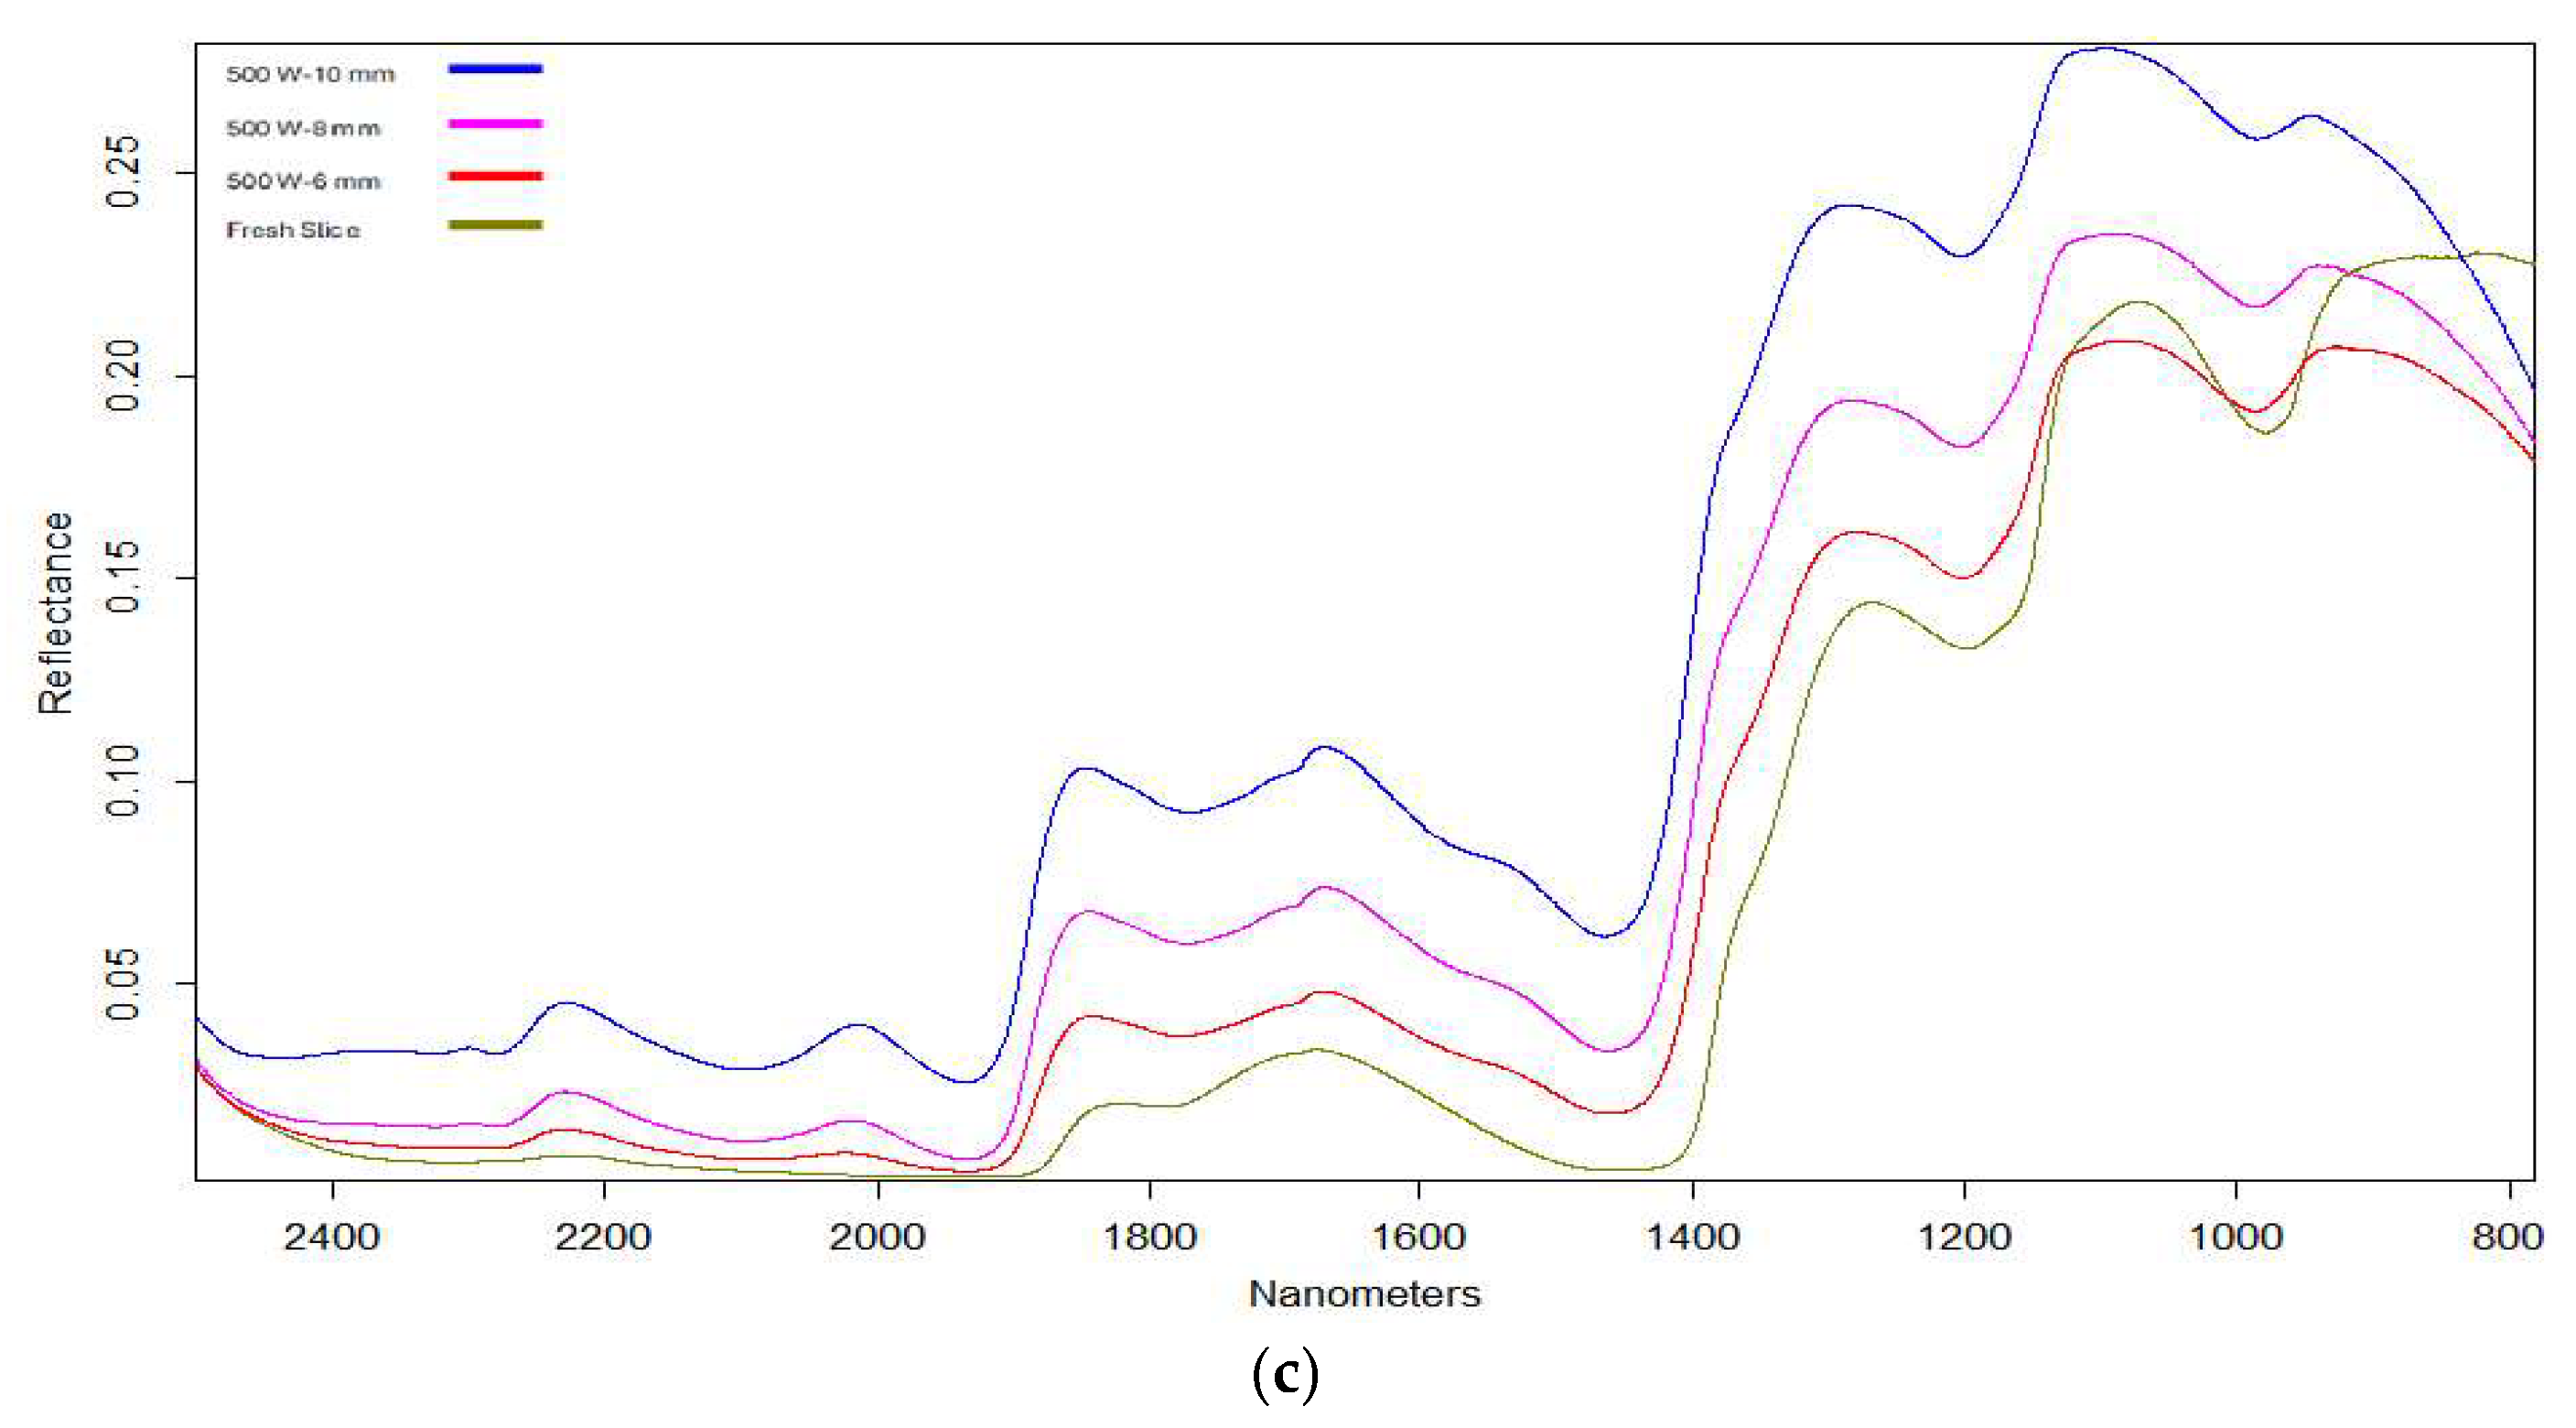
The spectra of dried banana slice samples at different powers and thicknesses are shown in Figure 6. At all drying powers, banana slices with a thickness of 10 mm showed the highest reflection intensity, while the lowest intensity was determined in fresh slices. As the thickness increases, the reflection intensity on the products decreases. The wavelengths 930, 1100, 1280, 1650, 1890, 2013 and 2230 nm detected in the raw reflection spectra of dried samples are the most effective peaks. These peaks are due to the molecular vibrations of the wavelengths within the product. Some special chemical bonds and functional groups in the products can cause changes in such specific wavelengths. The wavelengths 1930 and 1453 nm in the NIR region have the highest values in fresh banana content. These bands arise from the vibrations of O-H molecules, the first overtones of C-H stretching, and the third overtone of OH, CH, and CH2, and they indicate water signals. In addition, 974, 1200, 1460, 1785, and 1935 nm wavelengths stand out as the most effective peaks in banana slices. These peaks provide information about bananas’ absorption of water, cellulose, and sugars. Similar results were seen in kiwi in [30]. For this reason, thickly sliced dried banana samples have low spectrum values. These results are compatible with the literature [31,32].

3.4. Microstructure Features

Drying processes in food systems induce significant microstructural transformations that directly influence quality attributes and mass transfer dynamics. Microscopic observations of banana slices subjected to varying infrared power levels revealed that drying intensity markedly alters tissue morphology (Figure 7). Fresh banana samples exhibited a smooth, fibrous texture, whereas dried samples displayed disrupted cellular integrity. At 300 W, fiber bonds remained relatively compact. In comparison, 400 W and 500 W treatments promoted the formation of larger pores, primarily due to rapid water evaporation and internal vapor pressure buildup at elevated temperatures [19]. Increased porosity under high infrared power has been confirmed in studies employing X-ray microtomography, which demonstrated that far-infrared radiation significantly enhances pore volume and modifies structural uniformity in banana tissues [19]. Slice thickness also influenced structural stability; 10 mm slices maintained a more uniform architecture compared to thinner slices, which exhibited greater collapse and irregularity. Beyond physical changes, chemical reactions such as the Maillard reaction and caramelization play a pivotal role in shaping microstructural characteristics during thermal processing. The Maillard reaction, initiated by interactions between reducing sugars and amino groups, accelerates under low-moisture, high-temperature conditions, leading to the formation of melanoidins and other polymeric compounds. These products not only contribute to browning but also reinforce surface rigidity, creating a denser outer layer that alters moisture migration path [33,34,35]. Concurrently, caramelization, involving the thermal degradation of sugars in the absence of amino compounds, induces glassy, brittle surface layers and localized pore enlargement, particularly in sugar-rich matrices like bananas [36,37]. Both reactions are associated with the generation of intermediate compounds such as hydroxymethylfurfural (HMF) and furfural, which serve as indicators of advanced thermal processing and influence textural and sensory properties [37]. These findings align with previous research on mushrooms and potatoes, where high-temperature drying triggered similar structural disruptions and surface hardening due to combined physical and chemical mechanism [38]. The microstructural evolution of banana slices during infrared drying is governed by a synergistic interplay between thermal stress, moisture migration, and non-enzymatic browning reactions. While controlled Maillard and caramelization reactions can enhance desirable attributes such as color and flavor, excessive progression may compromise textural integrity and nutritional quality, underscoring the need for optimized drying parameters.

3.5. Water Loss and Shrinkage

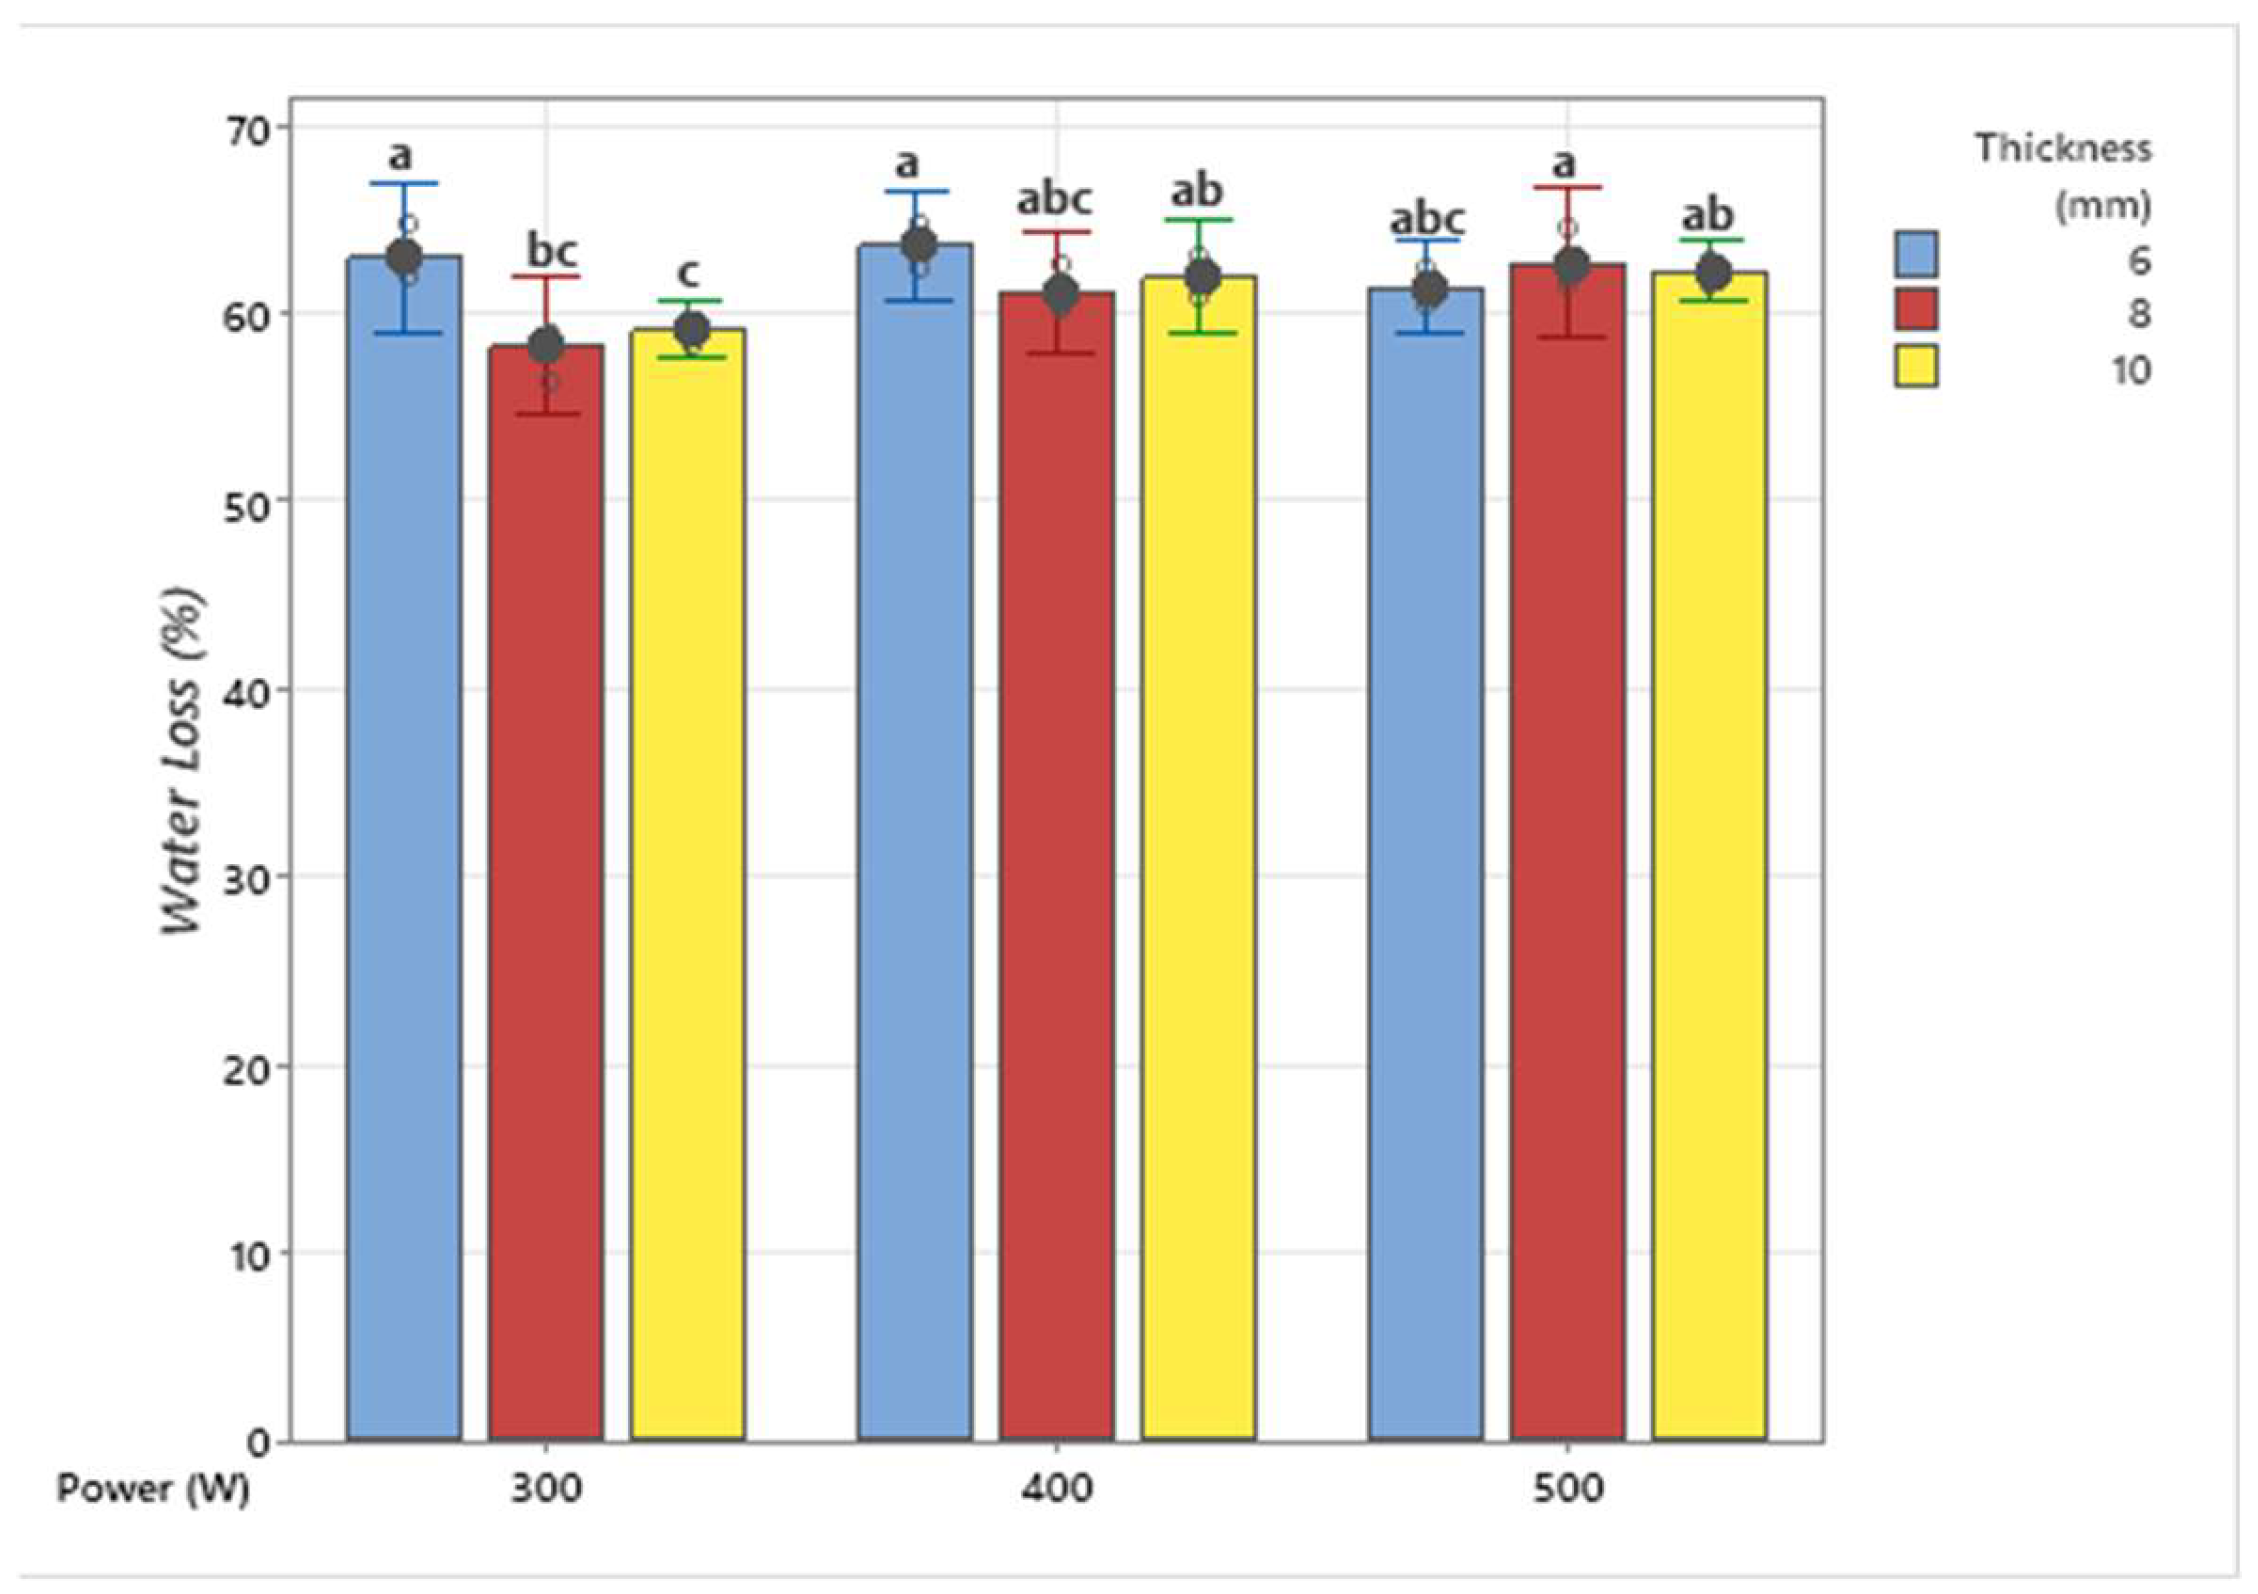
The water content of food products is an important feature that affects their quality, especially during the drying phase and during storage. Weight loss removes water from the product using heat and mass transfer [39]. Figure 8 shows the water loss values of banana slices according to drying processes at different powers and thicknesses. The water loss values were compared for three different thicknesses (6 mm, 8 mm, and 10 mm) and three different powers (300 W, 400 W, and 500 W). As Figure 7 shows, it is essential to understand that water loss varies depending on the thickness and power values and the effect of these parameters on water loss. Higher power levels generally lead to more water loss. Increasing thickness can affect the percentage of water loss; however, this effect varies depending on the applied power. The thinness of the banana slices minimizes the distance that water must travel in the fruit section, depending on the drying resistance applied, and thus it may cause more water loss [40]. The water loss in 300 W-10 mm slices is the lowest compared to the others. While it was determined that there was no statistical difference between 300 and 400 W power in the 6 mm thick slice samples, the samples in 500 W–8 mm slices showed similar results. It was determined that the 10 mm thick sliced banana samples had similar water loss values when dried at powers of 400 and 500 W.
Shrinkage, or surface change percentage, frequently occurs during the drying process. The shrinkage values of banana slices at various thicknesses and powers are given in Table 2. The shrinkage amounts in banana slices dried at various powers vary depending on the product’s moisture content, drying conditions, and chemical composition. Statistically, it was shown that the relationship between the infrared powers applied to the products and their thickness parameters was not significant. Still, the infrared powers were statistically significant on the products. As expected, it was determined that banana slices dried at 500 W power had higher shrinkage values than other drying degrees. The highest shrinkage values in hot air drying of pomegranate seeds were observed at high temperatures [41]. A study on lemon slices found that shrinkage rates increased with increasing infrared power [42]. Similar results were reported in banana and potato chips [43,44].

4. Conclusions

In this study, some quality characteristics (color, shrinkage, water loss, and microstructure), drying parameters, and spectral changes in banana slices with various thicknesses (6, 8, and 10 mm) were investigated at different infrared powers (300, 400, and 500 W). Banana slices dried at various powers showed changes in terms of drying time. It was observed that banana slices with a thickness of 6 mm dried earlier than other thicknesses. When ΔE values were examined, banana slices dried at 300 W infrared power underwent the most change. It was determined that the products showed similar results in shrinkage values, while a tighter bond structure was observed in microstructure structures. When the FT-NIR spectral graphs were examined, products with a thickness of 10 mm had the highest reflection values. It was observed that as the sample thickness decreased, the reflection values also decreased depending on the powers and the higher transmittance. As a result, it was determined that quality parameters decreased when bananas sliced into different thicknesses were dried at high infrared powers.
As a practical recommendation, it is advised to dry banana slices that are 6 mm thick using an infrared power setting of 500 W. This approach not only shortens the drying time but also helps maintain the quality of the product. These are the optimal conditions for achieving energy efficiency and high product quality in industrial applications.
For future studies, it is suggested to evaluate various banana varieties under the same infrared drying conditions and to conduct sensory analyses. This would provide a more comprehensive evaluation of consumer acceptance and product quality. Additionally, investigating the use of FT-NIR spectroscopy as a quality control tool across different fruit varieties could be beneficial.

Author Contributions

Conceptualization, M.A. and M.B.B.; methodology, M.A. and M.B.B.; validation, M.A. and M.B.B.; formal analysis, M.A. and M.B.B.; investigation, M.A. and M.B.B.; resources, M.A. and M.B.B.; data curation, M.A. and M.B.B.; writing—original draft preparation, M.A.; writing—review and editing, M.B.B.; visualization, M.B.B.; supervision, M.B.B.; project administration, M.B.B. All authors have read and agreed to the published version of the manuscript.

Funding

This research received no external funding.

Institutional Review Board Statement

Not applicable.

Informed Consent Statement

Not applicable.

Data Availability Statement

The original contributions presented in this study are included in the article. Further inquiries can be directed to the corresponding author.

Acknowledgments

This study is a part of the MSc thesis of Melih ATMACA (Çanakkale Onsekiz Mart University School of Graduate Studies).

Conflicts of Interest

The authors declare no conflicts of interest.

References

  1. Atmaca, M.; Büyükcan, M.B. Kurutulmuş Muz Dilimlerinin Bazı Fiziksel ve Yapısal Kalite Karakteristiklerinin Belirlenmesi. ÇOMÜ Ziraat Fakültesi Derg. 2022, 10, 29–36. [Google Scholar] [CrossRef]
  2. Martínez, S.; Roman-Chipantiza, A.; Boubertakh, A.; Carballo, J. Banana Drying: A Review on Methods and Advances. Food Rev. Int. 2024, 40, 2188–2226. [Google Scholar] [CrossRef]
  3. Singh, R.; Gosewade, S.; Ravinder Singh, C.; Kaushik, R. Bananas as Underutilized Fruit Having Huge Potential as Raw Materials for Food and Non-Food Processing Industries: A Brief Review. Pharma Innov. J. 2018, 7, 574–580. [Google Scholar]
  4. Pu, Y.Y.; Zhao, M.; O’Donnell, C.; Sun, D.W. Nondestructive Quality Evaluation of Banana Slices during Microwave Vacuum Drying Using Spectral and Imaging Techniques. Dry. Technol. 2018, 36, 1542–1553. [Google Scholar] [CrossRef]
  5. Moses, J.A.; Norton, T.; Alagusundaram, K.; Tiwari, B.K. Novel Drying Techniques for the Food Industry. Food Eng. Rev. 2014, 6, 43–55. [Google Scholar] [CrossRef]
  6. Obajemihi, O.I.; Cheng, J.H.; Sun, D.W. Novel Sequential and Simultaneous Infrared-Accelerated Drying Technologies for the Food Industry: Principles, Applications and Challenges. Crit. Rev. Food Sci. Nutr. 2023, 63, 1465–1482. [Google Scholar] [CrossRef]
  7. Thuwapanichayanan, R.; Prachayawarakorn, S.; Kunwisawa, J.; Soponronnarit, S. Determination of Effective Moisture Diffusivity and Assessment of Quality Attributes of Banana Slices during Drying. LWT 2011, 44, 1502–1510. [Google Scholar] [CrossRef]
  8. Sabzevari, M.; Behroozi-Khazaei, N.; Darvishi, H. Real-Time Evaluation of Artificial Neural Network-Developed Model of Banana Slice Kinetics in Microwave-Hot Air Dryer. J. Food Process Eng. 2021, 44, e13796. [Google Scholar] [CrossRef]
  9. Sakare, P.; Prasad, N.; Thombare, N.; Singh, R.; Sharma, S.C. Infrared Drying of Food Materials: Recent Advances. Food Eng. Rev. 2020, 12, 381–398. [Google Scholar] [CrossRef]
  10. Sarsavadia, P.N.; Sawhney, R.L.; Pangavhane, D.R.; Singh, S.P. Drying Behaviour of Brined Onion Slices. J. Food Eng. 1999, 40, 219–226. [Google Scholar] [CrossRef]
  11. Abano, E.E.; Ma, H.; Qu, W. Influence of Air Temperature on the Drying Kinetics and Quality of Tomato Slices. J. Food Process Technol. 2011, 2, 123. [Google Scholar] [CrossRef]
  12. Yadollahinia, A.; Jahangiri, M. Shrinkage of Potato Slice during Drying. J. Food Eng. 2009, 94, 52–58. [Google Scholar] [CrossRef]
  13. Nowak, D.; Lewicki, P.P. Infrared Drying of Apple Slices. Innov. Food Sci. Emerg. Technol. 2004, 5, 353–360. [Google Scholar] [CrossRef]
  14. Akoy, E.O.M. Experimental Characterization and Modeling of Thin-Layer Drying of Mango Slices. Int. Food Res. J. 2014, 21, 1911–1917. [Google Scholar]
  15. Seremet, L.; Botez, E.; Nistor, O.V.; Andronoiu, D.G.; Mocanu, G.D. Effect of Different Drying Methods on Moisture Ratio and Rehydration of Pumpkin Slices. Food Chem. 2016, 195, 104–109. [Google Scholar] [CrossRef]
  16. Kocabiyik, H.; Tezer, D. Drying of Carrot Slices Using Infrared Radiation. Int. J. Food Sci. Technol. 2009, 44, 953–959. [Google Scholar] [CrossRef]
  17. Tao, T.; Wang, Y.; Gao, J.; Yan, W.; Liu, Q.; Zhang, Z.; Ding, C. Impact of Infrared Heating on Drying Properties and Flavor Components of Carmine Radish (Raphanus sativus L.). Slices. Food Bioeng. 2023, 2, 164–174. [Google Scholar] [CrossRef]
  18. Huang, D.; Yang, P.; Tang, X.; Luo, L.; Sunden, B. Application of Infrared Radiation in the Drying of Food Products. Trends Food Sci. Technol. 2021, 110, 765–777. [Google Scholar] [CrossRef]
  19. Pekke, M.A.; Pan, Z.L.; Atungulu, G.G.; Smith, G.; Thompson, J.F. Drying Characteristics and Quality of Bananas under Infrared Radiation Heating. Int. J. Agric. Biol. Eng. 2013, 6, 58–70. [Google Scholar] [CrossRef]
  20. Swasdisevi, T.; Devahastin, S.; Sa-Adchom, P.; Soponronnarit, S. Mathematical Modeling of Combined Far-Infrared and Vacuum Drying Banana Slice. J. Food Eng. 2009, 92, 100–106. [Google Scholar] [CrossRef]
  21. Shi, X.; Yang, Y.; Li, Z.; Wang, X.; Liu, Y. Moisture Transfer and Microstructure Change of Banana Slices during Contact Ultrasound Strengthened Far-Infrared Radiation Drying. Innov. Food Sci. Emerg. Technol. 2020, 66, 102537. [Google Scholar] [CrossRef]
  22. Kocabiyik, H.; Yilmaz, N.; Tuncel, N.B.; Sumer, S.K.; Buyukcan, M.B. Drying, Energy, and Some Physical and Nutritional Quality Properties of Tomatoes Dried with Short-Infrared Radiation. Food Bioprocess Tech. 2015, 8, 516–525. [Google Scholar] [CrossRef]
  23. Buyukcan, M.B.; Kavdir, I. Prediction of Some Internal Quality Parameters of Apricot Using FT-NIR Spectroscopy. J. Food Meas. Charact. 2017, 11, 651–659. [Google Scholar] [CrossRef]
  24. Tan, S.; Miao, Y.; Zhou, C.; Luo, Y.; Lin, Z.; Xie, R.; Li, W. Effects of Hot Air Drying on Drying Kinetics and Anthocyanin Degradation of Blood-Flesh Peach. Foods 2022, 11, 1596. [Google Scholar] [CrossRef]
  25. Lu, L.; Tang, J.; Ran, X. Temperature and Moisture Changes during Microwave Drying of Sliced Food. Dry. Technol. 1999, 17, 414–431. [Google Scholar] [CrossRef]
  26. Swasdisevi, T.; Devahastin, S.; Ngamchum, R.; Soponronnarit, S. Optimization of a Drying Process Using Infrared-Vacuum Drying of Cavendish Banana Slices. Songklanakarin J. Sci. Technol. 2007, 29, 809–816. [Google Scholar]
  27. Tunckal, C.; Doymaz, İ. Performance Analysis and Mathematical Modelling of Banana Slices in a Heat Pump Drying System. Renew. Energy 2020, 150, 918–923. [Google Scholar] [CrossRef]
  28. Karabulut, I.; Topcu, A.; Duran, A.; Turan, S.; Ozturk, B. Effect of Hot Air Drying and Sun Drying on Color Values and β-Carotene Content of Apricot (Prunus armenica L.). LWT—Food Sci. Technol. 2007, 40, 753–758. [Google Scholar] [CrossRef]
  29. Nagvanshi, S.; Goswami, T.K. Development of a System to Measure Color in Fresh and Microwave Dried Banana Slices. J. Food Sci. Technol. 2021, 58, 1673–1681. [Google Scholar] [CrossRef]
  30. Cevoli, C.; Iaccheri, E.; Fabbri, A.; Ragni, L. Data Fusion of FT-NIR Spectroscopy and Vis/NIR Hyperspectral Imaging to Predict Quality Parameters of Yellow Flesh “Jintao” Kiwifruit. Biosyst. Eng. 2024, 237, 157–169. [Google Scholar] [CrossRef]
  31. Rambo, M.K.D.; Amorim, E.P.; Ferreira, M.M.C. Potential of Visible-near Infrared Spectroscopy Combined with Chemometrics for Analysis of Some Constituents of Coffee and Banana Residues. Anal. Chim. Acta 2013, 775, 41–49. [Google Scholar] [CrossRef]
  32. Arendse, E.; Fawole, O.A.; Magwaza, L.S.; Nieuwoudt, H.; Opara, U.L. Evaluation of Biochemical Markers Associated with the Development of Husk Scald and the Use of Diffuse Reflectance NIR Spectroscopy to Predict Husk Scald in Pomegranate Fruit. Sci. Hortic. 2018, 232, 240–249. [Google Scholar] [CrossRef]
  33. El Hosry, L.; Elias, V.; Chamoun, V.; Halawi, M.; Cayot, P.; Nehme, A.; Bou-Maroun, E. Maillard Reaction: Mechanism, Influencing Parameters, Advantages, Disadvantages, and Food Industrial Applications: A Review. Foods 2025, 14, 1881. [Google Scholar] [CrossRef] [PubMed]
  34. Hemmler, D.; Roullier-Gall, C.; Marshall, J.W.; Rychlik, M.; Taylor, A.J.; Schmitt-Kopplin, P. Evolution of Complex Maillard Chemical Reactions, Resolved in Time. Sci. Rep. 2017, 7, 3227. [Google Scholar] [CrossRef] [PubMed]
  35. Starowicz, M.; Zieliński, H. How Maillard Reaction Influences Sensorial Properties (Color, Flavor and Texture) of Food Products? Food Rev. Int. 2019, 35, 707–725. [Google Scholar] [CrossRef]
  36. Jafary, S.U.H.; Ahmad, R.S.; Hussain, M.B.; Ur Rehman, T.; Majeed, M.; Khan, M.U.; Shariati, M.A. Investigation of Changes in Antioxidant Activities of Caramelization Products Under Various Time Regimes and Ph Ranges. Carpathian J. Food Sci. Technol. 2018, 10, 116–128. [Google Scholar]
  37. Ajandouz, E.H.; Tchiakpe, L.S.; Dalle Ore, F.; Benajiba, A.; Puigserver, A. Effects of PH on Caramelization and Maillard Reaction Kinetics in Fructose-Lysine Model Systems. J. Food Sci. 2001, 66, 926–931. [Google Scholar] [CrossRef]
  38. Sarpong, F.; Yu, X.; Zhou, C.; Oteng-Darko, P.; Amenorfe, L.P.; Wu, B.; Bai, J.; Ma, H. Drying Characteristic, Enzyme Inactivation and Browning Pigmentation Kinetics of Controlled Humidity-Convective Drying of Banana Slices. Heat. Mass. Transf./Waerme-Und Stoffuebertragung 2018, 54, 3117–3130. [Google Scholar] [CrossRef]
  39. Siyum, Z.H.; Pham, T.T.; Vozáry, E.; Kaszab, T.; Nguyen, L.L.P.; Baranyai, L. Monitoring of Banana’s Optical Properties by Laser Light Backscattering Imaging Technique during Drying. J. Food Meas. Charact. 2023, 17, 5268–5287. [Google Scholar] [CrossRef]
  40. Kadam, D.M.; Dhingra, D. Mass Transfer Kinetics of Banana Slices during Osmo-Convective Drying. J. Food Process Eng. 2011, 34, 511–532. [Google Scholar] [CrossRef]
  41. Alaei, B.; Amiri Chayjan, R. Drying Characteristics of Pomegranate Arils Under Near Infrared-Vacuum Conditions. J. Food Process Preserv. 2015, 39, 469–479. [Google Scholar] [CrossRef]
  42. Salehi, F.; Kashaninejad, M. Modeling of Moisture Loss Kinetics and Color Changes in the Surface of Lemon Slice during the Combined Infrared-Vacuum Drying. Inf. Process. Agric. 2018, 5, 516–523. [Google Scholar] [CrossRef]
  43. Yagua, C.V.; Moreira, R.G. Physical and Thermal Properties of Potato Chips during Vacuum Frying. J. Food Eng. 2011, 104, 272–283. [Google Scholar] [CrossRef]
  44. Yamsaengsung, R.; Ariyapuchai, T.; Prasertsit, K. Effects of Vacuum Frying on Structural Changes of Bananas. J. Food Eng. 2011, 106, 298–305. [Google Scholar] [CrossRef]
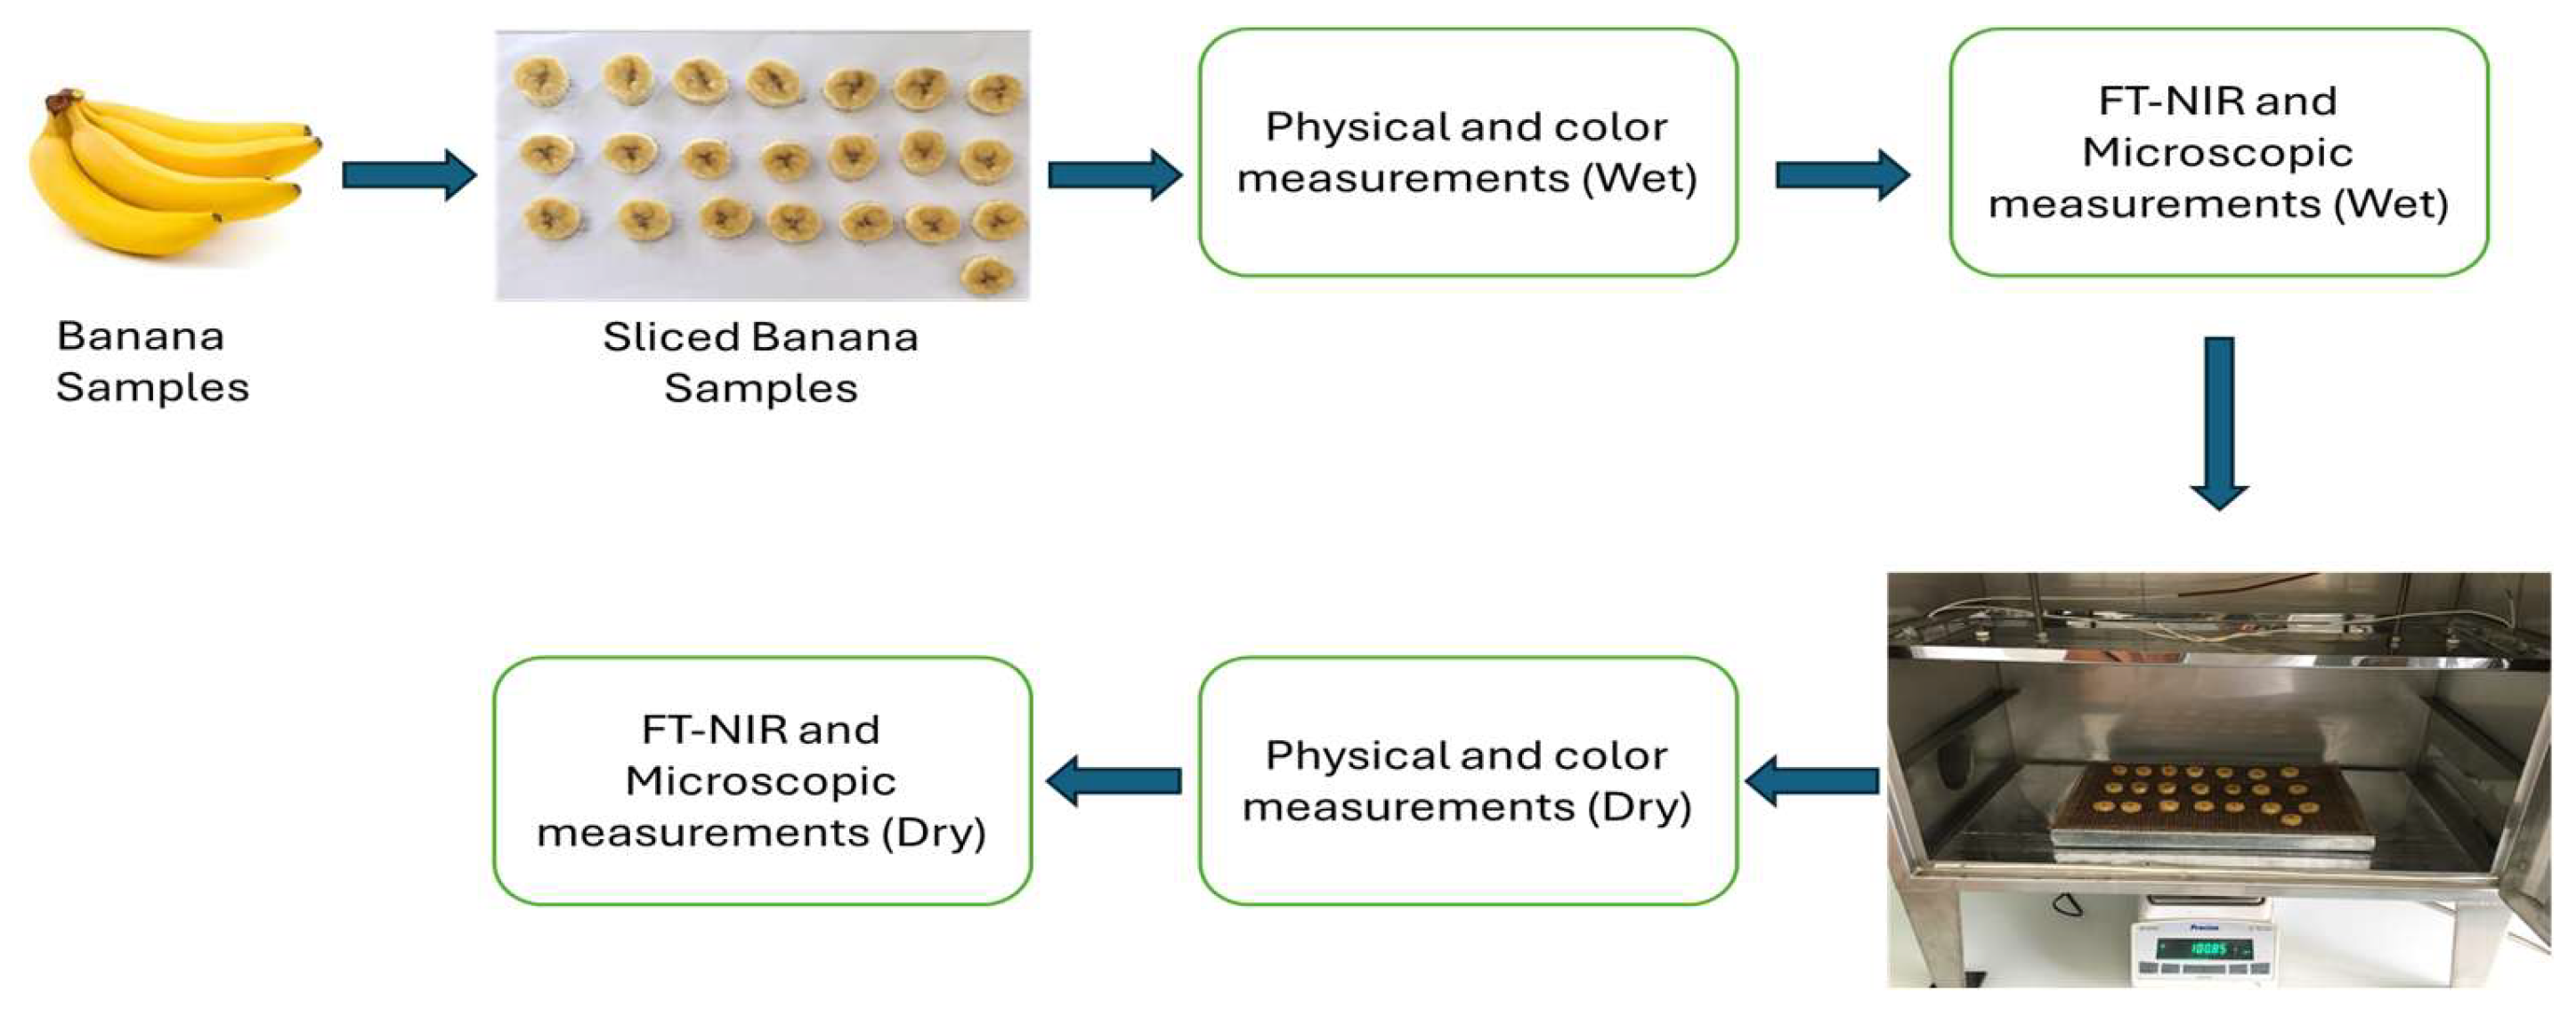
Figure 1. Experimental schematic view.
Applsci 15 09632 g001
Figure 2. Schematic view of infrared dryer [22].
Applsci 15 09632 g002
Figure 3. Effect of medium wavelength infrared heat source on the drying time of different banana slices at various infrared powers.
Applsci 15 09632 g003
Figure 4. Effect of product thickness on drying time (a,b: different letters indicate statistically significant differences at p < 0.05).
Applsci 15 09632 g004
Figure 5. Color parameter values of banana slices dried using the medium wavelength drying method (different letters (a–g) indicate statistically significant differences at p < 0.05) ((A): L*; (B): a*; (C): b*; (D): chroma; (E): hue; and (F): ΔE).
Applsci 15 09632 g005aApplsci 15 09632 g005bApplsci 15 09632 g005c
Figure 6. FT-NIR spectra of dried banana slices in MWIR drying ((a)—300 W; (b)—400 W; and (c)—500 W).
Applsci 15 09632 g006aApplsci 15 09632 g006b
Figure 7. Microstructure of banana slices ((a), 300 W-6 mm; (b), 300 W-8 mm; (c), 300 W-10 mm; (d), 400 W-6 mm; (e), 400 W-8 mm; (f), 400 W-10 mm; (g), 500 W-6 mm; (h), 500 W-8 mm; (i), 500 W-10 mm, (j), fresh banana).
Applsci 15 09632 g007
Figure 8. Water loss values of banana samples dried with medium wavelength infrared (different letters (a–c) indicate statistically significant differences at p < 0.05).
Applsci 15 09632 g008
Table 1. Introductory statistics of fresh and dried bananas in terms of weight, width, and diameter at medium wavelengths.
Weight (g)Width (mm)Diameter (mm)
WetDriedWetDriedWetDried
n198198198198198198
Minimum2.570.8327.1721.4017.2913.26
Maximum8.563.6641.3339.8732.5732.27
Averages5.372.093.9627.3027.7023.90
Standard error1.490.682.782.562.572.76
Table 2. Shrinkage changes in banana samples dried with medium wavelength infrared.
Infrared Powers6 mm8 mm10 mmAverage
300 W0.5637 ± 0.05770.5759 ± 0.02000.6243 ± 0.05500.5880 ± 0.0496 B
400 W0.6291 ± 0.02810.5894 ± 0.06110.6229 ± 0.02720.6138 ± 0.0407 AB
500 W0.6596 ± 0.07870.6029 ± 0.05020.6976 ± 0.02480.6534 ± 0.0635 A
A, B: A statistical difference exists between the applications indicated with the same letters in the same column (p < 0.05).
Disclaimer/Publisher’s Note: The statements, opinions and data contained in all publications are solely those of the individual author(s) and contributor(s) and not of MDPI and/or the editor(s). MDPI and/or the editor(s) disclaim responsibility for any injury to people or property resulting from any ideas, methods, instructions or products referred to in the content.