1. Introduction
Global electricity consumption has significantly increased over the last 10 years, from approximately 23.2 TWh in 2013 to over 29.5 TWh in 2023. This growth is accompanied by a shift toward electrification across all economic sectors. To achieve decarbonization goals, it is essential that this rising electricity demand is met by renewable energy sources (RES), accurately sized to reflect actual consumption needs.
Currently, one-third of global energy consumption and one-quarter of CO
2 emissions can be related to buildings, making them central to climate policies due to their potential for electrification, improved energy efficiency, and integration of RES [
1]. This impact increases when considering the energy use associated with the production of their construction materials from a life cycle perspective [
2,
3]. The energy demand of buildings has been primarily met by electricity and natural gas, which together account for 55% of total energy consumption [
4]. Electricity has progressively become the main energy carrier, thanks to greater accessibility in developing countries and increased demand for cooling and heating through heat pumps and electrical devices.
According to González-Torres et al. [
5], the typical energy consumption of buildings is mainly divided into residential (72%) and non-residential (28%) buildings, requiring distinct approaches due to their physical and operational differences. Among the non-residential energy consumption of buildings, in the specific context of universities, the growing demand for thermal comfort, driven by the need to expand spaces for student housing [
6] and changes in lifestyle, has led to substantial increases in energy demand, making energy efficiency and retrofit interventions essential [
7].
On the importance of energy policies and planning [
3], the EU has established a legislative framework that includes the revised Energy Performance of Buildings Directive (EPBD) [
8] and the revised Energy Efficiency Directive [
9]. The most important and challenging target of these directives is achieving a fully decarbonized, zero-emission building stock by 2050 and introducing minimum energy performance standards for non-residential buildings to trigger renovations of the least energy-efficient structures.
Apart from improving the efficiency of their building and plant systems and pursuing the decarbonization of their energy consumption, universities, in conducting their activities, can contribute to sustainability through teaching, research, and by promoting awareness, scientific dissemination, and information on environmental issues. From this perspective, universities, like other public entities, should play an exemplary role in promoting the concept of “glocalization” [
10]. Indeed, they can foster sustainability actions, energy efficiency, and decarbonization, demonstrating their feasibility while also providing social accountability [
11]. The support and influence that universities exert on decision makers (municipalities, provinces, governments, etc.) in energy and environmental planning is well established [
12,
13].
However, as previously noted, universities are significant energy consumers with direct environmental impacts; consequently, decarbonization and efficiency measures implemented within these institutions receive heightened attention due to their pivotal role as centers of innovation and social responsibility. Energy management within these institutions is far more than a routine administrative task. It plays a critical role in driving economic efficiency, environmental stewardship, and educational advancement [
14,
15]. As microcosms of society, public universities encounter energy challenges similar to those faced by cities and industries globally [
16,
17]. From powering classrooms and research labs to meeting the climate control needs of extensive complexes, their energy demands are significant and diverse. Electricity consumption, in particular, shows a multifaceted dependence on several drivers, such as occupancy, the size of the building, HVAC typology, the utilization of spaces, the age of the building, urban contextualization, etc. [
18,
19]. Effective energy management thus extends beyond simple utility oversight, becoming a statement of sustainability and responsible citizenship [
20,
21,
22].
Despite the significant role of universities as energy-intensive entities with a considerable impact on sustainability policies, to the best of the authors’ knowledge, they have yet to undergo in-depth studies regarding the characterization of the dynamics of their energy consumption or be mapped in relation to their energy systems. Consequently, there are no benchmark Key Performance Indicators (KPIs) for this sector in the literature, unlike in other sectors that are often less energy intensive. These gaps result in significant challenges in proposing energy transition, decarbonization, or efficiency improvement measures (in other words, energy planning) within these contexts.
For these reasons, this study defines benchmark KPIs for the academic sector that are currently lacking in the literature. This is achieved by collecting and analyzing one year’s worth of real-world data from 156 buildings across 10 Italian universities, mapping their energy systems and consumption, and relating them to the main energy drivers. The resulting benchmark values can be very useful for evaluating at first sight the level of electricity consumption of a public university by knowing the climate conditions, prevalent type of thermal plant, and overall floor area.
The analysis covers the entire Italian territory, different climate conditions and urban contexts, several types of energy systems, diverse functional uses for spaces, and varying availability of utilities. In total, it is based on over 5,465,000 quarter-hourly electricity consumption data points. As a consequence, this study also resulted in the development of one of the most extensive databases of universities’ consumption and related energy drivers.
2. Materials and Methods
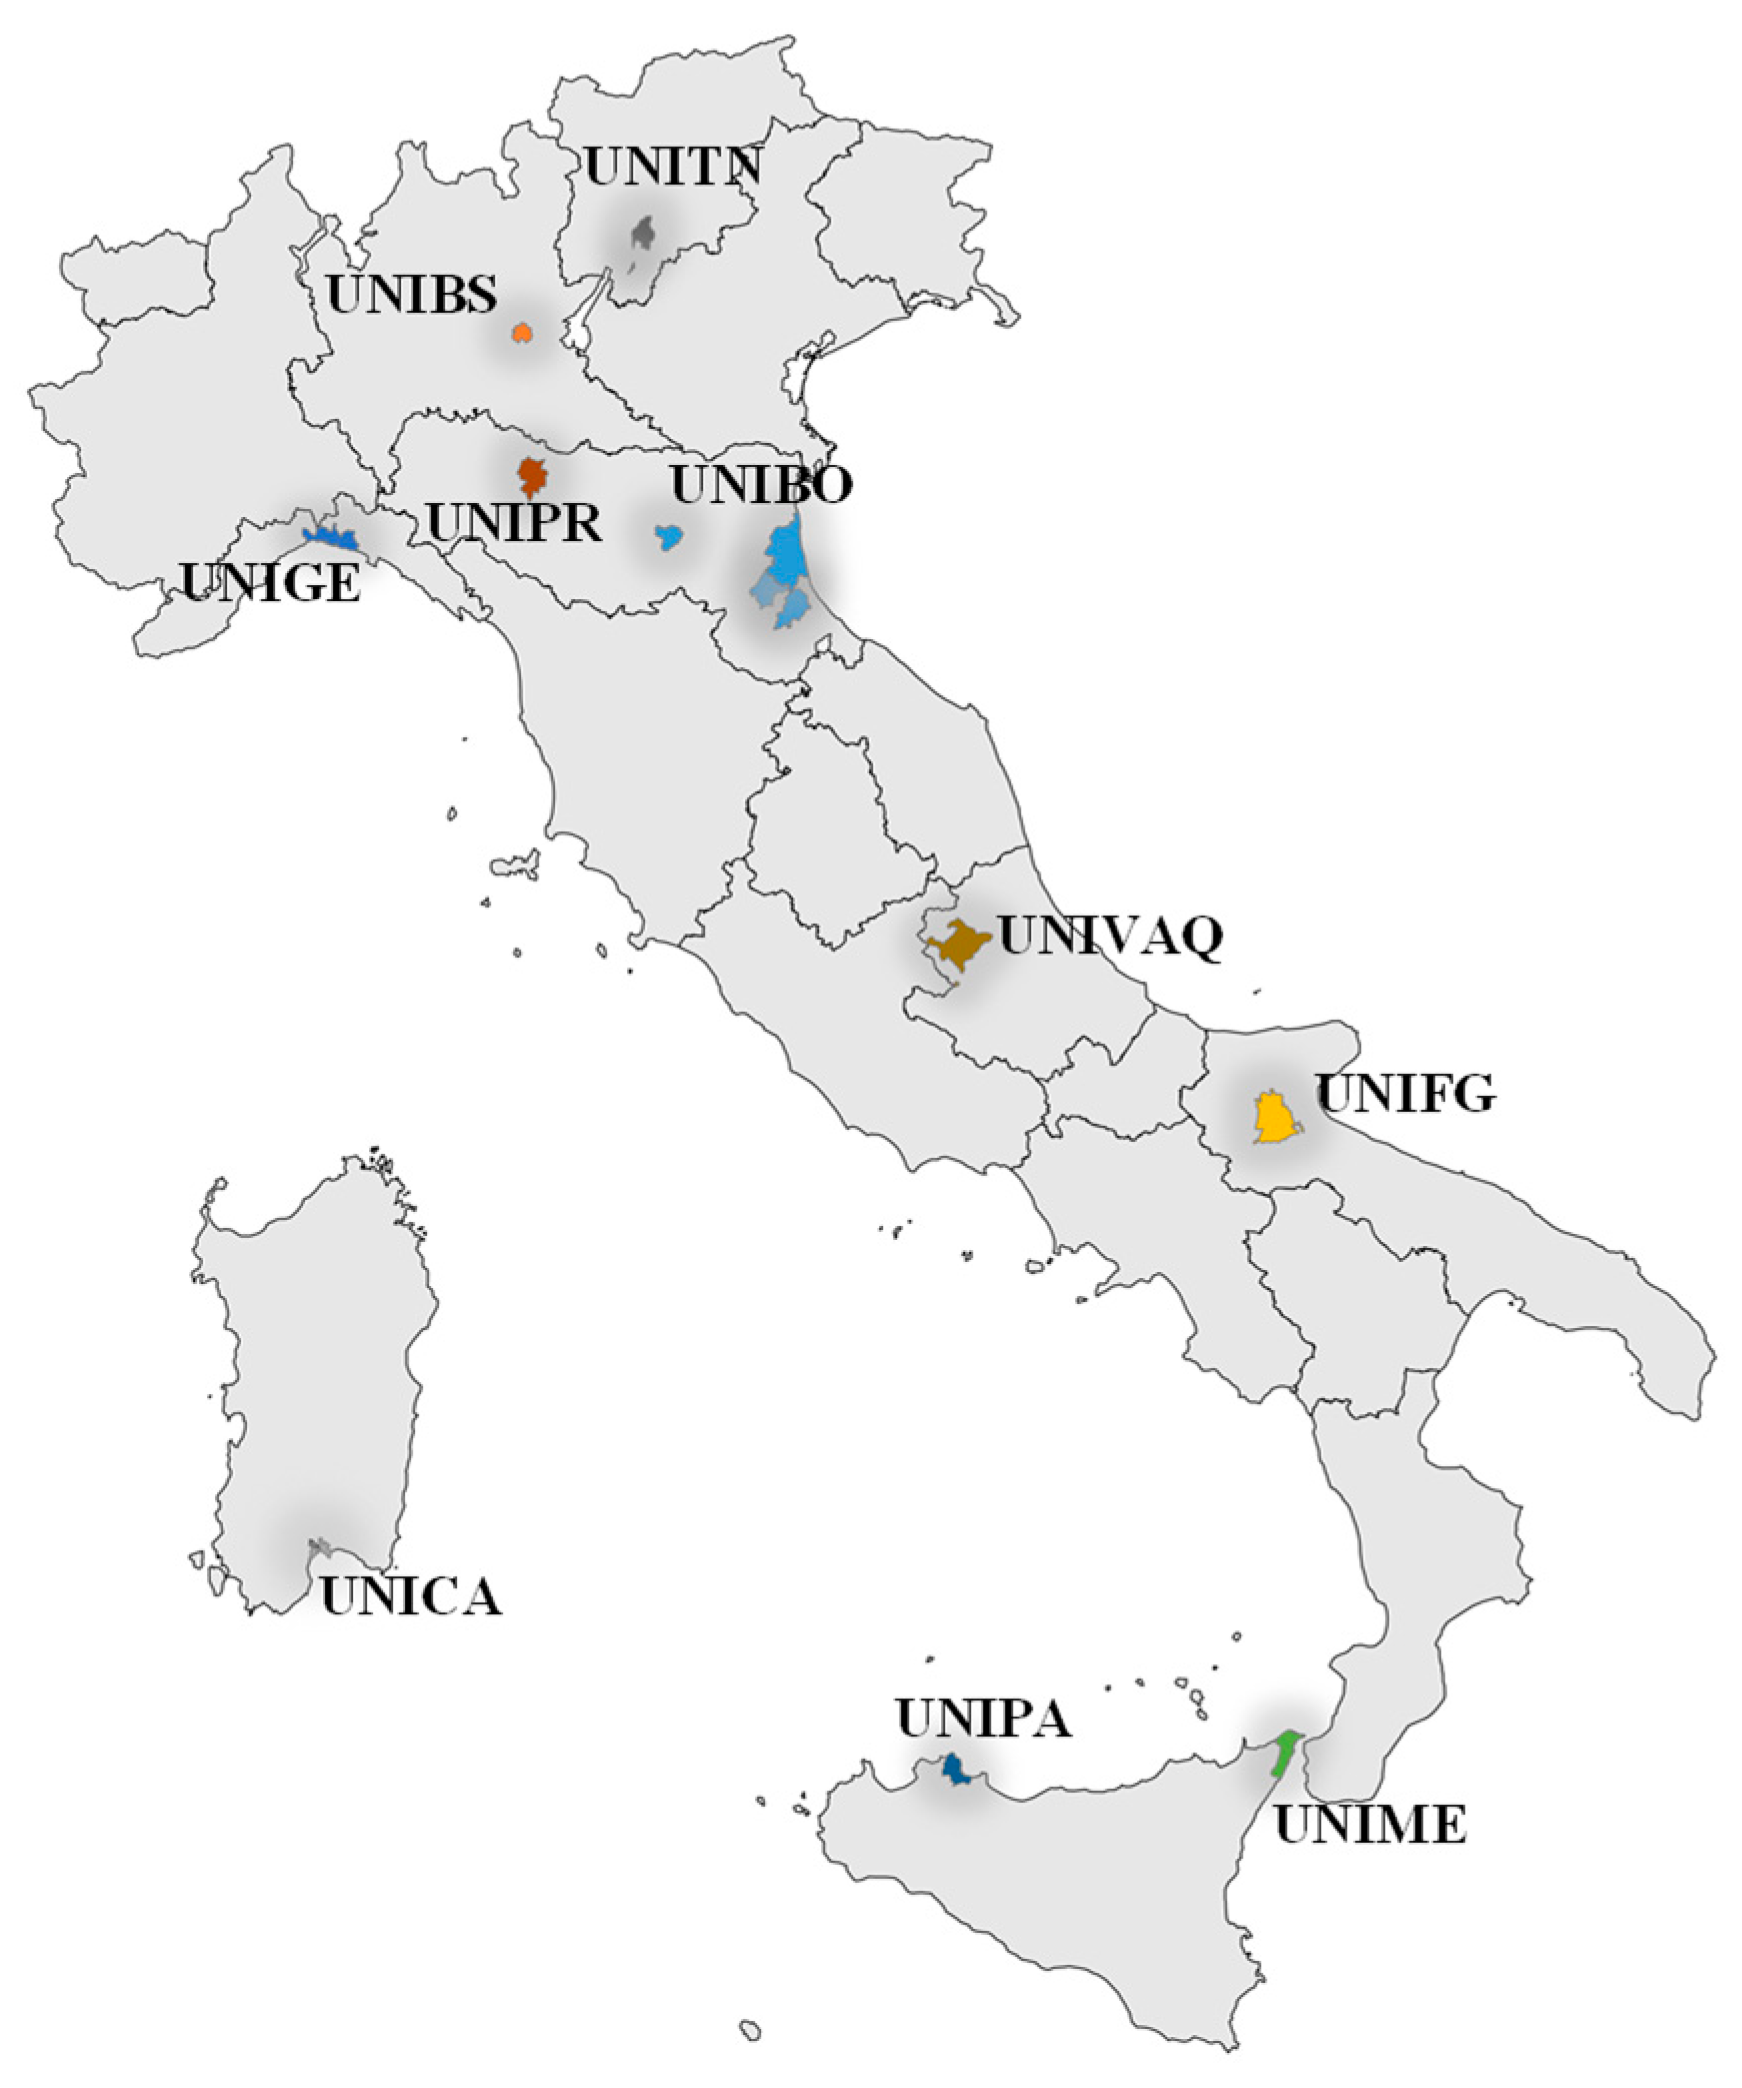
The definition of the KPIs is based on an analysis of measured data from 10 universities located in Italy (
Figure 1 and
Table 1), belonging to different geographical contexts, latitudes, and altitudes, and characterized by diverse energy systems and building typologies. The universities considered are all public ones, which involve many fields of teaching and research (Engineering, Human Sciences, Medicine, Economy, Law, Biosciences, etc.), demonstrating the high variability of data considered and also the wideness of the study proposed, which can be used as a benchmark value for any general public university.
The data used for the definition of the KPIs included, for each university, the location; the Heating Degree Days (HDD—see Equation (1)); the climate zone; the consumption centers; the number of buildings included; their urban context and age; the net area; the conditioned volume; the shares of classrooms, offices, and laboratories; the presence of electric generators and smart systems; the type of heating system; the main terminal type; as well as the hourly electricity consumption for the entire year of 2023. Indeed, all of the elements listed above were collected as potential energy drivers useful for defining KPIs, although not all were used in the present analysis. Moreover, this study focused on electricity consumption, with ongoing research by the authors aimed at extending the analysis to thermal consumption.
The data mentioned above were supplied by each participating university, with electricity consumption data characterized by a quarter-hour resolution and a one-year horizon. In order to have consistent data quality among the consumption centers, the electricity consumption data were retrieved from the distributors’ electricity meter devices, which involved precisely the point of delivery of the energy, which could then be supplied to different buildings with different utilization shares. The quarter-hour resolution enabled evaluating the daily demand for each of the four seasons, as well as the baseline consumption at nighttime or during breaks (e.g., summer breaks and Christmas breaks). Aggregating the data of all buildings, a benchmark value representing the statistical average electricity consumption of a public university was assessed, differentiated for different energy drivers. Definitively, each center of consumption, for which data of electrical consumption were collected, was characterized in terms of building area destined to a specific utilization (classrooms, laboratories, and offices).
2.1. Key Performance Indicators (KPIs)
As reported by Zhao et al. [
23,
24], several indexes can be proposed to evaluate a building’s energy performance. They usually refer energy consumption to various energy drivers, such as the floor area, the external temperature and, more in general, environmental conditions, the number and type of occupants, the functional use of spaces (laboratories, classroom, office, etc.), the type of thermal plant (boilers, heat pumps, etc.), the energy system’s management technology, and so on. In the authors’ opinion, among the reported energy drivers, the number of occupants is unsuitable for university settings, primarily due to strong fluctuations in student populations and the discrepancy between attendance and enrollment. Moreover, laboratory occupancy also varies depending on research or teaching activities, contributing to KPI variability. Additionally, accurate occupancy assessment requires specific monitoring devices, which are typically unavailable in university environments [
25]. In addition, occupants’ behaviors and habits can be very different, and a survey can be used to represent the sample correctly, also repeated every year. However, the year-by-year change in students is an additional degree of uncertainty that makes this choice unreliable.
Consequently, and based on data availability, this study related electricity consumption —thus defining the KPIs—to the surface area of the considered consumption center (kWh/m
2—
Section 2.1.1), which is an index of the size of the building, according also to Rey-Hernández et al. [
26], and to the outdoor temperature and climate conditions (kWh/HDD—
Section 2.1.2). To highlight the influence of these aspects as well, the KPIs were calculated for buildings characterized by different types of thermal plants (fully electric, hybrid, and non-electric—
Section 2.1.3) and functional space uses (offices, classrooms, and laboratories—
Section 2.1.4). These are the main drivers of energy consumption of a public university building.
2.1.1. Consumption per Floor Area
The first energy driver considered was the building floor area, which is the most common for this type of analysis [
27,
28]. Based on the floor area, the resulting KPI was the consumption per floor area (kWh/m
2). Indeed, electricity consumption is mostly related to lighting, electrical heating, ventilation, and air conditioning. In the first case, a minimum level of lighting should be also maintained at nighttime, for safety reasons. In many cases, in particular in the absence of smart systems (room thermostat, automatic lighting shut-off, presence detectors, etc.), the activation of such systems is centralized and completely separated from the actual presence of occupants in the rooms. So, the first driver was the size of the buildings involved in the consumption center, represented by its floor area.
2.1.2. Consumption per Heating Degree Days
The second energy driver considered was the Heating Degree Days (HDD), and the resulting KPI was the consumption per HDD (kWh/HDD). HDD is an indirect measure of the thermal need of a building, usually used to preliminarily estimate the energy required for heating and to design HVAC systems, as well as to evaluate building performance. This index normalizes the consumption for different climate conditions, representing a very important parameter. The HDD are calculated according to Equation (1):
where T
SP is the comfort internal temperature (SP—set point temperature, typically assumed to be 20 °C in Italy [
29], T
ext is the measured external mean daily temperature, and N is the number of heating days during a year (when thermal plant is turned on—i.e., T
ext < T
SP). If the average daily temperature is lower than the base temperature, the difference is counted as the HDD. If the average is higher, HDD for that day are zero.
The HDD can also be summed over a specific period (week, month, thermal season or year) to estimate the total heating requirements for that period. In this study, the HDD were retrieved from weather forecast services and official databases. In relation to the standard HDD (calculated over a typical meteorological year—TMY) of a location, the following climate zones can be defined [
30,
31]:
Zone A—The warmest areas, generally coastal or southern regions with HDD ≤ 600;
Zone B—Also warm, but slightly cooler than Zone A. It includes other southern coastal areas where longer heating is needed but still limited (600 < HDD ≤ 900);
Zone C—Covers areas with moderate winters, including parts of central Italy (900 < HDD ≤ 1400);
Zone D—These areas experience colder winters and require longer heating periods. Much of central Italy falls into this category (1400 < HDD ≤ 2100);
Zone E—Found in northern regions or mountain areas, this zone requires significant heating due to prolonged cold weather (2100 < HDD ≤ 3000);
Zone F—The coldest areas, mostly in the mountain areas, with severe winter conditions (HDD > 3000).
This classification covers all Italian climate regions, but it can also be used for European or international climates. In fact, HDD is a recognized reference to fully categorize a climate zone, and every geographical site can be classified by its HDD value. So, using HDD as a reference unit for energy consumption allows the results to be compared among different locations (i.e., climate conditions) and years, homogenizing the data regarding the climate. This means that data results can be used as a reference for each geographical site, which is simply characterized by its HDD standard or actual value. A similar reference is the Cooling Degree Days (CDD), which makes reference to the summer condition and cooling request. However, the two values (HDD and CDD) can be seen as complementary values, and the use of HDD is universally preferred for characterizing a climate zone.
Table 2 summarizes the standard HDD values for the universities involved, as well as the climate zone.
2.1.3. Functional Use of Space
Spaces in universities are mainly divided into classrooms (both for theoretical lectures and equipped with computer facilities), laboratories, teacher and secretariat rooms and offices, libraries, shared rooms for students, auditoriums and great halls for seminars and lectures, bathrooms, and circulation spaces [
32]. Based on the prevalence of spaces included in the sample considered, three main functional uses of space were categorized and considered herein: offices, classrooms, and laboratories. Each of them is characterized by different daily consumption profiles, so it was very interesting to analyze the differences among these functional uses of space.
Figure 2 characterizes the sample based on the prevalent functional uses of space, both in absolute terms—concerning the number of buildings involved—and in relative terms—considering the weighted average by floor area. Almost 42% of the buildings in number were mainly composed of laboratories, 39% were classroom-based, and the remaining 19% were mainly devoted to offices. A similar share was shown when considering the floor area, with a slight increase for offices. The possibility of further detailing the kind of laboratory involved (chemicals, mechanics, biological, electrical, computer sciences, etc.) would be useful for achieving a deeper understanding and for having a more specific relationship between electricity consumption and usage. However, this would require specific energy meters in rooms, since in the energy centers and buildings considered, the situation was very scattered and laboratories were usually mixed together in a building with offices and classrooms. The figure clearly presents the generality of the study, since more than 800,000 m
2 of overall floor area was considered in the 156 buildings. No other specific functional rooms were in the sample, like auditoriums, sport centers, or dormitories, which usually do not directly depend on university administration and have different patterns of usage during the day and weeks. The involvement in the study of every kind of university course (engineering, applied and basic sciences, economy, medicine, human sciences, etc.) greatly widened the study performed, being useful for energy impact estimation and policy making in a very general way. The distribution of rooms/buildings shown in
Figure 2 also demonstrates the generality in terms of functional use, specifically referred to as university function (teaching, research, or administration).
2.1.4. Thermal Plant Type
The thermal plant type is particularly important to assess a building’s energy performance. Where heat pumps are used year round, the annual electricity consumption (and consequently the related KPIs) tends to be higher compared to systems relying on a combination of electric and non-electric sources. However, the use of boilers fed by natural gas in winter is common in Europe and by far it is the most used heat generator in HVAC systems. For cooling needs, the use of electric heat pumps in summer is also commonly used, and therefore the electricity consumption profile strictly reflects the seasonal conditions. Recently, the use of reversible heat pumps both for winter and summer ambient conditioning has gained particular attention in the energy transition path, where RES exploitation is leading to the progressive electrification of users.
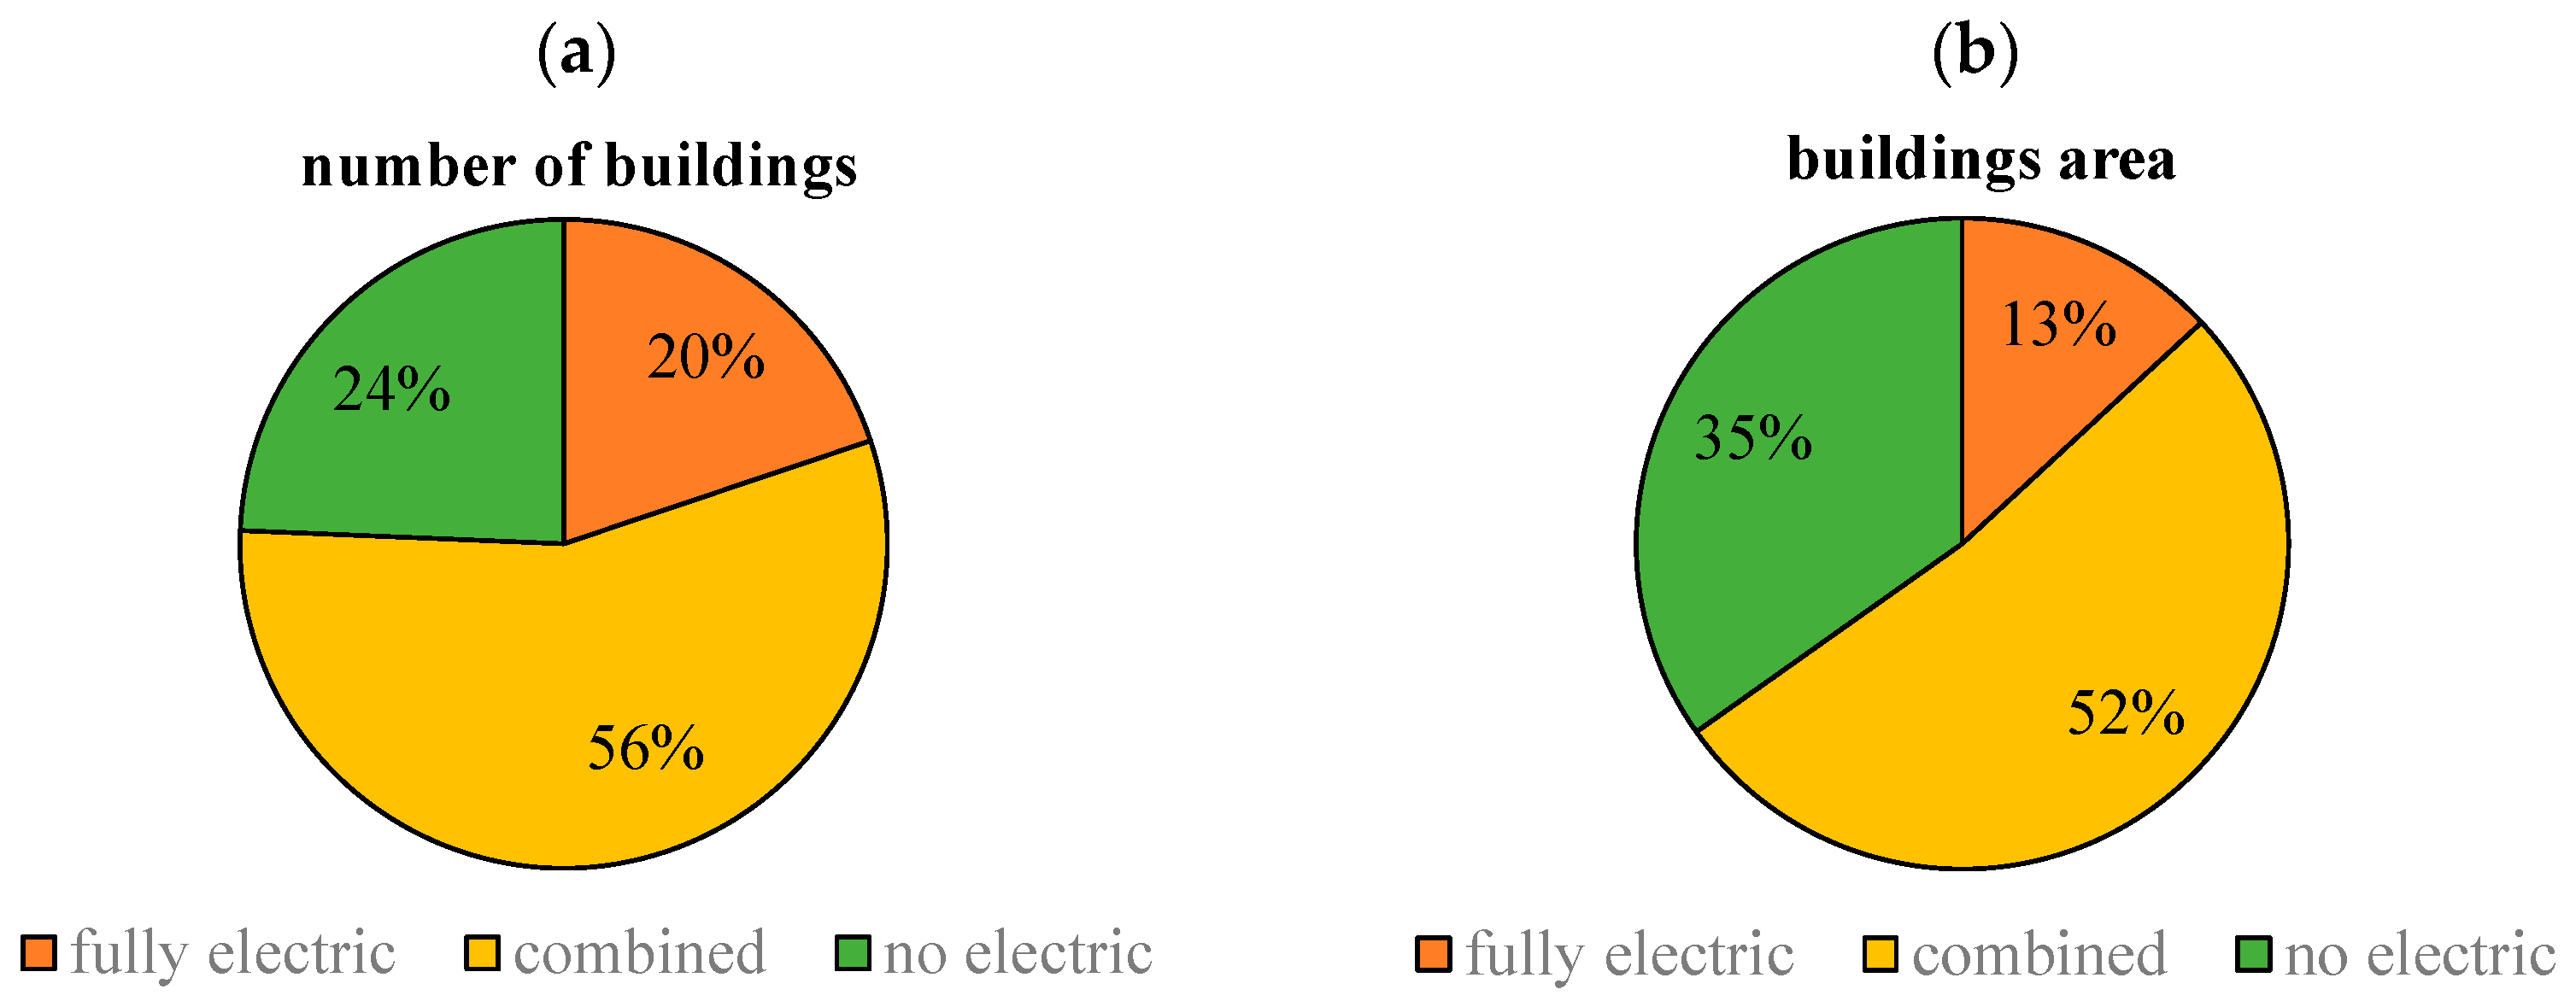
Given this, the thermal plant type was classified into three categories: fully electric, combined, and non-electric. A consumption center categorized as “fully electric” was equipped exclusively with reversible heat pumps for both winter heating and summer cooling. Within the sample, buildings with fully electric thermal systems represented 13% of the total (
Figure 3), even when weighted by floor area. Conversely, a consumption center classified as a “non-electric” thermal plant type relied solely on fossil fuel heating systems, powered by natural gas, diesel, or other fossil fuels. In the sample, this category accounted for 24% of buildings and 35% when weighted by floor area. Finally, the “combined” thermal plant type included consumption centers with fossil fuel boilers for winter heating and electric air conditioning units for summer cooling. It is interesting to note that more than 50% of buildings within this category were located in moderate climate zones (B and C), where the temperatures allowed the use of reversible heat pumps year round. Surely, the investment cost of fully electric conversion of a plant can represent a barrier for this kind of plant, particularly for public entities.
3. Results and Discussion
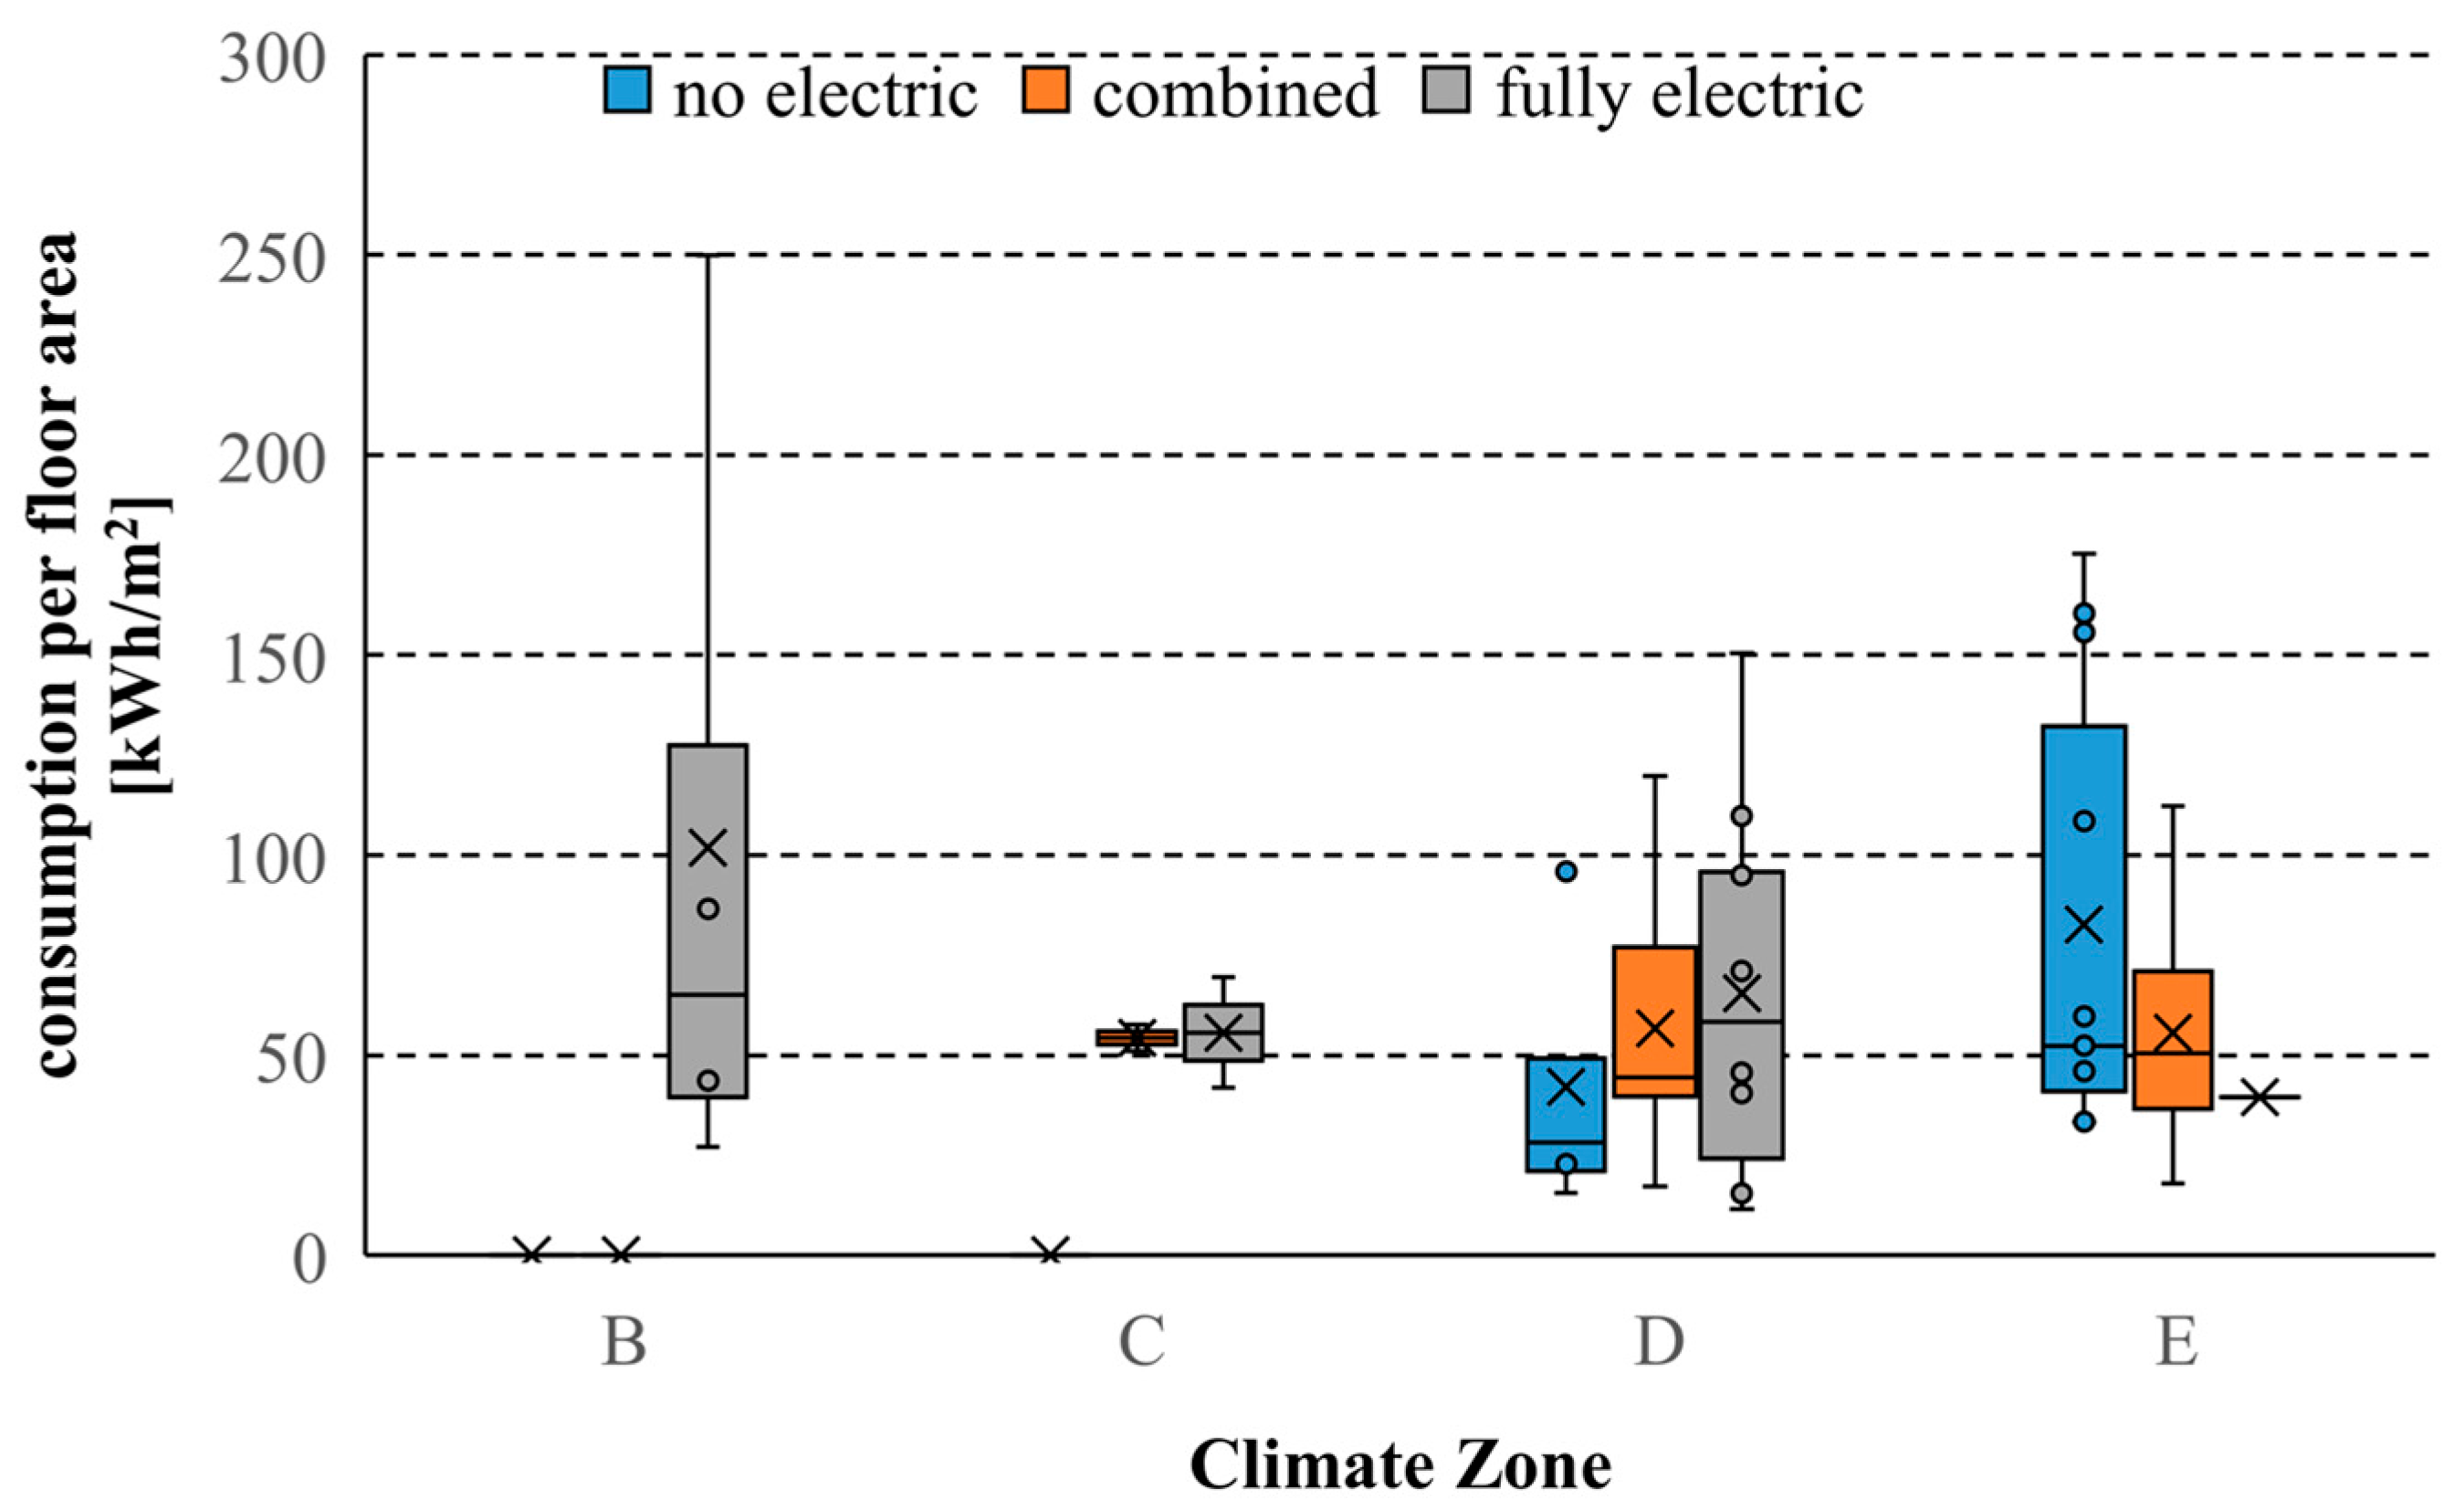
The results are presented using a boxplot representation, in which the boxes indicate the interquartile range, which spans from the first quartile (Q1) to the third quartile (Q3). The line inside the box indicates the median value, while the X represents the average value. The whiskers, which extend from the box, indicate the minimum and maximum values.
Figure 4,
Figure 5 and
Figure 6 show the results related to the first considered KPI (yearly consumption per floor area), while
Figure 7 relates to the second KPI (yearly electricity consumption per HDD).
The yearly consumption per floor area is shown in
Figure 4, with the climate zones (B–E) on the x-axis and the thermal plant type (non-electric, combined, fully electric) indicated by the box color. The average yearly consumption per floor area is around 60 kWh/m
2/year. As can be observed, median values are within the range of 25–75 kWh/m
2, where lower values are experienced for “non-electric” buildings, as expected. In fact, for these buildings, the electricity consumption generated by heat pumps is null, as no heat pumps are present. The yearly consumption per floor area is on average higher in climate zone B, due to climate conditions leading to wider adoption of fully electric thermal plant types, with a predominance of summer cooling usage. In zones D and E, “fully electric” thermal plants show higher variability in electricity consumption, indicating a stronger sensitivity to climate conditions. In zone D, the distribution of values is wider due to the larger sample size. Buildings with fully electric thermal plants show higher energy consumption compared to others, as they include total consumption for heating purposes. In zone E, fully electric thermal systems are almost not used due to the very cold climate conditions. Values are in line with or slightly lower than European tertiary buildings [
33,
34] but higher than those of residential ones, as expected [
35,
36].
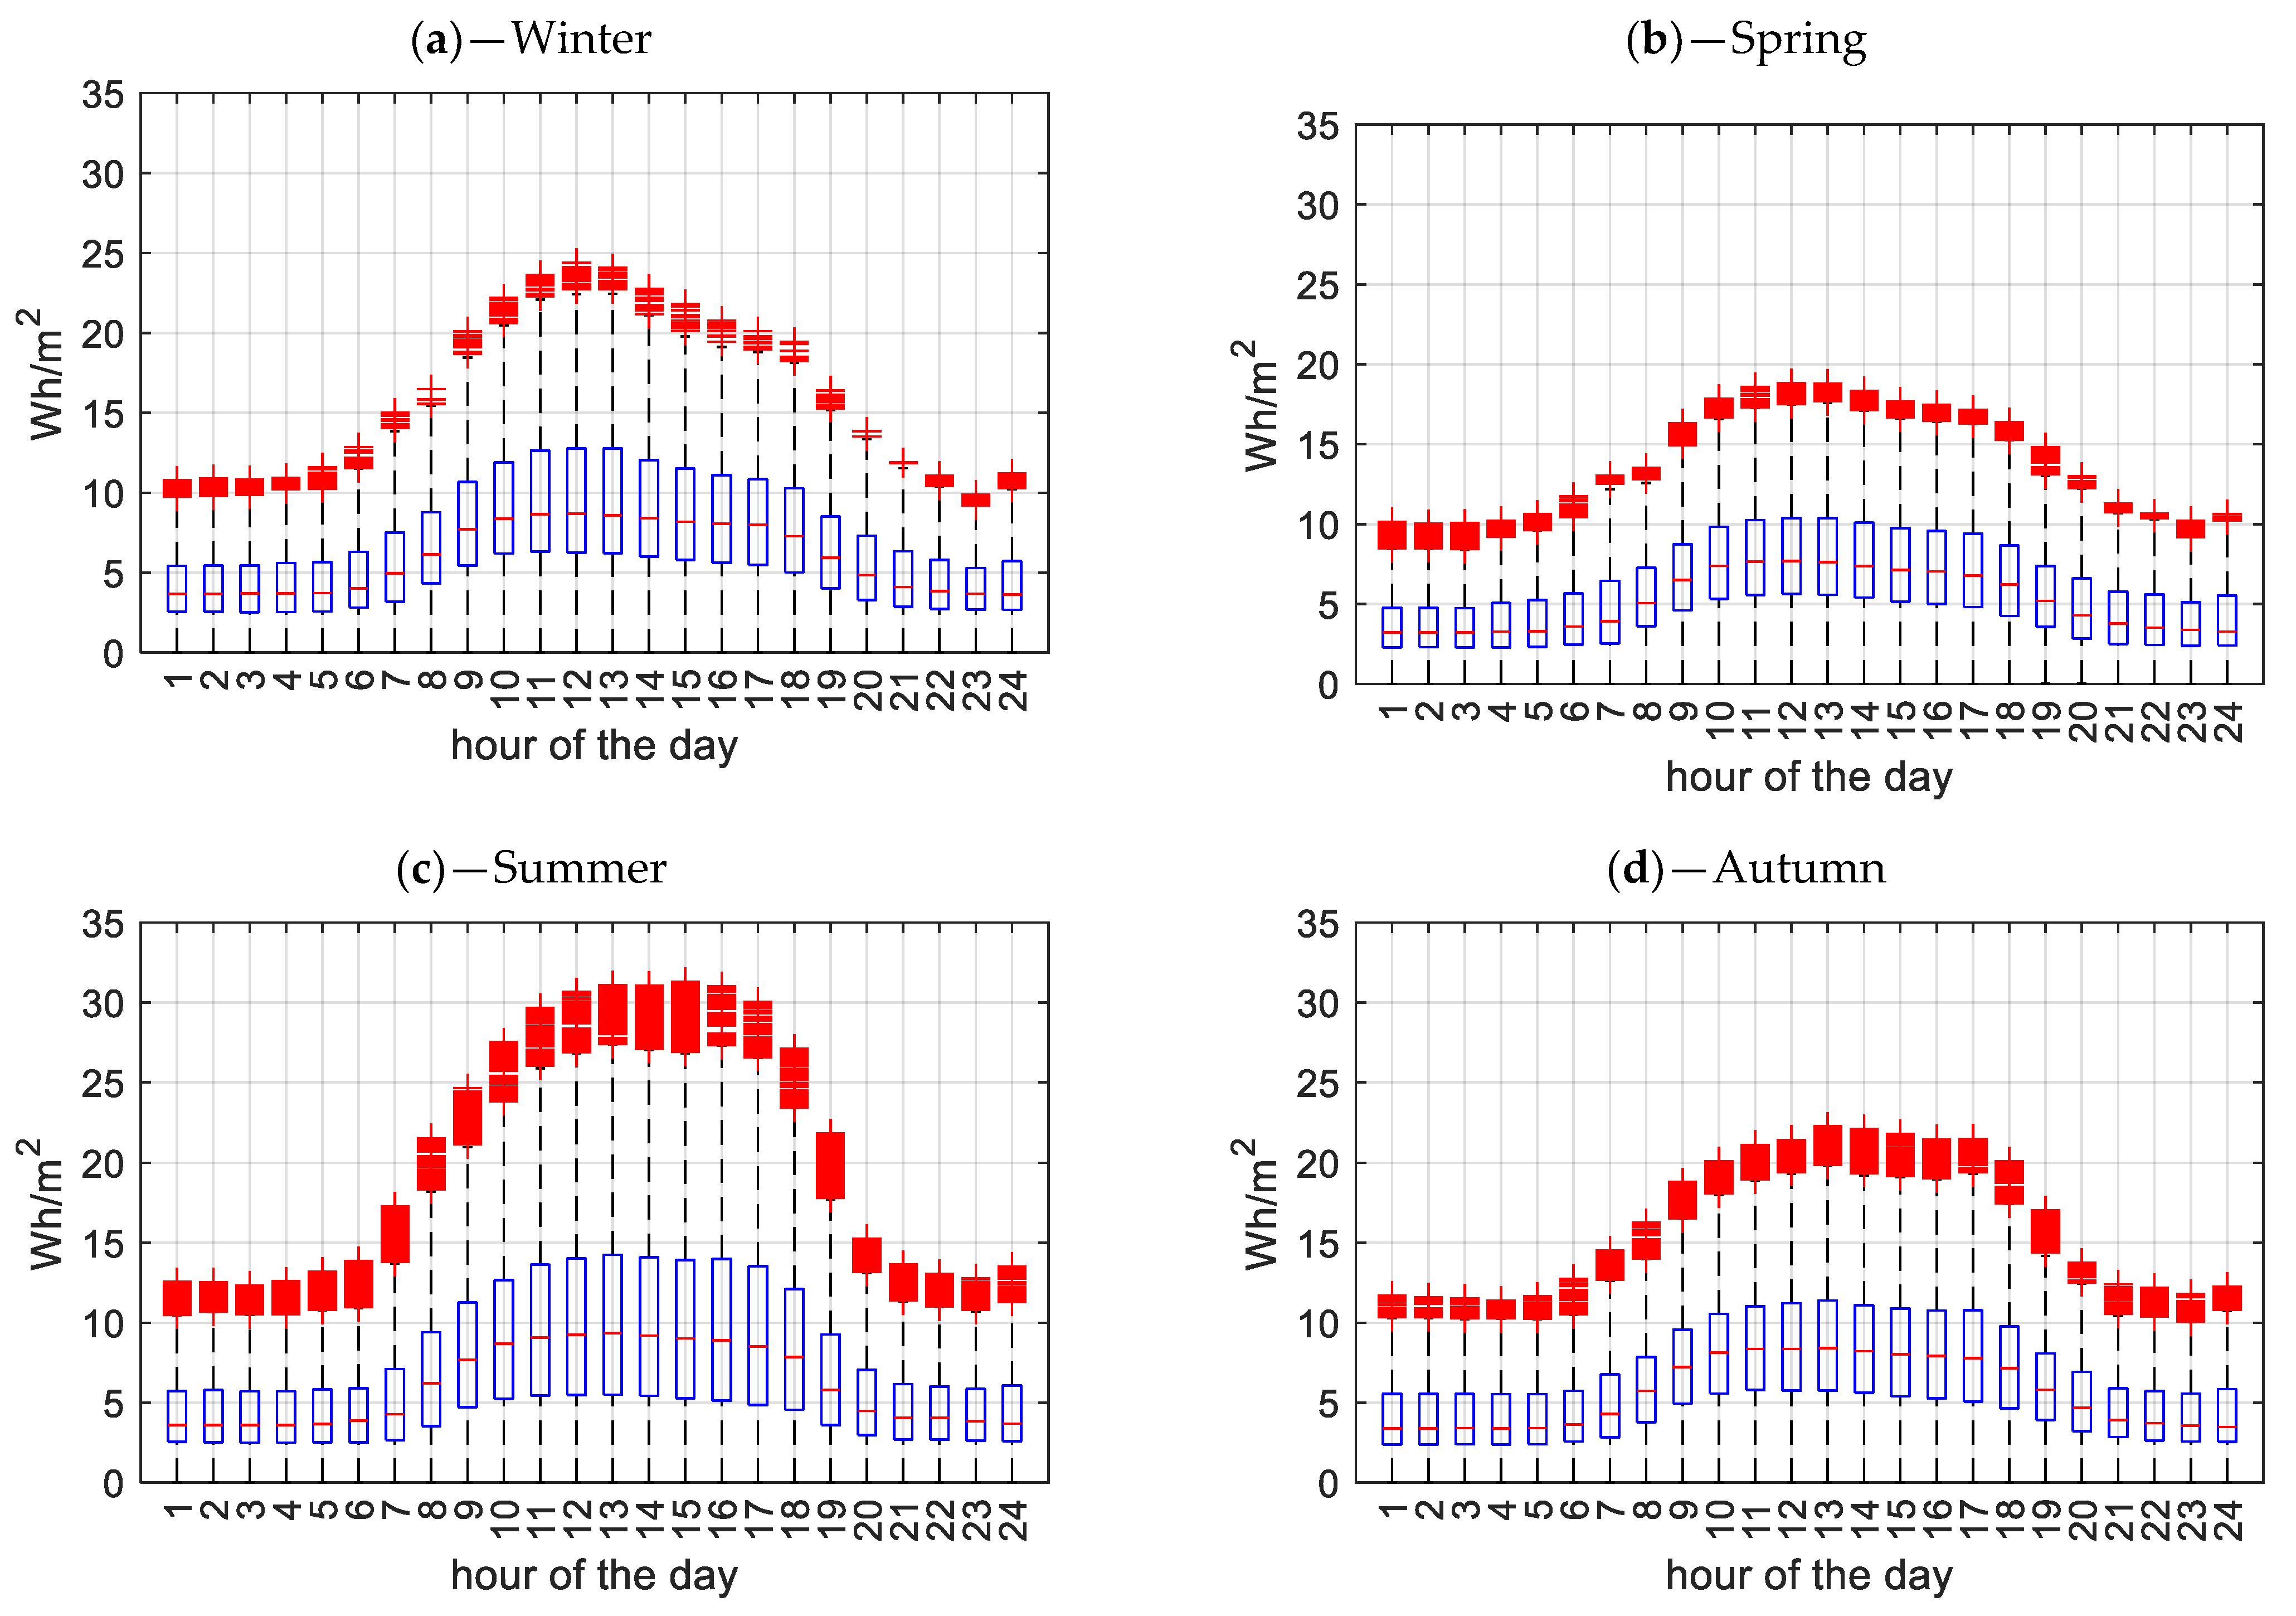
In order to highlight the hourly trend of electricity consumption, its variations throughout the year, and its baseline, a detailed analysis of the consumption per floor area of the entire dataset is presented at an hourly level, differentiated by seasons, working days (
Figure 5), and holidays (
Figure 6).
Focusing on
Figure 5 (working days), it is immediately evident that the buildings’ energy consumption increases during the central hours of the day across all seasons, starting at 7 a.m. and extending until 7–8 p.m. At midday, median consumption values reach approximately 8 Wh/m
2 during winter (
Figure 5a), spring (
Figure 5b), and autumn (
Figure 5d) and 10 Wh/m
2 during summer (
Figure 5c). The median nighttime consumption, which provides an indication of the buildings’ hourly baseline energy demand, is around 3–4 Wh/m
2 for all seasons. The highest nighttime values occur during the summer months due to the operation of cooling systems for data elaboration centers.
Another interesting aspect is that during the summer (
Figure 5c), the dispersion of data around the median value (red line inside each box) is much greater compared to other seasons. This can be attributed to the high variability in energy consumption caused by air conditioning systems, which have a particularly significant impact in the southern regions.
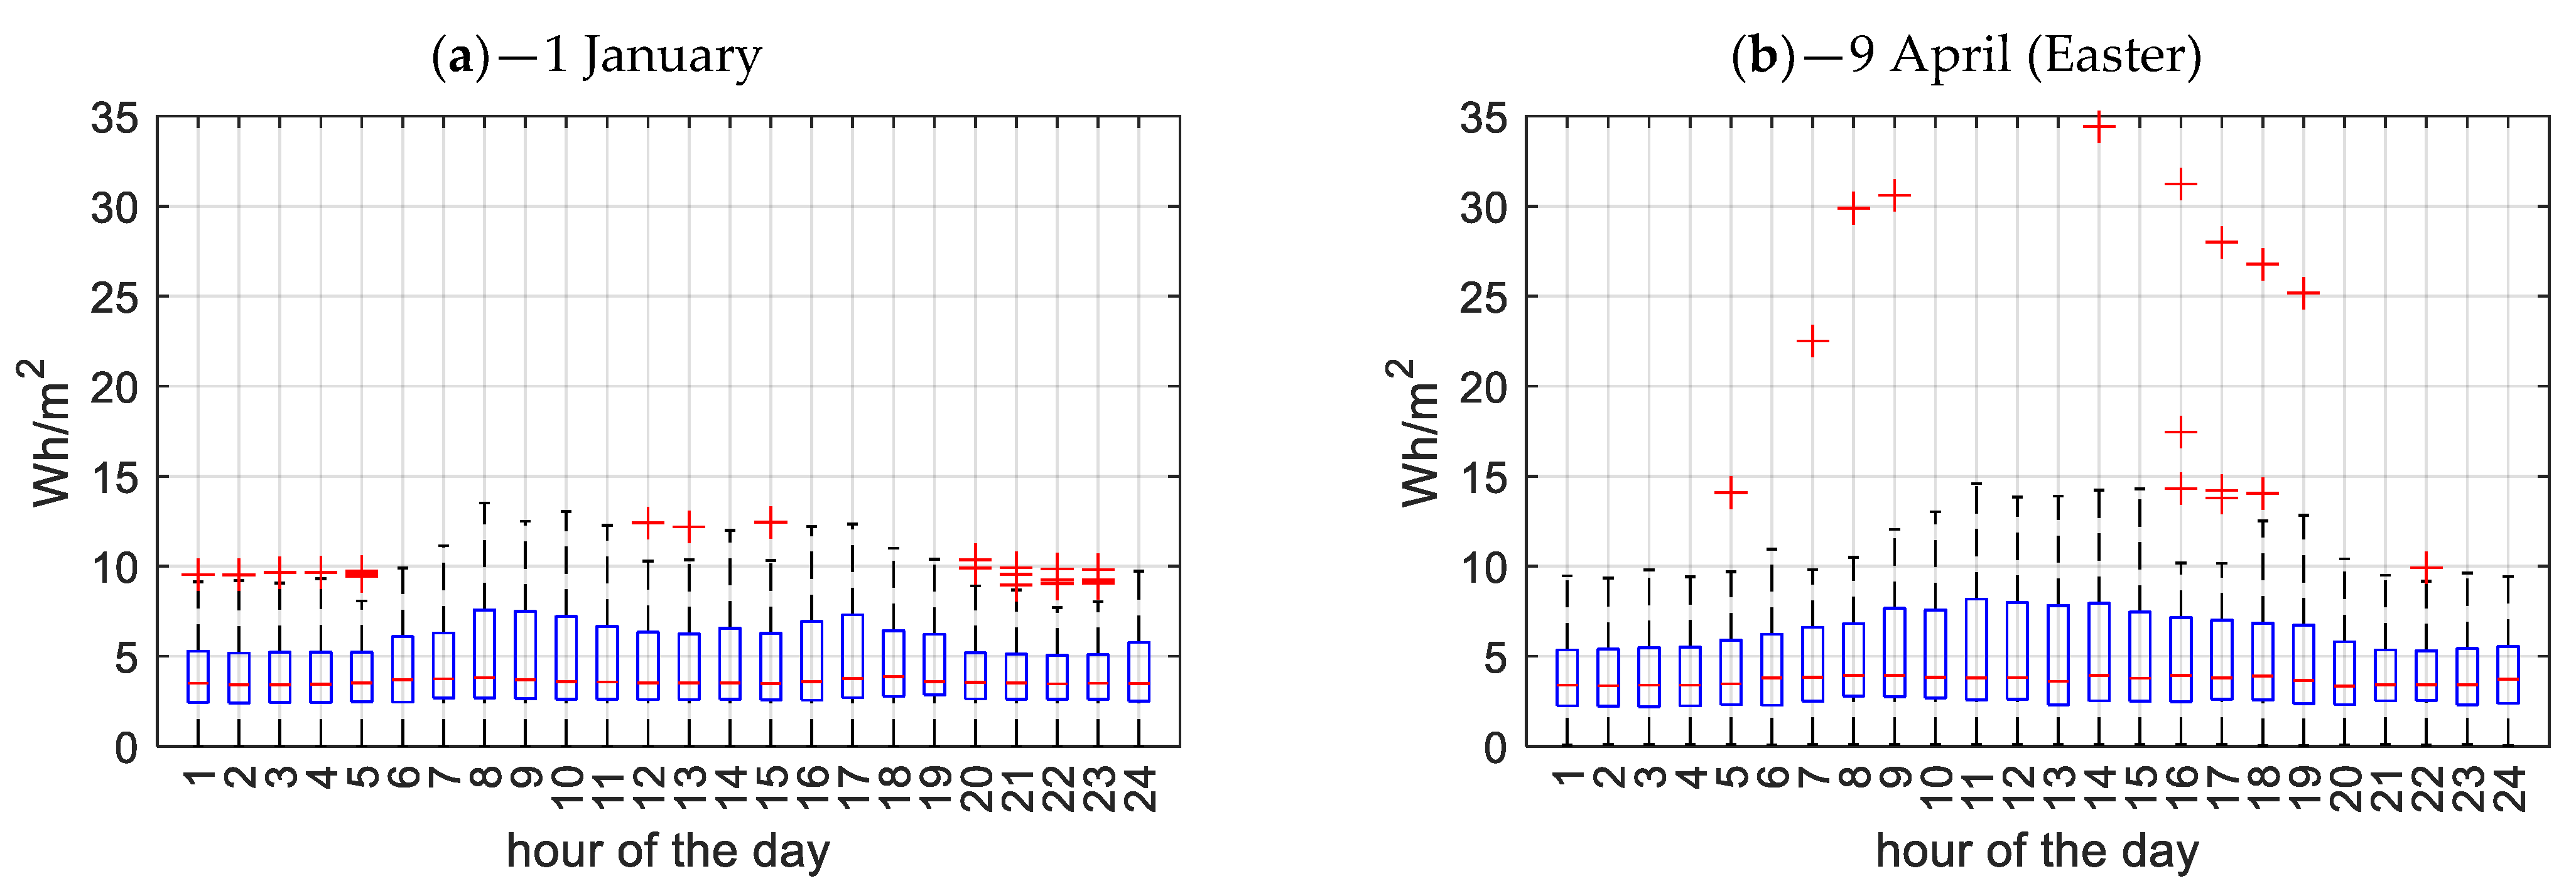
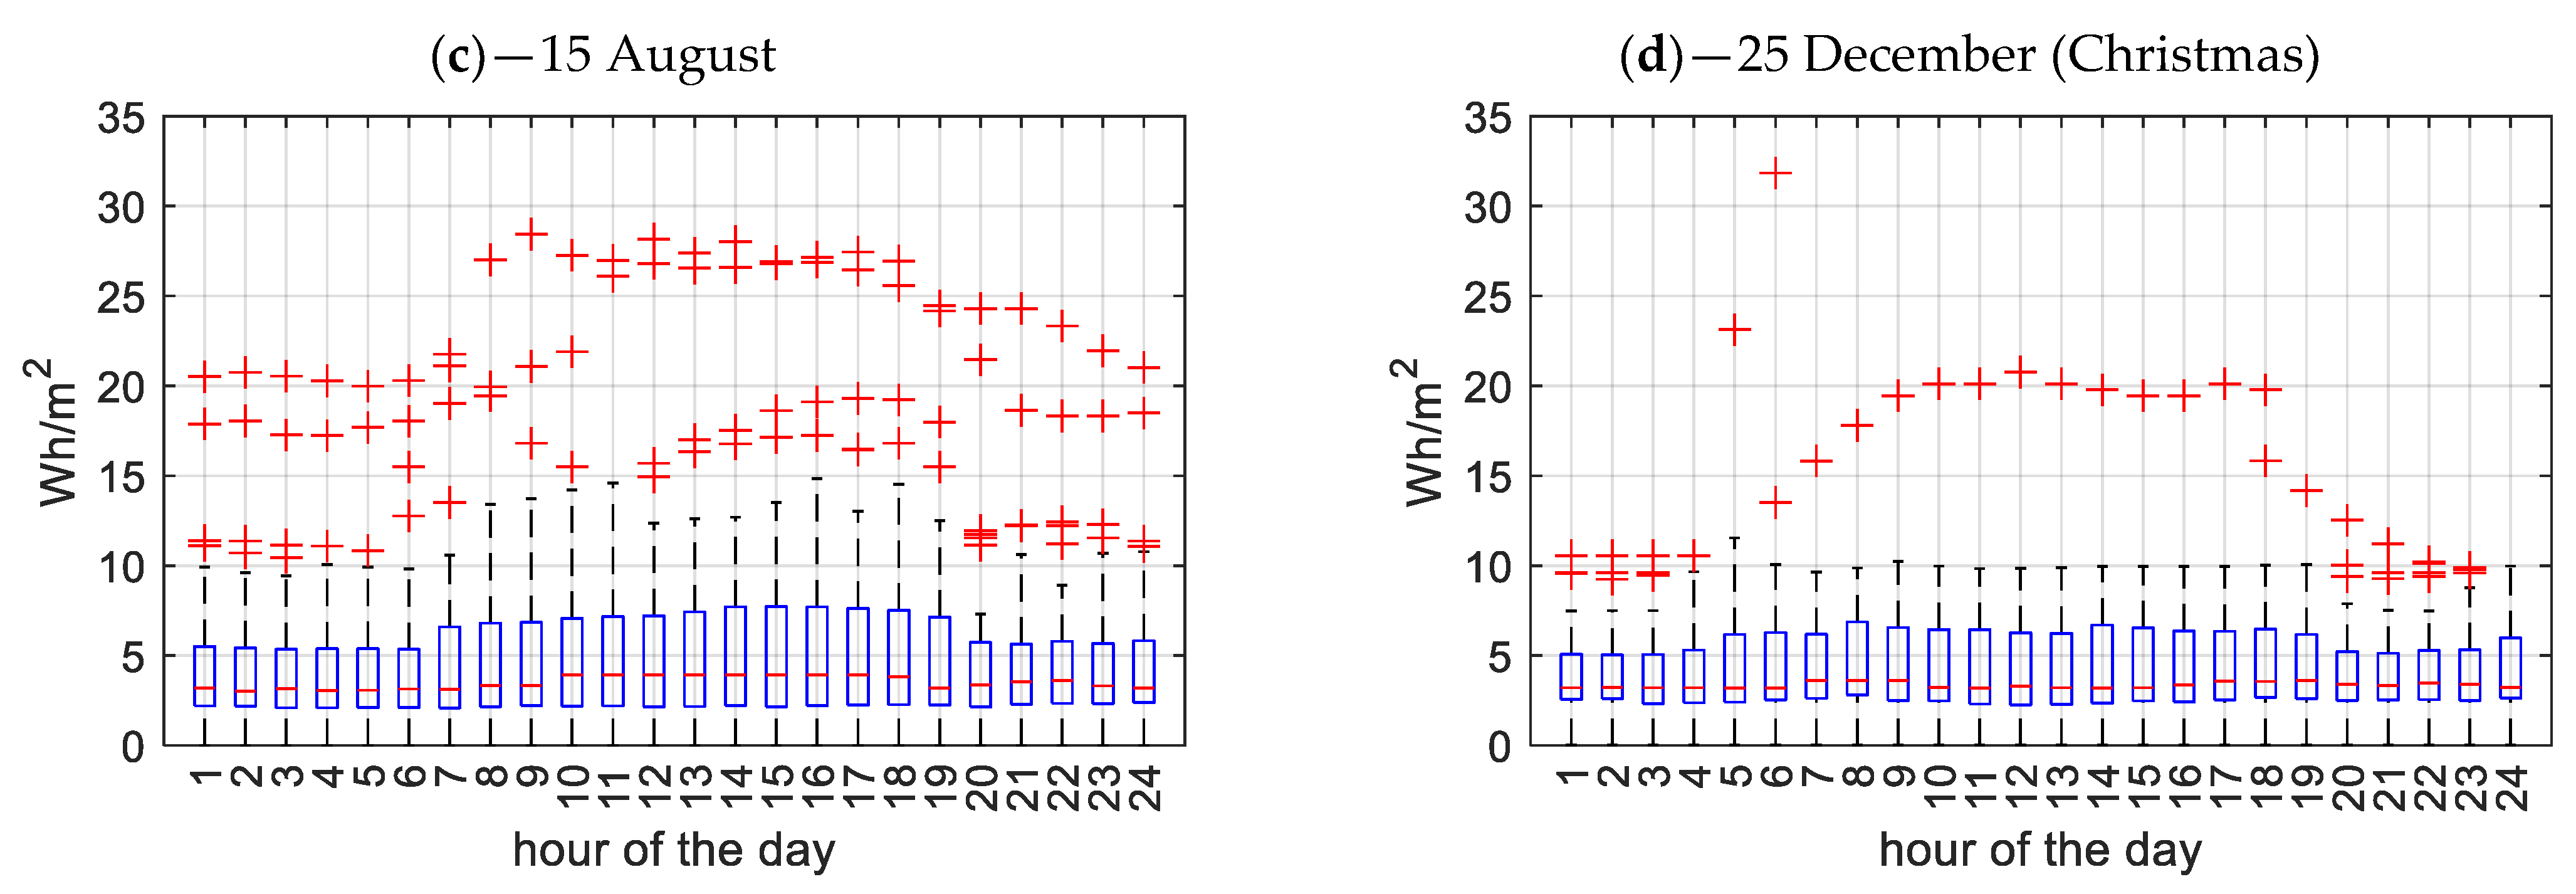
In line with the observations above, the baseline energy consumption of the buildings, as analyzed in
Figure 6, has a median value of 3–4 Wh/m
2 (approximately 35 kWh/m
2/year), while the maximum values rarely exceed 15 Wh/m
2. These values were evaluated considering four non-working days (a—1 January; b—9 April, which was Easter day in 2023; c—15 August; and d—25 December, Christmas day). On those days, universities are closed for teaching, research, and administrative work, so the median value observed is the electricity consumption that can be considered as baseline, since no activities are present. This electricity consumption is mainly due to safety lighting and devices, data centers, and other electric and electronic instrumentation always switched on.
The yearly consumption per HDD is shown in
Figure 7, with the thermal plant type (non-electric, combined, fully electric) on the x-axis and the functional use of space (classrooms, offices, and labs) indicated by the box color.
The yearly median consumption per HDD is around 500 kWh/HDD, and laboratories consistently show the highest values due to the electrical apparatuses used for research activities. For universities, laboratories act like “hard-to-abate” consumption centers. In fact, the electrical energy consumed is related to research or lab-based teaching activities, which are primary missions for academia, and their duties cannot be reduced. So, their decarbonization passes of course through renewable energy exploitation, as in sustainable energy communities. In these cases, hybrid strategies involving renewable energy exploitation, as in sustainable energy communities, can be used to meet a decarbonization target. Energy efficiency can be proposed only if specific low-consumption instrumentations are preferred, keeping the same application quality. Also, historical buildings deserve particular attention since they cannot always be equipped with renewable energy plants and their age is responsible for high energy consumption [
37].
Buildings with fully electric thermal plant types show greater variability in consumption per HDD for laboratories compared to classrooms and offices. In such systems, offices exhibit intermediate electricity consumption per HDD, while classrooms present the lowest values, likely due to more appropriate sizing of heating and cooling systems and scale effects.
Very interesting results are related to classrooms, which have a similar average consumption (around 400 kWh/HDD) regardless of the thermal plant type. Their electricity consumption is mainly due to the lighting of spaces, which has more importance than that of offices. This is true when the thermal plant type is not fully electric, and this observation claims better management of a fully electric system.
In conclusion, targeted management strategies should be implemented for buildings predominantly hosting laboratories, as these spaces often exhibit the highest electrical consumption. To enable this, the installation of specific monitoring systems should be mandatory in order to better understand actual usage patterns; however, such systems are often lacking in this sector [
33,
38].
4. Conclusions
This research provides an essential contribution to the characterization of energy dynamics in universities and offers valuable tools for energy planning within these entities. By analyzing a sample consisting of 156 buildings from 10 universities, spanning diverse climate zones and building typologies, one of the most comprehensive datasets on electricity consumption dynamics in the academic sector has been developed. This dataset, characterized by a high level of granularity, offers valuable insights into the factors influencing energy demand, including climate conditions, space usage, and technological configurations.
From the process of characterizing the sample, it emerged that only 13% of the buildings were equipped with fully electric thermal systems, predominantly in warmer climate zones. This emphasizes the need for a significant energy transition in universities. This is particularly difficult for those universities located in historical urban areas, where the installation of renewable energy systems is often restricted by heritage protection regulations. Therefore, one potential solution to achieve this transition could be integrating these buildings into sustainable energy communities, allowing them to benefit from shared renewable energy resources without the limitations imposed by building-specific installation constraints.
The results of the study showed that the average electricity consumption per floor area across universities was about 60 kWh/m2/year, with significant variations in energy dynamics driven by three primary drivers: the prevalence of functional use of space, the thermal plant type, and the climate context. Buildings with a prevalence of laboratories consistently showed the highest energy consumption, reflecting their intense operational requirements. The thermal plant type also played a pivotal role: fully electric systems exhibited higher variability in energy consumption, particularly in warmer climate zones, where summer cooling requirements are more significant. Considering the dependency on climate, an average value of 500 kWh per Heat Degrees Days per year was calculated for classrooms, with more than three times higher values for laboratories and lower values for offices.
The median baseline energy consumption value for universities was approximately 35 kWh/m2/year, with the highest values occurring during the winter and summer months, when thermal systems, especially those powered by electricity, play a crucial role in energy demand. The resulting benchmark values can be very useful for evaluating at first sight the level of electricity consumption of a public university by knowing the climate conditions, prevalent type of thermal plant, and overall floor area. Also, the characteristics in terms of usage of the building can be considered to evaluate the specific energy consumption level and further deepen the analysis focusing on the hot spots identified thanks to the benchmark comparison. It can also give indications for an eventual energy audit and diagnosis. These data can also define further actions in terms of the possibility of renewable energy plant installation and exploitation, as well as the possible integration of storage units. However, data on roof availability, tilt and azimuth angles, ground availability for photovoltaics, etc., and solar radiation for each city should also be considered and matched with the data resulting from this study in order to evaluate the real hourly self-consumption potential of a photovoltaic plant. This would also be useful in designing possible renewable energy communities.
The results have broad implications for stakeholders, including policymakers, university managers, energy managers, and building designers. By highlighting the interplay between climate, technology, and usage, this research can be helpful for the energy planning and design of more energy-efficient universities and the implementation of targeted policies for reducing carbon emissions in the academic sector. The benchmarks found can be helpful in understanding, for a specific center of consumption, if there is a need for action regarding the baseline average electricity consumption, in this way triggering energy management policies, and individuating the main needs by comparing the actual values with the ones resulting from this work.
Future work will leverage this extensive dataset to conduct in-depth analyses of specific building typologies and operational scenarios. This will help to uncover additional opportunities for efficiency improvements and guide investments in retrofitting existing infrastructures.
