Article

Comparative Study on Prediction Methods for Water Inflow in Regional High-Intensity Water Inrush Mine Clusters: A Case Study of Xiaozhuang Coal Mine

1
CCTEG Xi’an Research Institute (Group) Co., Ltd., Xi’an 710077, China
2
State Key Laboratory of Coal Mine Disaster Prevention and Control, Xi’an 710077, China
*
Author to whom correspondence should be addressed.
Appl. Sci. 2025, 15(17), 9472; https://doi.org/10.3390/app15179472
Submission received: 12 May 2025 / Revised: 28 July 2025 / Accepted: 22 August 2025 / Published: 28 August 2025
(This article belongs to the Special Issue Hydrogeology and Regional Groundwater Flow)

Abstract

To address the challenges of predicting high-intensity water inflow in regional mine clusters, this study evaluates the reliability of three methods—hydrogeological analogy, dynamic water inflow prediction models, and numerical simulations—based on geological and hydrogeological conditions as well as measured water inflow data from the target mining area. The water inflow at various working faces of the target coal mine was back-calculated, and the reliability of the three methods was compared. The conclusions are as follows: (1) Under the hydrogeological conditions of high-intensity water inflow in regional mine clusters, the conventional hydrogeological analogy method exhibits high reliability in predicting water inflow at the first-mined working face, with a coefficient of determination (R2) as high as 0.95. However, its prediction error increases significantly for non-first-mined working faces, yielding R2 values of only 0.72–0.85. (2) Compared to the hydrogeological analogy method, the dynamic prediction model based on groundwater dynamics more accurately characterizes the lateral runoff recharge process of aquifers, significantly improving the prediction accuracy for non-first-mined working faces (R2 = 0.90–0.94). (3) The numerical simulation method for water inflow prediction demonstrates high reliability under various conditions, but its accuracy is highly dependent on model characterization and parameter calibration.

1. Introduction

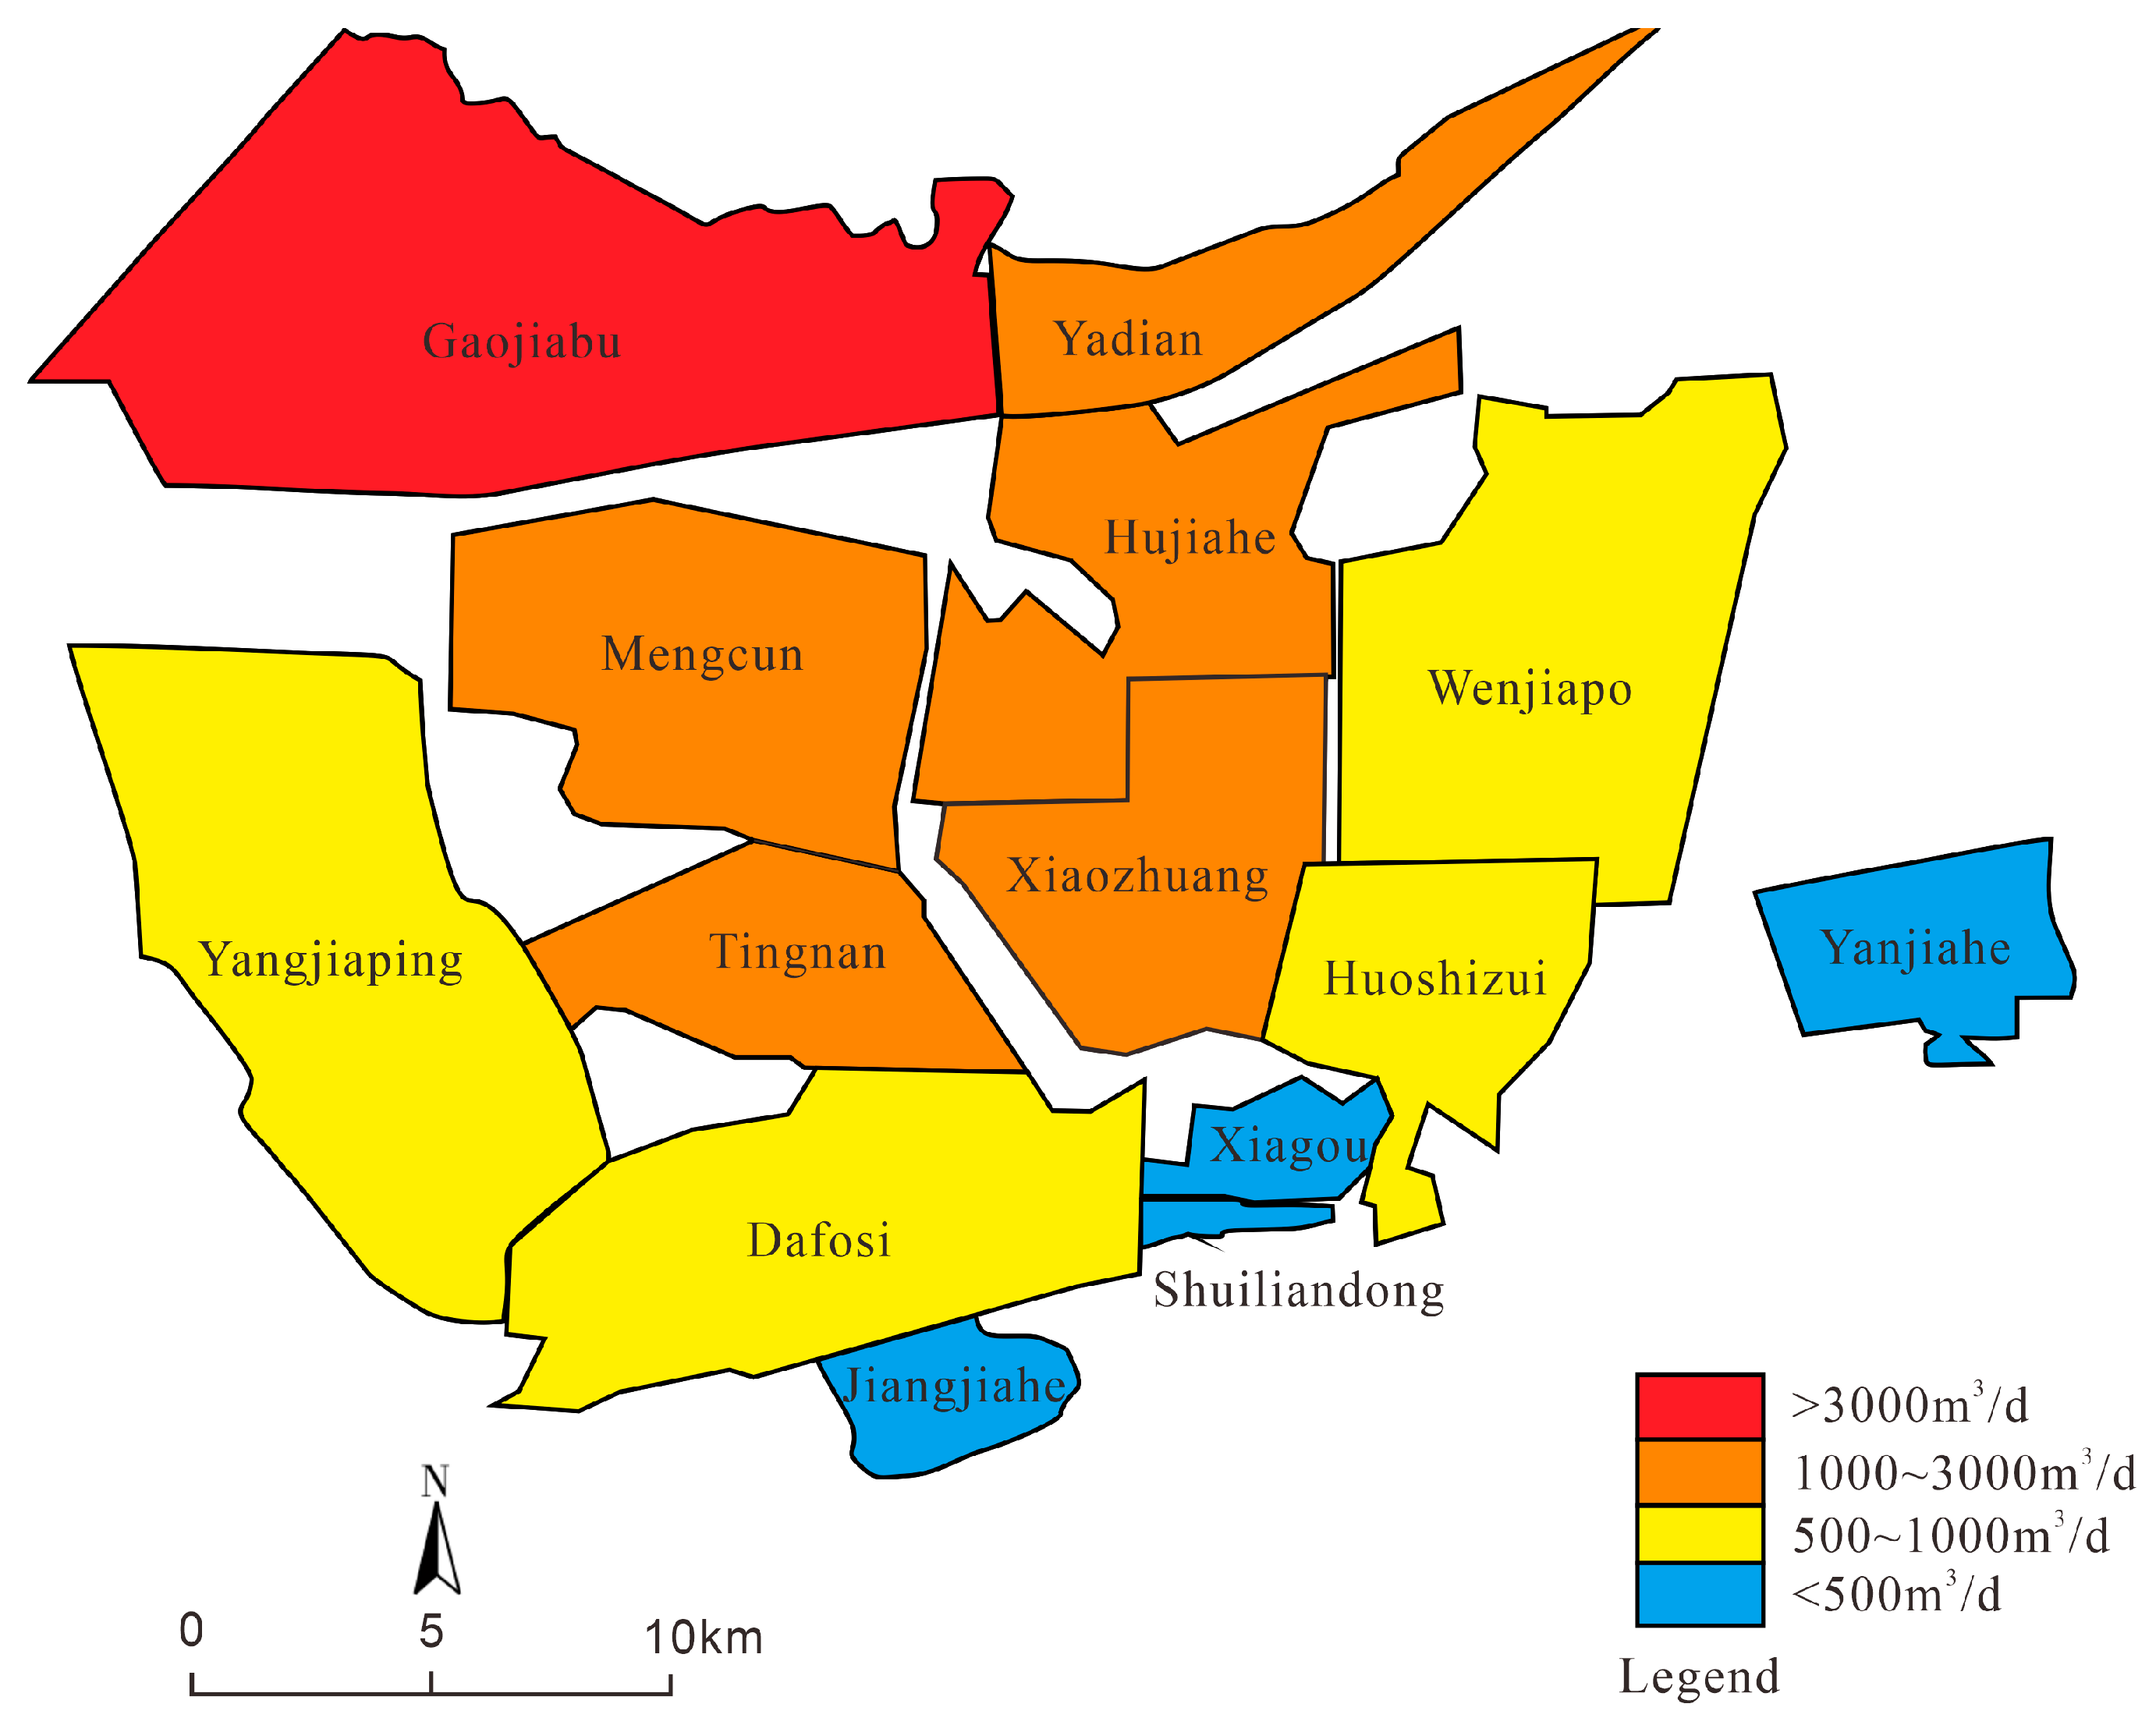
The Binchang Mining Area, a key site in the Huanglong Coal Base, is recognized by China’s National Mine Safety Administration as one of the most disaster-prone, water-rich, and challenging-to-manage coal mining regions in China [1] (Location of Binchang Mining area is shown in Figure 1). Mine water inflow in this area often exceeds 500 m3/h, with some mines exceeding 3000 m3/h under normal conditions. The phenomenon of high-intensity water inflow across regional mine clusters is exceptionally rare. As shown in Figure 2, coal mine water hazards are characterized by sudden onset, widespread occurrence, rapid flooding speeds, severe destructive potential, and challenging emergency response. These hazards critically constrain safe coal mine production [2,3,4]. Concurrently, mine water hazard incidents disrupt the hydrogeological setting of groundwater systems, leading to environmental issues such as land subsidence and groundwater contamination. This exacerbates the deterioration of groundwater environments in mining areas and intensifies the contradiction between water supply and demand in surrounding regions [5,6,7]. The accurate prediction of mine water inflow is critical for effective water hazard prevention [8,9,10]. While machine learning and artificial intelligence-based prediction methods have emerged [11,12,13,14], hydrogeological analogy, dynamic prediction models, and numerical simulations remain the primary approaches [15,16]. However, conventional methods often yield unstable accuracy in high-intensity water inflow scenarios [17], likely due to differing applicability conditions.
To address this, the Xiaozhuang Coal Mine, a major mine in the Binchang mining area, was selected as the study subject. Using hydrogeological data and field measurements, three methods were applied to back-calculate water inflow. Their reliability under varying conditions was analyzed to identify optimal prediction strategies, providing scientific guidance for mine water inflow forecasting.
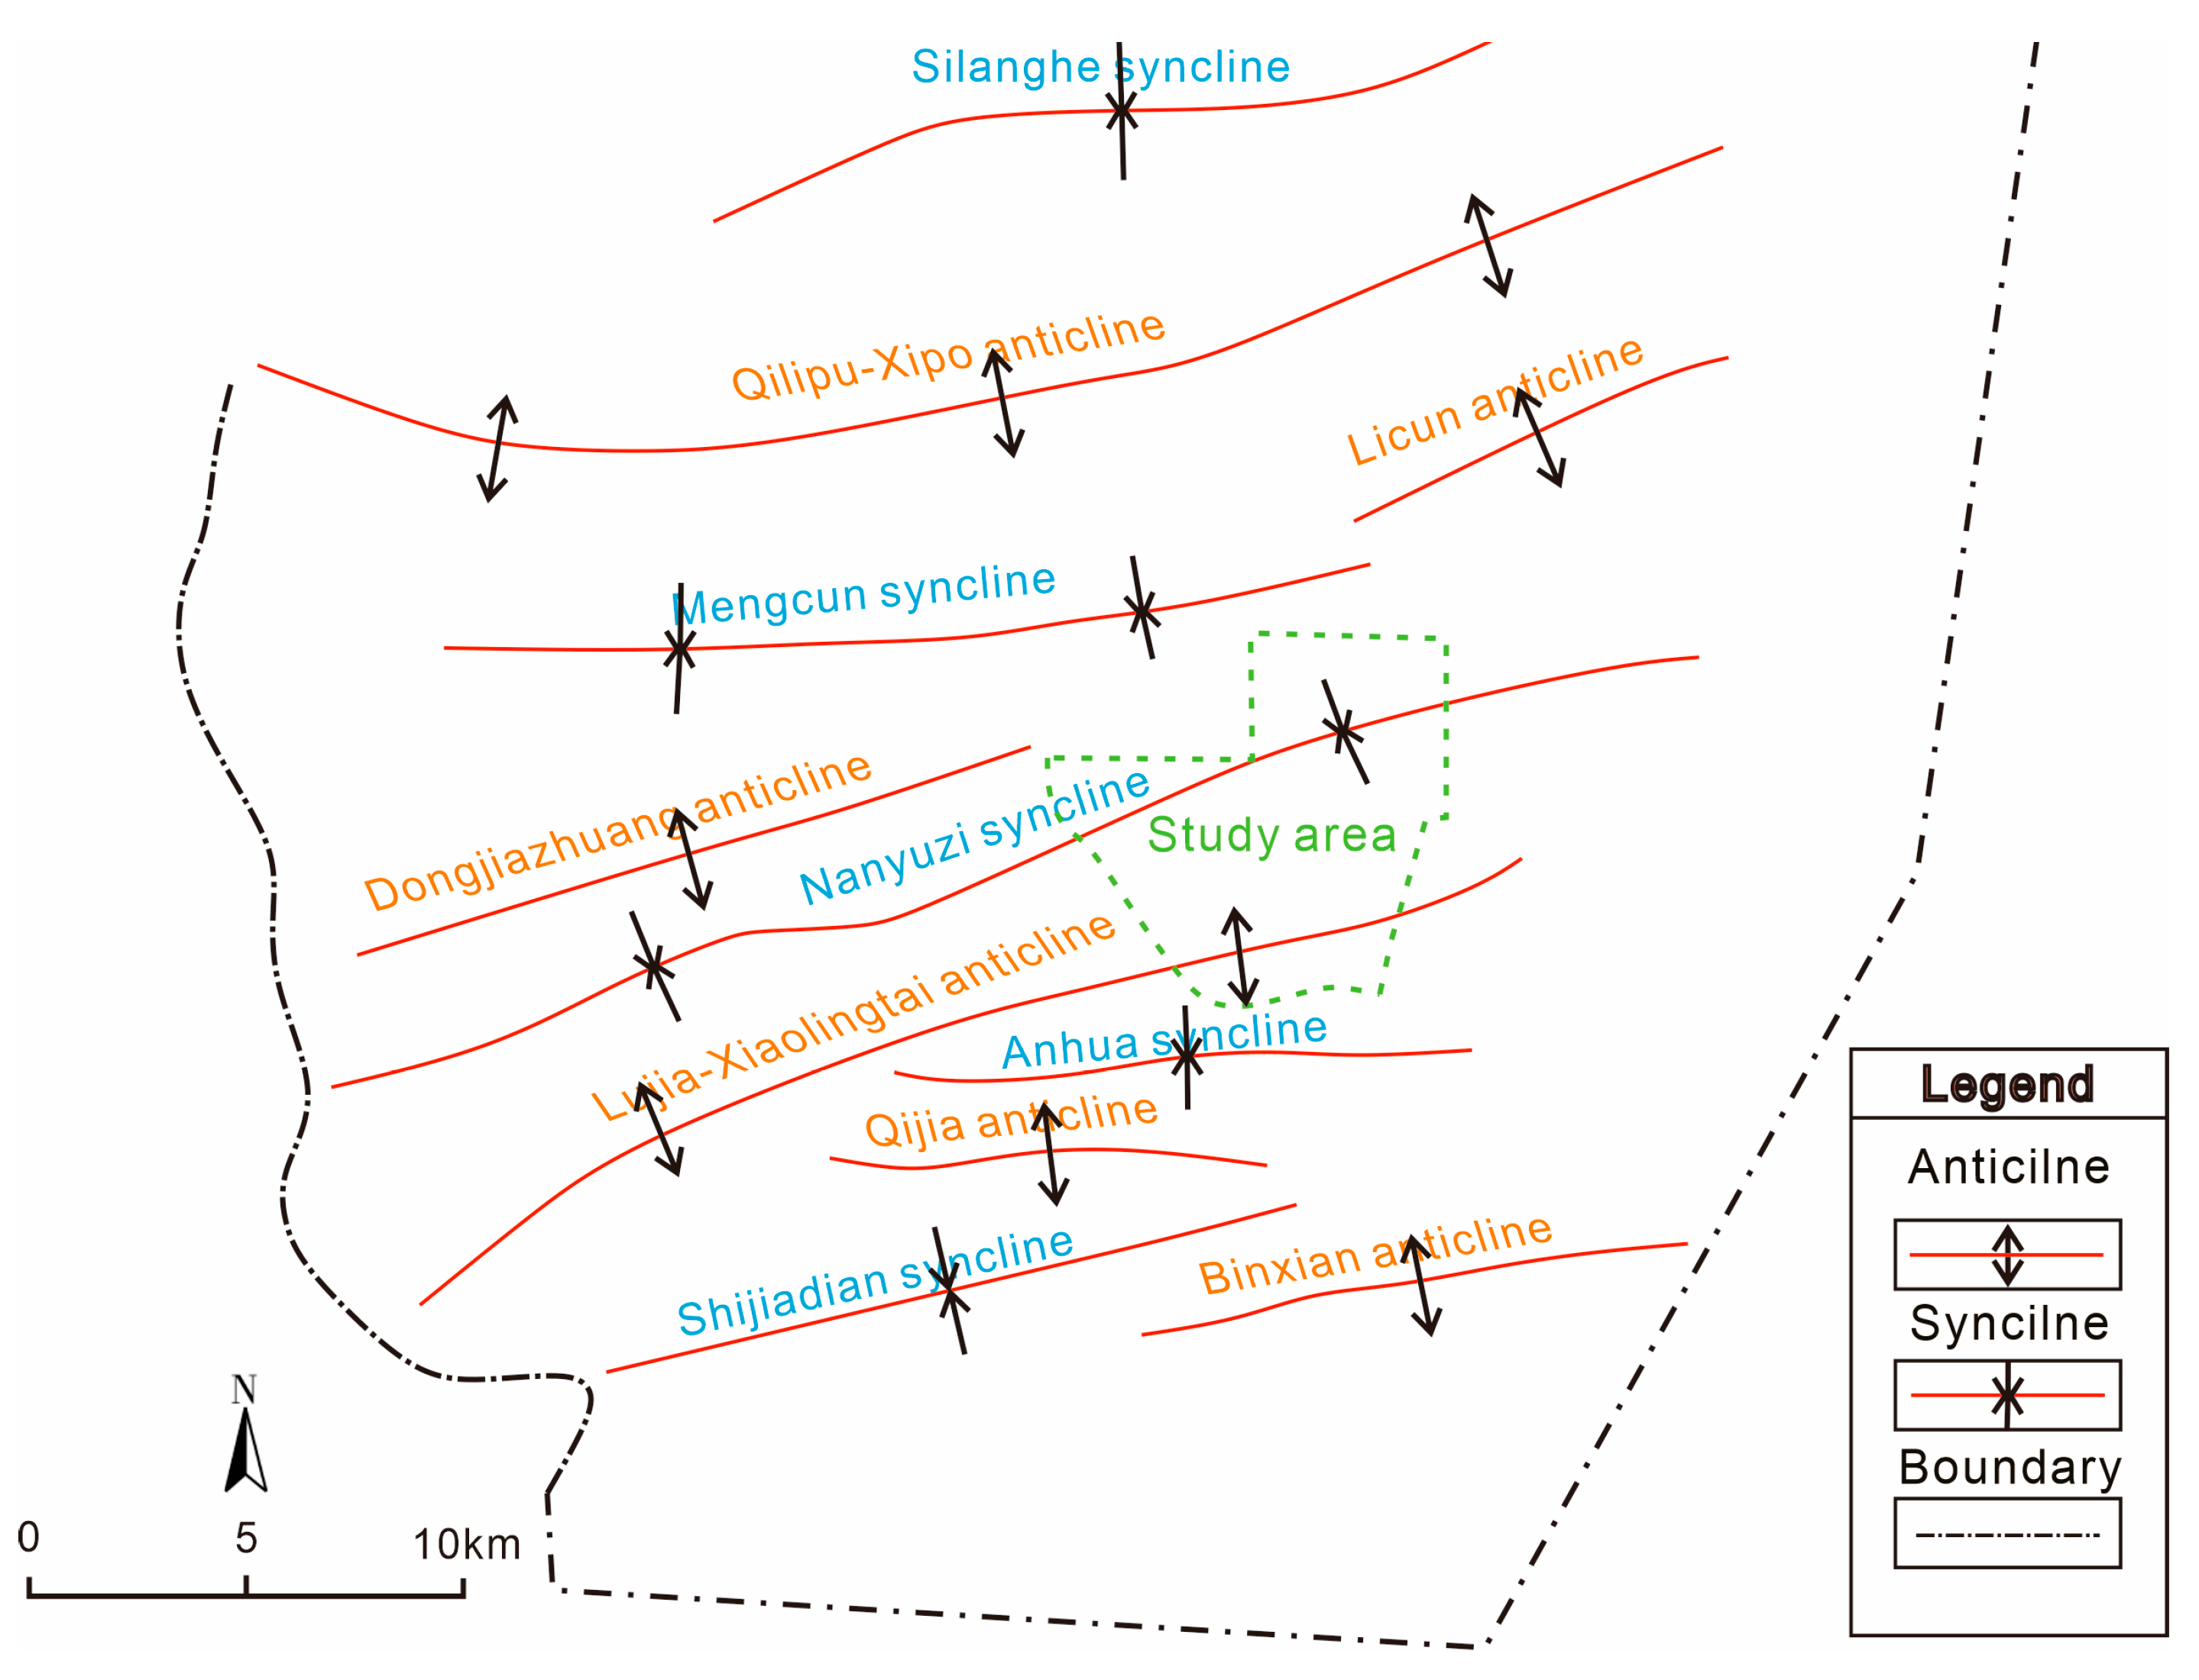
The regional tectonic map of Binchang mining area is shown in Figure 3.

2. Materials and Methods

2.1. Materials

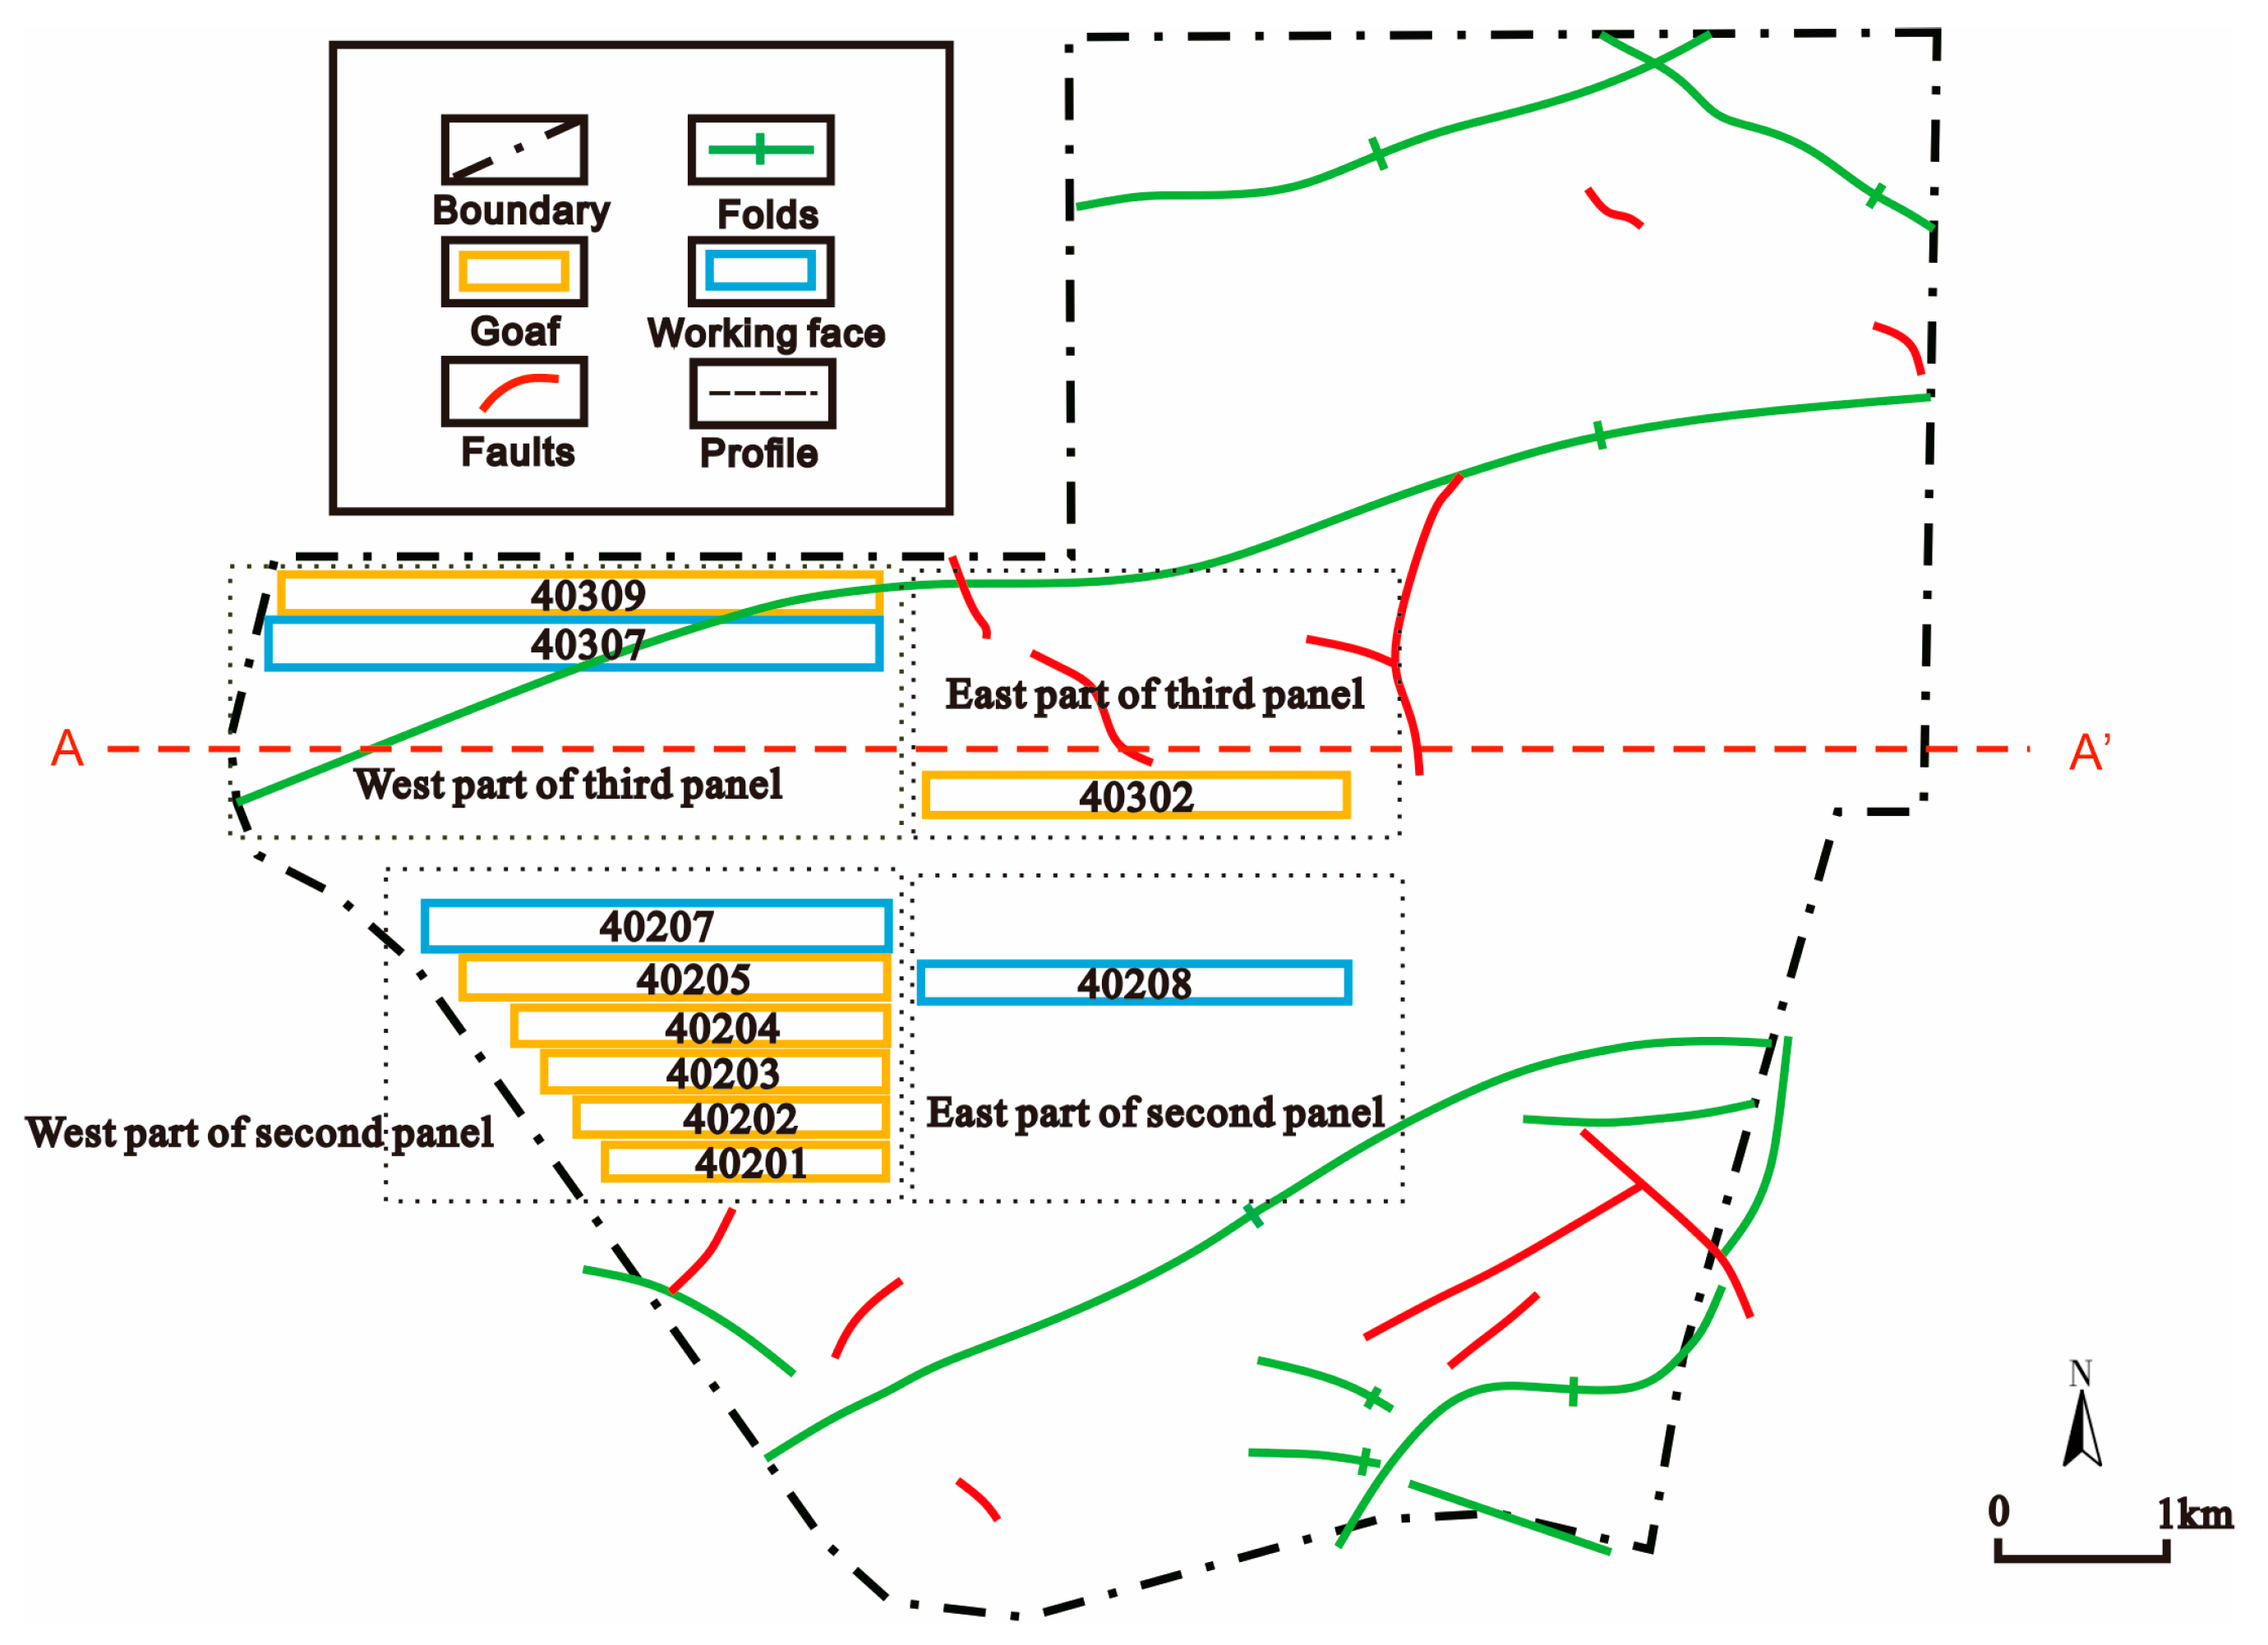
This study utilizes geological and hydrogeological data, along with field measurements, from the Xiaozhuang Coal Mine. The mining area is divided into four zones: western and eastern sections of Panel 2, and western and eastern sections of Panel 3 (Figure 4). To date, working faces 40201–40205 in the western Panel 2, 40302 in the eastern Panel 3, and 40309 in the western Panel 3 have been mined, generating extensive water inflow data.
The Xiaozhuang Coal Mine area is predominantly covered by quaternary loess and Neogene laterite. The Lower Cretaceous Luohu Formation is exposed along the Jinghe River and in larger valleys such as the Hongya River, while the Huachi Formation is exposed within the Hongya River valley. Based on borehole data and geological mapping (Figure 5), the stratigraphic sequence from oldest to youngest is as follows:
Middle Jurassic Yan’an Formation (J2y): The aquifer system is predominantly composed of medium- to coarse-grained sandstones and sandy conglomerates, classified as an extremely low-productivity aquifer unit. The groundwater exhibits a Cl·HCO3-Na hydrochemical facies with notably high salinity (total dissolved solids = 8267 mg/L), near-neutral pH (7.76), and elevated temperature (24 °C).
Zhiluo Formation (J2z): The lithology comprises light grayish-green, medium- to coarse-grained feldspathic quartz sandstones interbedded with grayish-green mudstones and sandy mudstones. These units constitute an aquifer of very low productivity, exhibiting a SO4-Na hydrochemical facies with an elevated TDS content of 2045 mg/L.
Anding Formation (J2a): The lithology consists of purplish-red and grayish-brown mudstones interbedded with sandy mudstones and light bluish-gray sandstones. The basal unit comprises 1–3 m thick light grayish-purple sandy conglomerates, which are classified as a relative aquitard.
Lower Cretaceous Yijun Formation (K1y): The lithology consists of purplish variegated massive conglomerates, with quartz and chert constituting the predominant gravel components. These formations represent an aquifer of heterogeneous low productivity, exhibiting hydrochemical facies of Cl·SO4-Na and SO4-Na types. The groundwater chemistry is characterized by a total dissolved solids (TDS) content of 5627 mg/L, a pH of 7.76, and temperature of 19 °C.
Luohe Formation (K1l): The formation is ubiquitously distributed across the study area and comprises variably grained sandstones and sandy conglomerates, with medium- to coarse-grained sandstones constituting the principal aquifer horizons. These units are classified as lowly to moderately productive aquifers, exhibiting a SO4·Cl-Na hydrochemical facies. The groundwater displays a TDS content of 2390–5579 mg/L and a stable temperature range of 17.5–18 °C.
Huanhe Formation (K1h): The lithology is predominantly composed of purplish-red, grayish-purple, and grayish-green mudstones intercalated with thin layers of sandy mudstones and silt- to fine-grained sandstones. The sandstone interbeds may form localized aquifer segments in fracture-developed zones, but exhibit extremely low productivity and are thus classified as a relative aquitard.
Neogene (N2): The upper portion consists of light brownish-red to brownish-red clays and sandy clays, while the lower section is composed of brownish-red clays. This stratigraphic unit forms a stable aquitard between the unconsolidated sediments and bedrock aquifers in the mine field.
Quaternary Lower Pleistocene (Qp1): this stratum is predominantly composed of semi-consolidated, light brown to grayish-brown medium-coarse clastic deposits, with hydrochemical facies of HCO3-Na·Mg. The groundwater exhibits a total dissolved solids (TDS) content of 0.3 g/L and a temperature ranging from 12 to 18 °C.
Upper Pleistocene (Qp2): The aquifer system is primarily composed of loess, sandy loess, and paleosol, forming a pore-fissure aquifer. The hydrochemical facies are classified as HCO3-Na·Ca·Mg and HCO3-Ca·Na·Mg, with a TDS content of 0.300–0.348 g/L and water temperatures ranging from 14 to 15 °C.
Holocene (Qh): The upper portion of this stratum primarily consists of sandy clay and silt, while the lower section is composed of medium- to coarse-grained sand and gravel-pebble layers, constituting a relatively high-yield aquifer. The hydrochemical facies is classified as HCO3-Na·Ca·Mg or HCO3·SO4-Na, TDS 0.96–1.27 g/L, with a water temperature of 10–13 °C.
Pump tests were conducted through multiple hydrogeological boreholes within the coal mine area, obtaining permeability coefficients and water table elevations for each aquifer at different locations, as detailed in the table below (Table 1).
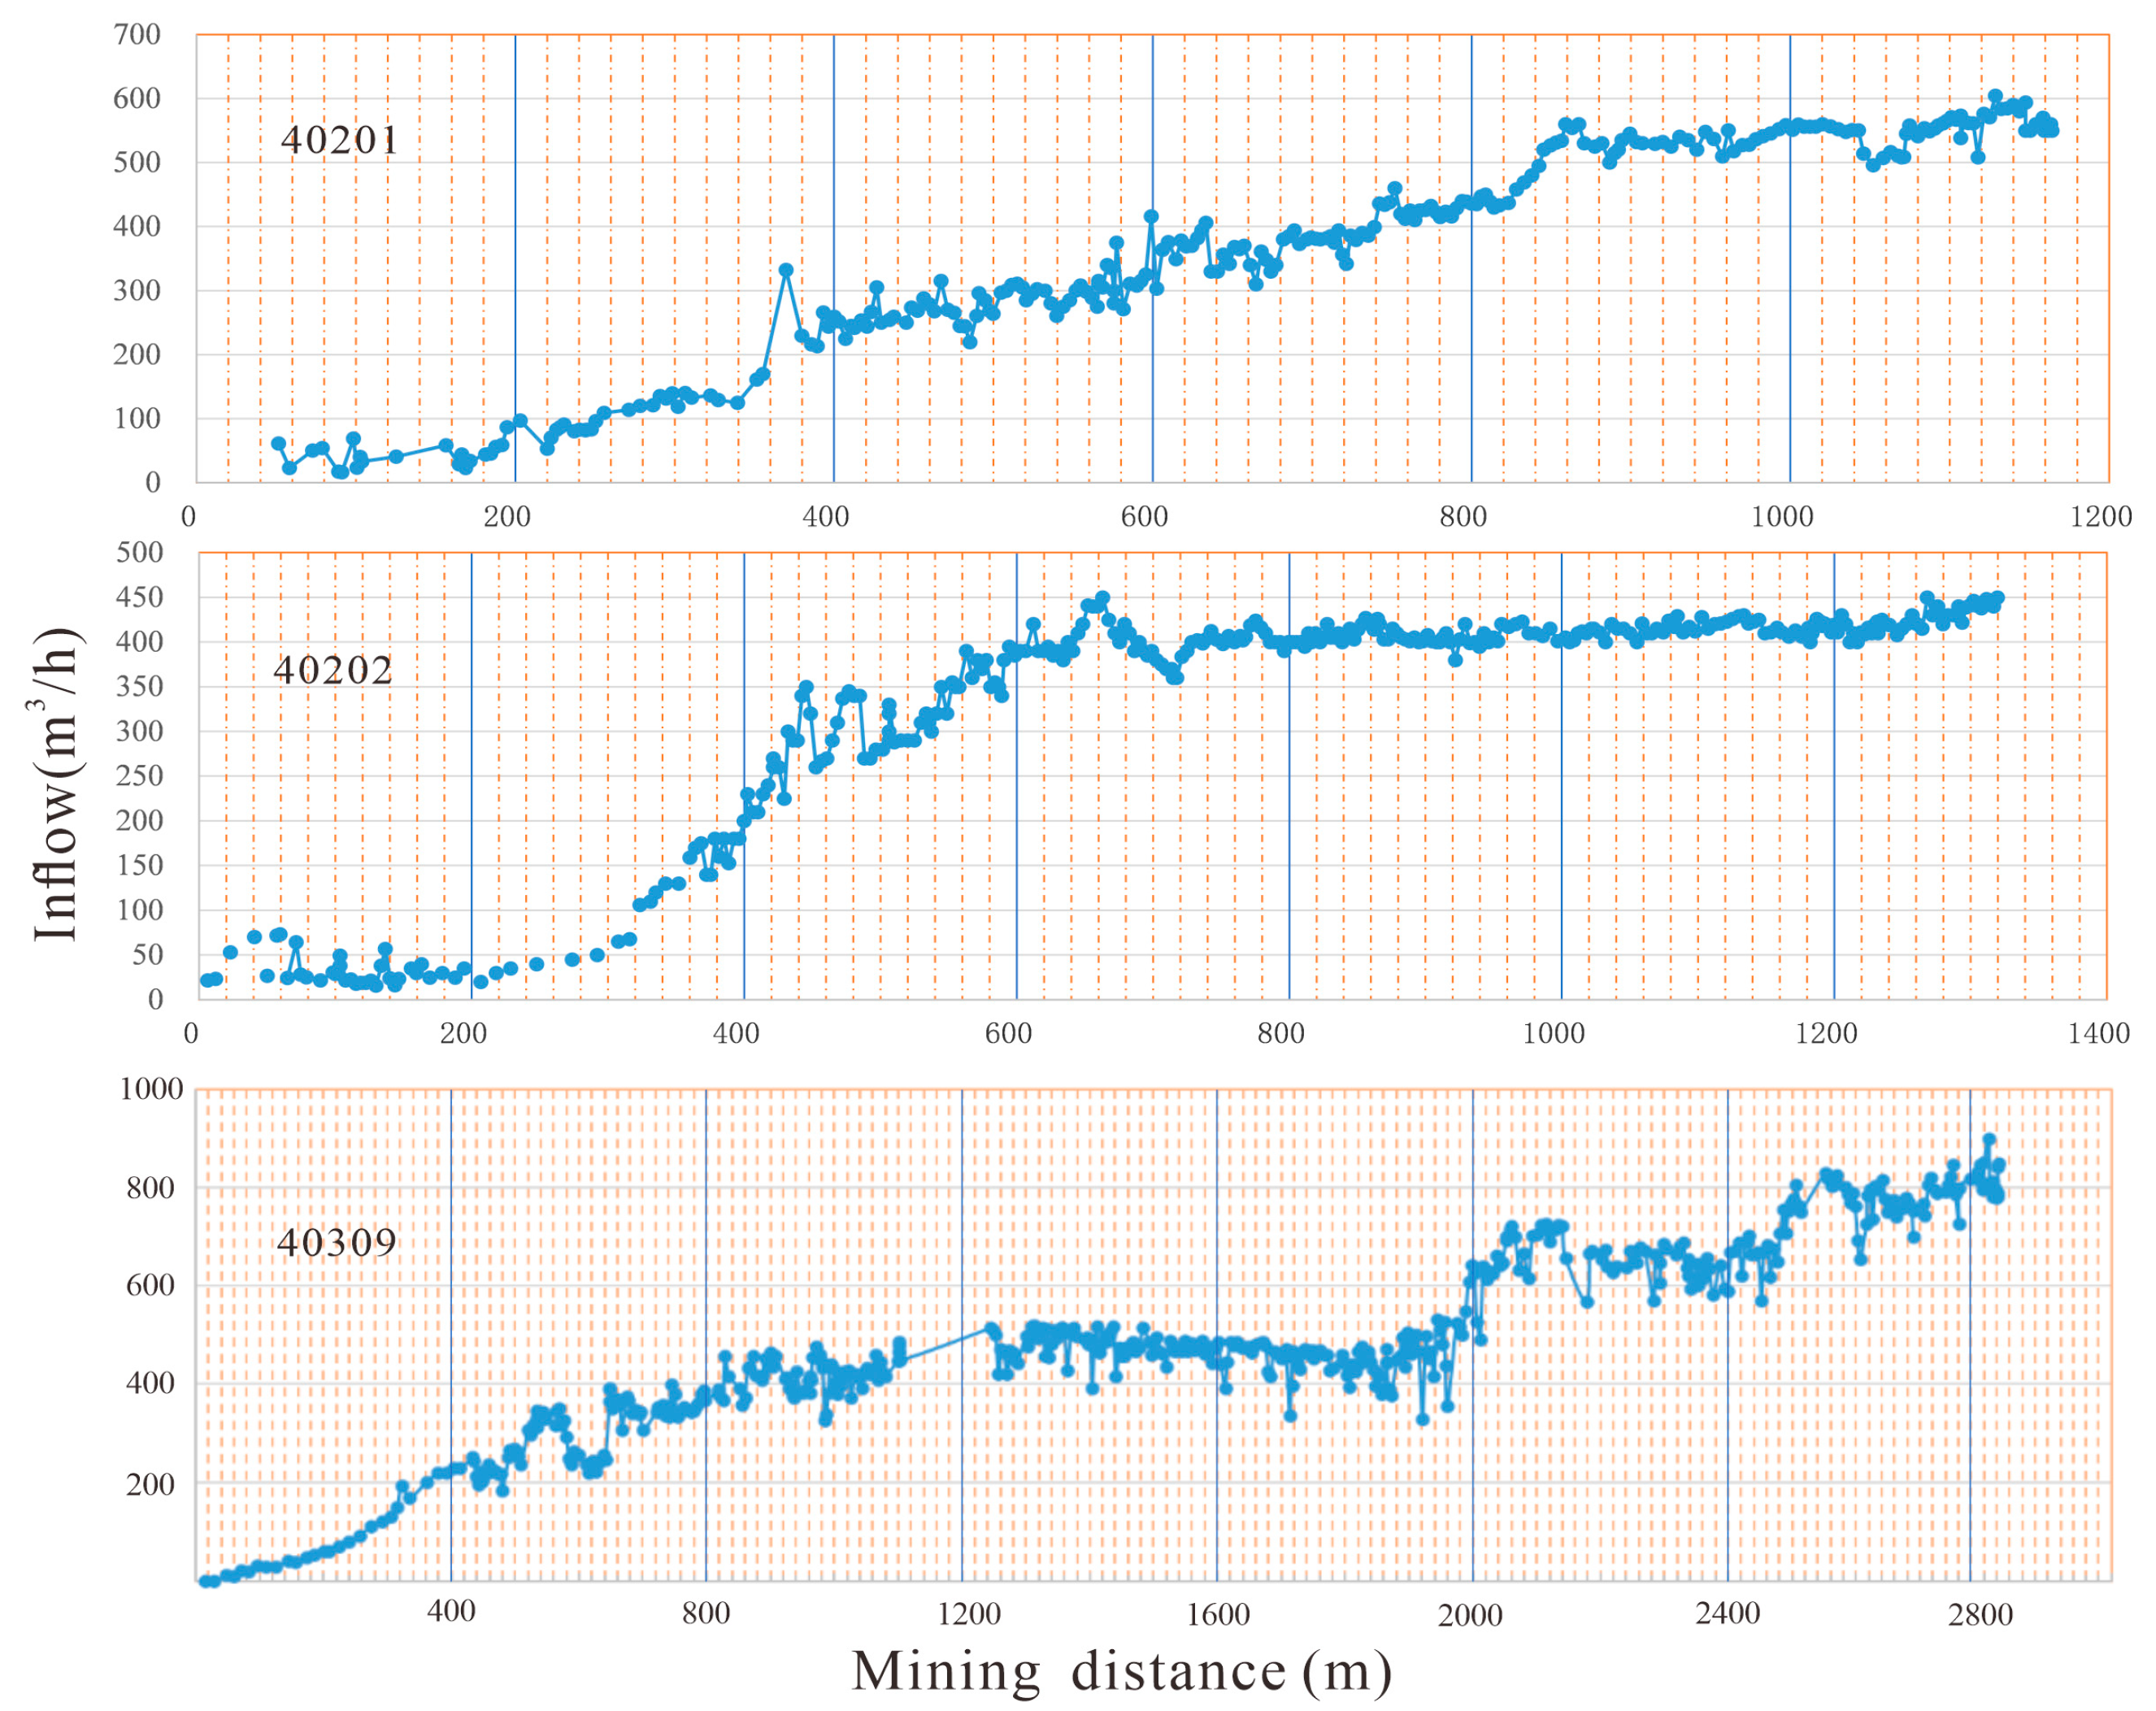
Key attributes and measured water inflow data for these working faces are summarized in Table 2 and Figure 6.

2.2. Methods

Three methods—hydrogeological analogy, dynamic water inflow prediction, and numerical simulation—were applied to back-calculate the water inflow at the Xiaozhuang Mine’s working faces. Their applicability under different conditions was compared.
(1) Hydrogeological Analogy Method
This method predicts water inflow for new working faces using data from existing faces with similar geological/hydrogeological conditions and mining methods [18,19,20]. The premise is that the new and existing faces share comparable conditions, with the latter having long-term water inflow records to establish reliable mathematical relationships between inflow and influencing factors [21].
This study adopts the water-rich coefficient analogy method. The water-rich coefficient is defined as the ratio between working face water inflow and concurrent coal production, expressed as
K = Q P
where K is the water-rich coefficient; Q represents the working face water inflow (m3/h); and P denotes the coal production at the working face (t/h).
Here, the coal production (P) can be expressed as the product of the working face’s mining advance distance (l), mining thickness (M), and mining width (w):
P = M × l × w
Thus, the water-rich coefficient (K) can be rewritten as
K = Q l M w
Since K, M, and w remain relatively constant for a given working face, the water inflow (Q) is directly proportional to the mining advance distance (l):
Q l
(2) Dynamic Prediction Model for Roof Water Inflow
The water inflow from a coal seam roof can be classified into two types based on its recharge mechanisms: vertical gravitational recharge and lateral runoff recharge [22].
Vertical Gravitational Recharge
This refers to the rapid recharge process in which water from the aquifer flows into the goaf under gravity as the roof periodically collapses. The recharge process can be characterized by a single-exponential decay model, where a discrete model is used to approximate the dynamic continuous system:
Q v ( t ) = Q v 0 e λ v a t / b + Q v s
where
Qv(t) = vertical water release from the aquifer at mining time t (m3/h);
λv = decay coefficient for vertical water release;
at = strike length of the working face at time t;
b = dip width of the working face (m);
Qvs = dynamic equilibrium value of vertical water release (m3/h).
Lateral Runoff Recharge
The variation of lateral runoff recharge with mining distance can be described by a first-order exponential recovery system:
Q l ( t ) = Q l 0 ( 1 e λ l a t / b ) + Q l s
where
Ql(t) = lateral runoff recharge at mining time t (m3/h); λl = decay coefficient for lateral recharge; Qls = dynamic equilibrium value of lateral recharge (m3/h).
Thus, the total water inflow can be expressed as
Q t = Q v t + Q l t
Dynamic Evolution of Water-Conducting Fracture Zone
After mining, the overlying strata are damaged, forming a water-conducting fracture zone, whose development pattern is the primary factor influencing lateral dynamic recharge. The affected area expands with increasing mining distance, and the influence radius extends outward until reaching an impermeable boundary. The assumption of an infinitely extending aquifer gradually becomes invalid, and the lateral runoff recharge decreases until it stabilizes.
To account for this, a second-order dynamic system model (initially increasing, then stabilizing) is adopted for solving [23]
Q ( t ) = Q v 0 e λ l a t / b + Q l 0 ( 1 e λ l a t / b ) + Q s
where
Q(t) = total water inflow at mining time t (m3/h); λv, λl = comprehensive decay coefficients for vertical and lateral recharge, respectively; Qs = ultimate stable water inflow (m3/h).
(3) Numerical Simulation
The numerical simulation method for water inflow prediction is based on the principles of groundwater dynamics, where actual hydrogeological conditions (e.g., aquifer structure, boundary conditions) are abstracted into mathematical equations. These equations are solved using discretization techniques (e.g., finite difference method, finite element method) to simulate groundwater flow and predict mine water inflow [24,25].
Model Conceptualization
Due to the presence of the tertiary laterite aquitard and the relatively impermeable Lower Cretaceous Huachi Formation, the Holocene aquifer and Middle Pleistocene aquifer do not provide effective recharge to the main water-filled aquifer—the Cretaceous Luohe Formation aquifer (the comprehensive hydrogeological histogram is shown in Figure 5).
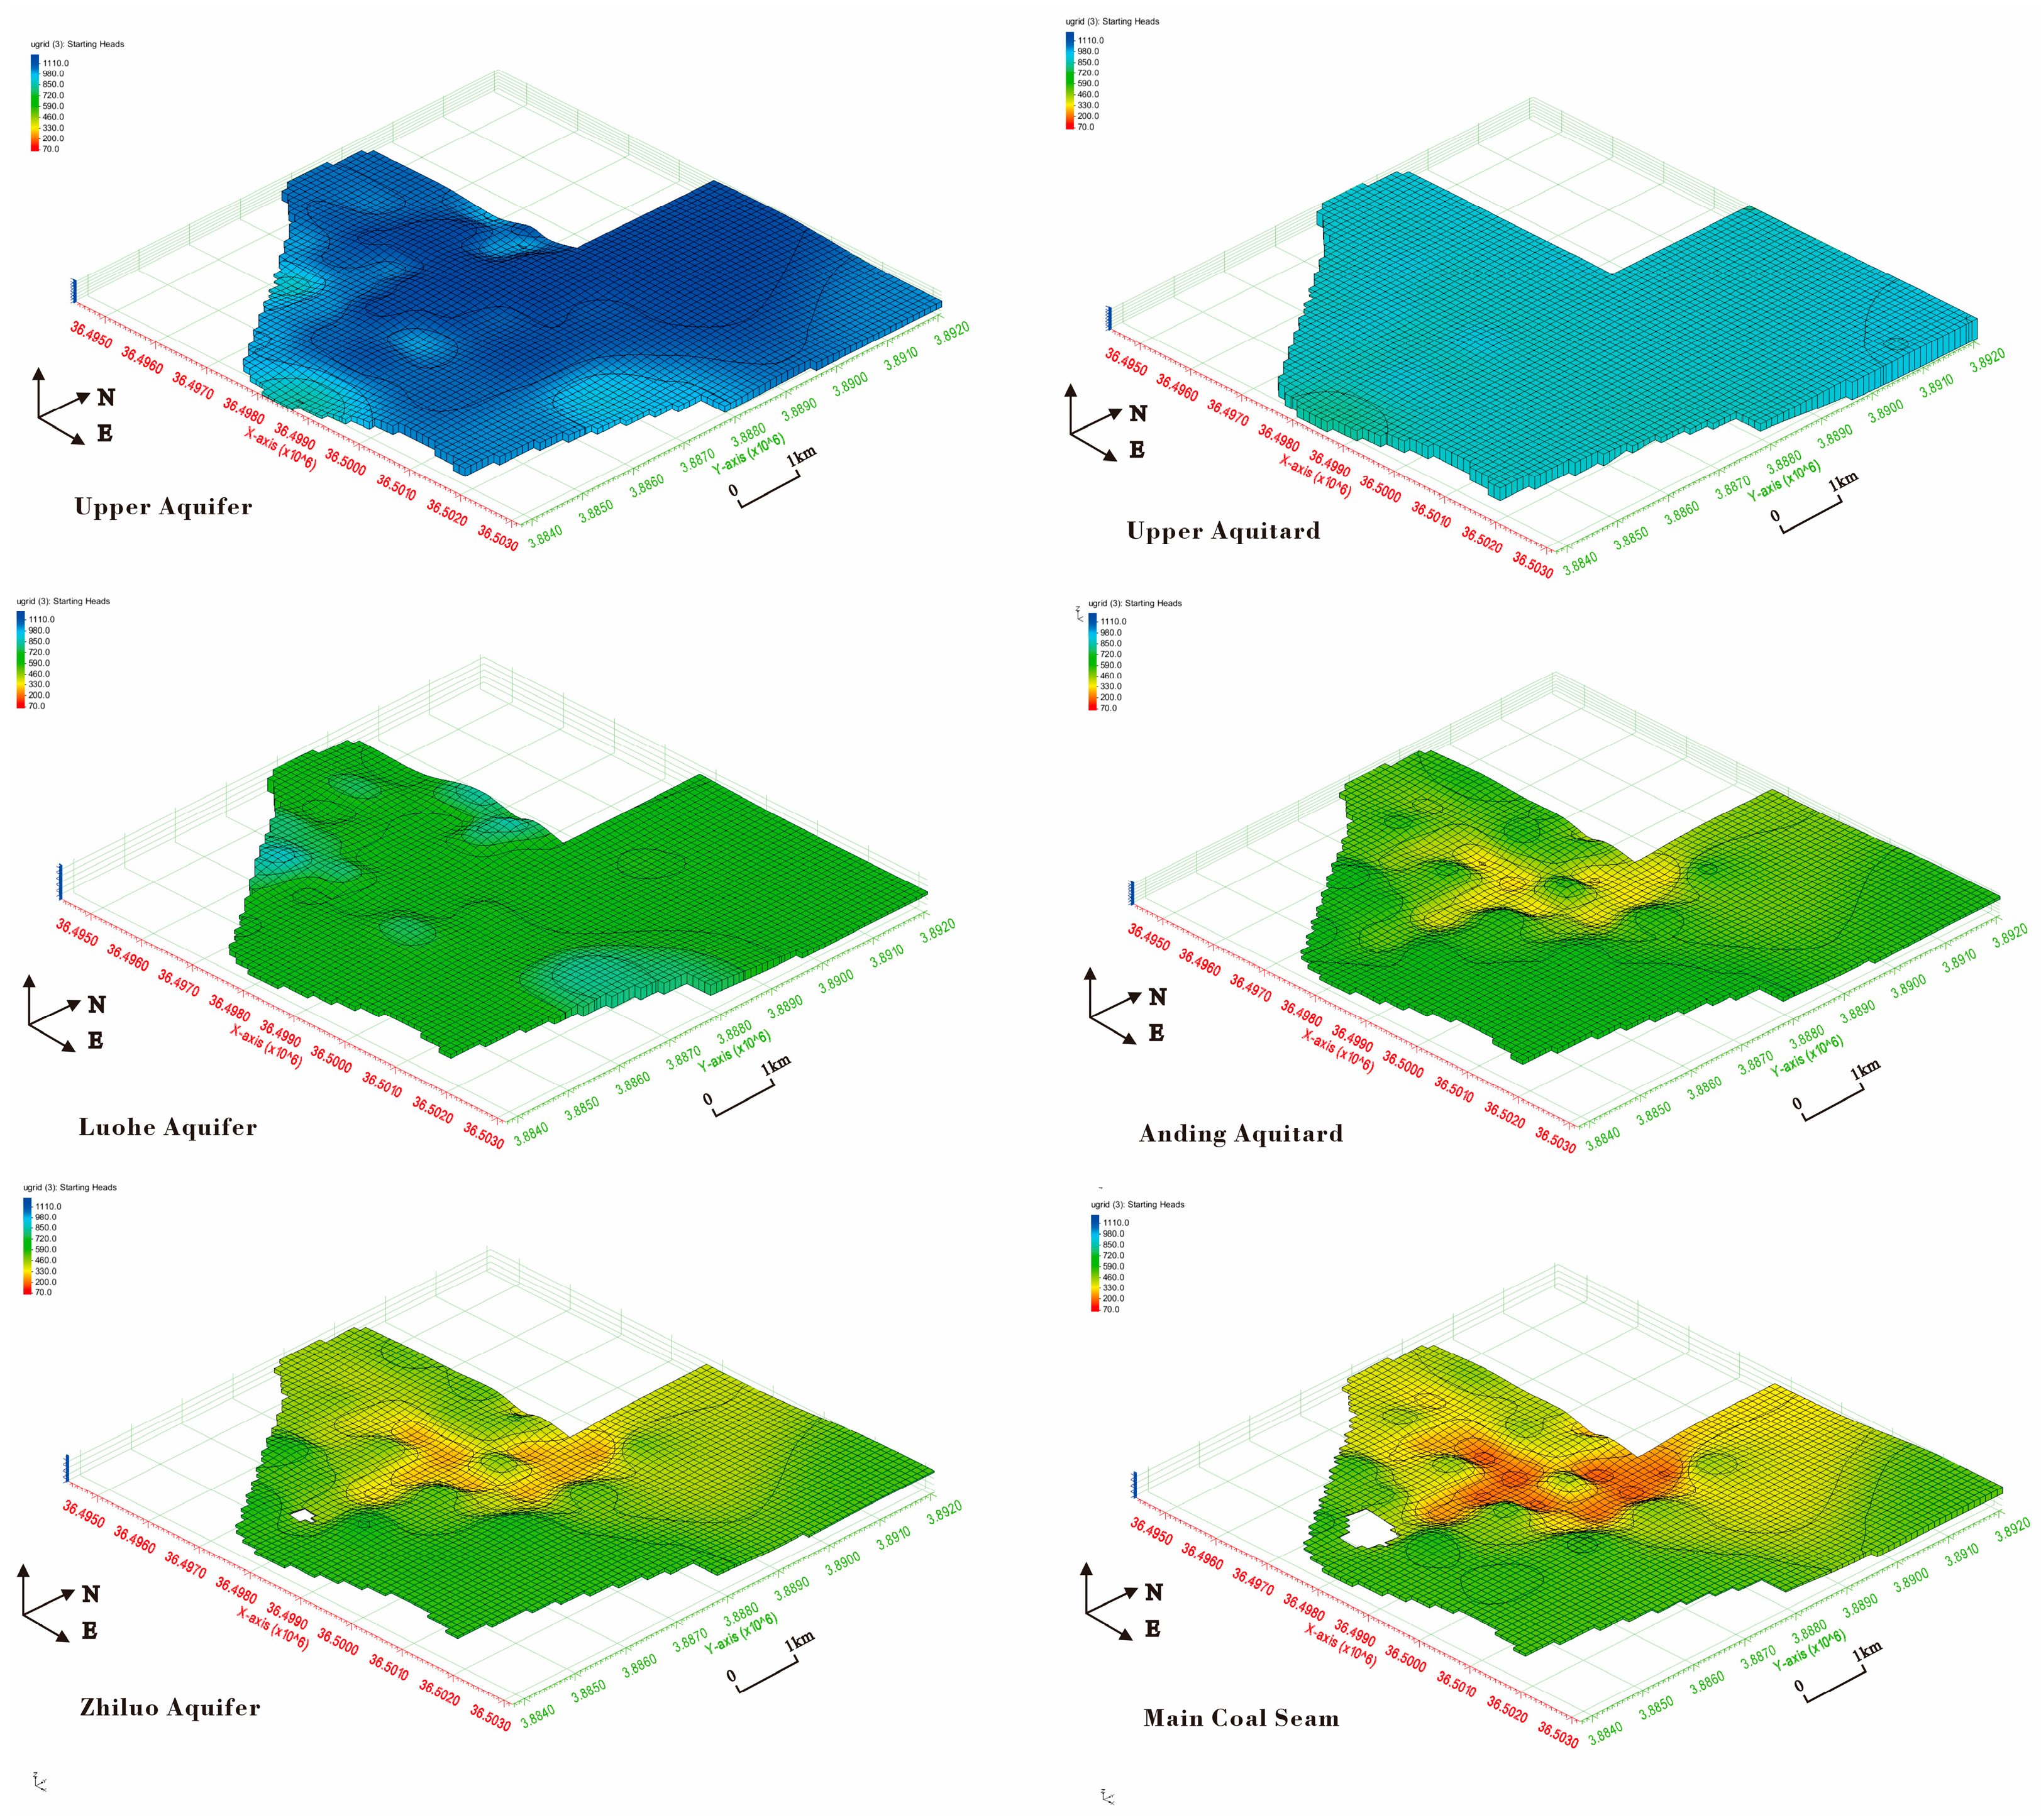
Therefore, in the model, these overlying aquifers are generalized as a single unit termed the “Upper Aquifer.” The Luohe Formation aquifer is assumed to receive no downward recharge from the Upper Aquifer (the model scheme is shown in Table 3). Instead, the Luohe Formation aquifer is primarily recharged through lateral runoff, with an overall groundwater flow direction from northeast to southwest.
The three-dimensional formation model established based on the drilling data and model scheme is shown in Figure 7.
This study employs the finite difference method for numerical simulation, establishing a three-dimensional anisotropic transient seepage flow model based on the observed water level data. The mathematical formulation is presented below:
x K h h x + y K h h y + z K v h z W = S s h t
h t = 0 = h 0 x , y , z
h Γ 1 = h 0 x , y , z x , y , z Γ 1
K h n Γ 2 = q x , y , z x , y , z Γ 2
K h h 0 m Γ 3 = q x , y , z x , y , z Γ 3
W represents the water inflow/outflow rate at sinks or sources; Ss denotes the specific storage (for confined aquifers) or specific yield (for unconfined aquifers); Kh and Kv indicate the horizontal and vertical hydraulic conductivity tensors, respectively. Equation (10) defines the initial conditions; Equation (11) specifies the Dirichlet boundary conditions (first-type); Equation (12) describes the Neumann boundary conditions (second-type); Equation (13) characterizes the Cauchy boundary conditions (third-type). These partial differential equations constitute the mathematical framework for each aquifer unit. When coupled with the initial conditions and first/second-type boundary conditions, they form a well-posed boundary value problem.
The initial head distribution is an indispensable condition in groundwater transient flow models, typically obtained by interpolating the observed well water level data. However, due to the scarcity of water level data in the study area, which are mostly concentrated on the left side of the mine field, the initial flow field derived from interpolation cannot accurately reflect the overall water level characteristics of the mine field. To identify the boundary conditions of the study area, steady-state flow simulation is first conducted. By adjusting the hydraulic conductivity, the position and head of general head boundaries, as well as their transmissivity, if the computed flow field from the model generally aligns with the variation trends observed in the actual monitored flow field, it indicates that the model’s boundary conditions and hydraulic conductivity zoning are consistent with real-world conditions.
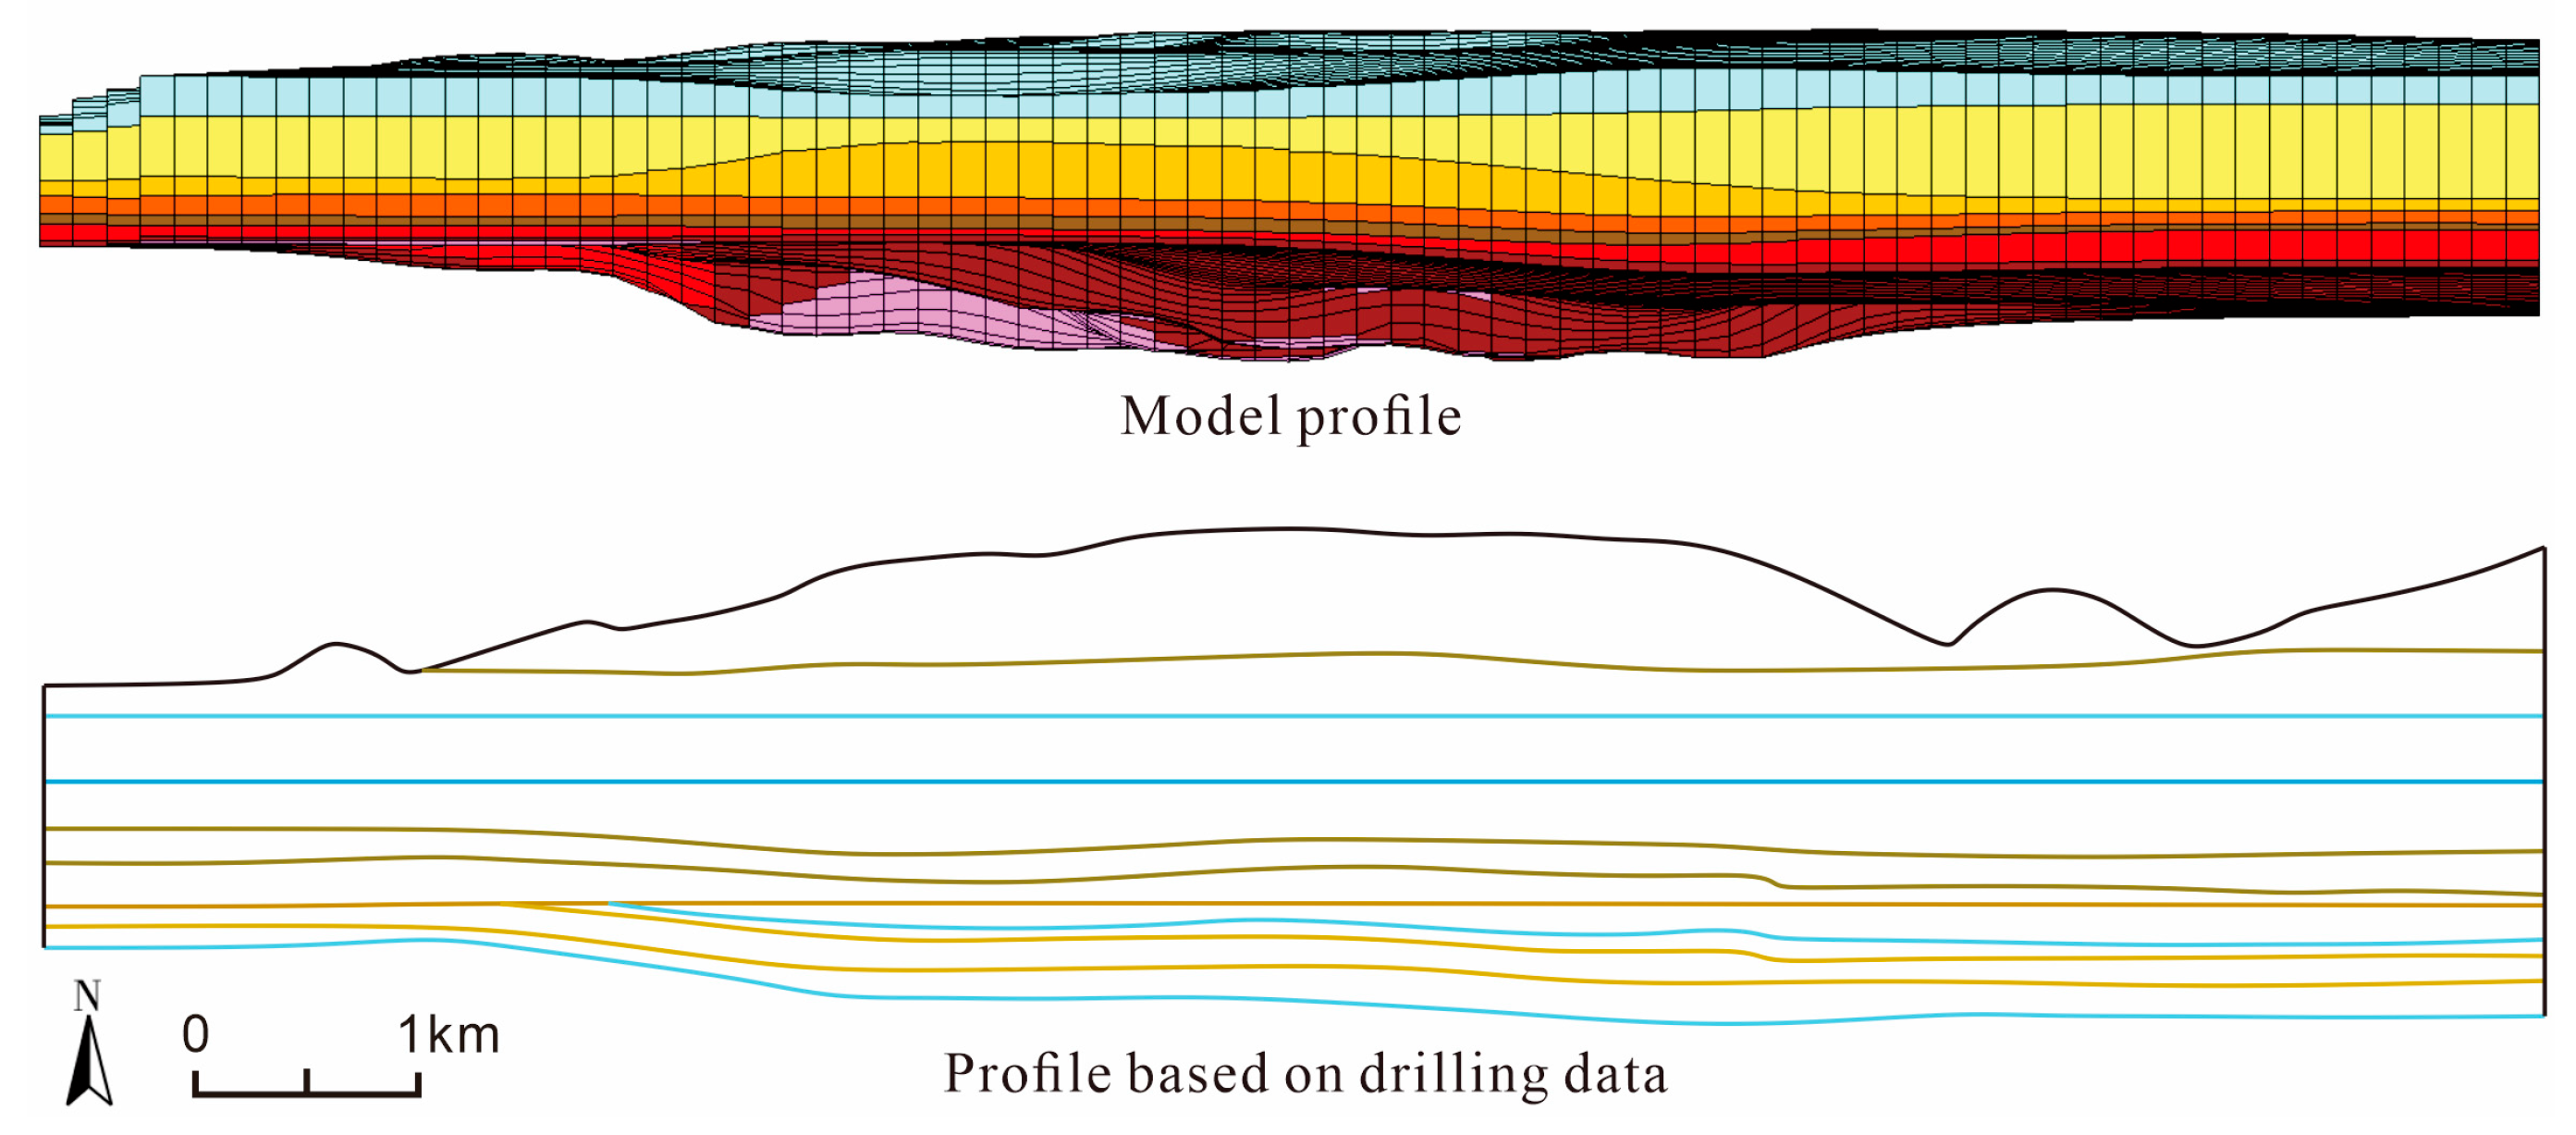
A comparison between the model cross-section and the borehole data profile A-A’ (as shown in Figure 8) indicates that the model exhibits high fitting accuracy in most areas of the coal mine. However, due to limited borehole data in the northeastern region, the model’s fitting performance is relatively poorer in this area. Since the focus of this water inflow simulation is on the western section of the coal mine, the minor deviations in the northeastern region are considered acceptable for the simulation results.

3. Results

(1) 
Hydrogeological Analogy Method
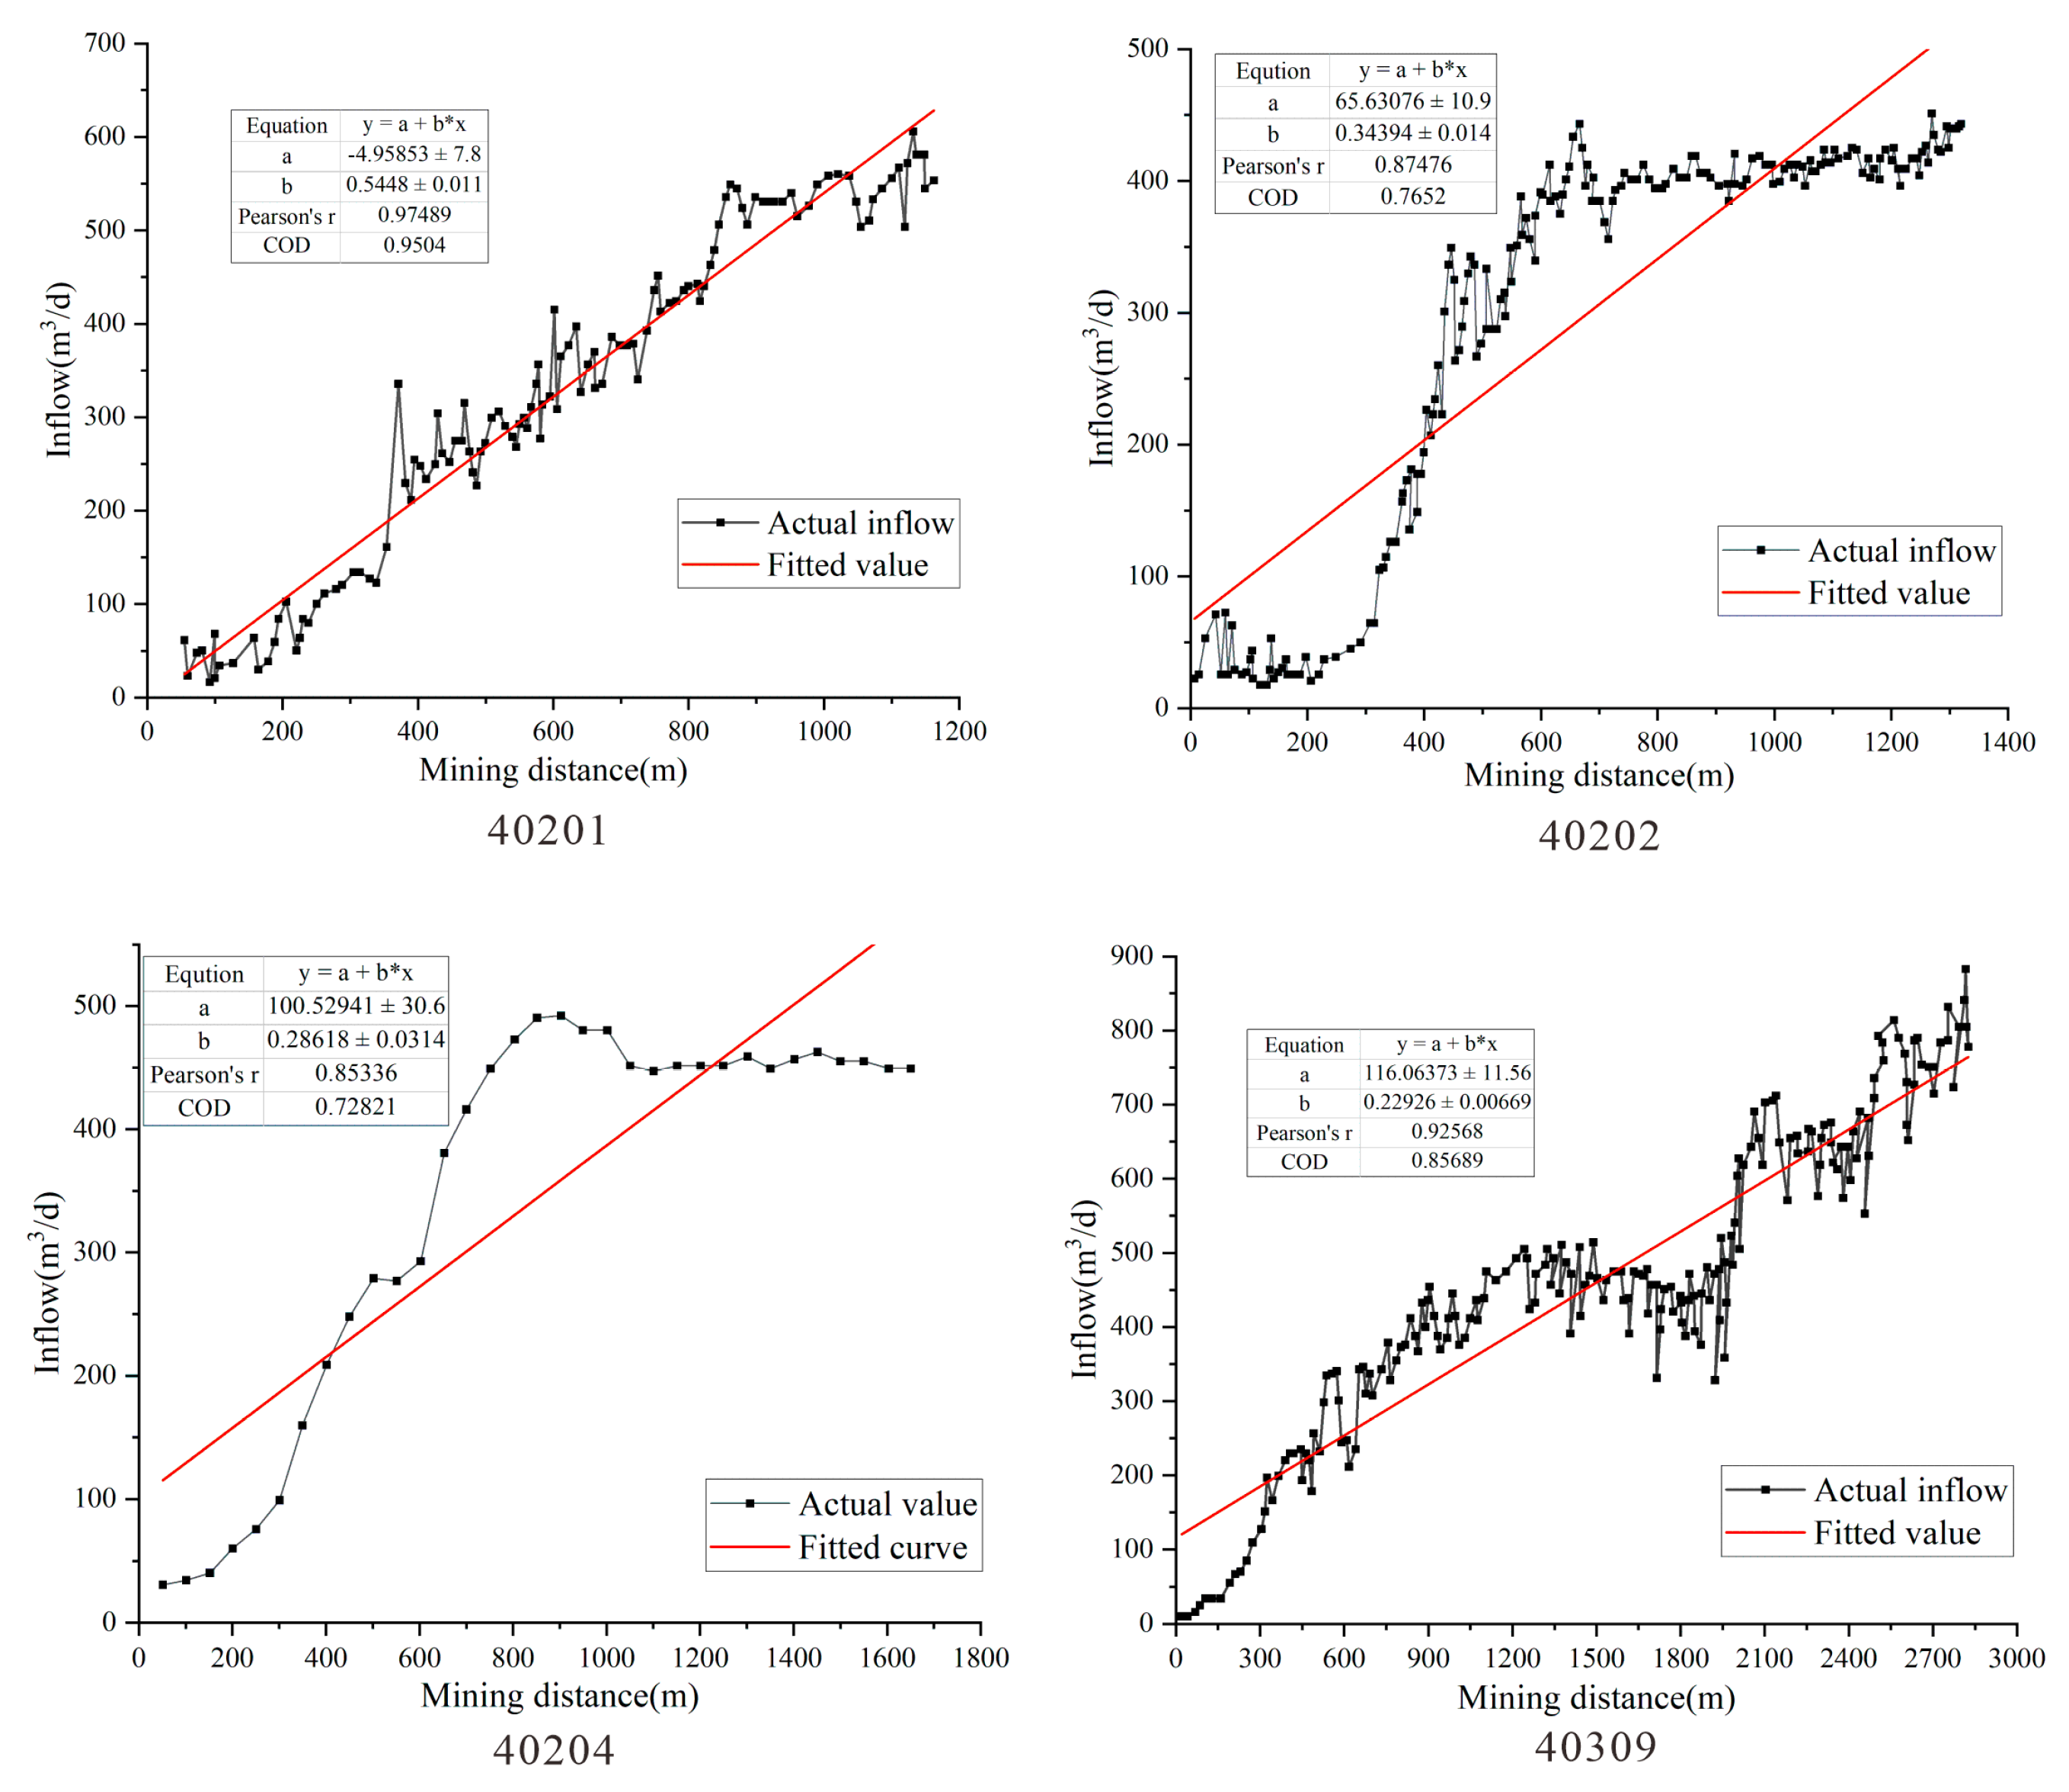
The fitting results between the predicted values from the hydrogeological analogy method and the measured water inflow data are illustrated in the accompanying figure (as shown in Figure 9).
Workface 40201 (First Mining Face in Panel 2 of No. 4 Coal Seam, Xiaozhuang Mine):
The predicted results exhibit an excellent agreement with the measured water inflow data, achieving a high coefficient of determination (R2 = 0.95).
Workface 40202: The correlation between predicted and measured values significantly decreases, with R2 dropping to 0.76.
Workface 40204: An even poorer fit is observed, with R2 further declining to 0.72.
Workface 40309 (Located in Panel 3): The predictive performance improves slightly, yielding an R2 of 0.85, which is still lower than that of the first mining face.
(2) 
Dynamic Water Inflow Prediction Method
The dynamic prediction method was applied to simulate the water inflow variation curves during the mining advance of each working face in the Xiaozhuang Coal Mine (Figure 10). The analysis demonstrates a strong correlation between predicted and measured water inflow data, with the coefficient of determination (R2) ranging from 0.88 to 0.96.
(3) 
Numerical Simulation Method
The simulated mining cycles for each working face were determined according to the mine development plan. During these cycles, the vertical permeability coefficient of the overlying strata above the working face was increased, and a drainage trench module was incorporated into the model at the corresponding locations. This module assumes that water flowing into the designated area from any direction will be extracted. Additionally, a water balance module was integrated to monitor inflow and outflow fluxes.
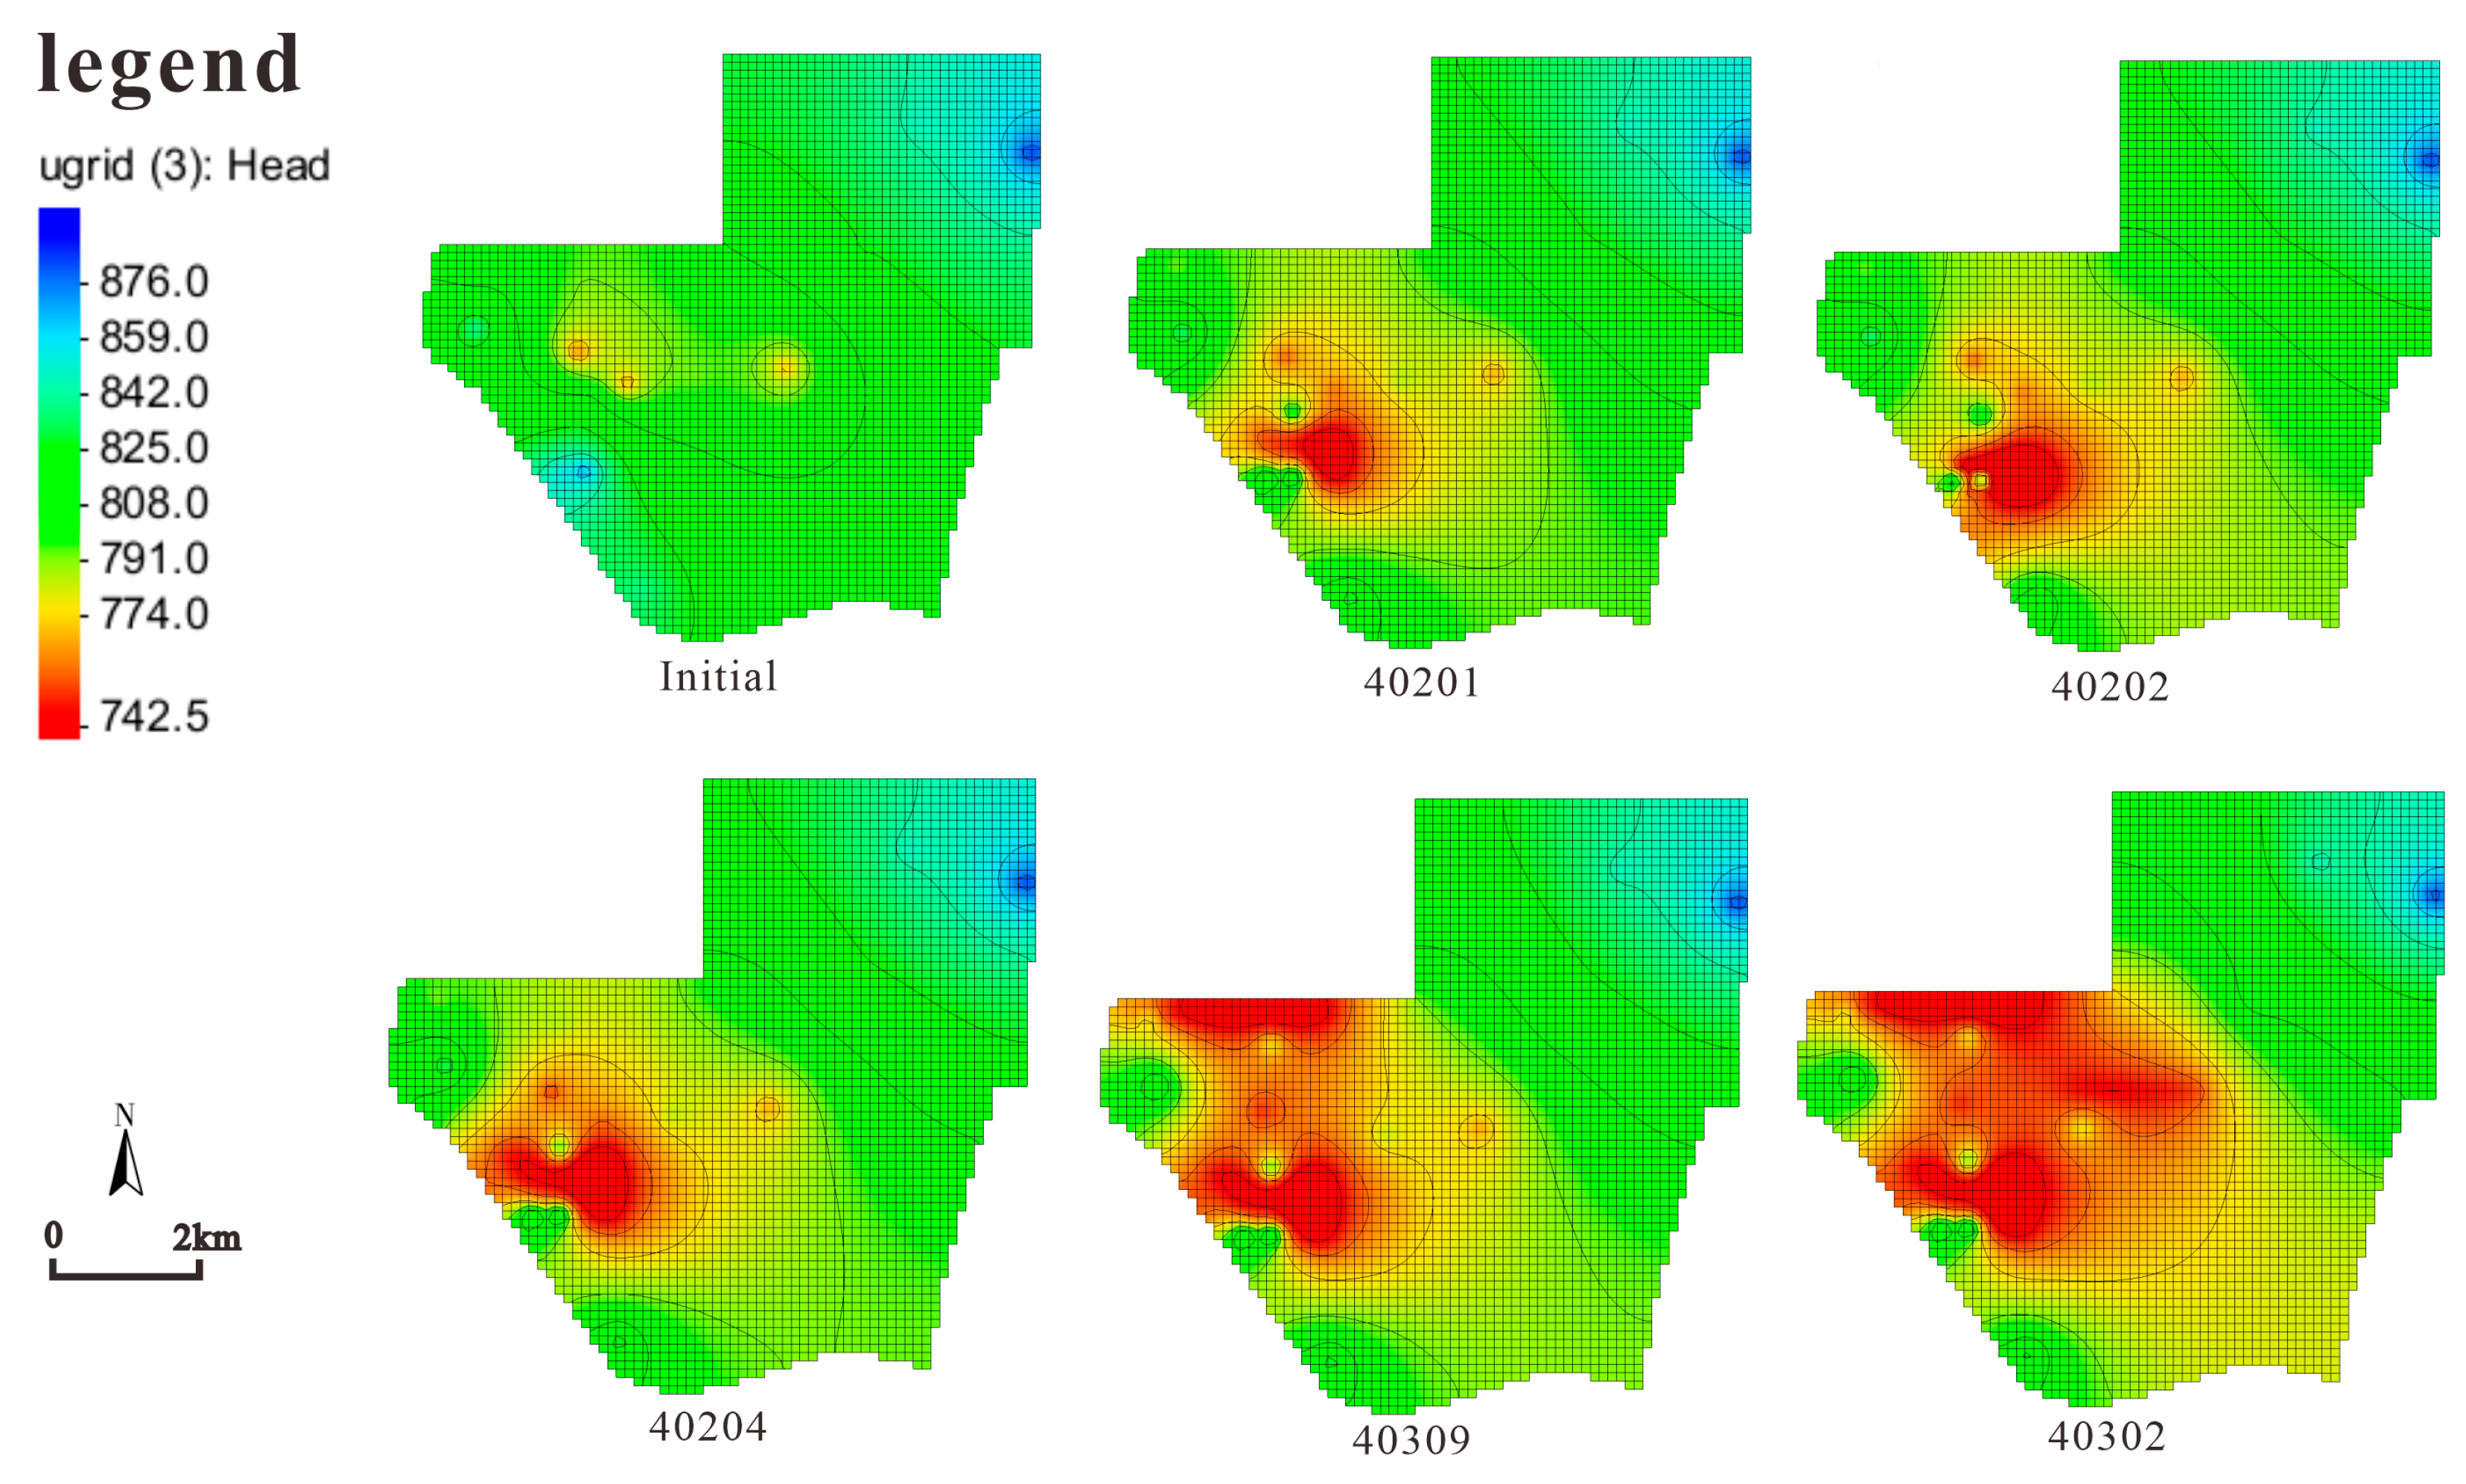
The simulation results (as shown in Figure 11) demonstrate significant changes in the seepage field of the Luohe Formation aquifer following the mining of working faces 40202, 40204, 40302, and 40309, as illustrated in the figure below. Notably, the water levels in both the Zhiluo-Yan’an Formation aquifer and the Luohe Formation aquifer exhibited a marked decline at the mined-out sections.
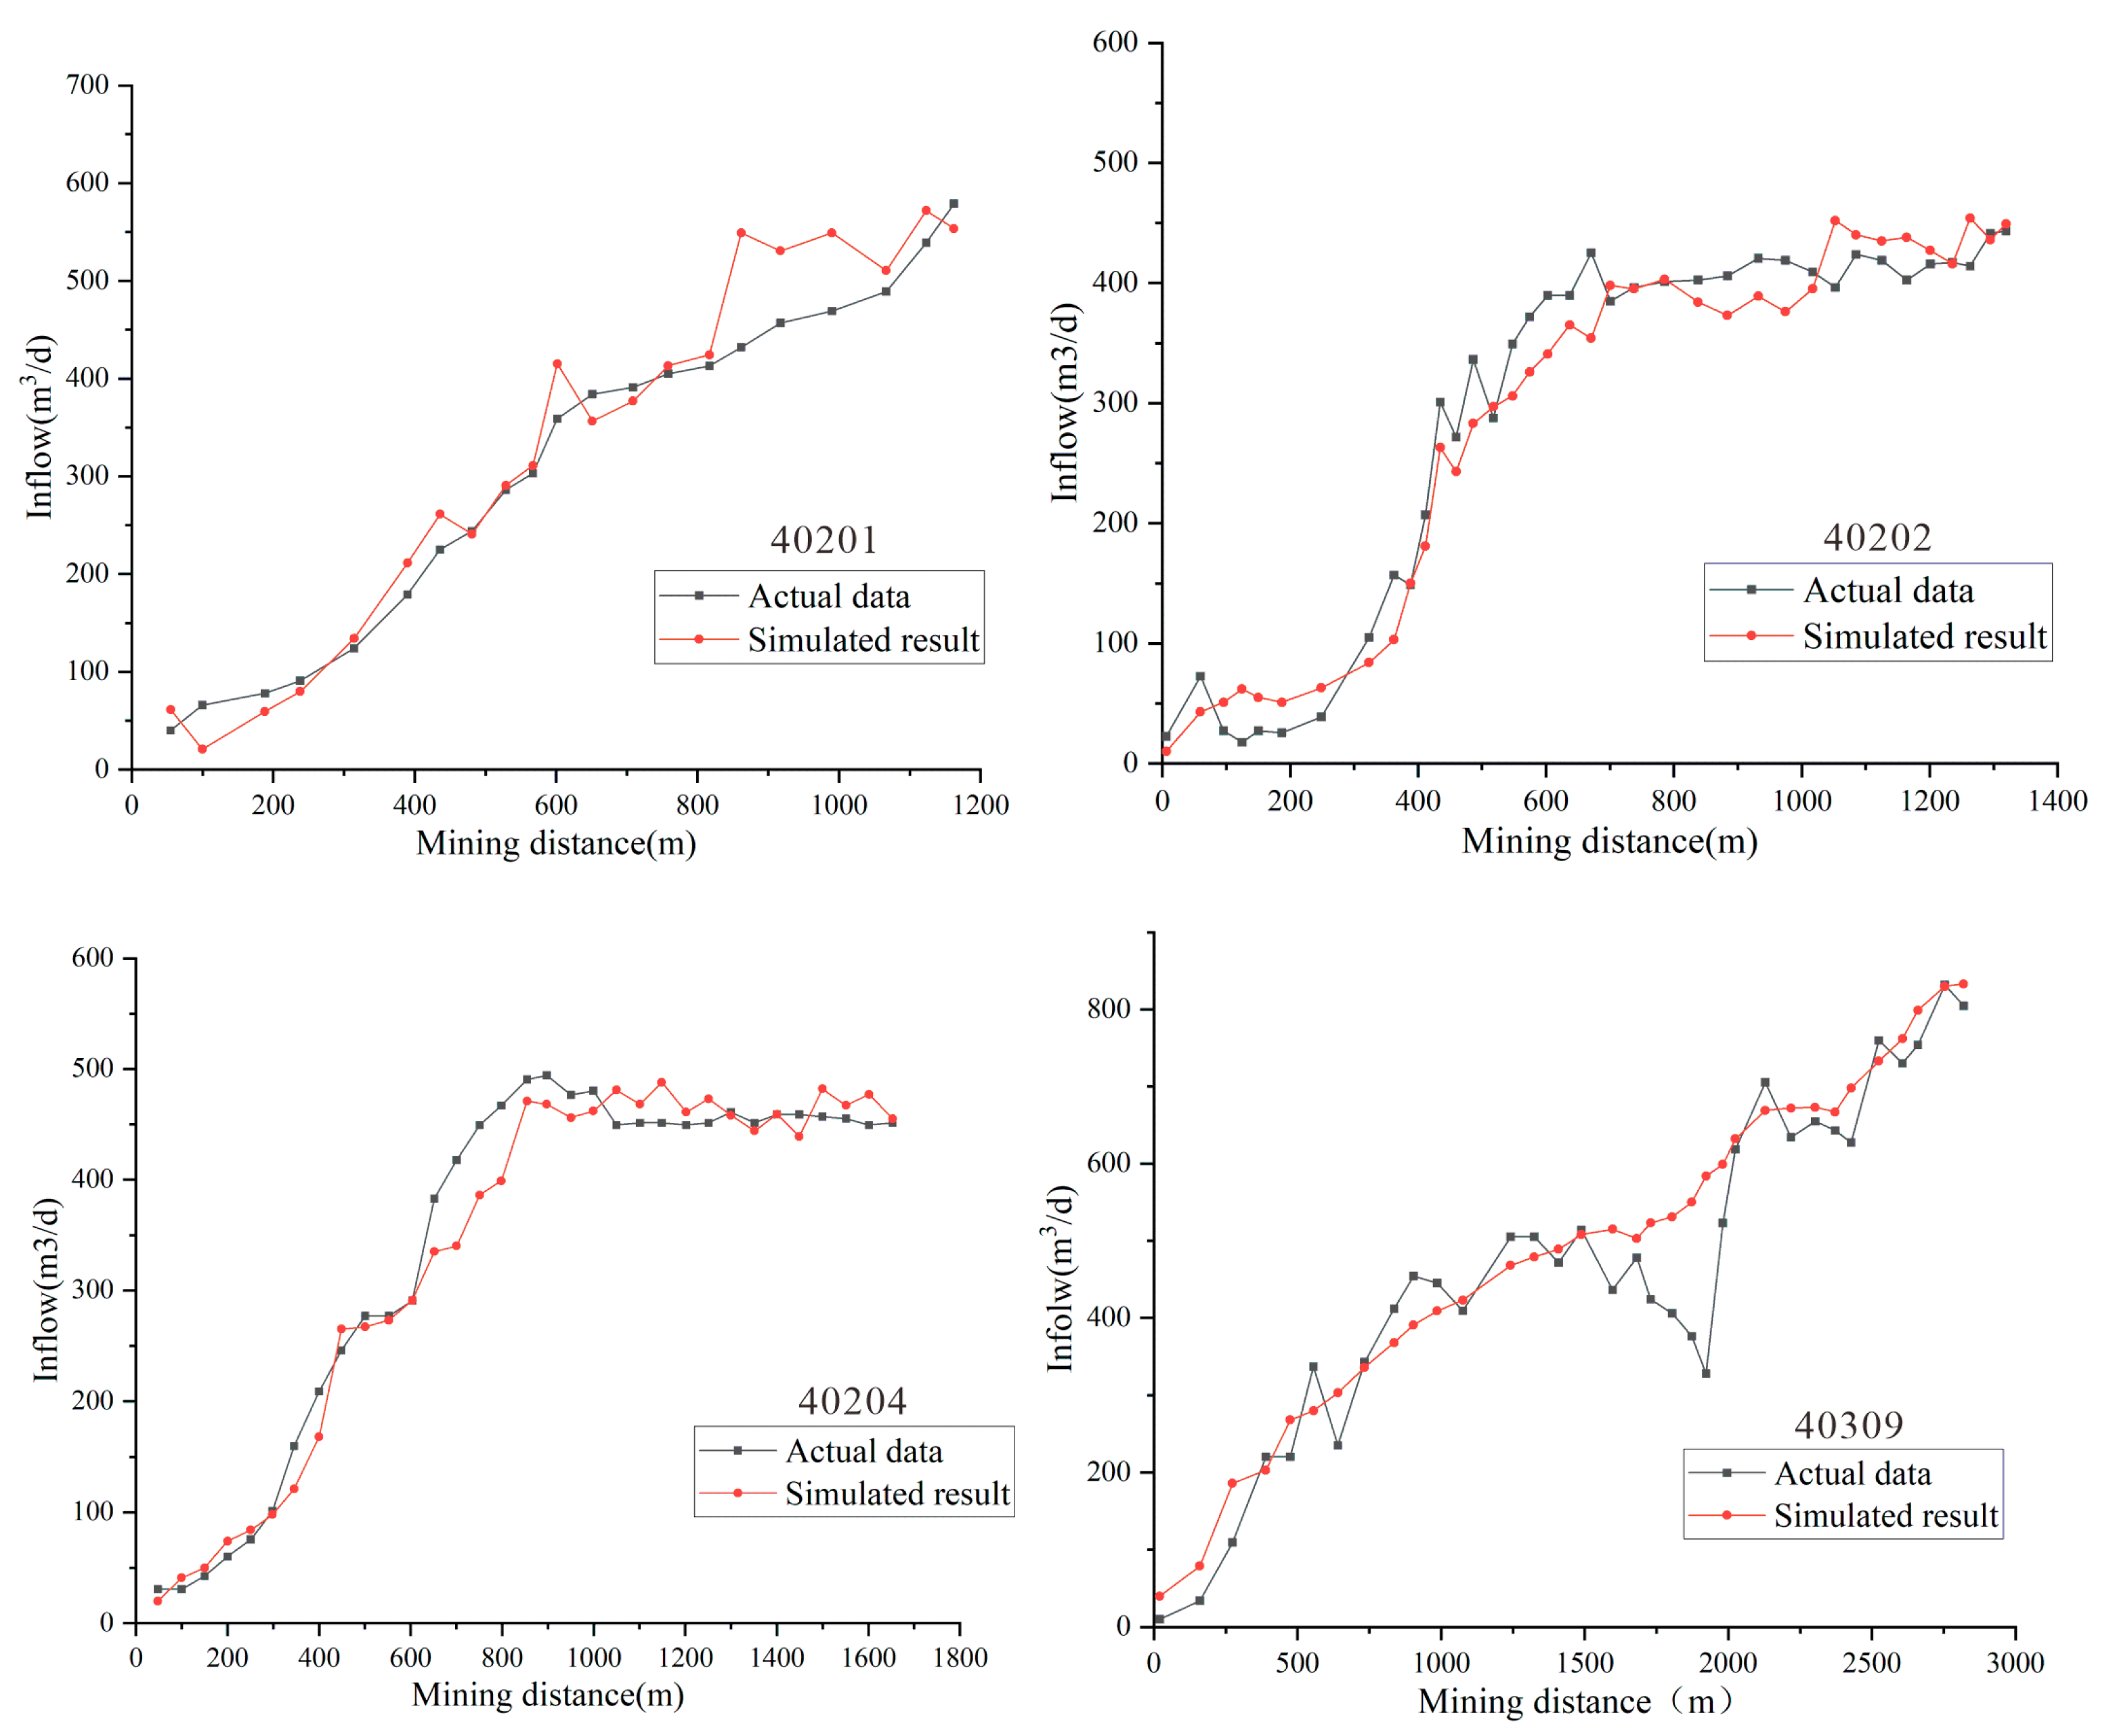
Extract the flow rates output from the water balance module for each working face during mining, and plot the variation curves of the numerical simulation results and measured data of the water inflow against the mining distance, as shown in the Figure 12.
A correlation analysis (as shown in Figure 13) was conducted between the simulated and measured water inflow data of the working face. The results indicate a strong correlation coefficient ranging from 0.89 to 0.96, demonstrating the high reliability of the numerical simulation method in predicting water inflow.

4. Discussion

4.1. Performance Discrepancy Between Methods

Hydrogeological Analogy Method: Worked well for the first mining face 40201 (R2 = 0.95) but showed poor reliability for adjacent faces 40202 (R2 = 0.76) and 40204 (R2 = 0.72).
Dynamic Prediction Method: Achieved high accuracy (R2 = 0.88–0.96) even for non-first mining faces (40202, 40204).
Numerical Simulation: Demonstrated consistent reliability (R2 = 0.89–0.96) across all working faces.

4.2. Key Reasons for Performance Differences

(1) Geological Consistency in Panel 2
No major faults/folds were detected in Panel 2, meaning that the hydrogeological conditions were similar across all working faces (40201, 40202, 40204).
Since geology was not the primary influencing factor, the poor performance of the analogy method in non-first mining faces must stem from mining-induced dynamic changes.
(2) Limitations of Hydrogeological Analogy Method
The analogy method assumes static aquifer behavior, making it suitable only for the first mining faces (undisturbed conditions).
It fails to account for dynamic lateral recharge decay (a major contributor in high-intensity water inflow mines) and mining-induced permeability changes (fracture development alters flow paths).
(3) Advantages of Dynamic Prediction
Mechanistic Superiority: Incorporates both vertical and lateral recharge dynamics, crucial for mines with strong runoff-dominated inflow. Accurately models time-dependent aquifer responses (e.g., gradual depletion of lateral flow).
Proven Effectiveness: Outperforms analogy methods in non-first mining faces where traditional assumptions break down.
(4) Robustness of Numerical Simulation
Less constrained by hydrogeological conditions compared to analogy methods.
Reliability depends on proper model conceptualization (e.g., drainage module setup); and accurate parameter calibration (e.g., permeability adjustments post-mining).
Flexibility: Adapts to varying mining stages, making it universally applicable.
The advantages and disadvantages of the total three methods for predicting water inflow are shown in Table 4.

4.3. Implications for Hazard Mitigation Strategies

The reliability of water inflow prediction methods directly influences practical decision making in mine hazard mitigation:
Hydrogeological Analogy: High accuracy in the first mining faces (e.g., 40201, R2 = 0.95) supports proactive drainage design during the initial mining stages (e.g., reducing drainage capacity by 25% compared to conservative estimates). However, its unreliability in non-first faces (40202, R2 = 0.76) necessitates supplementary methods to avoid underestimating peak inflow by 300–500 m3/h during months 6–8 of mining.
Dynamic Prediction: The mechanistic handling of lateral recharge (40204 face, R2 = 0.94) enables dynamic risk zoning. For example, predicting a 420 m3/h lateral inflow peak at 1200 m advance distance allowed for the preemptive reinforcement of support structures 14 days prior to hazard occurrence.
Numerical Simulation: Despite computational demands, its scenario adaptability (R2 = 0.89–0.96) permits long-term hazard mapping and sustainable water-resource management. In the Xiaozhuang Mine, simulated drawdown trends guided the installation of targeted dewatering wells.
The integrated application of these methods—using analogy for initial planning, dynamic models for operational adjustments, and numerical simulations for legacy risk assessment—forms a tiered mitigation framework. This approach aligns with China’s “Prevention-first” coal safety policy, minimizing both sudden inundations and chronic environmental impacts.

5. Conclusions

This study addresses the challenge of unreliable water inflow prediction in regional mine clusters with high-intensity water gushing. By applying three methods—hydrogeological analogy, dynamic water inflow prediction, and numerical simulation—to forecast water inflow in various working faces of the Xiaozhuang Coal Mine, we compared predicted and measured data, yielding the following conclusions:
(1) The hydrogeological analogy method demonstrates excellent performance in predicting water inflow in the first mining face, with a correlation coefficient between predicted and measured data reaching up to 0.95. However, its application in adjacent non-first mining faces yields poorer results, with the analysis showing a correlation coefficient of only 0.72–0.76. Furthermore, the predictive accuracy deteriorates with increasing distance from the first mining face. This issue arises because the hydrogeological analogy method only considers vertical recharge from aquifers to the goaf. In contrast, for regional high-intensity water-inrush mining areas, aquifer runoff recharge typically contributes significantly, exerting a considerable influence on the water inflow of mining faces.
(2) Compared to the hydrogeological analogy method, the dynamic prediction method significantly improves reliability in non-first mining faces, achieving a correlation coefficient between predicted and measured data as high as 0.91–0.96, which improve non-first face reliability by 27–34% (40202 face: R2 = 0.91 vs. 0.76). This enhancement is attributed to the dynamic prediction method’s ability to account not only for vertical recharge from the aquifer to the goaf but also to accurately characterize the gradual stabilization of lateral seepage recharge under boundary effects. Consequently, this method exhibits high reliability in water inflow prediction for regional high-intensity water-inrush mining areas.
(3) Numerical simulation achieves universal applicability (R2 = 0.89–0.96) but requires intensive calibration. The finite element numerical simulation-based water inflow prediction method offers the advantage of handling complex geological conditions, dynamic mining processes, and multi-factor coupling effects. As a result, it is largely unaffected by mining face conditions. However, the reliability of its simulation results is highly dependent on model characterization and parameter adjustment.

Author Contributions

J.D.: Contribution roles: Conceptualization, Software, Writing—original draft; Specific responsibilities: proposed the core concepts and theoretical framework of the research; developed the software tools required for the study; responsible for drafting the initial manuscript and constructing the main content. Special note: As one of the main authors, J.D. was deeply involved in the core research work. S.D.: Contribution roles: Conceptualization, Supervision, Funding acquisition; Specific responsibilities: participated in research conception and direction determination; oversaw research quality and progress throughout, provided key academic guidance; responsible for funding applications and the management of the research project. Special note: As the project leader, S.D. ensured academic rigor and resource support for the research. X.G.: Contribution roles: Validation, Formal analysis, Writing—review and editing; Specific responsibilities: conducted rigorous validation of research methods and results; performed in-depth mathematical/logical formal analysis; participated in manuscript revision, content review, and enhancement of academic standards. B.L.: Contribution roles: Methodology, Data curation; Specific responsibilities: designed the research technical approach and analysis methods; responsible for data collection, cleaning, organization, storage, and quality control processes. All authors have read and agreed to the published version of the manuscript.

Funding

This research was funded by National Natural Science Foundation of China (grant number 42472326); Key Project of the Natural Science Basic Research Program of Shaanxi Province (Grant No. 2023-JC-ZD-27); Science and Technology Innovation Fund Project of CCTEG Xi’an Research Institute (Group) Co., Ltd. (Grant No.2024XAYJS07); Natural Science Basic Research Program of Shaanxi Province (Grant No. 2025JC-JCQN-012).

Data Availability Statement

The original contributions presented in this study are included in the article. Further inquiries can be directed to the corresponding author.

Acknowledgments

We extend our gratitude to the following contributors for their support: Lei Liu for his assistance in investigation and empirical data collection. Xingling Dong for providing essential research resources and project coordination. Xiyu Zhang for his expertise in data visualization and figure preparation.

Conflicts of Interest

The authors declare that this study received funding from CCTEG Xi’an Research Institute (Group) Co., Ltd. The funder was not involved in the study design, collection, analysis, interpretation of data, the writing of this article or the decision to submit it for publication. Authors Jia Ding, Shuning Dong, Xiaoming Guo and Bo Liu were employed by the company CCTEG Xi’an Research Institute (Group) Co., Ltd. The authors declare that the research was conducted in the absence of any commercial or financial relationships that could be construed as a potential conflict of interest.

References

  1. Jin, D.; Liu, Y. Comprehensive caving water reduction mining technology for thick coal seams in extremely thick sandstone aquifers. Coal Sci. Technol. 2020, 48, 88–95. (In Chinese) [Google Scholar] [CrossRef]
  2. Guimarães, V.d.O.G.; Castro, P.M.G.d.; Petesse, M.L.; Ferreira, C.M. Mining disaster in Brumadinho (Brazil): Social vulnerability from the perspective of the fisherman community. Int. J. Disaster Risk Reduct. 2024, 112, 104814. [Google Scholar] [CrossRef]
  3. Gu, H.; Lai, X.; Tao, M.; Momeni, A.; Zhang, Q. Dynamic mechanical mechanism and optimization approach of roadway surrounding coal water infusion for dynamic disaster prevention. Measurement 2023, 223, 113639. [Google Scholar] [CrossRef]
  4. Hua, Z.; Zhang, Y.; Meng, S.; Wang, L.; Wang, X.; Lv, Y.; Li, J.; Ren, S.; Bao, H.; Zhang, Z.; et al. Response Characteristics and Water Inflow Prediction of Complex Groundwater Systems under High-Intensity Coal Seam Mining Conditions. Water 2023, 15, 3376. [Google Scholar] [CrossRef]
  5. Ding, J.; Dong, D.; Hu, Z.; Ji, Y.; Wei, Z. Numerical Simulations of How Staged Dewatering and Mining Influence Surface Subsidence. Mine Water Environ. 2022, 41, 1124–1136. [Google Scholar] [CrossRef]
  6. Ding, J.; Dong, D.; Hu, Z.; Wei, Z.; Zhang, L. A Study of Interbedded Groundwater Contamination in a Mining Area and the Process of Grouting Composite Failure. Mine Water Environ. 2023, 42, 590–604. [Google Scholar] [CrossRef]
  7. Guzy, A.; Malinowska, A.A. Assessment of the Impact of the Spatial Extent of Land Subsidence and Aquifer System Drainage Induced by Underground Mining. Sustainability 2020, 12, 7871. [Google Scholar] [CrossRef]
  8. Yin, H.; Wu, Q.; Yin, S.; Dong, S.; Dai, Z.; Soltanian, M.R. Predicting mine water inrush accidents based on water level anomalies of borehole groups using long short-term memory and isolation forest. J. Hydrol. 2023, 616, 128813. [Google Scholar] [CrossRef]
  9. Liu, Y.; Yang, T.; Wang, H.; Zhang, P.; Dong, X.; Zhao, Y.; Liu, Y. Risk assessment of disaster chain in multi-seam mining beneath gully topography. Int. J. Disaster Risk Reduct. 2024, 111, 104750. [Google Scholar] [CrossRef]
  10. Ding, Y.; Yin, S.; Dai, Z.; Lian, H.; Bu, C. Multi-Factor Prediction of Water Inflow from the Working Face Based on an Improved SSA-RG-MHA Model. Water 2024, 16, 3390. [Google Scholar] [CrossRef]
  11. Dong, F.; Yin, H.; Cheng, W.; Zhang, C.; Zhang, D.; Ding, H.; Lu, C.; Wang, Y. Quantitative prediction model and prewarning system of water yield capacity (WYC) from coal seam roof based on deep learning and joint advanced detection. Energy 2024, 290, 130200. [Google Scholar] [CrossRef]
  12. Lei, X.; Wu, J.; Long, Y.; Chen, L.; Liu, X.; Xu, H. Integral delay inspired deep learning model for single pool water level prediction. J. Hydrol. 2025, 659, 133328. [Google Scholar] [CrossRef]
  13. Mahmoodzadeh, A.; Ghafourian, H.; Hussein Mohammed, A.; Rezaei, N.; Hashim Ibrahim, H.; Rashidi, S. Predicting tunnel water inflow using a machine learning-based solution to improve tunnel construction safety. Transp. Geotech. 2023, 40, 100978. [Google Scholar] [CrossRef]
  14. Xu, L.; Cai, M.; Dong, S.; Yin, S.; Xiao, T.; Dai, Z.; Wang, Y.; Reza Soltanian, M. An upscaling approach to predict mine water inflow from roof sandstone aquifers. J. Hydrol. 2022, 612, 128314. [Google Scholar] [CrossRef]
  15. Ghadirianniari, S.; McDougall, S.; Eberhardt, E.; Varian, J.; Llewelyn, K.; Campbell, R.; Moss, A. Statistical analysis of the impact of ore draw strategies on wet inrush hazard susceptibility in a panel cave mine. Int. J. Rock Mech. Min. Sci. 2024, 174, 105632. [Google Scholar] [CrossRef]
  16. Li, X.; Du, S.; Hu, S.; Dong, D.; Jiang, D.; Cao, C.; Lin, G.; Fu, J. Simulation of surface water–groundwater interaction in coal mining subsidence areas: A case study of the Kuye River Basin in China. J. Hydrol. 2025, 659, 133243. [Google Scholar] [CrossRef]
  17. Mahmoodzadeh, A.; Mohammadi, M.; M Gharrib Noori, K.; Khishe, M.; Hashim Ibrahim, H.; Farid Hama Ali, H.; Nariman Abdulhamid, S. Presenting the best prediction model of water inflow into drill and blast tunnels among several machine learning techniques. Autom. Constr. 2021, 127, 103719. [Google Scholar] [CrossRef]
  18. Cheng, W.; Yin, H.; Xie, D.; Dong, F.; Li, Y.; Zhu, T.; Wang, J. Prediction of dominant roof water inrush windows and analysis of control target area based on set pair variable weight—Forward correlation cloud model. J. Clean. Prod. 2024, 483, 144253. [Google Scholar] [CrossRef]
  19. Meng, S.; Wu, Q.; Zeng, Y.; Mei, A.; Yang, G.; Hua, Z.; Yang, L.; Zhang, Y. Evaluating the impact of coal seam roof groundwater using variable weights theory: A special emphasis on skylight-type water inrush pattern. J. Hydrol. Reg. Stud. 2024, 56, 102009. [Google Scholar] [CrossRef]
  20. Lian, H.; Zhang, Q.; Yin, S.; Yan, T.; Yao, H.; Yang, S.; Kang, J.; Xia, X.; Li, Q.; Huang, Y.; et al. Integrating Microseismic Monitoring for Predicting Water Inrush Hazards in Coal Mines. Water 2024, 16, 1168. [Google Scholar] [CrossRef]
  21. Yang, Z.; Dong, D.; Chen, Y.; Wang, R. Water Inflow Forecasting Based on Visual MODFLOW and GS-SARIMA-LSTM Methods. Water 2024, 16, 2749. [Google Scholar] [CrossRef]
  22. Cheng, L.; Xu, J.; Peng, S.; Yang, H.; Jiao, F.; Zhou, B.; Yan, F. Dynamic behavior of outburst two-phase flow in a coal mine T-shaped roadway: The formation of impact airflow and its disaster-causing effect. Int. J. Min. Sci. Technol. 2023, 33, 1001–1017. [Google Scholar] [CrossRef]
  23. Zhou, Z.; Jin, D.; Hu, W.; Dong, Y.; Cao, H. Research on the Dynamic Attenuation Dynamics of Double Indices of Water Gushing in the Goaf of Coal Mine Face Push Mining. J. China Coal Soc. 2018, 43, 2587–2594. (In Chinese) [Google Scholar] [CrossRef]
  24. Liu, B.; Liu, G.; Sha, J.; Sun, J.; Zhao, X.; Ren, S.; Liu, R.; Li, S. Numerical simulation of the interaction between mine water drainage and recharge: A case study of Wutongzhuang coal mine in Heibei Province, China. Ecol. Indic. 2024, 158, 111568. [Google Scholar] [CrossRef]
  25. Meng, S.; Wu, Q.; Zeng, Y.; Gu, L. Enhancing mine groundwater system prediction: Full-process simulation of mining-induced spatio-temporal variations in hydraulic conductivities via modularized modeling. Int. J. Min. Sci. Technol. 2024, 34, 1625–1642. [Google Scholar] [CrossRef]
Figure 1. Location of Binchang mining area.
Applsci 15 09472 g001
Figure 2. Distribution map of water inflow in the Binchang mining area.
Applsci 15 09472 g002
Figure 3. Regional tectonic map.
Applsci 15 09472 g003
Figure 4. Distribution and location of the working face.
Applsci 15 09472 g004
Figure 5. Comprehensive hydrogeological histogram.
Applsci 15 09472 g005
Figure 6. Graph of water inflow in the working face, varying with the mining distance.
Applsci 15 09472 g006
Figure 7. Three-dimensional formation model.
Applsci 15 09472 g007
Figure 8. Model comparison at profile line A-A’.
Applsci 15 09472 g008
Figure 9. Analysis of prediction results by hydrogeological analogy method.
Applsci 15 09472 g009
Figure 10. Analysis of dynamic prediction results of water inflow.
Applsci 15 09472 g010
Figure 11. Simulation results of the seepage field in the main water-filled aquifer.
Applsci 15 09472 g011
Figure 12. Numerical simulation results of water inflow in the working face.
Applsci 15 09472 g012
Figure 13. Correlation analysis between numerical simulation results and actual data.
Applsci 15 09472 g013
Table 1. Statistical table of aquifer water level height and permeability coefficient.
FormationBoreholeWater Level (m)Permeability Coefficient (m/d)
Luohe2-6843.080.71567
2-5847.280.787
DG3844.870.16294
XZ1763.060.2244
XZ2748.440.05871
XZ1903836.110.1667
XZ1907845.690.0922
XZ1911842.850.004461
XZ2101748.460.104764
XZ2103785.5810.068186
YijunDG3790.970.03425
XZ1620.950.00325
XZ2617.540.00557
XZ1903837.190.0007
XZ1911803.30.003974
Zhiluo-Yanan2-6809.960.00174
2-5857.060.00081
DG4776.690.0002
XZ1907868.030.000203
Table 2. Working face attributes.
Working
Face
Mining
Period
Mining Length
(m)
Mining Width
(m)
Mining Thickness
(m)
402012014.08–2015.07117017412.5
402022015.08–2016.09134817414.3
402032016.09–2017.12150419514.8
402042017.11–2019.03164619514
403092019.03–2021.03282419514.8
402052021.03–2022.07189019614
403022022.08–2023.09154419614
Table 3. Model scheme.
Model StratumCorresponding FormationSpecific Yield (L/s·m)Initial Permeability (m/d)
Upper AquiferQuaternary Alluvial/
Pleistocene Loess
0.08100.0589
Upper AquitardLower Cretaceous Huachi Formation/0.0001
Luohe Formation
Aquifer
Lower Cretaceous Sandstone0.22140.0220
Anding FormationMiddle Jurassic Mudstone Aquitard/0.0001
Zhiluo Formation
Aquifer
Middle Jurassic Sandstone0.00260.0164
Main Coal Seam4th Coal Seam//
Table 4. Applicability analysis of water inflow prediction methods.
MethodR2 RangeBest ForWeaknesses
Hydrogeological Analogy0.72–0.95First mining faces
(undisturbed conditions)
Fails for non-first
mining faces
Dynamic Prediction0.88–0.96Non-first faces
(high lateral recharge)
Requires continuous
data updates
Numerical Simulation0.89–0.96All scenarios
(mechanistic rigor)
Computationally
intensive
Disclaimer/Publisher’s Note: The statements, opinions and data contained in all publications are solely those of the individual author(s) and contributor(s) and not of MDPI and/or the editor(s). MDPI and/or the editor(s) disclaim responsibility for any injury to people or property resulting from any ideas, methods, instructions or products referred to in the content.