Article

Deep Learning-Based Optimization of Central Angle and Viewpoint Configuration for 360-Degree Holographic Content

1
Department of Digital Contents, Sejong University, Seoul 05006, Republic of Korea
2
Department of Software, Sejong University, Seoul 05006, Republic of Korea
3
Hyper-Reality Metaverse Research Laboratory, Electronics and Telecommunications Research Institute, Daejeon 34129, Republic of Korea
4
R&D Center, Heerae Corporation, Seoul 04790, Republic of Korea
*
Authors to whom correspondence should be addressed.
Appl. Sci. 2025, 15(17), 9465; https://doi.org/10.3390/app15179465
Submission received: 16 July 2025 / Revised: 19 August 2025 / Accepted: 28 August 2025 / Published: 28 August 2025
(This article belongs to the Special Issue Emerging Technologies of 3D Imaging and 3D Display)

Abstract

We present a deep learning-based approach to optimize the central angle between adjacent camera viewpoints for the efficient generation of natural 360-degree holographic 3D content. High-quality 360-degree digital holograms require the acquisition of densely sampled RGB–depth map pairs, a process that traditionally requires significant computational costs. Our method introduces a novel pipeline that systematically evaluates the impact of varying central angles—defined as the angular separation between equidistant viewpoints in an object-centered coordinate system—on both depth map estimation and holographic 3D image reconstruction. By systematically applying this pipeline, we determine the optimal central angle that achieves an effective balance between image quality and computational efficiency. Experimental investigations demonstrate that our approach significantly reduces computational demands while maintaining superior fidelity of the reconstructed 3D holographic images. The relationship between central angle selection and the resulting quality of 360-degree digital holographic 3D content is thoroughly analyzed, providing practical guidelines for the creation of immersive holographic video experiences. This work establishes a quantitative standard for the geometric configuration of viewpoint sampling in object-centered environments and advances the practical realization of real-time, high-quality holographic 3D content.

1. Introduction

Depth map estimation plays a pivotal role in three-dimensional (3D) image processing, particularly in the synthesis of computer-generated holograms (CGHs) [1]. Recently, CGHs based on 360-degree multi-viewed image content [2,3] have been increasingly utilized for a variety of real-time, immersive display applications such as stage performances, near-eyed displays, augmented and extended reality (AR/XR) video platforms [4], and diverse industrial domains [5,6]. Typically, the acquisition of a paired RGB image and depth map for each viewpoint is required to synthesize CGHs using fast Fourier transform (FFT), the algorithm which is applicable for calculating real-time holograms [4,7,8].
This study aims to determine an efficient angular configuration for 360-degree holographic reconstruction using deep learning, focusing on optimizing both the viewpoint interval and the number of viewpoints. Conventional approaches often rely on arbitrary or uniform viewpoint arrangements, which may lead to redundant computations or degraded reconstruction quality. To overcome these limitations, we propose a learning-based optimization framework that balances reconstruction fidelity with computational efficiency.
A fundamental challenge in producing 360-degree holographic video content lies in the trade-off between computational cost and viewpoint density, which is governed by the central angle—the angular separation between adjacent viewpoints positioned equidistantly around a given 3D object or scene (see Figure 1). As the central angle decreases, the number of required viewpoints increases, enabling more detailed and realistic 3D reconstructions. However, this also escalates the computational burden, particularly for deep learning-based depth map estimation and subsequent CGH synthesis. Therefore, identifying the optimal central angle is crucial for balancing image quality with computational efficiency in 360-degree holographic content creation.
In this work, we propose a novel deep learning-based framework to determine the optimal geometric configuration for viewpoint sampling in object-centered environments. Our approach systematically investigates the relationship between central angle selection and the resulting quality of holographic 3D reconstructions, using a custom dataset of paired RGB and depth images acquired across a range of viewpoints [4]. Specifically, we vary the number of viewpoints from 4 to 512, corresponding to central angles from 90° to 0.7° and define the general relationship as follows: The general relation between the central angle ( θ n ) is given by
θ n = 360 2 n
where n is a natural number within the range 2 ≤ n ≤ 9.
The experimental procedure comprises three main steps to systematically address the challenges inherent in 360-degree holographic 3D content generation. First, a comprehensive multi-view dataset comprising paired RGB images and depth maps is constructed to facilitate robust 3D content synthesis. This dataset is meticulously designed to capture the full range of object perspectives necessary for accurate holographic reconstruction. Second, the proposed deep learning model is trained using datasets with varying central angles—the angular separation between adjacent camera viewpoints in an object-centered environment. This stage includes depth map estimation for viewpoints not included in the training set, followed by the synthesis of computer-generated holograms (CGHs) and the subsequent reconstruction of 3D holographic images. Third, both quantitative and qualitative evaluations are conducted to assess the quality of the estimated depth maps and the reconstructed 3D holographic images as a function of the central angle. Performance metrics such as mean squared error and accuracy are employed to rigorously analyze the relationship between angular sampling density and image fidelity.
This work contributes to the development of more efficient and realistic 360-degree digital holographic 3D content creation processes both by presenting a quantitative standard and providing an optimization strategy for the angular separation of recorded viewing perspectives within a 360° around a holographic 3D display.
The remainder of this paper is organized as follows: Section 2 reviews key prior studies relevant to this research and analyzes existing approaches for optimizing viewpoint configuration in 360-degree holographic content generation. Section 3 presents our proposed deep learning-based optimization method for efficiently determining the viewpoint interval and number in an object-centered environment. Section 4 provides both quantitative and qualitative experimental results for various central angles and analyzes the impact of viewpoint configuration on depth map quality. Finally, Section 5 discusses the significance and limitations of the present study and suggests directions for future research.

2. Related Work

Digital holograms, also known as computer-generated holograms (CGHs), can be synthesized using a variety of computational algorithms. The fast Fourier transform (FFT) algorithm is one of the common methods for synthesizing CGHs [4]. A critical prerequisite for generating high-quality digital holographic content is the precise estimation of depth maps. Recent advancements in deep learning have led to the development of various methods for depth map estimation, tailored to different types of input data, including monocular image sets, stereo image pairs, and multi-view image sets. These innovations have significantly improved the fidelity and efficiency of digital hologram synthesis, enabling the creation of more realistic and immersive 3D content.
This section provides a selective review of previous studies on depth map estimation directly relevant to 360-degree holographic content generation. We focus on research employing deep learning techniques with monocular, stereo, and multi-view RGB inputs for depth estimation. Studies that do not pertain to deep learning methods or are not applicable to 360-degree content generation are excluded.

2.1. Depth Map Estimation from Monocular-Image Information

After a convolutional neural network (CNN)-based model made up of two subnet-works was proposed by Eigen et al. [9], several other approaches for monocular-image-based depth map estimation were proposed, including conditional random fields (CRFs) [10,11,12], generative adversarial networks (GANs) [13,14], and U-net architectures [15,16]. Also, monocular images were used as input to perform depth map estimation. Zhou et al. [17] proposed a method to estimate depth information from monocular videos and to provide situation information corresponding to the estimated depth map results. Yang et al. [18] suggested an approach to advance previous depth map estimation models to derive output images that include object surface information.

2.2. Depth Map Estimation from Stereo-Image Information

Alagoz et al. [19] presented a depth map estimation method inspired by the human visual system, utilizing binocular disparity. Joung et al. [20] proposed a CNN model to estimate depth maps by matching cost volumes using an unsupervised learning approach. Garg et al. [21] and Luo et al. [22] introduced a method that applies pixel-shifted warping to a single image input to generate left-eye and right-eye images, which are then used to estimate a depth map. Wu et al. [23] presented a GAN model with an attention mechanism for depth map estimation, replacing the disparity refinement process used in stereo images.

2.3. Depth Map Estimation from Multi-View Image Information

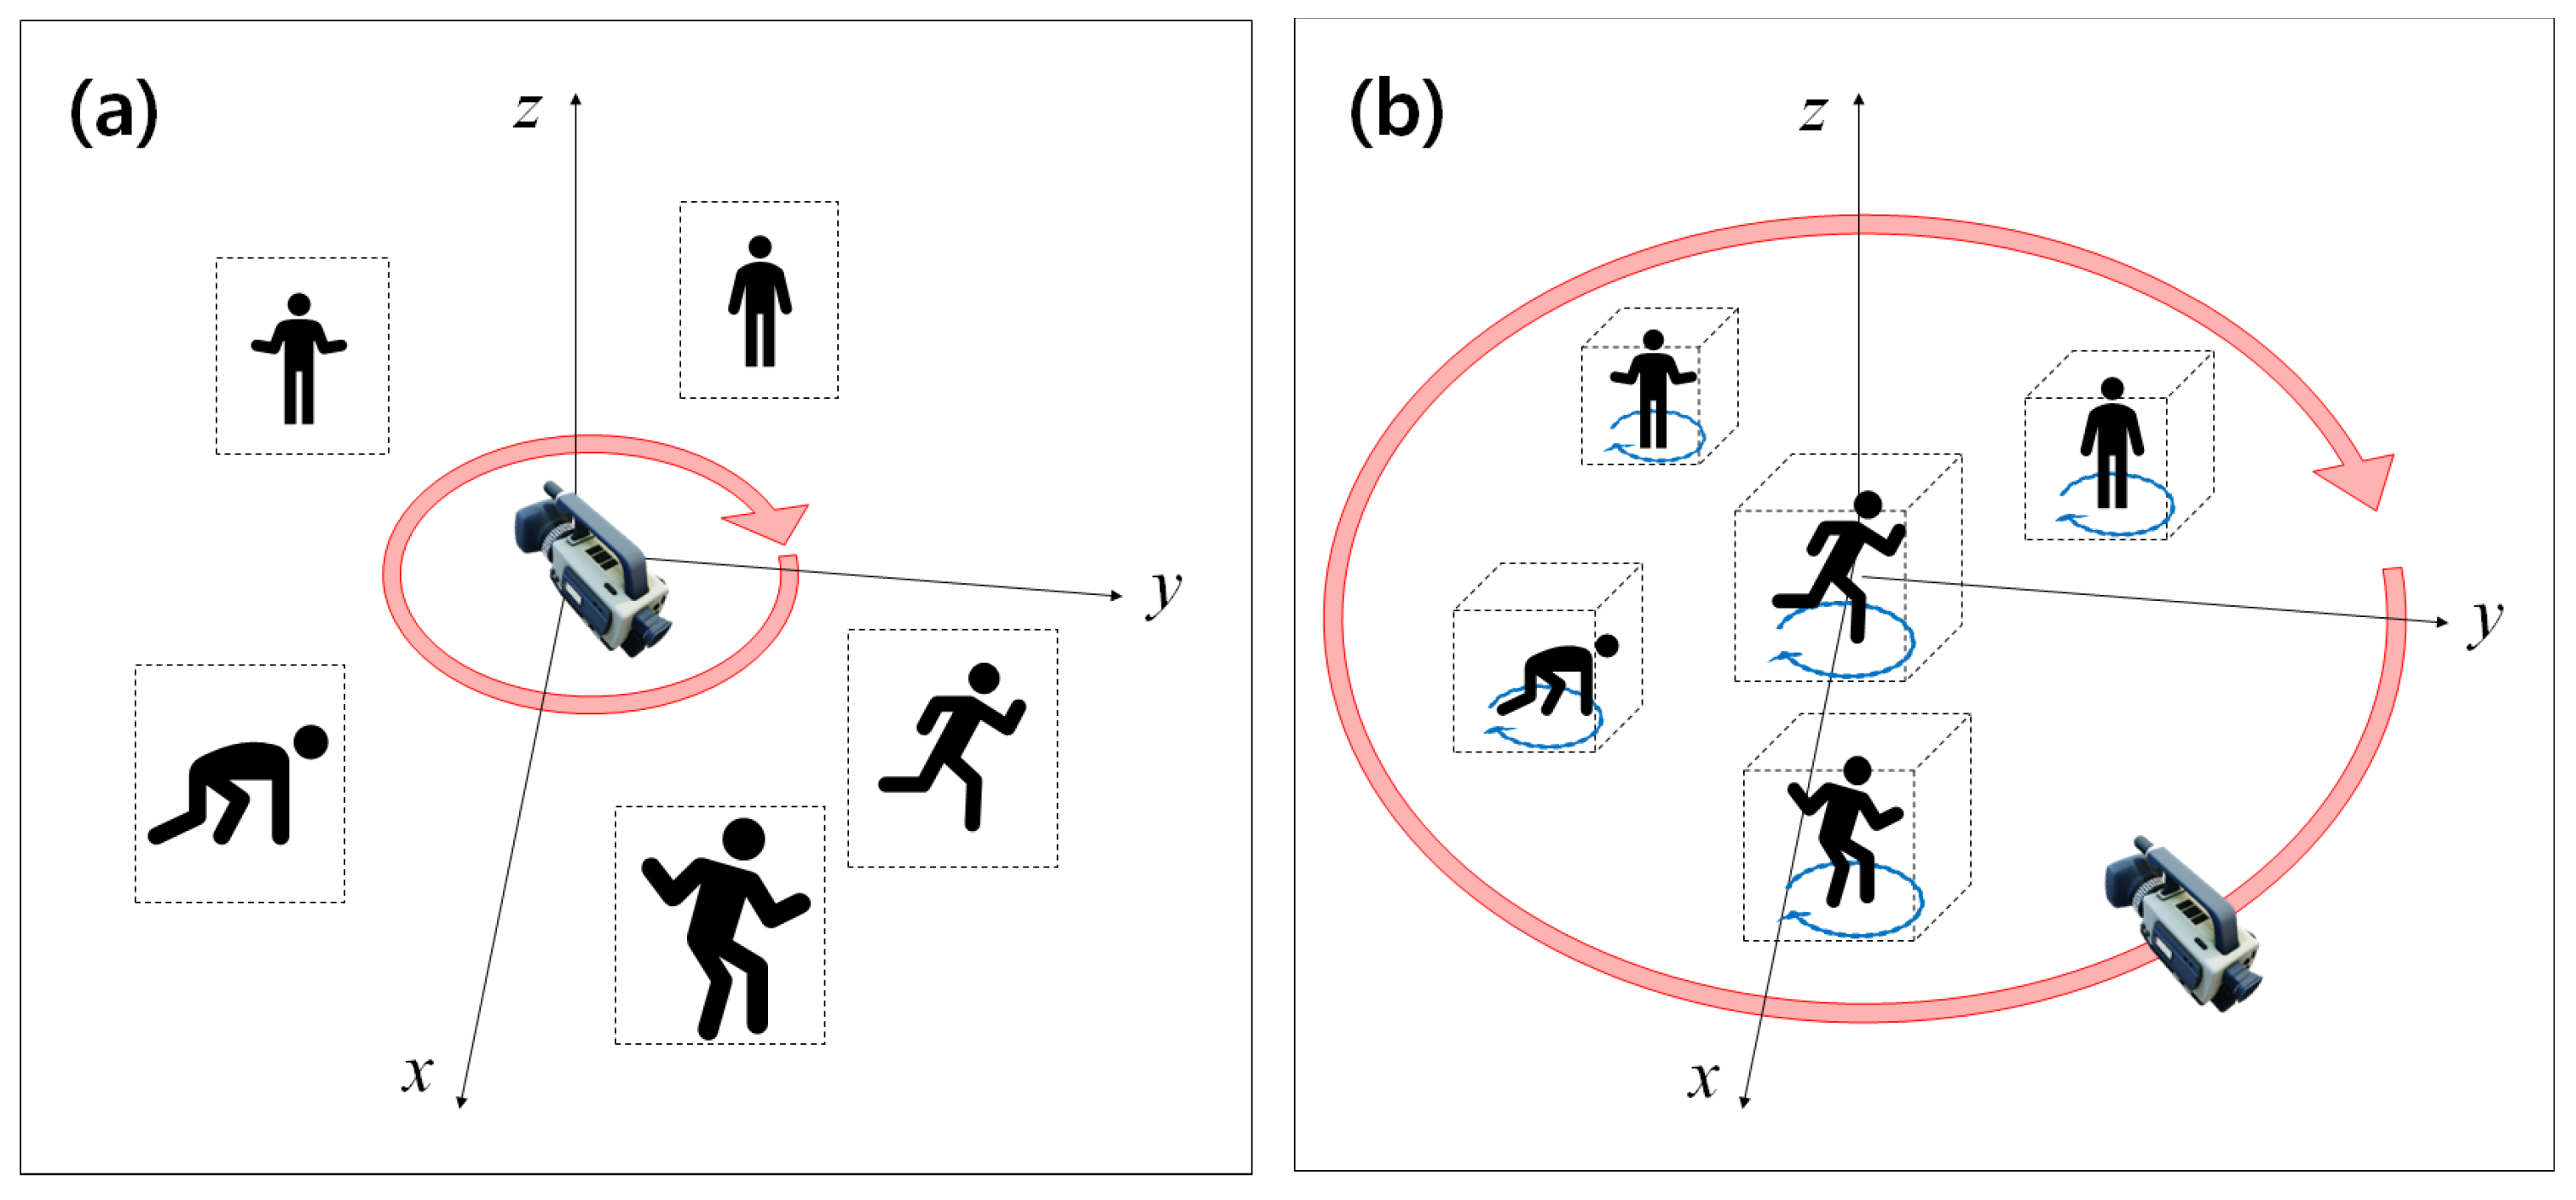
Most of depth map estimation methods using multi-view images were inspired by plane-sweep techniques [24], which are geometric algorithms designed to find intersecting line segments. Pei et al. [25] proposed an asymmetric U-net model to improve depth estimation from multi-view images in outdoor environments. Zioulis et al. [26] investigated a self-supervised learning approach based on geometrical formulas to estimate depth map for a set of 360-degree spherical-viewed images. Feng et al. [27] presented an image set augmentation method designed to synthesize a 360-degree background image and a foreground image, and then to estimate depth map. Both Zioulis et al. [26] and Feng et al. [27] developed methods, respectively, for estimating the depth maps from 360-degree color images which were captured in a camera-centered environment, as illustrated in Figure 2a. These two methods differ from our proposed approach in that they are not suitable for 360-degree holographic content because, in a camera-centered environment, RGB–depth map pairs cannot be acquired for all directions of objects. In contrast, our proposed method is suitable for 360-degree holographic content because we use a data set of an object-centered environment. In the object-centered environment, the object of interest is placed at the center, and the camera moves around the object along a defined path (e.g., a circular trajectory). This configuration enables the systematic capture of RGB–depth map pairs from all possible directions around the object. By acquiring data at regular angular intervals, it ensures that the entire 360-degree surface of the object is represented. This comprehensive data acquisition is particularly advantageous for 360-degree holographic content generation, as it provides the complete set of viewpoints required for accurate and realistic holographic reconstruction, as shown in Figure 2b.

2.4. Object-Centered Depth Map Acquisition for 360-Degree Digital Holography

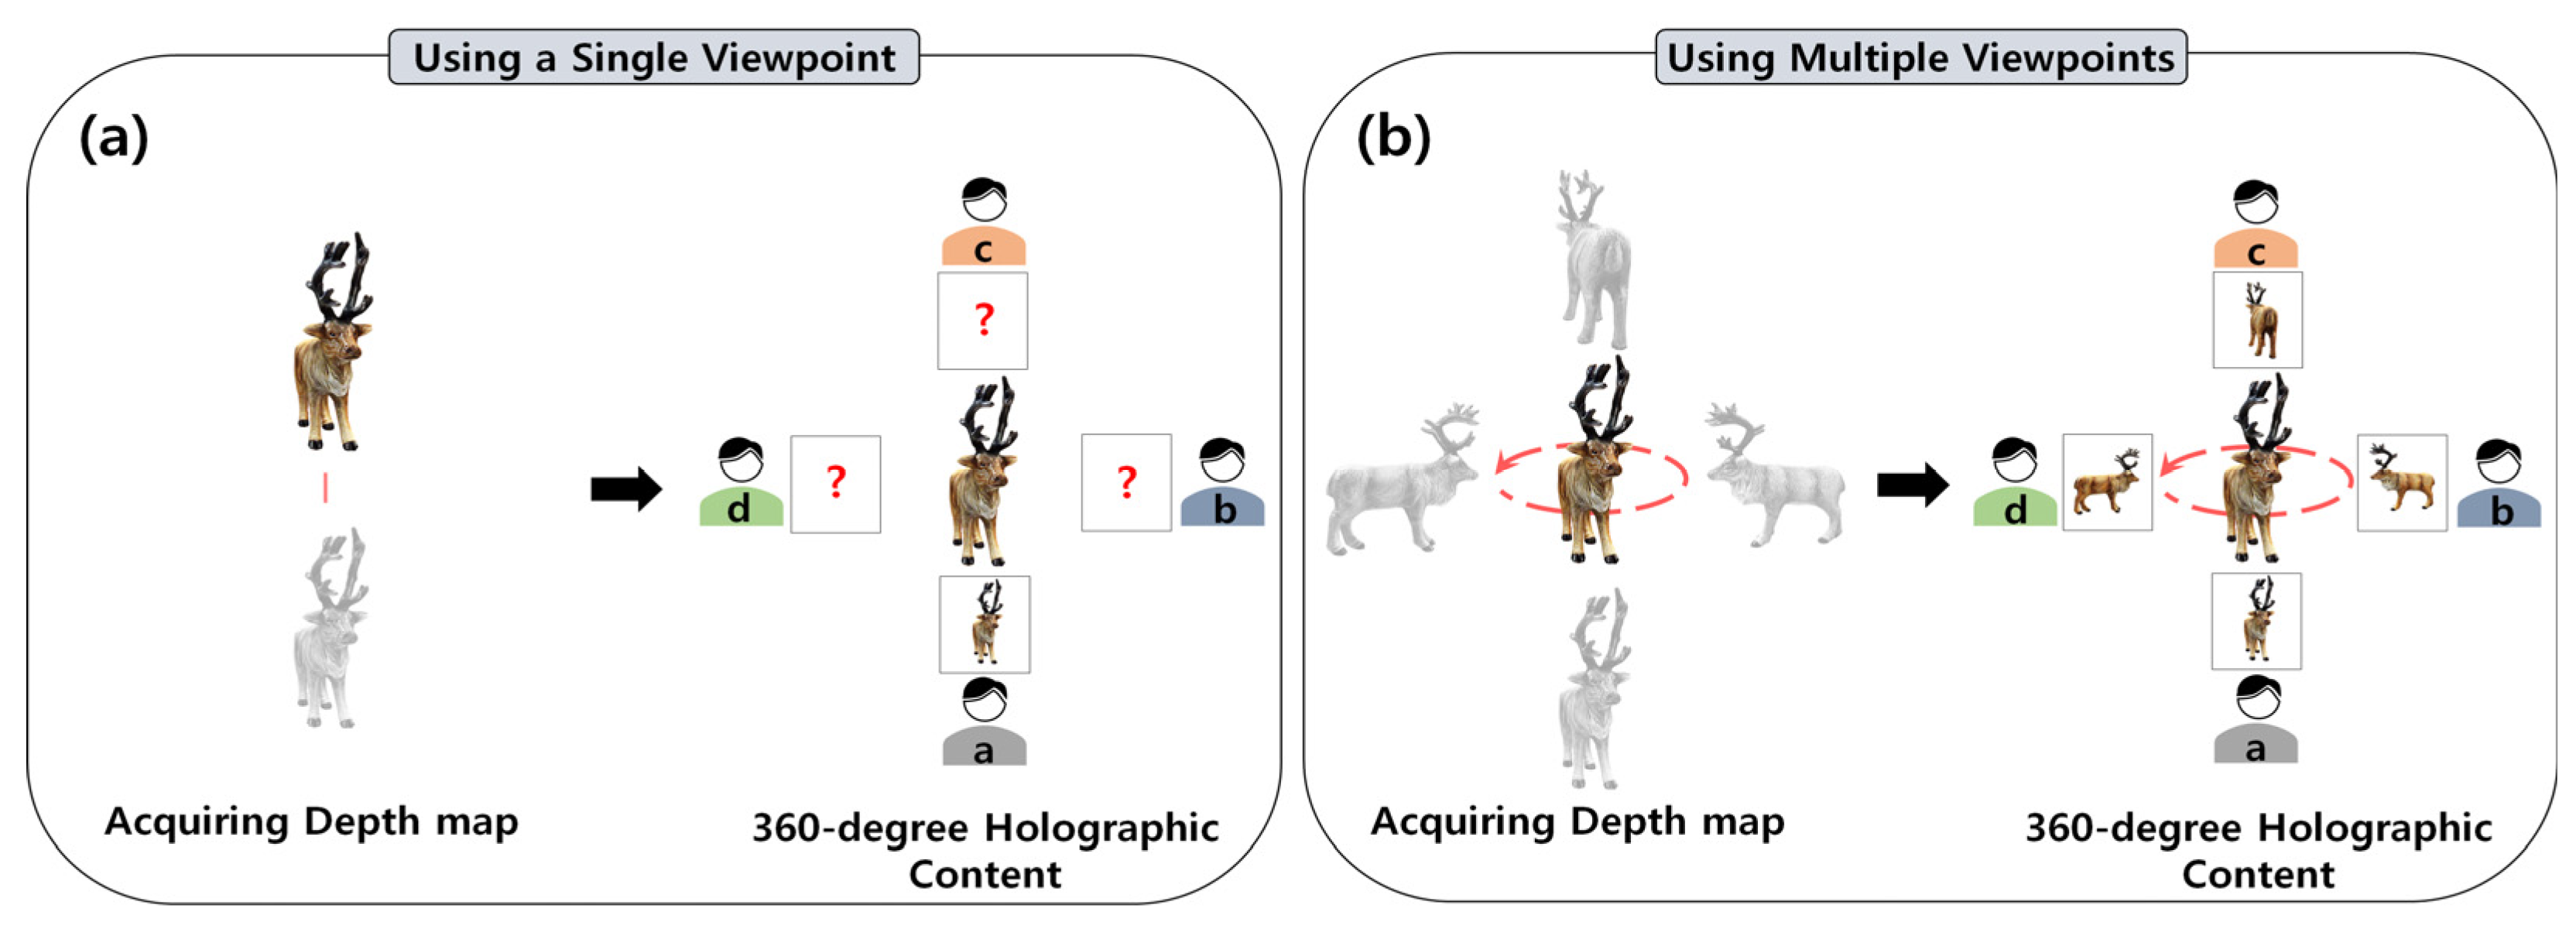
To enable comprehensive observation of digital holographic 3D content from all viewing angles, it is essential to acquire RGB–depth map pairs that fully cover the 360-degree domain, as illustrated in Figure 3. Kim et al. [4] recently introduced a technique to generate complete 360-degree digital holographic content by addressing the challenge of overcoming a lack of depth map data at certain viewpoints. While effective, their approach requires depth map estimation for every possible viewpoint, since there is no established criterion for the optimal central angle between adjacent viewpoints necessary for high-fidelity CGH content.
This absence of a standard leads to redundant computational effort during depth estimation, CGH synthesis, and subsequent reconstruction, as all viewpoints are treated as equally necessary, regardless of their actual contribution to image quality. The present study addresses this limitation by introducing a method to systematically optimize and determine the minimal yet sufficient number of RGB–depth map pairs, guided by the central angle, within an object-centered acquisition framework. By strategically selecting the central angle, our approach achieves a balance between image quality and computational efficiency, thereby facilitating the practical and scalable generation of realistic 360-degree holographic 3D content.

3. Proposed Method

Section 3 is organized into three subsections detailing the proposed framework. Section 3.1 describes the data acquisition and preprocessing procedures for 360-degree depth map generation. Section 3.2 presents the network architecture and training configuration employed for optimizing the angular configuration. Finally, Section 3.3 explains the criteria and metrics used for performance evaluation and analysis of reconstruction quality.

3.1. Data Generation

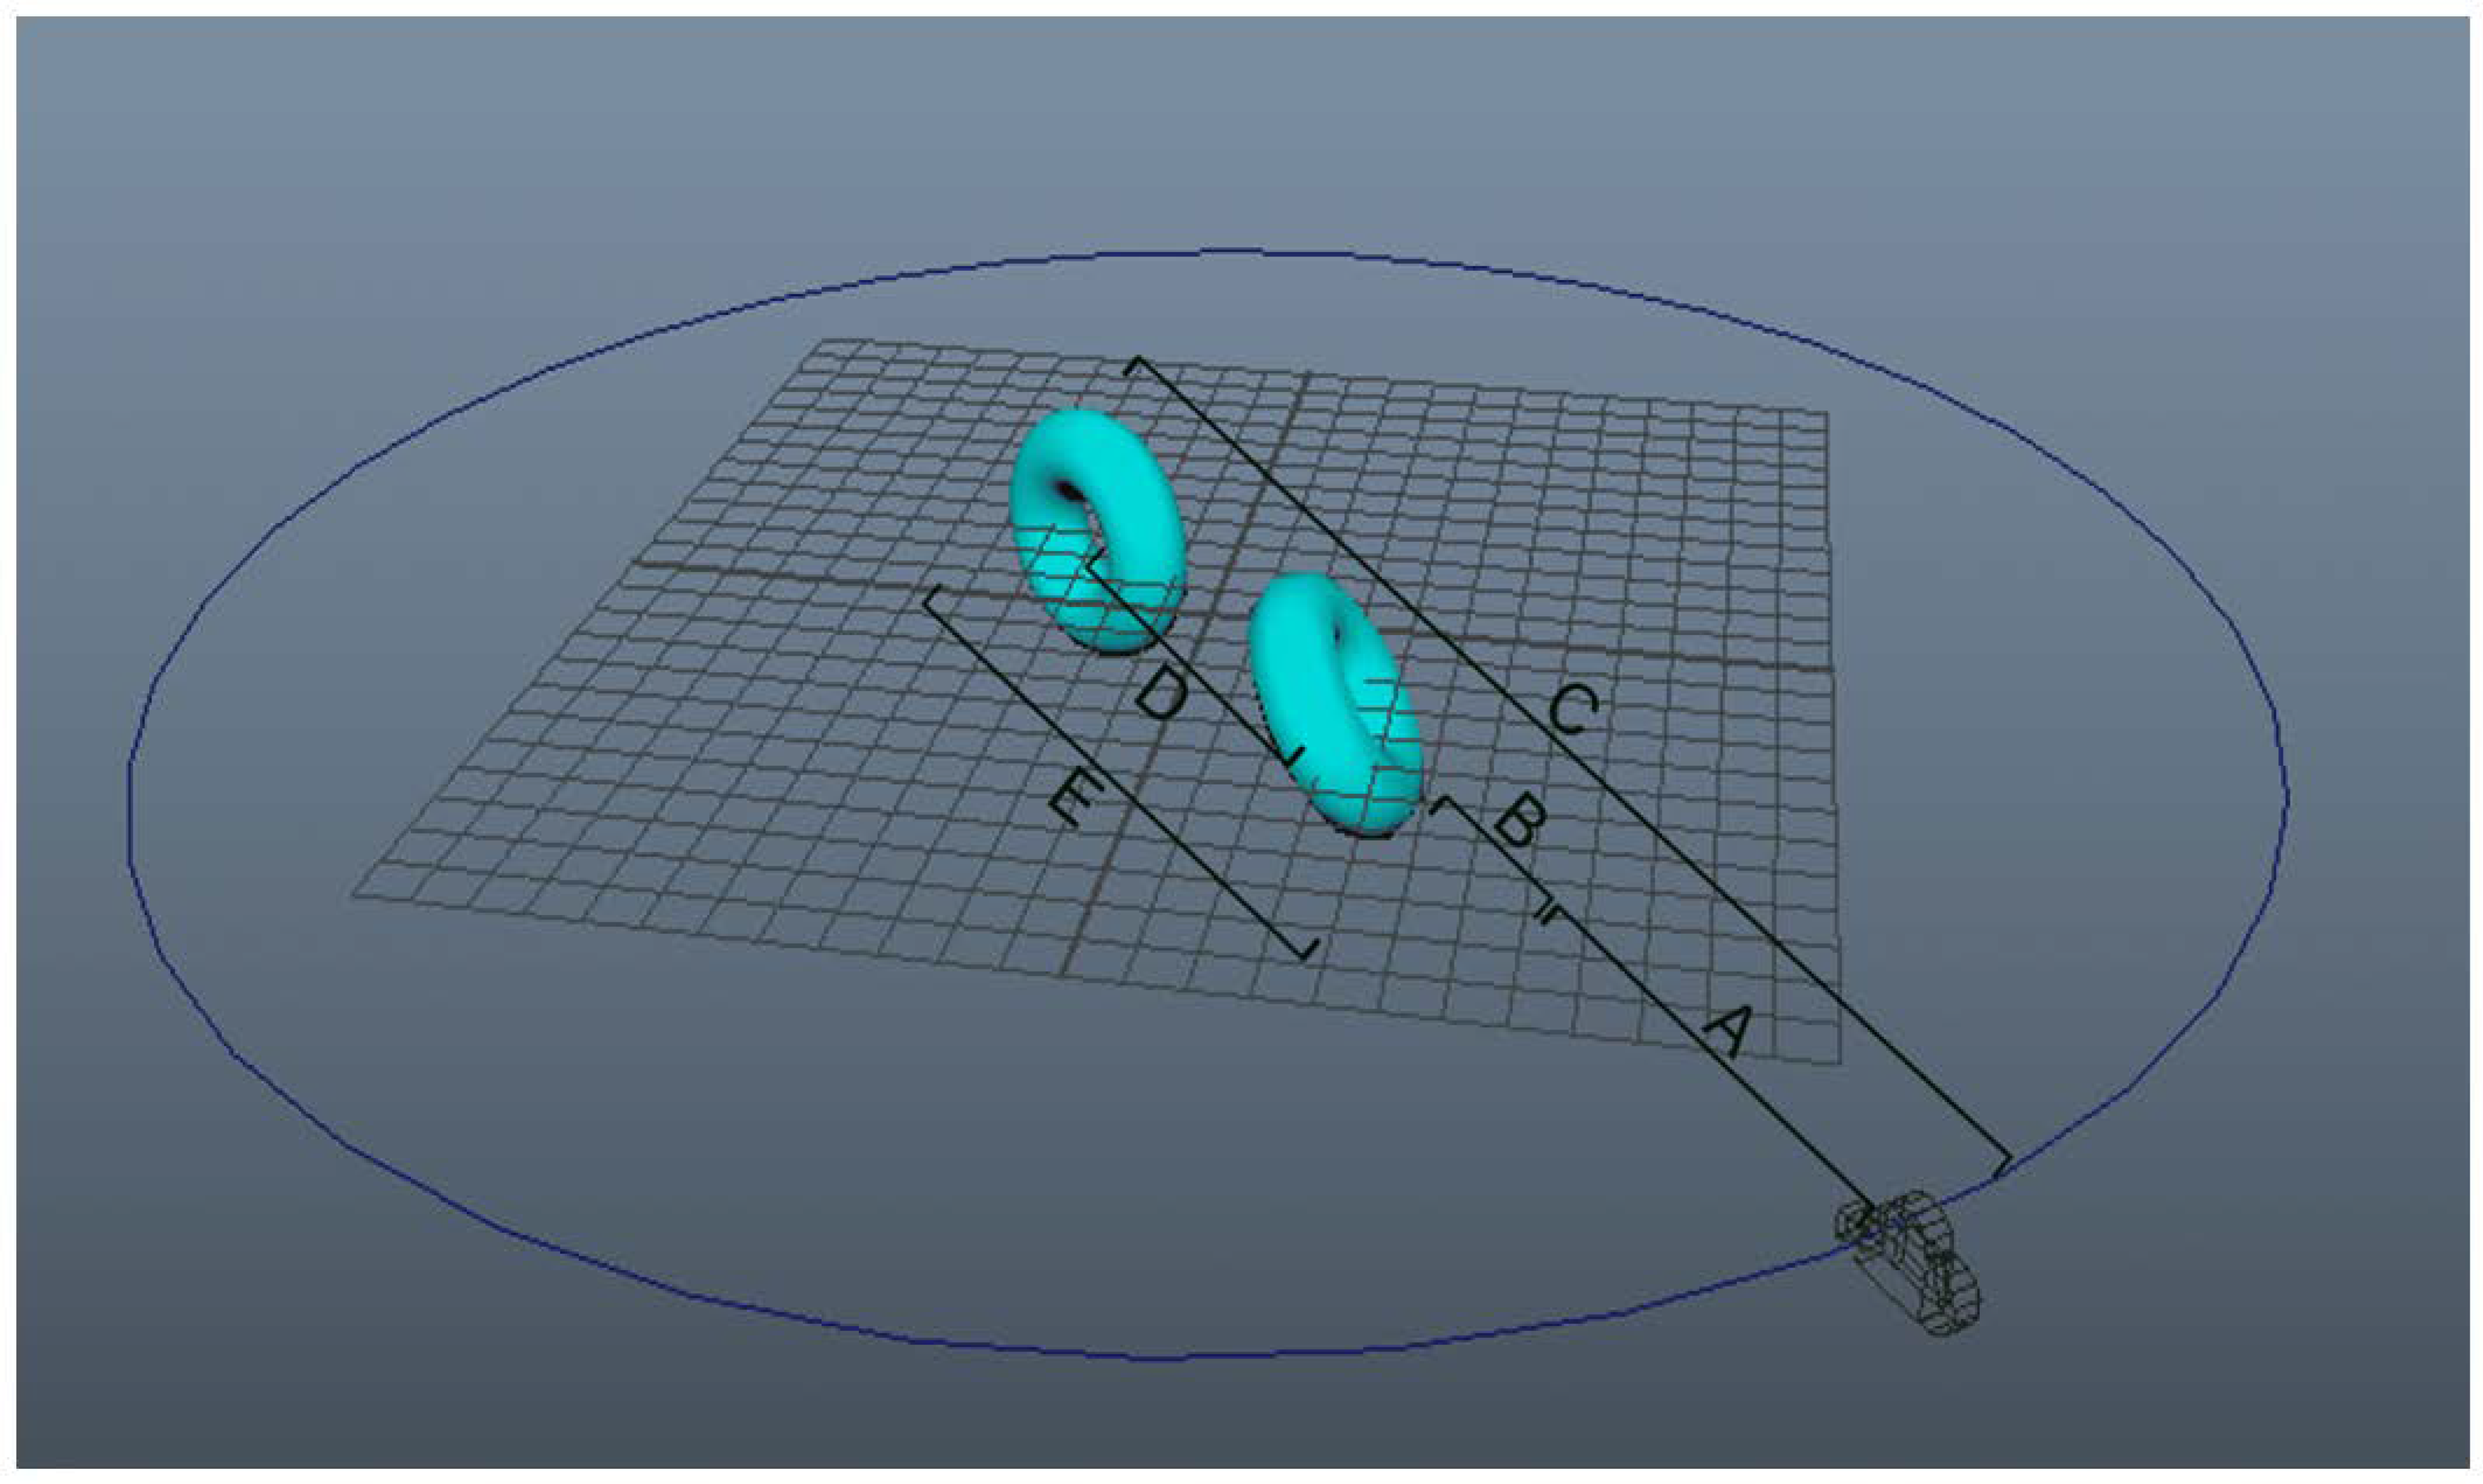
To construct a comprehensive dataset for 360-degree holographic content generation, pairs of RGB and depth map images were acquired using the 3D graphics software Maya™ (Maya 2022) [28] in an object-centered environment. To effectively capture the accommodation effect arising from depth variations in 3D space, each scene was designed with two distinct 3D objects positioned at different distances from the virtual camera. This arrangement enables the dataset to reflect realistic depth cues essential for high-fidelity holographic reconstruction. The central angle between adjacent camera viewpoints is determined by the radius of the camera’s circular trajectory. In this study, the rotational radius—defined as the distance from the camera to the scene origin—was fixed at 20 cm. Table 1 summarizes the key geometric parameters and camera settings used for 360-degree RGB and depth map data acquisition in the object-centered environment, as illustrated in Figure 4. The camera for capturing RGB and depth map images was programmed complete a full 360° rotation in approximately 8.5 s at a speed of 120 frames per second (fps). During one rotation, the camera captured 1024 RGB color images and simultaneously acquired 1024 depth maps.
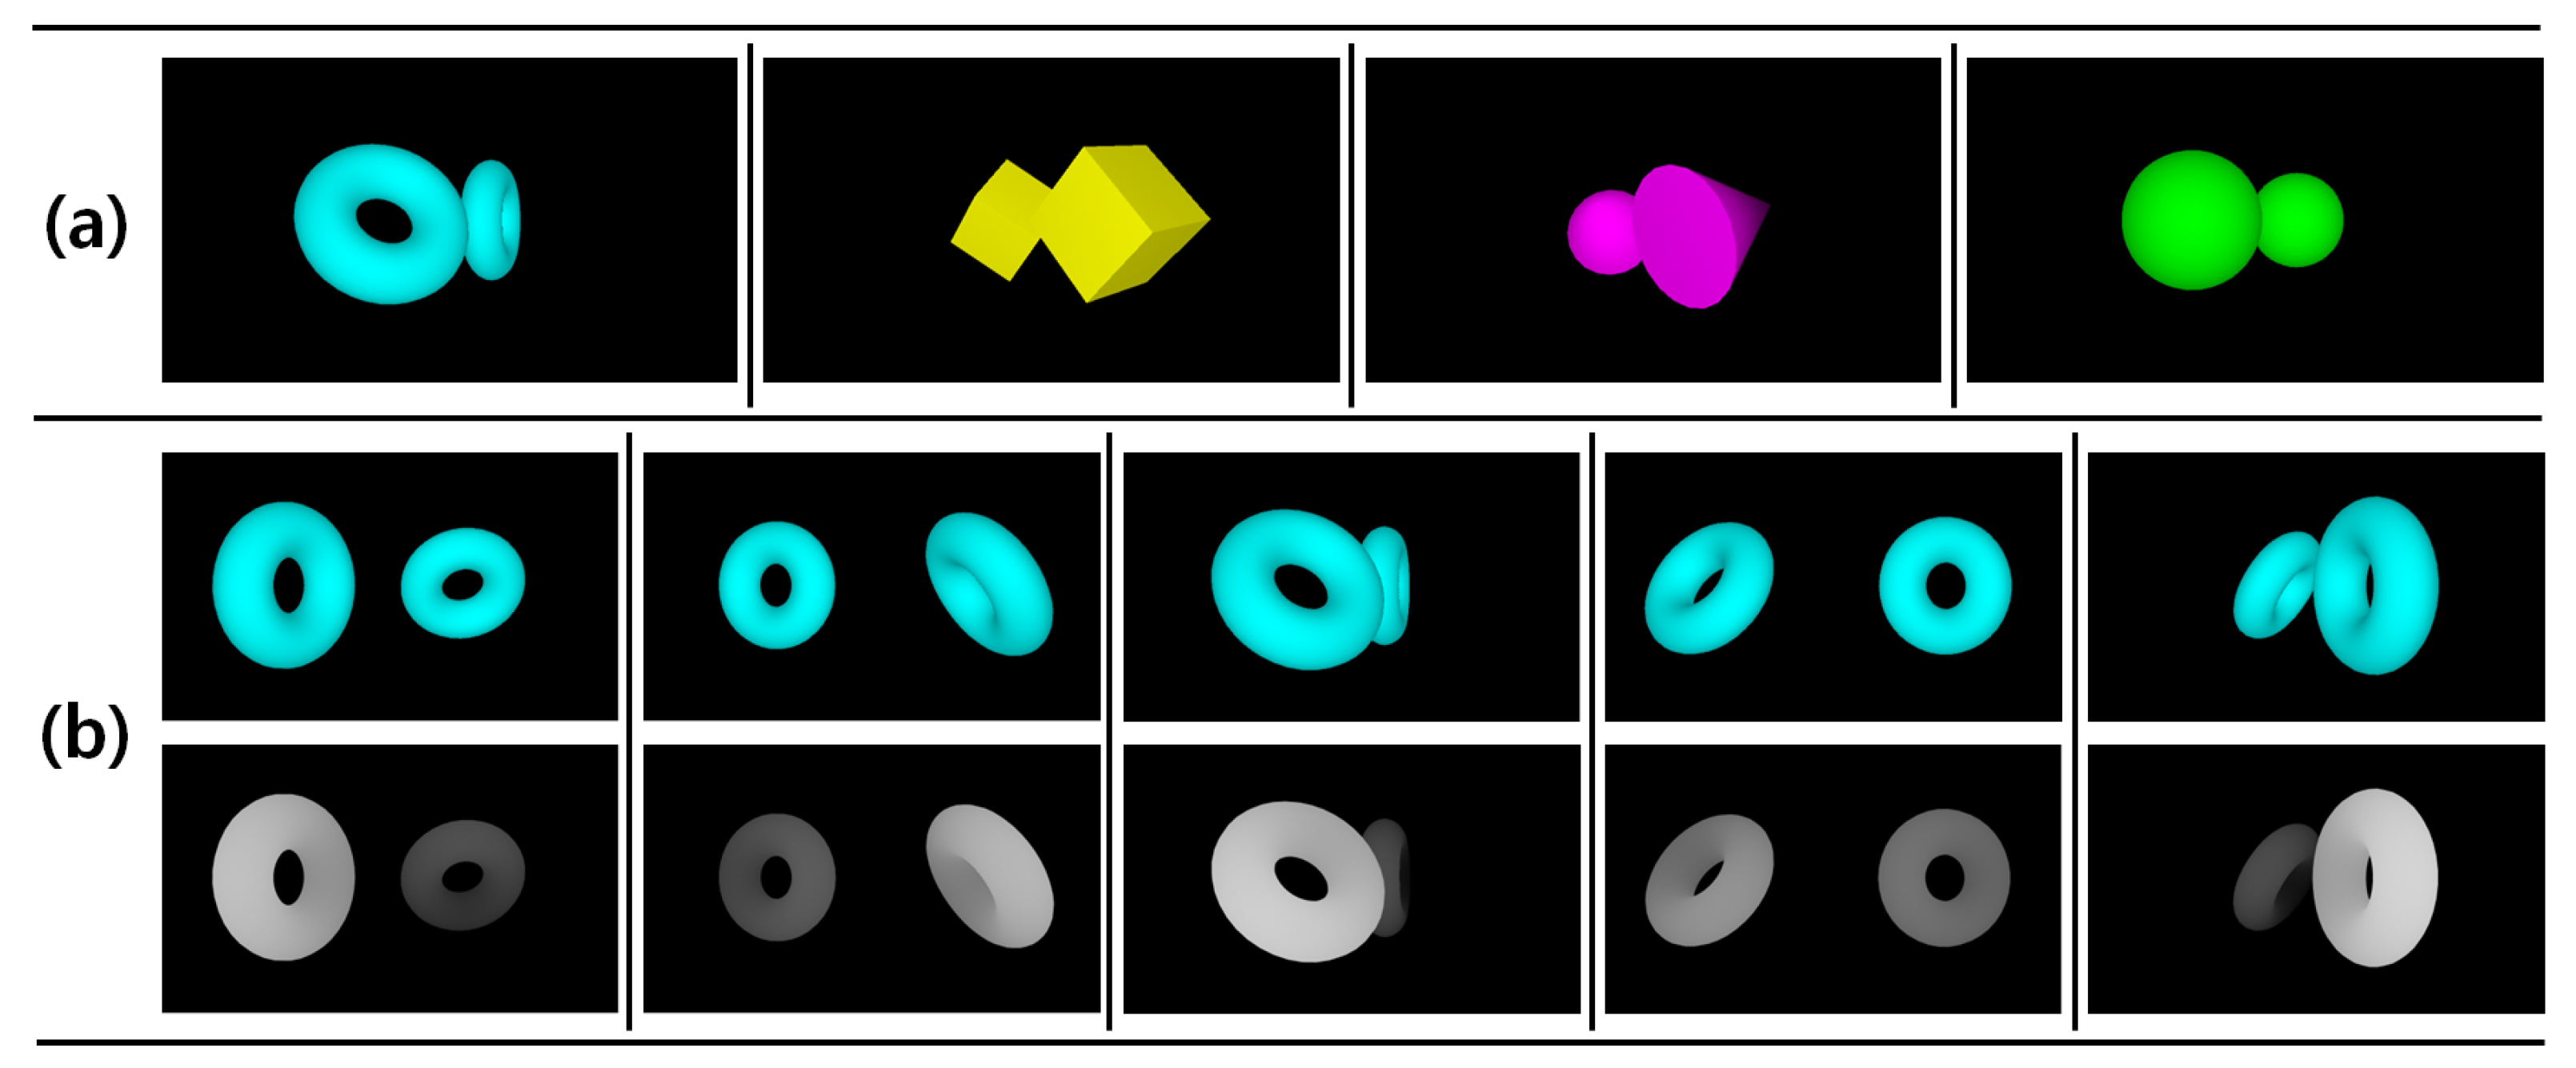
For data acquisition, this setup resulted in the collection of 1024 RGB images and corresponding depth maps per rotation, with each image captured at 0.35° intervals. The resulting dataset was divided evenly into training and evaluation sets. For instance, when the central angle was set to 0.7°, 512 RGB–depth map pairs (0.7° × 512 ≈ 360°) were allocated for training, and the remaining 512 pairs were reserved for testing. To ensure the robustness and generalizability of the proposed model, four distinct types of 3D object pairs—torus, cube, cone, and sphere—were used in the data generation process [4]. For each object type, 1024 RGB–depth map pairs were prepared, as depicted in Figure 5. Note that the RGB images shown in Figure 5 are used solely for visualization purposes and do not represent actual wavelength-based holographic wavefront reconstructions. This systematic approach to data generation provides a diverse and representative foundation for evaluating the performance of the proposed deep learning-based optimization framework in 360-degree holographic content synthesis.

3.2. Model Architecture

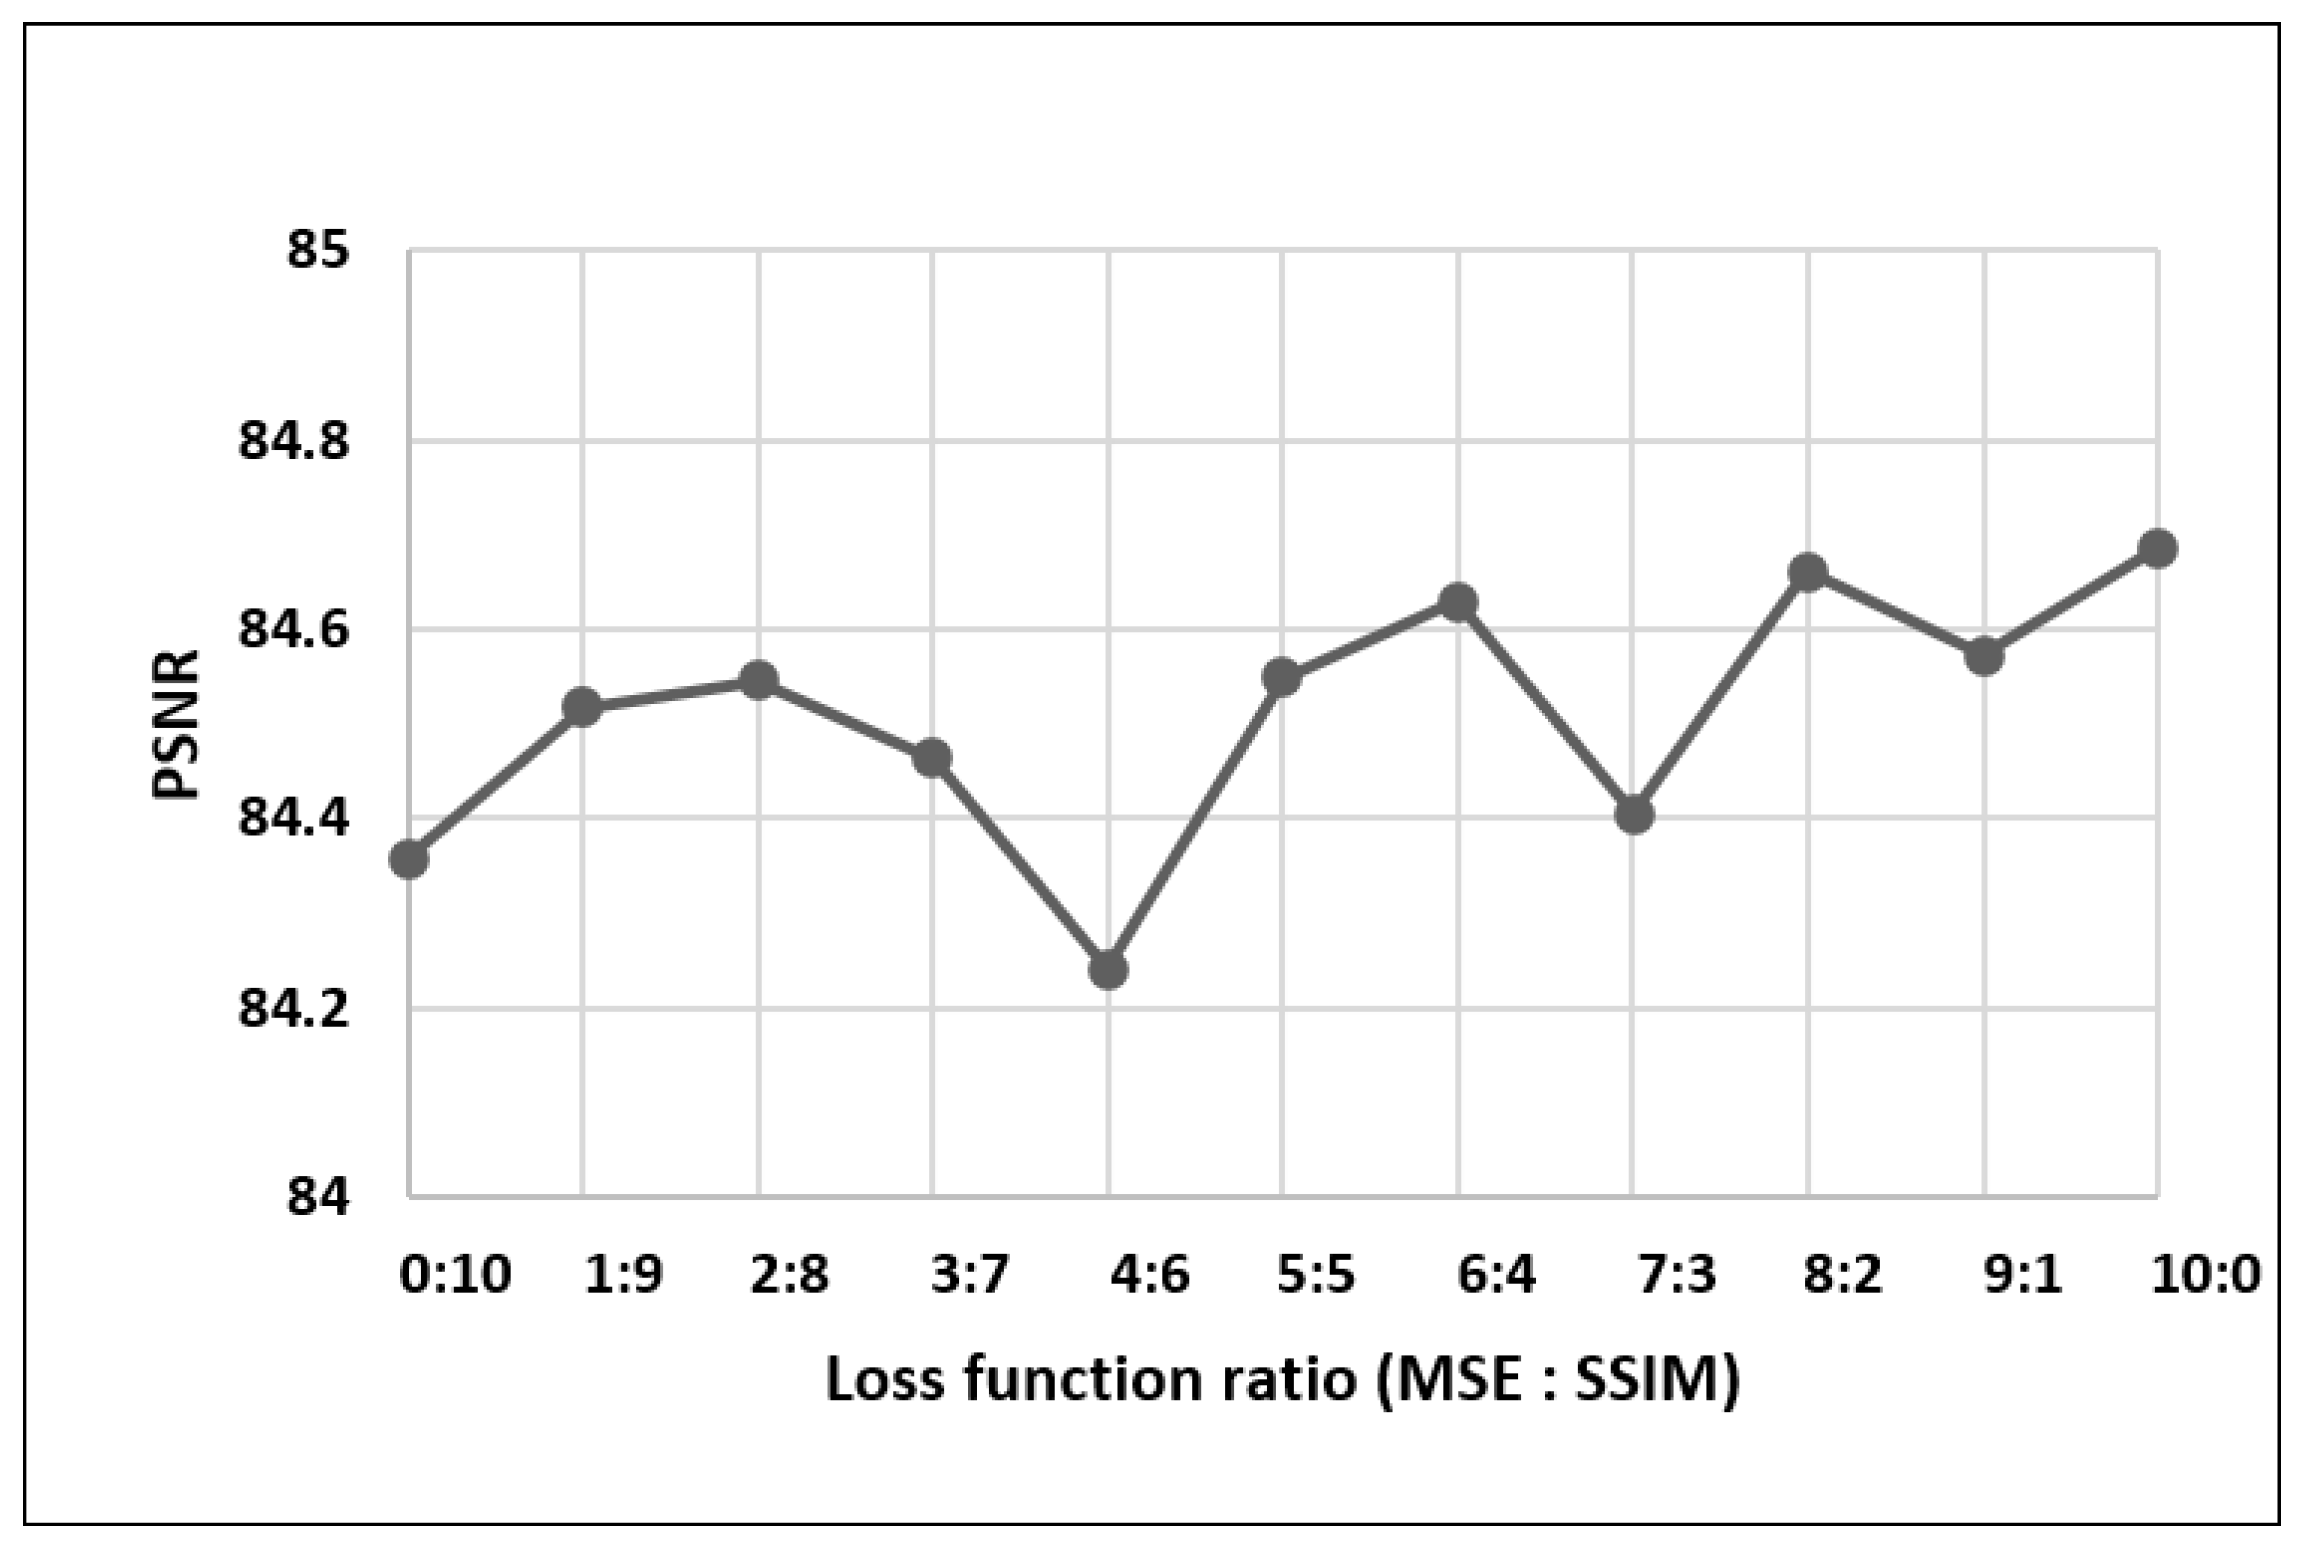
For depth map estimation in 360-degree holographic multi-view content, we adopted the holographic dense depth (HDD) model [4], which utilizes an encoder–decoder architecture optimized for high-precision prediction from object-centered, multi-view RGB inputs. The encoder extracts hierarchical features via convolution and down-sampling, with skip connections using concatenation to preserve spatial information. The decoder reconstructs the depth map by up-sampling the encoded features to match the input resolution. Bilinear interpolation and ReLU activation [29] were employed. The overall architecture of the model is illustrated in Figure 6. For the loss function, we conducted experiments to determine the optimal weighting between Mean Squared Error (MSE) and the Structural Similarity Index (SSIM) [30]. As shown in Figure 7, the model was trained with various coefficient ratios of MSE and SSIM, and performance was assessed using the Peak Signal-to-Noise Ratio (PSNR) [31]. The results revealed that assigning a weight of 100% to MSE and 0% to SSIM achieved the highest PSNR, indicating that MSE alone constitutes the most effective loss function for depth map estimation in our 360-degree holographic content application.

3.3. Process to Optimize Central Angles

The optimization of central angles—the angular separation between adjacent camera viewpoints—was systematically investigated using a stepwise experimental protocol: First, the experiment began with a central angle of 90°, corresponding to n = 2, as shown in Figure 1a. The viewpoints used for training in this case were 0°, 90°, 180°, and 270°. The proposed model was initially trained using four RGB color and depth map pairs, each captured from one of these four viewpoints. Next, depth map estimation was performed for a new set with four other viewpoints (for example, 45°, 135°, 225°, and 315°) using the trained weights. Subsequently, the proposed model was trained with a central angle of 45°, corresponding to n = 3. Eight viewpoints were used for training in this case, after which the proposed model estimated depth maps for eight new viewpoints. In the same manner, the number of viewpoints was increased until n = 9, resulting in 512 viewpoints being used for both training and testing, as the proposed model was trained and evaluated.

4. Experiment Results and Discussion

In our experiments, we progressively increased the number of viewpoints, corresponding to angular intervals of 90°, 45°, 22.5°, 11.25°, 5.63°, 2.81°, 1.41°, and 0.7° (i.e., 4, 8, 16, 32, 64, 128, 256, and 512 viewpoints). While detailed quantitative and qualitative results are presented for representative angles (90°, 11.25°, and 0.7°), all intermediate angles were also evaluated. The results consistently support the overall trend of performance improvement across the full range of angular resolutions.

4.1. Depth Map Estimation Results Comparison

All experiments were conducted on an ASUS ESC8000-G4 (ASUS, Taipei, Taiwan) workstation equipped with eight Nvidia Titan GPUs, providing robust computational resources for large-scale deep learning training and evaluation. Depth map estimation results were compared prior to CGH’s synthesis and reconstruction, as the quality of holographic 3D content depends directly on the accuracy of depth map estimation. The proposed model was separately built according to the number of viewpoints determined by the central angle ( θ n = 360 ° 2 n , where 2 ≤ n ≤ 9, as illustrated in Figure 1). For each configuration, the model was trained using the number of viewpoints according to n and then used to estimate depth maps for new viewpoints which were not used during training. Subsequently, we calculated the mean square error (MSE) between the predicted depth maps and the ground truth [4]. The equation of MSE is given by
M S E = 1 n i = 1 n y i y i 2  
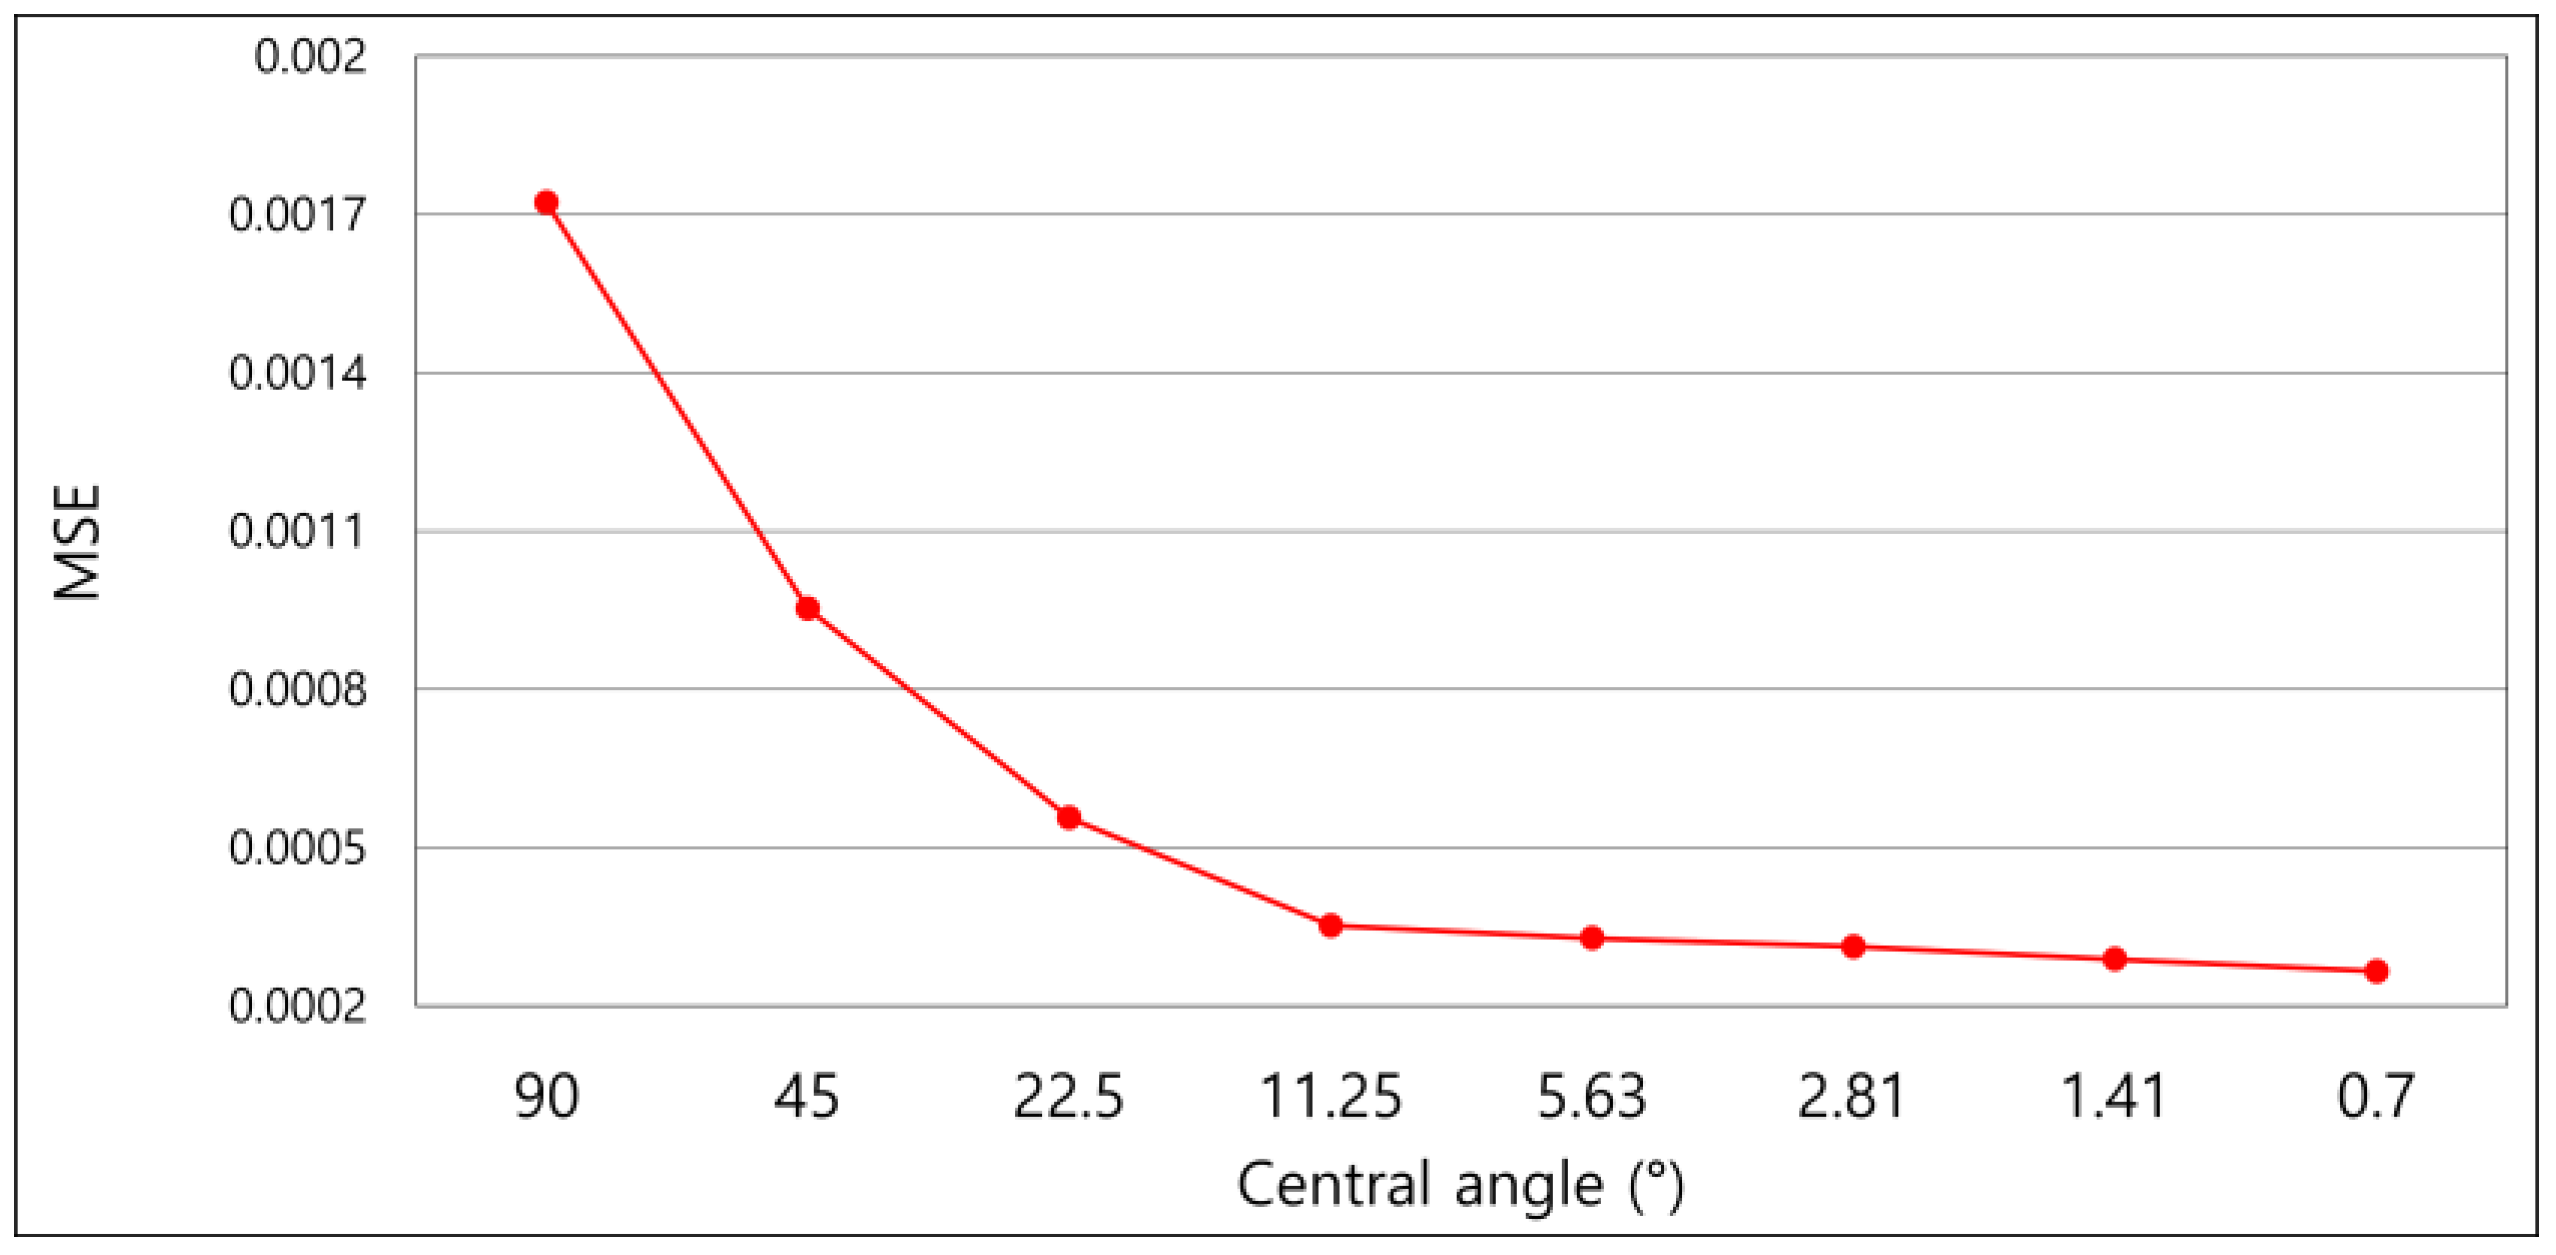
where yi represents the ground truth pixel value, and yi represents the predicted pixel value, and n is the total number of pixels. The trend of MSE with respect to the central angle used for training the proposed model is shown in Figure 8.
As shown in Figure 8, Substantial improvement in depth map estimation was observed (with the MSE reducing by approximately a factor of two at each step) as the central angle decreased from 90° to 45°, and from 45° to 22.5°. Further reduction in the central angle from 22.5° to 11.25° resulted in an additional 1.6-fold decrease in MSE. Beyond this point, improvements in MSE became negligible. Therefore, it can be concluded that when the central angle is below 11.25°, there is limited potential for further performance improvement. To complement the MSE metric, we also used the accuracy (ACC) metric [4,32], which was calculated using both ground truth depth map and estimated depth map. The ACC is defined as
A C C = d I · I d I 2 d I 2
where I is the brightness of the estimated depth map and I′ is the brightness of the ground truth depth map, respectively [4,32]. If the estimation result and ground truth are identical, or I = kI′ (k is positive), then ACC = 1. If there is a mismatch between them, then 0 ≤ ACC < 1. The trend in the average ACC of depth map is shown in Figure 9a.
As shown in Figure 9, a consistent local minimum at 5.63° was observed across all tested object geometries (torus, cube, cone, and sphere) and multiple experimental repetitions, indicating a reproducible phenomenon rather than random variability or object-specific angular overlap. This behavior is attributed to a temporary imbalance in the sampling mechanism, in which the adverse effects of data redundancy and interpolation noise from overly dense viewpoint spacing outweigh the benefits of finer sampling. When the angular interval is further reduced (e.g., to 2.81° or below), the increased sampling density mitigates these negative effects, enabling a recovery and subsequent improvement in performance.
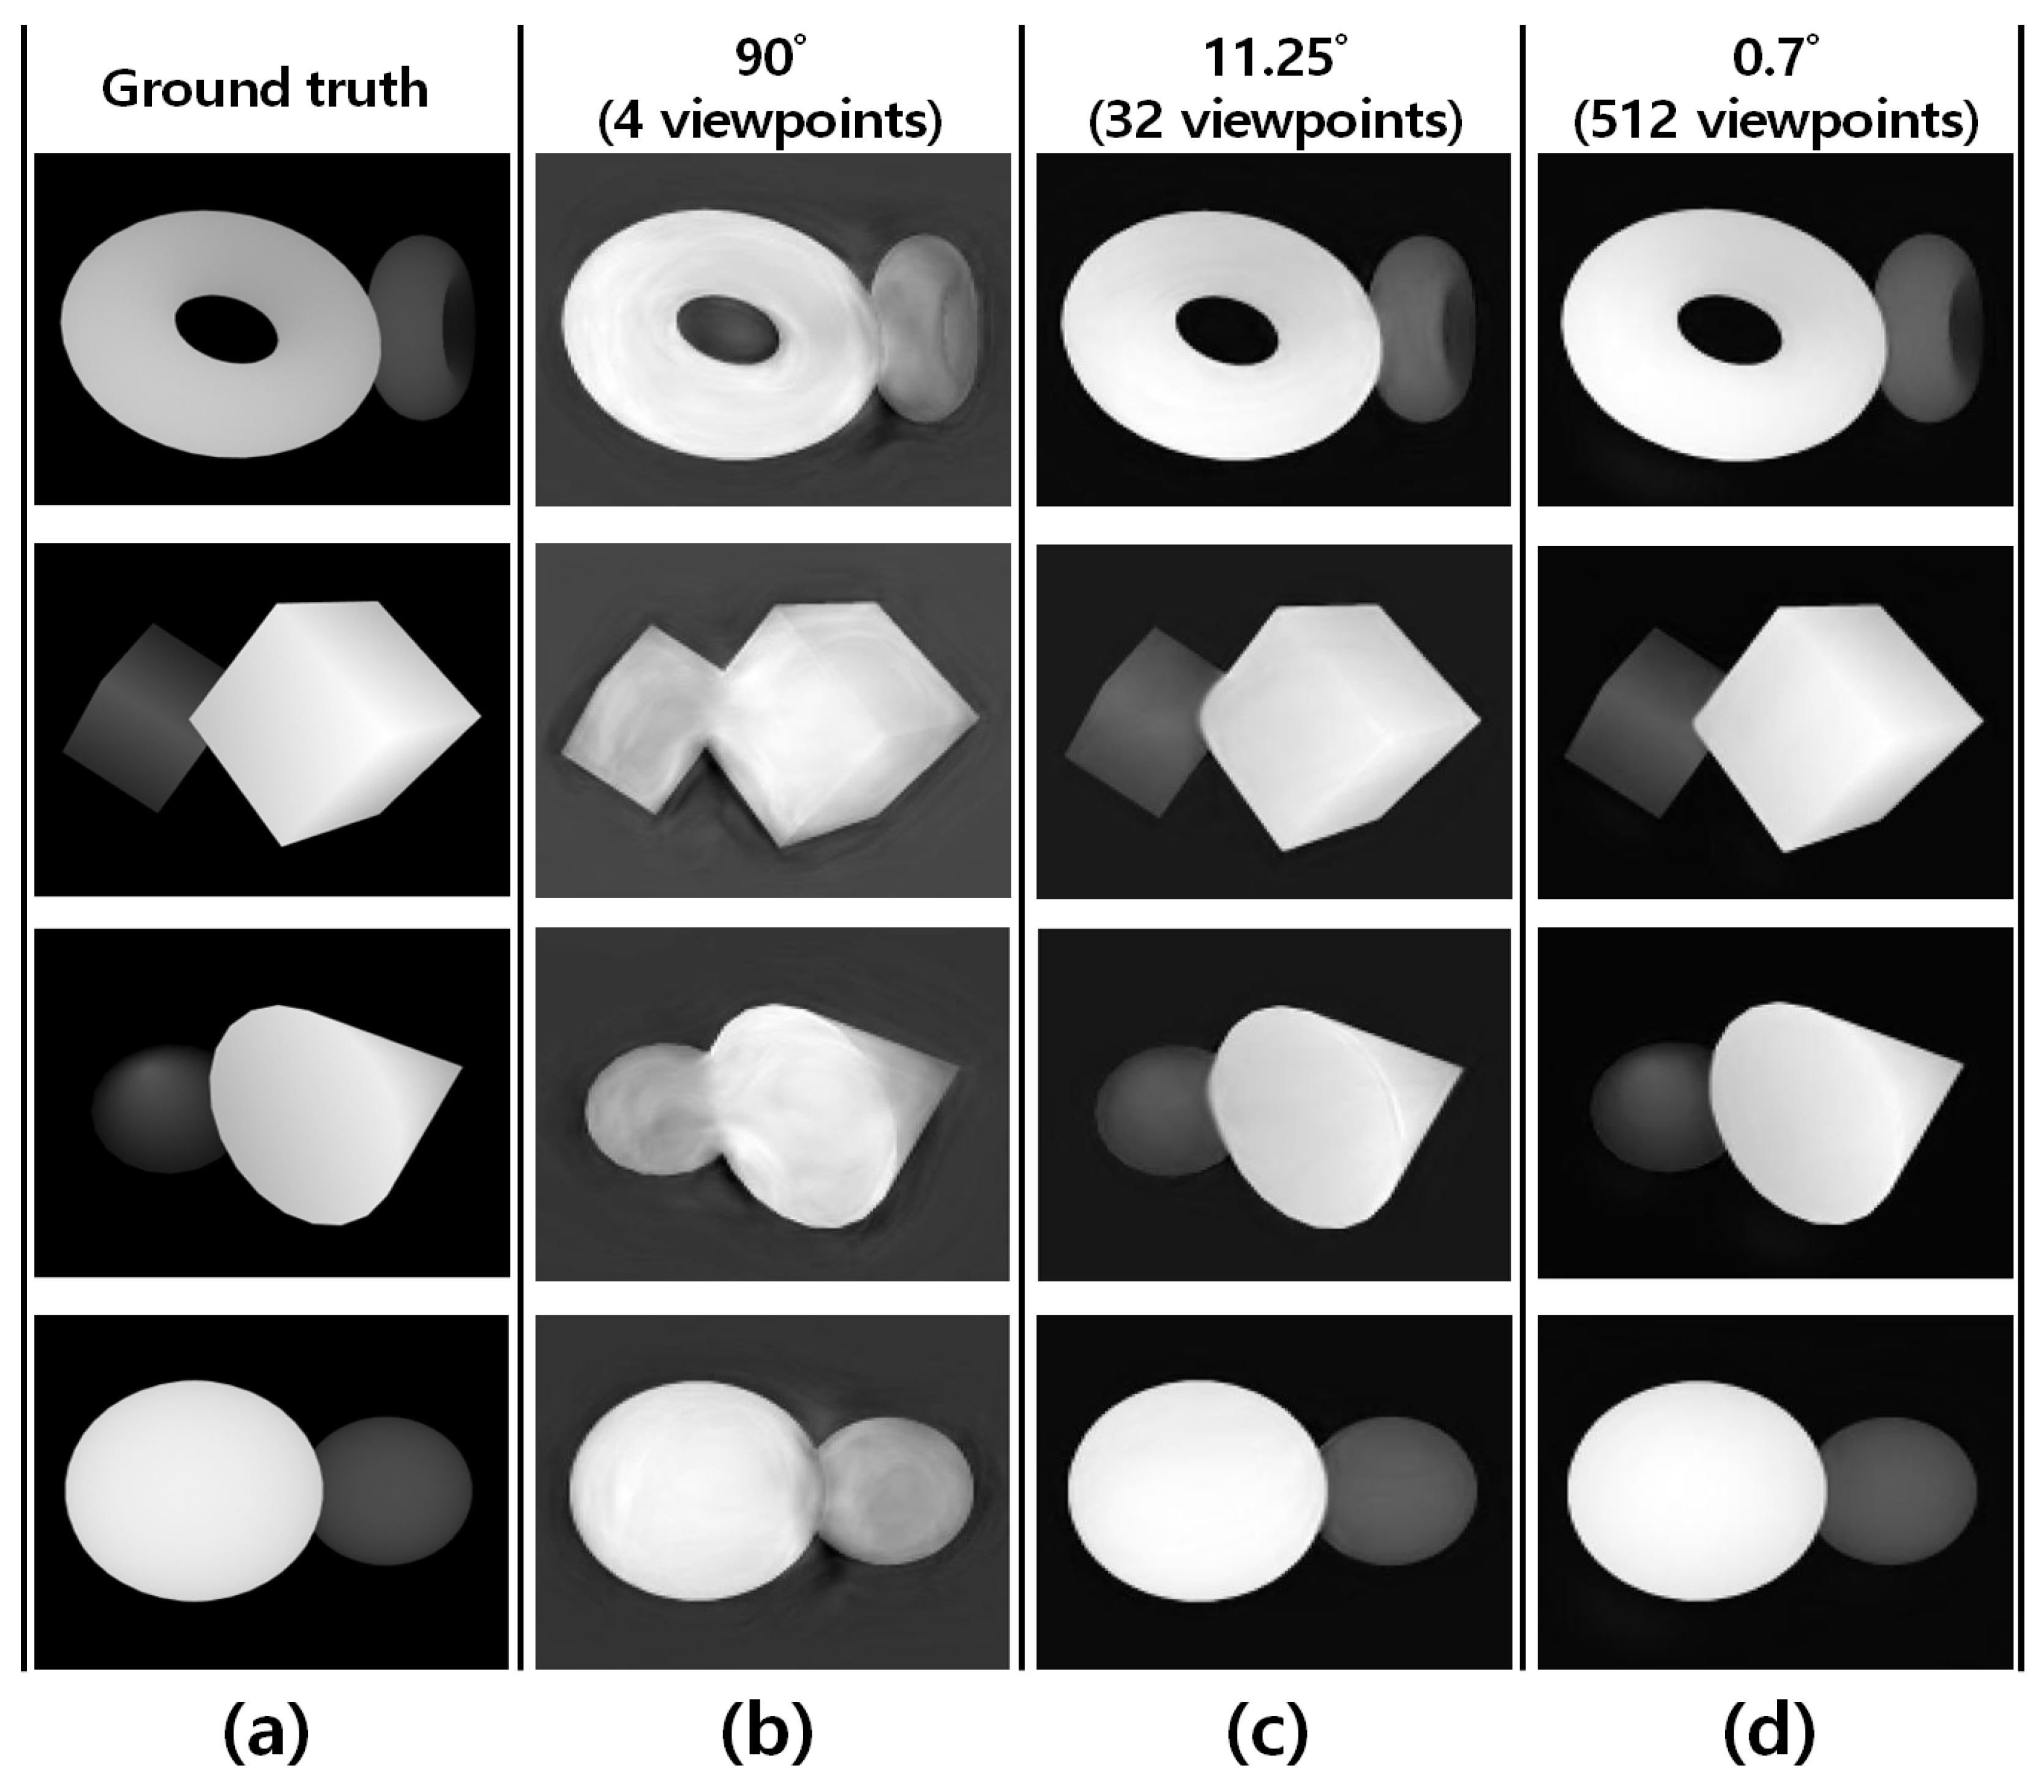
Overall, the results indicate that smaller central angles generally correspond to higher quality in both the estimated depth maps and the reconstructed holographic 3D (H3D) images, with the exception of this local minimum at 5.63°. Beyond approximately 11.25°, however, the rate of improvement tapers off. This trend arises from the relationship between the angular sampling step and the scene geometry, rather than from object-specific dimensions. Although a comprehensive investigation involving significant variations in object size is beyond the present scope—owing to the substantial modifications required in the acquisition setup and preprocessing pipeline—future work will explicitly examine the influence of object linear dimensions on this trade-off. To visually confirm the differences in image quality according to the central angle, qualitative comparison results for depth map estimation are presented for four different types of 3D objects in Figure 10. Quantitative evaluations using MSE and ACC form the analytical foundation of this study, upon which the subsequent visual assessments are built to provide intuitive and empirical support for the findings.
The depth map estimation results of the proposed model trained with a central angle of 90° (Figure 10b) were inaccurate in terms of visual perception. The background and the distance differences between the two objects relative to the camera were not estimated accurately. The boundary between the objects and the background appeared ambiguous, as did the overlapping boundary between the two objects. In contrast, the results of the model trained with a central angle of 11.25° (Figure 10c) showed remarkable improvement compared to the 90° case (Figure 10b), both in background estimation and in the overlapping region. When comparing 11.25° and 0.7°, the results for 11.25° were of slightly lower quality. These findings indicate that a smaller central angle improves the quality of the depth map. Furthermore, using a central angle of 11.25° resulted in significant improvements over 90°, whereas reducing the angle further to 0.7° provided only a relatively minor improvement compared to 11.25°.

4.2. CGH Synthesis and Reconstruction Results Comparison

We synthesized each CGH image from a pair of images consisting of an estimated depth map and an RGB image for each viewpoint. For this study, CGH data were generated using the FFT algorithm [4] and Lee’s encoding scheme [33]. First, the hologram function for each viewpoint was calculated by the FFT algorithm, using an input set comprising an RGB image and a depth map image for each viewpoint. This results in a complex-valued function, which can be expressed as H(x, y) = |H(x, y)|e(x,y), where |H(x, y)| and Φ(x, y) represent the amplitude and phase of the hologram, respectively [4]. Lee’s encoding is then applied to the original hologram to obtain the CGH data, which can be directly displayed on commercial amplitude-modulating devices such as LCD-SLMs and LCOS-SLMs. Lee’s representation of the hologram function can be written as
H ( x ,   y ) = m = 1 4 L m ( x ,   y ) e i Φ m = L 1 ( x ,   y ) e i 0 + L 2 ( x ,   y ) e i π / 2 + L 3 ( x ,   y ) e i π + L 4 ( x ,   y ) e i 3 π / 2
where each Lm(x, y) is a non-negative, real-valued coefficient [4,32]. Each image set used for depth map estimation in the proposed model was initially created with a resolution of 640 × 360 pixels. To ensure compatibility with practical holographic 3D applications—such as commercial spatial light modulator (SLM) models with 4K (3840 × 2160) resolution—we subsequently upscaled each image to 4K resolution before generating its digital hologram fringe pattern (CGH) [4]. To evaluate the quality of the reconstructed H3D images, we used the ACC metric, which was calculated by comparing a reconstructed H3D image generated from the ground truth depth map with one generated from the estimated depth map [32]. The ACC is defined as
A C C = r , g , b I · I r , g , b I 2 r , g , b I 2
where I is the brightness of the reconstructed H3D image from the estimated depth map, and I′ is the brightness of the reconstructed H3D image from the ground truth depth map, respectively [4,32]. If the estimation result and ground truth are identical, or I = kI′ (for k > 0), then ACC = 1. If there is a mismatch between them, then 0 ≤ ACC < 1. The results are shown in Figure 9b.
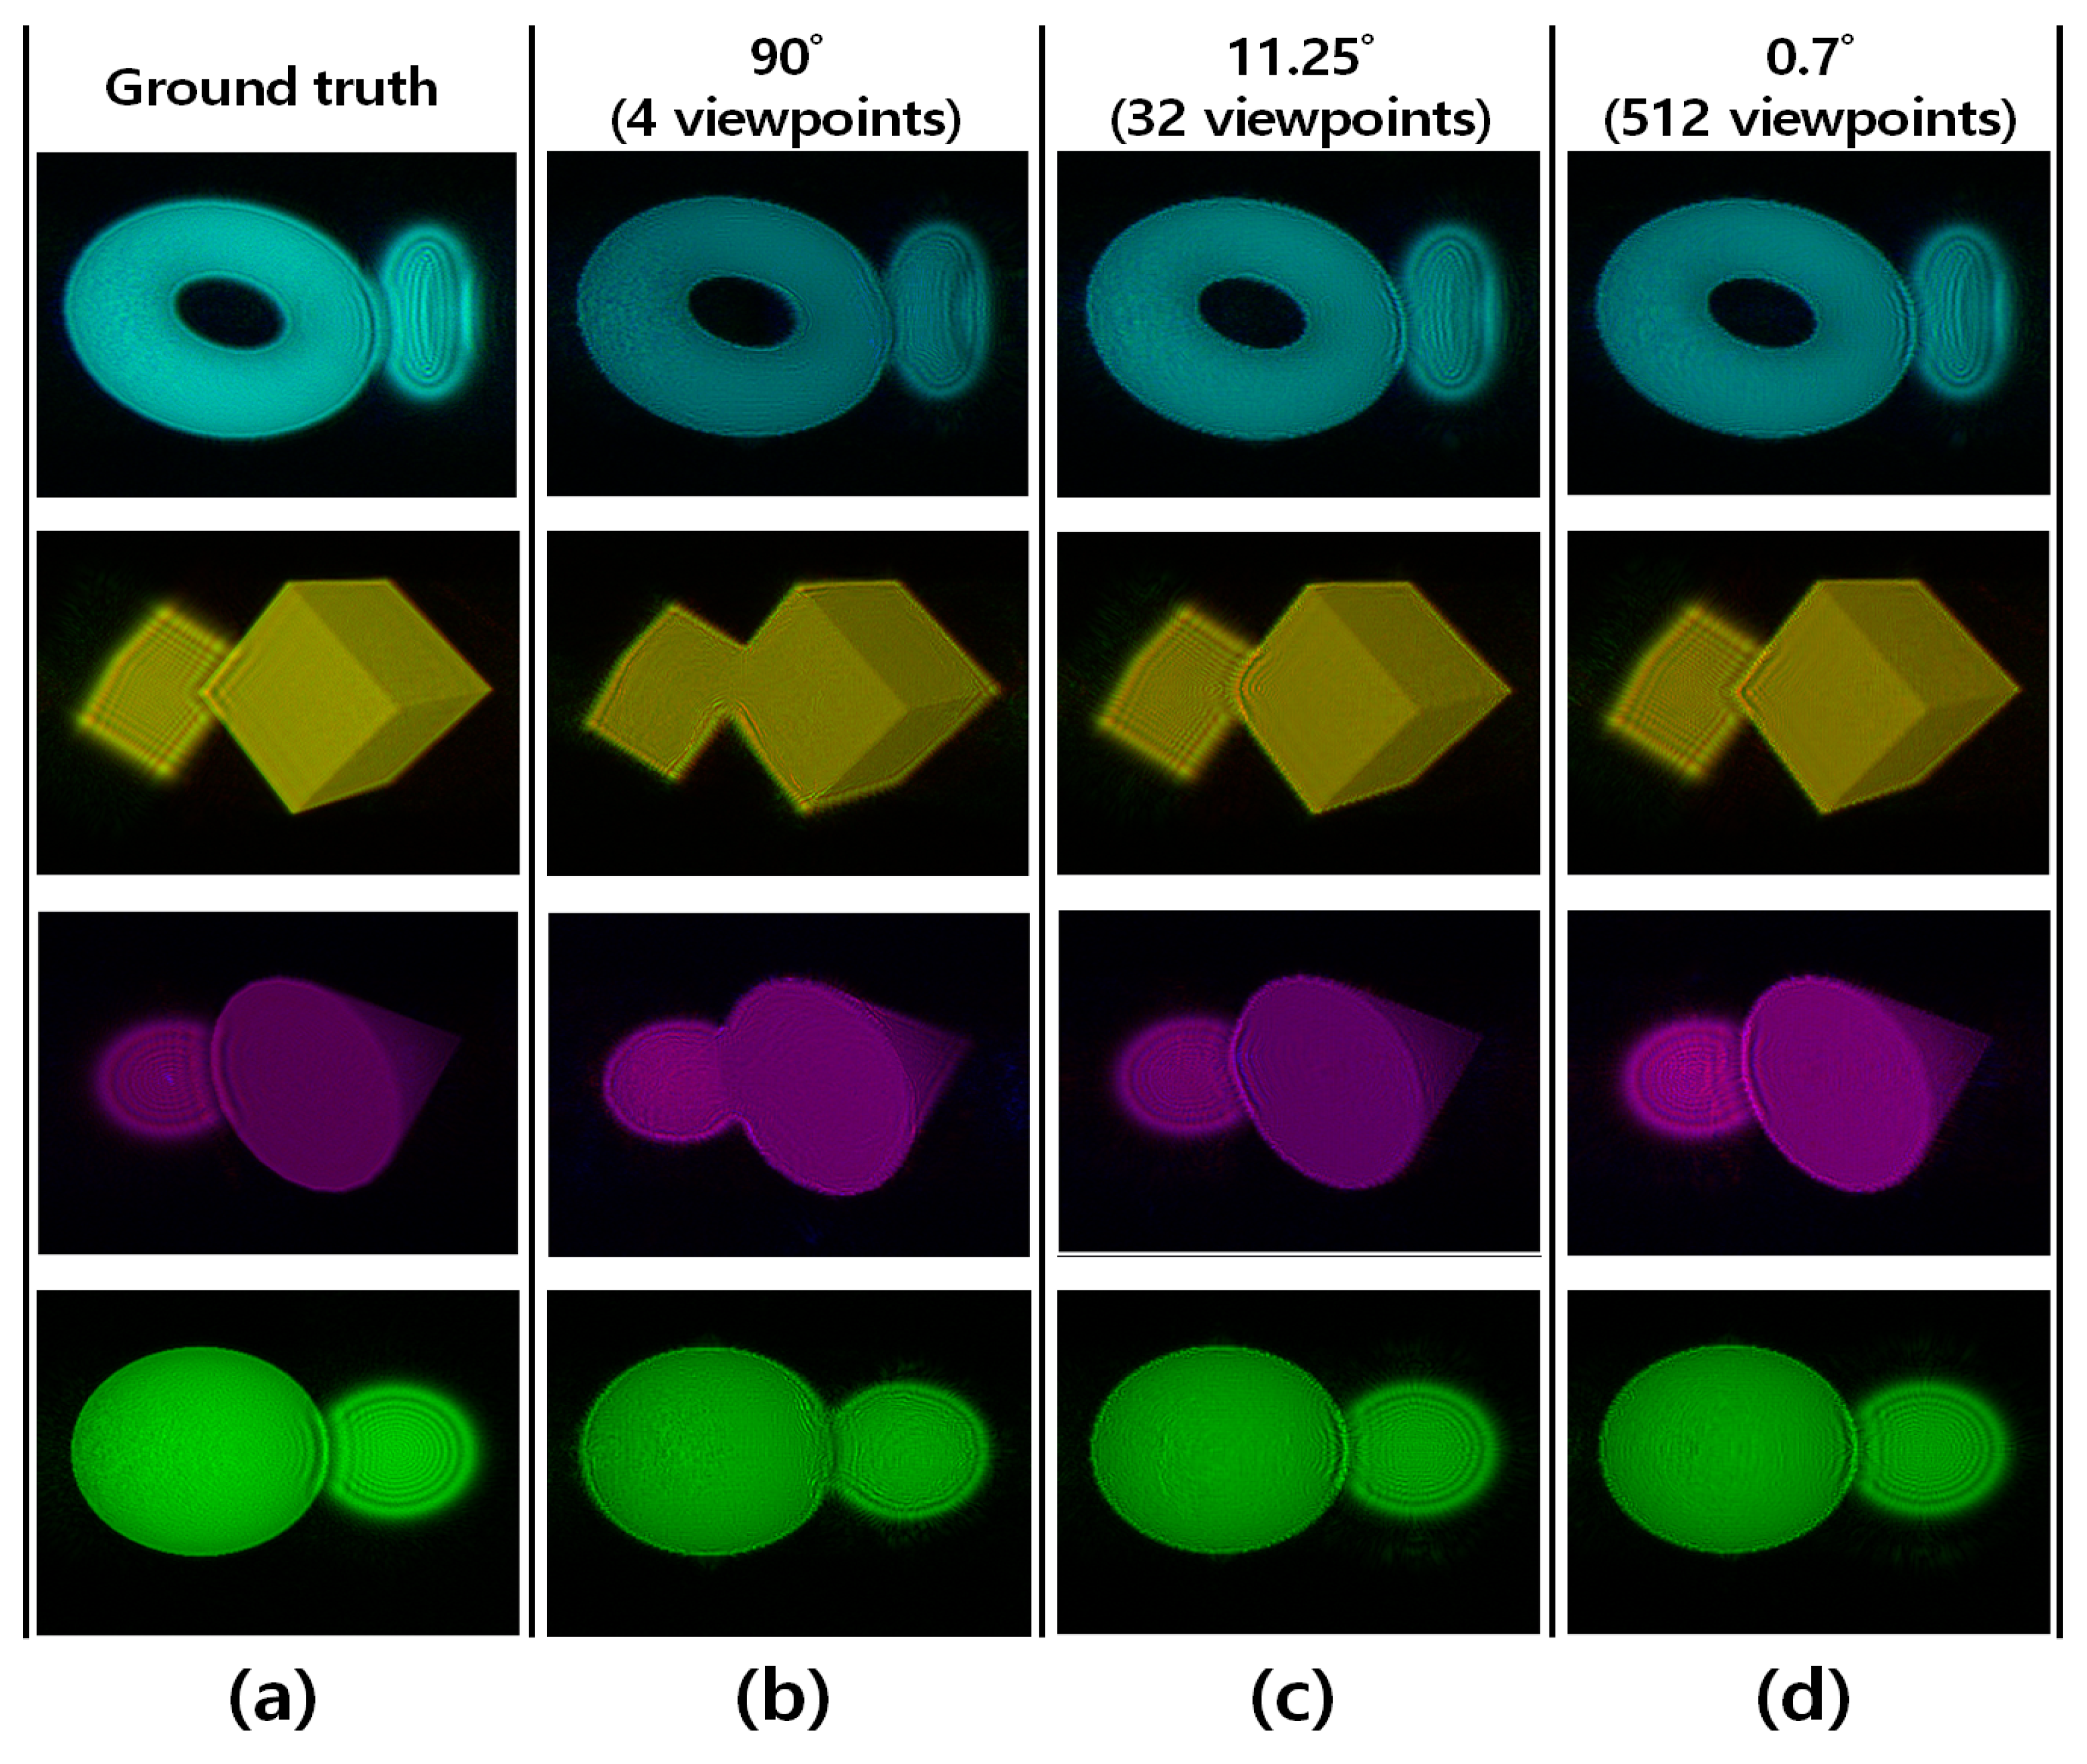
As shown in Figure 9b, we also obtained results for reconstructed H3D image comparisons that were similar to the ACC trends observed in depth map estimation. For all types of 3D shapes used, the ACC increased as the central angle decreased, reaching a maximum at 11.25°, then dropped at 5.63°, and subsequently increased again. This trend was consistent for both depth maps and reconstructed H3D images. In general, a smaller central angle leads to greater improvements in the quality of depth map estimation for 360-degree holographic content. The ACC values for both the estimated depth maps and the reconstructed H3D images increased as the central angle decreased, except for a local minimum at 5.63°. However, once the central angle passed 11.25°, the rate of improvement diminished. To visually confirm the differences associated with various central angles, qualitative comparison of reconstructed H3D images are presented in Figure 11 and Figure 12.
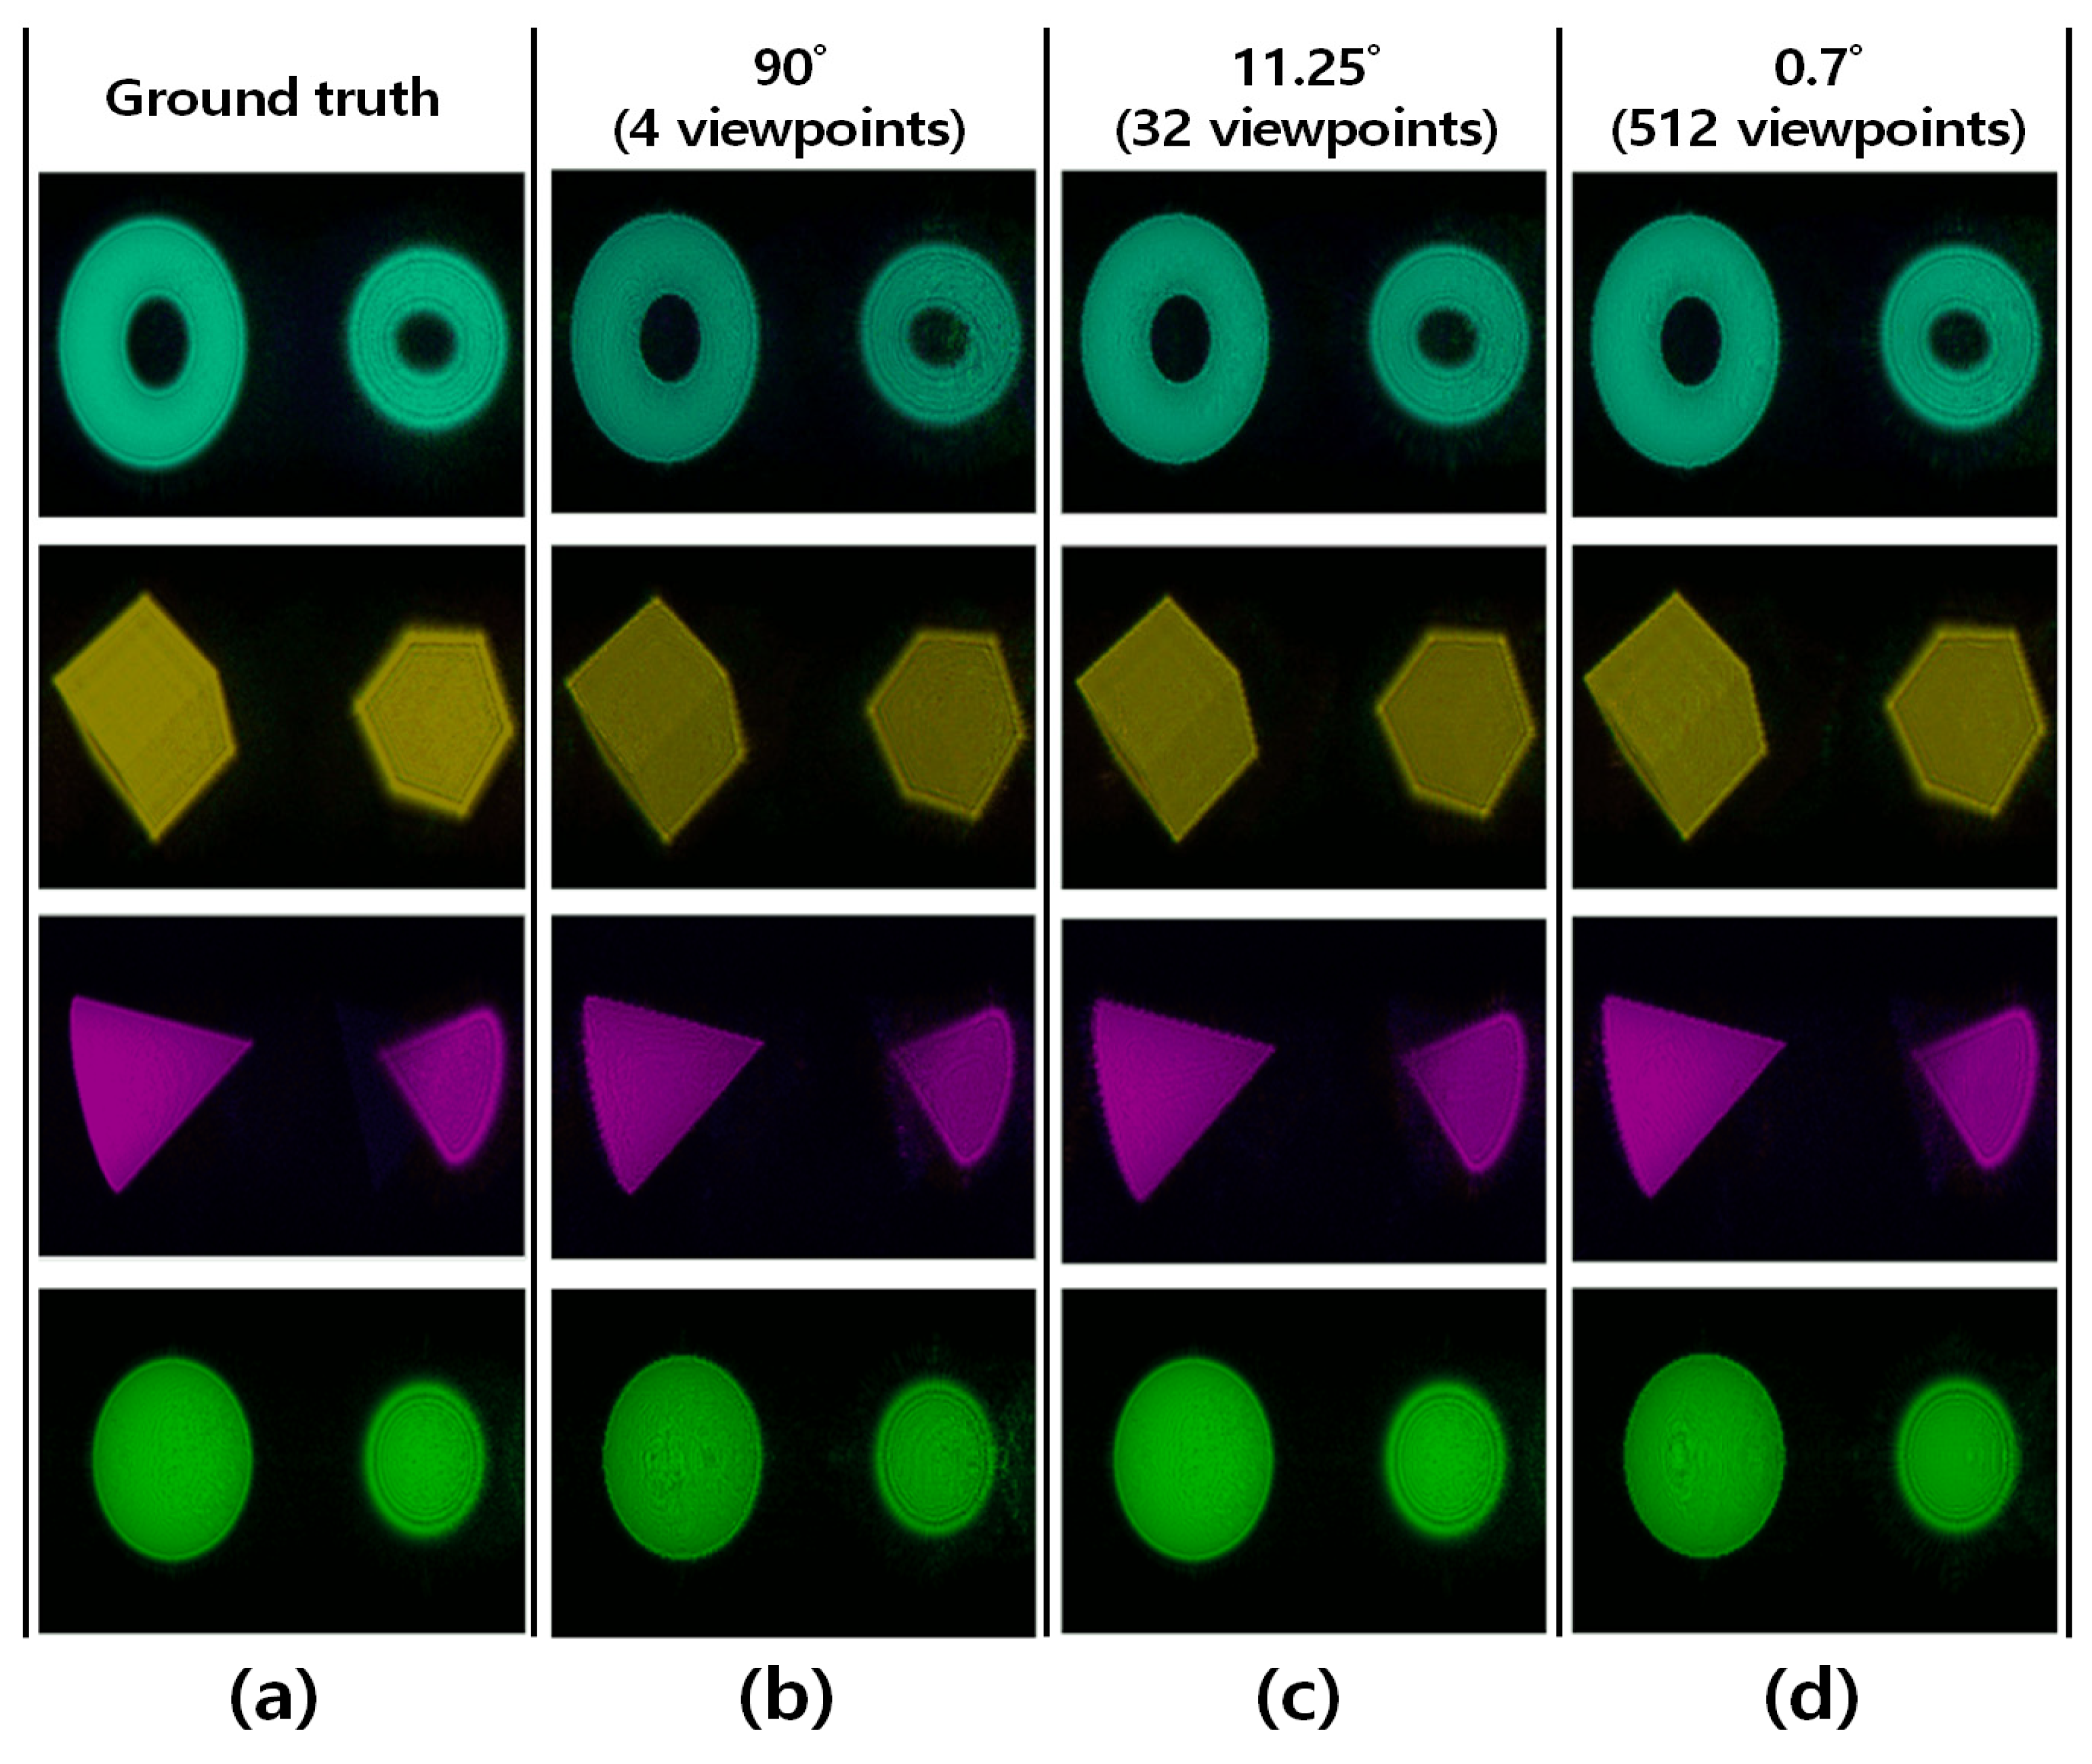
In principle, the observation of depth differences is a critical aspect of holographic 3D images [4]. When an observation camera is focused on an object positioned in the foreground, that object appears sharp, while the object behind it appears blurry. In this study, we conducted experiments to numerically reconstruct holographic 3D images from CGHs and identified three dominant qualitative characteristics, as illustrated in Figure 11. First, the reconstruction result using data from the model trained with a central angle of 90° (Figure 11b) shows that, even when focusing on either the foreground or background object, sharpness and blurring—i.e., the accommodation effect—cannot be distinguished. Additionally, the boundary at the overlap between the two objects is not accurately rendered. Second, the reconstruction result obtained from the model trained with a central angle of 0.7° (Figure 11d) is closest to the ground truth (Figure 11a). Third, the model trained with a central angle of 11.25° (Figure 11c) demonstrates a sufficient accommodation effect. Notably, the quality of the reconstructed image under the 11.25° condition (Figure 11c) is quite similar to that of the 0.7° condition (Figure 11d). Similar behaviors can also be observed in Figure 12, consistent with the findings in Figure 11.
In terms of image quality, as evaluated by depth map estimation and CGH’s reconstruction, the proposed model trained with a central angle of 0.7° achieves the best results. However, when considering both the efficiency of data preparation and the computational cost required for real-time display of holographic 3D content, the model trained with a central angle of 11.25° offers a more practical solution. This configuration enables users to experience 360-degree holographic 3D movies with high-quality images in real time. Table 2 presents the computational time required for depth map learning, CGH’s generation, and CGH’s reconstruction for each central angle used during training. The depth map learning time (T) is defined as
T = τ × β × ε
where τ is the time per batch, β is the number of batches, and ε is the number of epochs.
The number of epochs required for effective loss reduction is influenced by the choice of central angle. The proposed model trained with central angles in the range of 11.25° to 0.7° required fewer epochs than those trained with central angles between 90° and 22.5°. Specifically, the model trained at a central angle of 11.25° required only half the training time of the model trained at 5.63°, resulting in a substantial reduction in computational effort. Furthermore, the 11.25° configuration yielded a training time approximately fifteen times shorter—saving about two hours—compared to the model trained at 0.7°. As indicated in Table 2, the model trained with smaller central angles (5.63° and 0.7°) required significantly greater computational times for both CGH’s synthesis and CGH’s reconstruction. Therefore, when considering both the quality of holographic 3D images and the overall content preparation time, setting the central angle to 11.25° emerges as the most practical and efficient choice for real-world 360-degree holographic content applications.

5. Conclusions

This study presented a deep learning-based framework for determining the optimal geometric arrangement of RGB–depth map pairs in an object-centered environment, with the goal of producing cost-effective and photorealistic 360-degree holographic video content. Through combined quantitative and qualitative analyses, we found that a central angle of 11.25° offers the best compromise between image quality and computational cost. Holographic 3D content reconstructed at this interval maintained sufficient visual fidelity for practical applications, including holographic video displays, extended reality (XR) glasses, and immersive media platforms. Furthermore, this work establishes a quantitative benchmark and an optimization strategy for selecting central angles between adjacent viewpoints, thereby advancing the development of hyper-realistic, immersive holographic 3D content generation.
While 11.25° was identified as the optimal condition, a consistent local minimum in performance was observed at 5.63° across all tested object geometries, caused by the interplay between viewpoint redundancy and interpolation noise. This finding demonstrates that finer angular intervals do not necessarily ensure higher reconstruction quality, underscoring a nontrivial trade-off that merits further investigation.
Future research will refine this analysis by examining the optimal angular range between 11.25° and 0.7°, and by assessing the influence of varying object dimensions on the sampling mechanism. In addition, we plan to explore adaptive viewpoint selection strategies responsive to scene geometry, as well as alternative model architectures—such as transformer-based designs—to further enhance the accuracy and scalability of depth estimation.

Author Contributions

Conceptualization, H.K. and M.Y.; methodology, H.K. and C.K.; software, H.K. and Y.L.; validation, H.K., Y.L., M.Y. and C.K.; formal analysis, Y.L.; investigation, H.K.; resources, H.K.; data curation, H.K. and M.Y.; writing—original draft preparation, Y.L.; writing—review and editing, Y.L. and M.Y.; visualization, H.K.; supervision, C.K. and M.Y.; project administration, M.Y.; funding acquisition, C.K. All authors have read and agreed to the published version of the manuscript.

Funding

This work was supported by the National Research Foundation of Korea (NRF) grant funded by the Korea government (MSIT) (RS-2023-00253739).

Data Availability Statement

The datasets prepared for the current study are not publicly available since they are under license permitted only within the current study, but they could be available from the corresponding author upon reasonable request.

Conflicts of Interest

Author Cheongwon Kim was employed by the Heerae Corporation. The remaining authors declare that the research was conducted in the absence of any commercial or financial relationships that could be construed as a potential conflict of interest.

Abbreviations

The following abbreviations are used in this manuscript:
CGHComputer-Generated Hologram
3DThree-Dimensional
H3DHolographic Three-Dimensional
CNNConvolutional Neural Network
HDDHolographic Dense Depth
MSEMean Squared Error
GPUGraphics Processing Unit
ACCAccuracy
XRExtended Reality
ARAugmented Reality

References

  1. Shi, L.; Li, B.; Kim, C.; Kellnhofer, P.; Matusik, W. Towards real-time photorealistic 3D holography with deep neural networks. Nature 2021, 591, 234–239. [Google Scholar] [CrossRef] [PubMed]
  2. Park, S.M.; Kim, Y.G. A metaverse: Taxonomy, components, applications, and open challenges. IEEE Access 2022, 10, 4209–4251. [Google Scholar] [CrossRef]
  3. Mozumder, M.; Theodore, A.; Athar, A.; Kim, H. The metaverse applications for the finance industry, its challenges, and an approach for the metaverse finance industry. In Proceedings of the 2023 25th International Conference on Advanced Communication Technology (ICACT), Pyeongchang, Republic of Korea, 19–22 February 2023; pp. 407–410. [Google Scholar]
  4. Lee, H.; Kim, H.; Jun, T.; Son, W.; Kim, C.; Yoon, M. Hybrid Approach of Holography and Augmented-Reality Reconstruction Optimizations for Hyper-Reality Metaverse Video Applications. IEEE Trans. Broadcast. 2023, 69, 916–926. [Google Scholar] [CrossRef]
  5. Shin, S.; Eun, J.; Lee, S.; Lee, C.; Hugonnet, H.; Yoon, D.; Park, Y. Tomographic measurement of dielectric tensors at optical frequency. Nat. Mater. 2022, 21, 317–324. [Google Scholar] [CrossRef] [PubMed]
  6. Kim, H.; Jun, T.; Lee, H.; Chae, B.G.; Yoon, M.; Kim, C. Deep-learning based 3D birefringence image generation using 2D multi-view holographic images. Sci. Rep. 2024, 14, 9879. [Google Scholar] [CrossRef] [PubMed]
  7. Haleem, A.; Javaid, M.; Singh, R.; Suman, R.; Rab, S. Holography and its applications for industry 4.0: An overview. Internet Things Cyber-Phys. Syst. 2022, 2, 42–48. [Google Scholar] [CrossRef]
  8. Zhong, C.; Sang, X.; Yan, B.; Li, H.; Chen, D.; Qin, X. Real-time realistic computer-generated hologram with accurate depth precision and a large depth range. Opt. Express 2022, 30, 40087–40100. [Google Scholar] [CrossRef] [PubMed]
  9. Eigen, D.; Puhrsch, C.; Fergus, R. Depth map prediction from a single image using a multi-scale deep network. Adv. Neural Inf. Process. Syst. 2014, 27, 2366–2374. [Google Scholar]
  10. Li, B.; Shen, C.; Dai, Y.; Van Den Hengel, A.; He, M. Depth and surface normal estimation from monocular images using regression on deep features and hierarchical CRFs. In Proceedings of the IEEE Conference on Computer Vision and Pattern Recognition, Boston, MA, USA, 7–12 June 2015; pp. 1119–1127. [Google Scholar]
  11. Liu, F.; Shen, C.; Lin, G.; Reid, I. Learning depth from single monocular images using deep convolutional neural fields. IEEE Trans. Pattern Anal. Mach. Intell. 2015, 38, 2024–2039. [Google Scholar] [CrossRef] [PubMed]
  12. Wang, P.; Shen, X.; Lin, Z.; Cohen, S.; Price, B.; Yuille, A. Towards unified depth and semantic prediction from a single image. In Proceedings of the IEEE Conference on Computer Vision and Pattern Recognition, Boston, MA, USA, 7–12 June 2015; pp. 2800–2809. [Google Scholar]
  13. Lore, K.; Reddy, K.; Giering, M.; Bernal, E. Generative adversarial networks for depth map estimation from RGB video. In Proceedings of the IEEE/CVF Conference on Computer Vision and Pattern Recognition Workshops, Salt Lake City, UT, USA, 18–22 June 2018; pp. 1177–1185. [Google Scholar]
  14. Aleotti, F.; Tosi, F.; Poggi, M.; Mattoccia, S. Generative adversarial networks for unsupervised monocular depth prediction. In Proceedings of the European Conference on Computer Vision (ECCV) Workshops, Munich, Germany, 8–14 September 2018. [Google Scholar]
  15. Ronneberger, O.; Fischer, P.; Brox, T. U-net: Convolutional networks for biomedical image segmentation. In Proceedings of the International Conference on Medical Image Computing and Computer-Assisted Intervention, Munich, Germany, 5–9 October 2015; Springer: Cham, Switzerland; pp. 234–241. [Google Scholar]
  16. Alhashim, I.; Wonka, P. High quality monocular depth estimation via transfer learning. arXiv 2018, arXiv:1812.11941. [Google Scholar]
  17. Zhou, T.; Brown, M.; Snavely, N.; Lowe, D. Unsupervised learning of depth and ego-motion from video. In Proceedings of the IEEE Conference on Computer Vision and Pattern Recognition, Honolulu, HI, USA, 21–26 July 2017; pp. 1851–1858. [Google Scholar]
  18. Yang, Z.; Wang, P.; Xu, W.; Zhao, L.; Nevatia, R. Unsupervised learning of geometry with edge-aware depth-normal consistency. arXiv 2017, arXiv:1711.03665. [Google Scholar] [CrossRef]
  19. Alagoz, B. Obtaining depth maps from color images by region based stereo matching algorithms. arXiv 2008, arXiv:0812.1340. [Google Scholar]
  20. Joung, S.; Kim, S.; Ham, B.; Sohn, K. Unsupervised stereo matching using correspondence consistency. In Proceedings of the 2017 IEEE International Conference on Image Processing (ICIP), Beijing, China, 17–20 September 2017; pp. 2518–2522. [Google Scholar]
  21. Garg, R.; Bg, V.; Carneiro, G.; Reid, I. Unsupervised CNN for single view depth estimation: Geometry to the rescue. In Proceedings of the European Conference on Computer Vision–ECCV 2016, Amsterdam, The Netherlands, 11–14 October 2016; Springer: Cham, Switzerland, 2016; pp. 740–756. [Google Scholar]
  22. Luo, Y.; Ren, J.; Lin, M.; Pang, J.; Sun, W.; Li, H.; Lin, L. Single view stereo matching. In Proceedings of the IEEE Conference on Computer Vision and Pattern Recognition, Salt Lake City, UT, USA, 18–23 June 2018; pp. 155–163. [Google Scholar]
  23. Wu, Z.; Wu, X.; Zhang, X.; Wang, S.; Ju, L. Spatial correspondence with generative adversarial network: Learning depth from monocular videos. In Proceedings of the IEEE/CVF International Conference on Computer Vision, Seoul, Republic of Korea, 27 October–2 November 2019; pp. 7494–7504. [Google Scholar]
  24. Shekhar, S.; Xiong, H. Encyclopedia of GIS; Springer Science & Business Media: Berlin/Heidelberg, Germany, 2007. [Google Scholar]
  25. Pei, Z.; Wen, D.; Zhang, Y.; Ma, M.; Guo, M.; Zhang, X.; Yang, Y. MDEAN: Multi-view disparity estimation with an asymmetric network. Electronics 2020, 9, 924. [Google Scholar] [CrossRef]
  26. Zioulis, N.; Karakottas, A.; Zarpalas, D.; Alvarez, F.; Daras, P. Spherical view synthesis for self-supervised 360 depth estimation. In Proceedings of the 2019 International Conference on 3D Vision (3DV), Quebec City, QC, Canada, 16–19 September 2019; pp. 690–699. [Google Scholar]
  27. Feng, Q.; Shum, H.; Shimamura, R.; Morishima, S. Foreground-aware dense depth estimation for 360 images. J. WSCG 2020, 28, 79–88. [Google Scholar] [CrossRef]
  28. Autodesk Maya. 2025. Available online: https://www.autodesk.com/products/maya/overview (accessed on 11 July 2025).
  29. Nair, V.; Hinton, G.E. Rectified linear units improve restricted boltzmann machines. In Proceedings of the 27th International Conference on Machine Learning (ICML-10), Haifa, Israel, 21–24 June 2010; pp. 807–814. [Google Scholar]
  30. Wang, Z.; Bovik, A.C.; Sheikh, H.R.; Simoncelli, E.P. Image quality assessment: From error visibility to structural similarity. IEEE Trans. Image Process. 2004, 13, 600–612. [Google Scholar] [CrossRef] [PubMed]
  31. Hore, A.; Ziou, D. Image quality metrics: PSNR vs. SSIM. In Proceedings of the 2010 20th International Conference on Pattern Recognition, Istanbul, Turkey, 23–26 August 2010; pp. 2366–2369. [Google Scholar]
  32. Hossein Eybposh, M.; Caira, N.; Atisa, M.; Chakravarthula, P.; Pégard, N. DeepCGH: 3D computer-generated holography using deep learning. Opt. Express 2020, 28, 26636–26650. [Google Scholar] [CrossRef] [PubMed]
  33. Lee, W. Sampled Fourier transform hologram generated by computer. Appl. Opt. 1970, 9, 639–643. [Google Scholar] [CrossRef] [PubMed]
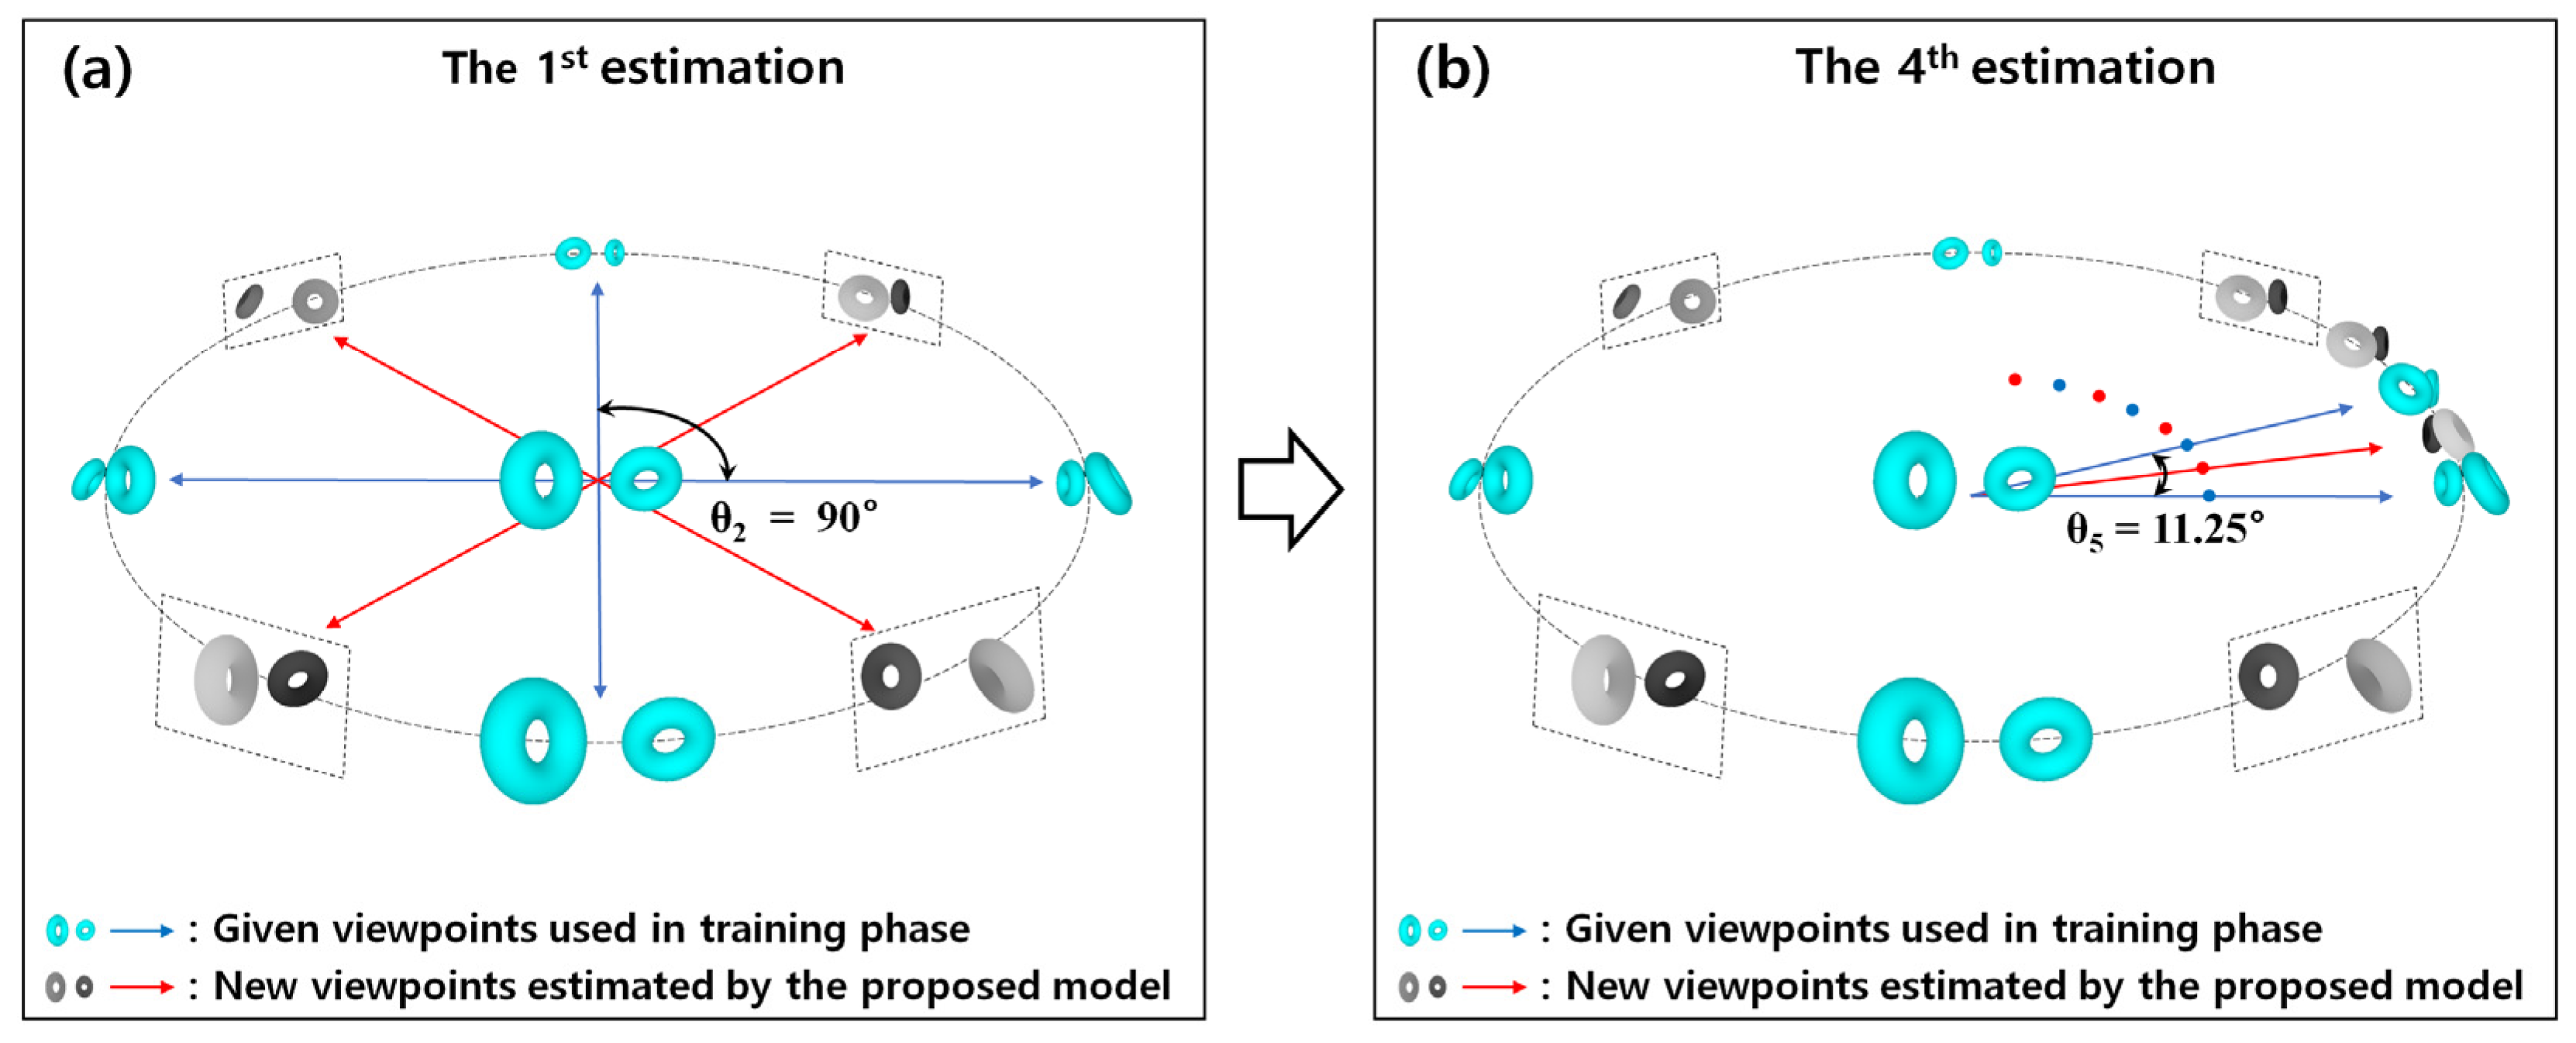
Figure 1. Schematic illustration of the 360-degree multi-view acquisition process in an object-centered environment, as utilized in the proposed deep learning framework. The model is initially trained on 2n evenly distributed viewpoints (indicated by blue lines or dots), corresponding to central angles defined by θ n = 360 2 n , where 2 ≤ n ≤ 9 (n is a natural number). Following training, the proposed model estimates depth maps for 2n novel viewpoints (represented by red lines or dots) interleaved between the original positions. (a) Example for n = 2, or central angle θ2 = 90°: The proposed model is trained on 4 viewpoints and estimates 4 additional intermediate viewpoints. (b) Example for n = 5, or central angle θ5 = 11.25°: The proposed model is trained on 32 viewpoints and estimates depth maps for 32 new positions. This process demonstrates the progressive refinement of viewpoint sampling for high-fidelity 360-degree holographic 3D content generation.
Applsci 15 09465 g001
Figure 2. Difference between (a) camera-centered environment and (b) object-centered environment. In the camera-centered environment, this setup inherently limits the acquisition of comprehensive RGB–depth data for all possible object directions. In contrast, the object-centered environment enables the systematic capture of RGB–depth map pairs from all possible directions around the object. This comprehensive data acquisition is more suitable for 360-degree holographic content.
Applsci 15 09465 g002
Figure 3. A 360-degree holographic 3D content representation via multiple-viewpoint depth map estimation. (a) Single viewpoint case: Only the user at viewpoint a can observe the holographic content, as it is impossible to view the holographic content from positions where the depth map is missing. (b) Multiple viewpoints case: All users (a, b, c, and d), regardless of viewpoint, can observe the holographic content because depth maps have been acquired for all viewpoints.
Applsci 15 09465 g003
Figure 4. Geometry of the data acquisition conditions for RGB and depth map images from a pair of 3D objects. (A) Distance from virtual camera to 255 depth. (B) Margin from depth boundary to object. (C) Distance from virtual camera to 0 depth. (D) Distance between two objects (center to center). (E) Distance from 0 depth to 255 depth.
Applsci 15 09465 g004
Figure 5. Representative data sets utilized in the experiment. (a) Four distinct 3D object types—torus, cube, cone, and sphere—were designed to create comprehensive 360-degree, multi-view datasets for the proposed framework. (b) Example of a typical dataset (torus case): For each set, both an RGB image and a corresponding depth map were systematically captured at each viewpoint along a circular trajectory, ensuring uniform angular sampling around the torus objects [4]. In the illustrated case, the virtual camera acquired images at rotational angles of 0°, 72°, 144°, 216°, and 288°, respectively.
Applsci 15 09465 g005
Figure 6. Architecture of the proposed holographic dense depth (HDD) model, featuring a U-Net style encoder–decoder structure with skip connections implemented via concatenation, designed for depth map estimation.
Applsci 15 09465 g006
Figure 7. Peak Signal-to-Noise Ratio (PSNR) performance for various coefficient ratios of Mean Squared Error (MSE) and Structural Similarity Index (SSIM) in the loss function. The highest performance was observed with 100% MSE and 0% SSIM.
Applsci 15 09465 g007
Figure 8. Trend of the mean squared error (MSE) as a function of the central angle parameter used for training the proposed model.
Applsci 15 09465 g008
Figure 9. (a) Trends in the average accuracy (ACC) for depth map images as a function of the central angle. (b) Trends in the average accuracy (ACC) for the numerically reconstructed holographic 3D (H3D) images as a function of the central angle.
Applsci 15 09465 g009
Figure 10. Comparison of depth map estimation results under different central angle conditions used for training. (a) Ground truth. (b) Depth map estimation result after training with 4 viewpoints, corresponding to a central angle of θ = 90°. (c) Depth map estimation result after training with 32 viewpoints, corresponding to a central angle of θ = 11.25°. (d) Depth map estimation result after training with 512 viewpoints, corresponding to a central angle of θ = 0.7°.
Applsci 15 09465 g010
Figure 11. Comparison of holographic 3D (H3D) images reconstructed from CGHs as the central angle used for training decreases, in the case of an overlapped view between two objects. (a) Ground truth. (b) CGH’s reconstruction result after training with 4 viewpoints, corresponding to a central angle of θ = 90°. (c) CGH’s reconstruction result after training with 32 viewpoints, corresponding to a central angle of θ = 11.25°. (d) CGH’s reconstruction result after training with 512 viewpoints, corresponding to a central angle of θ = 0.7°.
Applsci 15 09465 g011
Figure 12. Comparison of holographic 3D (H3D) images reconstructed from CGHs as the central angle used for training decreases, in the case of a separated view between two objects. (a) Ground truth. (b) CGH reconstruction result after training with 4 viewpoints, corresponding to a central angle of θ = 90°. (c) CGH reconstruction result after training with 32 viewpoints, corresponding to a central angle of θ = 11.25°. (d) CGH reconstruction result after training with 512 viewpoints, corresponding to a central angle of θ = 0.7°.
Applsci 15 09465 g012
Table 1. Camera settings for 360-degree 3D content acquisition.
A: Distance from virtual camera to 255 depth11 cm
B: Margin from depth boundary to object2.0 cm
C: Distance from virtual camera to 0 depth28.7 cm
D: Distance between two objects (center to center)8.3 cm
E: Distance from 0 depth to 255 depth14.2 cm
Radius of camera’s rotation path (R)20 cm
Table 2. Computational time for depth map learning, the CGH’s generation, and the holographic 3D reconstruction from CGH (in the case of cone-shaped 3D objects).
Central Angle (°)11.255.630.7
Depth Map Learning Time (min:s)3:327:04113:04
CGH’s Synthesis Time (min:s)12:1097:171556:29
CGH’s Reconstruction Time (min:s)4:0632:48524:48
Disclaimer/Publisher’s Note: The statements, opinions and data contained in all publications are solely those of the individual author(s) and contributor(s) and not of MDPI and/or the editor(s). MDPI and/or the editor(s) disclaim responsibility for any injury to people or property resulting from any ideas, methods, instructions or products referred to in the content.