Article

Dynamic Response of Methane Explosion and Roadway Surrounding Rock in Restricted Space: A Simulation Analysis of Fluid-Solid Coupling

1
College of Arts, Xi’an University of Science and Technology, Xi’an 710054, China
2
College of Safety Science and Engineering, Xi’an University of Science and Technology, Xi’an 710054, China
*
Author to whom correspondence should be addressed.
Appl. Sci. 2025, 15(17), 9454; https://doi.org/10.3390/app15179454 (registering DOI)
Submission received: 14 April 2025 / Revised: 21 June 2025 / Accepted: 26 August 2025 / Published: 28 August 2025
(This article belongs to the Special Issue Advanced Blasting Technology for Mining)

Abstract

A methane-air premixed gas explosion is one of the most destructive disasters in the process of coal mining, and the dynamic coupling between the shock wave triggered by the explosion and the surrounding rock of the roadway can lead to the destabilization of the surrounding rock structure, the destruction of equipment, and casualties. The aim of this study is to systematically reveal the propagation characteristics of the blast wave, the spatial and temporal evolution of the wall load, and the damage mechanism of the surrounding rock by establishing a two-way fluid-solid coupling numerical model. Based on the Ansys Fluent fluid solver and Transient Structure module, a framework for the co-simulation of the fluid and solid domains has been constructed by adopting the standard k ε turbulence model, finite-rate/eddy-dissipation (FR/ED) reaction model, and nonlinear finite-element theory, and by introducing a dynamic damage threshold criterion based on the Drucker–Prager and Mohr–Coulomb criteria. It is shown that methane concentration significantly affects the kinetic behavior of explosive shock wave propagation. Under chemical equivalence ratio conditions (9.5% methane), an ideal Chapman–Jouguet blast wave structure was formed, exhibiting the highest energy release efficiency. In contrast, lean ignition (7%) and rich ignition (12%) conditions resulted in lower efficiencies due to incomplete combustion or complex combustion patterns. In addition, the pressure time-history evolution of the tunnel enclosure wall after ignition triggering exhibits significant nonlinear dynamics, which can be divided into three phases: the initiation and turbulence development phase, the quasi-steady propagation phase, and the expansion and dissipation phase. Further analysis reveals that the closed end produces significant stress aggregation due to the interference of multiple reflected waves, while the open end increases the stress fluctuation due to turbulence effects. The spatial and temporal evolution of the strain field also follows a three-stage dynamic pattern: an initial strain-induced stage, a strain accumulation propagation stage, and a residual strain stabilization stage and the displacement is characterized by an initial phase of concentration followed by gradual expansion. This study not only deepens the understanding of methane-air premixed gas explosion and its interaction with the roadway’s surrounding rock, but also provides an important scientific basis and technical support for coal mine safety production.

1. Introduction

A methane-air premixed gas explosion is one of the most destructive disasters in the coal mining process, and the dynamic coupling between the shock wave triggered by it and the roadway surrounding rock can lead to the destabilization of the surrounding rock structure, the destruction of equipment, and casualties. Governed by Langmuir’s law of adsorption, the increase in ground stress and temperature due to the increase in burial depth will significantly enhance the methane desorption potential, and the deep, highly permeable sandstone layers or fault zones can seep through the fissures to the mining site. In recent years, the risk of methane release has increased nonlinearly with the increase in the depth of coal mining and the demand for mining in gas-rich areas; the prevention and control of explosive hazards urgently require an in-depth understanding of its multi-physical field coupling mechanism [1].
Although some studies have revealed the propagation law of explosion overpressure based on experimental and numerical simulations, due to the complexity of fluid-solid coupling modeling, the existing results still have significant deficiencies in the high-precision co-simulation of the dynamic response of shock waves and surrounding rock, and the cross-scale characterization of damage evolution [2,3,4].
At this stage, scholars have carried out extensive research in the field of coal mine gas explosions through simulation and experimental means. However, most of the studies on gas explosions focus on the propagation law or the surge effect of roadway obstacles on the explosive shock wave under different equivalent concentrations or different roadway models, as well as the unidirectional coupling of the explosive shock wave to the underground ventilation system or underground structures [5]. Quansheng Jia and others [6] explored the change law of explosion temperature and pressure under different initial gas concentration conditions by using the 20L explosion characteristic test system. Ke Gao and others [7] proposed a Harten-Lax-van Leer-Contact (HLLC) approximation algorithm based on a density solver to capture the shock wave, and used the OpenFOAM toolkit of the XiFOAM process variables for deflagration reaction, and investigated the effect of very low gas concentration on the explosive performance of the gas. Runzhi Li and others [8], in a large test tunnel, with different volumes of gas-air mixture as the explosive source, carried out the gas explosion propagation test. With the increase in propagation distance, the explosion pressure is not linearly attenuated but fluctuates along the tunnel; flame propagation velocity in the whole explosion process shows the tendency of increasing and then decreasing. Kun Yang and others [9] used pipelines with diameters of 500 mm and 700 mm, lengths of 66.5 m and 93.1 m, and methane concentrations set at 7.5%, 8.5%, and 9.5%, respectively. The combustion-to-explosion (DDT) process of methane gas was investigated in large-scale, unobstructed pipelines. Bo Tan and others [10] investigated the effects of vertical concentration gradient and shape of obstacles on methane-air explosion characteristics by using Fluent 2022 R2 to simulate the gas explosion of different sizes of straight tunnels, and compared with the experimental data, proved that Fluent software can accurately simulate the gas explosion condition, and concluded that the propagation law of gas explosion in different sizes of straight tunnels is affected by the size of the corresponding influence. Yimeng Zhao and others [11] established an experimental setup to simulate the natural gas explosion process in an integrated pipe corridor to study the effect of natural gas chamber length and write-ya conditions on the flame behavior. Senpei Wang and others [12] established a numerical model by using LS-DYNA, and verified the numerical model by comparing the experimental data to study the performance of the integrated pipe corridor under gas explosion loading. Wei Liu and others [13] used a self-built large-scale gas explosion test system to carry out explosion shock wave and flame isolation experiments on different sizes of cavities, and explored the effect of cavity structure on the propagation of the explosion wave. Mengqi Yuan and others [14] used a CFD method to analyze the performance of a serious gas leakage and explosion accident, and summarized the results. The explosion accident was analyzed by the CFD method, and the explosion wave propagation and impact damage law were summarized based on the fact that the structure is small. Jianwei Cheng and others [15] examined the dynamic response characteristics of the gas explosion wave on the seals composed of concrete and loess materials by sample test and numerical simulation methods. Chunlian Cheng and others [16,17] explored the mechanism of explosion suppression from the perspective of chemical reaction kinetic analysis, investigated the propagation of gas explosion under complex conditions in a real tunnel, and conducted gas/deposited coal dust explosion and explosion suppression experiments in a large tunnel to clarify the propagation law of the explosion in a real environment and the effect of ultrafine dry powder on it.
This study focuses on the fluid-solid coupling dynamics of a methane-air premixed gas explosion in a restricted space, and aims to construct a two-way fluid-solid coupling numerical model to systematically reveal the propagation characteristics of the explosion shock wave, the spatial and temporal evolution of the wall load, and the damage mechanism of the surrounding rock. By integrating the Ansys Fluent fluid solver and Transient Structure module, a multi-field synergistic simulation framework of coupled chemical-turbulent-structural dynamics is established by adopting the standard k-ε turbulence model, finite-rate/eddy-dissipation (FR/ED) reaction model, and nonlinear finite-element theory. The dynamic damage threshold criterion based on the Drucker–Prager and Mohr–Coulomb criteria was also introduced to quantitatively analyze the shock wave energy transfer efficiency, the phase lag effect of the surrounding rock stress field, and the damage accumulation law under the optimal equivalence ratio working condition.

2. Numerical Simulation Methods and Control Equations

Figure 1 systematically explains the technical route and data interaction mechanism of the coupled numerical simulation of multi-physics fields. Based on the Ansys SCDM geometric modeling platform, a parametric channel computational domain is constructed, and a sub-domain discretization strategy is adopted: isotropic discretization is achieved by structured hexahedral meshes in the fluid domain, unstructured tetrahedral meshes are used for morphology-adaptive discretization in the solid domain, and the meshes are all 0.1 m in size. For the solver configurations, the pressure-based coupling solver (SIMPLE algorithm) is used in Fluent for the fluid domain, and automatic time-step control is enabled in Transient Structure for the solid domain (maximal increment Δ t m a x = 1 × 10 5   s , stability coefficient γ = 0.75 ). The bi-directional field coupling architecture was established through the System Coupling module with the data exchange protocol set to perform 20 bi-directional mapping passes per global time step, and a conservation interpolation algorithm was used to ensure momentum-energy conservation of the interfacial pressure ( F l u e n t     M e c h a n i c a l ) and displacement ( M e c h a n i c a l F l u e n t ) (with residual thresholds of R p <   1 % and R d < 0.5 % ), same frequency as the global time step for 20 two-way mapping passes is enabled to maintain the topological continuity of the interface. The methane concentration is selected with reference to a typical industrial scenario of 4–17% gas accumulation in coal mines and covers key nodes in the explosive limit range.

2.1. Governing Equations for Methane-Air Mixture Explosion Simulations

The explosion process of methane-air premixed gas is essentially a rapid combustion reaction process in a confined space, and its numerical simulation requires the establishment of a system of conservation equations for the coupled chemical reaction, including the mass conservation law, momentum conservation law (Navier-Stokes equations), energy conservation equations, and species transport equations.
A detonation is a combustion induced by an excitation wave that propagates in a steady manner. Because of the intense chemical reaction of this combustion, it has a very high flame propagation rate and its products have very high temperatures and pressures. After weak ignition, a laminar flame is generated, which is destabilized and accelerated by boundary action. The accelerated flame and the wall have a positive feedback effect, so that the flame continues to accelerate, is caused by sudden turbulence, the formation of turbulent flame, resulting in further enhancement of the combustion rate; combustion products of the expansion of the flame front of the medium have a compression effect, the formation of a series of compression waves, and ultimately develop into a surge. The induced surge, with the continuous acceleration of the flame, continues to enhance the flame; the accelerated flame formation of the induced surge is strong enough, and the surge pre-compression zone may be a local explosion, the formation of a bombardment, so that the combustion suddenly transforms into a strong bombardment. Strong bombardment is unstable, gradually decaying into a stable propagation of CJ bombardment. In the deflagration-to-detonation process, the flame acceleration and the enhancement of the surge are closely related to turbulent combustion. Deflagration to detonation is a more complex physicochemical process, including turbulent combustion, compression wave reflection, and other phenomena. The process is not only strongly nonlinear, but there is also a wide range of spatial and temporal characteristics of the scale, so the use of numerical calculations needs to be a suitable model of turbulent combustion [18]. The k     ε model quantifies the turbulent mixing effect through turbulent kinetic energy ( k ) and dissipation rate ( ε ), which can significantly enhance the flame face stretching and local combustion rate, and also affects the momentum equation by varying the effective Reynolds stress to capture the interaction of the shock wave with turbulent eddies such as pressure oscillations, and wavefront surface distortions, which are crucial for accurately modeling the reflection and superposition of the pressure wave in a confined space [19,20]. The theoretical framework constructed in this study is based on the following set of fundamental control equations:
Mass Conservation Equation:
ρ t + ρ v = 0
Ensures the conservation of mass within the fluid domain. The temporal change in density ( ρ / t ) balances the spatial divergence of mass flux ( · ( ρ v ) ).
Energy Conservation Equation:
t ρ h + ρ h v = P t + v P + τ
Accounts for enthalpy ( h ) transport, pressure work, and thermal conduction ( τ ).
Momentum Conservation Equation:
t ρ v + ρ v v + P = τ + S
Describes the balance between inertial forces, pressure gradients ( P ), viscous stresses ( τ ), and external forces ( S ).
Species Transport Equation:
t ρ V f v + ρ v V f v ν e G f v V f v = R f v
In this equation, ρ denotes the density ( k g / m 3 ), t represents time ( s ), and v is the velocity vector ( m / s ), h is the specific enthalpy, P denotes the fluid pressure ( Pa ), and τ represents the shear stress tensor. V f v represents the mass fraction of the flammable component ( % ), v e is the effective viscosity coefficient, G f v denotes the effective thermal conductivity, and R f v corresponds to the premixed gas explosion rate ( m / s ).
The standard model resolves turbulent kinetic energy and its dissipation rate to characterize turbulence effects, which is critical for capturing stagnation zones, recirculation, and flame wrinkling in explosion simulations. Turbulence increases the rate of combustion by increasing the surface area of the flame, which is necessary for flame acceleration, and neglecting turbulence will make it impossible to accurately model the explosion evolution.
Turbulent kinetic energy transport modeling:
ρ t ρ k + x i ρ k a i = x j μ + μ t δ k k x j + G k + G b ρ ε Y m + S k
Turbulent dissipation rate transport equations:
t ρ k + x i ρ k u i = x j μ + μ t σ ε k x j + c 1 ε ε k G k + C 3 ε G b C 2 ε ρ ε 2 k + S ε
Turbulent viscosity calculation equation:
μ t = ρ C μ k t 2 ε
In this equation,   G k is the turbulent kinetic energy produced by the mean velocity gradient; G b is the turbulent kinetic energy generated for buoyancy; Y m is the effect of fluctuating expansion on turbulent dissipation; C μ = 0.09 ;   c 1 ε = 1.44 ;   C 2 ε = 1.92 ;   C 3 ε = 1.2 ;   δ k = 1.0 ;   a n d   σ ε = 1.3 .
Based on the structural dynamics analysis framework of nonlinear finite-element theory, the continuous medium structure is decomposed into a finite number of units by spatial discretization and the unit-level dynamics control equations are established [21]. The time evolution characteristics of the displacement, velocity, and acceleration fields of the structural system under external load excitation can be obtained by numerically solving this set of coupled equations. The system kinematic governing equations of this theoretical framework can be formulated as
M a + C v + K d = F ( t )
In this equation, M , C , and   K are the mass, damping, and stiffness matrices, respectively; a , v , and d denote the acceleration, velocity, and displacement vectors; and   F t   represents the external force vector.

2.2. Bi-Directional Fluid-Structure Interaction Method for Gas Explosion Simulations

The bi-directional fluid-solid coupled numerical simulation method provides an effective computational framework for solving fluid-structure interaction dynamics problems. The method realizes the coupling solution between the fluid and solid domains through a two-way physical quantity transfer mechanism, which strictly follows the dynamic equilibrium principle at the interface. For the strong nonlinear coupling problem of the interaction between the tunnel-enclosing rock and the methane-air premixed gas explosion shock wave, in view of the strong nonlinear characteristics of this physical process, it is necessary to adopt a multi-physics field strong coupling iterative algorithm to achieve the convergent transfer of the interface parameters at each time step in order to ensure computational accuracy [22,23,24]. This study is based on the Ansys Workbench co-simulation platform, integrating the Fluent fluid dynamics solver and the Transient Structure nonlinear structural analysis module, realizing real-time interaction between pressure load and structural displacement through the System Coupling system interface, and constructing a complete two-domain two-way coupling numerical model. The fluid-structure coupling interface needs to satisfy the following basic conservation laws:
τ f · n f = τ s · n s d f = d s
In this equation, τ f , τ s is Fluid and solid domain stresses ( M P a ), n f , n s is the unit normal vectors of fluid and solid boundaries, and d f , d s is the displacement vectors ( m ) at the interface.
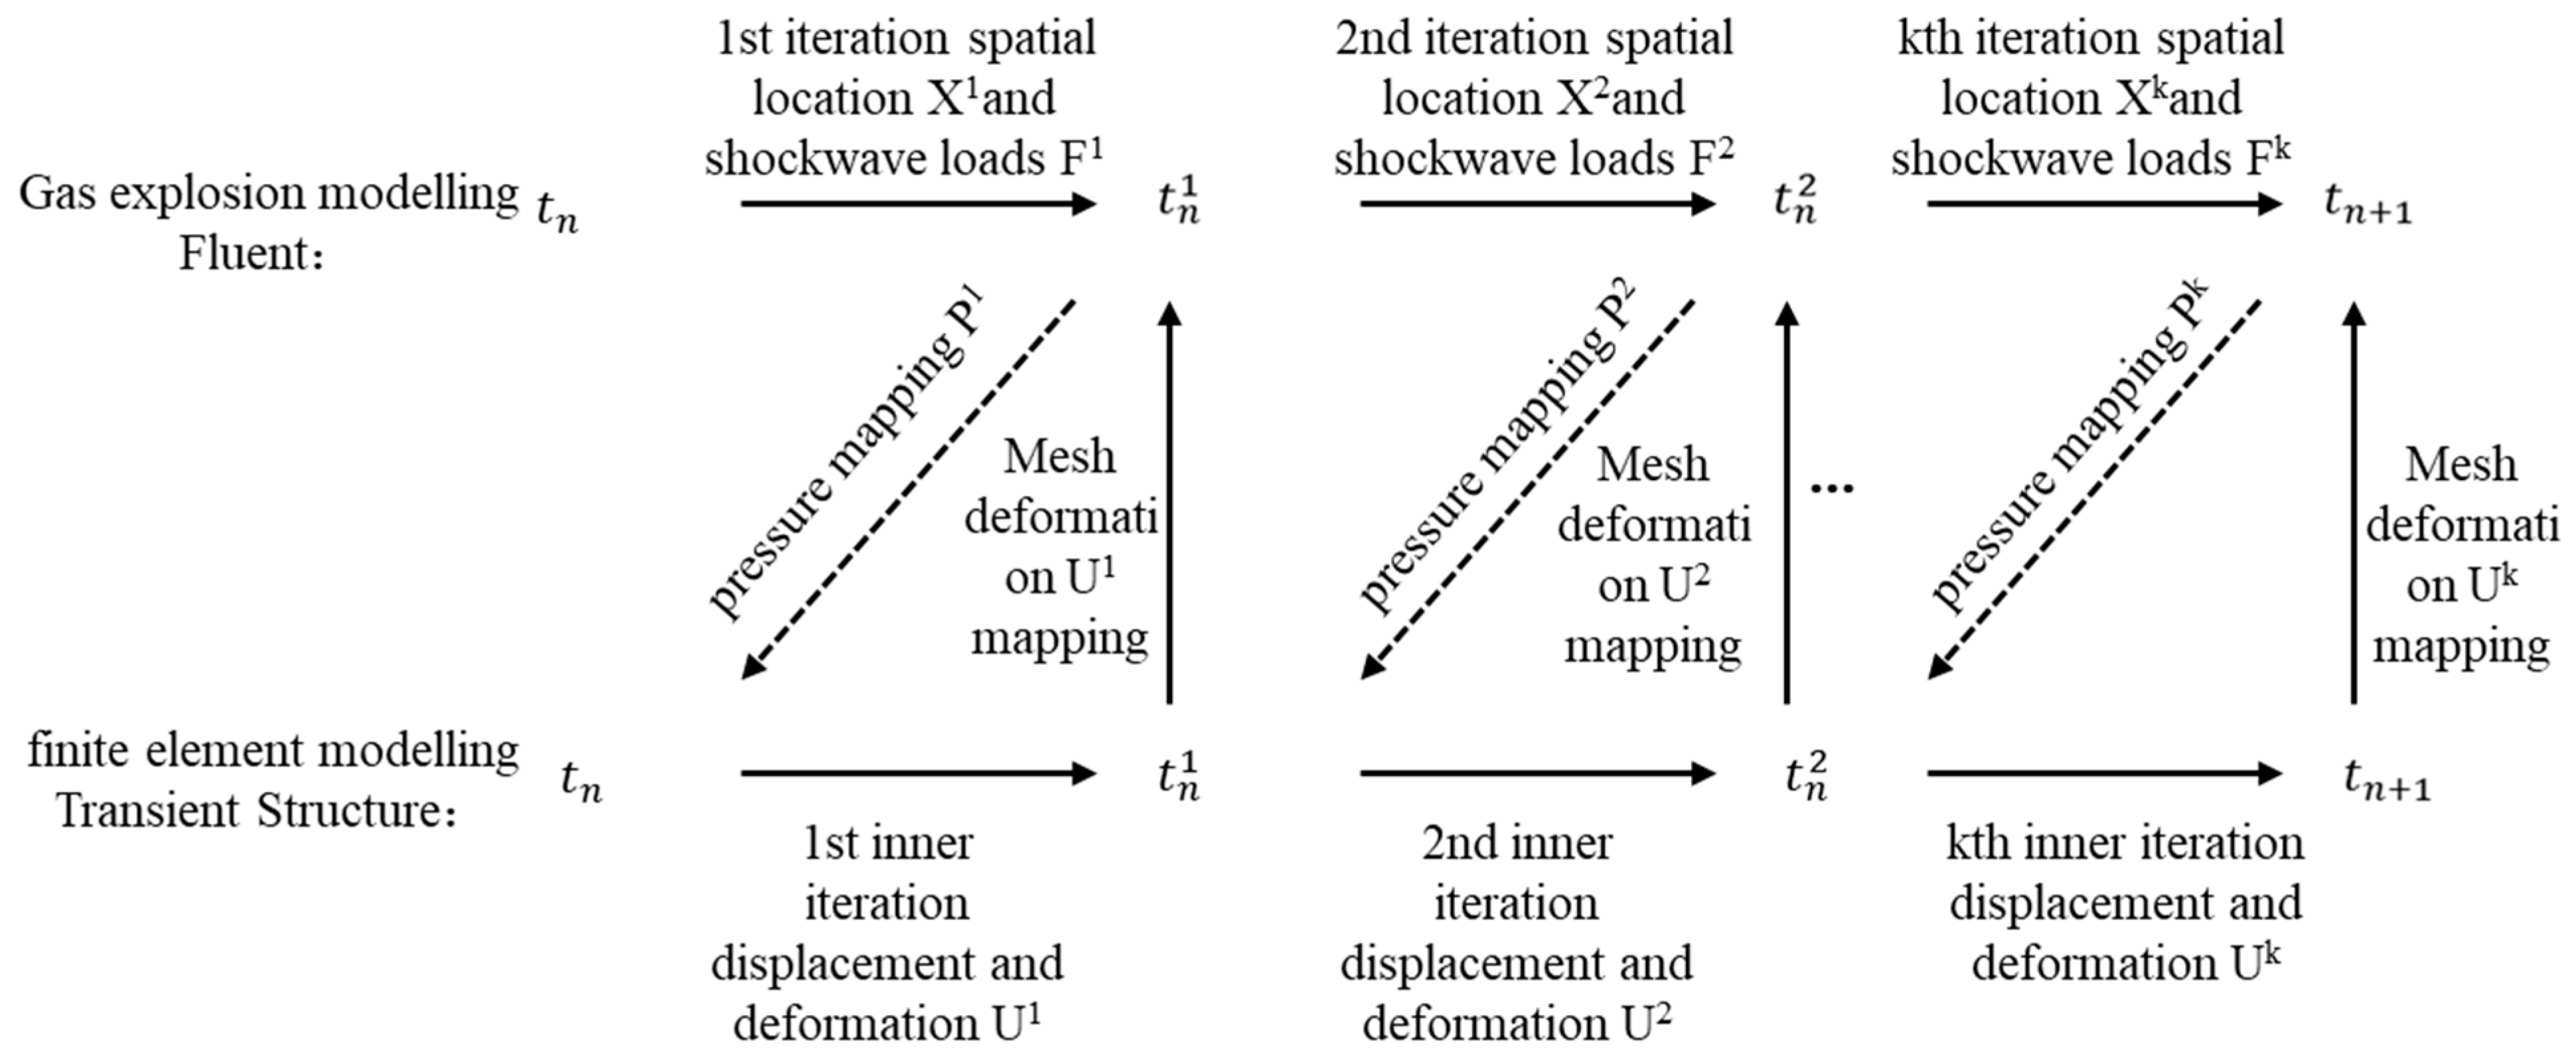
Within the Ansys co-simulation framework, the roadway rock-gas contact interface is defined as a fluid-solid coupling interface. Based on the principle of energy conservation, the real-time bi-directional transfer of the pressure field in the fluid domain and the displacement field in the solid domain is realized by an implicit coupling algorithm. In each iteration step, the Fluent transient fluid solver and the Transient Structure nonlinear structure solver complete the convergent data exchange of dynamic loads (shock wave pressure, shear stress) and structural response (displacement field, deformation tensor) through the System Coupling module (see Figure 2 for details of the process). This study mainly focuses on the role of the explosion shock wave on the surrounding rock, and the explosion time scale is very short. The surrounding rock heat absorption can be ignored, so the data exchange process in the System Coupling module ignores heat transfer. The coupling system solution result contains the following: (1) the fluid domain pressure field resolution (composed of the dynamic pressure component and the wall shear stress component), and the boundary load is transferred to the surrounding rock surface through the spatial mapping algorithm; (2) the solid domain displacement field is solved by the nonlinear finite-element method, and then it is fed back to the fluid domain through the interface coordination condition. At each iteration, the fluid domain topology is updated using dynamic mesh technology, and the shock wave propagation path and load distribution are modified simultaneously. Through multiple iteration cycles, the peak shock wave pressure, the plastic deformation of surrounding rock, and the interface shear stress gradually reach the convergence threshold, and finally the stable flow field distribution and structural dynamic response characteristics that meet the residual requirements are obtained at the end of the time step.

2.3. Numerical Modeling of Fluid-Solid Coupling

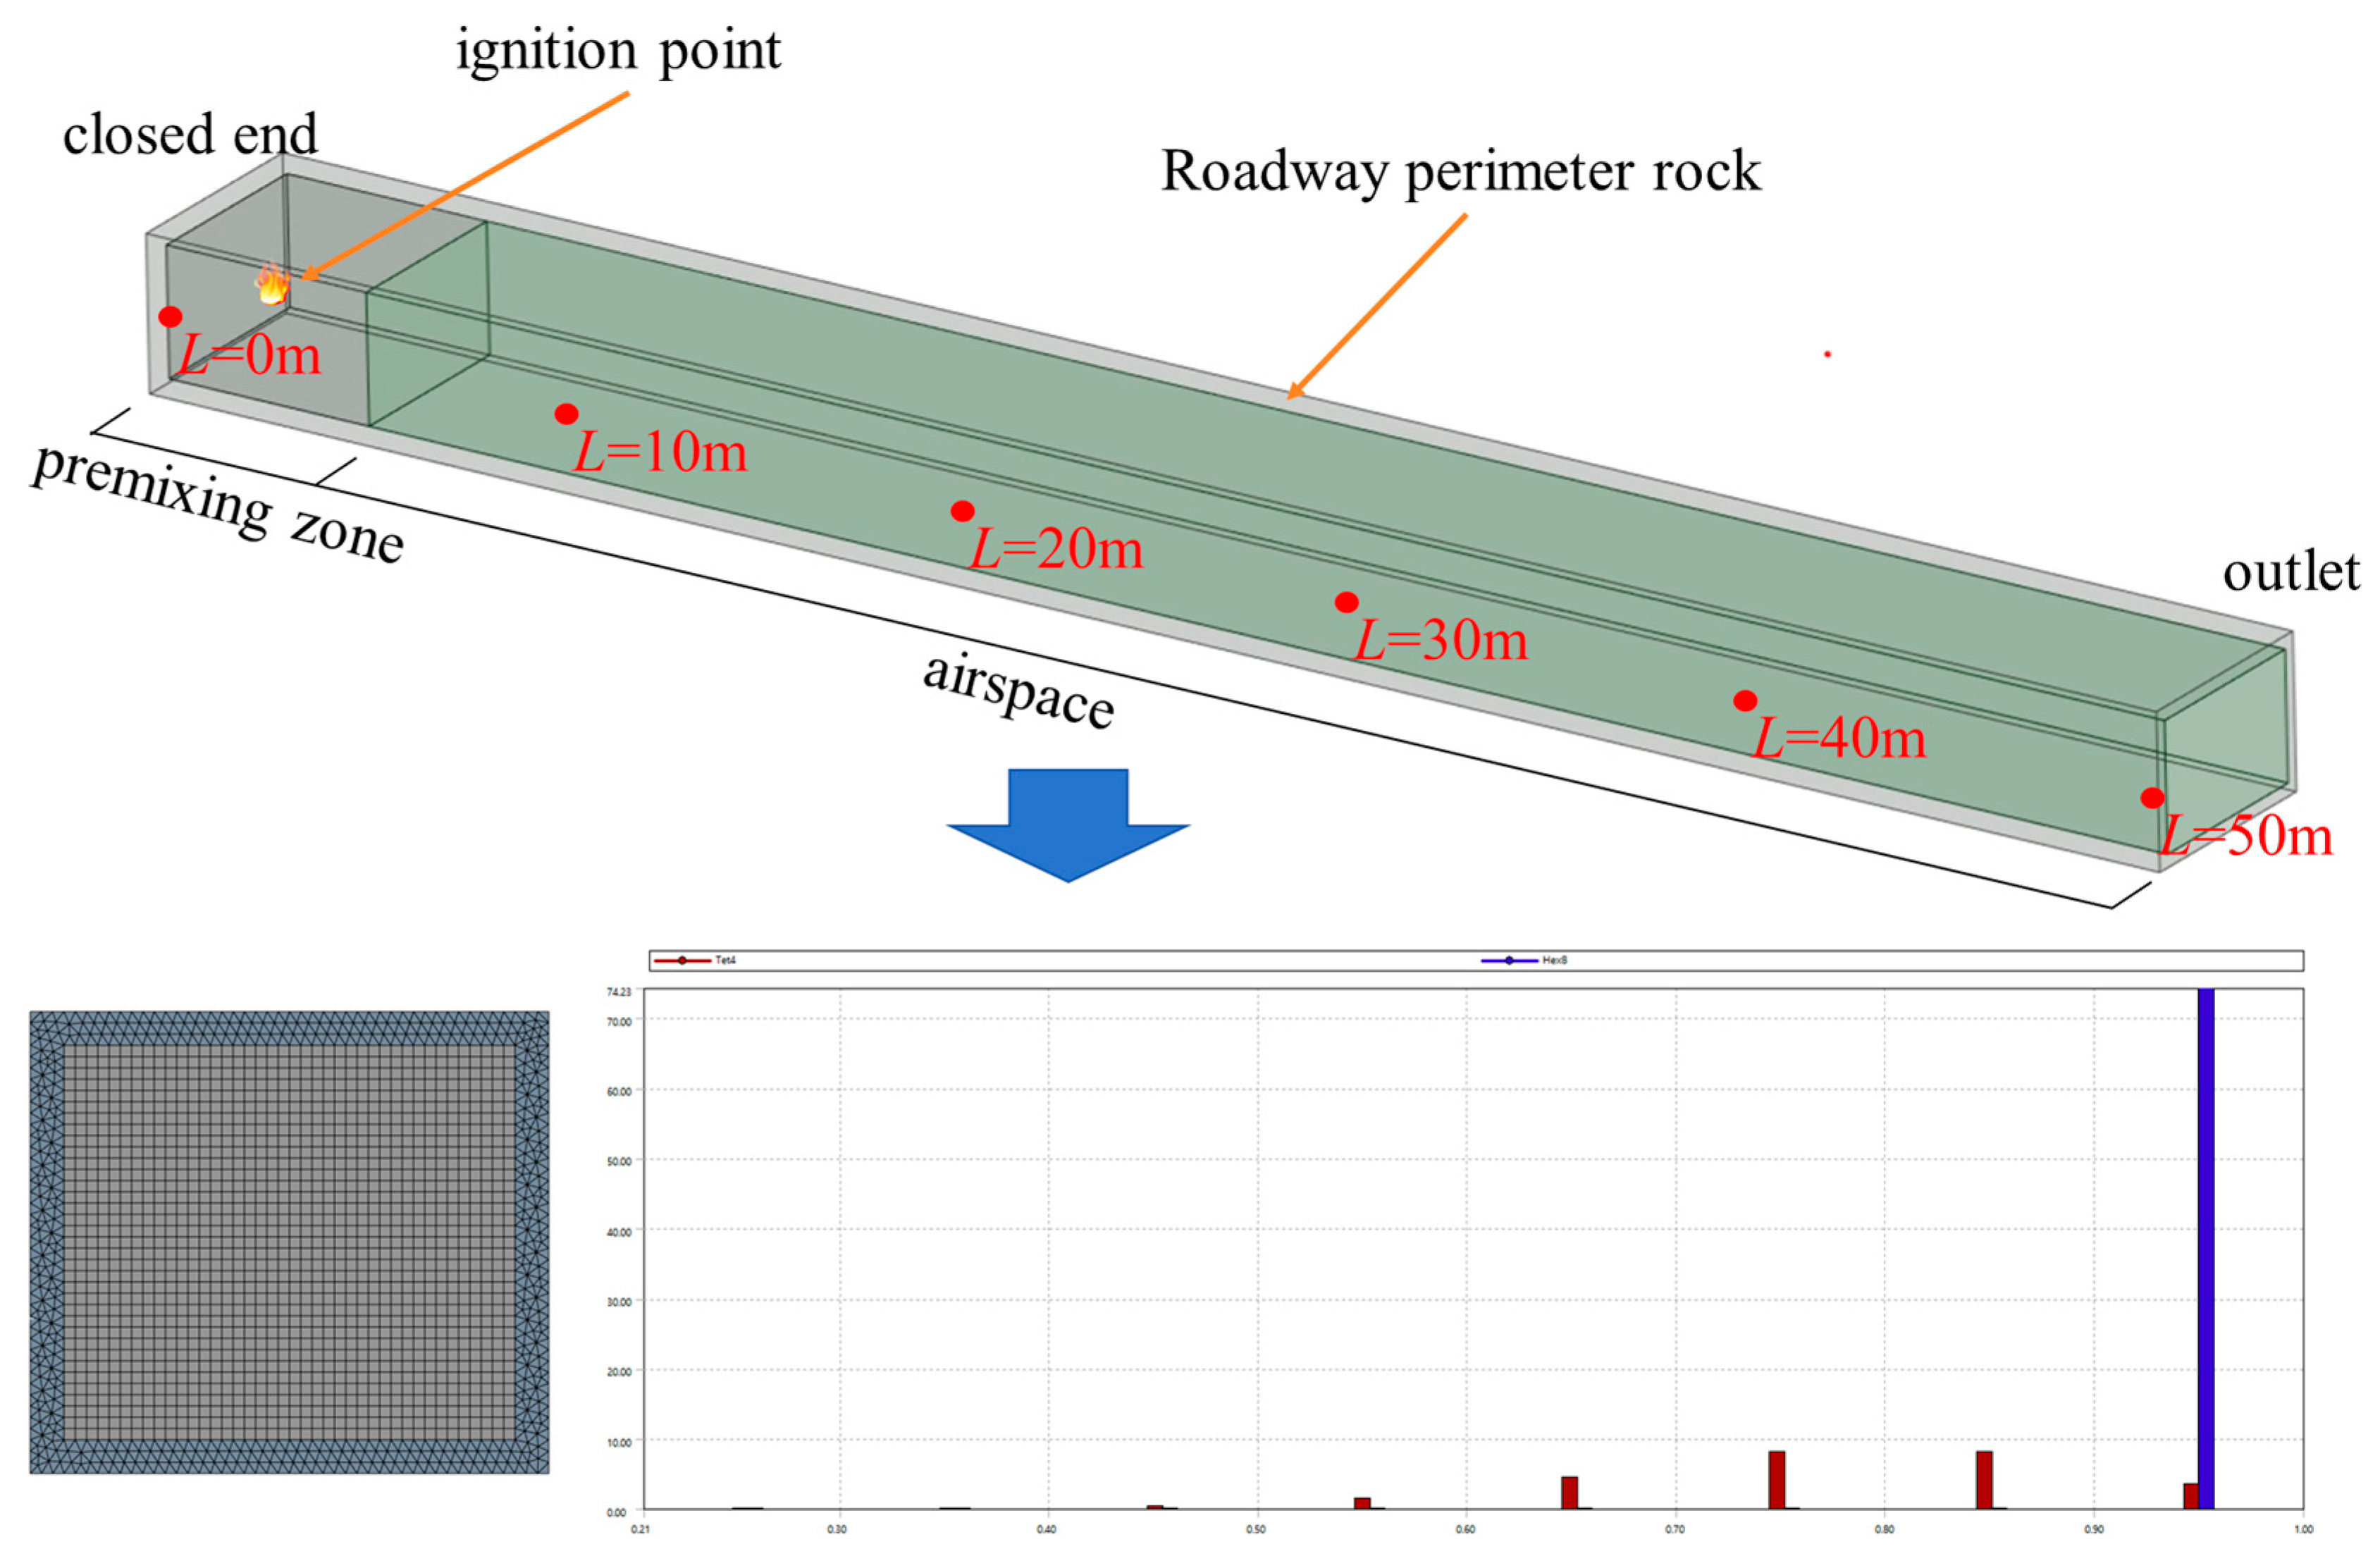
A three-dimensional simplified computational model was constructed based on a typical tunnel engineering prototype, which is characterized by a semi-enclosed structure (axial length of 50 m, cross-section size of 4.5   m × 3   m ). The methane pre-mixing zone is defined as a restricted spatial domain 0 5   m from the closed end, to study the propagation of shock waves in the air zone after forming a complete wavefront in the premixed zone. In order to make the damage region more significant, its boundary constraint layer is set to be 0.3   m thick and is defined as an impermeable wall, where there are no cracks or pores during the simulation time, and the gas cannot pass through the computational domain. The ignition source is positioned at the geometric center axis 1.0   m from the closed end. The computational domain was discretized using a hybrid mesh discretization strategy: isotropic discretization was achieved by a structured hexahedral mesh for the fluid domain, and an unstructured tetrahedral mesh was used for morphologically adapted discretization in the solid domain, and mesh suitability was verified by orthogonal mass [25]. Three sets of methane volume fraction working conditions were constructed within the methane pre-mixing zone ( 7 % stoichiometric, 9.5 % optimal, and 12 % rich mixture). The volume fraction of O2 in the whole model area is 21 % , CO2 and H2O volume fractions are 0.01 % and 0.03 % , respectively, and the rest of the components are N2. The monitoring system was arranged with monitoring arrays along the axial direction of the roadway wall according to the distance parameter (see Figure 3 for details of the spatial distribution of the projected grid).
The fast chemical reaction kinetics of methane-air premixed gas explosion is characterized by a finite-rate/eddy-dissipation (FR/ED) volumetric reaction model. The model combines the Arrhenius formula and the eddy-dissipation model, which can take into account both kinetic and turbulence factors, and is suitable for the local premixed combustion case, where the reaction rate is taken as the smaller value of the Arrhenius rate and the eddy-dissipation rate where the Arrhenius formula is
k = A T β e x p E a / R T
In this equation, k is the rate of reaction; R is the molar gas constant with a value of 8.314 J/(mol-K); T is the thermodynamic temperature (K); E a is the apparent activation energy (J/mol) which has a value of 2.027 × 10⁸; and A is the pre-exponential factor, which has a value of 2.119 × 10¹¹.
The eddy-dissipation model reaction rate is calculated as
R i , r = v i , r M w , i A B ρ ε 1 k 1 p Y p j N v i , r M w , j
In this equation, Y p is the mass fraction of the product; A and B are empirical constants, A = 4 and B = 0.5; v i , r is the stoichiometric number of product i in reaction r ; and chemical reaction rates are controlled by large eddy mixing timescales ε 1 k 1 .
The net reaction rate is taken to be the smallest of the above two rates. Finite-rate kinetics prevent the reaction from occurring before the flame stabilizer. Once the flame is ignited, the vortex dissipation rate is usually less than the Arrhenius rate, and the reaction is limited by mixing.
This is constructed on the basis of the following basic assumptions: (1) the fluid medium follows the ideal gas state equation; (2) the thermodynamic system is adiabatic and the effects of bulk forces are neglected; (3) the single-step irreversible lumped reaction mechanism ( C H 4 + 2 O 2 C O 2 + 2 H 2 O ); and (4) the ignition mechanism is realized through the spark ignition setting in the component transport model, and different spark ignition parameters have certain effects on the peak value of the shock wave and the propagation speed. In this paper, the ignition energy is 1 mJ, the initial radius is 0.002   m , and the duration is 1   m s ., with the initial conditions set at ambient temperature (298 K) and standard atmospheric pressure (101.325 kPa), and with a uniform distribution of the concentration and temperature fields.
Full displacement constraint boundary conditions are used at the closed end of the tunnel to maintain numerical stability; the top and bottom plates were used as fixed supports at the junction of the top and bottom plates with the two gangs of surrounding rock to maintain numerical stability, while a pressure of 1   M P a was applied to the surface of the surrounding rock to simulate the initial ground stress, and the surrounding rock medium is idealized by an equivalent isotropic linear elasticity constitutive model. The key material constitutive parameters (including Young’s modulus, Poisson’s ratio, density, and kinetic parameter) were set according to the experimental measurements shown in Table 1, where the explosion rate transport coefficient of the explosive mixture is obtained by calculating the kinetic theory Equation (4).
In Table 1, ρ is the density; E is Young’s modulus; ν is Poisson’s ratio; R m is the tensile ultimate strength; σ c is the ultimate compressive strength; and K is the strength factor.
In this study, an implicit strongly coupled iterative algorithm is used to implement the fluid-structure coupling solution, and the numerical framework is set as follows: a single bi-directional data transfer is executed within each global time step ( t = 1 × 10 5   s ), and the physical field coupling is achieved through a multi-field convergence mechanism. In the specific implementation, the fluid solver performs 20 sub-iterative computations within each time step to ensure convergence of the Navier-Stokes equations, which is determined by dynamic optimization of the mesh eigenvelocity according to the Courant–Friedrichs–Lewy condition. The time discretization strategy of the coupled system adopts a fixed time-step scheme ( t = 1 × 10 5   s ), and this parameter setting is verified by the leading mesh independence analysis and the time-step sensitivity to achieve optimal computational efficiency while ensuring the computational accuracy. The data convergence criterion is based on the triple constraints of interfacial load residual (pressure residual < 1 % ), displacement continuity error ( L 2 < 0.5 % ), and energy conservation threshold ( E E 0 < 5 ).

3. Analysis of the Evolutionary Pattern of Wall Loads in a Gas Explosion

3.1. Numerical Model Validation

In order to verify the accuracy of the parameter settings and boundary conditions used in this paper, the numerical simulation of the gas explosion pipe is compared with the experimental results with reference to the existing studies [26]. The inner diameter of the circular pipe is 18 cm, and the data of 0.23 m3 of gas volume in case 1 is selected for simulation and comparison. The experimental schematic and the distribution of measurement points are shown in Figure 4.
According to the experimental results, the numerical simulation results are plotted and the peak values of overpressure at different measurement points are shown in Table 2. Relative error is calculated by averaging the experimental results with the numerical simulation results over three experimental results. From the results, it can be seen that the relative error of the results of all measurement points remains between 6 % and + 9 % . The initial stage F1 measurement point numerical simulation is relatively large, which may be due to the use of a single-step irreversible reaction; the reaction is more rapid because of the comparison of the experimental results of the peak overpressure is higher. During the propagation of the shock wave, the experimental overpressure decays faster due to a number of factors such as the high friction coefficient of the inner wall of the pipe. Overall the relative errors between the experimental results and the numerical simulation results are within acceptable limits, thus verifying the availability of the numerical simulation parameter settings and boundary conditions.

3.2. Conversion of Combustion and Explosion Shock Waves

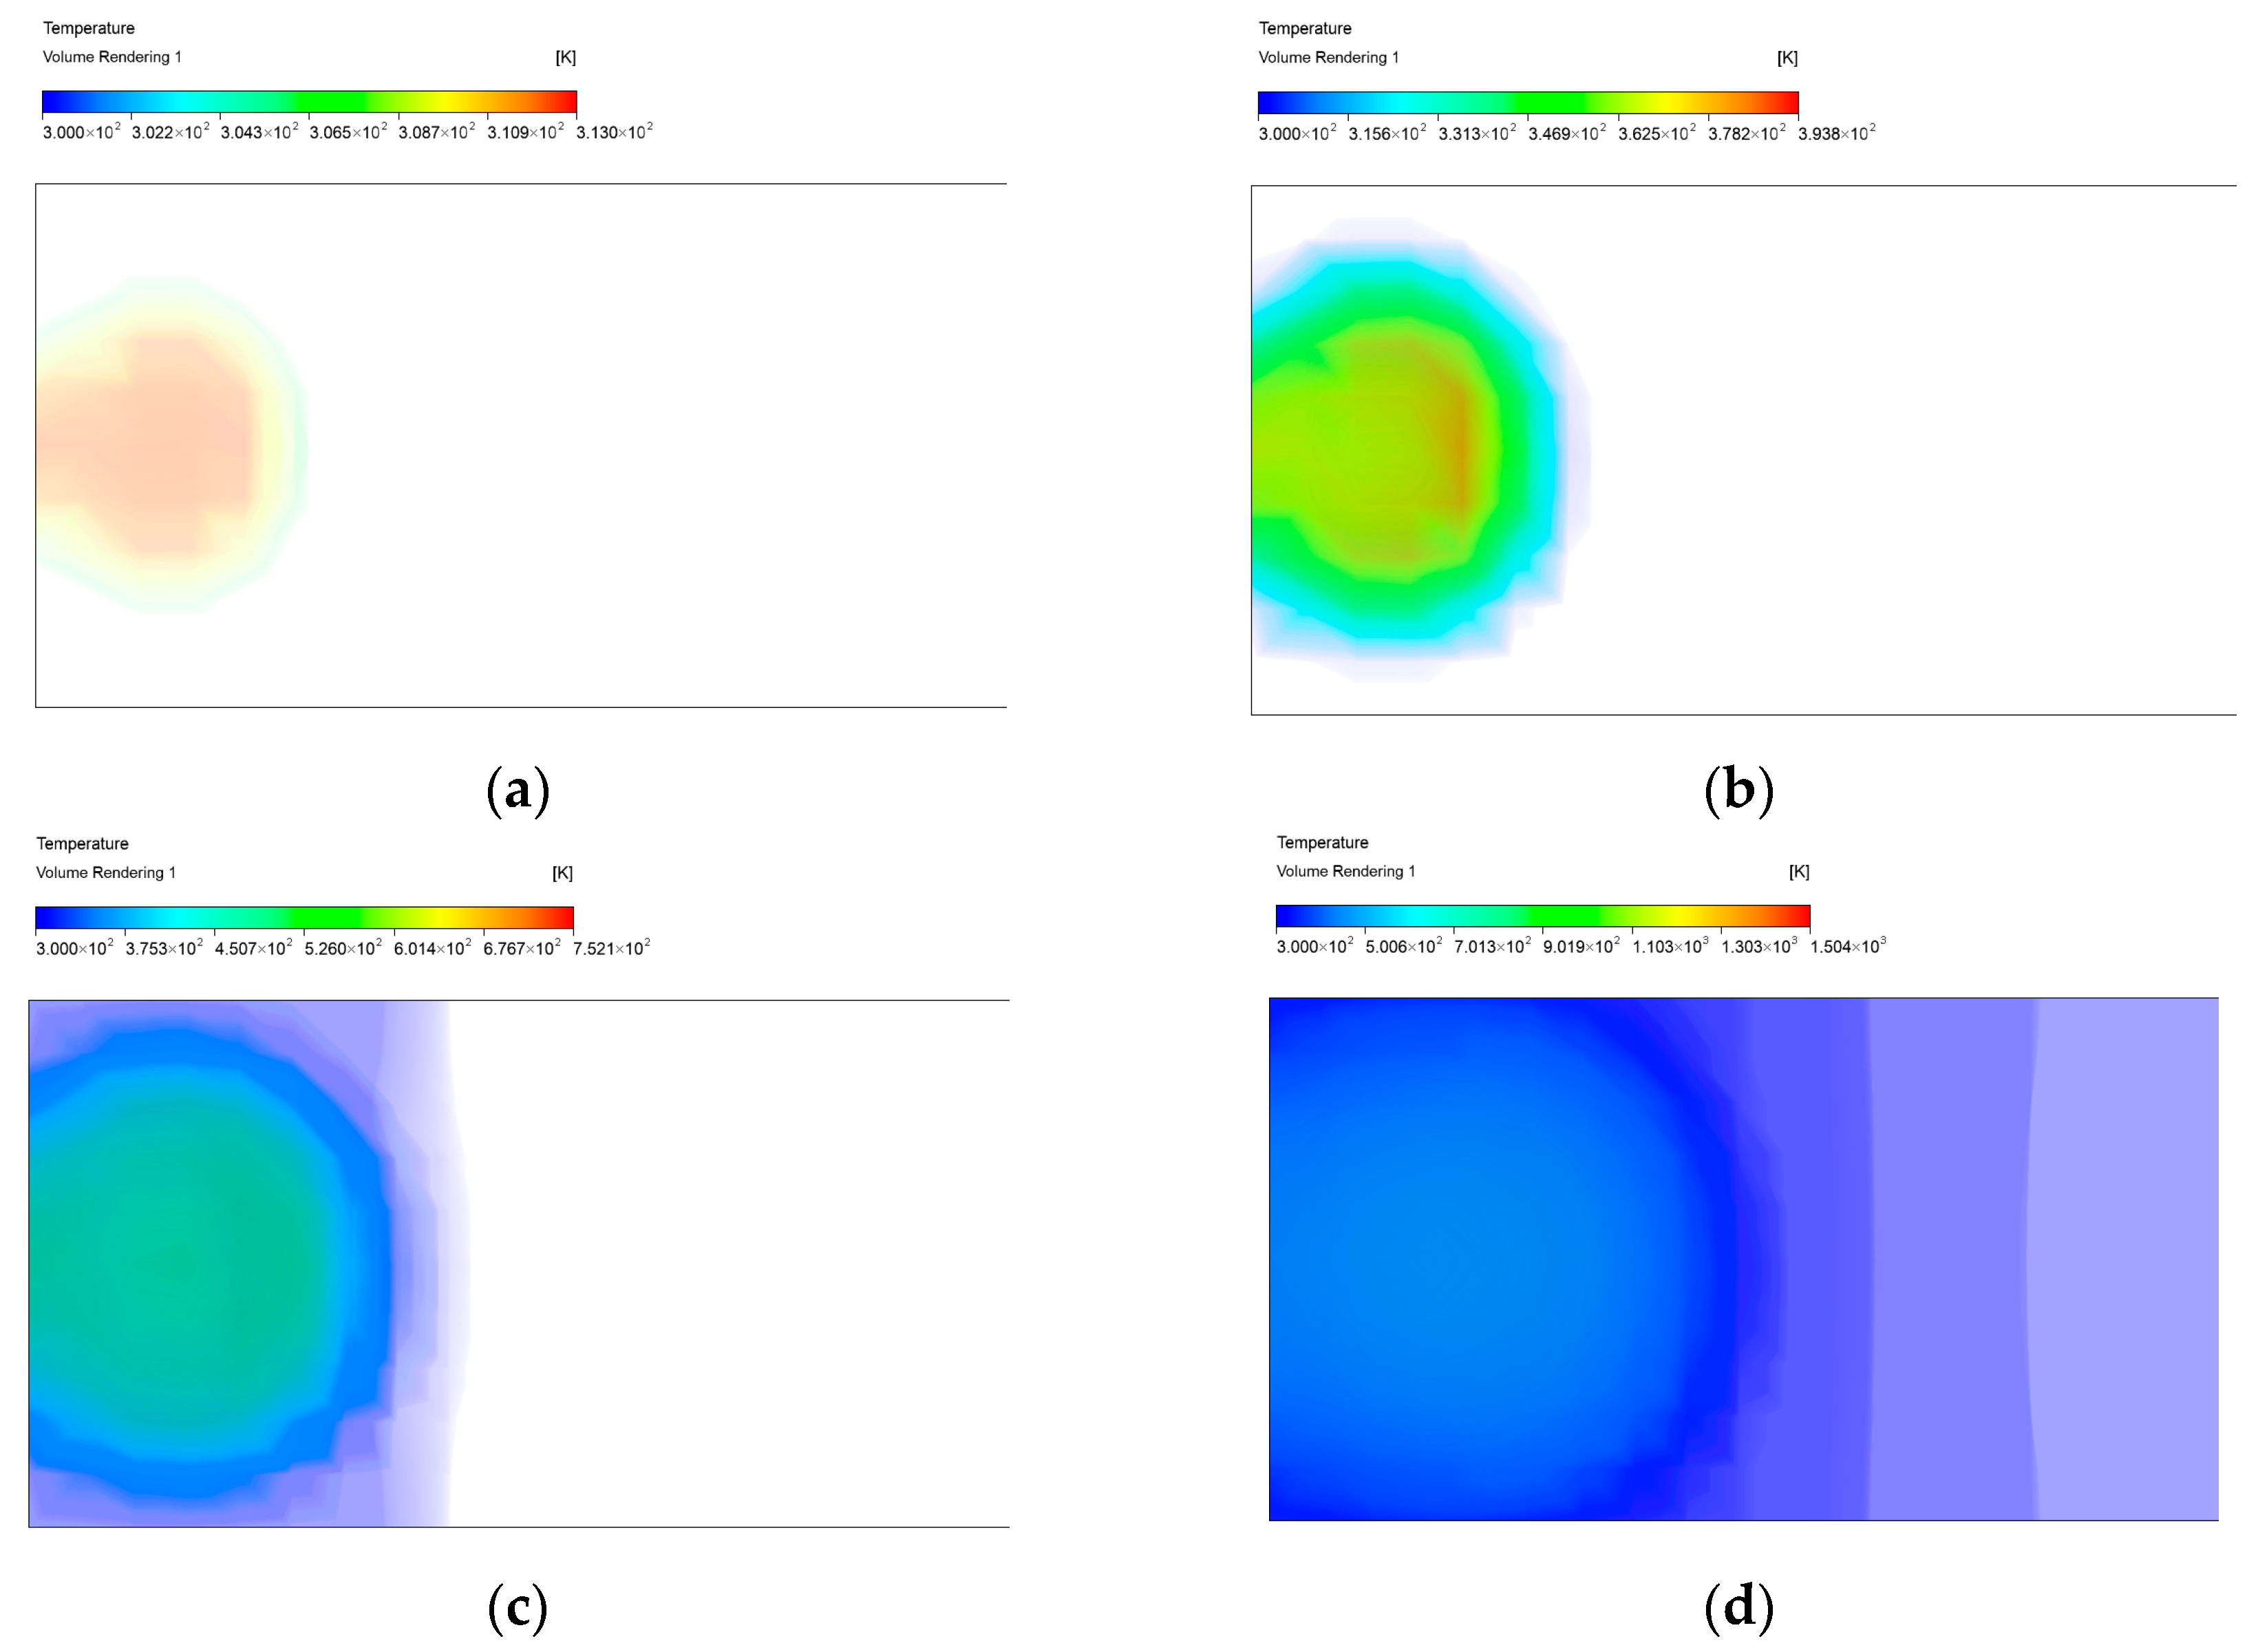
Figure 5a–d illustrate the transition from ignition to detonation of a gas explosion. Figure 5b shows the process of turbulent flame formation and the interaction of the surge with the flame, resulting in the appearance of the flame surface of this week and the flame surface area expansion with the energy release significantly higher. Figure 5c shows the process of hot spot formation, where a high-temperature region appears near the turbulent flame, and a temperature or reaction gradient exists inside the hot spot, and the direction of the gradient determines the propagation path of the spontaneous wave. Figure 5d shows the transition from spontaneous wave to detonation, where the hot spot explosion generates a continuous reaction wave that propagates along the reaction gradient and eventually stabilizes as a CJ detonation.
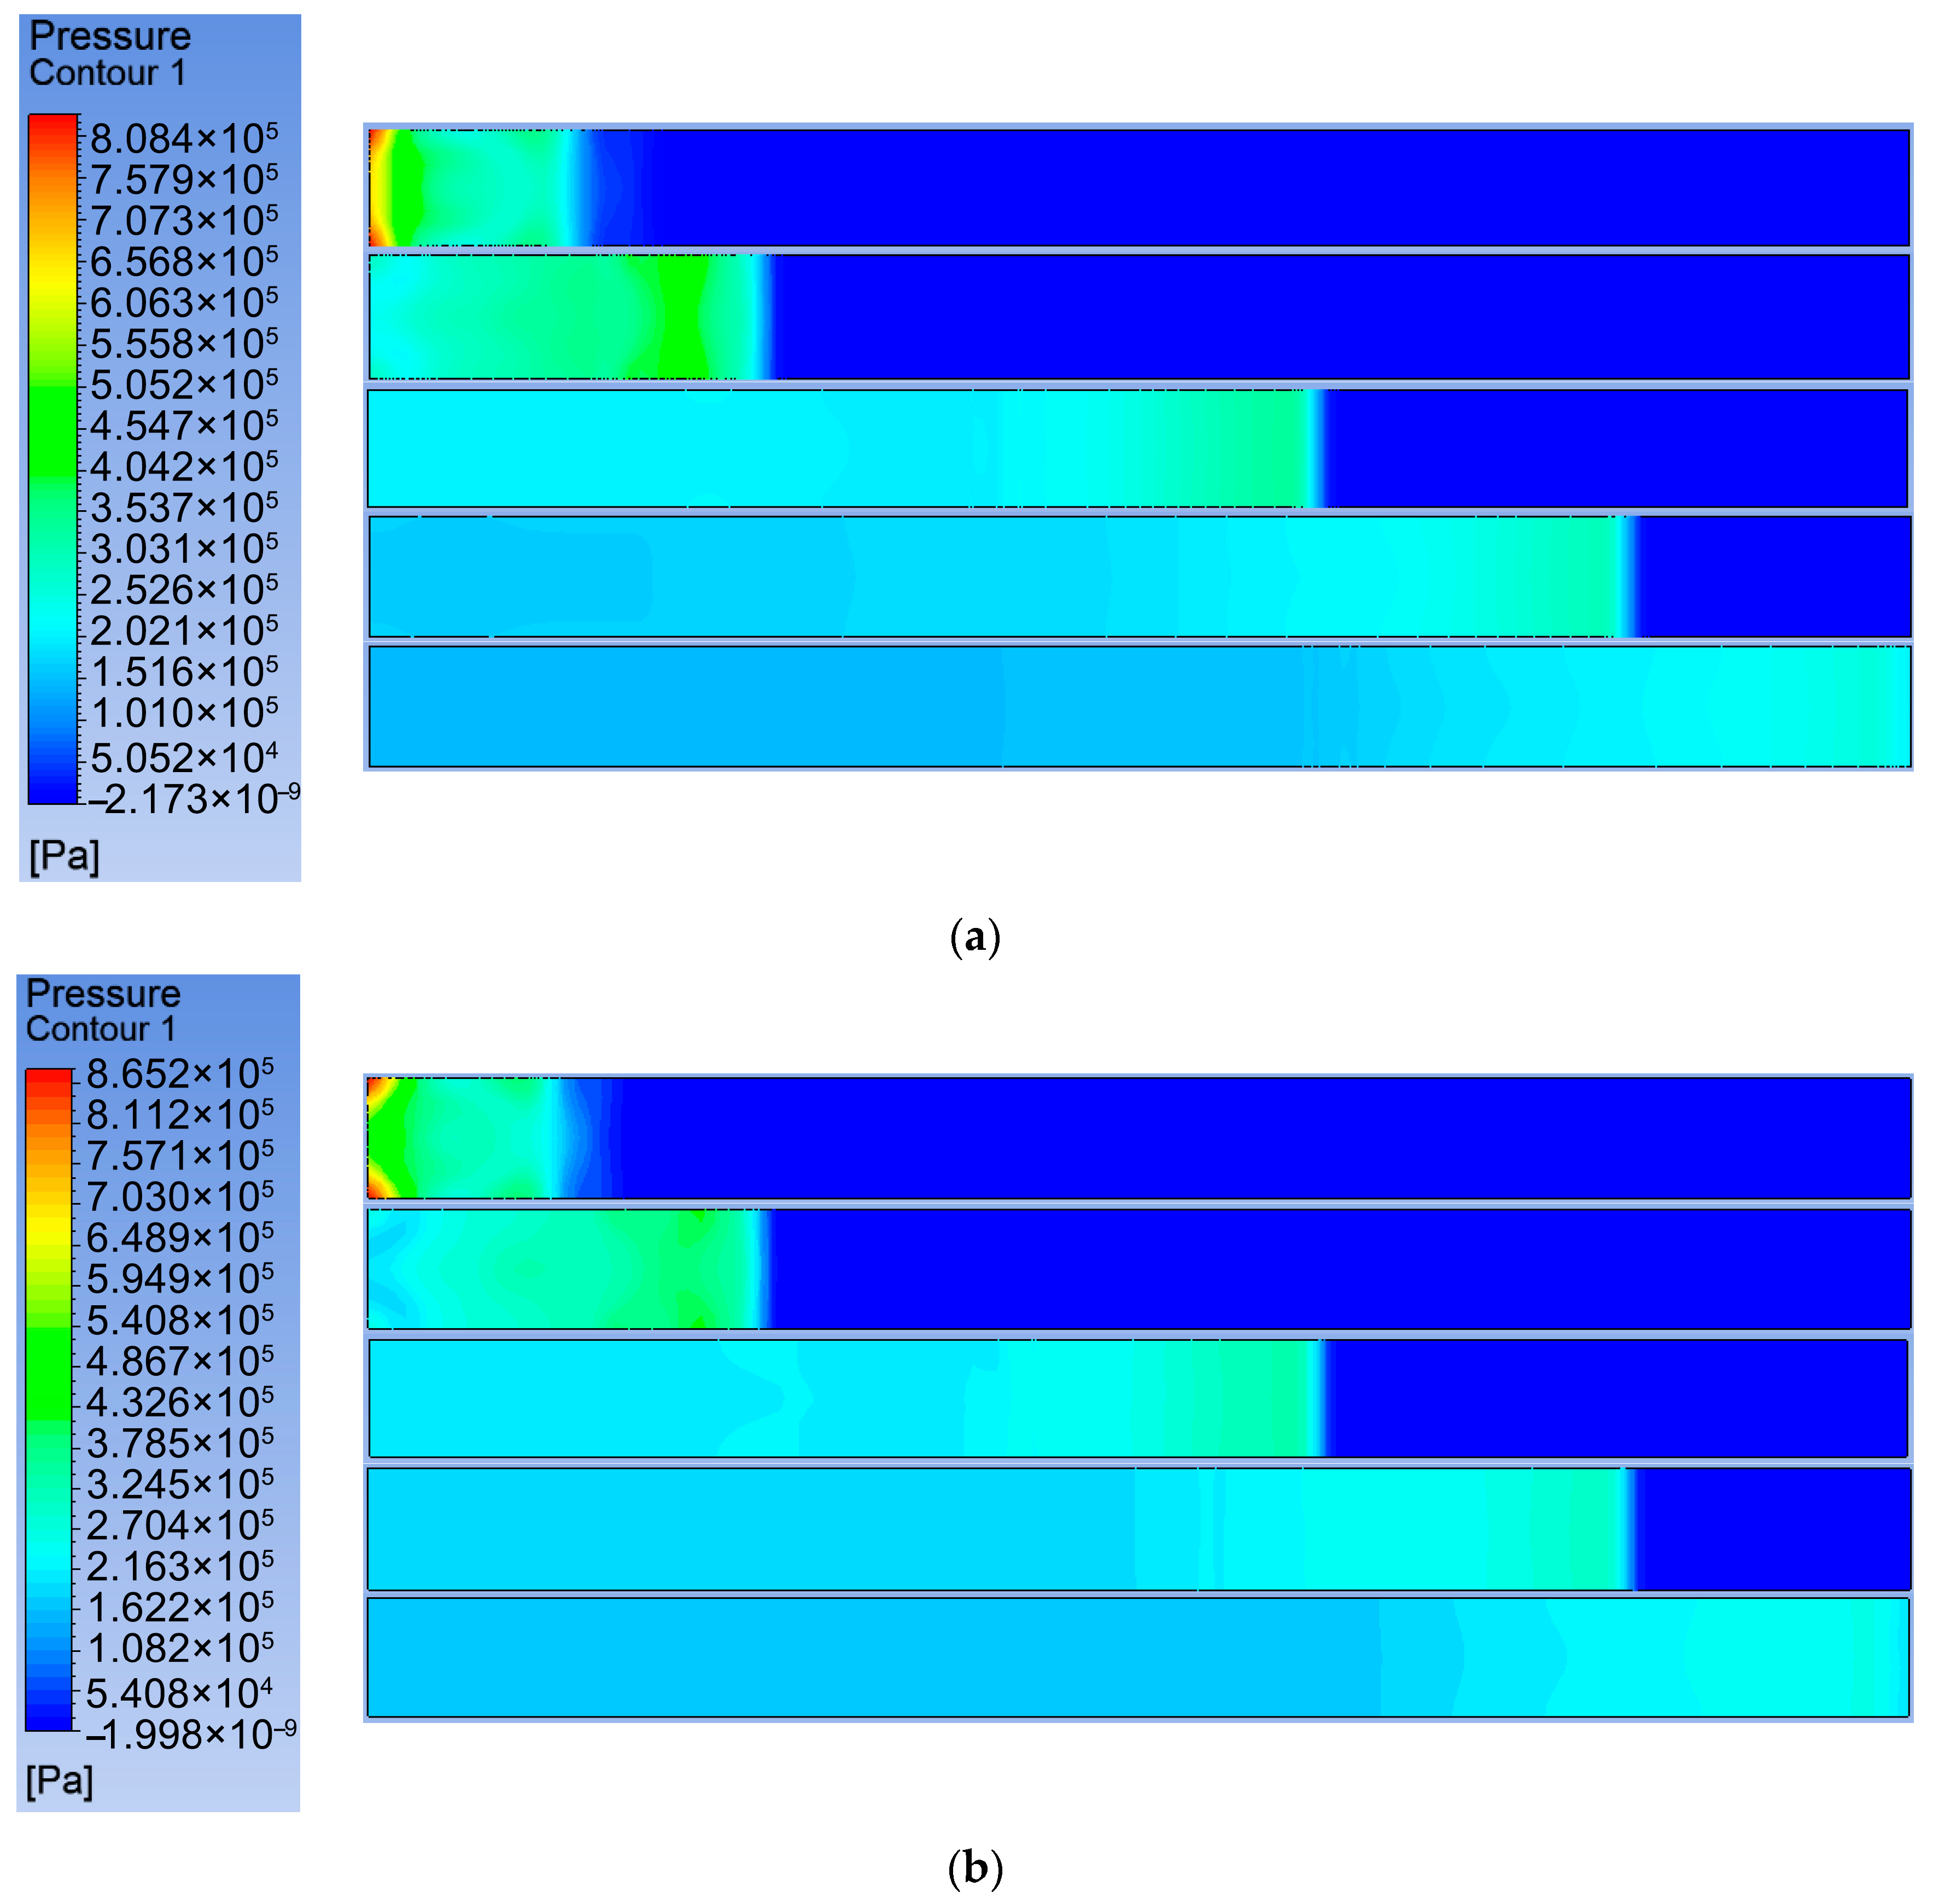
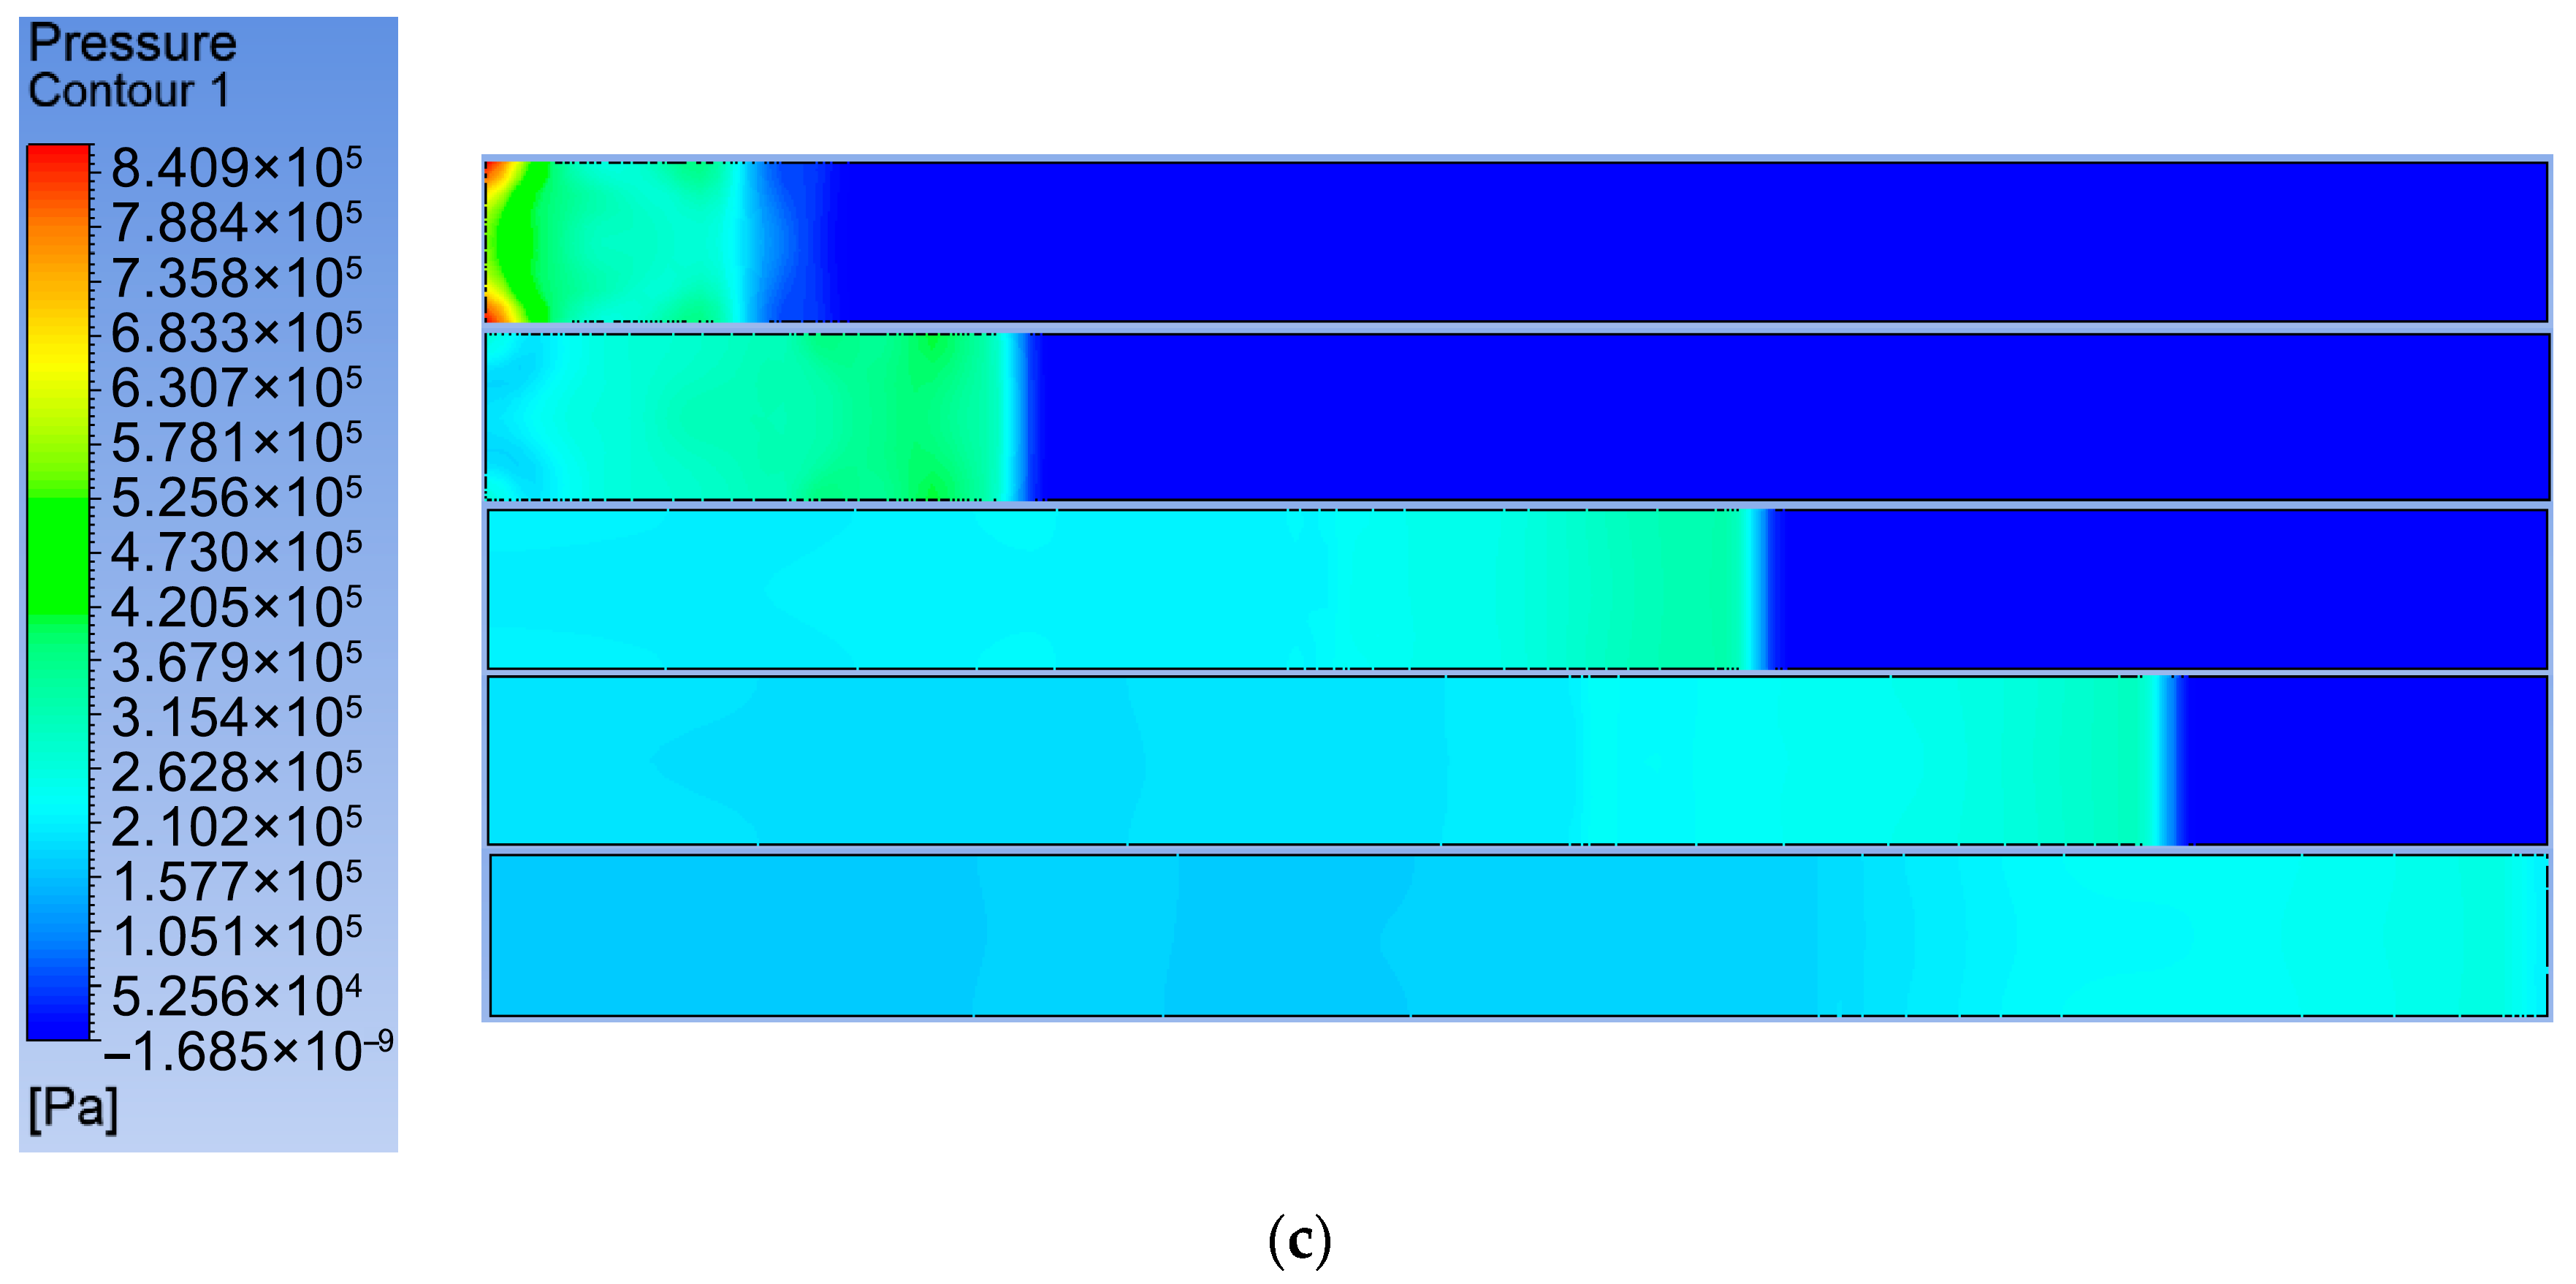
Quantitative analyses based on the methane-air premixed gas overpressure field distribution cloud diagrams in Figure 6a–c show that the fuel equivalence ratio has a significant modulation on the propagation dynamics of the explosive shock wave. The numerical results show that when the methane volume fraction is 9.5 % (Figure 6b), the explosion process meets the conditions of the chemical equivalence ratio, forming a complete Chapman–Jouguet detonation structure, and the distribution of isobars in the overpressure field shows typical concentric circle geometry (radial spacing increment Δ r = 0.25   m ), indicating that the combustion reaction is complete and the energy release efficiency is the highest in this working condition. At this time, the amplitude of the pressure gradient behind the wavefront was in the range of 0.15–0.22 M P a / m , and its relative rate of change was 38 ~ 42 % lower than that of other conditions, which confirmed the effective aggregation of shock wave energy in the propagation process.
In contrast, 7 % (Figure 6a) of the lean combustion condition is limited by the combustion reaction rate due to insufficient fuel, the maximum peak overpressure decreases 27.4 % compared with that of the equivalent condition, the isobar contour density increases to Δ r = 0.15   m , and the isobar curvature distortion phenomenon occurs in the region of 20 m away from the source of the blast, which is attributed to the oblique pressure effect generated by the shock wave and the boundary layer of the channel wall. Notably, 12 % (Figure 6c) of the rich combustion condition is limited by the explosion limit. The constraints present multimodal combustion characteristics, and its isobar topology presents asymmetric branching patterns, locally forming high-pressure subdomains with self-sustained propagation characteristics (diameter d = 0.6 ~ 0.8   m ), which is closely related to the turbulent flame acceleration mechanism triggered by secondary ignition of the unburned gas. It is worth noting that all the conditions show an exponential decrease in the pressure decay rate with the propagation distance, which is consistent with the trend predicted by the classical Friedlander shock wave decay theory. In all sub-diagrams, when the shock wave is 10 m away from the closed end, the pressure near the wall is obviously higher than that at the center. At this time, the shock wave is still in the formation stage, with the formation of arc-shaped reflected waves after impact with the wall and diffraction between the reflected waves, resulting in obvious disturbances in front of the shock wave at this time. The transverse waves appearing ahead of the wave front at this stage are a hallmark of detonation, and they manifest more distinctly at 9.5% methane concentration, indicating an earlier onset of detonation compared to other concentrations.
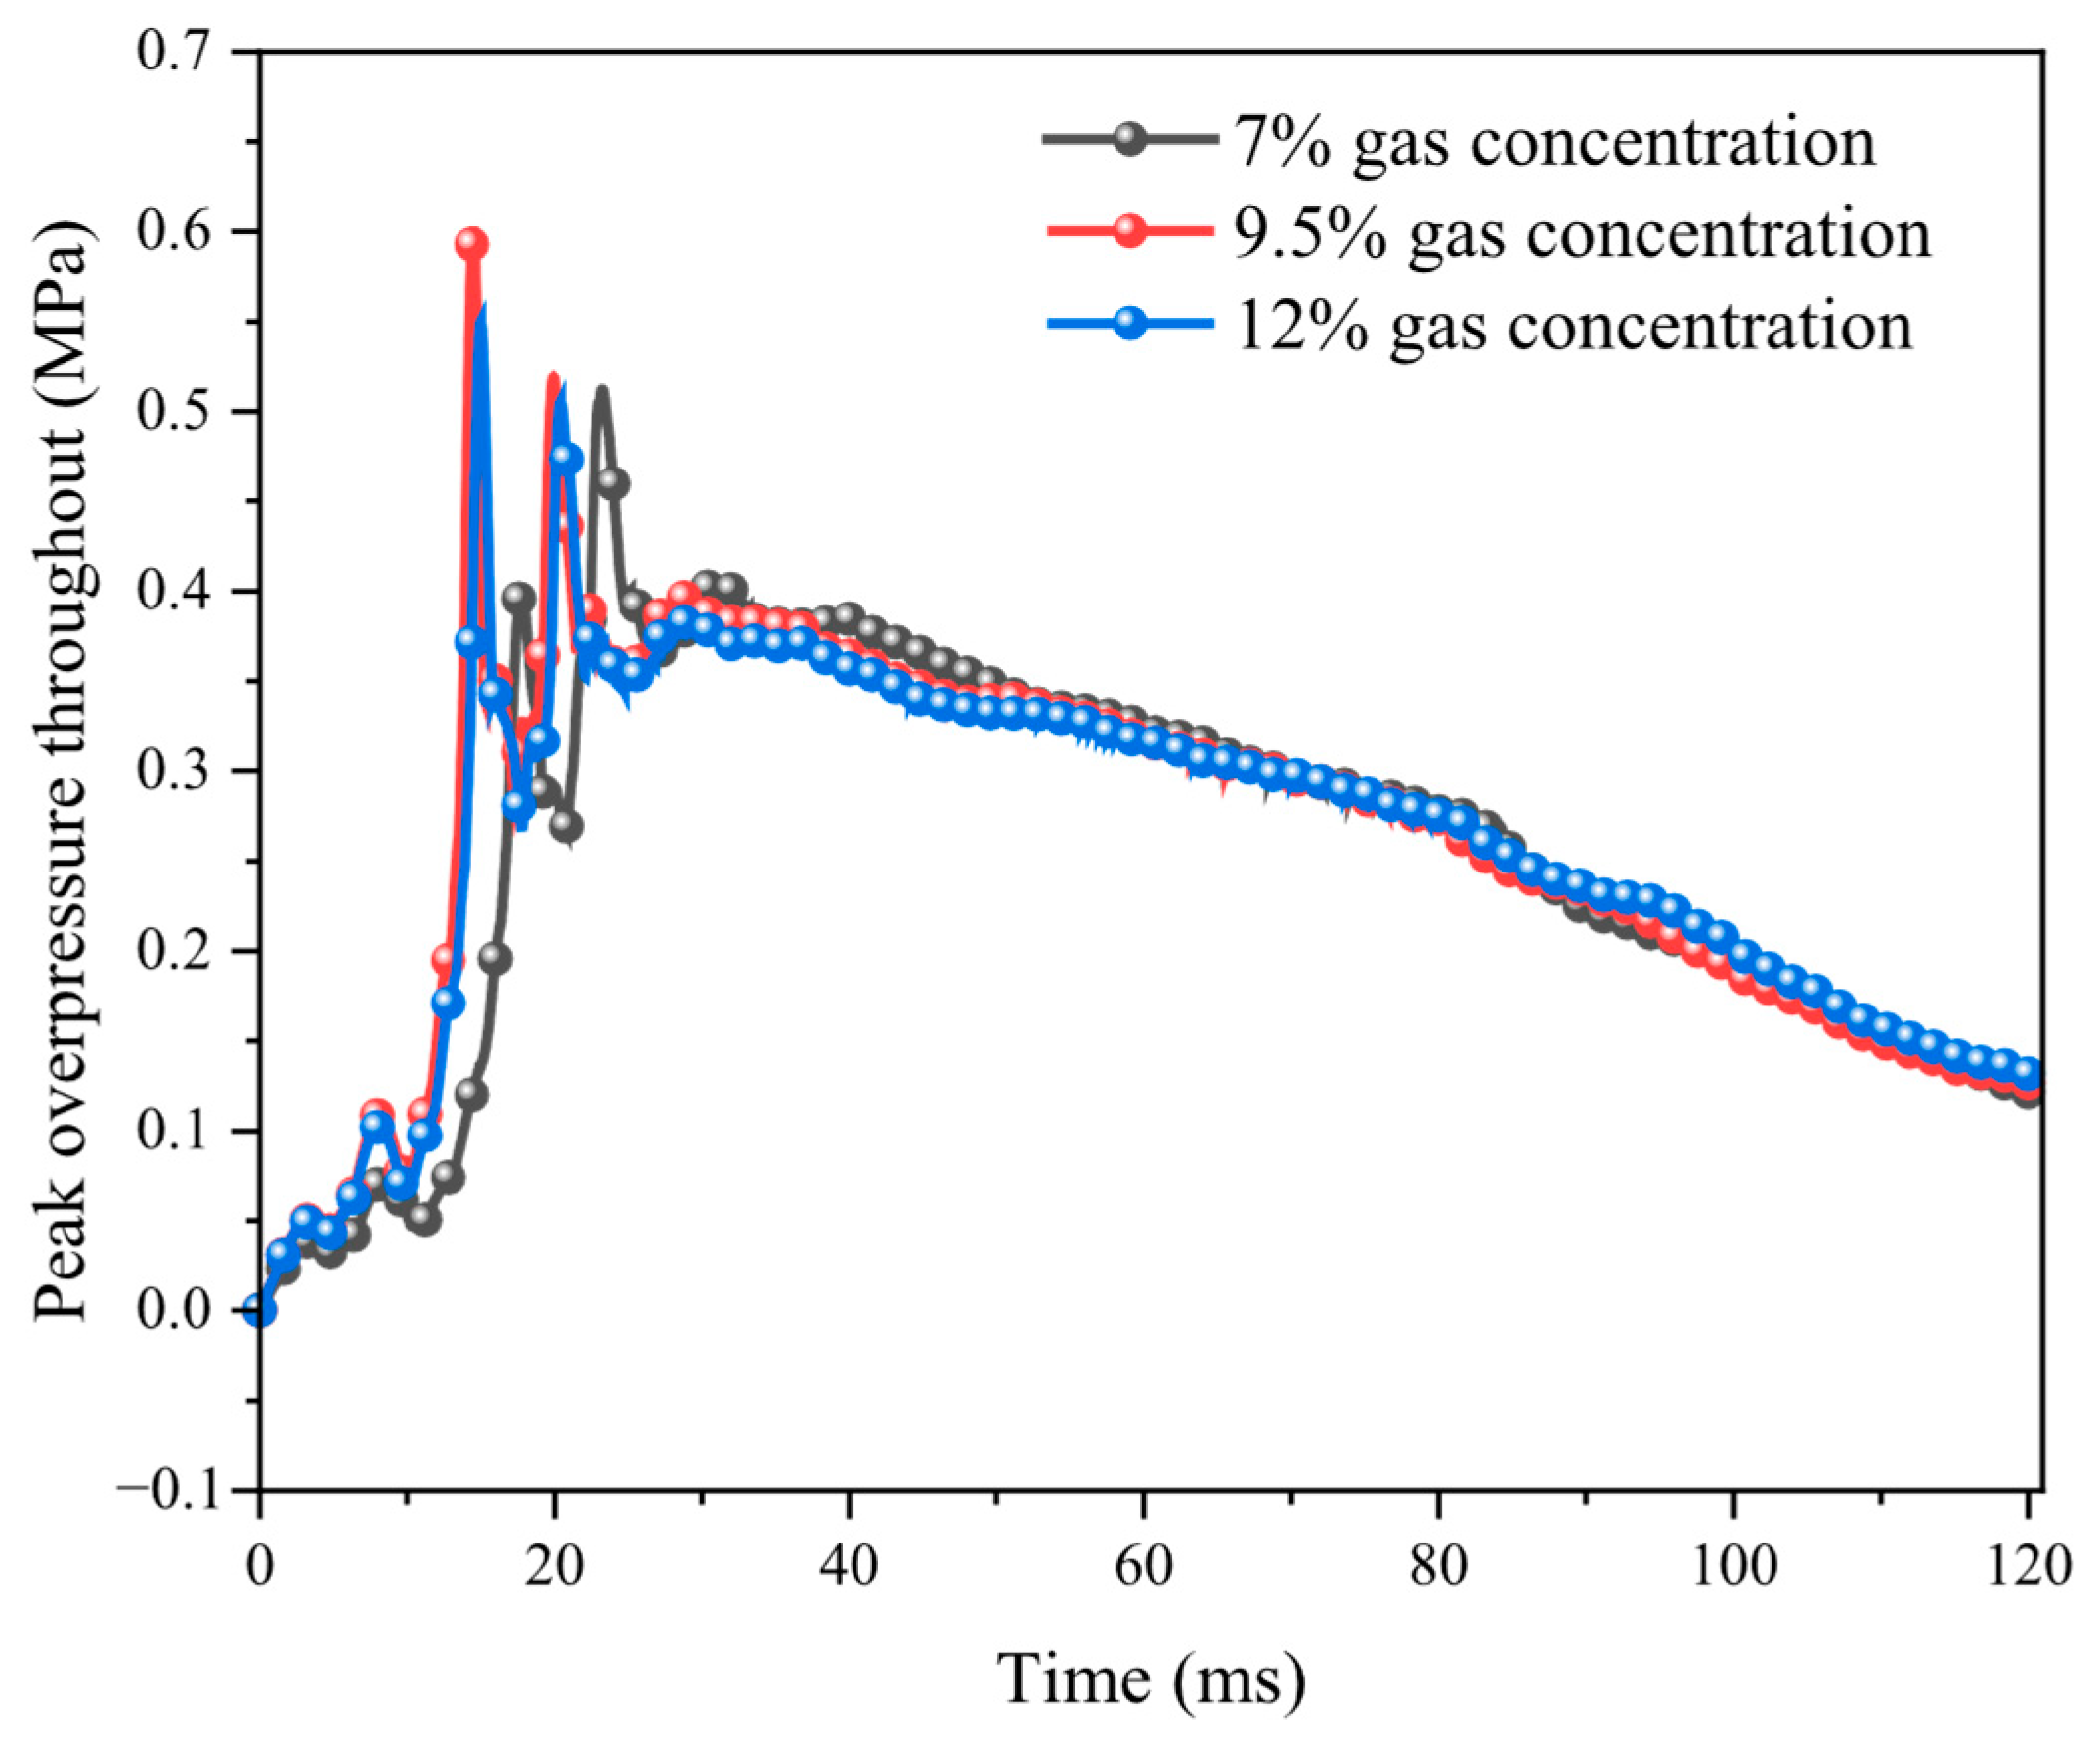
Figure 7 reveals the regulatory mechanism of methane volume fraction on the temporal evolution of explosion overpressure. Moreover, 7 % (black curve), 9.5 % (red curve), and 12 %   (blue curve) conditions all show characteristic bimodal pressure evolution. The first peak corresponds to the initial positive impact between the shock wave and the surrounding rock of the tunnel, and the second peak is dominated by the superposition effect of the compression wave formed by the reflection of the shock wave in the closed end face. At this stage, shock waves dominate energy release. Detonation formation occurs primarily in three phases, as illustrated by the pressure curve at 9.5% concentration. Before 11.8 ms, shock-flame interactions induce Richtmyer–Meshkov instability, causing flame surface destabilization. Turbulent flames significantly increase combustion surface area, enhancing energy release and generating high-intensity pressure waves. During 11.8–21.3 ms, the shock wave contacts the confined space wall, generating reflected shocks that heat unburned gases. This causes shock bifurcation, forming recirculation zones that entrain flames, leading to Hot Spots consistently appearing in unburned regions. At 21.3 ms, driven by the Zeldovich Gradient Mechanism, spontaneous reaction waves propagate along gradients and transition to detonation [27]. Moreover, 12 % rich-fire conditions and 9.5 % equivalent conditions meet the CJ blast condition (Chapman–Jouguet velocity theory v = 682   m / s [28]), and the actual propagation velocity of the shock wave reaches 512   m / s and 618   m / s , respectively, and this propagation characteristic makes the first peak appear 1.8 ms earlier ( t t 1 = 14.6 % ) than the lean-burn condition ( 7 % ). In the lean condition ( 7 % ), the combustion efficiency decreases to 73.2 % (calculated by integrating the heat release rate) due to fuel limitation, resulting in a 9 % decrease in the first peak pressure amplitude ( P m a x = 0.19   M P a ) compared to the equivalent condition, with a significant phase delay.

3.3. Laws of Shock Wave Propagation in Gas Explosions

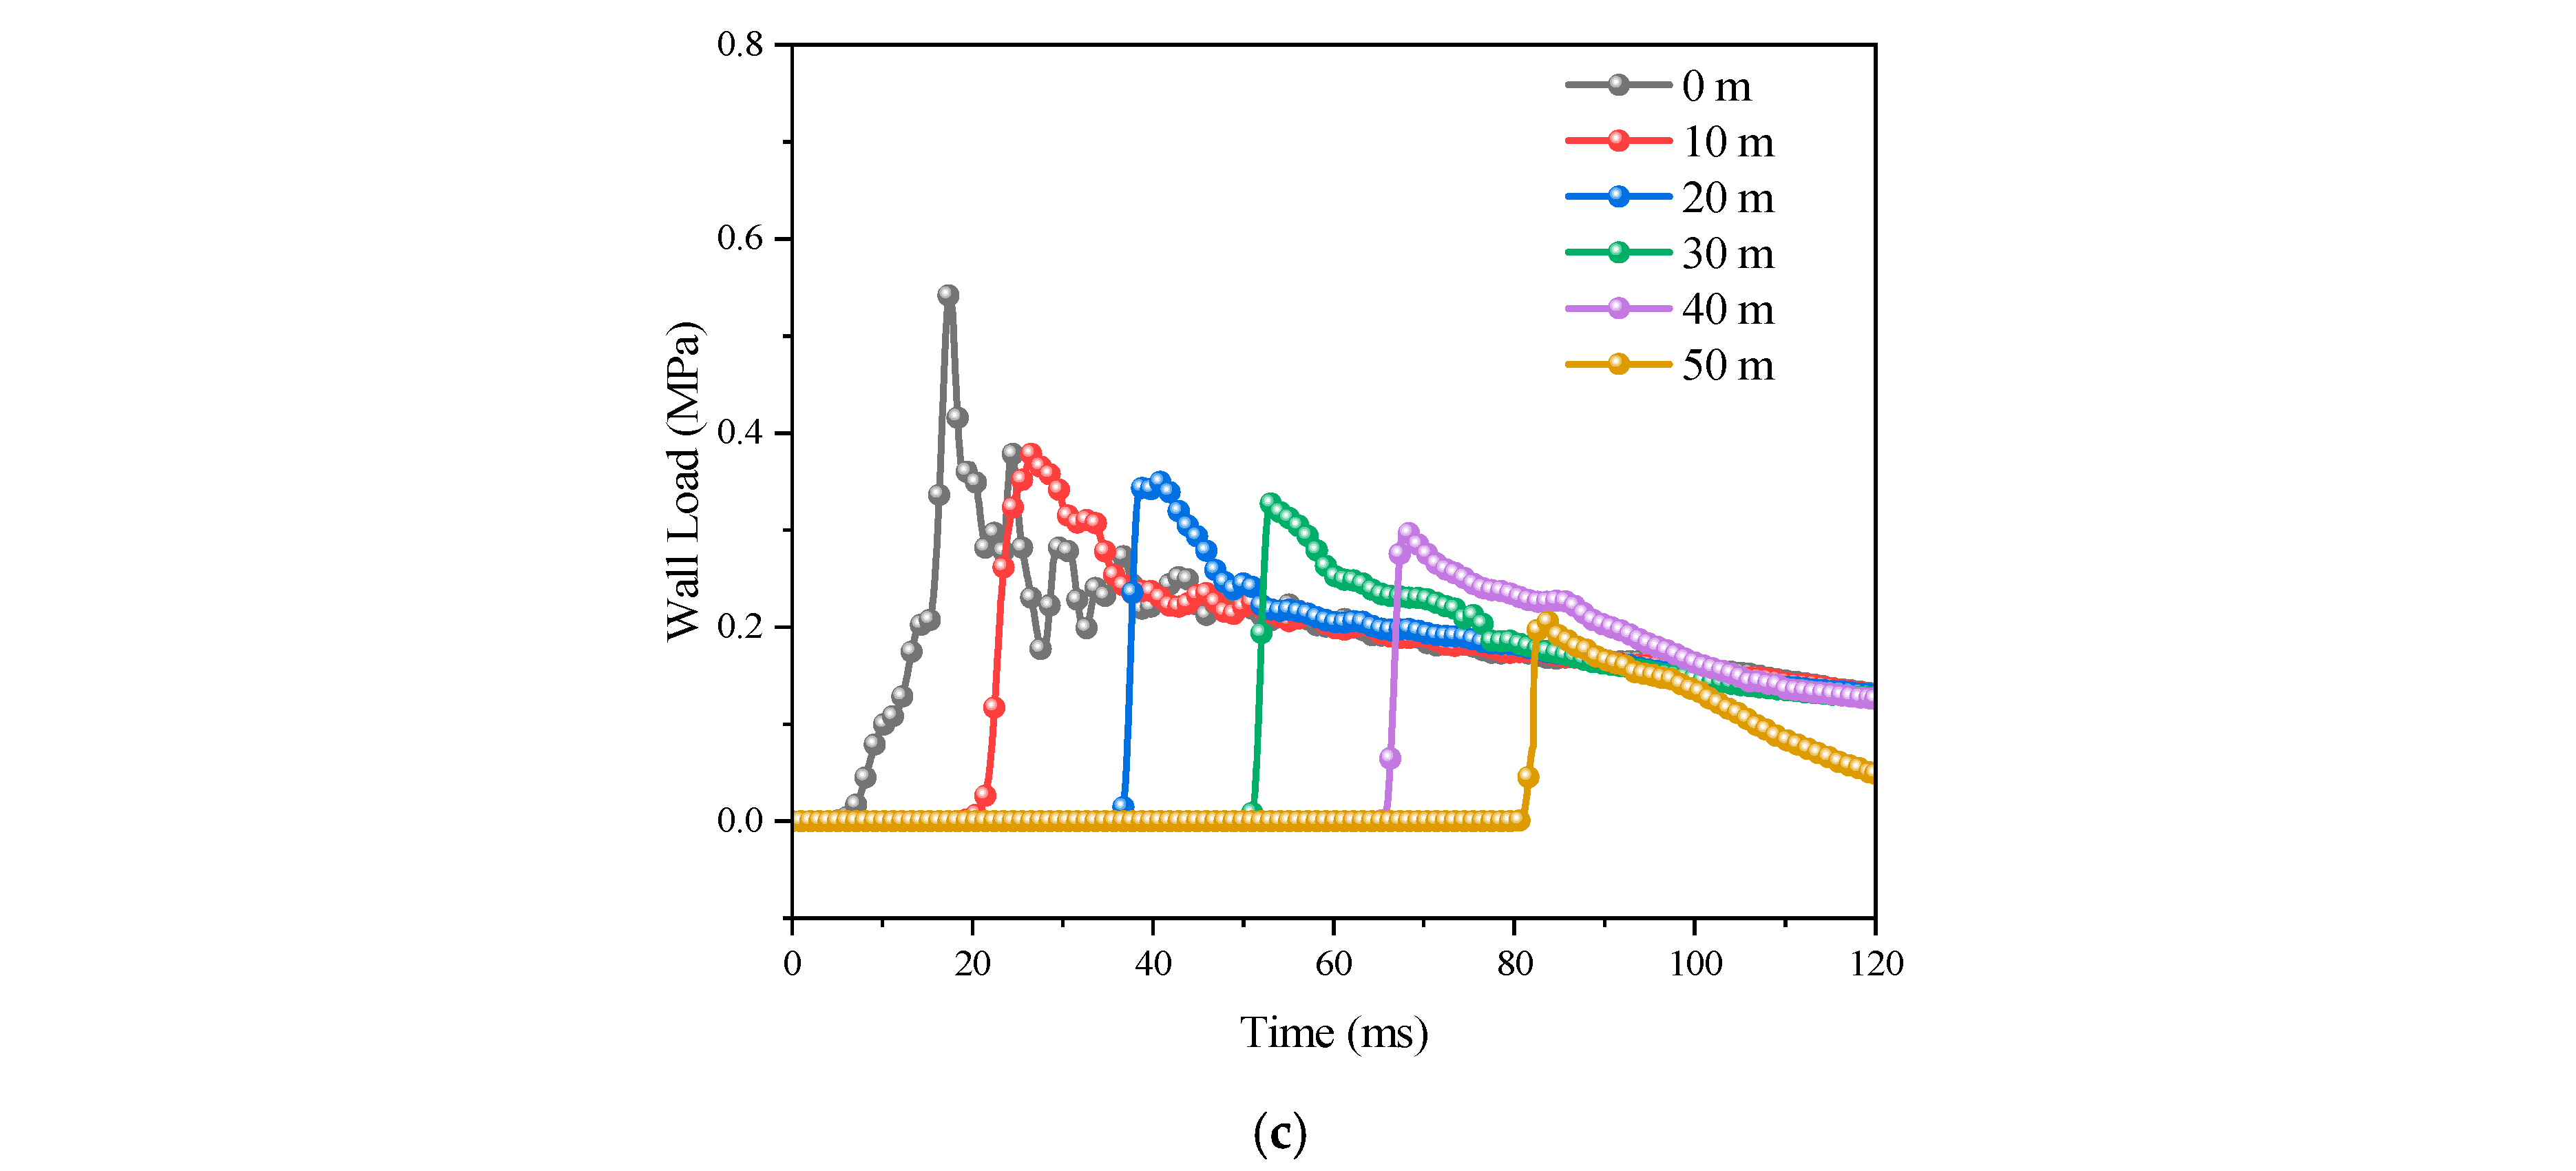
After ignition triggering, the time-course evolution of the pressure on the wall surface of the tunnel enclosure showed significant nonlinear dynamics (Figure 8a–c), and the physical process can be deconstructed into three characteristic phases. The stage of detonation and turbulence development ( t 1 = 0 18   m s ): the initial compression wave system and the wall surface undergo multimodal reflection coupling, which induces the instability of the shear layer to form a Kelvin–Helmholtz vortex structure [29], leading to periodic pressure oscillations in the near-field area ( L = 0   m ). In this stage, the pressure rise rate reaches an extreme value, and the pressure pulsation shows multi-peak characteristics. Quasi-steady propagation phase ( t 2 = 18 82   m s ): a self-similar propagation mode is formed under the constraints of the channel geometry, and the energy dissipation mechanism is dominated by viscous dissipation together with turbulent kinetic energy transport. The along-track decay of the pressure peak is consistent with the P ( x ) = P 0 e α x model, where P 0 is the initial pressure, α is the pressure decay rate constant, and x is the propagation distance, and the time delay of the pressure rise at the neighboring monitoring point ( Δ L = 10   m ) is linear. Expansion dissipation phase ( t 3 = 82 120   m s ): the open-end boundary induces a Prandtl–Meyer expansion wave system, forming a characteristic pressure plunge zone.
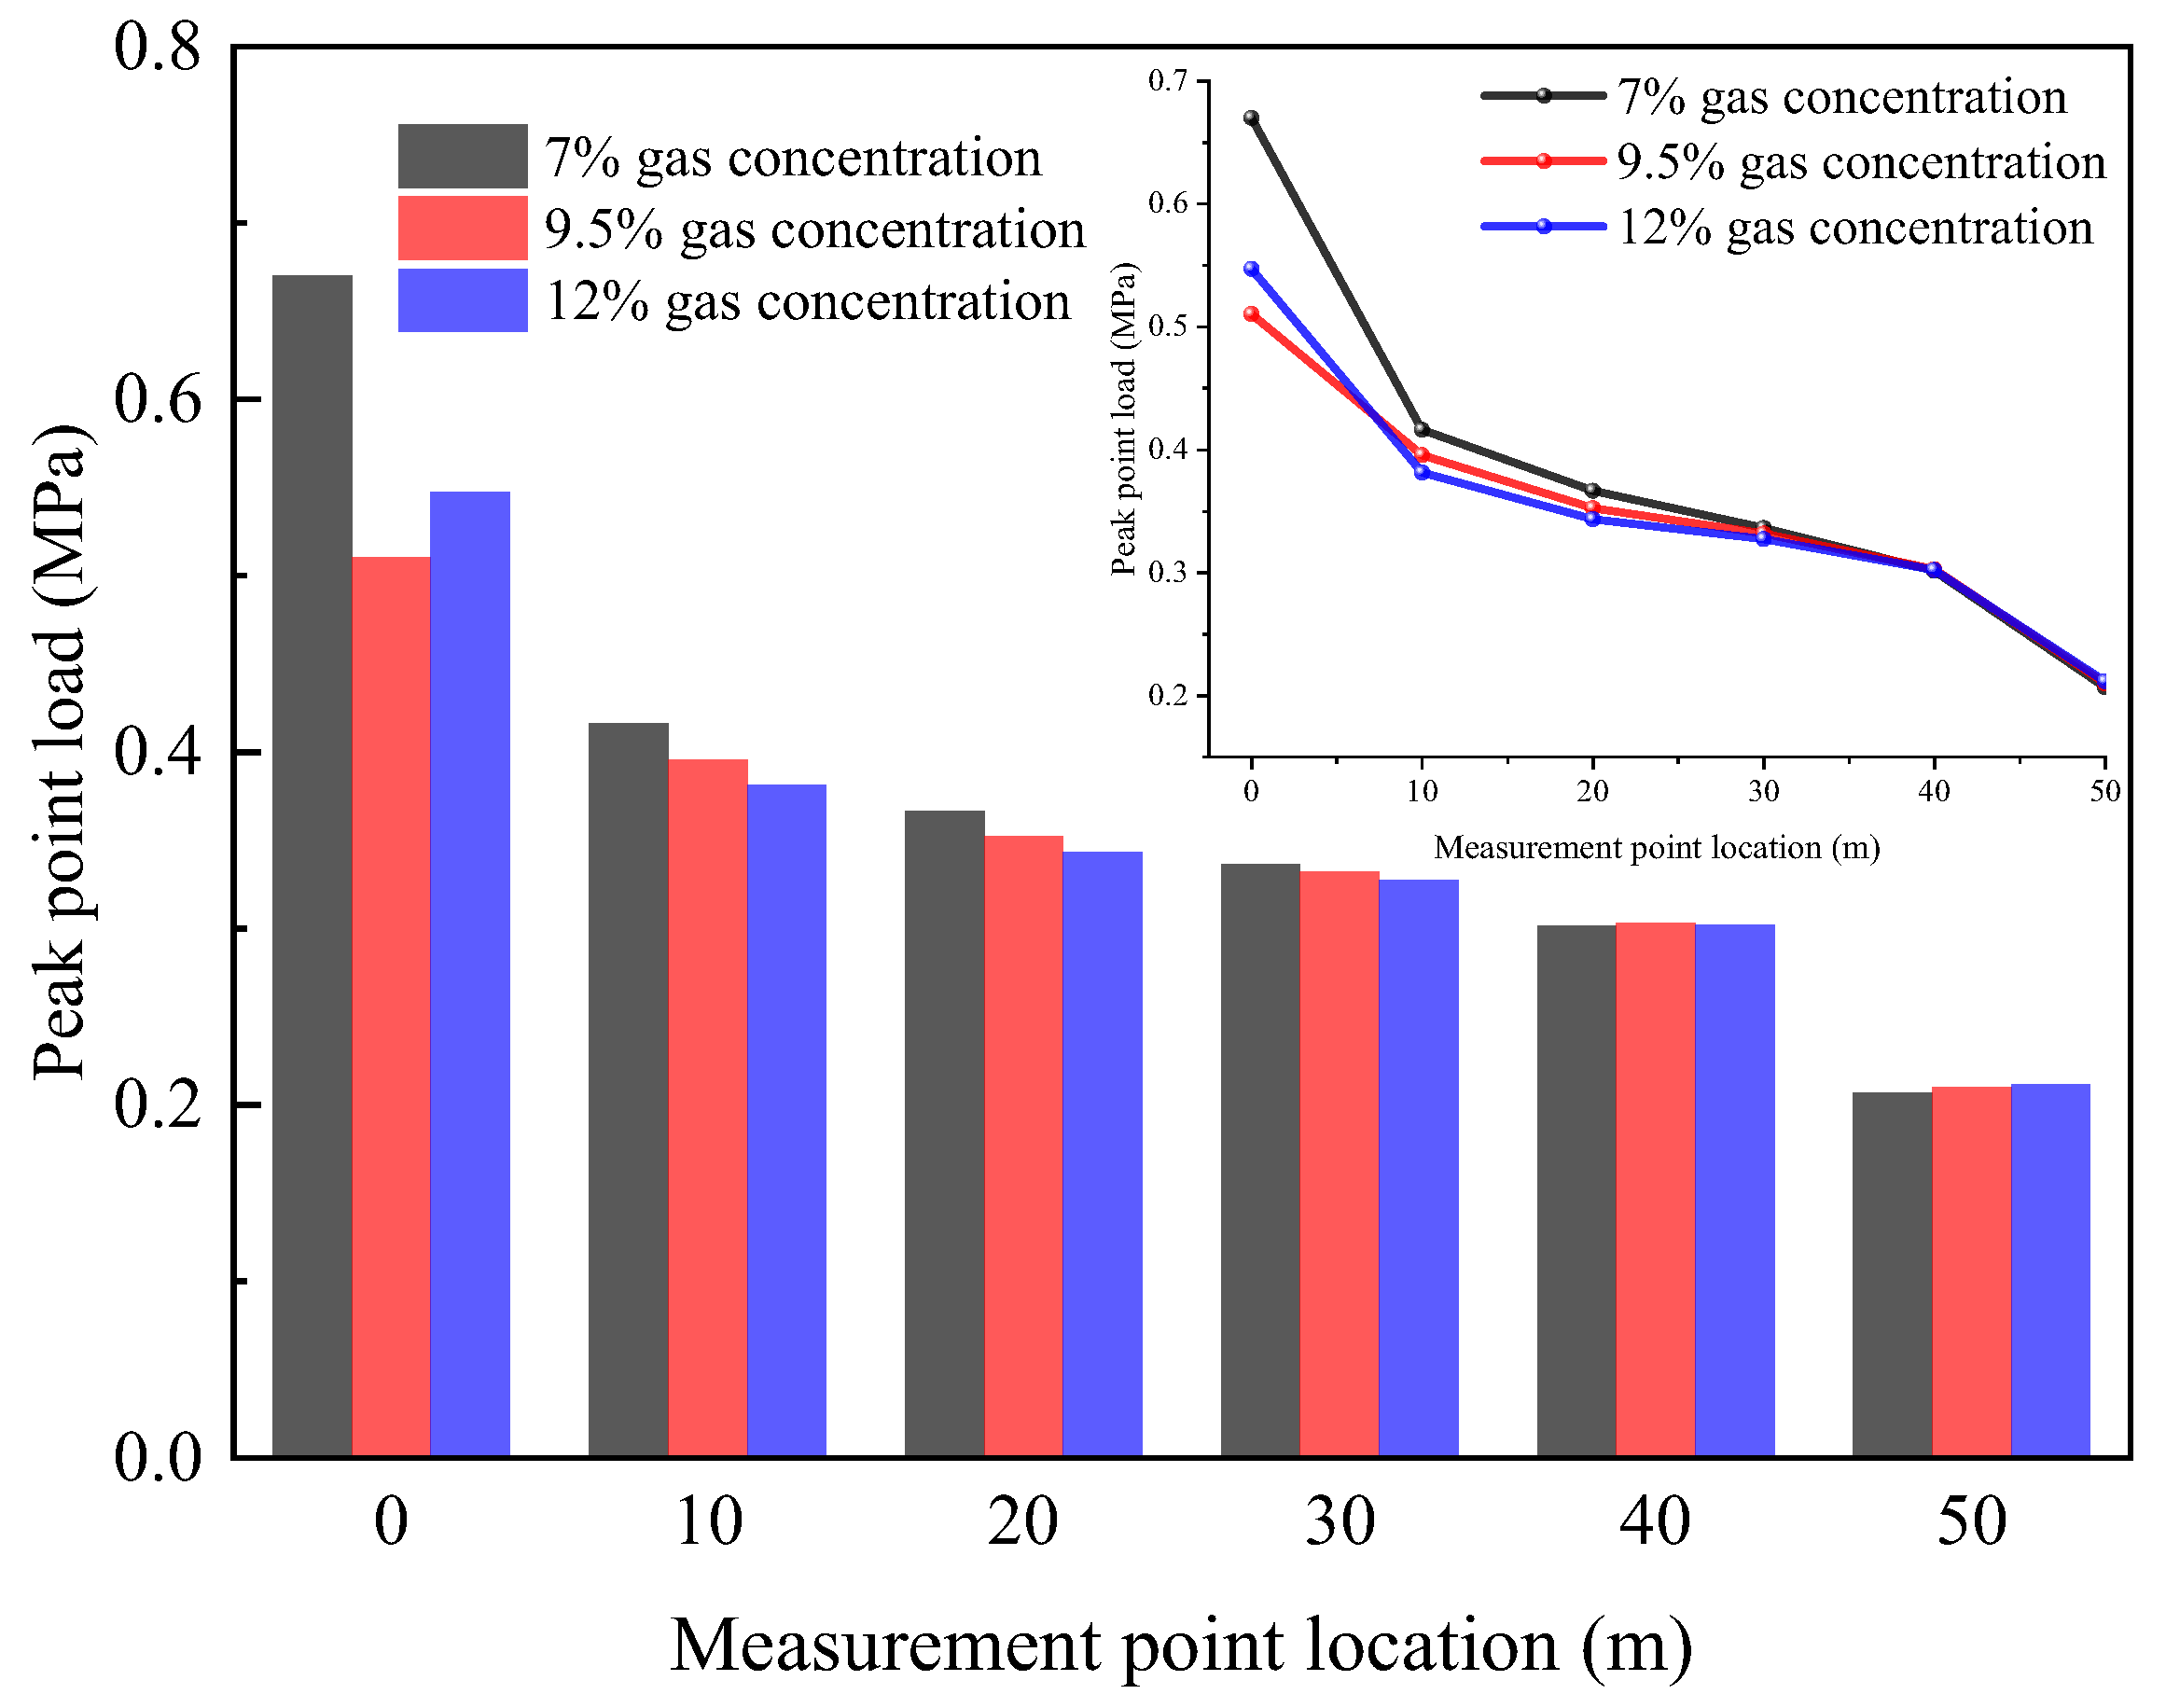
Figure 9 quantitatively reveals the modulation mechanism of methane volume fraction on the spatial decay pattern of explosion overpressure. The data from the near-field monitoring point ( L = 0 ) showed that the initial overpressure peak was 0.51   M P a (the lowest for all conditions) for the equivalence ratio condition ( 9.5 %   C H 4 ), while that for the lean-burn condition ( 7 % ) reached 0.67 MPa (the highest for all conditions), an anomaly closely related to the quadratic polar characteristic of the laminar combustion rate of the gas mixture. The time-course evolution analysis shows that the pressure decay rate constants α = 0.309   m 1 and α = 0.203   m 1 for the lean combustion condition are increased by 67.9% and 10.3% compared with those of the equivalent condition ( α = 0.184   m 1 ), and the residual pressure decreases to 0.207   M P a at the exit of the roadway ( L = 50 ) (decaying by 69.3% from the initial peak value). The equivalent condition benefits from a near-theoretical optimal concentration, with a combustion efficiency of η c = 98.2 % (validated by the Arrhenius combustion model [30]), resulting in an energy density of 23.7   M J / m 3 , which is 28.8% and 41.1% higher than the lean ( 18.4   M J / m 3 ) and rich ( 16.8   M J / m 3 ) conditions, respectively. This energy advantage results in a shock wave front velocity of 618   m / s for the equivalent case. Although the lean-burn condition generates transient high-pressure pulses due to the rapid consumption of finite fuel, its low energy deposition efficiency leads to rapid dissipation of kinetic energy in the late stage of shock wave propagation. Laws of shock wave propagation in gas explosions.

4. Stress and Strain Analysis of Tunnel Wall Under Flow-Solid Coupling

4.1. Stress Analysis of Tunnel Wall Under Fluid-Solid Coupling

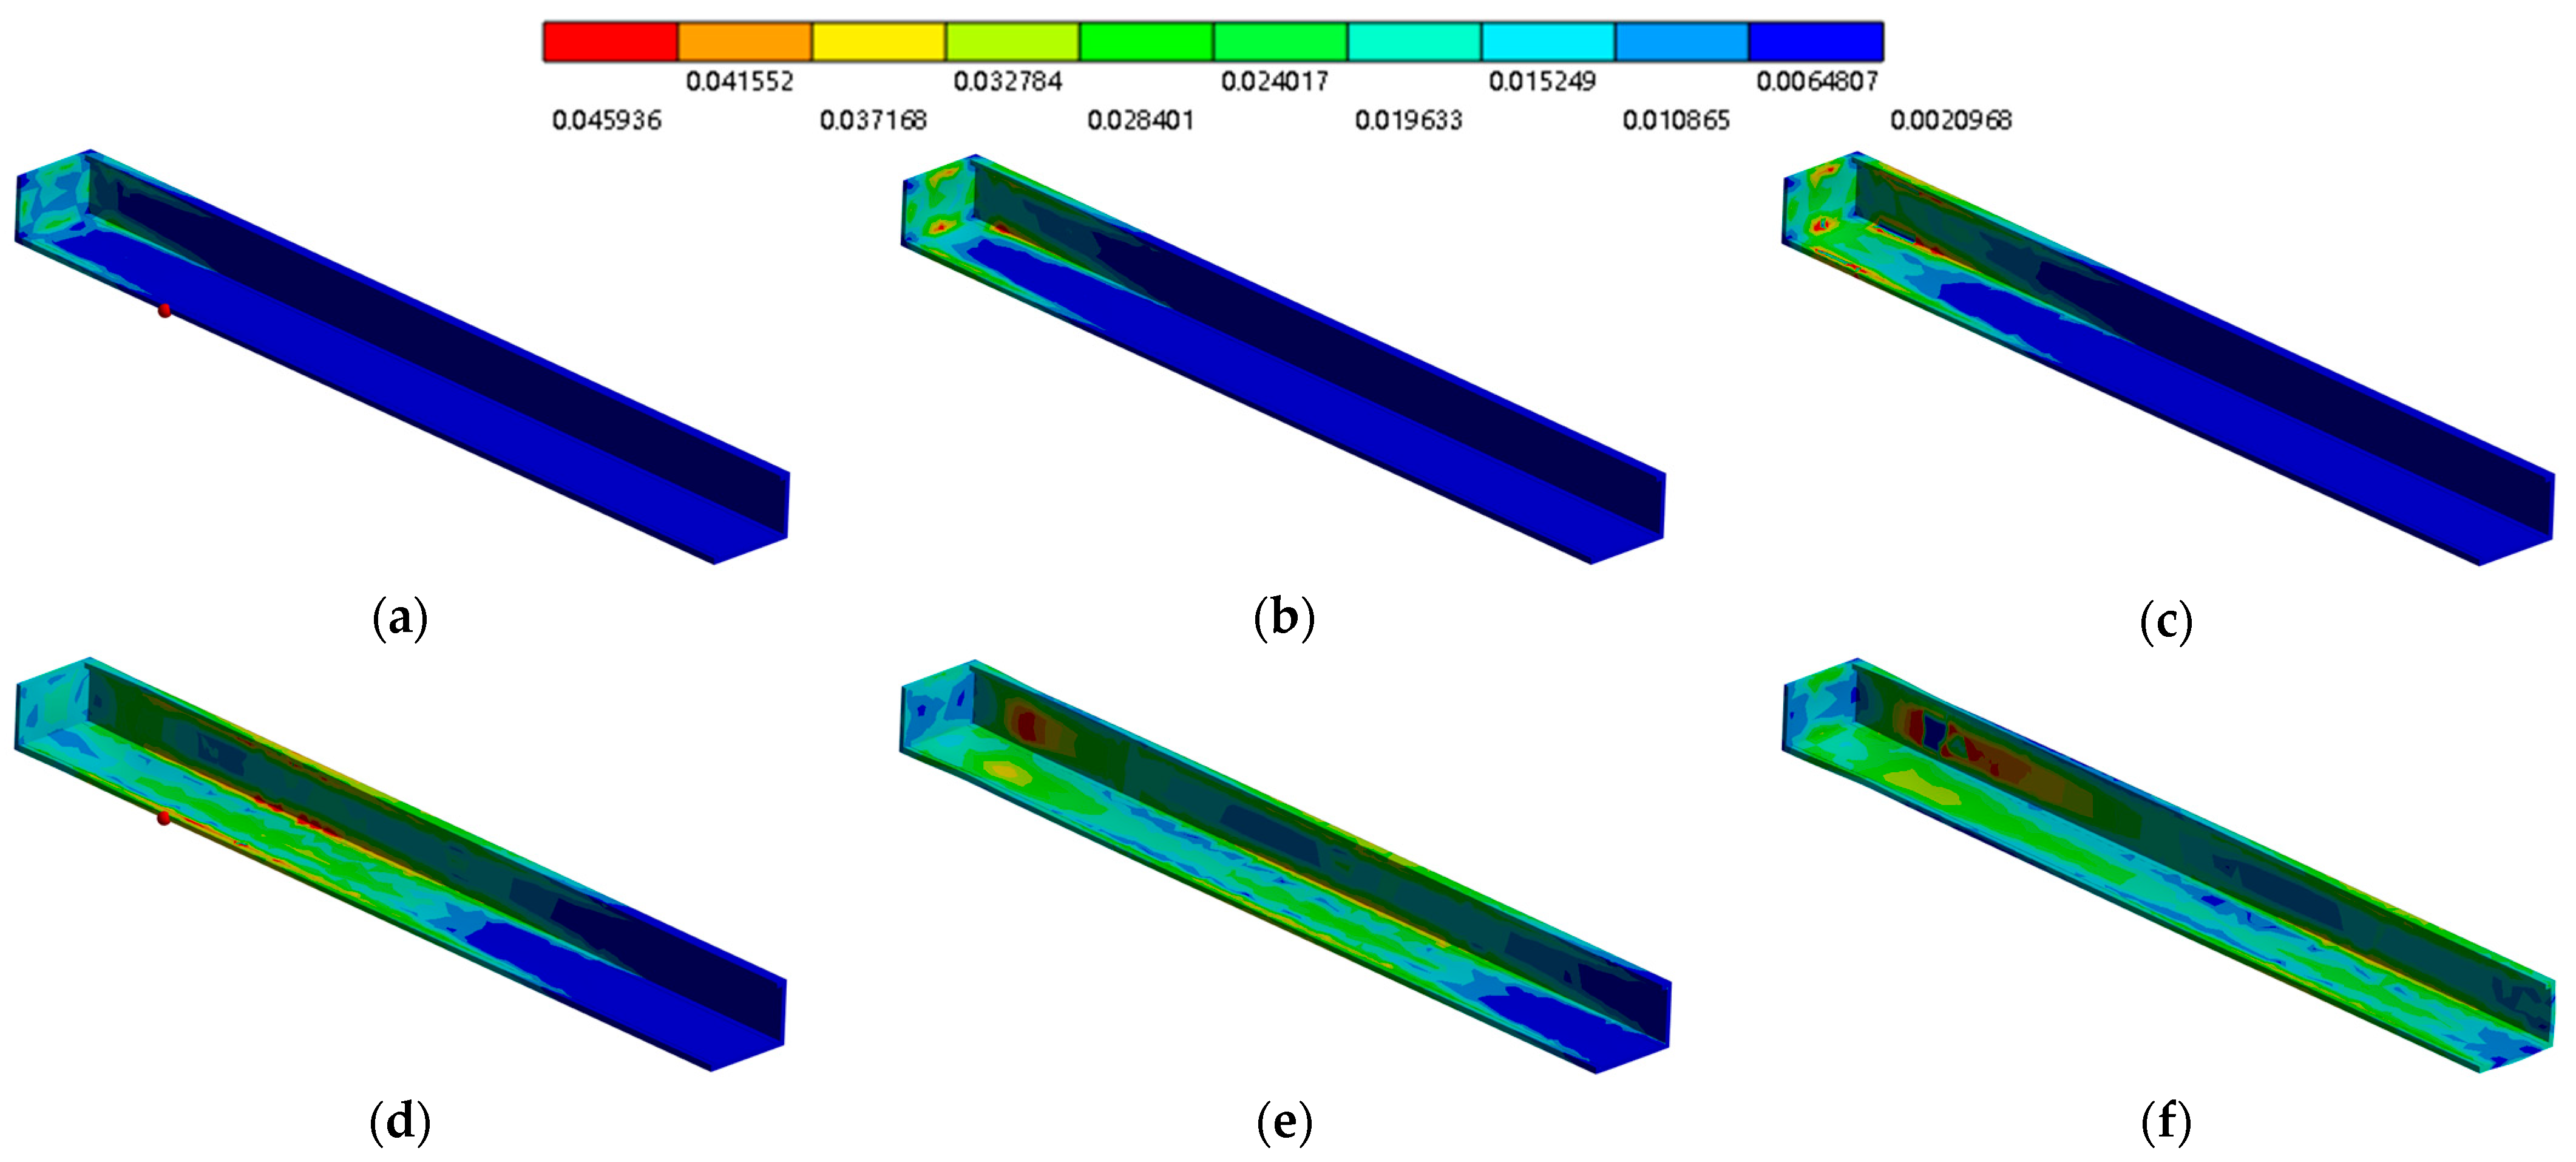
The dynamic mapping of the fluid pressure field to the solid mechanics field is realized by the System Coupling module, and the temporal and spatial evolution characteristics of the von Mises stress field in the surrounding rock at different measurement points are successfully reconstructed (Figure 10a–c). The numerical results show that the stress evolution patterns of different equivalent ratio working conditions have universal characteristics, so a typical equivalent working condition ( 9.5 %   CH 4 ) is selected for the mechanistic analysis:
Initial impact stage ( t = 0 ~ 20   m s ): the monitoring point at the confined end is affected by the interference effect of the multiple reflected waves, the stress appears to be a significant energy aggregation, and the maximum von Mises stress is 2.09 (the lowest for the full working condition). This phenomenon is in accordance with the Saint-Venant principle, but induces local stress tensor anisotropy. Steady-state propagation stage ( t = 20 ~ 80   m s ): the stress wave shows a characteristic hyperbolic decay pattern, and the peak stress of 10.02 MPa is reached at the position of L = 10 . The speed of the stress wave remains constant during the propagation process, and the stress phase difference between the neighboring monitoring points ( L = 20 ) is converged from 3.2 ms to 0.8 ms, which indicates an increase in the rate of energy accumulation. Boundary dissipation phase ( t > 80   m s ): the monitoring points at the open end are affected by the turbulence-structure coupling resonance effect, and the amplitude of stress fluctuation increases. At this time, the stress energy flow density decreases compared to the initial value.
The numerical solution shows that there is a phase lag of 18 ms in the stress response relative to the pressure loading, and this phase lag phenomenon originates from the continuous loading in the high-pressure region behind the shock wave. The geometrical constraints at the closed end dominate the effect of the equivalence ratio, while the turbulence effect at the open end increases the sensitivity of the equivalence ratio. In particular, although the depleted combustion case ( 7 % ) has a maximum pressure pulse, its short-term loading characteristics do not match the dynamic response characteristics of the rate-dependent plasticity ontological model of the enclosing rock, resulting in only a small portion of the shock energy being converted into effective stress work, which is lower than that of the equivalent case.

4.2. Characterization of Damage Analysis of Roadway Perimeter Rock Under Fluid-Solid Coupling

The analysis of the explosion impact dynamics based on the equivalent ratio working condition ( 9.5 %   C H 4 ) shows (Figure 11) that the spatial and temporal evolution of the strain field of the tunnel enclosure follows a three-phase dynamic pattern:
Initial strain-inducing phase: when the shock wave array first contacts the enclosing rock interface, an elastic deformation field with a maximum principal strain of ε 1   =   0.01 ± 0.002   m m / m m is induced. The closed end is constrained by the Saint-Venant boundary effect to form a low-strain gradient zone, while the wall pinch point produces a strain concentration due to the stress three-dimensionality coefficient, forming a high-strain core with a diameter of d = 0.8   ±   0.1   m . Strain accumulation and propagation stage: the rear high-pressure zone drives plastic strain accumulation at a rate of ε = 2.1   ×   10 3   s 1 . The formation of composite strain bands in the near field of the burst source. The strain field is redirected to migrate through the Hill anisotropy model, resulting in a characteristic bulging deformation in the center of the wall. Residual strain stabilization phase: the open end of the expansion wave system is triggered by the reverse propagation of the strain decay front, and the explosion source area due to the accumulation of equivalent plastic strain forms a permanent deformation zone. At this point, the energy dissipation rate returns to the initial value of the enhancement.
The high stiffness property of the closed end limits the strain energy density to U = 0.18   M J / m 3 (67% lower than the open end). The high energy density of the equivalent case drives a two-mechanism deformation: plastic flow dominated by dislocation slip in the early stage ( T   <   35   m s ), and grain boundary migration dominated by the diffusion creep mechanism in the late stage ( T   >   35   m s ), with the dynamic equilibrium point of the two occurring at T = 35   ±   1.2   m s . Strain-phase analyses show that the equivalent plastic strains lag behind the von Mises stresses.
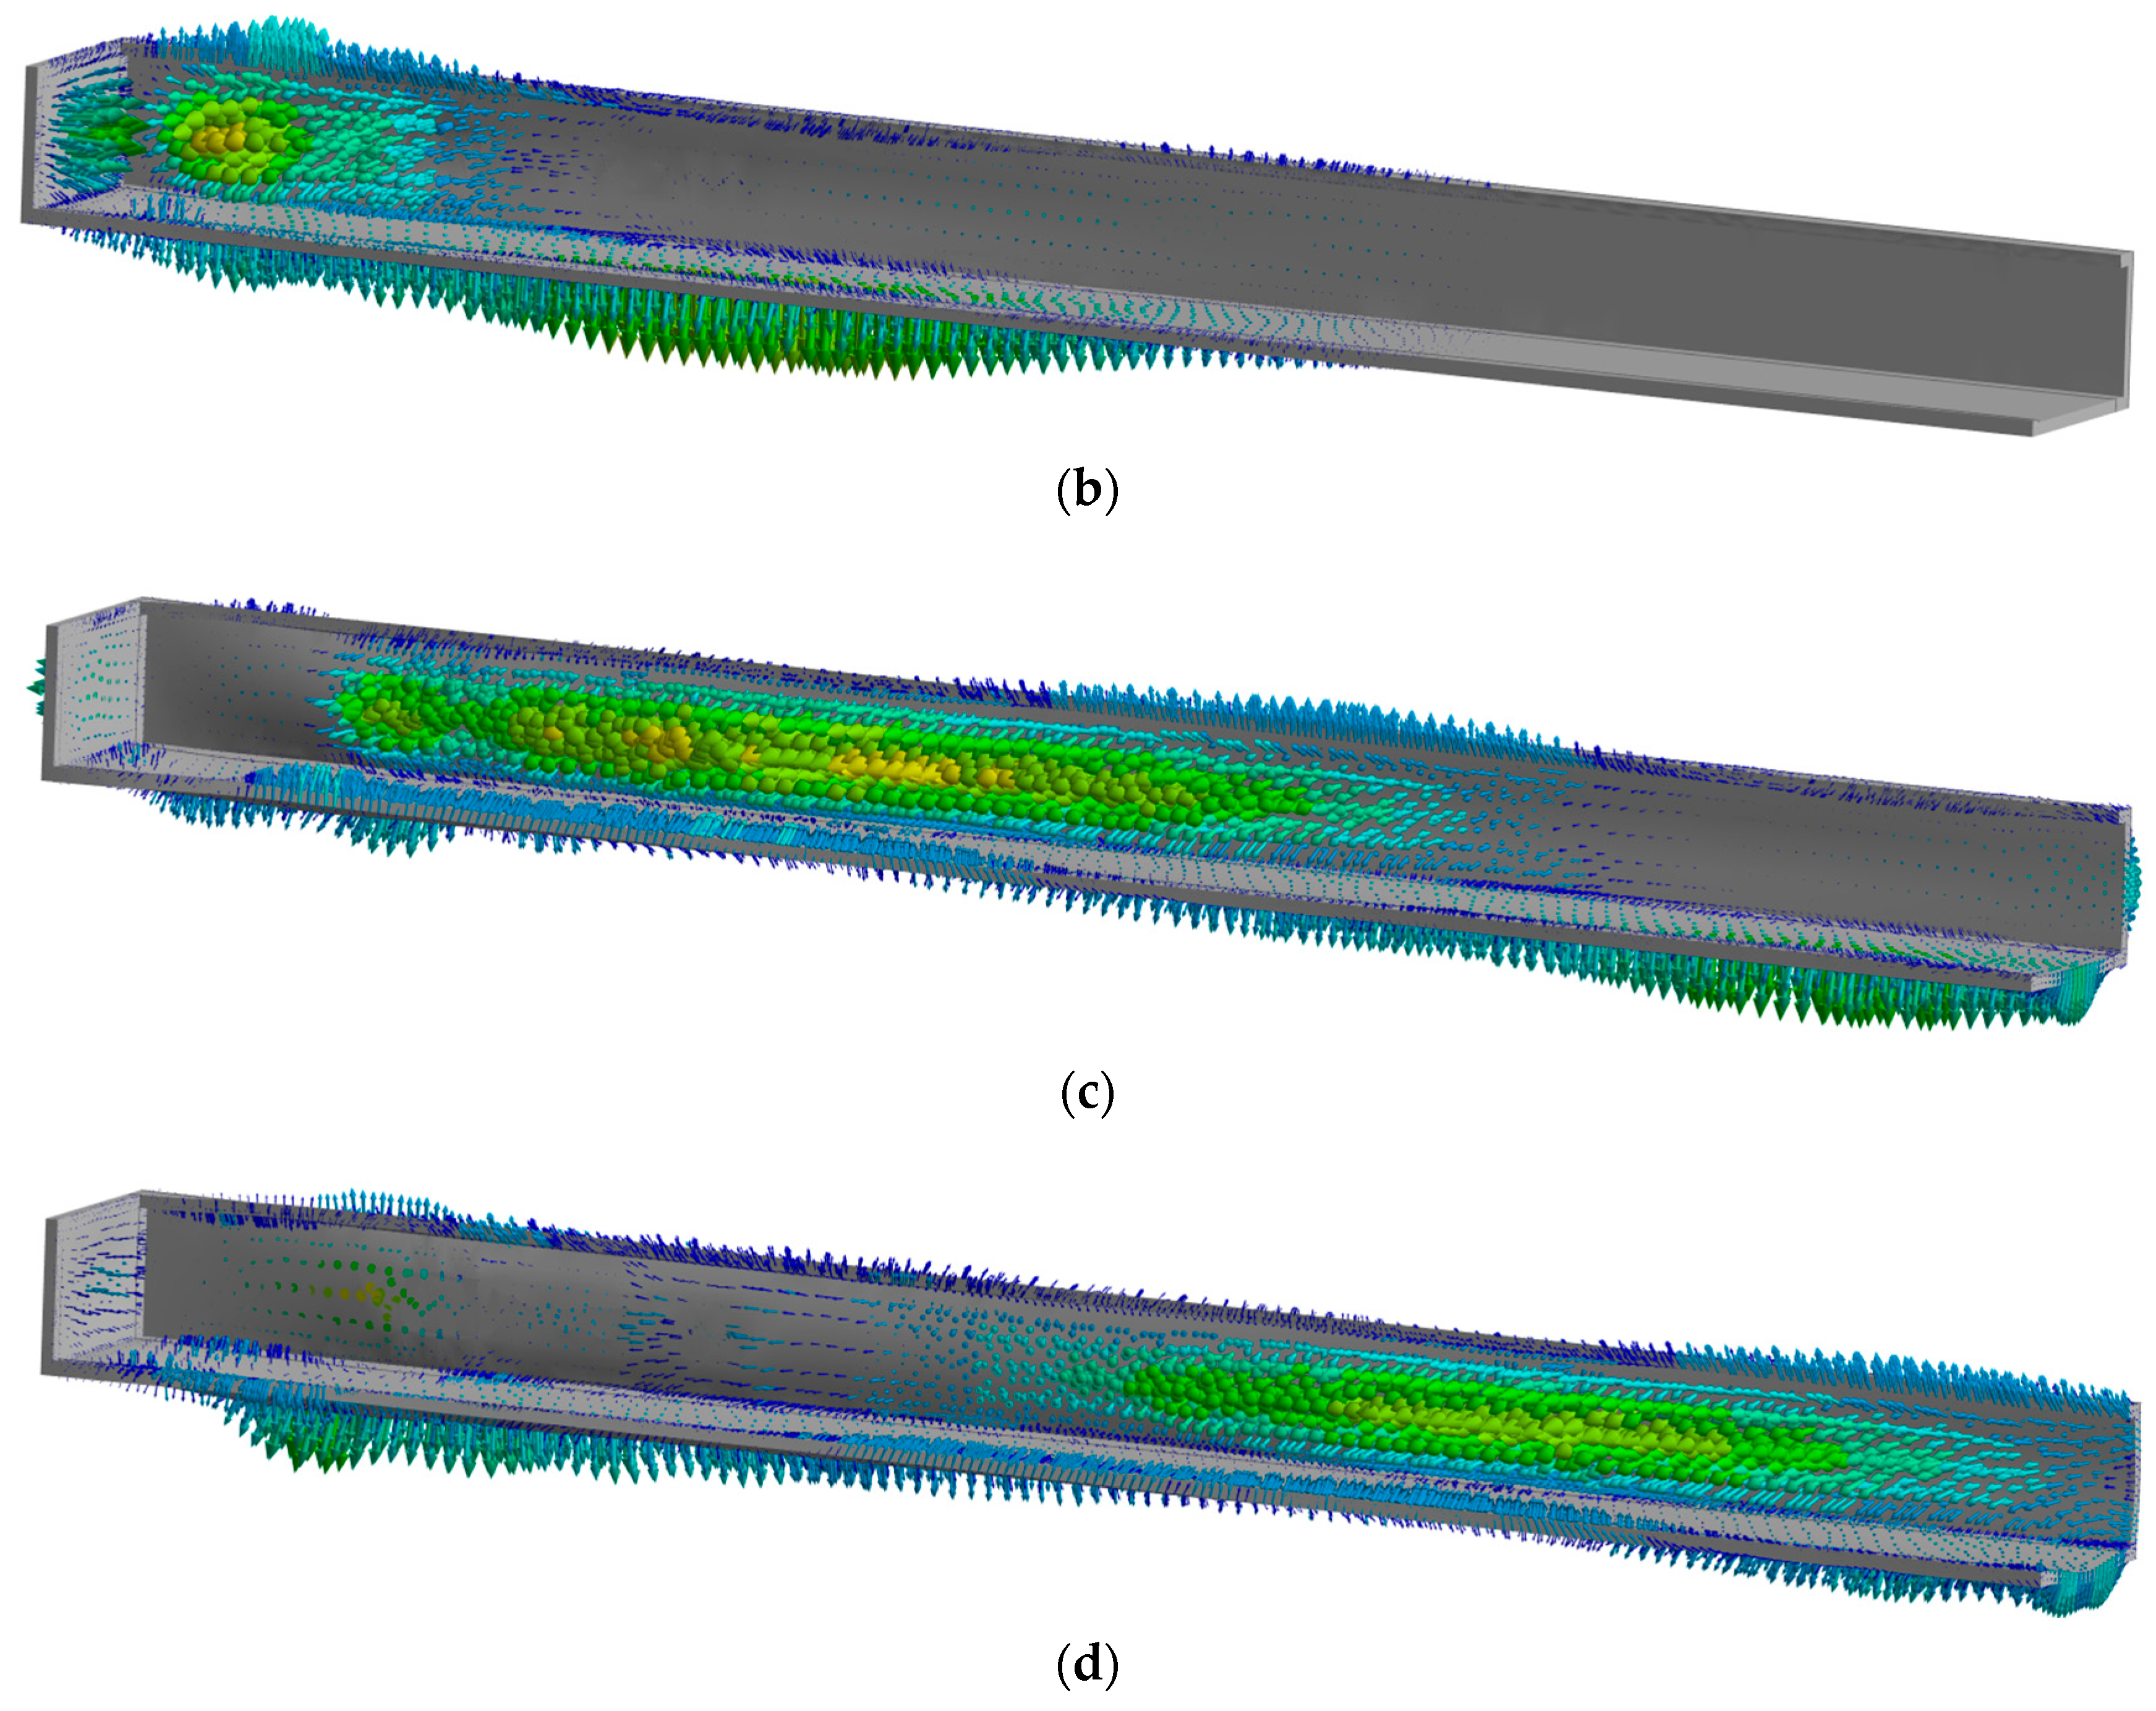
Figure 12 shows the motion vector diagram of the surrounding rock during the propagation of the shock wave, and it can be seen that at the initial stage of the motion T = 53.9 ms. At this time, the motion direction of the wall surface of the closed end of the surrounding rock is facing outward, while the junction of the surrounding rock is moving inward. With the propagation of displacement, at T = 74.1 ms, the bottom plate motion vector is still outward and the range of displacement becomes larger but the speed decreases, while the two gang areas change to inward motion, and the density behind the shock wave decreases at this time. At the same time, comparing different time vector diagrams, it can be seen that when the two gangs’ displacement direction is towards the more dramatic internal region, the size of the bottom plate velocity is lower; on the contrary, when the bottom plate velocity is larger, the two gangs’ inward velocity is smaller. Reflected and tensile waves influenced by shock waves are particularly important for rock fracture.
The kinetic coupling between the methane-air premixed gas explosion shock wave and the surrounding rock of the roadway can induce the coal rock medium to produce multi-scale damage evolution. The degree of damage is closely related to the shock wave pressure amplitude and action time. The crack initiation threshold of coal rock can be characterized by the following critical strain criterion [31,32,33].
Using the equivalent strain, the statistical damage expression for the strength of uniaxial coal rock under impact loading is obtained as
R m = E ε t h r e s h o l d 1 D = E ε t h r e s h o l d e F F 0 m
F 0 = β + 1 3 E ε m m 1 m
m = 1 l n σ m a x / E ε m
In this equation, ε t h r e s h o l d is the strain threshold for crack generation; α is the crack generation coefficient of the coal rock;   R m is the ultimate tensile strength, MPa, and E is the modulus of elasticity of the coal rock, MPa; F is the distribution variable for the strength of the micromeres; and F 0 and m is the Weibull distribution parameter, which reflects the mechanical properties of the coal rock material.
Through the uniaxial impact test results of different coal samples, the extreme value method was used to determine with, and the values are shown in Table 3.
The ε ˙ versus F 0 and m relationship is obtained by fitting Table 3’s data and simplifying it by substituting it into Equation (16):
ε t h r e s h o l d = α R m E
α t = 1 e F F 0 m
In this equation, α t is the crack generation coefficient of the coal rock.
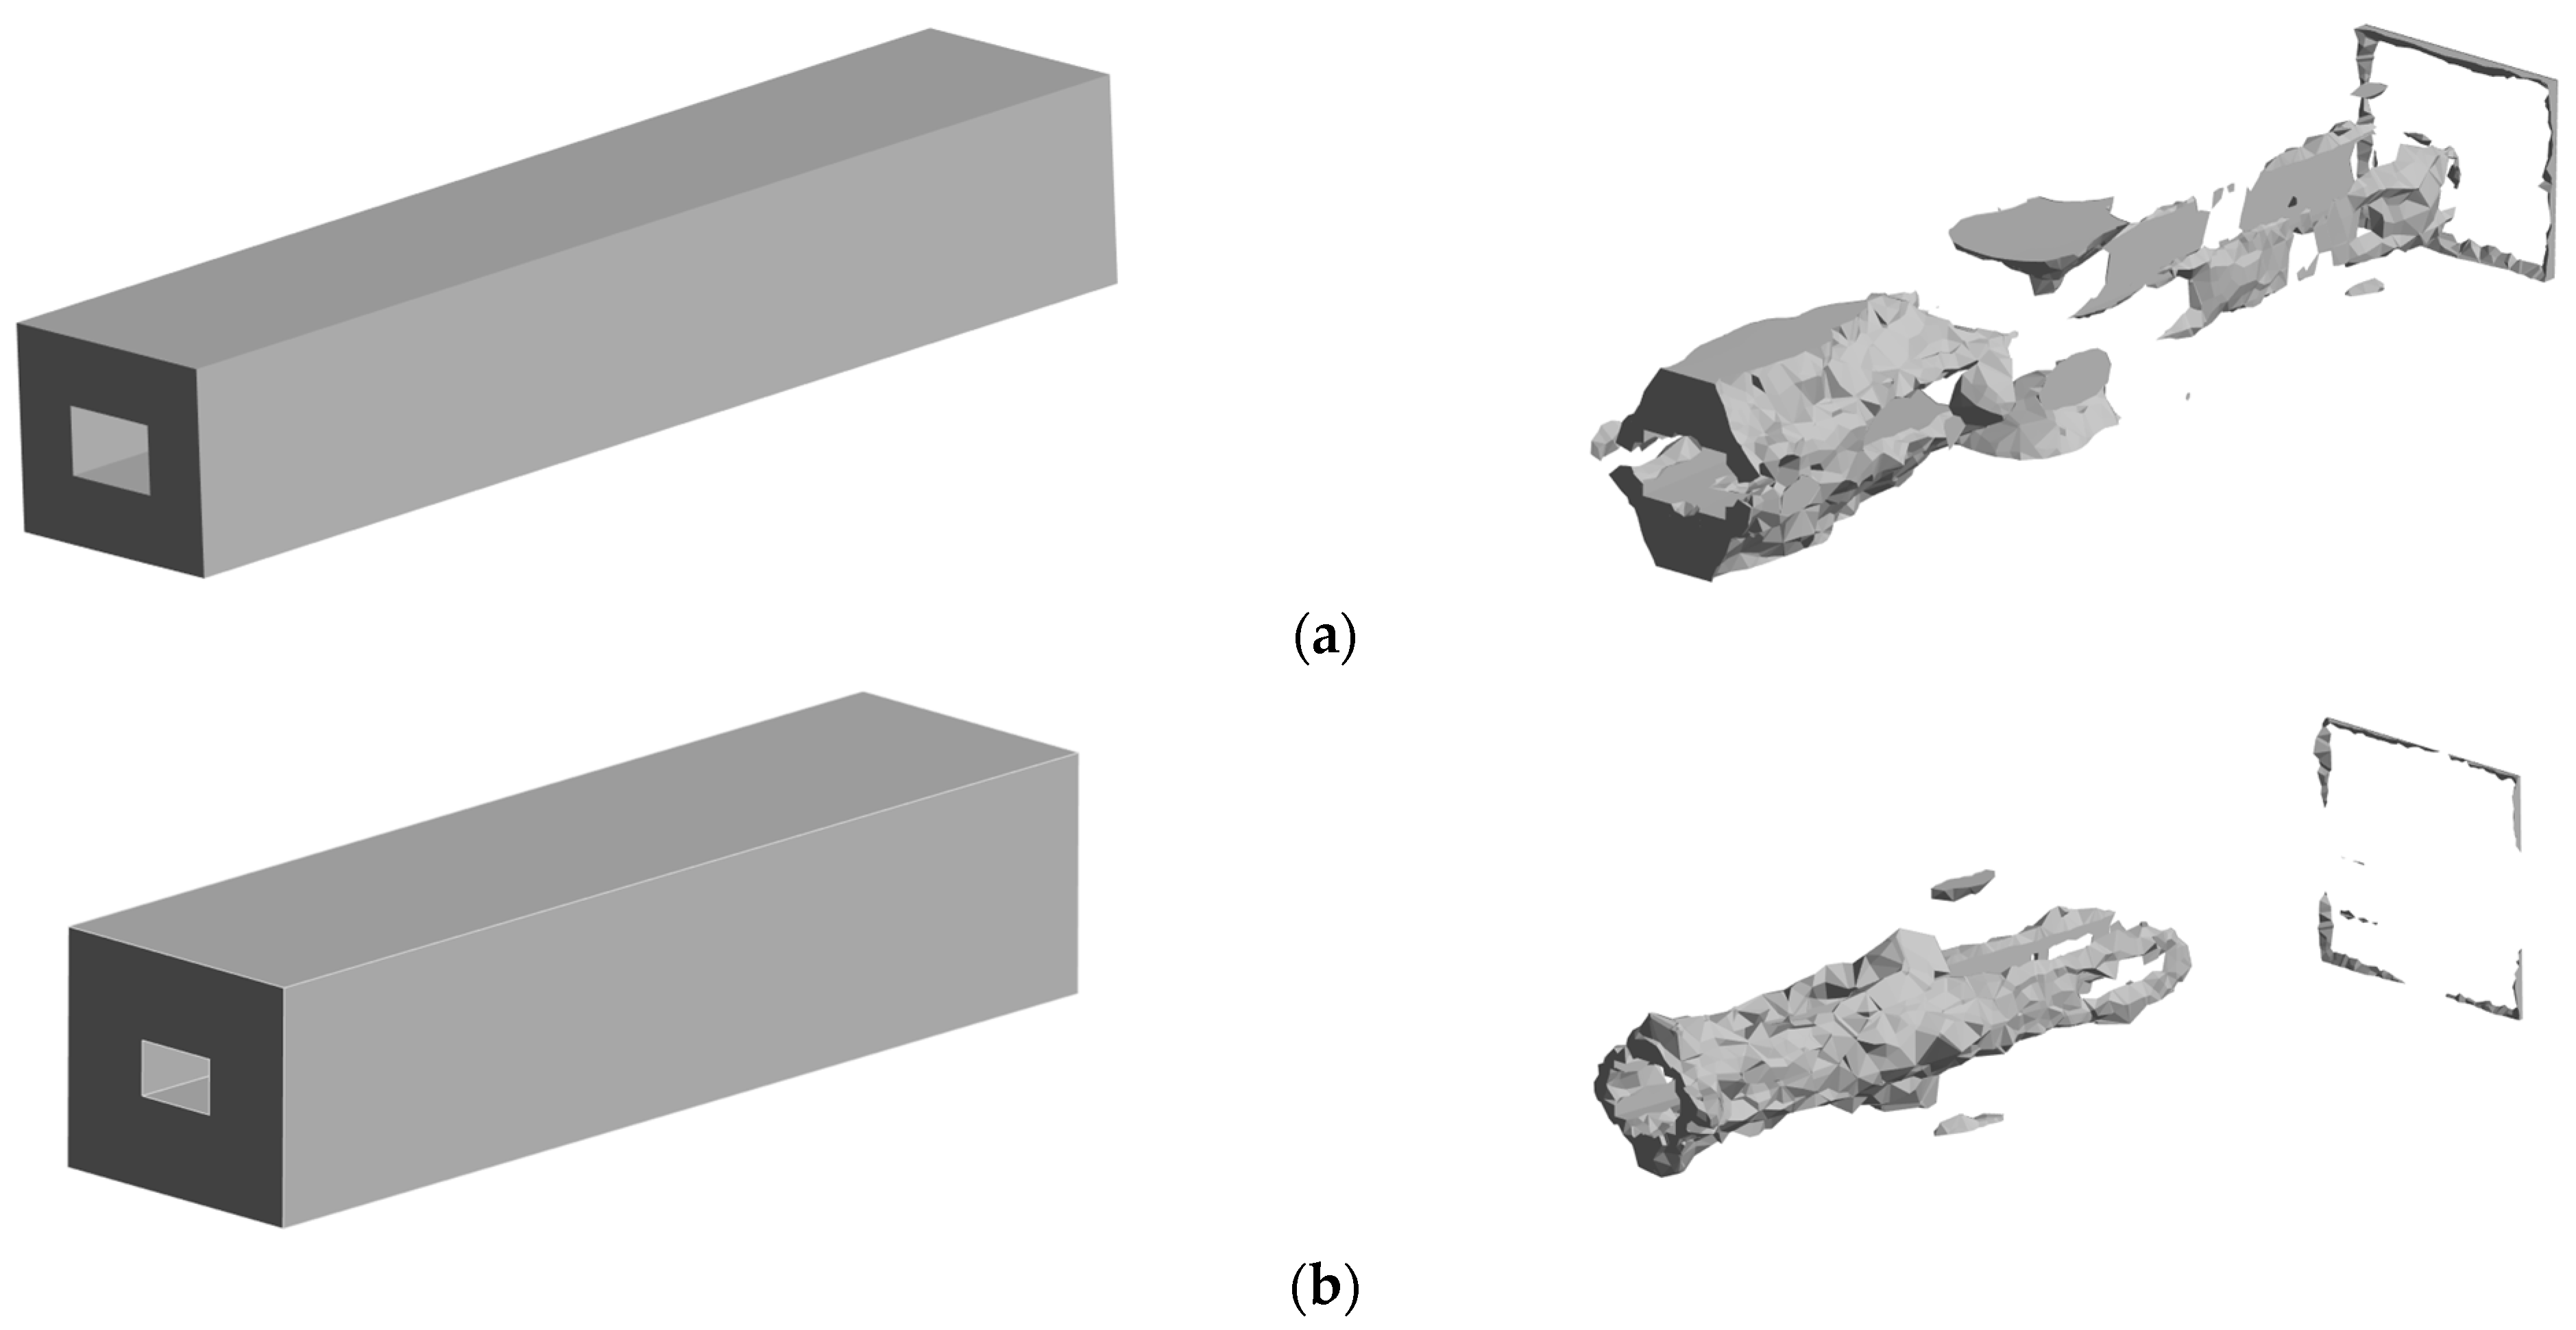
Based on the basic assumptions of linear elastic fracture mechanics (tensile strength R m = 1.5   M P a , modulus of elasticity E = 2500   M P a ). It is known from previous studies that the usual value range is between 0.3 and 1.2, and according to the nature of coal rock, this paper takes the value of 0.7 [34], and the critical damage strain threshold is obtained by calculation as ε t h r e s h o l d = 0.042   m m / m m . The damage evolution tracking algorithm is used to establish the following failure criterion in the Transient Structure solver: when the equivalent plastic strain at the integration point of the unit is greater than the threshold value, the unit failure marker parameter is activated. When the equivalent plastic strain at the integration point of the unit is larger than the threshold value, the unit failure marking parameter is activated. The spatial distribution characteristics of the damage field of the surrounding rock after the explosion impact were successfully reconstructed by this intrinsic model (Figure 13).
Based on the quantitative strain field analysis of the damage characteristics of the surrounding rock during the shock wave propagation stage in Figure 10a, the closed end is constrained by the high stiffness boundary condition ( ν   =   0.25 ,   E   =   2500   M P a ), and its maximum principal strain is limited to the range of ε 1   <   0.03   ±   0.002   m m / m m , which does not reach the threshold value of crack initiation ( ε t h r e s h o l d   =   0.042   m m / m m ). The wall-top plate angle zone is subjected to bi-directional stress constraints, and the decrease in strain concentration factor leads to a decrease in damage density. The center zone of the surrounding rock is subject to elastic strain energy release, dominated by the shrinkage of the damage area compared to the pinch point zone. The strain migration effect induces local strain intensification in the central zone, but it is still below the critical threshold. The damage mechanism at the closed end revealed by the damage characteristics of the surrounding rock in the shock wave release stage in Figure 8b shows that the superposition of the reflected shock waves causes the dynamic strain energy density in the central zone to break through the threshold to form a radial branching fissure system. The damage density is suppressed in the sidewall region due to the higher lateral confinement strength than the top plate. The central area of the roof plate is governed by the tensile-shear composite stress state, which induces a band-shaped damage zone.

4.3. Strain Thresholding Results for Thicker Perimeter Rock Models

The damage distribution under the thicker surrounding rock conditions is verified by thickening the thickness of the surrounding rock to 3 m, 5 m, and 10 m. Figure 14a–c The left figure shows the model before the damage, and in order to more intuitively observe the distribution of the damaged area in the thicker surrounding rock, the strain greater than 0.042 is retained in the area, and the right figure shows the damaged area of the surrounding rock under the thicker surrounding rock conditions. It can be seen that in the area near the closed end, the two groups of surrounding rock are more seriously damaged, while the top and bottom plates are basically not damaged. As the surrounding rock is more stable away from the closed end, the damage area starts to expand after the shock wave forms a stable wave surface. At the thicknesses of 3 m and 5 m, in the middle of the roadway near the exit area, the top slab was damaged near the outside of the model, but not inside. In all the models, the surrounding rock near the exit position is damaged internally while the two sides of the wall are more intact. Figure 9 shows that the top plate is more affected by the reflected wave of the shock wave, and the surrounding rock is mostly extended outward, so the external strain is greater than the internal.
After the gas explosion, the support method can significantly change the surrounding rock response. For the central area of the roof plate, surface shotcrete can reduce the surface tensile stress of the surrounding rock and inhibit the spalling damage induced by the explosion shock wave, but it may increase the local compressive stress concentration; anchor support can deform through the pre-tensioning force and the surrounding rock synergistically, to improve the uniformity of the stress field and reduce the scope of the plastic zone; through Flexible arch support, the explosion energy can be dissipated, but Flexible arch support may cause secondary collapse. The use of high-strength prestressing anchors and silicate-based grouting materials for coordinated support can significantly reduce the equivalent plastic strain; the closed end of the roadway is equipped with a polyurethane-rubber composite buffer layer, which can reduce the depth of damage to the surrounding rock through energy dissipation and pressure wave attenuation.

5. Conclusions

Based on multi-physics field-coupled numerical simulation and fracture mechanics theory, this study systematically reveals the coupling mechanism between the methane-air premixed gas explosion shock wave and the dynamic response of the tunnel’s surrounding rock. The following innovative conclusions are obtained through the establishment of a two-way fluid-solid coupling numerical model and damage evolution constitutive equation:
(1)
The methane volume fraction and shock wave overpressure show a significant quadratic relationship, and the equivalent condition ( 9.5 % ) produces the maximum overpressure peaks of 31 % and 9 % compared with those of the lean combustion/rich combustion condition, and its pressure decay rate constant is reduced by 67.9 % and 10.3 % compared with that of the other conditions. This phenomenon is highly consistent with the laminar flow combustion velocity extreme value characteristics and the CJ burst theory.
(2)
The dynamic evolution of the surrounding rock stress field is revealed through the numerical simulation of fluid-solid coupling. The initial shock stage at the closed end is interfered with by multiple reflected waves to produce stress aggregation, and the maximum von Mises stress is 2.09 MPa, which is in accordance with the Saint-Venant principle; the steady-state propagation stage shows hyperbolic decay characteristics of the stress wave, and the phase difference between the neighboring monitoring points is converged; and the open end of the boundary dissipation stage is aggravated by the stress fluctuation due to the turbulence-coupled resonance.
(3)
The initial elastic deformation forms a high-strain kernel; the plastic accumulation stage is caused by the redirected migration of the strain field, which triggers the central bulge; and the residual stage is caused by the permanent deformation of the open end by the reverse attenuation. There is a significant difference in the displacement between the bottom plate of the wall and the two gangs. The initial displacement is more concentrated. With the propagation of the shock wave, the displacement area increases but the displacement velocity decreases. By increasing the thickness of the perimeter rock, the movement of the base plate perimeter rock is oriented towards the outside, resulting in less strain near the roadway than on the side away from the roadway, leading to more internal damage to the perimeter rock. Tension-shear stress in the center of the roof plate formed band damage, and the anchor support and buffer layer effectively suppressed the damage expansion.
The results of this research provide the following theoretical support for the anti-explosive design of coal mine roadways: (1) the quantitative relationship of explosion equivalence ratio-damage evolution is established; (2) a two-way coupled simulation framework is used; and (3) a dynamic damage model is proposed. Future research will integrate the coupling mechanism of geological tectonic effects and multi-component gas, and verify the engineering applicability of the model through on-site distributed fiber-optic monitoring.

Author Contributions

Conceptualization, Q.Z. and Z.Y.; methodology, P.D.; software, Q.Z. and P.D.; validation, Q.Z., Z.Y., Y.Z. and J.Z.; formal analysis, P.D.; investigation, Q.Z.; resources, J.Z.; data curation, P.D.; writing—original draft preparation, Y.Z.; writing—review and editing, P.D.; visualization, Q.Z.; supervision, Y.Z.; project administration, Z.Y.; funding acquisition, Q.Z. All authors have read and agreed to the published version of the manuscript.

Funding

This research was funded by the Key Research and Development Program of Shaanxi Province, grant number 2022GY-150.

Institutional Review Board Statement

Not applicable.

Informed Consent Statement

Not applicable.

Data Availability Statement

The data are not publicly available due to commercial confidentiality, as they contain information that could compromise the privacy of research participants.

Conflicts of Interest

The authors declare no conflicts of interest.

References

  1. Wang, Y.; Fu, G.; Lyu, Q.; Li, X.; Chen, Y.; Wu, Y.; Xie, X. Modelling and analysis of unsafe acts in coal mine gas explosion accidents based on network theory. Process Saf. Environ. 2023, 170, 28–44. [Google Scholar]
  2. Wang, B.; Lv, Y.; Liu, C. Research on fire early warning index system of coal mine goaf based on multi-parameter fusion. Sci. Rep. 2024, 14, 485. [Google Scholar] [CrossRef]
  3. Kang, Y.; Wu, Z.; Ma, S.; Zhao, M.; Li, W. CFD-based assessment and visualization of the failure consequences of LPG tankers. J. Loss Prev. Process Ind. 2023, 82, 105008. [Google Scholar] [CrossRef]
  4. Xu, Y.; Huang, Y.; Ma, G. CFD-based AHP-TOPSIS decision-making model for gas explosion overpressure mitigation measures in underground utility tunnels. J. Loss Prev. Process Ind. 2024, 89, 105299. [Google Scholar] [CrossRef]
  5. Mandal, J.; Goel, M.; Agarwal, A. Underground structures subjected to various blast loading scenarios: A scoping review. Arch. Comput. Methods Eng. 2022, 29, 2491–2512. [Google Scholar] [CrossRef]
  6. Jia, Q.; Xue, S.; Si, X.; Si, R.; Wang, L.; Liu, X.; Li, Z. Dynamics of gas composition and thermal behavior post explosions: An experimental investigation across varied initial concentrations. Case Stud. Therm. Eng. 2024, 59, 104564. [Google Scholar] [CrossRef]
  7. Gao, K.; Liu, Z.; Wu, C.; Li, J.; Liu, K.; Liu, Y.; Li, S. Effect of low gas concentration in underground return tunnels on characteristics of gas explosions. Process Saf. Environ. 2021, 152, 679–691. [Google Scholar] [CrossRef]
  8. Li, R.; Si, R.; Wang, L. Propagation of gas explosions of different volumes in a large test tunnel. Energy Sources Part A Recovery Util. Environ. Eff. 2025, 47, 3222–3234. [Google Scholar] [CrossRef]
  9. Yang, K.; Si, R.; Huang, Z.; Wang, L.; Zhao, J.; Li, Z. Experimental study on the deflagration to detonation transition process of gas explosions in engineering-scale pipelines. Fuel 2025, 384, 133995. [Google Scholar] [CrossRef]
  10. Tan, B.; Liu, Y.; Liu, H.; Wang, H.; Li, T. Research on size effect of gas explosion in the roadway. Tunn. Undergr. Space Technol. 2021, 112, 103921. [Google Scholar] [CrossRef]
  11. Zhao, Y.; Wu, J.; Zhou, R.; Cai, J.; Bai, Y.; Pang, L. Effects of the length and pressure relief conditions on propagation characteristics of natural gas explosion in utility tunnels. J. Loss Prev. Process Ind. 2022, 75, 104679. [Google Scholar] [CrossRef]
  12. Wang, S.; Li, Z.; Fang, Q.; Yan, H.; Chen, L. Performance of utility tunnels under gas explosion loads. Tunn. Undergr. Space Technol. 2021, 109, 103762. [Google Scholar] [CrossRef]
  13. Liu, W.; Mu, C.; Li, Z. Influence of cavity structure on gas explosion characteristics in coal mine. Powder Technol. 2022, 398, 117084. [Google Scholar] [CrossRef]
  14. Yuan, M.; Hu, Q.; Huang, Z.; Shen, X.; Qian, X.; Yang, H.; Qi, S.; Jiang, J.; Xia, D. Gas explosion impact behavior and disaster analysis based on structural failure: Numerical modeling. J. Loss Prev. Process Ind. 2024, 87, 105234. [Google Scholar] [CrossRef]
  15. Cheng, J.; Fu, Q.; Wang, Z.; Qin, Y.; Jiang, H.; Gao, K.; Zhang, L. Dynamic response characteristics and structural optimization of isolation seal under the impact of gas explosion. J. Loss Prev. Process Ind. 2023, 84, 105095. [Google Scholar] [CrossRef]
  16. Cheng, C.; Si, R.; Wang, L.; Jia, Q.; Xin, C.; Chen, X. Experimental study on the effect of initial accumulation pattern on gas explosion and explosion suppression in a real roadway. Case Stud. Therm. Eng. 2023, 51, 103544. [Google Scholar] [CrossRef]
  17. Cheng, C.; Si, R.; Wang, L.; Jia, Q.; Xin, C. Explosion and explosion suppression of gas/deposited coal dust in a realistic environment. Fuel 2024, 357, 129710. [Google Scholar] [CrossRef]
  18. Gui, M.; Zhang, L.; Cui, H.; Zhang, H. Turbulent combustion related with detoantion. Acta Aerodyn. Sin. 2019, 38, 515–531. [Google Scholar]
  19. Maremonti, M.; Russo, G.; Salzano, E.; Tufano, V. Numerical simulation of gas explosions in linked vessels. J. Loss Prev. Process Ind. 1999, 12, 189–194. [Google Scholar] [CrossRef]
  20. Du, J.; Chen, J.; Zhu, L.; Guo, L.; Wang, F.; Hu, X. Numerical study on the dynamic response of gas explosion in uneven coal mine tunnels using CESE reaction dynamics model. Appl. Sci. 2024, 14, 2372. [Google Scholar] [CrossRef]
  21. Mo, L.; Wang, R.; Yang, H.; Yang, Y.; Wu, X.; Jia, W.; Li, C.; Chen, C. Dynamic response of spherical tanks subjected to the explosion of hydrogen-blended natural gas. Fuel 2024, 377, 132834. [Google Scholar] [CrossRef]
  22. Zheng, G.; Shi, J.; Li, L.; Li, Q.; Gu, Z.; Xu, W.; Lu, B.; Wang, C. Fluid-solid coupling-based vibration generation mechanism of the multiphase vortex. Processes 2023, 11, 568. [Google Scholar] [CrossRef]
  23. Zhang, D.; Wu, C.; Shi, Z.; Li, Y.; Zhao, Y.; Wu, X. A fluid–solid coupling model for hydraulic fracture of deep coal seam based on finite element method. Phys. Fluids 2024, 36, 066609. [Google Scholar] [CrossRef]
  24. Tan, W.; Chen, Z.; Li, Z.; Yan, H. Thermal-fluid-solid coupling simulation and oil groove structure optimization of wet friction clutch for high-speed helicopter. Machines 2023, 11, 296. [Google Scholar] [CrossRef]
  25. Shamsuddin, D.S.N.A.; Fekeri, A.F.M.; Muchtar, A.; Khan, F.; Khor, B.C.; Lim, B.H.; Rosli, M.I.; Takriff, M.S. Computational fluid dynamics modelling approaches of gas explosion in the chemical process industry: A review. Process Saf. Environ. 2023, 170, 112–138. [Google Scholar] [CrossRef]
  26. Qiu, J. Study on Propagation Characteristics of Shock Wave in Pipe Network and Simulation of Catastrophic Process for Gas Explosion. Ph.D. Thesis, Anhui University of Science and Technology, Huainan, China, 2018. [Google Scholar]
  27. Oran, E.S.; Gamezo, V.N. Origins of the deflagration-to-detonation transition in gas-phase combustion. Combust. Flame 2007, 148, 4–47. [Google Scholar] [CrossRef]
  28. Saif, M.; Wang, W.; Pekalski, A.; Levin, M.; Radulescu, M.I. Chapman–Jouguet deflagrations and their transition to detonation. Proc. Combust. Inst. 2017, 36, 2771–2779. [Google Scholar] [CrossRef]
  29. Kumar, K.; Bandyopadhyay, P.; Singh, S.; Dharodi, V.S.; Sen, A. Kelvin-Helmholtz instability in a compressible dust fluid flow. Sci. Rep. 2023, 13, 3979. [Google Scholar] [CrossRef] [PubMed]
  30. Nagy, T.; Valkó, É.; Sedyó, I.; Zsély, I.G.; Pilling, M.J.; Turányi, T. Uncertainty of the rate parameters of several important elementary reactions of the H2 and syngas combustion systems. Combust. Flame 2015, 162, 2059–2076. [Google Scholar] [CrossRef]
  31. Li, S. Stress or strain? Proc. R. Soc. A 2024, 480, 20240269. [Google Scholar] [CrossRef]
  32. Gong, B.; Wan, X.; Huo, X.; Liu, Y.; Deng, C.; Wang, D.; Dai, L. Development of a strain-based fracture assessment approach for X80 steel pipe welded girth by modified Mohr-Coulomb model. Int. J. Press. Vessel. Pip. 2023, 206, 105056. [Google Scholar] [CrossRef]
  33. Zhang, J.-Z.; Zhou, X.-P. Integrated acoustic-optic-mechanics (AOM) multi-physics field characterization methods for a crack: Tension vs. shear. Eng. Fract. Mech. 2023, 287, 109339. [Google Scholar] [CrossRef]
  34. Yu, Z.; Haoran, S.; Xiaohui, L.; Wenju, Z. Failure characteristics and constitutive model of coal rock at different strain rates. Explos. Shock Waves 2021, 41, 053103. [Google Scholar]
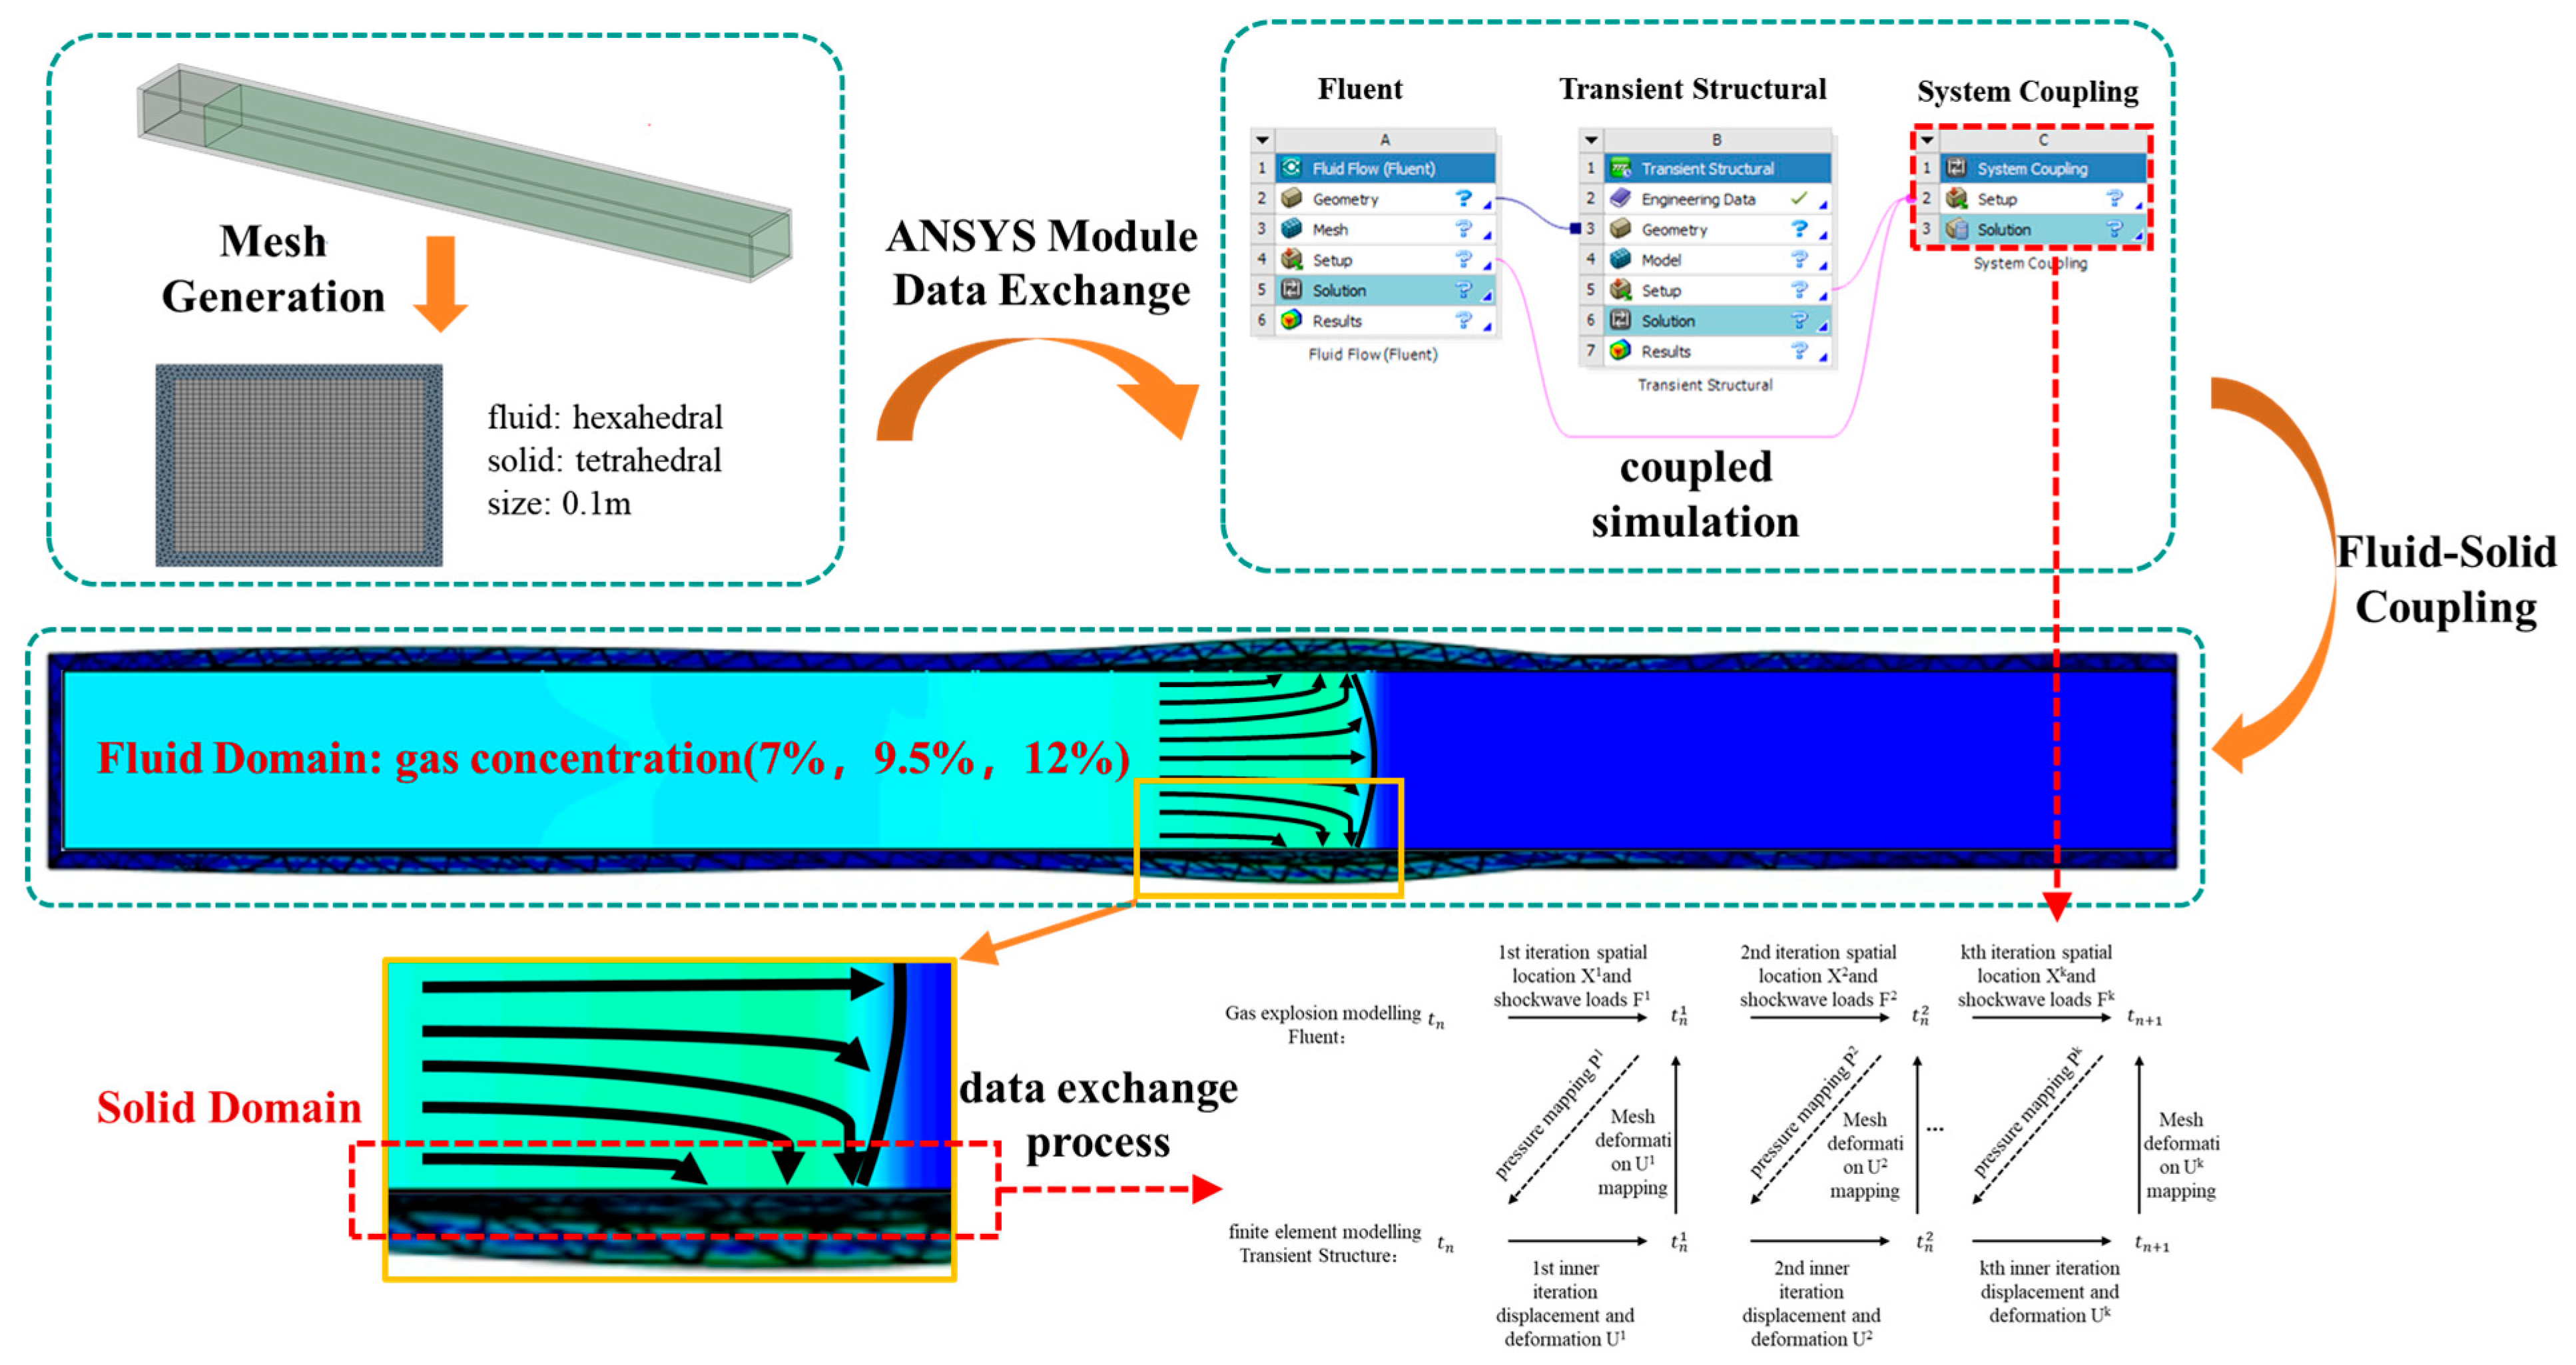
Figure 1. Technical route and data interaction mechanism of the coupled numerical simulation of multi-physics fields.
Applsci 15 09454 g001
Figure 2. Bi-directionally coupled iterative time-step data exchange diagrams.
Applsci 15 09454 g002
Figure 3. Distribution of monitoring points and grid quality.
Applsci 15 09454 g003
Figure 4. Distribution of measurement points.
Applsci 15 09454 g004
Figure 5. Diagram of the burst formation process. (a) Initial state of flame; (b) turbulent flame formation; (c) hot spot formation; (d) transition from spontaneous wave to explosive blast.
Applsci 15 09454 g005
Figure 6. Pressure contour of the location of the point where the blast wave reached the measurement point. (a) 7% gas concentration explosion contour; (b) 9.5% gas concentration explosion contour; (c) 12% gas concentration explosion contour.
Applsci 15 09454 g006aApplsci 15 09454 g006b
Figure 7. Peak explosion overpressure for different gas concentrations.
Applsci 15 09454 g007
Figure 8. Variation of perimeter rock loads at different measurement points. (a) Notably, 7% gas concentration; (b) 9.5% gas concentration; (c) 12% gas concentration.
Applsci 15 09454 g008aApplsci 15 09454 g008b
Figure 9. Plot of peak loads at each monitoring point for different gas concentrations.
Applsci 15 09454 g009
Figure 10. Equivalent force variation curves at different measurement points. (a) Notably, 0 m measurement point; (b) 10 m measurement point; (c) 20 m measurement point; (d) 30 m measurement point; (e) 40 m measurement point; (f) 50 m measurement point.
Applsci 15 09454 g010
Figure 11. Strain contour of the roadway perimeter rock. (a) T = 15 ms; (b) T = 35 ms; (c) T = 55 ms; (d) T = 75 ms; (e) T = 95 ms; (f) T = 115 ms.
Applsci 15 09454 g011
Figure 12. Vector diagram of perimeter rock movement. (a) T = 53.9 ms; (b) T = 74.1 ms; (c) T = 107.8 ms; (d) T = 128 ms. The size and color of the arrow simultaneously represent the magnitude of speed. Colors closer to red indicate higher speeds, while colors closer to blue indicate lower speeds.
Applsci 15 09454 g012aApplsci 15 09454 g012b
Figure 13. Characteristics of damage to the surrounding rock in the roadway of a gas explosion. (a) Damage conditions during shock wave propagation; (b) Final form of the damage.
Applsci 15 09454 g013
Figure 14. Verification Results for Thicker Envelope Conditions. (a) Schematic of modeled damage to 3 m thick perimeter rock; (b) Schematic of modeled damage to 5 m thick perimeter rock; (c) Schematic of modeled damage to 10 m thick perimeter rock.
Applsci 15 09454 g014aApplsci 15 09454 g014b
Table 1. Enclosed rock model material parameters.
Parameter Type ρ / k g / m 3 E / M P a ν R m / M P a σ c / M P a K / M P a
parameter value235025000.251.524920
Table 2. Comparison of experimental and simulation results.
Measurement Point LocationF1F2F3F4F5F6
Experiment 10.41880.79540.75000.40750.40090.3311
Experiment 20.41150.89830.72320.57960.50900.3167
Experiment 30.42320.74790.63610.51230.47880.3288
Experimental mean0.41780.81390.70310.49980.46290.3255
Numerical simulation results0.44180.77310.68920.50040.47820.3525
Relative error+5.74%−5.01%−1.98%+0.12%+3.46%+8.29
Table 3. Table of solid model parameters.
ε ˙ / s 1 F 0 /MPa m
24.812.82.95
33.814.71.63
42.323.21.41
46.223.41.74
53.832.31.20
Disclaimer/Publisher’s Note: The statements, opinions and data contained in all publications are solely those of the individual author(s) and contributor(s) and not of MDPI and/or the editor(s). MDPI and/or the editor(s) disclaim responsibility for any injury to people or property resulting from any ideas, methods, instructions or products referred to in the content.