Article

Transient Stability Analysis and Enhancement Strategies for AC Side of Hydro-Wind-PV VSC-HVDC Transmission System

1
Electric Power Research Institute of Guangdong Power Grid Co., Ltd., Guangzhou 510080, China
2
Guangdong Power Grid Co., Ltd., Guangzhou 510060, China
3
College of Electric Engineering, Zhejiang University, Hangzhou 310027, China
*
Author to whom correspondence should be addressed.
Appl. Sci. 2025, 15(17), 9456; https://doi.org/10.3390/app15179456
Submission received: 6 August 2025 / Revised: 26 August 2025 / Accepted: 27 August 2025 / Published: 28 August 2025
(This article belongs to the Section Electrical, Electronics and Communications Engineering)

Abstract

To analyze and enhance the transient stability of a hydro-wind-PV VSC-HVDC transmission system, this paper establishes a transient stability analytical model and proposes strategies for stability improvement. Based on the dynamic interaction mechanisms of multiple types of power sources, an analytical model integrating GFM converters, GFL converters, and SGs is first developed. The EAC is employed to investigate how the factors such as current-limiting thresholds and fault locations influence transient stability. Subsequently, a parameter tuning method based on optimal phase angle calculation and delayed control of current-limiting modes is proposed. Theoretical analysis and PSCAD simulations demonstrate that various factors affect transient stability by influencing the PLL of converters and the electromagnetic power of synchronous machines. The energy transfer path during transient processes is related to fault locations, parameter settings of current-limiting modes in converters, and the operational states of equipment. The proposed strategy significantly improves the transient synchronization stability of multi-source coupled systems. The research findings reveal the transient stability mechanisms of hydro-wind-PV VSC-HVDC transmission systems, and the proposed stability enhancement method combines theoretical innovation with engineering practicality, providing valuable insights for the planning and design of such scenarios.

1. Introduction

Currently, the energy structure worldwide is continuously being optimized and upgraded, with the share of installed clean energy power generation capacity steadily increasing [1,2,3,4]. As of August 2024, China’s total installed capacity of wind and solar power nationwide has reached 1.22 billion kilowatts [5], achieving ahead of schedule the 2030 development target of exceeding 1.2 billion kilowatts for combined wind and solar capacity. During the phase of rapid energy transition, regions such as Western China, the Mongolian Western Region, and the Baziro site will continue to support it by their exceptional advantages in renewable energy resources and development conditions [6,7]. Tibet alone possesses approximately 180 million kilowatts of technically exploitable wind energy and 200 million kilowatts of average annual hydropower potential [8,9,10], with its theoretical hydropower reserves accounting for about 30% of the nation’s total. To achieve flexible regulation and optimal allocation of renewable energy and hydropower, China has planned and constructed multiple hydro-wind-PV energy bases in western regions, including the Kela photovoltaic power station [11]. Furthermore, countries such as Egypt are also planning or constructing hybrid hydro-wind-PV power systems in regions including Ataka and Suez [12]. Due to the reverse distribution pattern between China’s energy resources and economic development [13], the long distance between western hydro-wind-PV complementary energy bases and eastern coastal load centers necessitates HVDC transmission systems for long-distance power delivery [14]. VSC-HVDC technology demonstrates significant advantages in long-distance, high-voltage, large-capacity power transmission scenarios [15], showing enormous potential for future renewable energy delivery applications. The bundled hydro-wind-PV hybrid transmission system via MMC-HVDC has attracted widespread attention [16,17,18], with ongoing projects like the Gansu-Zhejiang and Tibet-Yunnan HVDC links adopting this technical approach.
Based on synchronization control methods, grid-connected converters for renewable energy generation can be categorized into two main types: GFM converters and GFL converters. Among them, GFM converters actively establish grid synchronization references through self-synchronization mechanisms, and are more suitable for weak grid conditions, with transient instability manifesting as virtual power-angle oscillations [19,20,21]. However, GFL converters synchronize with external grids via PLL demonstrating better stability in strong grids, where PLL-weak grid interaction dominates instability factors [22,23]. In hydro-wind-PV complementary energy bases employing VSC-HVDC transmission, the sending-end AC system involves interactions among multiple devices including GFM converters, GFL converters, and SGs. Compared with conventional transmission scenarios, the combined effects of heterogeneous device dynamics, control strategy coupling, and oscillation interactions in weak grid conditions make the synchronization stability mechanism under large disturbances significantly more complex.
Regarding transient stability issues in AC systems involving different types of power source equipment, some scholars have conducted corresponding research and made progress. Reference [21] proposed measures to improve the transient stability of grid-connected systems with GFM and GFL converters but did not mention their interaction characteristics. Reference [24] analyzed the mutual influence between GFM and GFL converters in terms of transient stability but did not consider the influence of SG integration into the system. Reference [25] focused on hybrid power systems where GFL/GFM renewable generation units and SGs are connected together. It used space vector diagrams and phase plane methods to analyze the influence of power electronic device control strategies and controller parameters on the transient stability of various generation units in the system. However, the study focused on scenarios where multiple types of power sources are directly connected to the main grid rather than independently forming a sending-end grid, and it did not consider the influence of the GFM converter limiting current during faults. Reference [26] quantitatively evaluated the power transmission capacity of a hydro-wind-PV VSC-HVDC transmission system, but the analysis was limited to steady-state electrical parameters and small-signal stability without involving large-disturbance stability analysis. Therefore, there is still limited research on the synchronization stability of the hydro-wind-PV VSC-HVDC transmission system with GFM converters, GFL converters, and SG, particularly when considering the current-limiting control of converters.
This paper focuses on the sending-end AC system of a hydro-wind-PV VSC-HVDC transmission base, investigating the transient stability of power systems incorporating different types of converters and SGs while considering converter current-limiting control. The study establishes transient stability analytical models for GFM converters, GFL converters, and SGs. Based on the power-angle synchronization mechanisms of different converter types, it elaborates the transient stability evaluation method for hydro-wind-PV hybrid systems and the mechanism of various influencing factors on system transient stability. Furthermore, the paper proposes transient stability enhancement strategies according to the revealed influence mechanisms.

2. The Sending-End AC System of a Hydro-Wind-PV VSC-HVDC Transmission System

This study takes the sending-end AC system of the hydro-wind-PV VSC-HVDC transmission system as the research object. In this system, the renewable energy base connects to the converter station’s AC bus via AC Line 1, the hydropower station connects to the converter station’s AC bus via AC Line 2, and the valve-side outlet AC bus of the sending-end converter station is designated as PCC1. For the investigated transient stability problem, this paper adopts the following premises and assumptions:
  • The DC voltage of the sending-end converter station is kept constant by energy storage or other converter stations, with its dynamic variations neglected in the study;
  • The inner-loop current controllers of converters, including both VSC-HVDC converters and renewable energy converters, respond significantly faster than outer-loop controllers [27], allowing the current inner-loop dynamics to be disregarded in transient stability analysis;
  • The SGs in this study employ the classical second-order model, maintaining constant q-axis transient EMF Eq during transient processes;
  • The resistive components in the equivalent impedances of transformers and SGs are relatively small, thus their influence is neglected;
  • Limited by overcurrent capability, converters will switch to current-limiting mode upon detecting a voltage drop below the threshold during severe AC-side short-circuit faults.
Considering the simplified conditions, the sending-end system is represented by the equivalent circuit in Figure 1. In this equivalent circuit, Converter 1 representing the sending-end converter station adopts a GFM strategy with constant AC voltage and frequency control (i.e., V/f control), while Converter 2 representing the renewable energy base adopts a GFL strategy with constant power control.
The terms in Figure 1 are defined as follows:
  • The AC bus node of Converter 2 is denoted as PCC2;
  • RLine1 and XLine1 represent the resistance and reactance of Line 1, respectively;
  • RLine2 and XLine2 represent the resistance and reactance of Line 2, respectively;
  • XTs1 and XTs2 represent the connection reactance of Converter 1 and Converter 2, respectively;
  • XTG represents the leakage reactance of the SG’s step-up transformer;
  • Xd represents the transient reactance of the SG;
  • Z1 and Z2 represent the equivalent impedances between PCC2 and PCC1, and between the Eq node and PCC1, respectively;
  • U0 and I1 represent the voltage and injected current at PCC1, respectively;
  • Us, I2, Ps and Qs represent the voltage, injected current, active power output and reactive power output at PCC2, respectively;
  • Ug, Ig, Pg and Qg represent the terminal voltage, injected current, active power output and reactive power output of the SG, respectively.
Based on the equivalent circuit, this paper will establish a mathematical model for transient stability analysis of the sending-end system in the hydro-wind-PV VSC-HVDC transmission system, aiming to quantitatively analyze the interaction mechanisms within the hybrid hydro-wind-PV system during transient evolution processes.

3. Generic Model for Transient Stability Analysis of Sending-End AC Systems

The research objects in this study include Converter 1, Converter 2, and the SG. To distinguish them, this paper denotes the dq rotating reference frames corresponding to the synchronization unit output phase angle of Converter 1, the PLL output phase angle of Converter 2, and the q-axis transient electromotive force Eq of the SG as the dq frame, dsqs frame, and dgqg frame, respectively. The vector transformation relationships between these coordinate systems are provided in Equation (A1) in Appendix A.1.

3.1. Generic Equivalent Circuit Model

Based on the topology presented in Figure 1, this paper normalizes the system equivalent circuits for both normal and AC fault conditions into a unified generic circuit model as shown in Figure 2. The equivalent representation of system circuits under both normal and fault conditions can be effectively achieved by adjusting the grounding resistance values. In this model, the following are defined:
  • Uf1 and Uf2 represent the voltage phasors at fault points f1 and f2, respectively;
  • Zf1 and Zf2 denote the equivalent impedances of faults occurring on Line 1 and Line 2, respectively, which are determined by the fault type;
  • Z11 and Z12 represent the impedances between fault point f1 and the PCC2, and between f1 and the PCC of Converter 1, respectively;
  • Z21 and Z22 represent the impedances between fault point f2 and the transient EMF equivalent point of the SG, and between f2 and the PCC1, respectively;
  • The ratio of Zi2 to Zi is defined as Ki (i = 1 or 2), which characterizes the relative distance between fault point fi and Converter 1.
Let I1max and I2max be the current phasors of Converter 1 and Converter 2 in the current-limiting state, respectively, with φ1 and φ2 representing the angles between I1max and the d-axis, and between I2max and the ds-axis, respectively. According to Equations (A2)–(A4) in the Appendix A.2, Uf1, Uf2, and Ig are all coupled with I1max, I2max, and Eq. Considering that power systems are more prone to transient instability during three-phase short-circuit faults [21], this study primarily focuses on the more severe three-phase metallic grounding faults. Based on the equivalent circuit shown in Figure 2, the voltages at the fault points of Line 1 and Line 2 are given by Equations (1) and (2), respectively:
U ˙ f 1 = 0 U ˙ f 2 = ( 1 K 2 ) K 1 Z ˙ 1 Z ˙ 2 K 1 Z ˙ 1 + Z ˙ 2 I ˙ 1 max + K 1 Z ˙ 1 + K 2 Z ˙ 2 K 1 Z ˙ 1 + Z ˙ 2 E ˙ q
U ˙ f 1 = K 2 Z ˙ 2 I ˙ 1 max + ( K 1 Z ˙ 1 + K 2 Z ˙ 2 ) I ˙ 2 max U ˙ f 2 = 0
From the above analysis, when a metallic fault occurs on Line 1, the output current I2ₘₐₓ of Converter 2 does not affect the SG or the output voltage of Converter 1. And when a metallic fault occurs on Line 2, Eq does not influence the output voltages of either Converter 1 or Converter 2.

3.2. Transient Stability Analysis Model for GFM Converters

The equivalent circuit shown in Figure 2 employs V/f control for Converter 1. After specifying the initial phase θinitial, its transient stability analysis model refers to the synchronization signal θ0 generation strategy of Converter 1 at t:
θ 0 = 0 t ω 0 d t + θ initial
For Converter 1 adopting V/f control, the influence of its inner current control loop can be neglected in transient stability analysis [28]. Since the V/f control directly provides the synchronization signal, Converter 1 does not face synchronization stability issues. Therefore, this paper focuses specifically on analyzing the transient stability of Converter 2 and the SG.

3.3. Transient Stability Analysis Model for GFL Converters

The PLL output signal θPLL of GFL converters is a critical research focus for synchronization stability analysis [29]. This paper therefore concentrates on investigating the PLL’s dynamic characteristics. When Converter 2 is connected to an infinite bus, its dynamic model in the dsqs coordinate system exhibits similar characteristics to the second-order SG equations [30]. Based on the equivalent circuit shown in Figure 2, the mathematical model for transient stability analysis of Converter 2 in hydro-wind-PV VSC-HVDC transmission system can be derived as follows:
d δ PLL d t = ω PLL ω 0 J s i d 2 δ PLL d t = P ms i P es i D s i d δ PLL d t
In the equations, the following apply:
  • δPLL represents the angle between the ds-axis and d-axis;
  • Jsi, Pmsi, Pesi, and Dsi denote Converter 2’s equivalent inertia coefficient, equivalent mechanical power, equivalent electromagnetic power, and equivalent damping coefficient, respectively;
  • i indicates the system operating state, where i = 0 corresponds to normal operation and i = 1 or 2 indicates a fault on Line 1 or Line 2, respectively. The same meaning applies hereafter.
For different system operating conditions, including normal operation, Line 1 fault, or Line 2 fault, Equation (5) can be expressed as Equations (6), (7) and (8), respectively:
J s 0 = 1 L 1 I sd k i ,   P ms 0 = R 1 I sq + X 1 I sd P es 0 = U 0 sin δ PLL ,   D s 0 = k p k i U 0 cos δ PLL L 1 I sd
J s 1 = 1 L 1 I 2 max ( 1 K 1 ) cos φ 2 k i ,   P ms 1 = I 2 max ( 1 K 1 ) ( R 1 sin φ 2 + X 1 cos φ 2 ) P es 1 = 0 ,   D s 1 = L 1 I 2 max ( 1 K 1 ) cos φ 2
J s 2 = 1 ( L 1 + K 2 L 2 ) I 2 max cos φ 2 k i P ms 2 = ( R 1 + K 2 R 2 ) I 2 max sin φ 2 + ( X 1 + K 2 X 2 ) I 2 max cos φ 2 P es 2 = K 2 Z 2 I 1 max sin ( δ PLL φ 1 θ 2 ) D s 2 = k p k i K 2 Z 2 I 1 max cos ( δ PLL φ 1 θ 2 ) ( L 1 + K 2 L 2 ) I 2 max cos φ 2
In the equations, the following apply:
  • L1 and R1 represent the inductance and resistance values of impedance Z1, respectively;
  • L2 and R2 denote the inductance and resistance values of impedance Z2, respectively;
  • Isd and Isq are the ds-axis and qs-axis components of the current phasor Is.

3.4. Transient Stability Analysis Model for SGs

This paper analyzes the transient stability of SGs based on the second-order rotor swing equation, with the corresponding transient stability model expressed as:
d δ d t = ω δ ω 0 J g d 2 δ d t = P mg P eg i D g d δ d t
In the equation, Pegi represents the electromagnetic power of the SG.
Considering that the resistance components in high-voltage AC transmission lines are significantly smaller than the reactance components, the resistance can be neglected when analyzing the transient stability of SGs. Through derivations, the expression for the electromagnetic power Pegi is obtained as follows:
P eg 0 = E q U 0 X 2 sin δ
P eg 1 = E q I 1 max K 1 X 1 K 1 X 1 + X 2 cos ( δ φ 1 π ) = P eg 1 max cos ( δ φ 1 π )
P eg 2 = 0
Based on the generic transient stability analysis model for the sending-end AC system of the hydro-wind-PV VSC-HVDC transmission system developed above, this paper will subsequently employ the EAC to analyze the transient stability of the coupled converter-SG system [31].

4. Transient Stability Analysis of the Sending-End AC System

4.1. Transient Stability Assessment

This paper employs the EAC to analyze the transient stability of the sending-end AC system in a hydro-wind-PV VSC-HVDC transmission system, with quantitative evaluation based on the CCT of system faults [32].
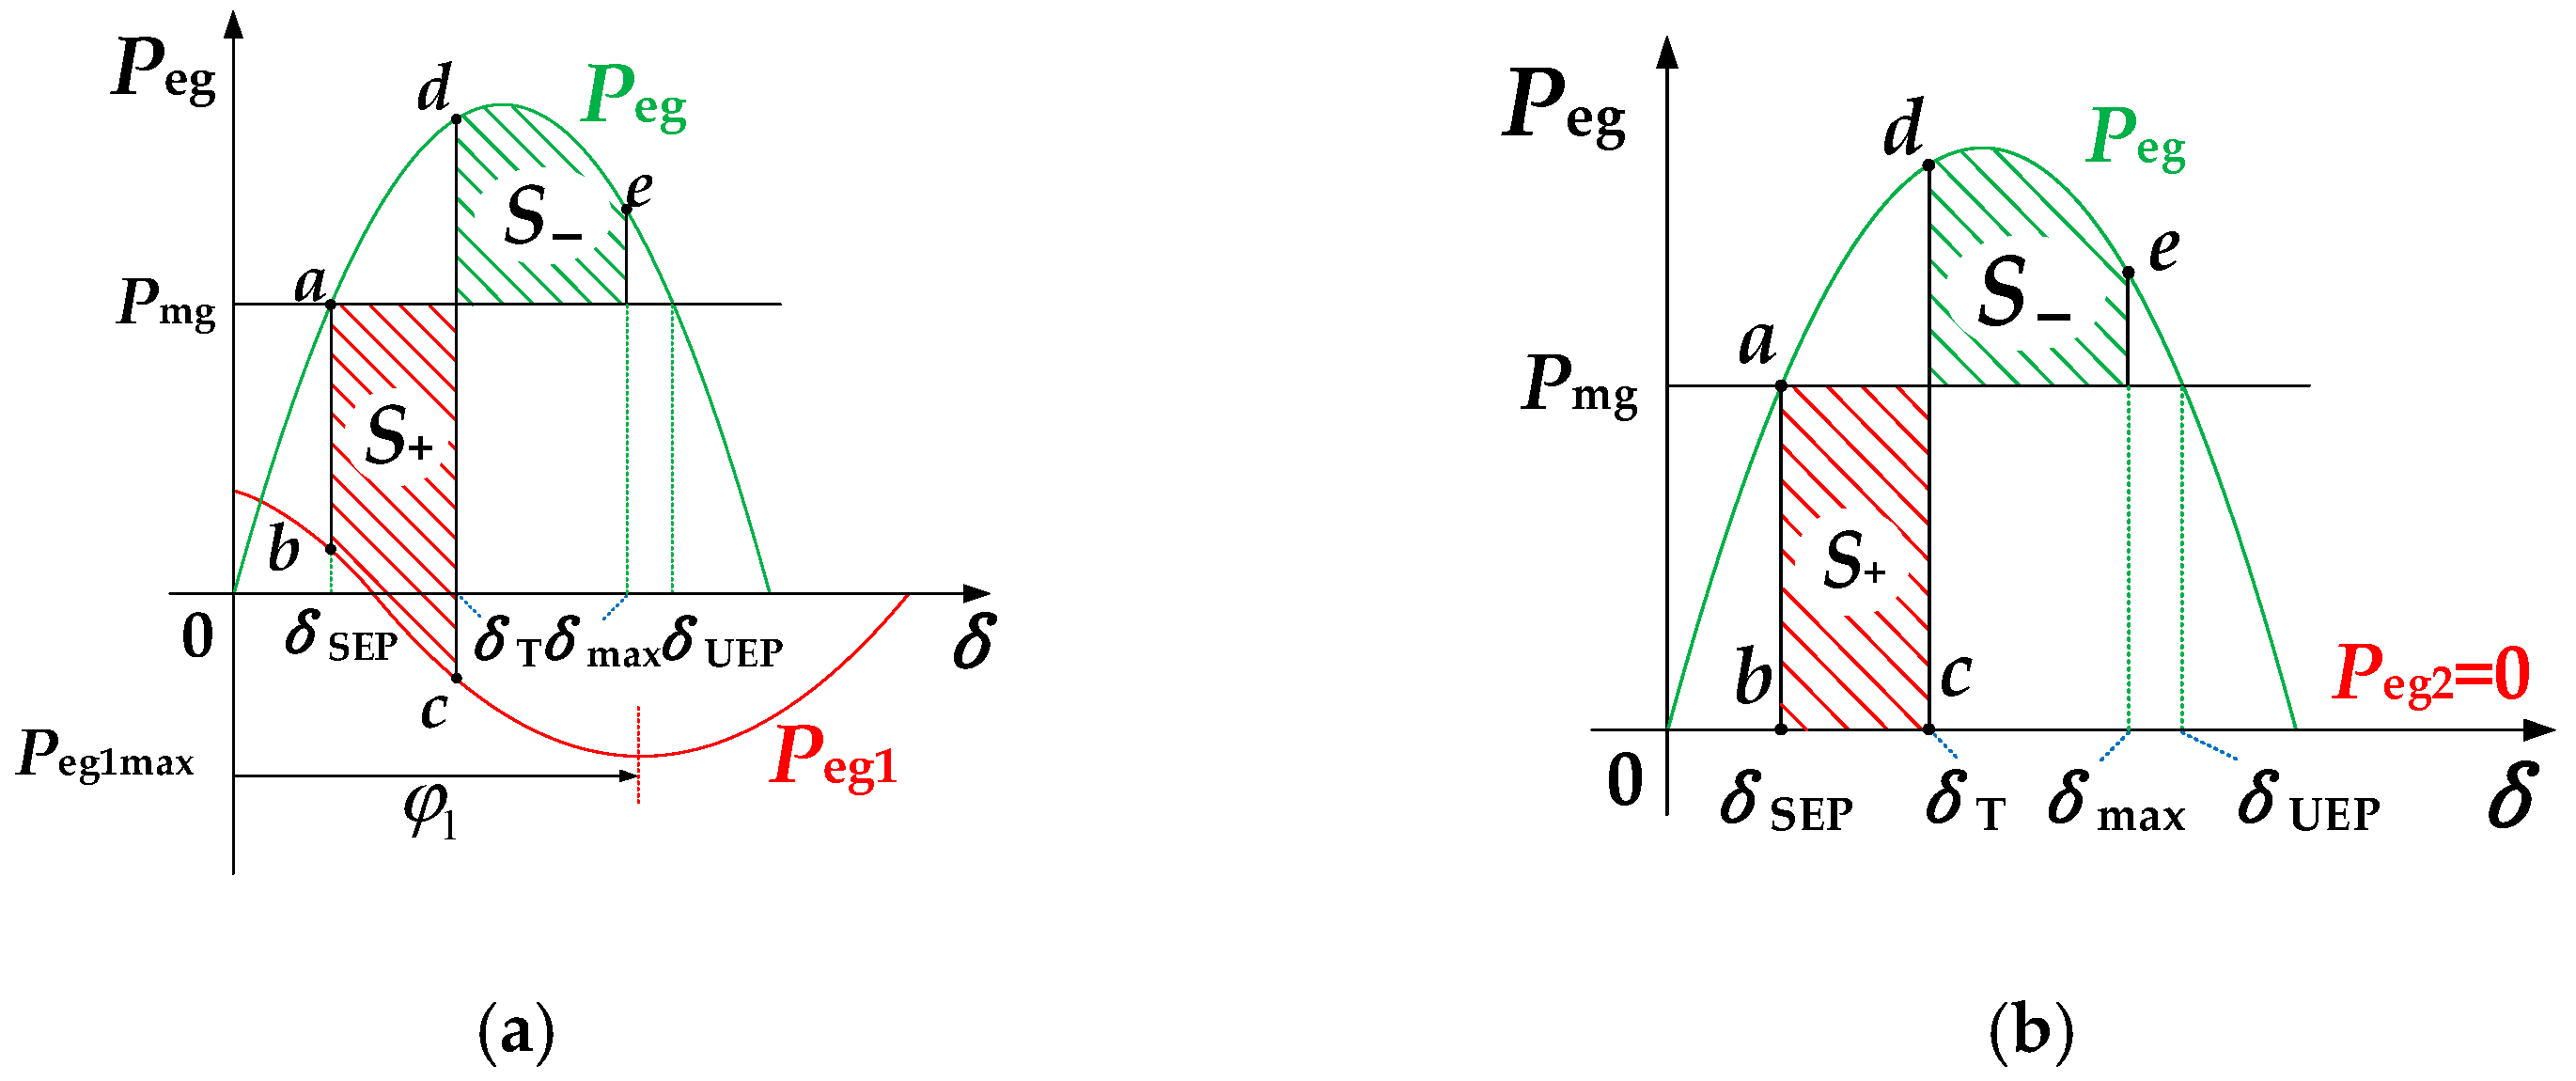
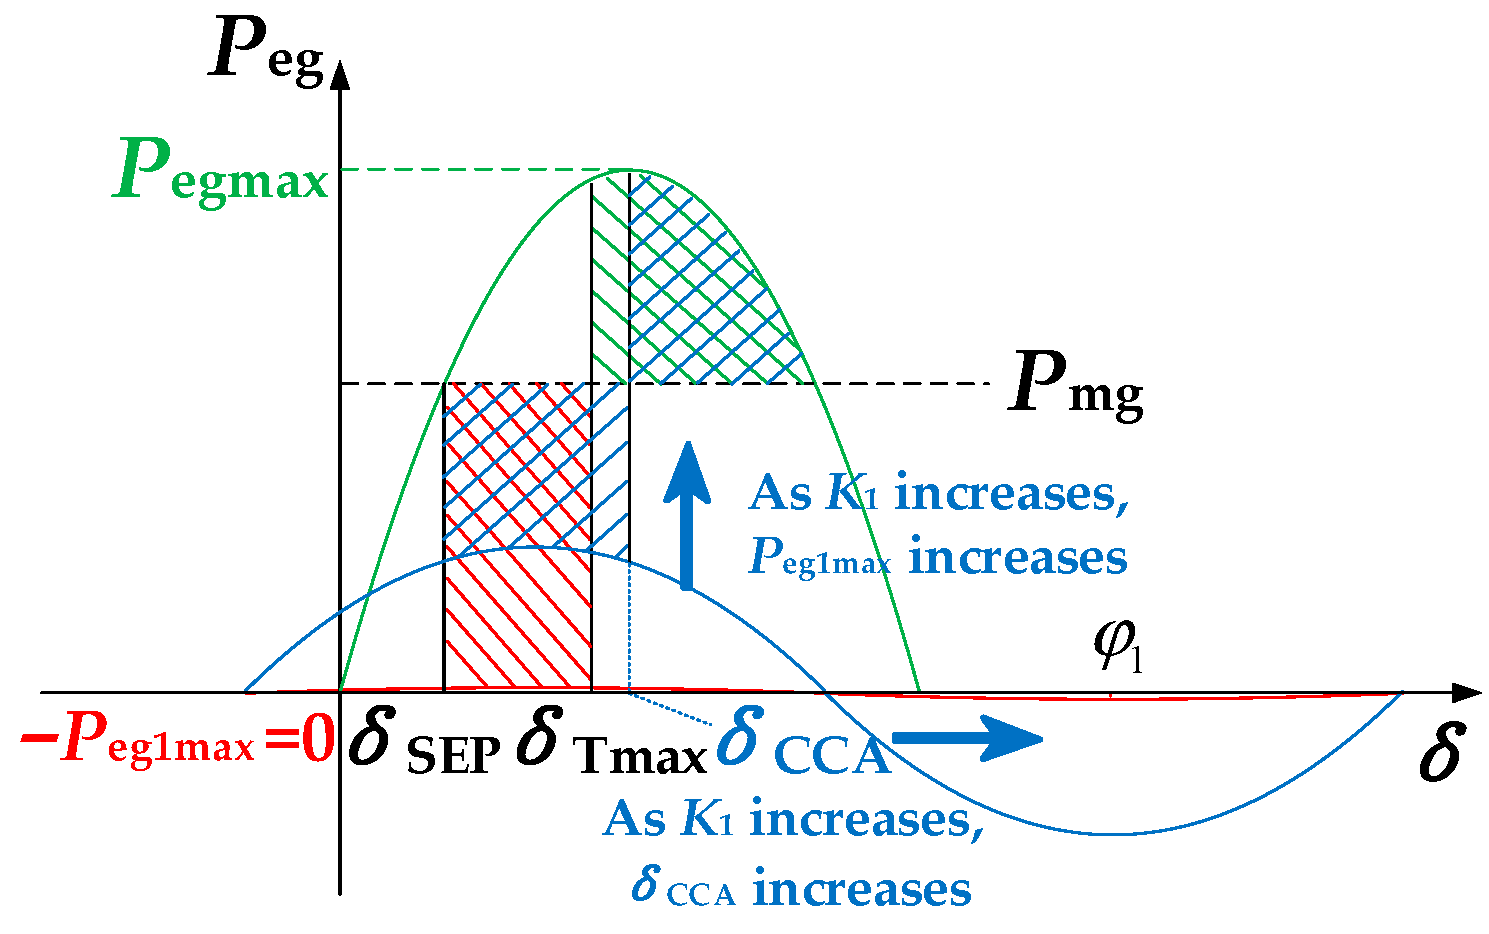
As shown in Figure 3a, when using EAC to assess the transient stability of a SG, the process is divided into the following key stages:
Stage 1: During steady-state operation, the SG maintains equilibrium at the SEP, where the mechanical power Pmg equals the electromagnetic power Peg0. The SEP is determined by the pre-fault load level of the system, and its corresponding rotor angle δSEP is given by the following:
δ SEP = arcsin ( P mg P eg 0 max ) = arcsin ( P mg X 2 E q U 0 )
In the equation, Peg0max represents the maximum output power of the SG under steady-state operation.
In addition to the SEP, the condition Pmg = Peg0 yields another intersection point, namely the UEP, with its corresponding rotor angle δUEP given by δUEP = π − δSEP.
Stage 2: At the instant of fault occurrence, the operating point shifts to point b. The mechanical torque Tmg exceeds the electromagnetic torque Teg, causing the rotor to accelerate toward increasing δ. The operating point moves toward point c, where Peg1max represents the maximum electromagnetic power of the SG under Line 1 fault conditions. When the fault is cleared at angle δT, the rotor accelerating area S+ is expressed as follows:
S + = δ SEP δ T ( P mg P eg 1 ) d δ
Stage 3: After fault clearance, the operating point shifts to point d, initiating rotor deceleration. If the fault is cleared promptly (i.e., δT < δcr), the maximum rotor angle swing δmax will not exceed δUEP. The decelerating area S is then given by the following:
S = δ T δ max ( P eg max sin δ P mg ) d δ
When δmax = δUEP, S is the maximum decelerating area S−max for the given δT.
Stage 4: If the fault is cleared promptly (i.e., S−max > S+), the rotor speed will decelerate to the rated synchronous speed before the operating point reaches the UEP, then continue to decelerate and eventually stabilize back to the SEP under damping effects. Conversely, if the fault clearance is delayed (i.e., S−max < S+), the rotor angle δ will exceed δUEP, resulting in transient instability of the SG. The clearing angle δCCA corresponding to S−max = S+ is defined as the CCA, and its associated fault duration is the CCT. Here, δCCA is determined by solving the following equation:
δ SEP δ CCA ( P mg P eg 1 ) d δ = δ CCA δ UEP ( P eg max sin δ P mg ) d δ
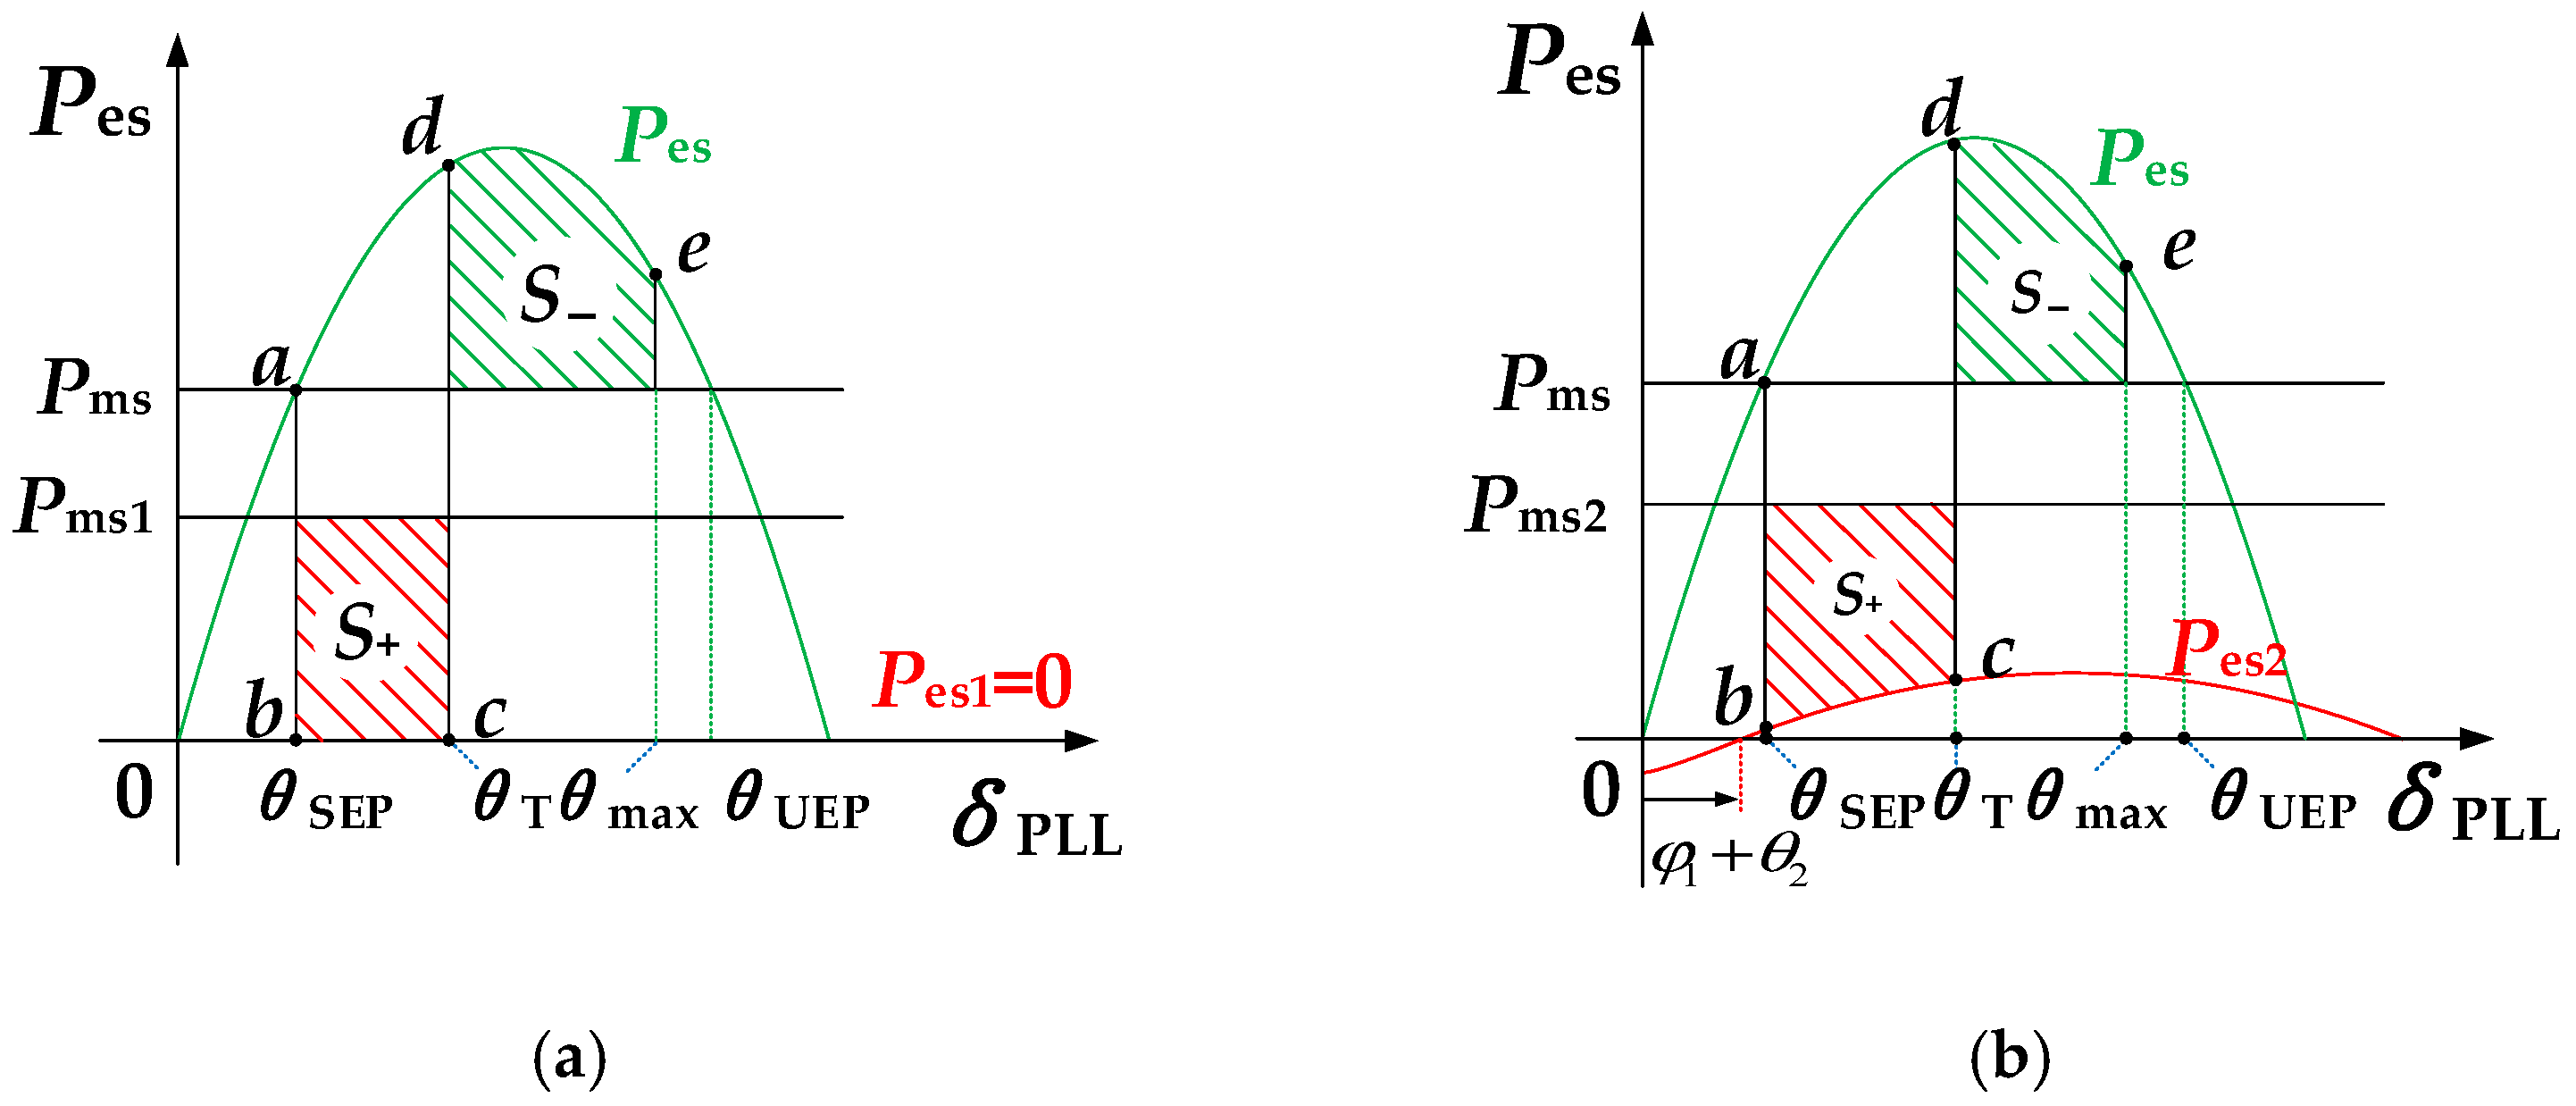
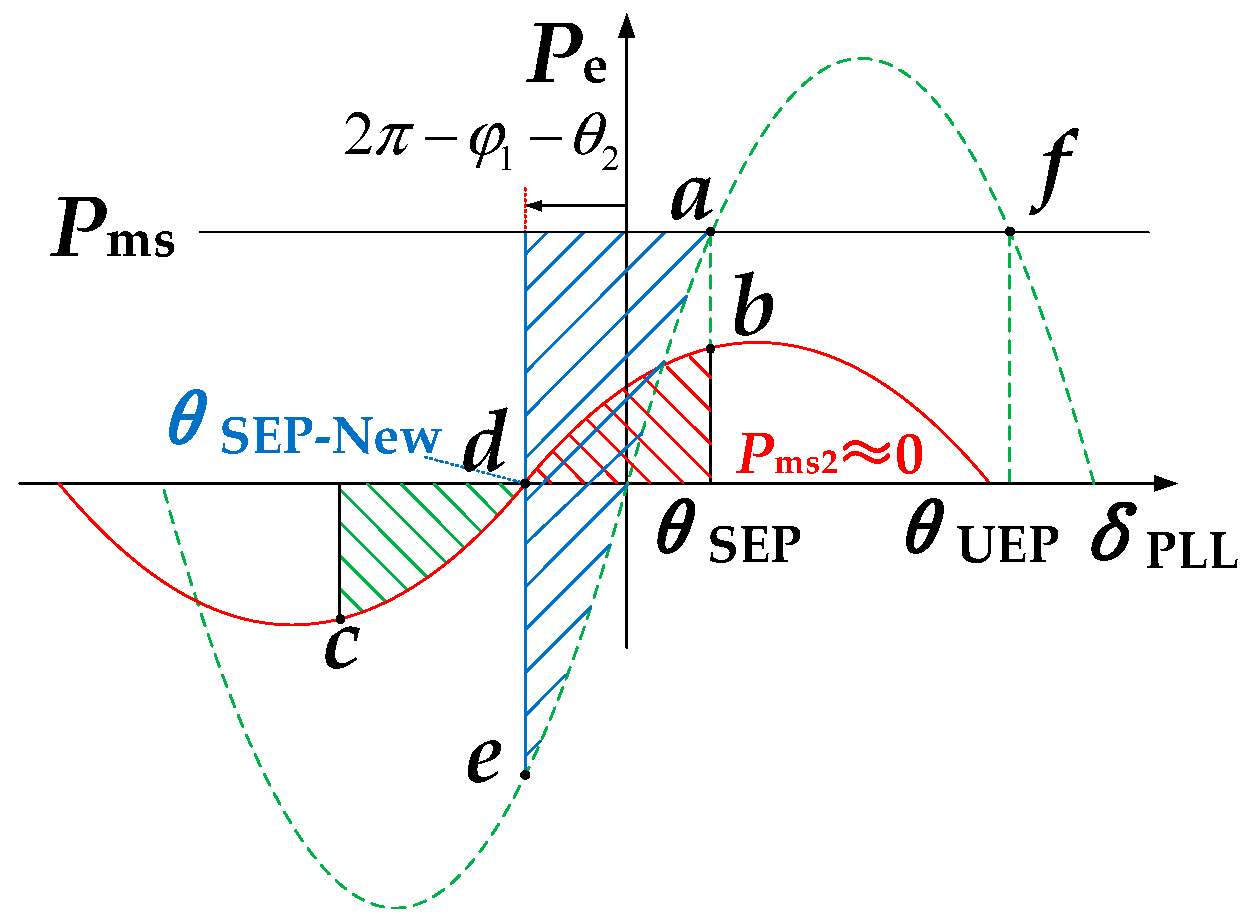
In the equivalent power curve of Converter 2, the equivalent power angle θSEP corresponding to SEP is:
θ SEP = arcsin ( P ms P es max )
The δPLL of Converter 2 exhibits dynamic characteristics similar to the power angle δ of a SG. When assessing its transient stability using EAC, the principle is consistent with that of SGs, which will not be reiterated here. The derived equivalent power-angle characteristic curve is shown in Figure 4.

4.2. Factors Affecting Transient Stability

4.2.1. Limiting Current in Converter Current-Limiting Mode

(1) Influence of Limiting Current on δPLL During Line 2 Fault
It can be seen from Equation (7) that when Line 2 fails, the amplitude and phase of the Pes2 curve of Converter 2 are affected by |I1max| and φ1, respectively, while the magnitude of Pms2 is influenced by |I2max| and φ2. During the Line 2 fault, δPLL is jointly determined by I1max and I2max. Based on the vector analysis method, the influence mechanism of the current limit on δPLL is analyzed.
The PLL of Converter 2 adopts PI control, and the dynamic characteristics of δPLL are determined by Usq:
U sq ( k p + k i s ) = d δ PLL d t
When K1 in Equation (2) is set to 1, Uf1 equals Us. After coordinate transformation, the expressions for Us and Usq in the dsqs coordinate system can be derived as follows:
U ˙ sq = U ˙ sq - I 1 + U ˙ sq - I 2 U ˙ sq - I 1 = Z eq I 1 I 1 max sin ( θ eq I 1 + φ 1 δ PLL ) e j π 2 U ˙ sq - I 2 = Z eq I 2 I 2 max sin ( θ eq I 2 + φ 2 ) e j π 2 Z ˙ eq I 1 = K 2 Z ˙ 2 = Z eq I 1 θ eq I 1 Z ˙ eq I 2 = Z ˙ 1 + K 2 Z ˙ 2 = Z eq I 2 θ eq I 2
According to Equations (17) and (18), the dynamic characteristics of δPLL are determined by Usq, which in turn depends on I1max and I2max. Therefore, during a Line 2 fault, δPLL is jointly governed by I1max and I2max.
Equation (18) indicates that the Usq component Usq-I1 determined by I1max varies with δPLL, leading to changes in both magnitude and phase of Usq, whereas the Usq component Usq-I2 determined by I2max remains unaffected by δPLL. According to Equation (17), the effect of Usq on δPLL is analogous to the effect of net torque on the power angle of a SG. Therefore, I1max and I2max, respectively, correspond to electromagnetic power and mechanical power of a SG. Among them, the magnitude of the former varies with δPLL or power angle, while the latter remains constant.
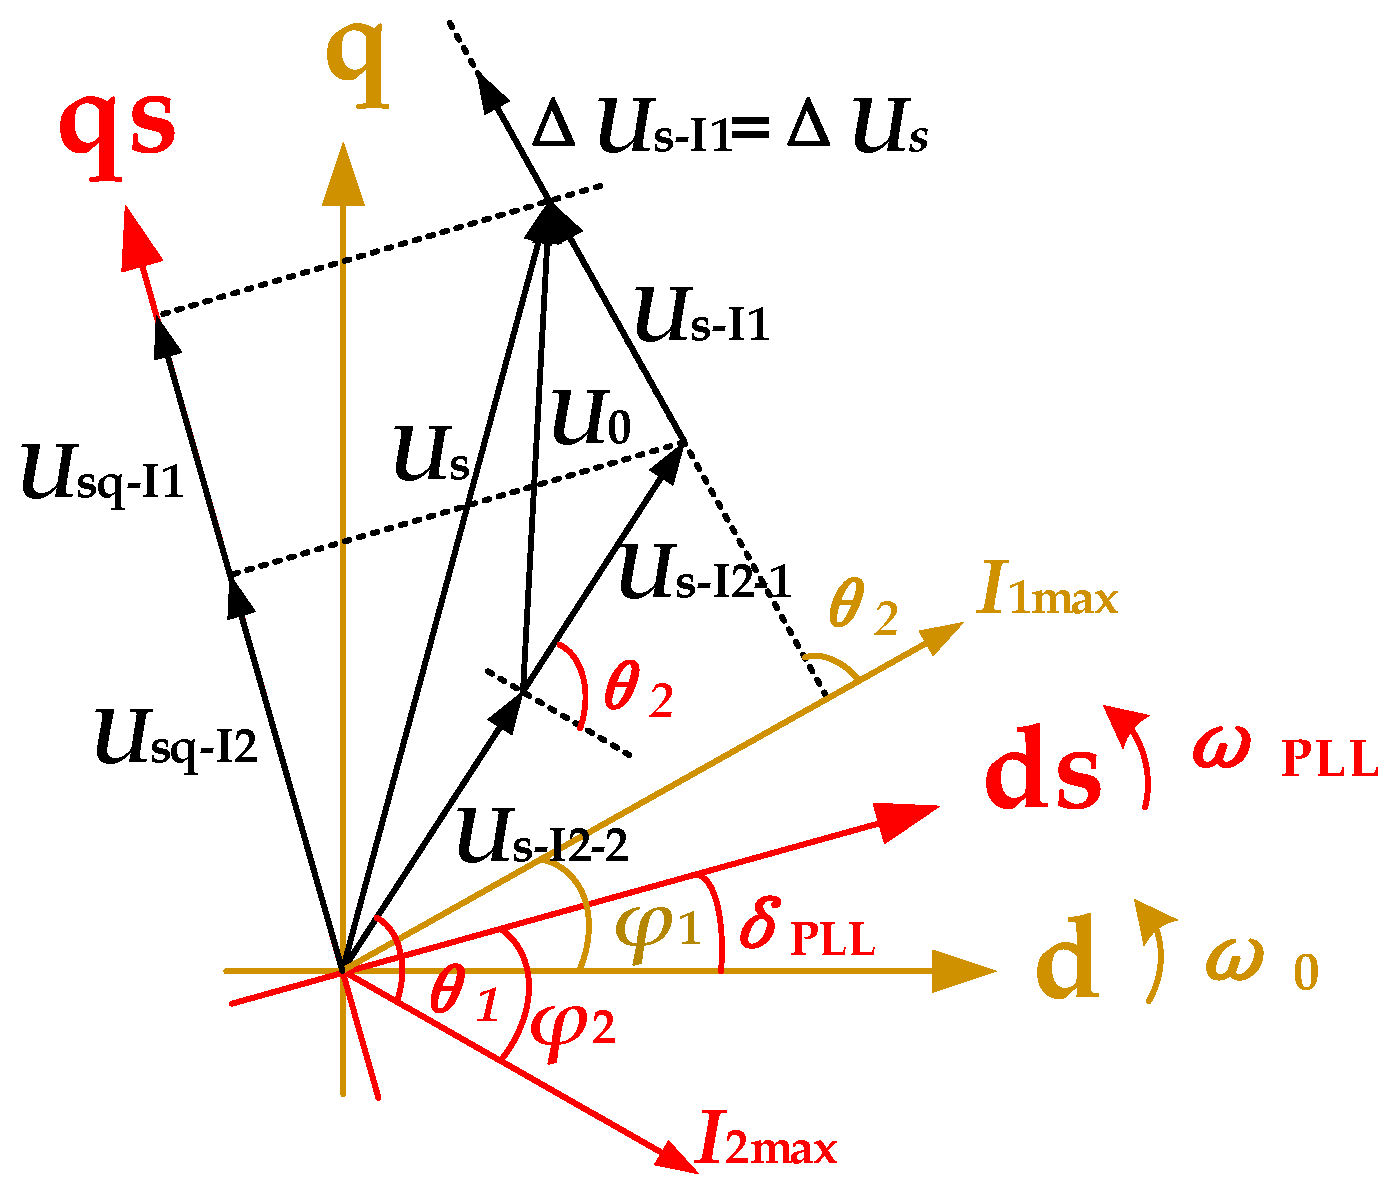
In Figure 5: Us-I2-1 and Us-I2-2 represent the voltages generated by I2max at the PCC of Converter 1 And Converter 2, respectively, while ΔUs-I1 denotes the increment in Us caused by the increase in I1max.
As shown in Figure 5, The Usq component that is in phase (or anti-phase) with the qs-axis will drive the dsqs coordinate system to rotate counterclockwise (or clockwise) in the dq coordinate system. Therefore, within the dsqs coordinate system, I1max and Us-I1 exhibit a tendency to rotate clockwise (or counterclockwise), causing Usq-I1 to vary in magnitude and polarity within the range of |Us-I1|. In contrast, I2max and Usq-I2 remain stationary relative to the dsqs coordinate system. Based on the above analysis, when I2max is fixed and |I1max| increases within a certain range, the dynamic behavior of δPLL during the fault undergoes the following changes:
  • If the initial value of Usq (Usq0) is nonzero and |I1max| results in |Usq-I1| < |Usq-I2|, δPLL will monotonically increase (if Usq0 > 0) or decrease (if Usq0 < 0).
  • As |I1max| increases, δPLL may either stabilize due to damping or exhibit oscillatory growth/decay, depending on the phase of I1max.
  • If the phase of I1max remains unchanged, further increasing |I1max| will cause δPLL that was stabilizing due to damping to continue stabilizing, while δPLL that was oscillating will either oscillate more prominently or transition to a stable state.
(2) Influence of Limiting Current on δPLL During Line 1 Fault
From Equation (6), it can be seen that when Line 1 fails, Converter 2 is only affected by I2max, where |I2max| only influences the magnitude of Pms1 while φ2 affects both the magnitude and sign of Pms1. Through vector analysis, the following is found:
U ˙ sq - I 1 = 0 U ˙ sq - I 2 = ( 1 K 1 ) Z 1 I 2 max sin ( θ 1 + φ 2 ) e j π 2 .
As shown in Equation (19), |I2max| only affects the magnitude of Usq-I2, while φ2 influences both the magnitude and phase of Usq-I2. Consequently, different φ2 values may cause δPLL to exhibit varying directional changes. If φ2 remains constant, an increase in |I2max| will amplify |Usq-I2|, accelerating the variation of δPLL during the fault. Therefore, with a fixed fault clearing time, as |I2max| increases, the post-fault δPLL will transition from stable to unstable, and larger |I2max| values increasingly undermine the transient stability of δPLL.
(3) Influence of Limiting Current on δ During Line 1 Fault
From Equation (10), it can be seen that the δ of the SG is only affected by the current limit during a fault on Line 1 and is solely influenced by I1max, where |I1max| and φ1 determine the amplitude and phase of its electromagnetic power curve, respectively. Therefore, for δ, φ1 determines the increase or decrease in S+, while |I1max| affects the magnitude of this increase or decrease. Through vector analysis, the following is found:
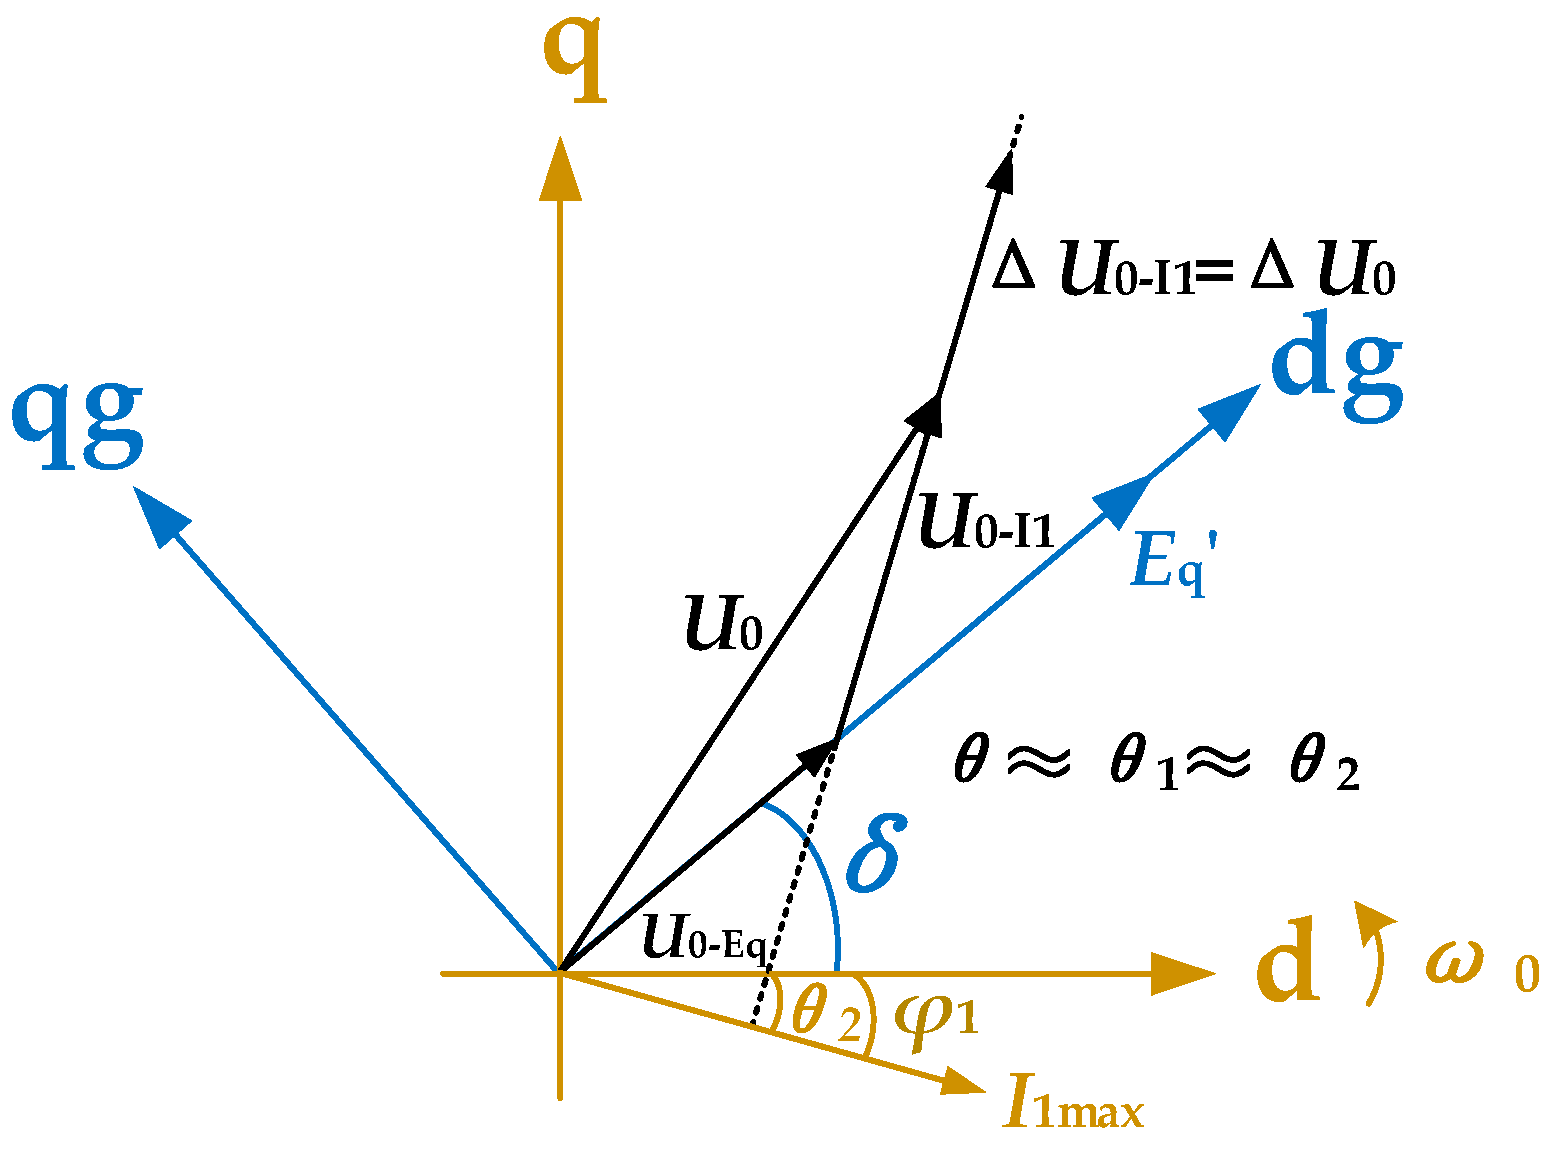
U0 is determined by Eq and I1max. Since the U0 component U0-E′q determined by Eq remains constant and its phase nearly aligns with U0 when the parameters of the two lines are similar, changes in the magnitude and phase of U0 are caused by the U0 component U0-I1 determined by I1max. As shown in Figure 6, when |I1max| is fixed, adjusting φ1 can alter the phase and amplitude of the PCC voltage U0 of Converter 1. If φ1 is set such that the angle between Eq and U0-I1 lies within 0~180°, according to the superposition theorem, increasing |I1max| will raise Pes1, thereby enhancing the synchronous stability of the generator during the fault. However, the current-carrying capacity of the equipment |I1max| limits the magnitude of U0-I1, resulting in a smaller amplitude of the I1max -coupled component in Peg1. Consequently, the influence of changes in I1max on the transient stability of the SG is limited.

4.2.2. Fault Location

(1) A fault occurs on the outgoing line of Converter 2
For Converter 2, under Fault 1, Pes1 = 0. Combined with Equation (6), it can be seen that the closer the fault point f1 is to Converter 2, the smaller Pms1 becomes, making Converter 2 less prone to equivalent power-angle instability. In principle, the following apply:
The larger K1 is, the smaller the impedance from PCC2 to the fault ground becomes. Limited by |I2max|, both |Us| and the corresponding |Usq| decrease, slowing the change in δPLL and increasing the CCT, which enhances the transient stability of Converter 2. In this case, if φ2 ∈ (−θ1, π−θ1), Usq will remain in a positive phase, and the increase in δPLL will slow further as K1 increases; for other values of φ2, the decrease will also slow.
Additionally, Equation (5) shows that the smaller the line impedance of Z1, the smaller Pms0 of Converter 2 under normal conditions, which improves its transient stability. This aligns with the conclusion that a higher short-circuit ratio leads to better PLL tracking performance.
For the SG, Peg1 is coupled with I1max. According to Equation (10), Peg1max depends on K1Z1 and the magnitude of I1max. When |I1max| is fixed, the distance of f1 from Converter 1 is monotonically related to CCT, and the value of φ1 determines whether this correlation is positive or negative. In principle, the larger the impedance of K1Z1 from Converter 1 to the fault ground, the greater the current injected by Converter 1 (acting as a current source) into the SG. If φ1 ensures the injected current promotes an increase in Peg1, the resulting Peg1 enhancement due to I1max coupling will improve the transient stability of the SG. Conversely, if φ1 opposes this effect, it will degrade transient stability.
(2) A fault occurs on the outgoing line of the SG
In high-voltage transmission systems, the reactance of line impedance significantly exceeds the resistance, with impedance angles consistently approaching 90°. Therefore, the following assumptions are made:
θ 1 θ 2
For Converter 2, both Pms2 and Pes2 are directly related to the line parameters. The difference between Pms2 and Pes2 acting on δPLL, denoted as ΔPs2, reflects the rate of change in ωPLL. The expression for ΔPs2 is as follows:
Δ P s 2 = Z 1 I 2 max sin ( θ 1 + φ 2 ) + K 2 Z 2 Δ P s 2 2
Δ P s 2 2 = I 2 max sin ( θ 1 + φ 2 ) I 1 max sin ( δ P L L φ 1 θ 1 ) ]
The variable K2 characterizing the location of fault point f2 only affects ΔPs2-2. When K2 is small, the sign of ΔPs2 is determined by the first term. If φ2 ≠ −θ1, δPLL will exhibit monotonic variation during the fault, with the direction of change determined by φ2. As K2 increases, the influence of ΔPs2 becomes more pronounced—both the direction and rate of δPLL variation are affected by the magnitude and phase of ΔPs2. Under parameter-matched conditions, δPLL may reach an equilibrium point during sustained faults.
For the SG, when a fault occurs on Line 2, its active power output becomes zero, and its transient stability becomes independent of the fault location.

5. Parameter Tuning Methodology for Transient Stability Enhancement

5.1. Parameter Tuning Methodology for GFL Converter Outgoing Line Faults

5.1.1. Parameter Tuning Methodology for SG

The magnitudes of |I1max| and |I2max| are constrained by the withstand capability of power equipment, making the controllable variables in the system φ1 and φ2. During Line 2 faults, the SG becomes decoupled from the system. Therefore, when designing parameter tuning methods to enhance the transient stability of SGs, only Line 1 fault conditions need to be considered.
After fault occurrence, the following occurs if the value of φ1 is set to simultaneously satisfy the subsequent conditions:
  • For a given δT, S+ reaches the minimum value among all possible φ1 settings;
  • δT corresponds to the δCCA under this specific φ1.
At this δT, any other φ1 values would lead to an increase in S+, causing the maximum rotor angle swing to exceed δUEP and resulting in transient instability of the SG. This specific φ1 is therefore considered the optimal value for the given clearing angle δT. The corresponding power-angle characteristic curve under this condition is shown in Figure 7.
Through systematic derivation, the solution for φ1 satisfying the aforementioned conditions is obtained as:
A cos [ 2 φ 1 δ eq ] B 1 + C K 1 sin [ φ 1 δ eq ] = E
A = E q U 0 X 2 ,   B = 2 E q I 1 max ,   C = X 2 X 1 ,   D = P mg ( π 2 δ eq ) δ eq = δ SEP = arcsin ( P mg X 2 E q U 0 ) , E = D A cos δ eq
In the equation: A, B, C, D, E, and δeq are all constants determined by the system topology parameters and operating conditions.
Under the aforementioned operating conditions, S+ is given by the following:
S + = 2 P mg ( φ 1 δ SEP π ) + 2 P eg 1 max sin ( φ 1 δ SEP )
P eg 1 max = E q I 1 max 1 + X 2 X 1 K 1
Subject to operational constraints, the relevant variables must satisfy the following requirements:
P mg > 0 ,   K 1 > 0 φ 1 = δ SEP + δ T 2 + π ( δ SEP + π , π 2 + π )
Consequently, the following can be derived:
2 P mg ( φ 1 δ SEP π ) ( 0 , π P mg ) 2 P eg 1 max sin ( φ 1 δ SEP ) ( 2 P eg 1 max , 0 )
The closer fault f1 is to Converter 1, the smaller Peg1max becomes and the larger S+ grows, making it more difficult for the SG to achieve transient stability. As shown in Figure 8, when the aforementioned two conditions are satisfied, faults occurring at PCC1 represent the most severe scenario for the SG across different fault locations. Compared to other fault points, this location yields the smallest δCCA, denoted as δCCA-min. When δT = δCCA-min, the φ1 value satisfying both conditions ensures the following:
  • For any fault location along Line 1, δCCA remains greater than δCCA-min;
  • This φ1 value maximally increases δCCA in the vicinity of δCCA-min.
Thus, from the perspective of overall transient stability enhancement, this φ1 setting provides improvement.
When fault f1 approaches Converter 1, the previously derived power-angle analytical equation can be simplified to the following:
A cos ( 2 φ 1 δ eq ) = E
Incorporating the operational constraints, the solution yields the following:
φ 1 = arccos γ + δ SEP 2
γ = ( π 2 δ SEP ) sin δ SEP cos δ SEP arccos γ ( 2 π , 3 π )
Thus, the value of φ1 can be determined solely based on the pre-fault steady-state power angle δSEP. In actual operation and maintenance, the control system can monitor δSEP in real time, automatically calculate the φ1 value, and dynamically adjust the current phase angle of current-limiting mode.

5.1.2. Parameter Tuning Methodology for GFL Converter

When a fault occurs on Line 1, Converter 2 becomes decoupled from the system. Under this condition, Pes1 = 0 and Pms1 depends solely on I2max and Line 1 parameters. Therefore, minimizing Pms1 is essential to reduce the rate of change of δPLL. Based on Equation (6), to achieve the smallest possible Pms1, the optimal φ2 is given by [33]:
φ 2 = θ 1

5.2. Parameter Tuning Methodology for SG Outgoing Line Faults

During a Line 1 fault, the optimal phase angle for I2max is set to φ2 = −θ1. According to Equation (7), this value simultaneously ensures Pms2 = 0 when Line 2 faults occur, thereby improving transient stability. However, this φ2 will cause Pms2 to be less than Pes2 at the instant of fault inception, resulting in reverse swinging of δPLL. Under sustained fault conditions, the system will ultimately stabilize at θSEP-New, with the corresponding equivalent power-angle characteristics shown in Figure 9. Based on the discussion of φ1 range limits in Equation (27), the power-angle curve offset angle of Converter 2’s equivalent electromagnetic power Pes2 must satisfy the following:
φ 1 + θ 2 ( 3 π 2 , 2 π )
Thus, the range of θSEP-New is determined to be the following:
θ SEP New ( π 2 , 0 )
If Converter 2 immediately resumes normal operation after fault clearance, Pms2 will rapidly recover to Pms0, corresponding to the acceleration area shown by the blue shaded region in Figure 9. Given the substantial acceleration area, Converter 2 is highly susceptible to transient instability during the recovery phase. In this scenario, prolonging its current-limiting mode duration can maintain the equivalent mechanical power near zero, thereby reducing the original acceleration area during recovery. This allows δPLL to stabilize via oscillations within the neighborhood of a 0° phase angle before the normal control is restored, ultimately returning δPLL to its pre-fault equilibrium point. This strategy can be transformed into a standard operation and maintenance procedure, involving three sequential steps: triggering the current-limiting mode through fault detection, maintaining the current-limiting duration, and progressively restoring the normal control mode.

6. Results

6.1. Case Overview

To validate the correctness of the research content and the effectiveness of the proposed parameter tuning method, this study establishes a corresponding simulation test system in PSCAD based on Figure 2, where both Converter 1 and Converter 2 employ MMC topology, and the SG adopts a 6th-order model. In the test system, the active power outputs of the SG and Converter 2 are 400 MW and 250 MW, respectively, with Converter 2’s reactive power set to 0 MVar. All faults are assumed to occur at 7.0 s, with the main circuit parameters listed in Table 1. For the base case (unless otherwise specified), the parameters are configured as follows: fault duration tf = 0.1 s, faults occurring only on a single line with K1 = K2 = 0.5, |I1max| = |I2max| = 1.2 p.u., φ1 = 230°, and φ2 = 0°. In this case study, Converter 2 is considered transiently unstable if the steady-state value of δPLL exceeds ±180°.

6.2. Simulation of Transient Stability Influencing Factors

In studying the influence of the phase angle and magnitude of I1max on Converter 2, a fault was applied to Line 2. The simulation results in Figure 10a demonstrate that when φ1 = −20°, δPLL exhibits forward swing, and as |I1max| increases, the rate of forward swing decreases, thereby enhancing stability; when φ1 = 160°, δPLL exhibits reverse swing, and as |I1max| increases, the rate of reverse swing increases, consequently weakening stability. The mechanism of I1max’s influence on the dynamic characteristics of δPLL is confirmed by the simulation results.
When investigating the influence of the phase angle and magnitude of I1max on the SG, a fault was applied to Line 1. The simulation results in Figure 10b show that when φ1 = 0°, I1max promotes the increase in δ; when φ1 = 180°, I1max suppresses the increase in δ. The larger |I1max| is, the more pronounced its effect on either promoting or suppressing the increase in δ becomes. However, overall, the influence of increasing |I1max| on the transient stability of the SG remains limited, which aligns with the analytical conclusions.
When investigating the influence of the phase angle and magnitude of I2max on Converter 2, a fault was applied to Line 1 with a duration of tf = 0.15 s. The simulation results in Figure 11a,b demonstrate that the phase of I2max determines the direction of change in the δPLL output angle; once the phase of I2max is determined, an increase in |I2max| accelerates the change in δPLL and weakens the stability of Converter 2, which is consistent with the analytical conclusions presented earlier.
To verify the influence of fault location on transient stability, simulations were conducted on the test system with f1 and f2 positioned at different locations.
Simulations with f1 at different locations in Figure 12a,b reveal that when f1 is closer to Converter 2, the Usq of Converter 2 decreases, leading to a slower rate of change in δPLL and relatively better synchronization stability; meanwhile, the Pes1 of the SG increases, resulting in a slower rate of change in δ and relatively better power-angle stability.
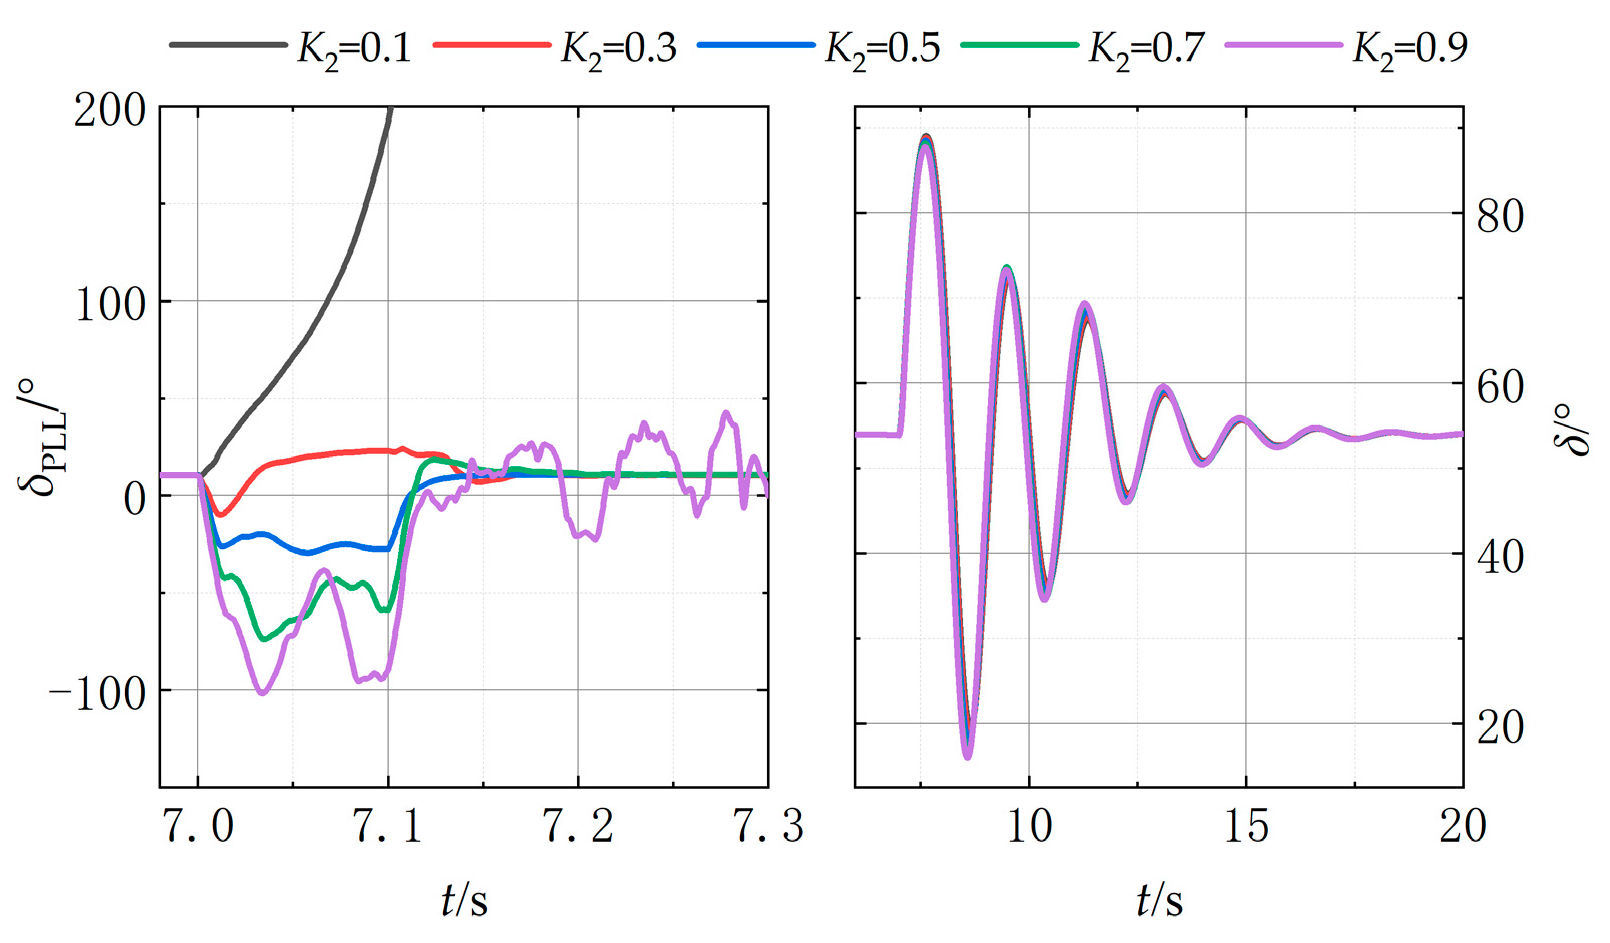
Simulations of the test system with f2 at different locations in Figure 13 demonstrate that when f2 is closer to the SG, the variation trends of δPLL and δ become more pronounced. These simulation results are consistent with the analytical conclusions.
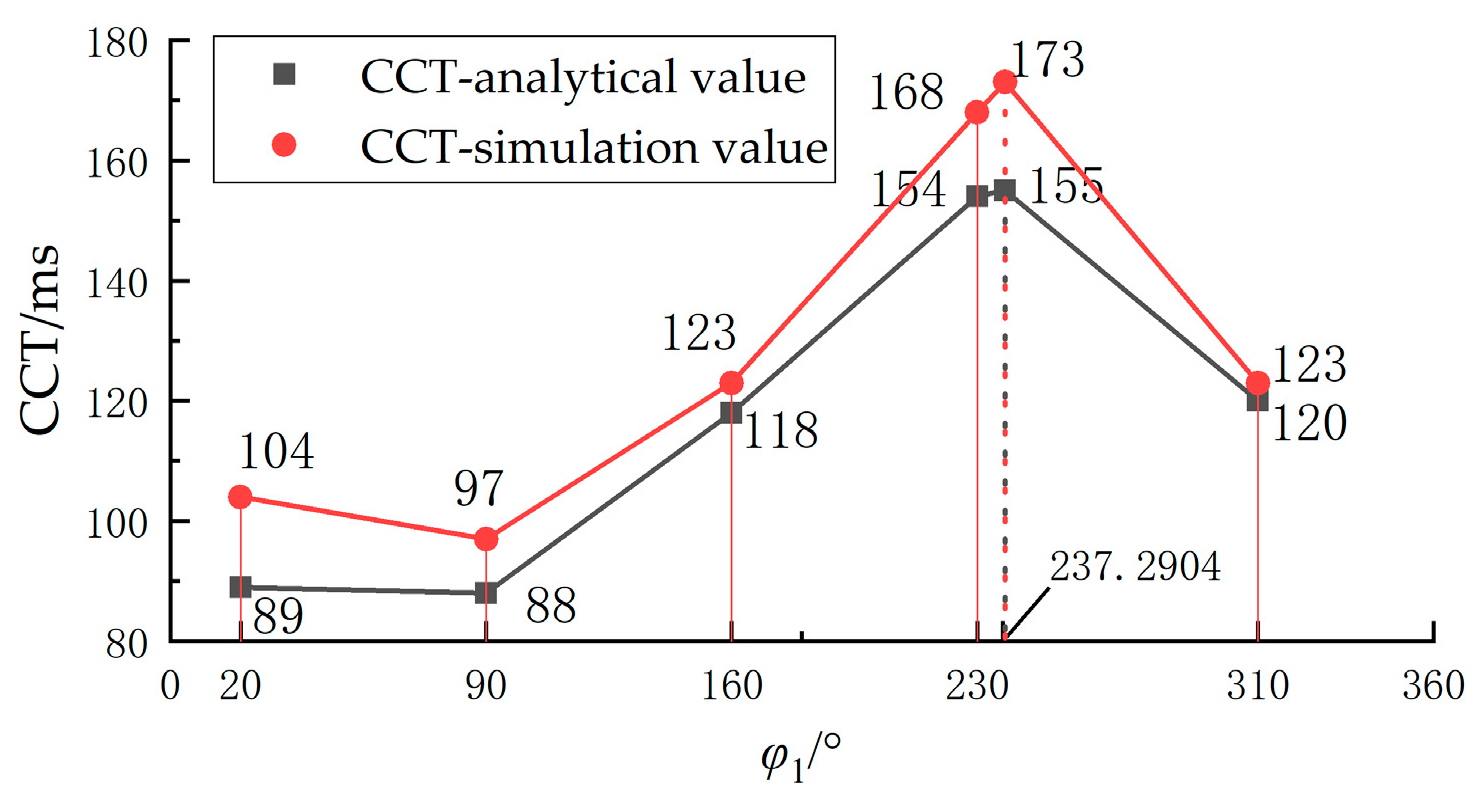
Based on the proposed parameter tuning method, the optimal φ1 and φ2 values for this test system are determined to be 237.9827° and −84.2904°, respectively. To validate the effectiveness of the proposed approach, simulations of CCT under different φ1 values were conducted, with the results shown in Figure 14. In this system, since Converter 2 exhibits significantly better stability than the SG during Fault 1, Figure 11b obtained from simulations is used here to verify and explain the optimal φ2 value rather than CCT.
As shown in Figure 14, the analytical CCT results are conservative due to the omission of system damping and other factors in the analytical model. However, simulation results indicate that the transient stability under the proposed parameter tuning method surpasses that achieved with other values of φ1 and φ2, thus verifying the effectiveness of the proposed tuning strategy for φ1 and φ2 values.
This paper proposes enhancing transient stability during Line 2 faults by extending the current-limiting mode duration. To validate the effectiveness of the delay-time tuning method, simulations results of CCT under different delay durations during Line 2 faults were conducted in Table 2. The simulations demonstrate that the proposed method significantly increases CCT, primarily improving the transient stability of Converter 2. As the delay duration extends, CCT increases within a certain range, after which the main unstable component shifts from Converter 2 to the SG, and CCT becomes determined by the SG. Beyond this point, further extending the delay duration no longer significantly enhances the transient stability of Converter 2. Therefore, selecting an appropriate exit time for the current-limiting mode to improve system transient stability is feasible.

7. Conclusions

This paper investigates the transient stability of the AC side in a hydro-wind-PV VSC-HVDC transmission system. An analytical model for transient stability analysis is established, revealing the dynamic interactions among various power sources. Based on influencing factors, a parameter tuning method is proposed to enhance the transient stability of the sending-end system. The main research findings are as follows:
  • In the context of hydro-wind-PV VSC-HVDC transmission, multiple types of equipment are mutually coupled. Various factors influence its transient stability by affecting the phase and magnitude of the PLL input phasor Usq and the electromagnetic power of synchronous machines.
  • The energy transfer paths and control interactions during transient processes are related to the fault location, parameter settings of the current-limiting mode in converter stations, and the operational states of the equipment.
  • This paper derives an optimal phase angle calculation formula for the current-limiting mode of converters and proposes a tuning method for extending the current-limiting mode duration during the recovery stage. These measures aim to enhance system transient stability when transmission line faults occur. The correctness of the analysis and the effectiveness of the proposed method are verified by PSCAD.
This paper focuses on the transient stability of the AC side in hydro-wind-PV VSC-HVDC transmission system, providing a reliable technical approach for the planning and design of multi-energy complementary systems and the optimization of system parameters for multi-source cooperative stability. The research outcomes offer guiding significance for enhancing renewable energy integration levels and ensuring the secure and stable operation of new power systems.

Author Contributions

Conceptualization, Z.X.; methodology, J.F.; validation, J.F.; formal analysis, J.F.; investigation, J.F. and Y.M.; data curation, J.F.; writing—original draft preparation, J.F.; writing—review and editing, Z.Z., Y.M. and H.J.; visualization, J.F.; supervision, X.L. and K.M.; project administration, X.L., K.M. and H.J.; funding acquisition, X.L., K.M. and H.J. All authors have read and agreed to the published version of the manuscript.

Funding

This research was funded by Science and Technology Project of China Southern Power Grid Co., Ltd., grant number GDKJXM20222092 (036100KK52222023).

Institutional Review Board Statement

Not applicable.

Informed Consent Statement

Not applicable.

Data Availability Statement

The original contributions presented in the study are included in the article, further inquiries can be directed to the corresponding author.

Conflicts of Interest

Authors Xinwei Li, Kai Ma and Han Jiang were employed by the company Electric Power Research Institute of Guangdong Power Grid Co., Ltd. Author Yanjun Ma was employed by the company Guangdong Power Grid Co., Ltd. The remaining authors declare that the research was conducted in the absence of any commercial or financial relation-ships that could be construed as a potential conflict of interest.

Abbreviations

The following abbreviations are used in this manuscript:
ACAlternating Current
PVPhotovoltaic
VSCVoltage Source Converter
HVDCHigh-Voltage Direct Current
MMCModular Multilevel Converter
GFMGrid-Forming
GFLGrid-Following
SGSynchronous Generator
PLLPhase-locked Loops
EMFElectromotive Force
EACEqual Area Criterion
CCTCritical Clearing Time
SEPStable Equilibrium Point
UEPUnstable Equilibrium Point
CCACritical Clearing Angle

Appendix A

Appendix A.1

The vector transformation relationships between different coordinate systems are as follows:
φ 1 + θ 2 ( 3 π 2 , 2 π )
Here, Adq, Adsqs, and Adgqg represent the vector expressions of phasor A in the dq rotating reference frame, dsqs rotating reference frame, and dgqg rotating reference frame, respectively, where
  • δ denotes the angle between Eq and the dg-axis of the dgqg rotating frame;
  • ω represents the angular velocity corresponding to δ;
  • δPLL indicates the angular displacement between the dq frame and dgqg frame.

Appendix A.2

Expressions for the voltages at fault points (Uf1 at f1 and Uf2 at f2) and the SG output current (Ig) in a universally applicable equivalent circuit under fault conditions is as follows:
U ˙ f 1 = Z ˙ f 1 [ Z ˙ 21 + ( Z ˙ f 2 / / Z ˙ 21 ) ] ( Z ˙ 12 + Z ˙ f 1 ) + [ Z ˙ 22 + ( Z ˙ f 2 / / Z ˙ 21 ) ] I ˙ 1 max + Z ˙ f 1 [ Z ˙ 12 + Z ˙ 22 + ( Z ˙ f 2 / / Z ˙ 21 ) ] Z ˙ f 1 + [ Z ˙ 12 + Z ˙ 22 + ( Z ˙ f 2 / / Z ˙ 21 ) ] I ˙ 2 max + ( Z ˙ f 1 + Z ˙ 12 + Z ˙ 22 ) / / Z ˙ f 2 [ ( Z ˙ f 1 + Z ˙ 12 + Z ˙ 22 ) / / Z ˙ f 2 ] + Z ˙ 21 Z ˙ f 1 Z ˙ f 1 + Z ˙ 12 + Z ˙ 22 E ˙ q
U ˙ f 2 = ( Z ˙ f 2 / / Z 21 ) ( Z ˙ 12 + Z ˙ f 1 ) ( Z ˙ 12 + Z ˙ f 1 ) + [ Z ˙ 22 + ( Z ˙ f 2 / / Z ˙ 21 ) ] I ˙ 1 max + ( Z ˙ f 2 / / Z ˙ 21 ) Z ˙ f 1 Z ˙ f 1 + [ Z ˙ 12 + Z ˙ 22 + ( Z ˙ f 2 / / Z ˙ 21 ) ] I ˙ 2 max + ( Z ˙ f 1 + Z ˙ 12 + Z ˙ 22 ) / / Z ˙ f 2 [ ( Z ˙ f 1 + Z ˙ 12 + Z ˙ 22 ) / / Z ˙ f 2 ] + Z ˙ 21 E ˙ q
I ˙ g = ( 1 ) Z ˙ 12 + Z ˙ f 1 ( Z ˙ 12 + Z ˙ f 1 ) + [ Z ˙ 22 + ( Z ˙ f 2 / / Z ˙ 21 ) ] Z ˙ f 2 Z ˙ 21 + Z ˙ f 2 I ˙ 1 max + ( 1 ) Z f 1 Z ˙ f 1 + [ Z ˙ 12 + Z ˙ 22 + ( Z ˙ f 2 / / Z ˙ 21 ) ] Z ˙ f 2 Z ˙ 21 + Z ˙ f 2 I ˙ 2 max + 1 [ ( Z ˙ f 1 + Z ˙ 12 + Z ˙ 22 ) / / Z ˙ f 2 ] + Z ˙ 21 E ˙ q

References

  1. Xu, J.; Zhang, W.; Liu, W.; Li, Y.; Tian, X.; Liu, C.; Wei, L. Study on the driving force and challenges of developing power grid with high penetration of renewable energy. In Proceedings of the 2017 IEEE Transportation Electrification Conference and Expo, Asia-Pacific (ITEC Asia-Pacific), Harbin, China, 7–10 August 2017. [Google Scholar] [CrossRef]
  2. Liang, Z.; Wu, Y.; Lei, Z.; Lu, Z.; Liu, S.; Xie, Y.; Liu, M. An Optimization Method for Distributed Energy Resource Aggregators to Participate in Electricity Market Bidding Considering PV Uncertainty and Distribution Network Security Check. Guangdong Electr. Power 2024, 37, 138–146. [Google Scholar]
  3. Tang, W.; Nie, X.; Qian, T.; Guo, C.; Chen, W. Review and Prospect on Application Technologies of Energy Storage for Safety and Stability of New Power System. Guangdong Electr. Power 2024, 37, 3–15. [Google Scholar]
  4. International Renewable Energy Agency. Renewable Capacity Statistics 2025; IRENA Publications: Abu Dhabi, United Arab Emirates, 2025; pp. 58–61.
  5. National Energy Administration Releases National Power Industry Statistics for January–August 2024. Available online: https://www.nea.gov.cn/2024-09/23/c_1212399359.htm (accessed on 23 September 2024).
  6. Gantumur, S.; Bekhbat, G. Challenges of hybrid DGs for islanded micro-grid operation in west region energy system of Mongolia. In Proceedings of the 2016 11th International Forum on Strategic Technology (IFOST), Novosibirsk, Russia, 1–3 June 2016. [Google Scholar] [CrossRef]
  7. Dusenge, P.; Niyonsaba, J.D.A.; Samvura, J.D.D.; Bikorimana, J.; Rwahama, T.; Mudaheranwa, E. Feasibility study of hybrid Hydro-PV power plant possible deployment in remote rural area. In Proceedings of the 2022 IEEE PES/IAS Power Africa, Kigali, Rwanda, 22–26 August 2022. [Google Scholar] [CrossRef]
  8. Tian, Z. Further Promoting the Development of New Energy in Western China. China Ind. 2010, 3, 16. [Google Scholar]
  9. Ci, Z. Overview of New Energy Development and Utilization in Tibet, China. Energy Eng. 1996, 16, 6. [Google Scholar]
  10. Yang, J.; Dai, Q.; Zhou, Y. Research on Wind Resource Utilization of Plateau Mountain Wind Farms. In Proceedings of the Internet of Things and New Power Technologies—Yunnan Power Technology Forum 2014, Kunming, China, 8 December 2014; p. 254. [Google Scholar]
  11. Sun, Q.; Li, D.; Wang, R.; Sui, Z.; Yao, J.; Shen, Q.; Yu, X. Power System with High Shares of Renewables and Power Electronics: A New Stability Criterion and Classification. Proc. CSEE 2024, 44, 3016–3036. [Google Scholar]
  12. Sultan, H.M.; Kuznetsov, O.N.; Menesy, A.S.; Kamel, S. Optimal Configuration of a Grid-Connected Hybrid PV/Wind/Hydro-Pumped Storage Power System Based on a Novel Optimization Algorithm. In Proceedings of the 2020 International Youth Conference on Radio Electronics, Electrical and Power Engineering (REEPE), Moscow, Russia, 12–14 March 2020. [Google Scholar] [CrossRef]
  13. Yang, L. Distribution Pattern and Spatiotemporal Changes of Bulk Energy Development and Utilization in China. Ph.D. Thesis, Lanzhou University, Lanzhou, China, 2012. [Google Scholar]
  14. Zhao, J. HVDC Transmission Technologies at the Frontier. Electr. Power 2005, 38, 1–6. [Google Scholar]
  15. Flourentzou, N.; Agelidis, V.G.; Demetriades, G.D. VSC-Based HVDC Power Transmission Systems: An Overview. IEEE Trans. Power Electron. 2009, 24, 592–602. [Google Scholar] [CrossRef]
  16. Luo, B.; Chen, Y.; Liu, Z.; Miao, S.M.; Wang, H.R.; Zhang, H. Short-Term Optimal Dispatch Model for Maximizing Expectation of Accommodation Power of Cascade Hydro-Photovoltaic Complementary System. Autom. Electr. Power Syst. 2023, 47, 66–75. [Google Scholar]
  17. Rao, H.; Huang, W.; Guo, Z.; Zhou, Y. Practical Experience of VSC-HVDC Transmission in Large Grid. High Volt. Eng. 2022, 48, 3347–3355. [Google Scholar]
  18. Tan, J.; He, C.; Chen, B.; Liu, T.; Nan, L.; Yin, Y. Distributionally Robust Optimal Scheduling Method of Power System Considering Hydropower-Photovoltaic-Pumped Storage Complementarity and DC Transmission. Proc. CSEE 2024, 44, 5947–5960. [Google Scholar]
  19. Zhan, C.; Wu, H.; Wang, X.; Wang, J.; Tian, X.; Lu, Y. An Overview of Stability Studies of GFM Voltage Source Converters. Proc. CSEE 2023, 43, 2339–2359. [Google Scholar]
  20. Wang, X.; Taul, M.G.; Wu, H.; Liao, Y.; Blaabjerg, F.; Harnefors, L. Grid-Synchronization Stability of Converter-Based Resources—An Overview. IEEE Open J. Ind. Appl. 2020, 1, 115–134. [Google Scholar] [CrossRef]
  21. Yang, Y.; Lin, X.; Wu, G.; Li, S.; Xue, Y.; Xu, Z. Analysis of Transient Synchronization Stability of Power System with GFM/GFL Nonsynchronous-Machine Sources. Acta Energiae Solaris Sin. 2024, 45, 218–228. [Google Scholar]
  22. Wang, X.; Du, W.; Wang, H. Stability Analysis of Grid-Tied VSC Systems Under Weak Connection Conditions. Proc. CSEE 2018, 38, 1593–1604. [Google Scholar]
  23. Taul, M.G.; Wang, X.; Davari, P.; Blaabjerg, F. An Overview of Assessment Methods for Synchronization Stability of Grid-Connected Converters Under Severe Symmetrical Grid Faults. IEEE Trans. Power Electron. 2019, 34, 9655–9670. [Google Scholar] [CrossRef]
  24. Ruan, L.; Wang, Y.; Xiao, X.; Wang, H.; Xu, Q.; Jia, C. Dynamic Interaction Control Characteristic Analysis of GFL and GFM Inverters. Smart Power 2024, 52, 103–110. [Google Scholar]
  25. Huang, S.; Yao, J.; Zhong, Q.; Gong, S.; Xu, H. Transient Synchronization Stability Analysis of Hybrid Power System with GFL and GFM Renewable Energy Generation Units. Proc. CSEE 2024, 44, 8378–8392. [Google Scholar]
  26. Research on the Power Transmission Capability of PV-Hydro Complementary MMC-HVDC Transmission System. Available online: http://kns.cnki.net/kcms/detail/11.2107.tm.20240829.1325.014.html (accessed on 10 September 2024).
  27. Taul, M.G.; Wang, X.; Davari, P.; Blaabjerg, F. Current Limiting Control with Enhanced Dynamics of GFM Converters During Fault Conditions. IEEE J. Emerg. Sel. Top. Power Electron. 2020, 8, 1062–1073. [Google Scholar] [CrossRef]
  28. Pan, D.; Wang, X.; Liu, F.; Shi, R. Transient Stability of Voltage-Source Converters with GFM Control: A Design-Oriented Study. IEEE J. Emerg. Sel. Top. Power Electron. 2020, 8, 1019–1033. [Google Scholar] [CrossRef]
  29. Huang, L.; Xin, H.; Ju, P.; Hu, J. Synchronization Stability Analysis and Unified Synchronization Control Structure of Grid-Connected Power Electronic Devices. Electr. Power Autom. Equip. 2020, 40, 10–25. [Google Scholar]
  30. Xiang, Z.; Ni, Q.; Li, Z.; Xu, J.; Xue, Y.; Zhang, Z.; Xu, Z. Transient Stability Mechanism Analysis of GFL MMC-HVDC. J. Electr. Eng. 2023, 18, 250–259. [Google Scholar]
  31. Wang, X.F. Modern Power System Analysis; Science Press: Beijing, China, 2003. [Google Scholar]
  32. Kundur, P. Power System Stability and Control; McGraw-Hill: New York, NY, USA, 1994; pp. 279, 831, 835. [Google Scholar]
  33. Hu, Q.; Fu, L.; Ma, F.; Ji, F. Large Signal Synchronizing Instability of PLL-Based VSC Connected to Weak AC Grid. IEEE Trans. Power Syst. 2019, 34, 3220–3229. [Google Scholar] [CrossRef]
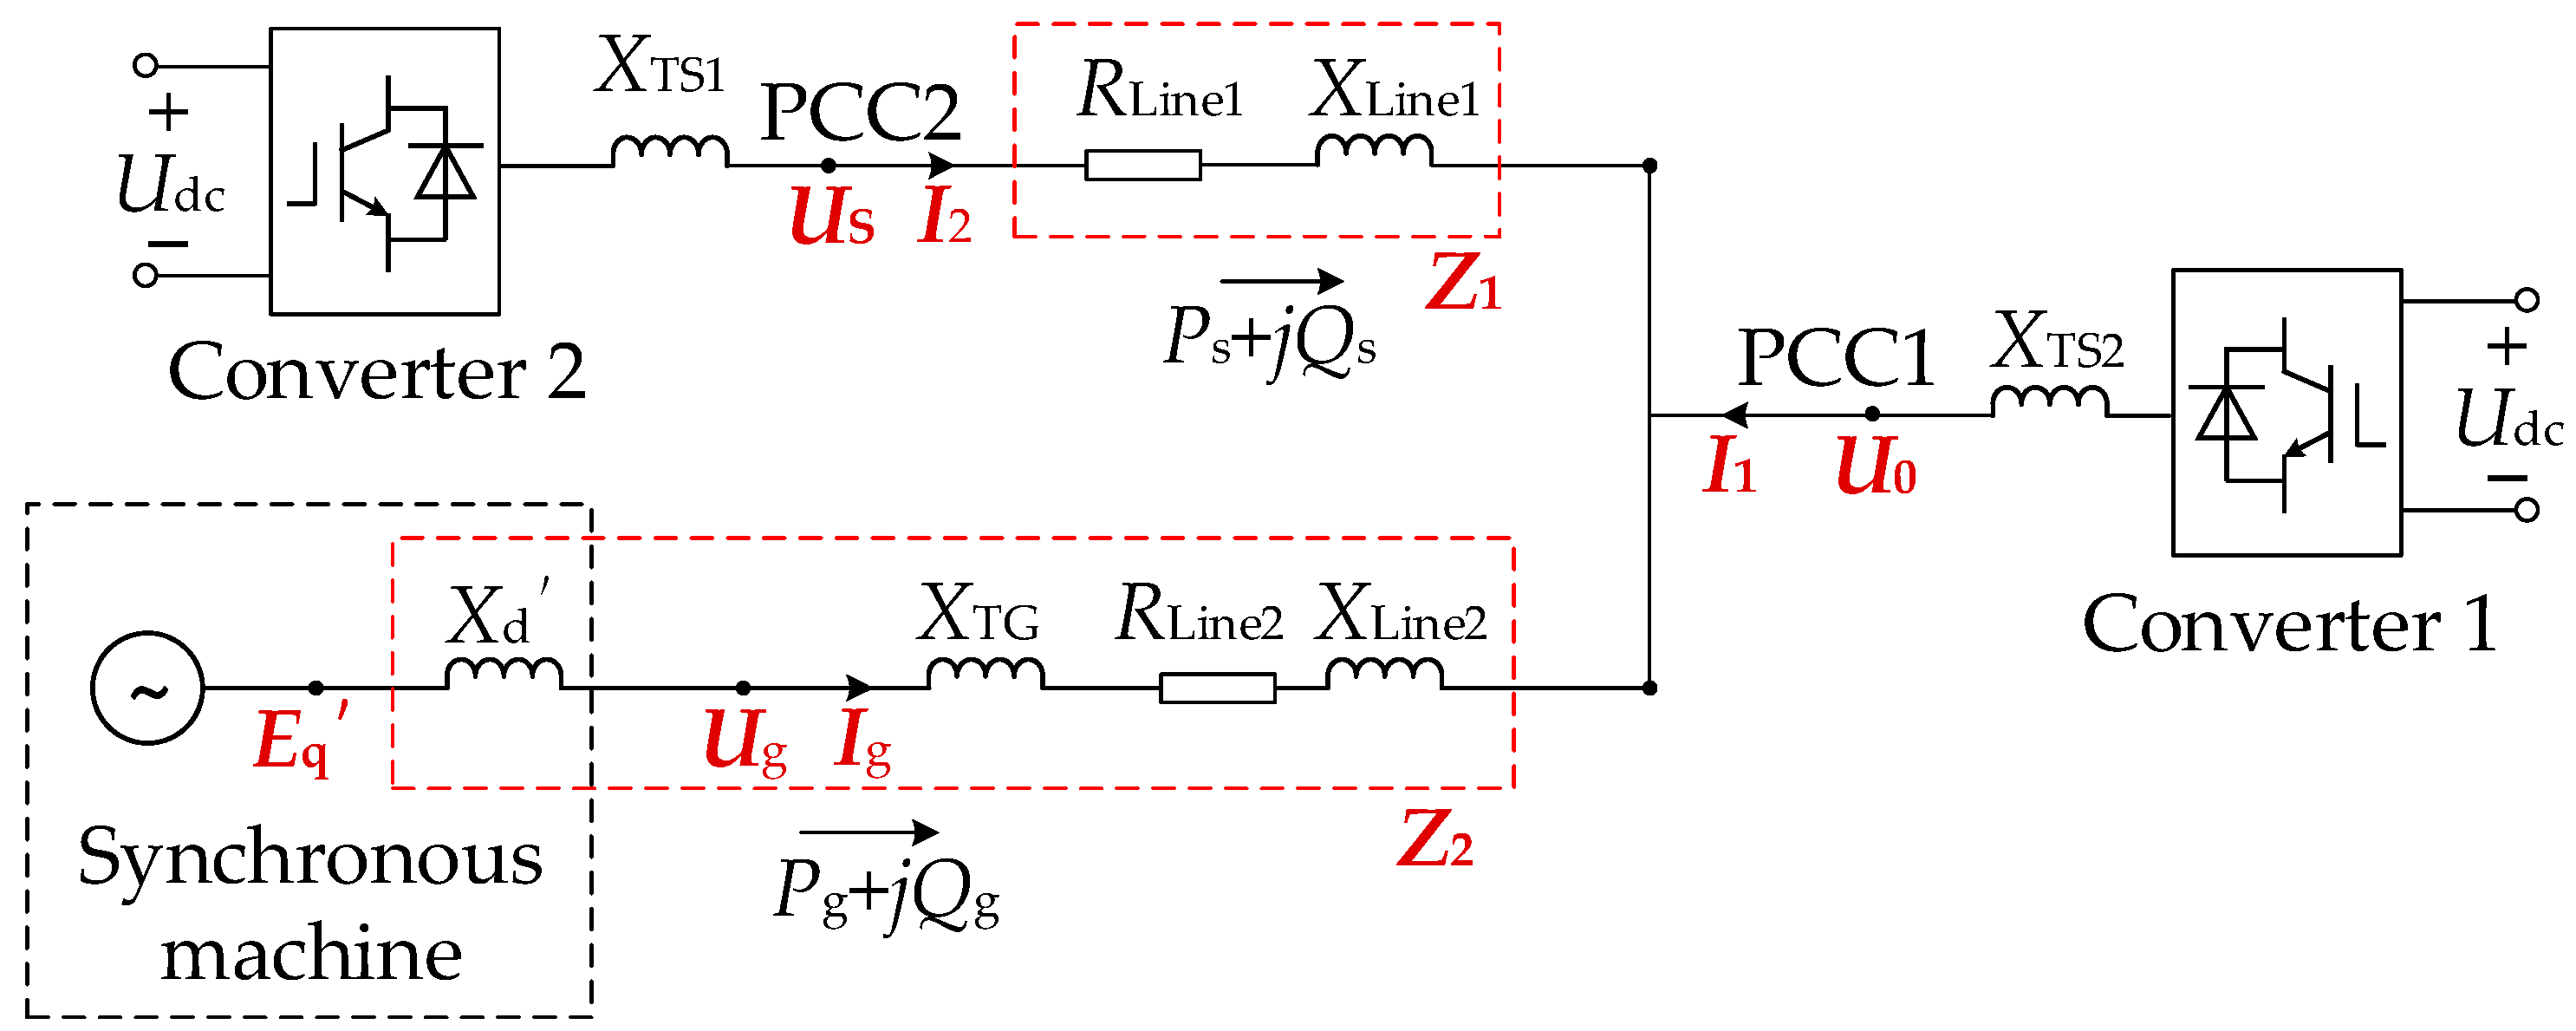
Figure 1. Equivalent circuit of the sending-end system for a hydro-wind-PV VSC-HVDC transmission system.
Applsci 15 09456 g001
Figure 2. Generic equivalent circuit diagram of the sending-end system.
Applsci 15 09456 g002
Figure 3. Power-angle characteristic curve of SG under fault conditions: (a) Fault in transmission line 1; (b) Fault in transmission line 2.
Applsci 15 09456 g003
Figure 4. Equivalent power-angle curve of Converter 2 under fault conditions: (a) Fault in transmission line 1; (b) Fault in transmission line 2.
Applsci 15 09456 g004
Figure 5. Schematic diagram of the influence mechanism of limiting current on δPLL during Line 2 fault.
Applsci 15 09456 g005
Figure 6. Schematic diagram of the influence mechanism of limiting current on δPLL during Line 1 fault.
Applsci 15 09456 g006
Figure 7. Power-angle characteristic curve when the proposed conditions are met.
Applsci 15 09456 g007
Figure 8. Schematic diagram of the principle for selecting φ1.
Applsci 15 09456 g008
Figure 9. Equivalent power-angle characteristic during the recovery phase of Line 2 fault.
Applsci 15 09456 g009
Figure 10. Influence of phase angle and magnitude of I1max: (a) Influence on δPLL; (b) Influence on δ.
Applsci 15 09456 g010
Figure 11. Influence of I2max on δPLL: (a) Magnitude of I2max; (b) Phase angle of I2max.
Applsci 15 09456 g011
Figure 12. Influence of fault location K1: (a) influence on δPLL and Usq; (b) influence on δ and Peg1.
Applsci 15 09456 g012
Figure 13. Influence of fault location K2 on δPLL and δ.
Applsci 15 09456 g013
Figure 14. CCT under different φ1 values.
Applsci 15 09456 g014
Table 1. System main circuit parameters.
EquipmentParameterValue
Converter 1Rated Capacity/MVA1000
Rated DC Voltage/kV400
AC-side Voltage/kV230
Converter 2Rated Capacity/MVA500
Rated DC Voltage/kV400
AC-side Voltage/kV230
SGRated Capacity/MVA500
Rated Voltage/kV10
Line 1Line Impedance/p.u.0.046
Impedance Angle/°84.2904
Line 2Line Impedance/p.u.0.185
Impedance Angle/°84.2904
Table 2. Validation of the effectiveness of the delayed exit duration setting method.
Delay Time/sCCT/msDominant Unstable Equipment
0.00030Converter 2
0.005102Converter 2
0.010124SG
0.015124SG
Disclaimer/Publisher’s Note: The statements, opinions and data contained in all publications are solely those of the individual author(s) and contributor(s) and not of MDPI and/or the editor(s). MDPI and/or the editor(s) disclaim responsibility for any injury to people or property resulting from any ideas, methods, instructions or products referred to in the content.