Article

Artificial Intelligence and Aviation: A Deep Learning Strategy for Improved Data Classification and Management

by
Flávio L. Lázaro
1,2,
Luís F. F. M. Santos
3,4,
Duarte Valério
1 and
Rui Melicio
1,4,5,*
1
Institute of Mechanical Engineering (IDMEC), Instituto Superior Técnico, Universidade de Lisboa, Av. Rovisco Pais 1, 1049-001 Lisboa, Portugal
2
Faculdade de Engenharia, Universidade Agostinho Neto, Av. 21 de Janeiro, Luanda 1756, Angola
3
ISEC Lisboa, Alameda das Linhas de Torres, 179, 1750-142 Lisboa, Portugal
4
Aeronautics and Astronautics Research Center (AEROG), Universidade da Beira Interior, Calçada Fonte do Lameiro, 6200-358 Covilhã, Portugal
5
Synopsis Planet, Advance Engineering Unipessoal LDA, Faculdade de Ciências, Universidade de Lisboa, Campo Grande 16, 1749-016 Lisboa, Portugal
*
Author to whom correspondence should be addressed.
Appl. Sci. 2025, 15(17), 9403; https://doi.org/10.3390/app15179403
Submission received: 24 July 2025 / Revised: 23 August 2025 / Accepted: 24 August 2025 / Published: 27 August 2025

Abstract

Deep learning (DL) and machine learning (ML) models have been successfully applied across multiple domains, but generic architectures often underperform without domain-specific adaptation. This study presents A-BERT, a BERT-based model fine-tuned on a dataset of aviation and aircraft-related academic publications, enabling accurate classification into 14 thematic categories. The temporal evolution of publication counts in each category was then modeled using ARIMA to forecast future research trends in the aviation sector. As a proof of concept, A-BERT outperformed the baseline BERT in several key metrics, offering a reliable approach for large-scale, domain-specific literature classification. Forecast validation through walk-forward testing across multiple time windows yielded Root Mean Square Error (RMSE) values below 2% for all categories, confirming high predictive reliability within this controlled setting. While the framework demonstrates the potential of combining domain-specific text classification with validated time series forecasting, its extension to operational aviation datasets will require further adaptation and external validation.

1. Introduction

The use of deep learning (DL) in the aviation sector has the potential to transform how data is managed across the industry. DL offers advances that enhance the safety, reliability, and efficiency of air operations, maintenance, design, and other aviation subfields. Enabling the automation of complex tasks and faster decision-making provides a powerful tool for modern aviation.
The aviation ecosystem generates vast amounts of information every day, including sensor outputs from aircraft, maintenance records, weather data, and passenger interactions. Historically, the analysis of this data relied on traditional statistical methods and predictive models. These approaches were often insufficient to capture the full complexity and detail of the information produced [1]. In contrast, DL can identify intricate patterns and extract meaningful insights from large datasets, overcoming many of these limitations. Advanced DL models can uncover relationships that conventional methods miss, offering valuable contributions to accident prevention. These insights support the creation of more effective safety policies, playing a key role in strengthening aviation safety standards and protecting both lives and resources [2].
Handling the complexity of aviation data presents significant challenges for organizations such as government authorities, airlines, airframe manufacturers, and aviation service providers, including operators, maintenance, and training organizations. As noted in [3], data models are typically designed to represent and manage the information produced, used, and stored by these entities. However, the challenge is compounded by the fact that various data providers use distinct data models, leading to difficulties in data exchange across different organizational lines.
This way, DL and machine learning (ML), as key drivers of artificial intelligence (AI), provide robust solutions to manage and classify the large volumes of data generated within the aviation ecosystem. In addition to reducing errors in data handling and improving safety, DL and ML help automate repetitive or labor-intensive tasks, increasing efficiency across the sector [4].
Among DL advances, Bidirectional Encoder Representations from Transformers (BERT), developed by researchers at Google [5], is a widely used pre-trained language representation model for general-purpose natural language understanding. BERT has achieved strong performance across multiple evaluation metrics, including precision, accuracy, and F1 score. While the model is versatile, domain-specific applications often require additional fine-tuning. In this study, the integration of BERT-based classification with Autoregressive Integrated Moving Average (ARIMA) forecasting is particularly relevant, as it bridges textual data analysis with temporal trend prediction. The ARIMA model, a widely used statistical technique, analyzes time series data to extract insights and predict future trends [6]. When combined with BERT-labeled data, ARIMA not only improves forecast accuracy but also provides a more comprehensive foundation for evidence-based decision-making in aviation. Indeed, planning is a cornerstone of the aviation ecosystem. Effective planning is critical for allocating resources and ensuring operational readiness. Much of aviation planning and safety analysis relies on time series data [6,7]. Time series models provide interpretability by uncovering underlying trends and patterns from historical data. Adding DL or ML classification before time series analysis further improves robustness against outliers and noise, which is essential for reliable forecasting in aviation operations.
Prior studies in aviation-related natural language processing (NLP) have mainly focused on binary or small-scale multi-class problems, often restricted to a limited number of categories [8,9,10]. To the best of our knowledge, no studies have attempted large-scale classification across a broad and semantically overlapping taxonomy of 14 aviation themes. This research gap underscores the need for domain-adapted models capable of distinguishing between conceptually similar topics in aviation literature. Transformer-based models like SciBERT [11] and RoBERTa [12] have shown strong performance in other domain-specific classification tasks, but their application to aviation remains limited. In contrast, this study adapts BERT directly to a broad aviation taxonomy, enabling classification across 14 semantically overlapping categories. For this purpose, a novel adaptation of the BERT model [5] to aviation data is introduced, resulting in the Aviation BERT (A-BERT), designed explicitly for the comprehension and management of aviation-related information. This is achieved by employing many labels for classification and assessing their efficacy within the entire aviation ecosystem context. Subsequently, because forecasting is crucial to ensure the readiness and safety of the aviation ecosystem, this study also applies the ARIMA model to forecast future trends across various classes for the upcoming years up to 2029. This methodology offers potential benefits for aviation stakeholders by enhancing data classification accuracy and facilitating proactive decision-making based on trend forecasts.

1.1. Main Contributions

The main contributions of this study include (i) the adaptation of the BERT to the aviation domain, resulting in A-BERT, a model capable of classifying scientific articles with high precision in 14 specific categories; (ii) the integration of A-BERT outputs with ARIMA forecasting, allowing prediction of publication trends until 2029; (iii) the application of Walk-Forward Validation for temporal forecast validation, demonstrating robustness with Root Mean Square Error (RMSE) in all classes; and (iv) the demonstration that this hybrid framework can support not only document categorization but also research monitoring and strategic planning in the aviation sector. It is important to emphasize that this work is conceived as a proof of concept, aiming to validate the combined methodology of domain-specific NLP classification with statistical time series forecasting in a controlled academic literature setting. The primary goal is to assess feasibility and methodological soundness before extending the approach to operational aviation datasets, which may present additional challenges such as heterogeneous formats, incomplete records, and domain-specific terminology.

1.2. Paper Structure

This paper is structured as follows: Section 2 provides a comprehensive review of relevant literature, Section 3 delineates the methodology employed, Section 4 presents and discusses the results and the limitations of this study, and Section 5 offers concluding remarks and suggestions for future research endeavors.

2. Literature Review

DL is a subset of ML that uses artificial neural networks with multiple layers of neurons for feature extraction and transformation [13]. Neural networks mimic the structure and function of the human brain by processing data through interconnected nodes or neurons, which are nonlinear processing units [14,15]. Each successive layer of neurons uses the output of the previous layer to create a hierarchical representation, enabling the model to learn hierarchies of information and complex patterns in data and extract increasingly complex features from the raw input data [16].
In [17], the authors state that deep learning (DL) represents a robust set of techniques that have transformed how computers learn and make predictions about data. Its influence is evident across multiple fields, continually expanding the possibilities of artificial intelligence [18,19]. The rapid development of DL methods [17] and transformer-based models [20] has resulted in significant improvements in the accuracy and efficiency of various computational tasks. Its success mainly stems from its ability to handle large datasets and perform sophisticated feature extraction without manual intervention [16,18,19]. DL powers AI systems [13], and, in recent years, it has played a key role in advancing natural language processing (NLP), facilitating the automatic extraction of meaningful features from raw text and boosting the performance of tasks like text classification and summarization [21,22]. Its versatility allows it to be applied across many domains beyond NLP, such as image and voice recognition [13,16], metagenomics [18], and quantitative finance [19], where it supports pattern recognition and predictive modeling.
Google researchers developed the original BERT model in 2018 [5], and their most advanced model achieved an accuracy of 87.07% and an F1 score of 93.2%. The BERT model has significantly influenced multiple fields, enhancing the understanding of NLP contextual relationships. In radiology [23], the use of BERT has been crucial in sorting and extracting information from medical reports, with applications spanning computed tomography scans and X-ray interpretation, indicating its potential to improve diagnostic accuracy and patient care. Similarly, in the construction industry [24], BERT applied in clause classification has revealed superior performance compared to traditional machine learning methods, aiding in risk management and specification review processes. Additionally, the BERT architecture was employed for sentiment analysis, showing a quantitative link between company news and stock price movements, reflecting its ability to grasp nuances of human psychology [25]. The model’s efficiency is also clear in processing morphologically rich languages, outperforming baseline machine learning algorithms without extensive preprocessing [26]. Moreover, BERT’s use in automatically classifying online advertising texts highlights its versatility across different sectors [27].

2.1. Some Applications of DL and ML in Aviation

(a) 
Safety and Incident Analysis
Deep learning has also achieved significant breakthroughs in the aviation industry, providing innovative solutions and enhancements across various applications—from incident [28] and accident analysis [29] to optimizing aerodynamic systems [30]. In [31], the authors emphasize the advantages of deep-learning-based time series models in analyzing and predicting aviation accidents, highlighting their predictive accuracy and potential to enhance safety measures. Similarly, ref. [32] discusses how deep learning enhances satellite navigation monitoring in civil aviation, particularly by predicting possible degradations through trend detection. Additionally, refs. [2,3,33] have developed machine learning models that analyze security data from public networks and classify human factor risks, thereby improving the processing and accuracy of the results. Furthermore, the incorporation of deep learning for aviation safety has been extensive. In [34], models utilizing data from reports by the National Transportation Safety Board (NTSB) have been created to forecast aircraft accidents and damages, demonstrating the role of deep learning in proactive safety management. Another vital application involves detecting foreign objects on runways, where deep learning systems have proven highly accurate, as discussed by [35], helping to prevent potential accidents.
(b) 
Flight Operations and Training
In the field of training and flight operations [36], a machine learning pipeline has been created to classify flight difficulty using pilots’ physiological data, aiming to automate instruction in legacy Air Force systems and represent a step toward more advanced training environments. The potential to enhance passenger experience through autonomous and self-service systems has been examined by [37], which states that these technologies can increase efficiency and focus on user experience. In [38], an automated system for perceiving aircraft taxiing behavior was created by combining laser sensors with machine learning models. Tested in a real environment, the system was able to identify aircraft types with 80% accuracy based on the width of the landing gear, as well as analyze speed fluctuations and lateral deviations during taxiing. The findings offer valuable insights for improving runway design and airport operational management.
(c) 
Maintenance and Monitoring
Automated data tagging in aviation is a vital area where ML and DL algorithms have shown great promise [39]. The aviation industry produces large amounts of data, requiring efficient and accurate labeling for various uses, including aircraft diagnostics/prognosis, predictive maintenance, and flight data monitoring [40]. The use of ML and DL in aviation aims not only to improve operational efficiency but also to detect unsafe behaviors and violations of operational standards through analyzing flight data [41] and incident/accident reports [2,26,42]. Recent progress in multi-objective optimization for flight scheduling, such as the model proposed by [43], shows significant potential for lowering fleet operating costs while keeping planning practical. This approach combines time constraints with fuzzy logic and employs the NSGA-II algorithm to solve large-scale problems efficiently, which is especially beneficial for small and medium-sized airlines. The results highlight the importance of flexible, scalable, and metaheuristic-based frameworks in transportation systems.
Interestingly, although the use of these technologies in aviation is increasing, the literature shows that automated labeling is a broader classification issue that goes beyond aviation [44]. It is a supervised machine learning task that often faces a shortage of fully labeled data, which is a significant challenge in industrial settings due to high manual labeling costs [45]. This highlights the need to develop robust automated labeling methods that can cut labor and costs while ensuring high accuracy.

2.2. Forecasting and Predictive Modeling

ML and DL models, including hybrid approaches, are increasingly used for aviation data forecasting and analysis. Time series models like ARIMA provide interpretable trend analysis and forecasting capabilities for various applications [6,7]. ARIMA models have been widely used to predict inflation based on the Consumer Price Index, enabling statistical comparisons that favor certain specifications over others [46]. In the context of equipment monitoring, they have proven effective in predicting the temperature of electrical equipment [47] and mechanical vibrations [48], offering a reliable method to anticipate needs and implement predictive maintenance. In the aviation sector, they have been applied to air traffic volume and accident forecasting, with subset ARIMA models showing higher accuracy in short-term predictions [6,7]. Their application also extends to climate change studies, analyzing and forecasting environmental time series, often in combination with seasonal ARIMA models and exogenous variables [49]. Additional studies have assessed the robustness of ARIMA under different noise levels in time series, identifying the threshold where predictive capacity diminishes and emphasizing the importance of data preprocessing to ensure reliable predictions [50]. Furthermore, the integration of ARIMA with advanced algorithms, such as long-term memory neural networks, has improved accuracy in predicting satellite telemetry data [51].
In aviation, combining ARIMA models with deep learning (DL) approaches has become more critical because both methods complement each other in handling complex patterns. While DL excels at finding nonlinear relationships in factors like weather, traffic, and predictive maintenance [52], ARIMA remains strong in modeling and forecasting trends and seasonality [53]. This teamwork has been explored in research that merges ARIMA with neural networks to improve air traffic data prediction, producing better results than ARIMA alone [52]. Similar methods include hybridizing ARIMA with probabilistic neural networks, which boost predictive accuracy in areas like financial markets and may also apply to the complexities of aviation data [54]. Additionally, adaptive ARIMA models have been used on telecommunications data (which, like aviation data, involves growth and uncertainty), showing improved performance over methods relying only on neural networks [55]. This highlights how vital adaptability is for operational planning and resource management in the industry.

3. Methodology

3.1. Data Collection and Labeling

The proposed A-BERT + ARIMA pipeline was created as a proof of concept, using an extensive collection of scholarly publications as a substitute for aviation-related textual data. This design provides a controlled and repeatable environment to evaluate the combined classification and forecasting approach, while recognizing that real-world operational datasets might include additional complexities such as varied formats, incomplete records, and specialized terminology.
The initial stage involves collecting aviation data. To evaluate how well the A-BERT model learns from aviation-related terminology, academic articles published between 2000 and 2024 were collected from the Web of Science database that have “Aviation” or “Aircraft” as keywords. Table 1 shows the distribution of academic articles containing either of these keywords, categorized by publication year. For each article, the title, keywords, journal, and publication year were extracted, resulting in a total of 45,823 articles collected.
The next step was to define the thematic categories for the aviation dataset. Fourteen labels were chosen: Aerodynamics, Defense, Design, Emerging Technologies, Maintenance, Management, Manufacturing, Operations, Propulsion, Remotely Piloted Aircraft System (RPAS), Reliability, Safety, Structures, and Sustainability. Training began with a dataset of 1876 articles, each carefully labeled by hand. To balance the classes, an equal number of training examples was assigned to each category, except for Management, which received extra manual labeling due to its broader scope and higher variability. Figure 1 shows the composition of the training dataset, emphasizing that Management had the most labeled instances. Despite these measures, as shown later in the confusion matrix (Figure 2), this class remains the most difficult for the model, mainly due to overlapping themes with categories like Operations and Safety.

3.2. Data Preprocessing Pipeline and Validation

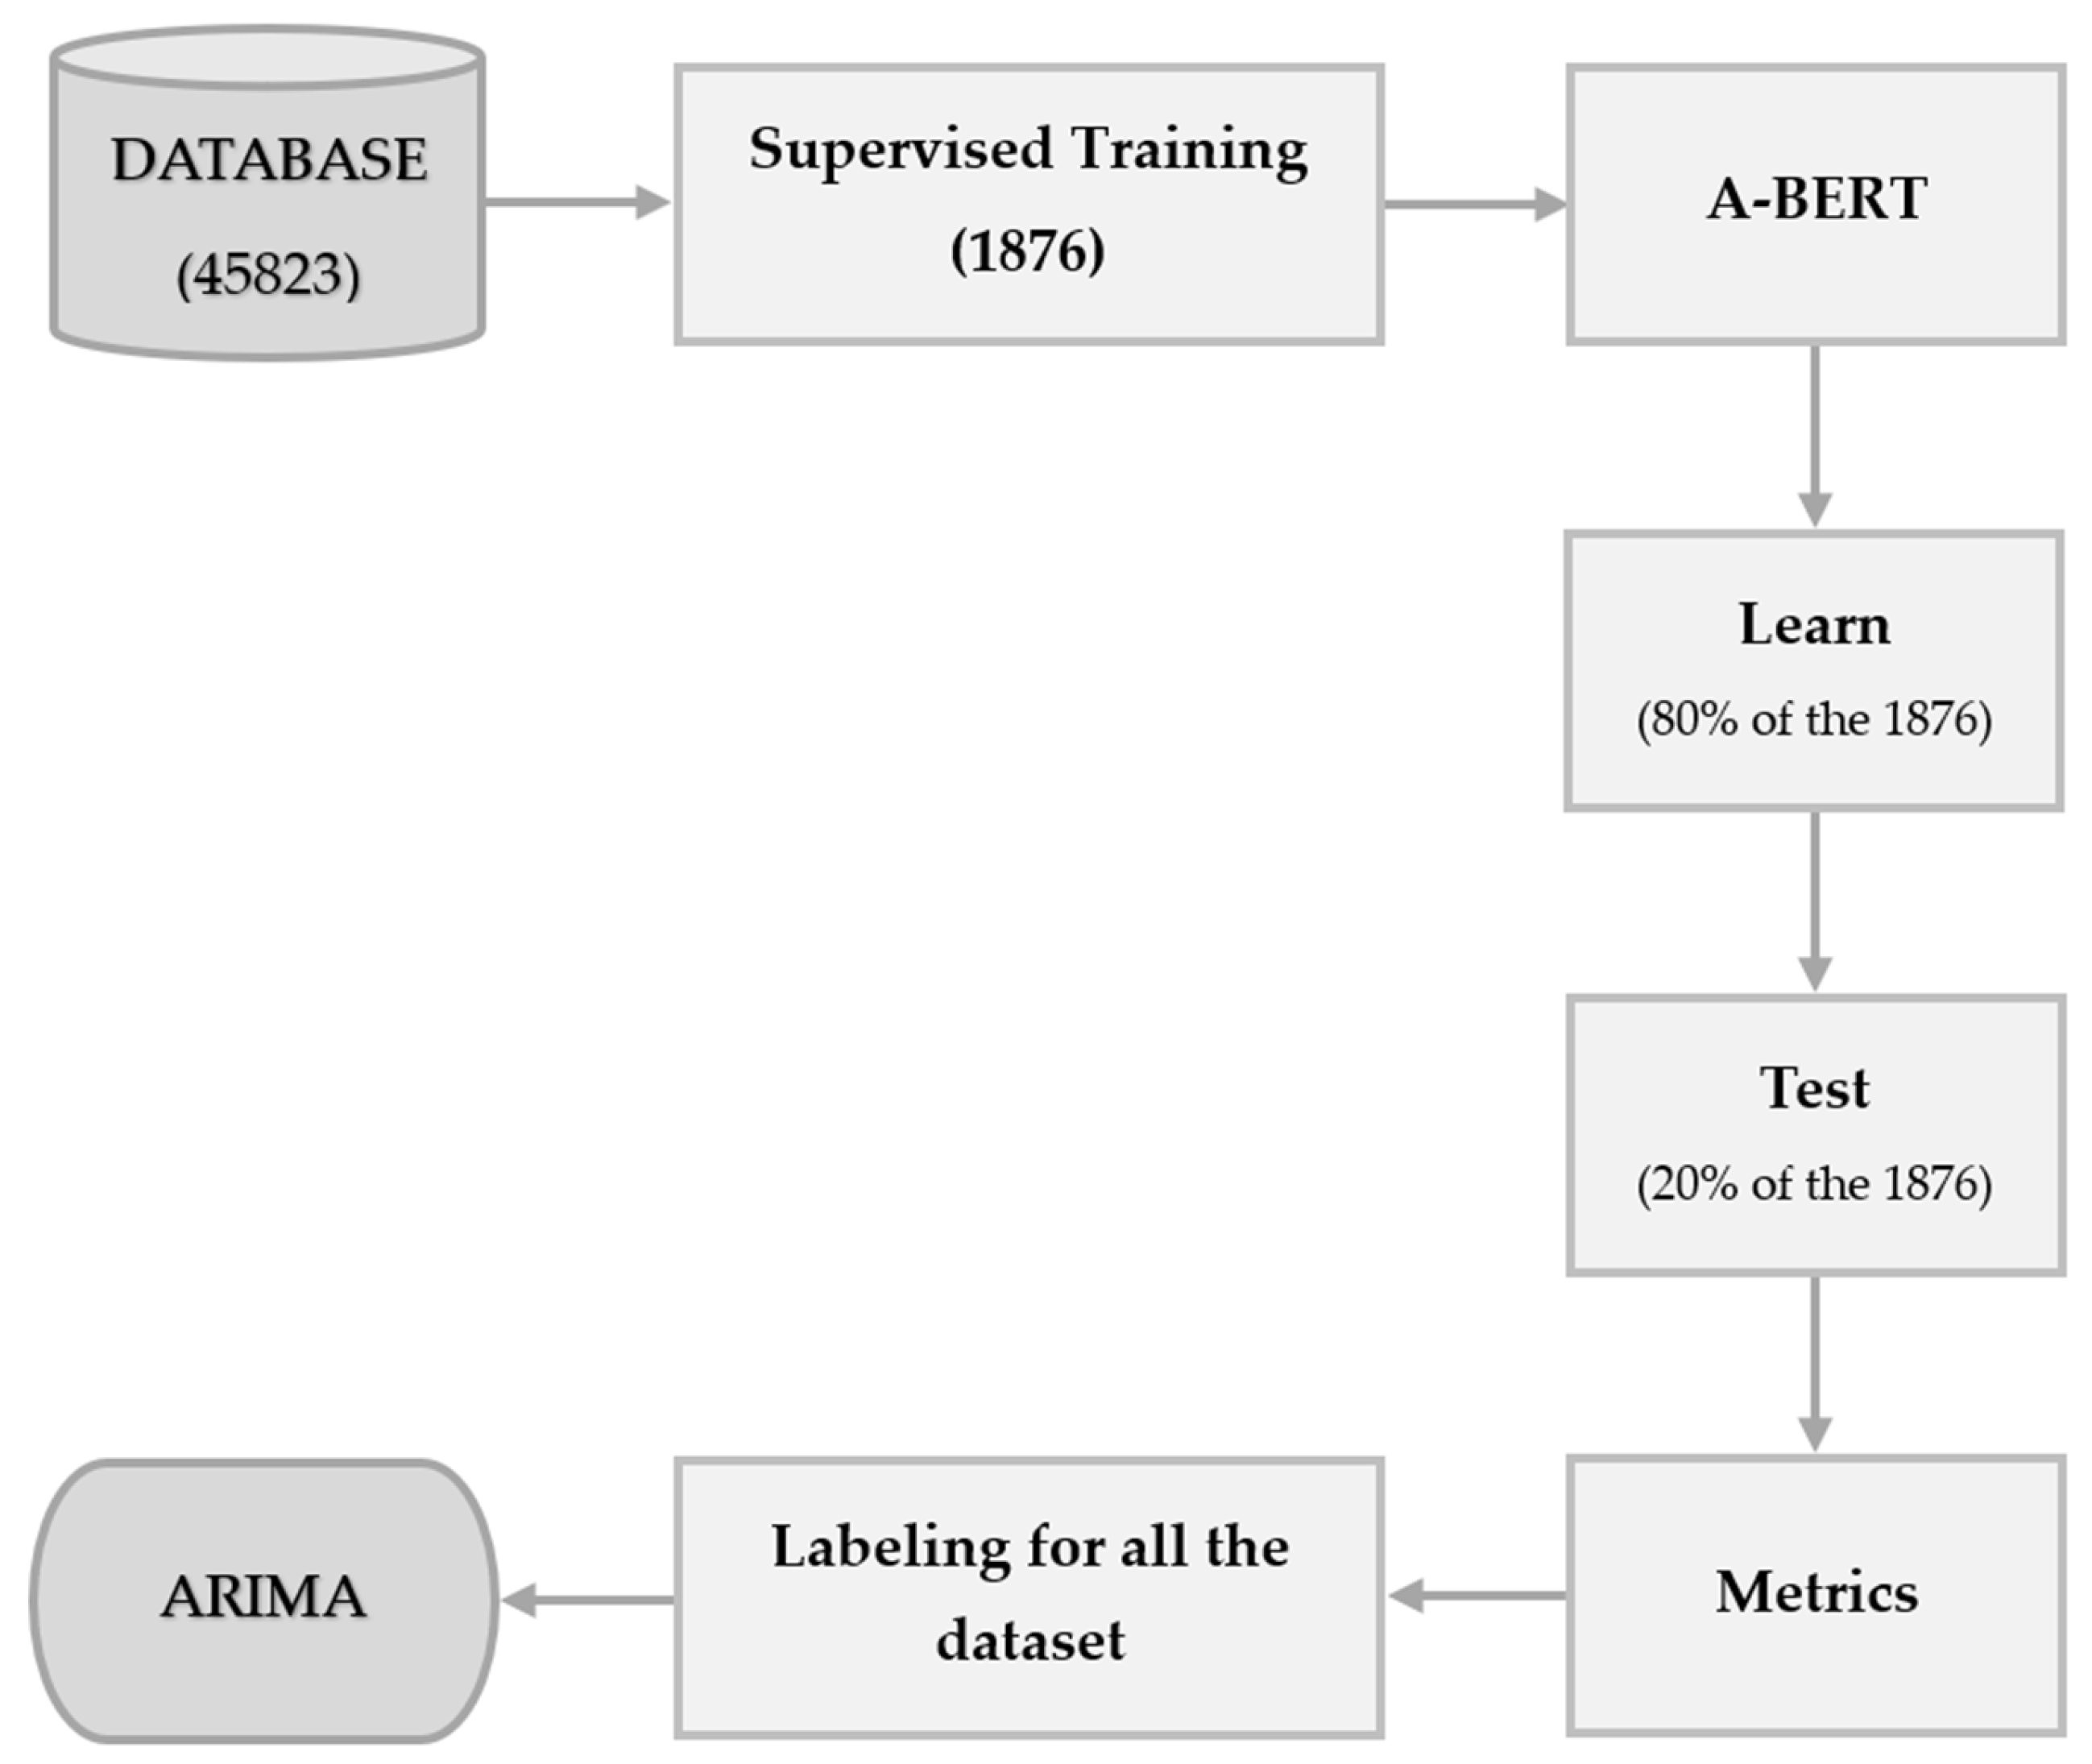
The data preprocessing and training workflow is shown in Figure 2. The steps were as follows:
(i)
Text tokenization using the Hugging Face bert-base-uncased tokenizer with padding=True, truncation=True, max_length=512, and return_tensors=“tf”.
(ii)
Vector representation obtained from the [CLS] token of the final hidden state of the BERT encoder.
(iii)
Data balancing performed with SMOTE (Synthetic Minority Oversampling Technique, random_state=42).
(iv)
Dataset splitting into 80% training and 20% testing sets (random_state=42).
(v)
Model training with two strategies:
a.
One-shot method using LogisticRegression (max_iter=1000) optimized via GridSearchCV (param_grid={“C”:[0.001, 0.01, 0.1, 1, 10, 100]}, cv=5).
b.
Epochs method using SGDClassifier (loss=“log_loss”, learning_rate=“constant”, eta0=0.01, max_iter=1, tol=None, random_state=42) trained for 500 epochs via incremental partial_fit.
(vi)
Evaluation with macro-averaged precision, recall, F1 score, and ROC–AUC. Learning curves were computed with cv=5 and scoring=“accuracy”.
A stratified 80/20 train–test split was used for both training strategies to maintain class distribution. Model hyperparameters were optimized through cross-validation within the training set. Performance was evaluated on the held-out test set, ensuring no data leakage. The tables with detailed hyperparameters for both methods (a and b) are shown in Appendix A.

3.3. Forecasting with ARIMA

Once the dataset (45,823 articles) has been labeled by A-BERT, a statistical analysis is conducted using the Autoregressive Integrated Moving Average (ARIMA) model to identify and project temporal patterns within each category. ARIMA is primarily known for its ability to capture trends in time series data, helping stakeholders anticipate emerging topics and resource needs, particularly in complex sequential data scenarios [56]. This time series model was chosen because the annual publication counts for each category showed mainly linear trends without strong seasonal patterns, making it a reliable and straightforward option. Its interpretable coefficients and well-established methodology provide clarity and dependability in forecasting. Also, the dataset covers 25 years of annual counts, which limits the advantages of more data-heavy deep learning models like Long Short-Term Memory (LSTM) and transformer-based architectures.
The ARIMA model is formulated by:
X t = ϕ 1 Y t 1 + ϕ 2 Y t 2 + + ϕ p Y t p + θ 1 e t 1 + θ 2 e t 2 + + θ q e t q + e t
where X t represents the input from the developed DL/ML models; Y t 1 ,   2 ,   p are the previous historical time series data; ϕ 1,2 , p are the autoregressive coefficients; e t 1,2 , q are the previous errors in the time series; and θ 1,2 q are the moving average coefficients [12]. The Walk-Forward Validation technique, based on sequential moving windows, was applied by training on 15-year periods and testing on the subsequent 5 years: (i) historical data from 2000 to 2014 and forecast for 2015–2019; (ii) 2001–2015 → 2016–2020; (iii) 2002–2016 → 2017–2021; (iv) 2003–2017 → 2018–2022; (v) 2004–2018 → 2019–2023; and (vi) 2005–2019 → 2020–2024. This approach allows assessing the predictive capacity of the model in each category. For each test window, the Root Mean Square Error (RMSE) was calculated as:
R M S E = 1 n t = 1 n y t y t ^ 2
where y t represents the observed value, y t ^ the predicted value, and n the number of observations [57]; the RMSE values were then expressed as percentages relative to the total number of articles for each class, providing a normalized measure of forecasting error and enabling intuitive comparison of forecast quality across classes with different magnitudes and frequencies.
With the information categorized, the model is then used to forecast each class from 2025 to 2029. Additionally, the Mann–Kendall trend test was applied to the ARIMA model to evaluate the presence of significant trends (increasing or decreasing) in the errors produced by the model’s predictions throughout the process [58]. In other words, the ARIMA uses the historical counts of articles per class as input. Based on the historical frequency of these classes, ARIMA can then forecast the number of articles in each class up to 2029. This forecasting capability is essential for anticipating emerging topics, developments, and research priorities within the aviation sector. By combining A-BERT’s deep learning capabilities for classification with ARIMA’s statistical time series forecasting, this method not only predicts scholarly output in specific aviation domains but also supports strategic decision-making and resource allocation based on projected data.

4. Results and Discussion

The complete dataset was run on an Intel Pentium i5 processor (4 cores at 2.11 GHz) with 32 GB of RAM. This configuration, although modest compared to typical deep learning environments, is reported as the actual computational resource available during this study. While more powerful hardware could potentially reduce training time, the methodology, dataset, and model parameters are fully specified, ensuring the reproducibility of results regardless of processing speed.
To further evaluate the performance of A-BERT and explore potential improvements, a Random Forest (RF) classifier was added as a baseline model, using the same pipeline and methodology applied to A-BERT to ensure a fair comparison [59]. The RF and A-BERT models took approximately 48 and 79 min, respectively, to finish the classification task. Performance metrics comparing both models across the 14 categories are summarized in Table 2.

4.1. Discussion of the Results

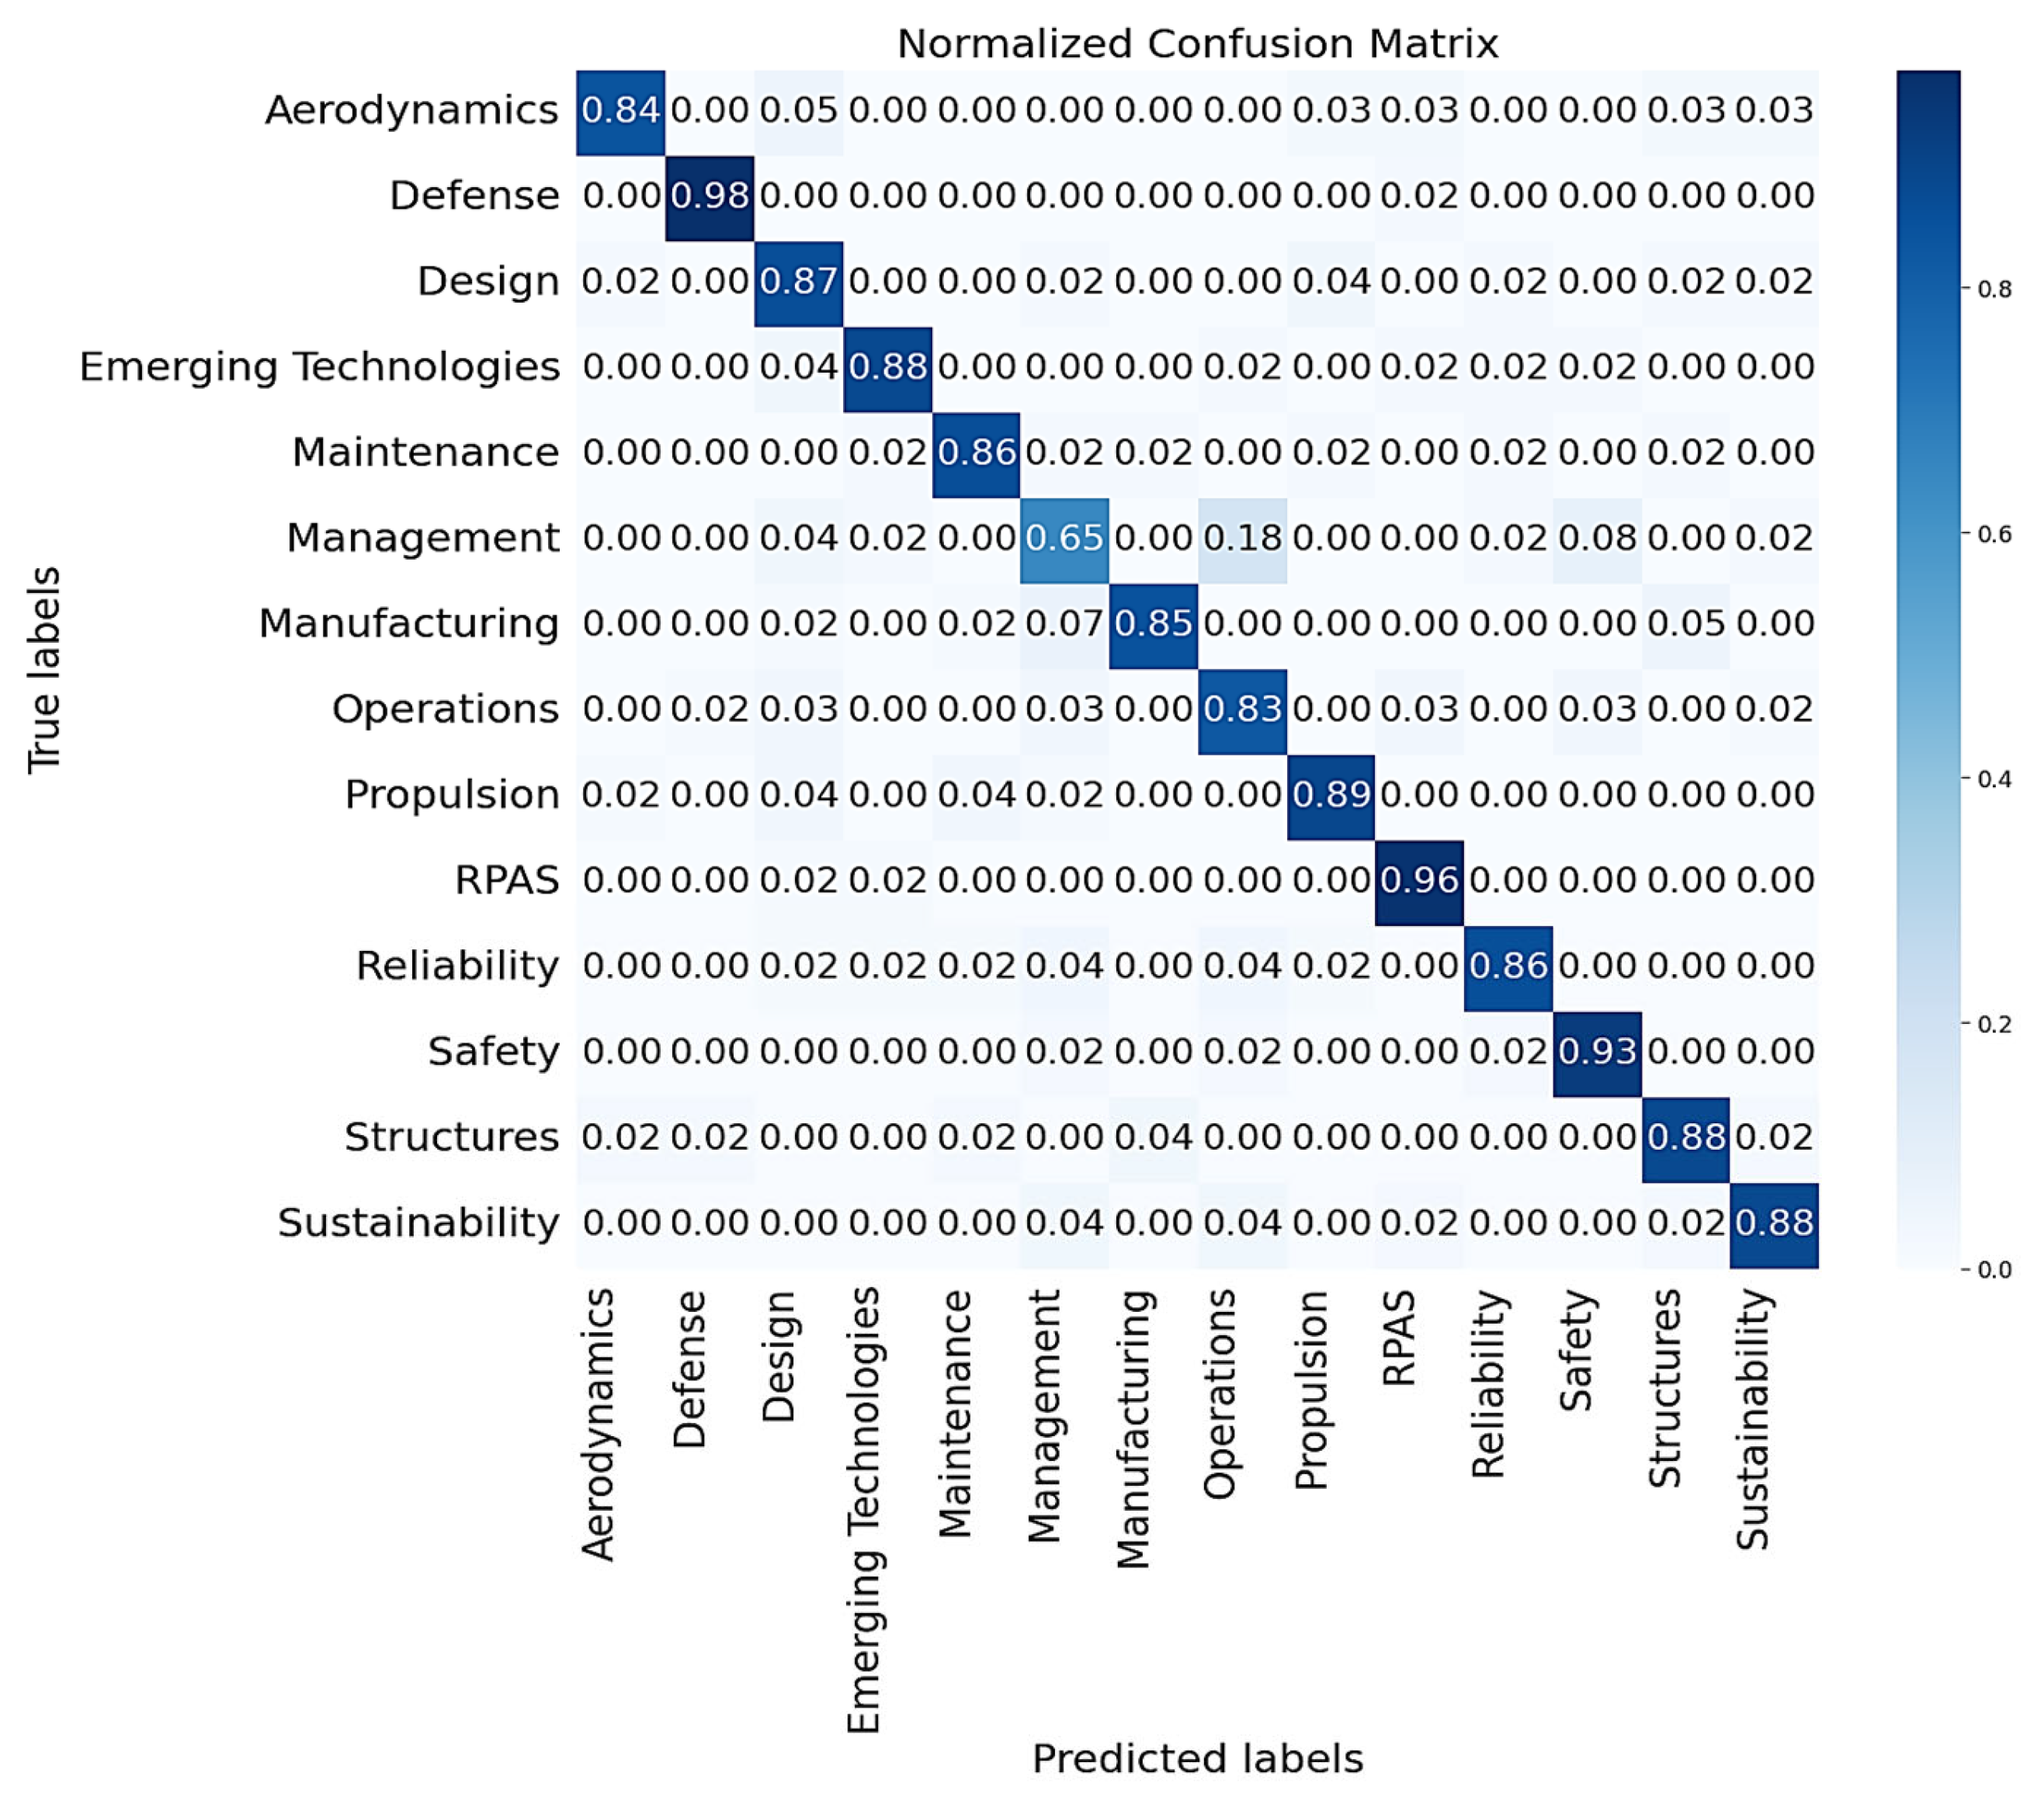
The A-BERT model maintains superior overall performance compared to the Random Forest (RF) baseline, with slightly higher precision (87.6%), accuracy (87.3%), and consistent F1 score and AUC across nearly all 14 categories. Although it requires longer training time due to its transformer-based architecture, A-BERT’s performance advantage—especially in complex or less separable classes—justifies the computational overhead when classification reliability is crucial. This aligns with recent findings showing that transformer-based models, while more computationally demanding than traditional approaches, provide significant gains in accuracy and predictability in classification tasks [60]. Figure 3 displays the Normalized Confusion Matrix for all labeled data. The A-BERT model demonstrates strong classification ability, with most classes correctly identified in over 80% of cases. The main exception is the Management class, which, despite additional manual labeling to address data imbalance (as shown in Figure 1), remains the most challenging category for the model. A closer look at the confusion matrix shows that most Management misclassifications occur with semantically related categories, such as Operations (18%) and Safety (8%), indicating that thematic overlap is the key factor affecting performance. This pattern is consistent across multiple evaluation metrics—including F1 score, AUC, precision, and accuracy—which collectively confirm the lower separability of this class.
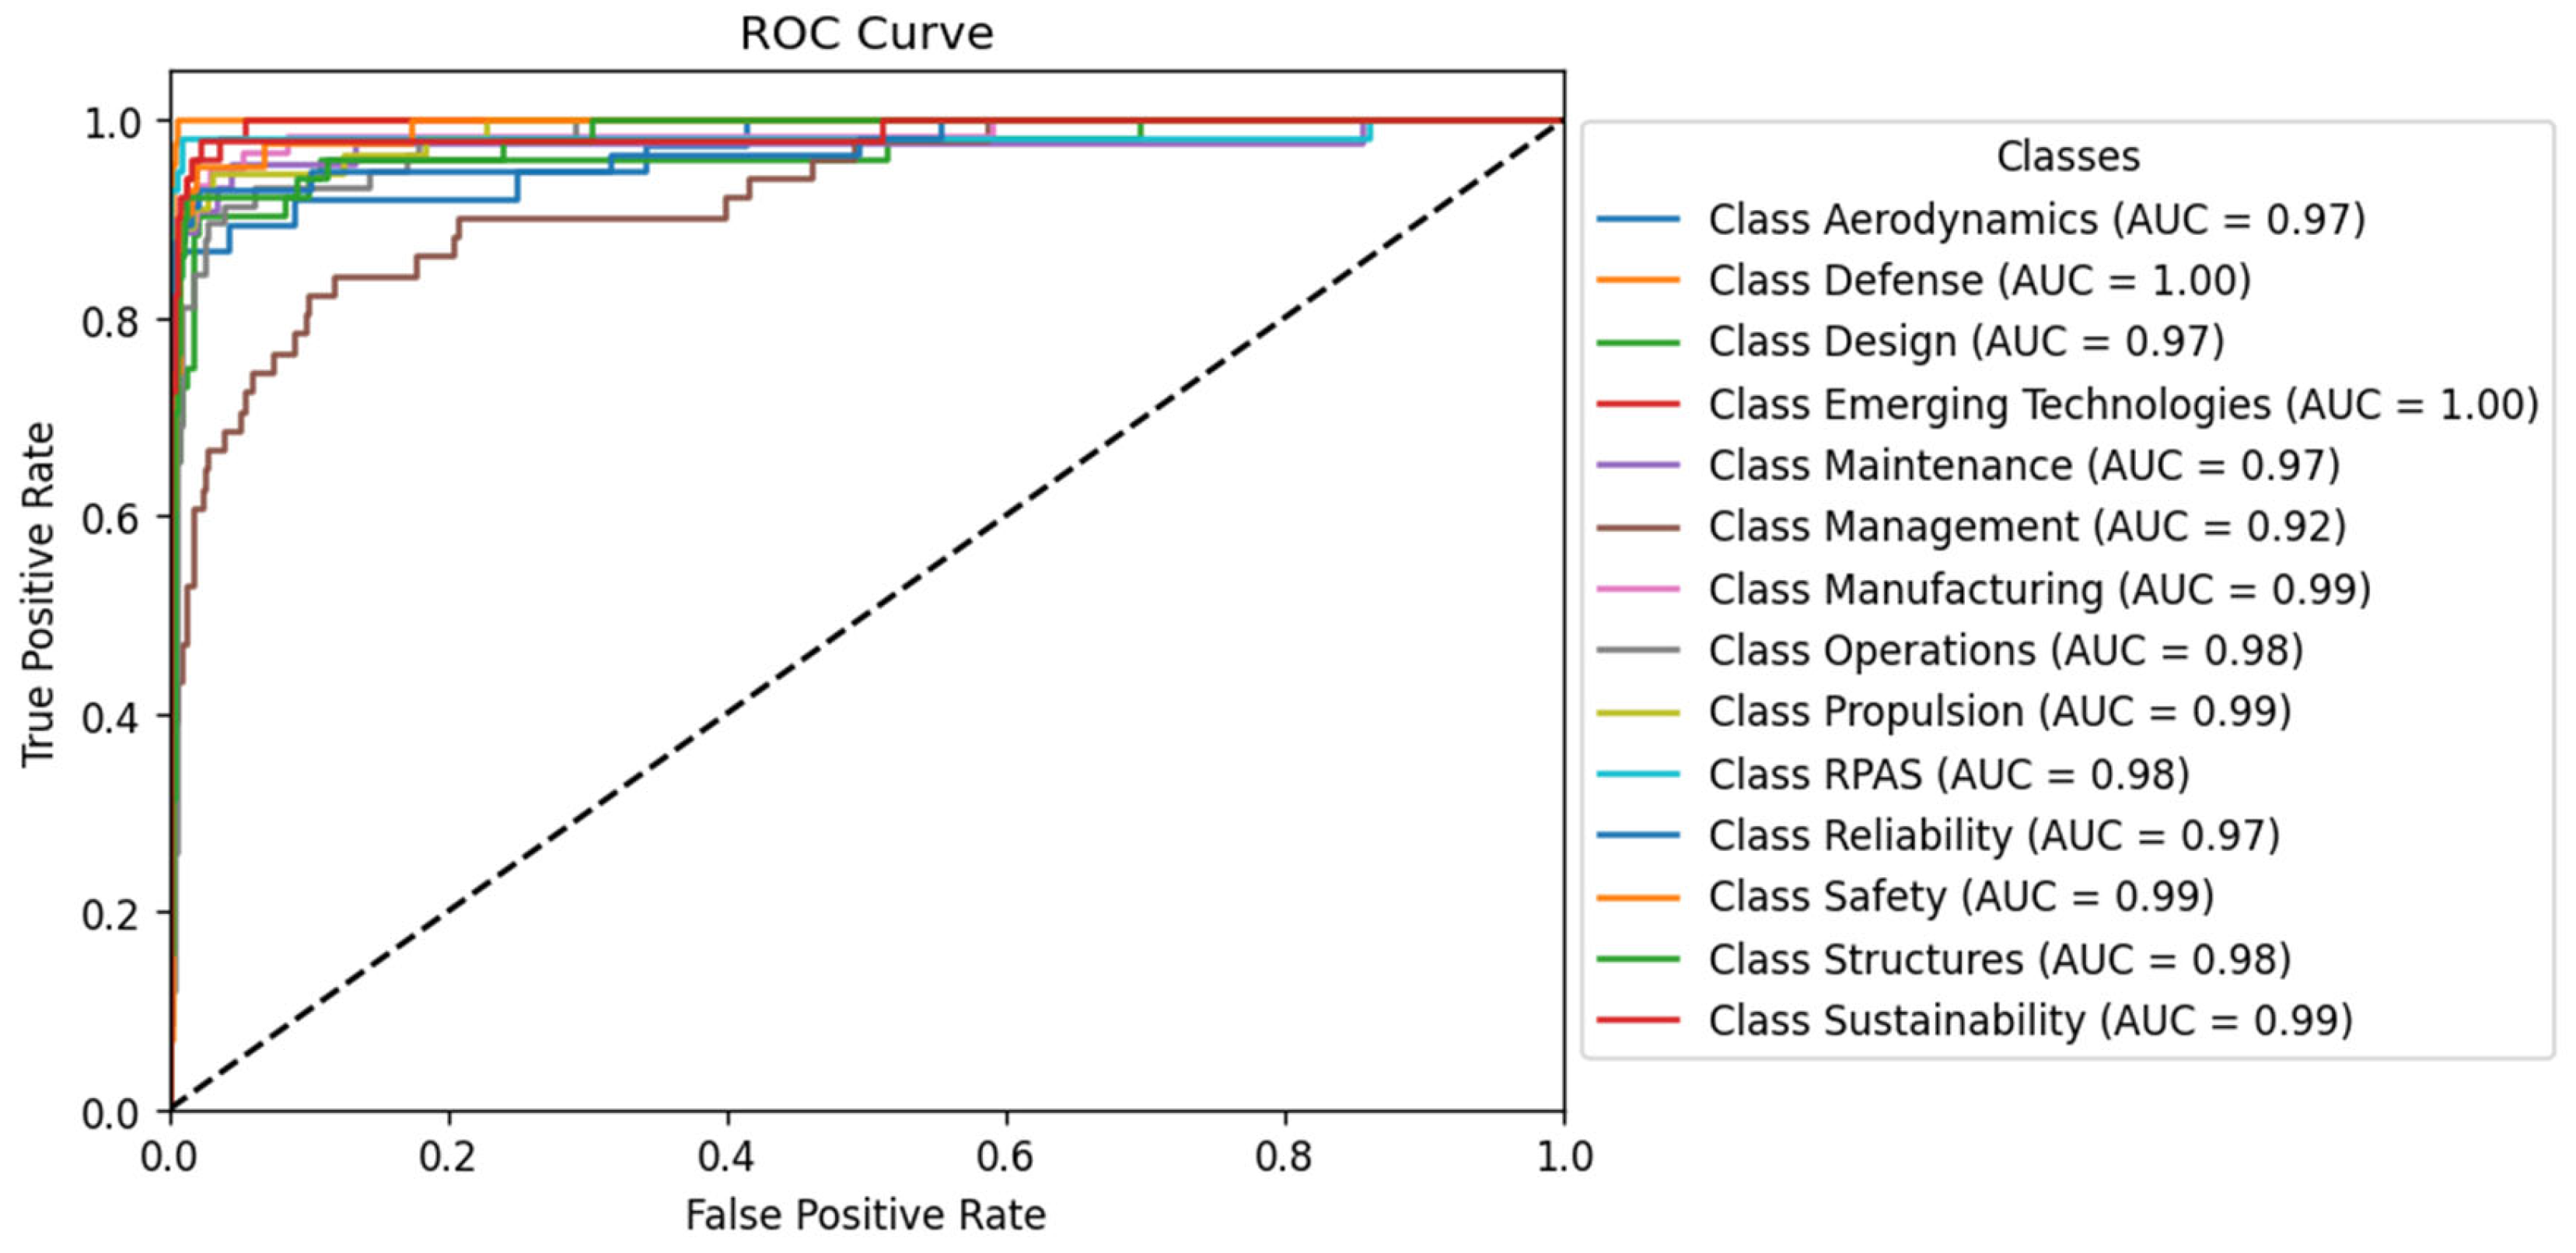
The Receiver Operating Characteristics (ROC) curve and the Area Under the Curve (AUC) are essential tools for evaluating a model’s effectiveness. As a probability curve, the ROC and the AUC offer insight into a model’s ability to distinguish between different classes. This means that a model’s success in correctly predicting class X as class X and class Y as class Y is directly related to the AUC value. For example, in the context of Aerodynamics, a higher AUC indicates a greater ability of the model to differentiate the “Aerodynamics” class from others.
It is also important to note that a high-performing model exhibits an AUC value close to 1, indicating a substantial measure of separability. When a model’s AUC measures 0.5, it signifies an inability to distinguish between different classes; the model is operating on a purely random basis. The ROC and AUC values for each studied class are shown in Figure 4, and it can be seen that the A-BERT model’s ROC and AUC metrics demonstrate excellent performance in classifying all classes except Management.
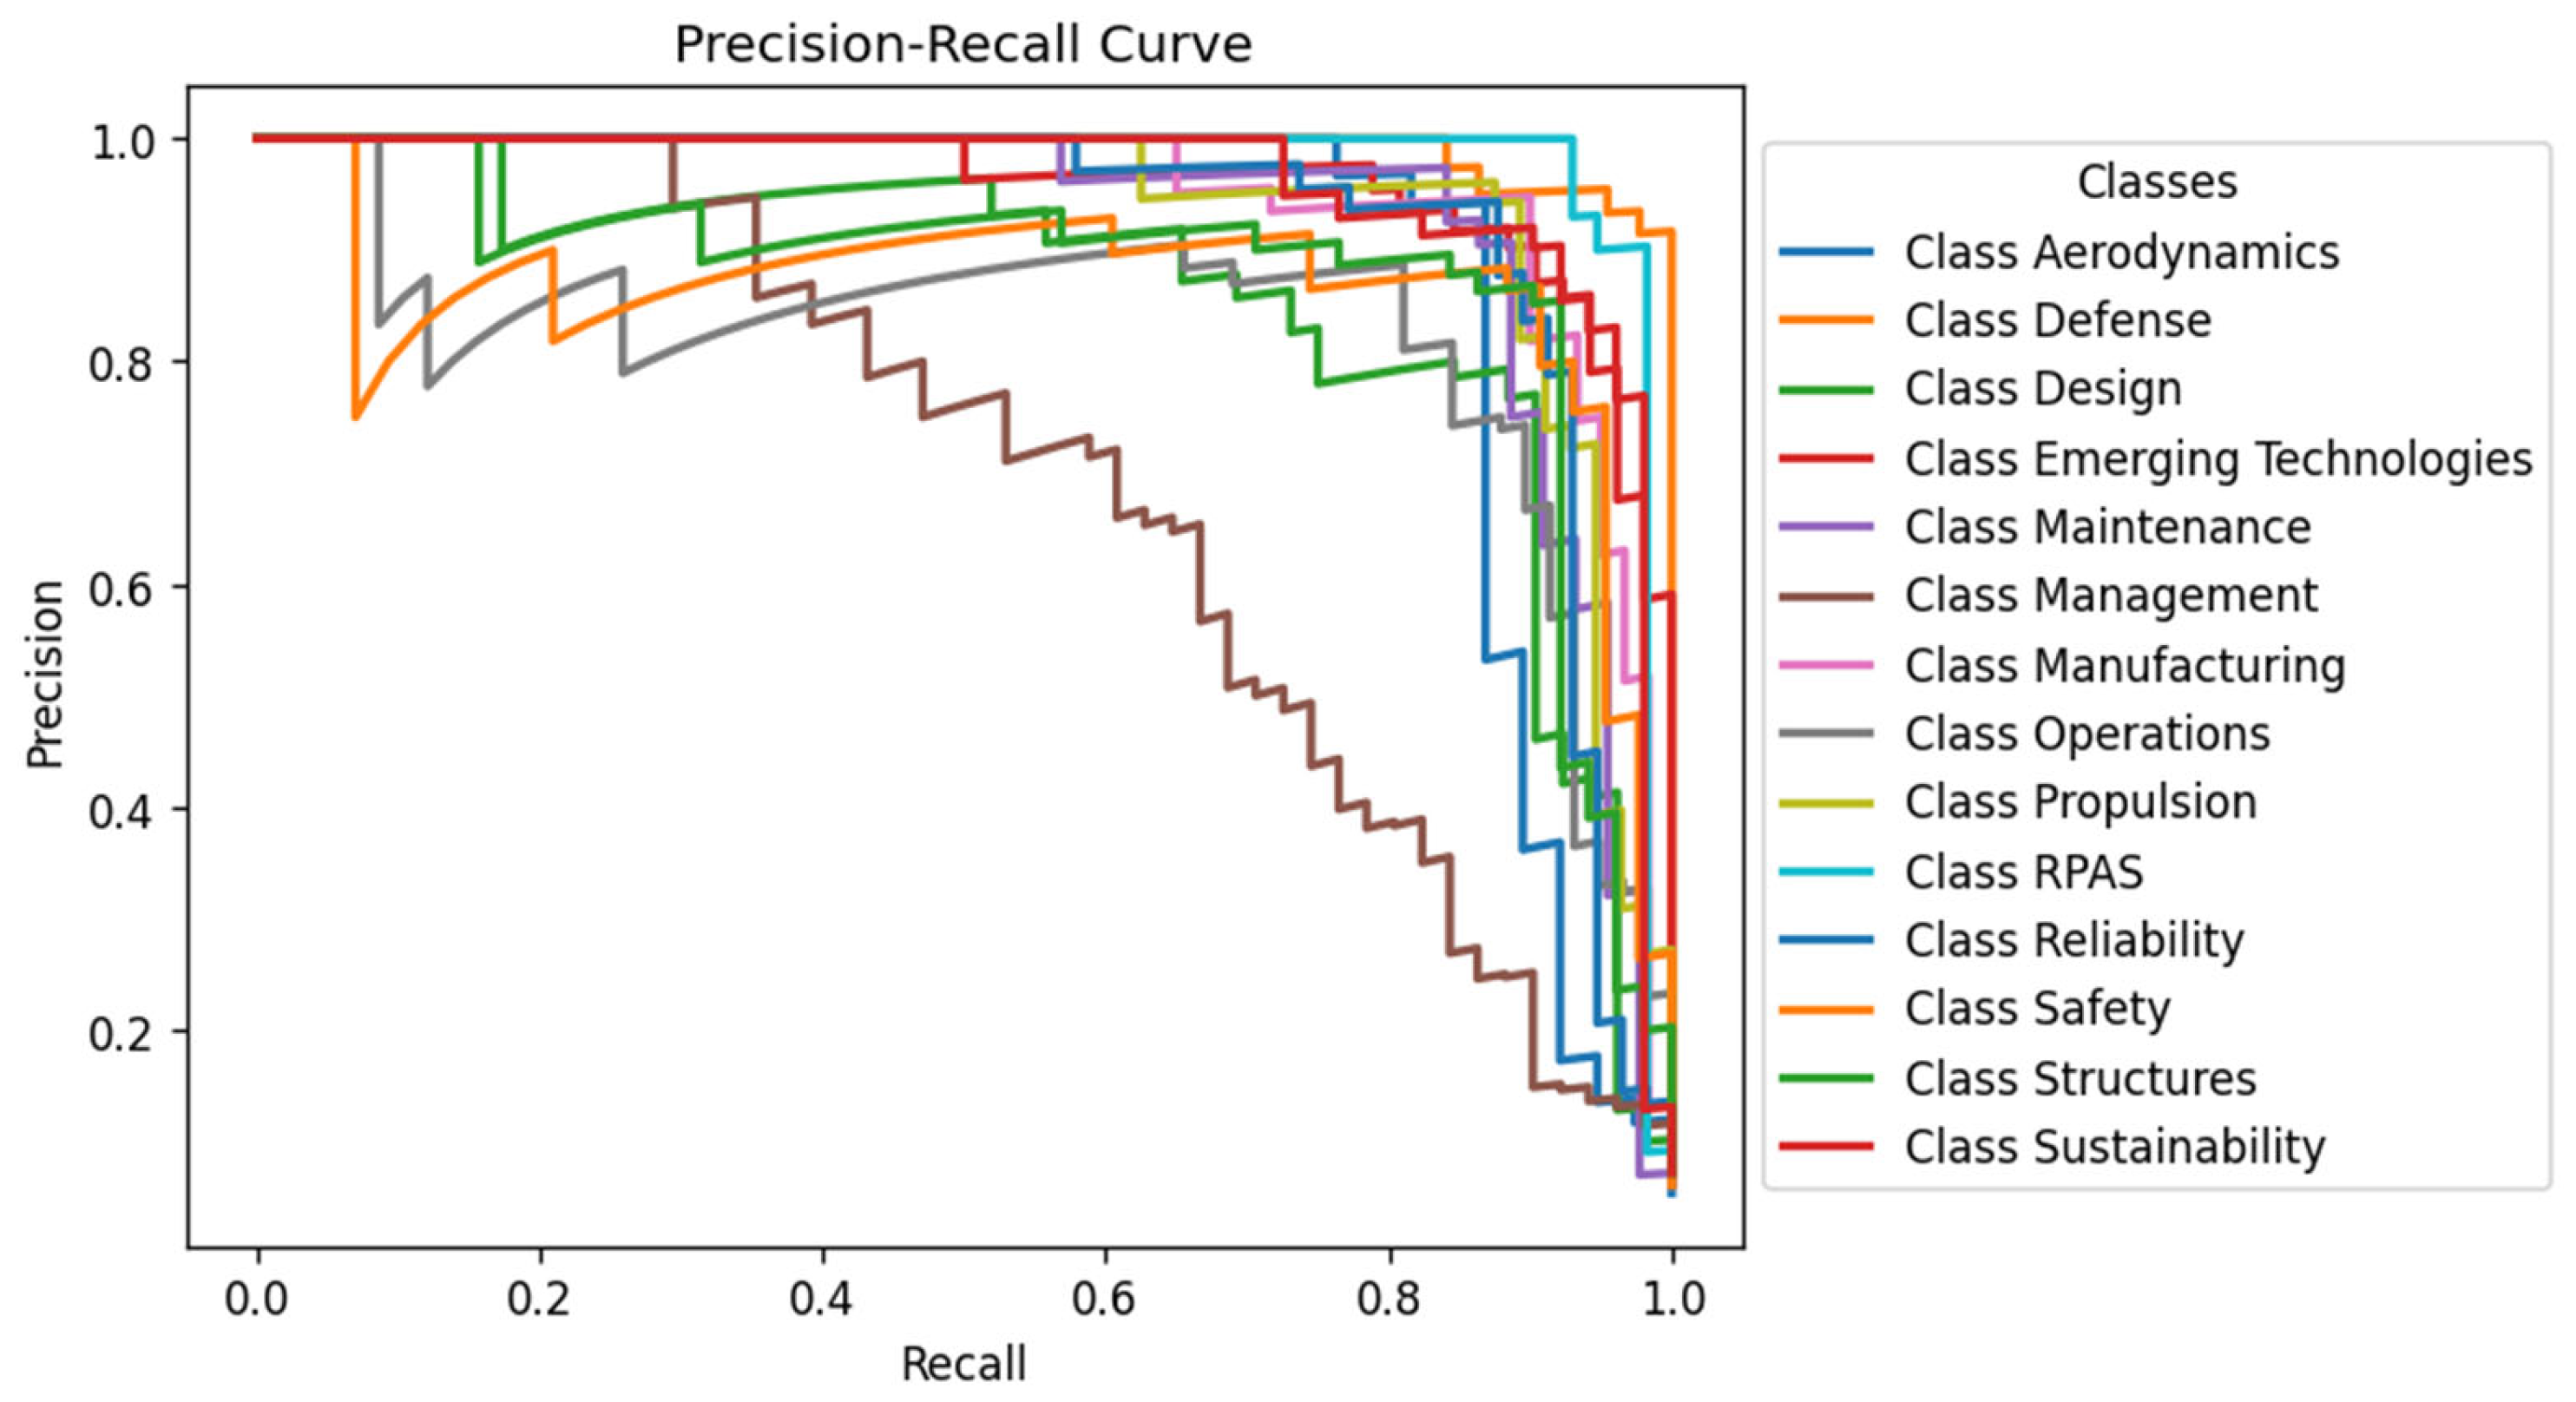
Another important performance analysis tool is the precision–recall curve. Precision indicates how confidently a model predicts the positive class as positive; recall measures the model’s ability to identify different instances of the positive class within the dataset. Therefore, the precision–recall curve summarizes the balance between the true positive rate and the positive predictive value, which is crucial when a predictive model is used at various probability thresholds. The precision–recall curve for the A-BERT model using the Aviation dataset is shown in Figure 5. It is evident that, even though A-BERT was trained with a “One-Shot” approach, it handles the 14 classes very well, with the “Management” class having the weakest performance.
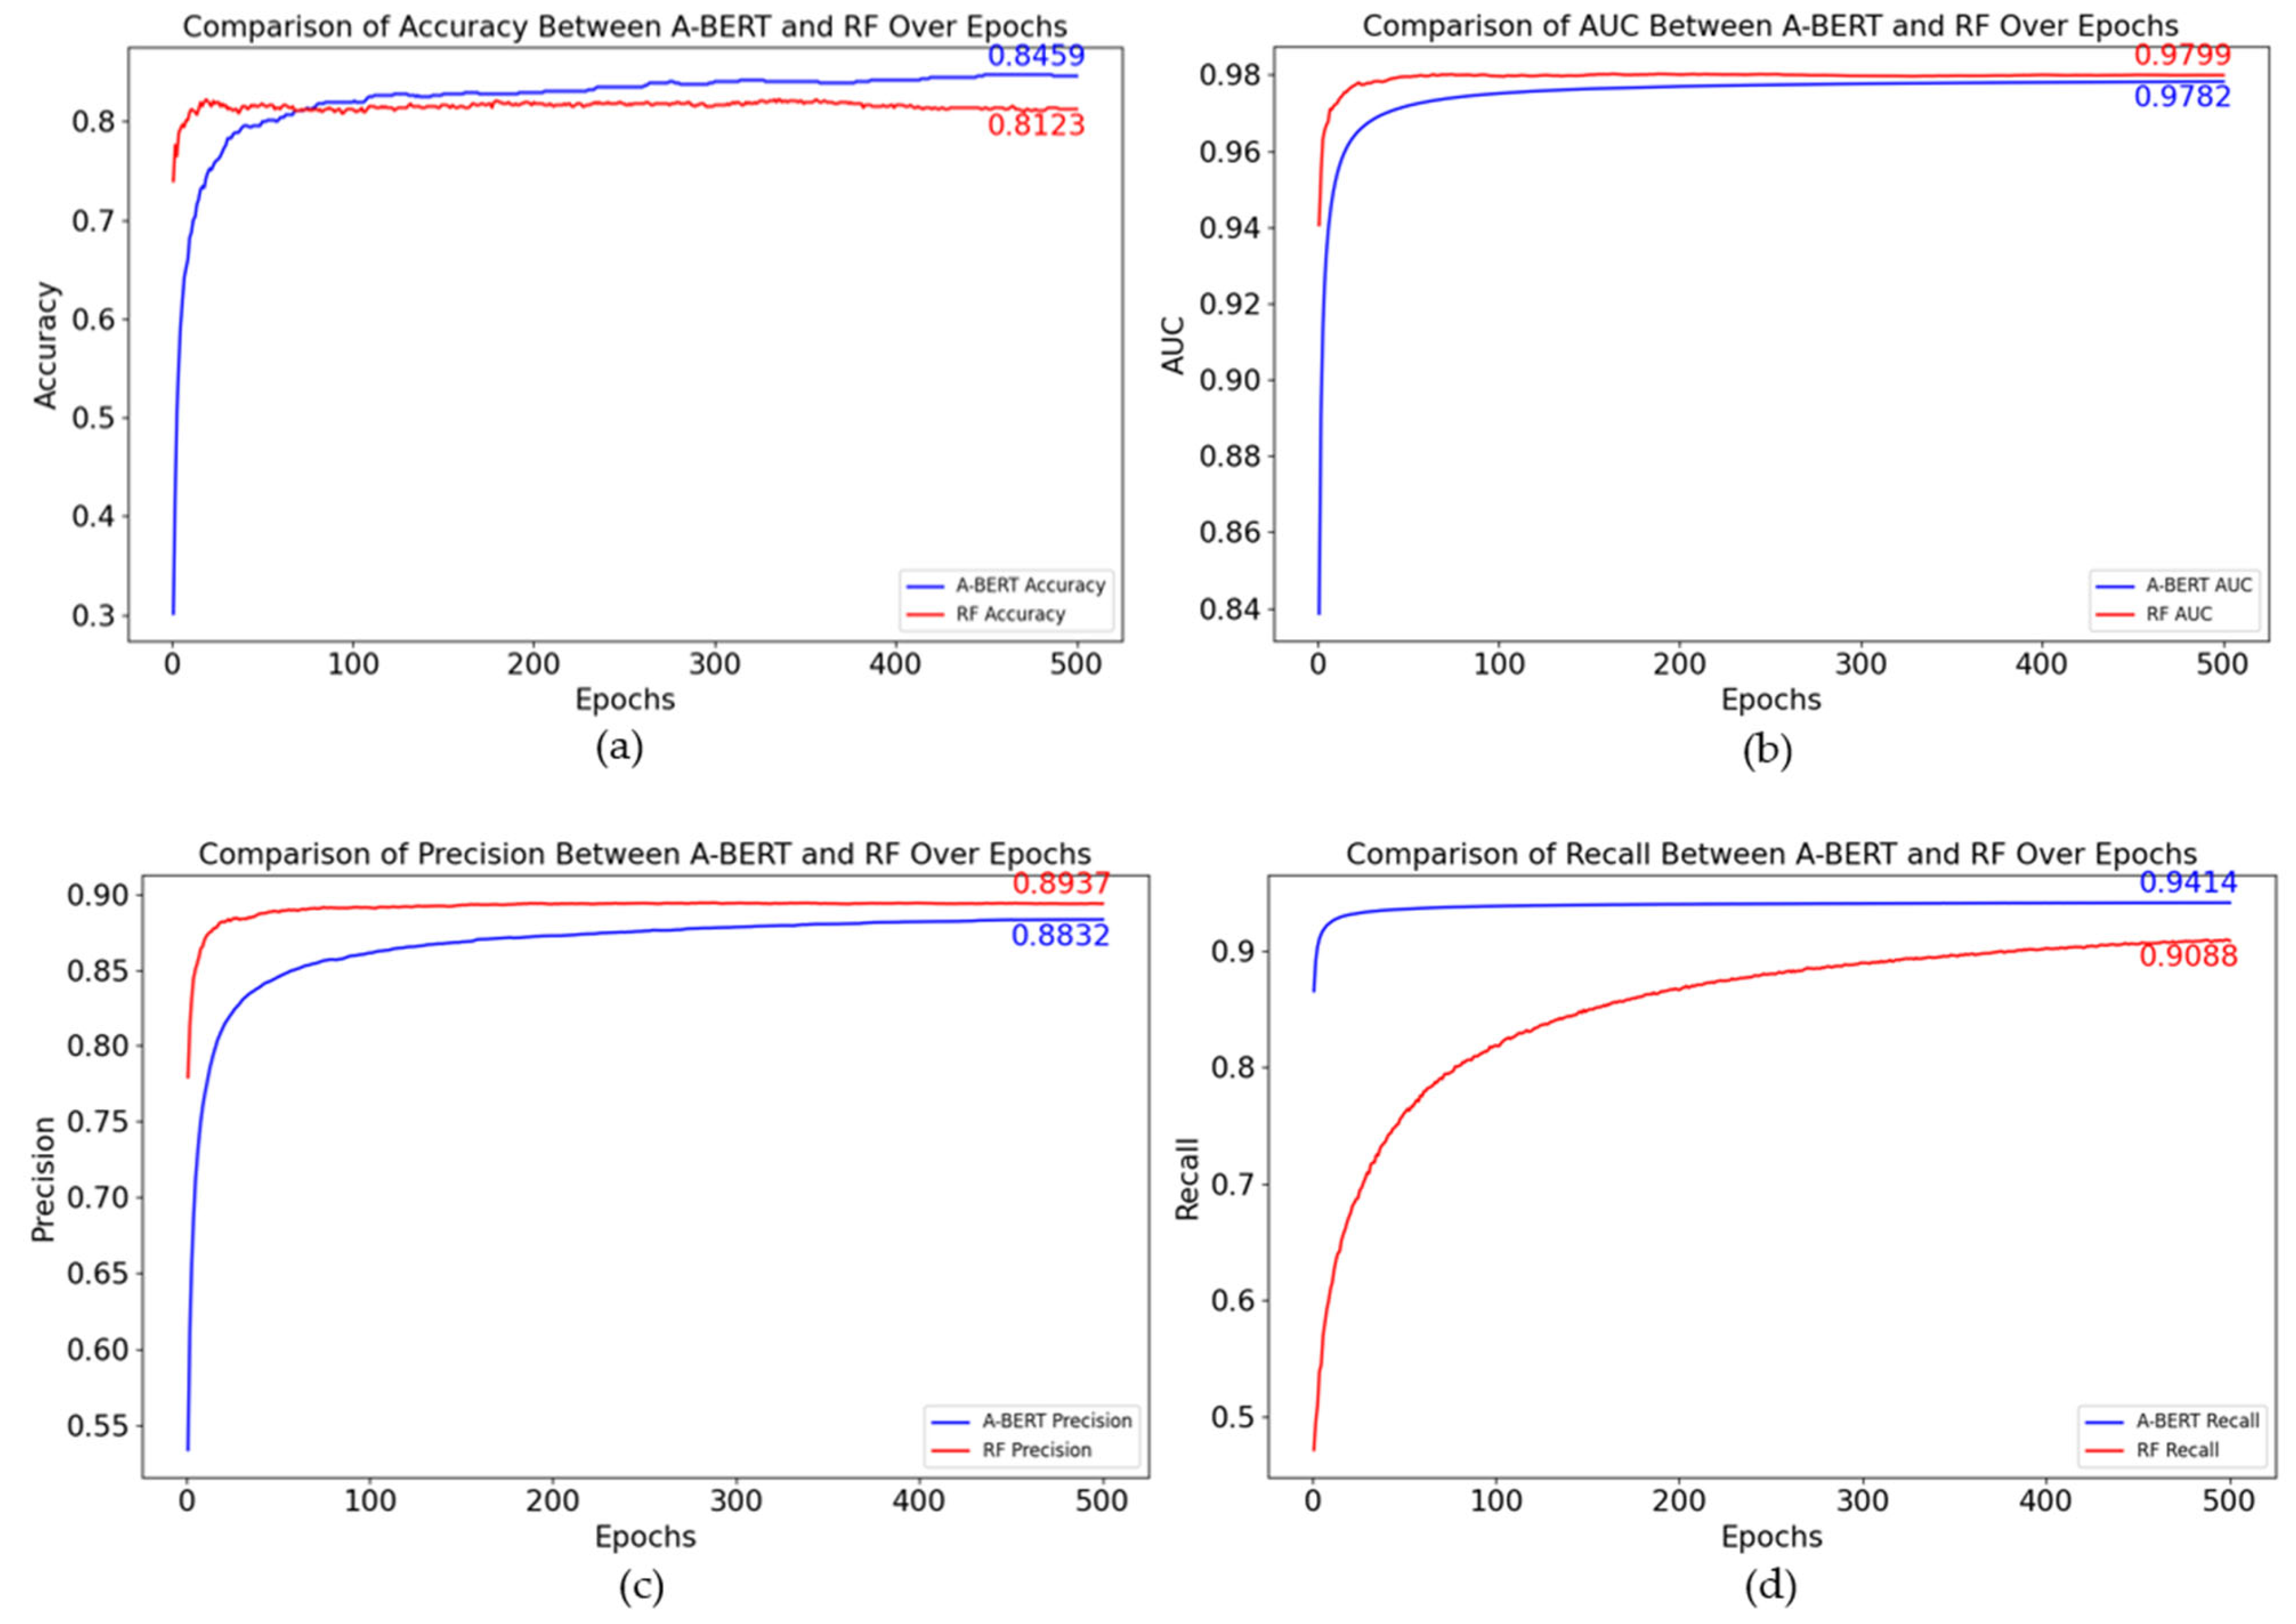
Figure 6 presents the evolution of accuracy, AUC, precision, and recall, comparing A-BERT and RF models, over 500 training epochs. Both models continued to perform very well under this training regime, with overall metrics remaining very similar. The most notable difference was a slight increase in precision. Specifically, A-BERT achieved higher accuracy (0.8459 vs. 0.8123) and recall (0.9414 vs. 0.9088), while RF exhibited slightly higher precision (0.8937 vs. 0.8832, a difference of 1.05 percentage points) and marginally better AUC (0.9799 vs. 0.9782). Overall, A-BERT maintains competitive performance across all metrics, with a clear advantage in recall, which is particularly relevant for tasks where minimizing false negatives is critical.
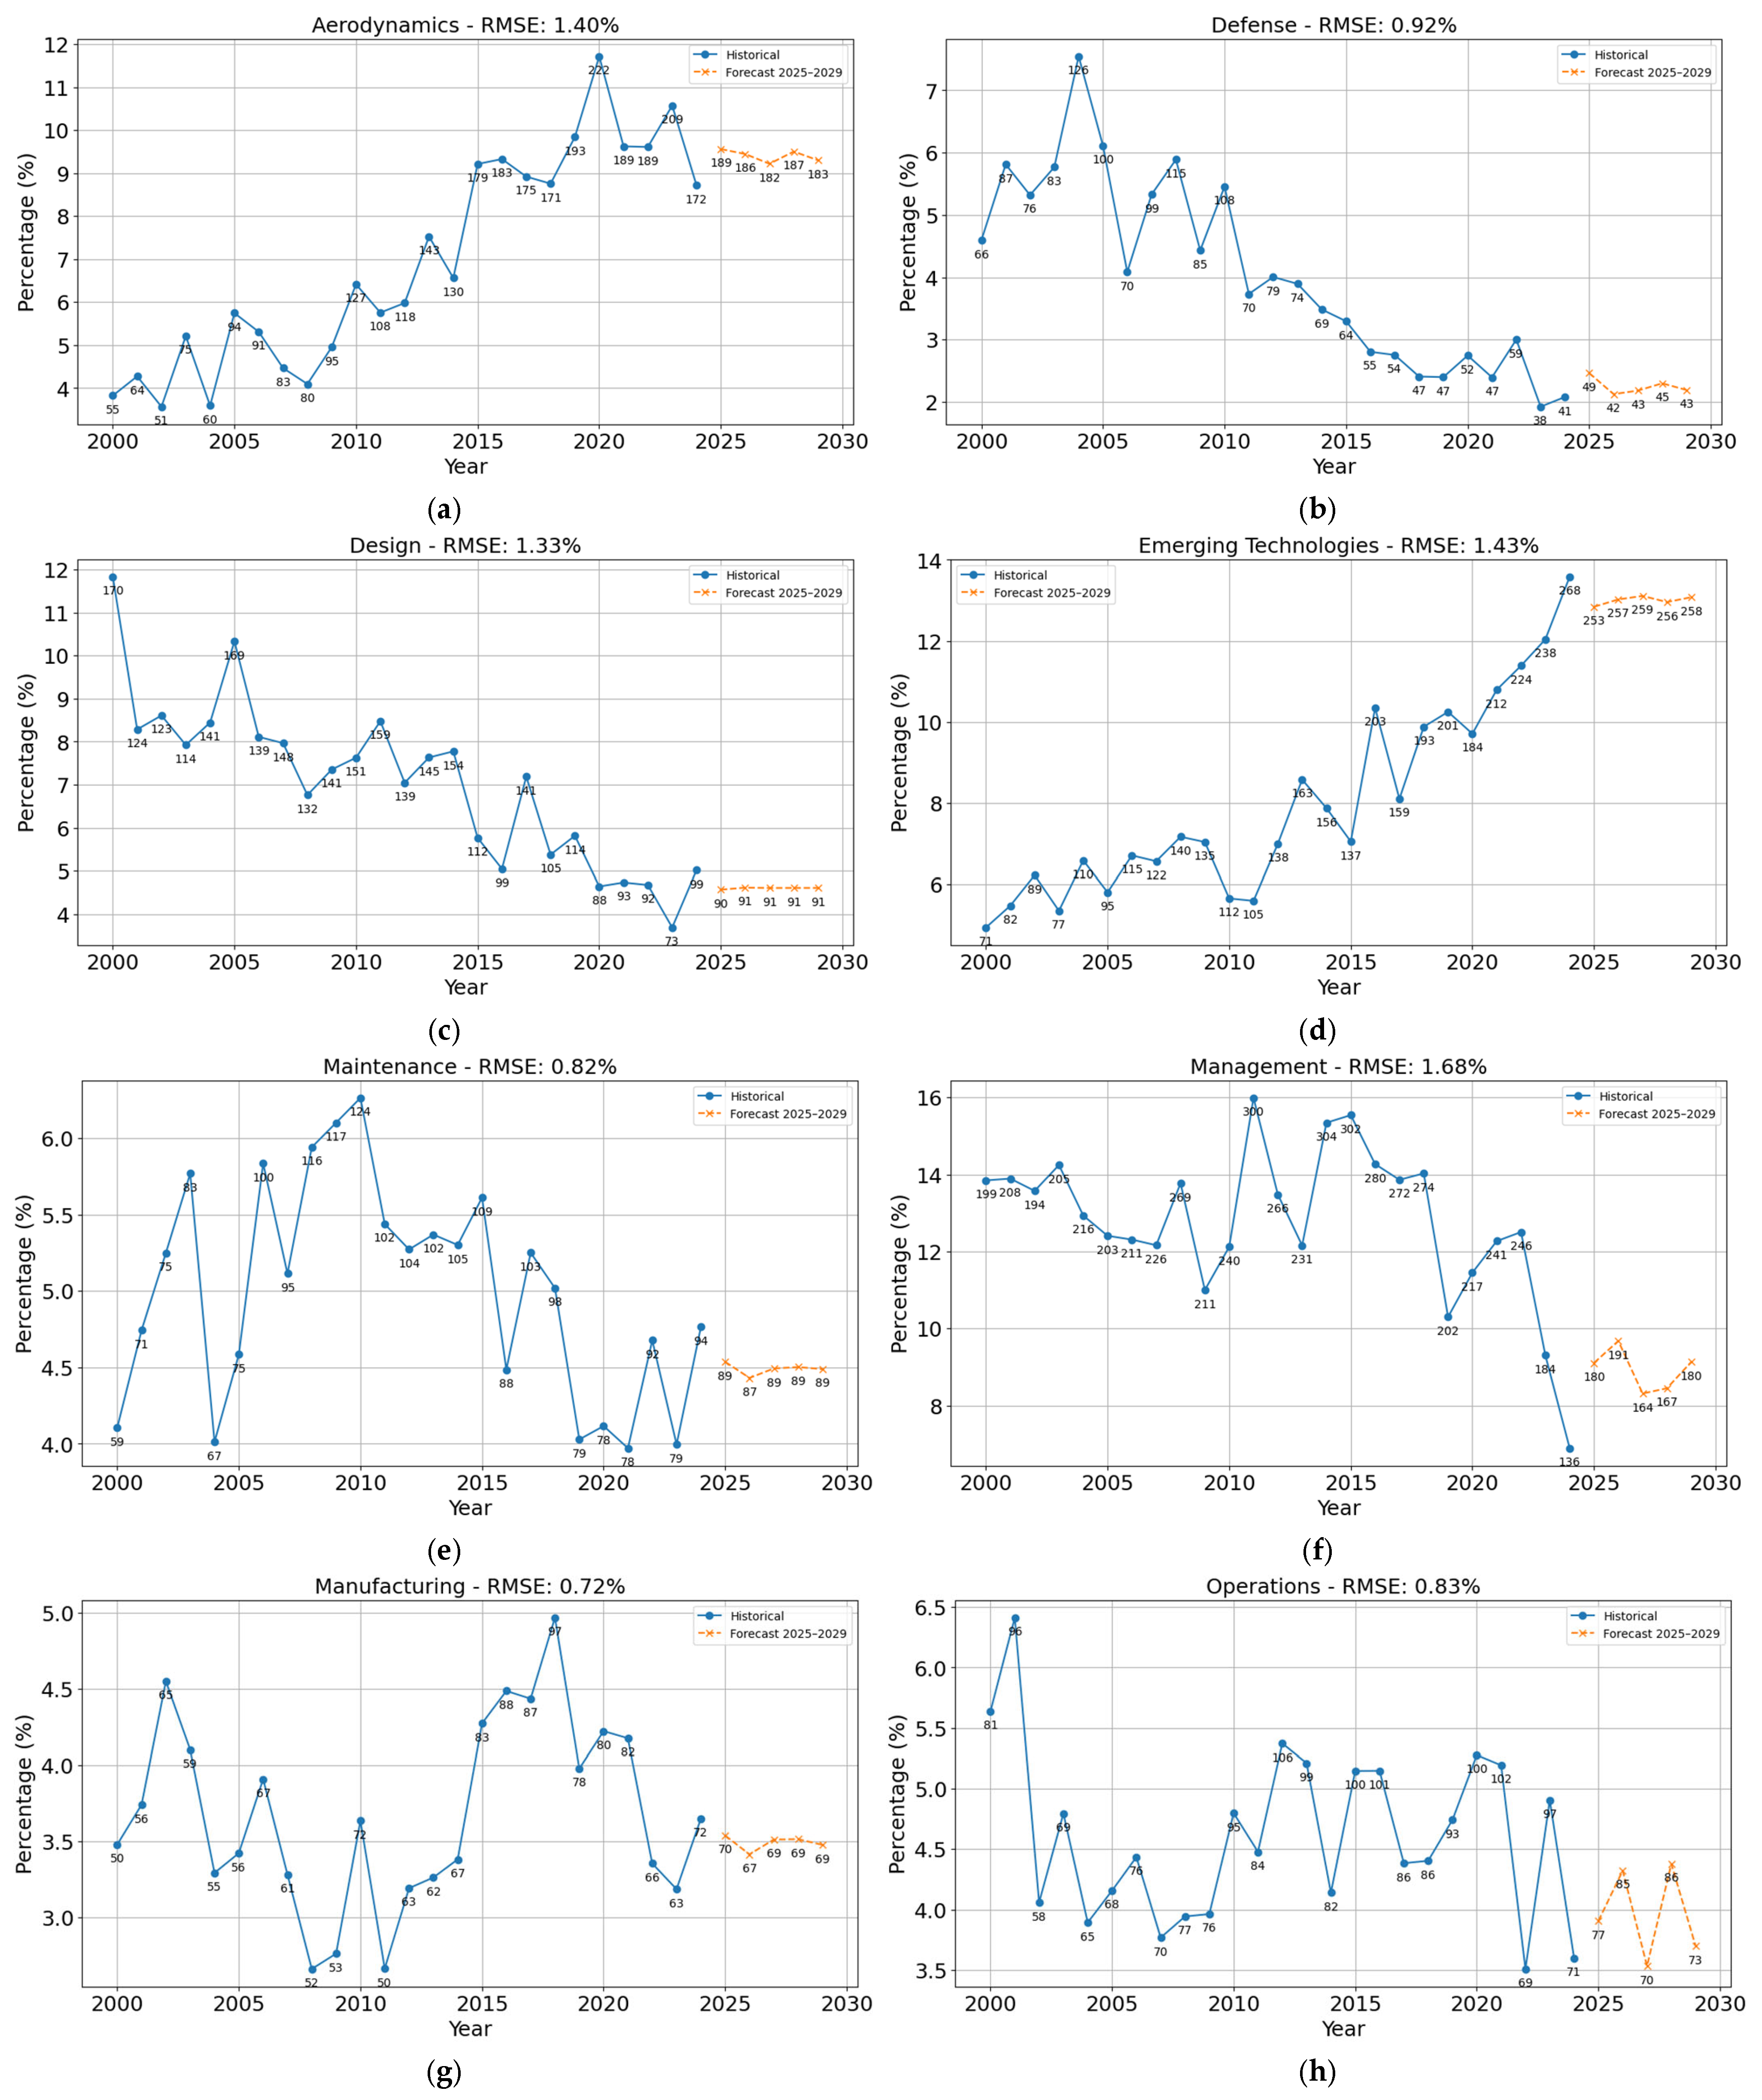
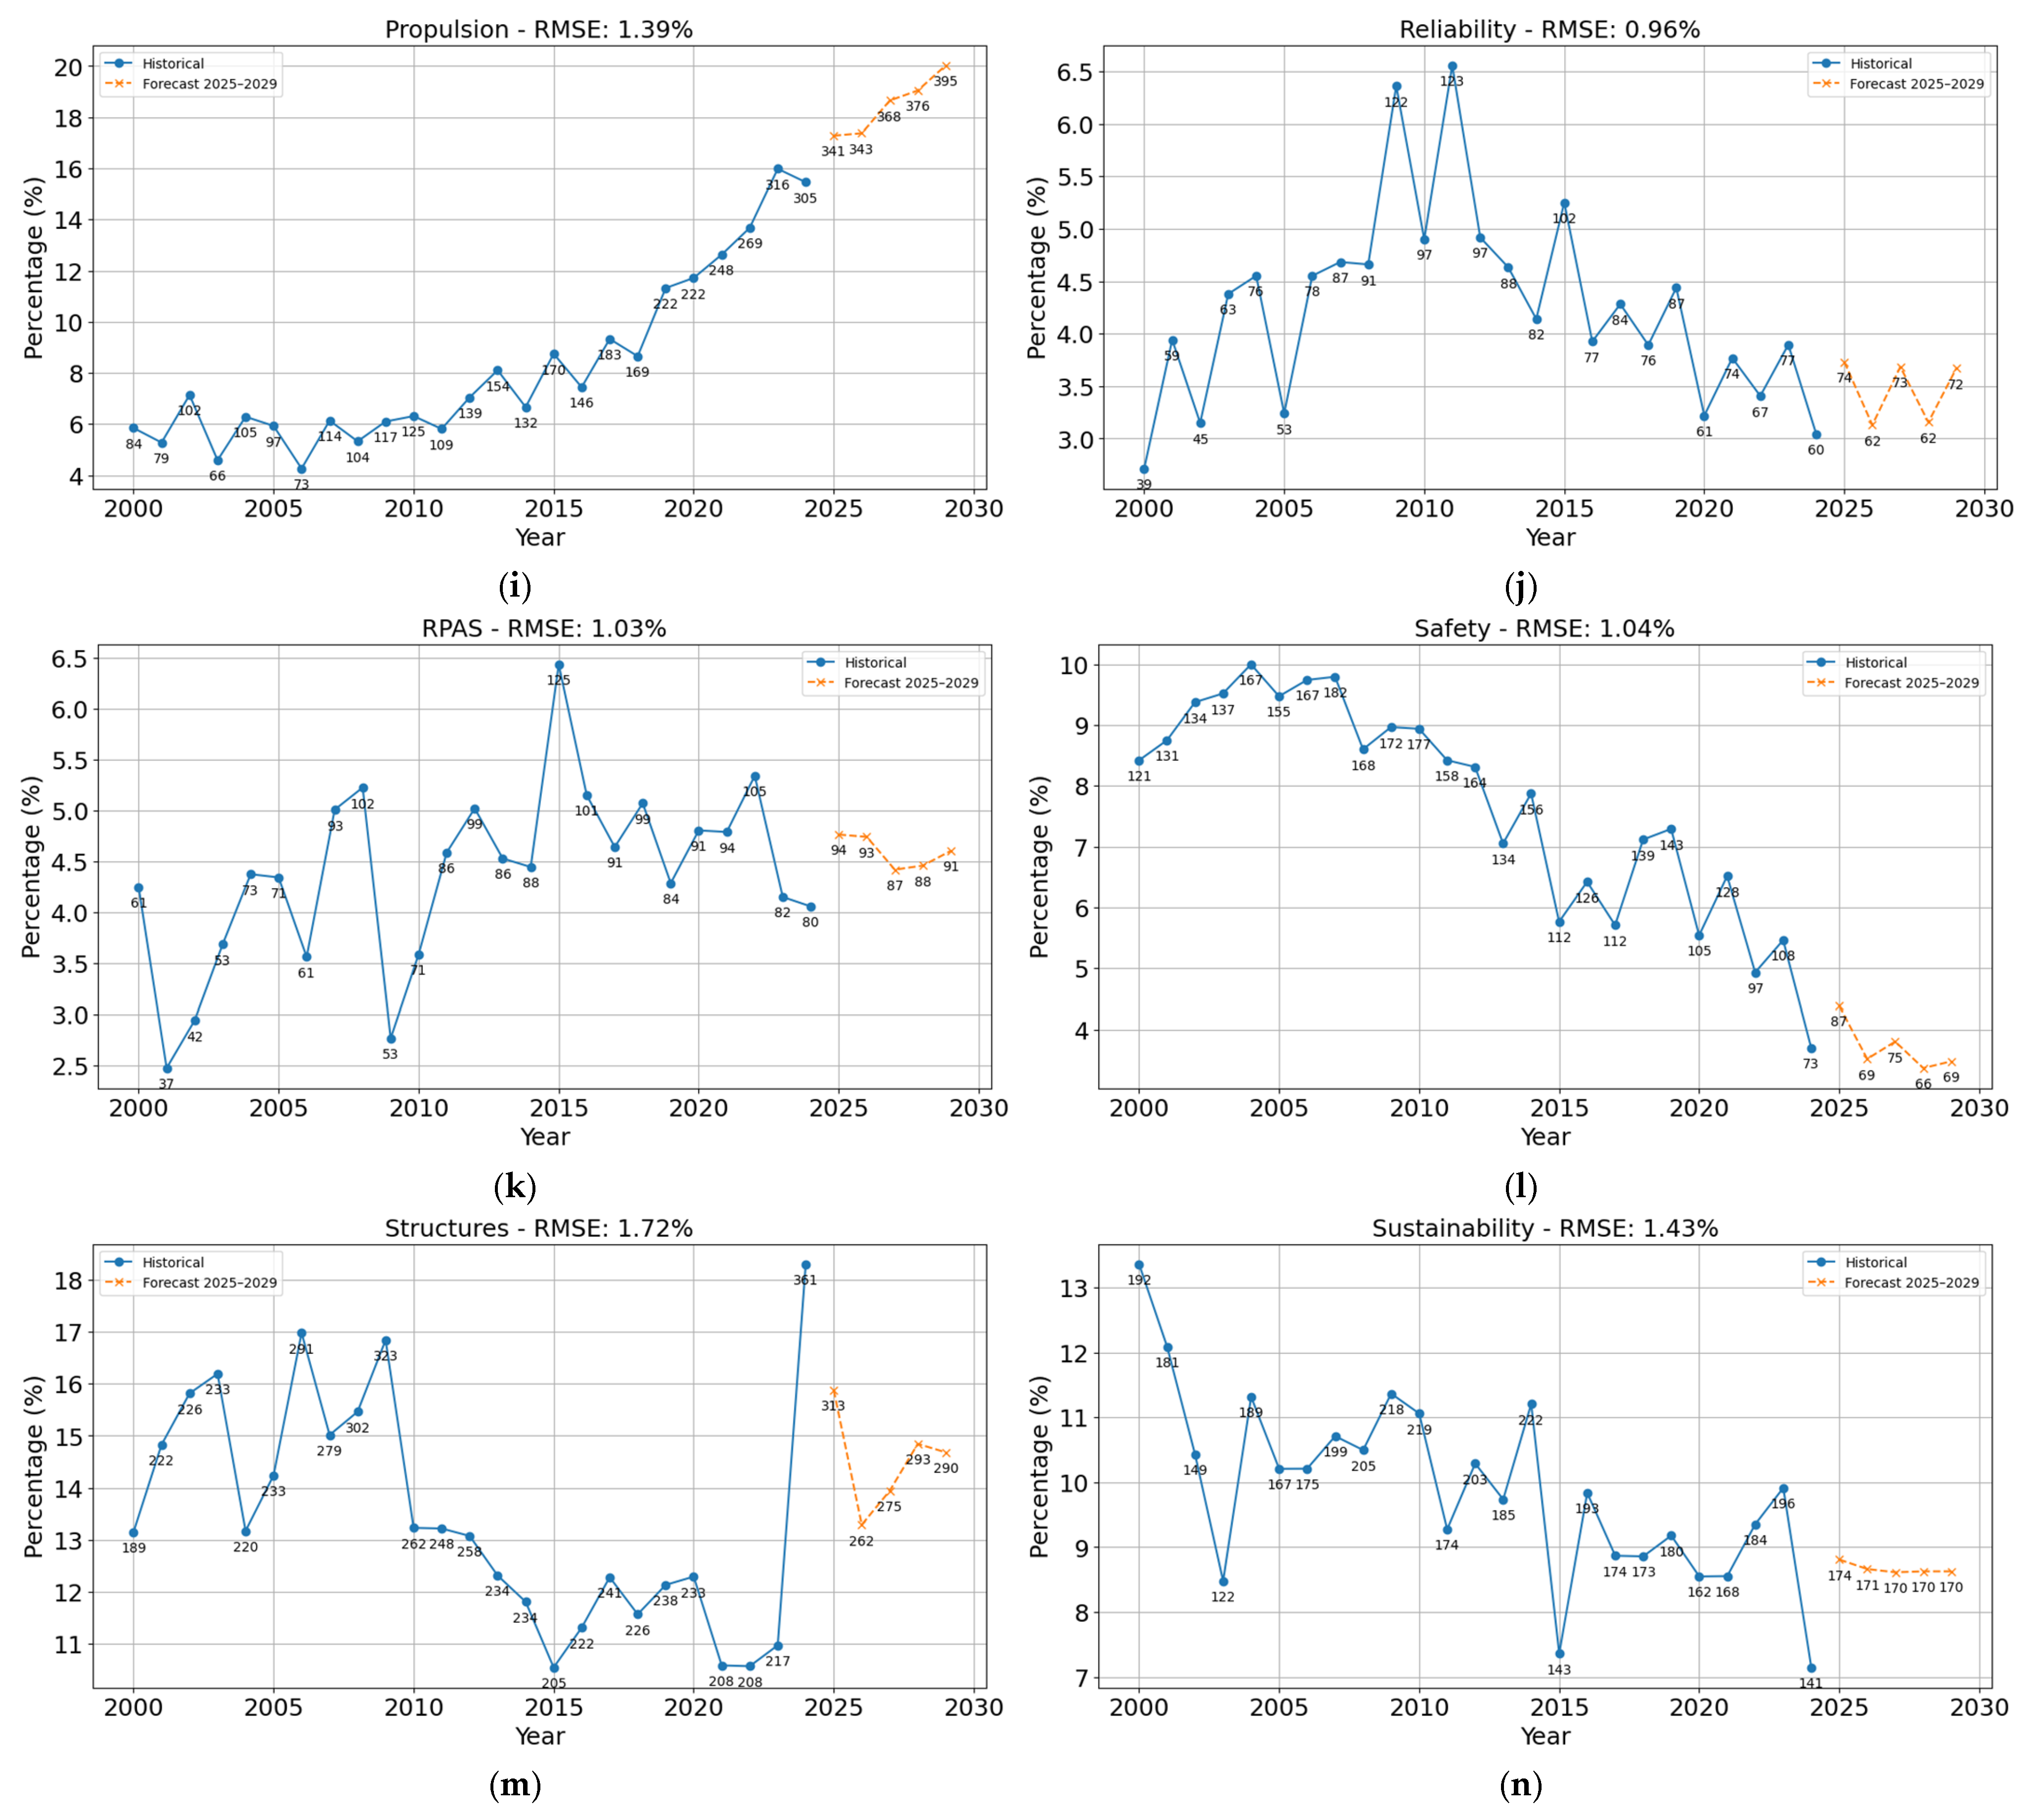
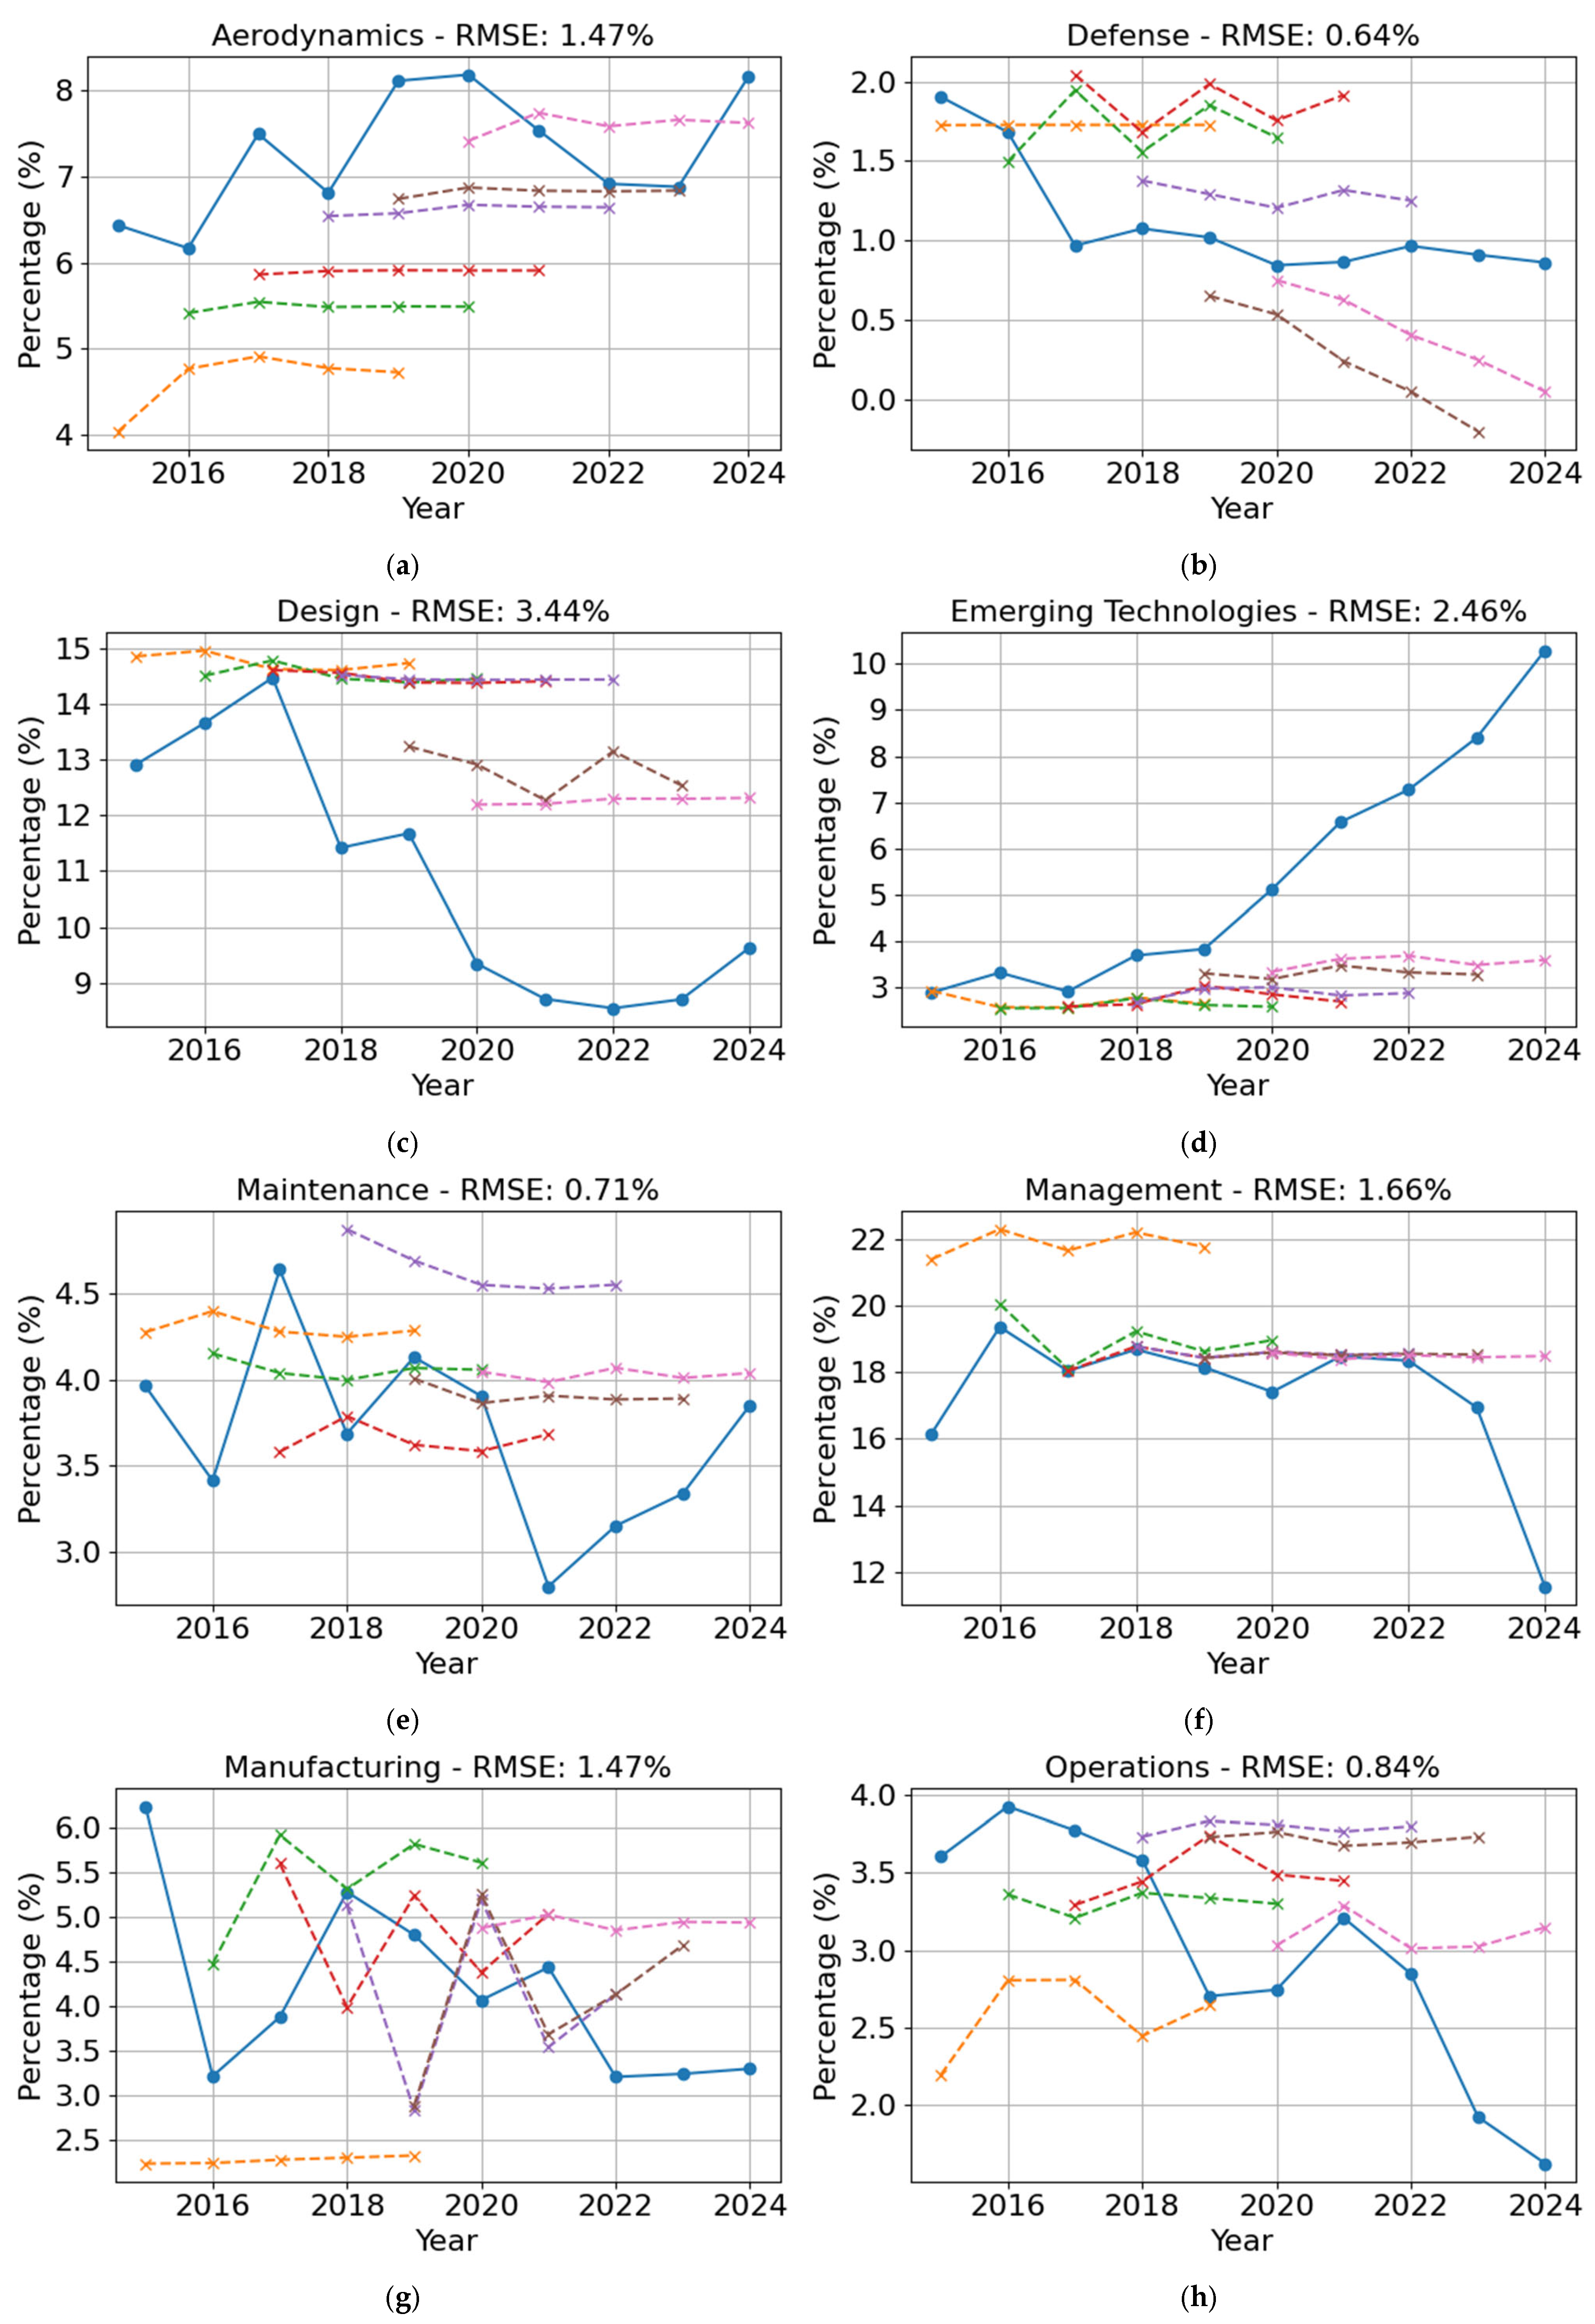
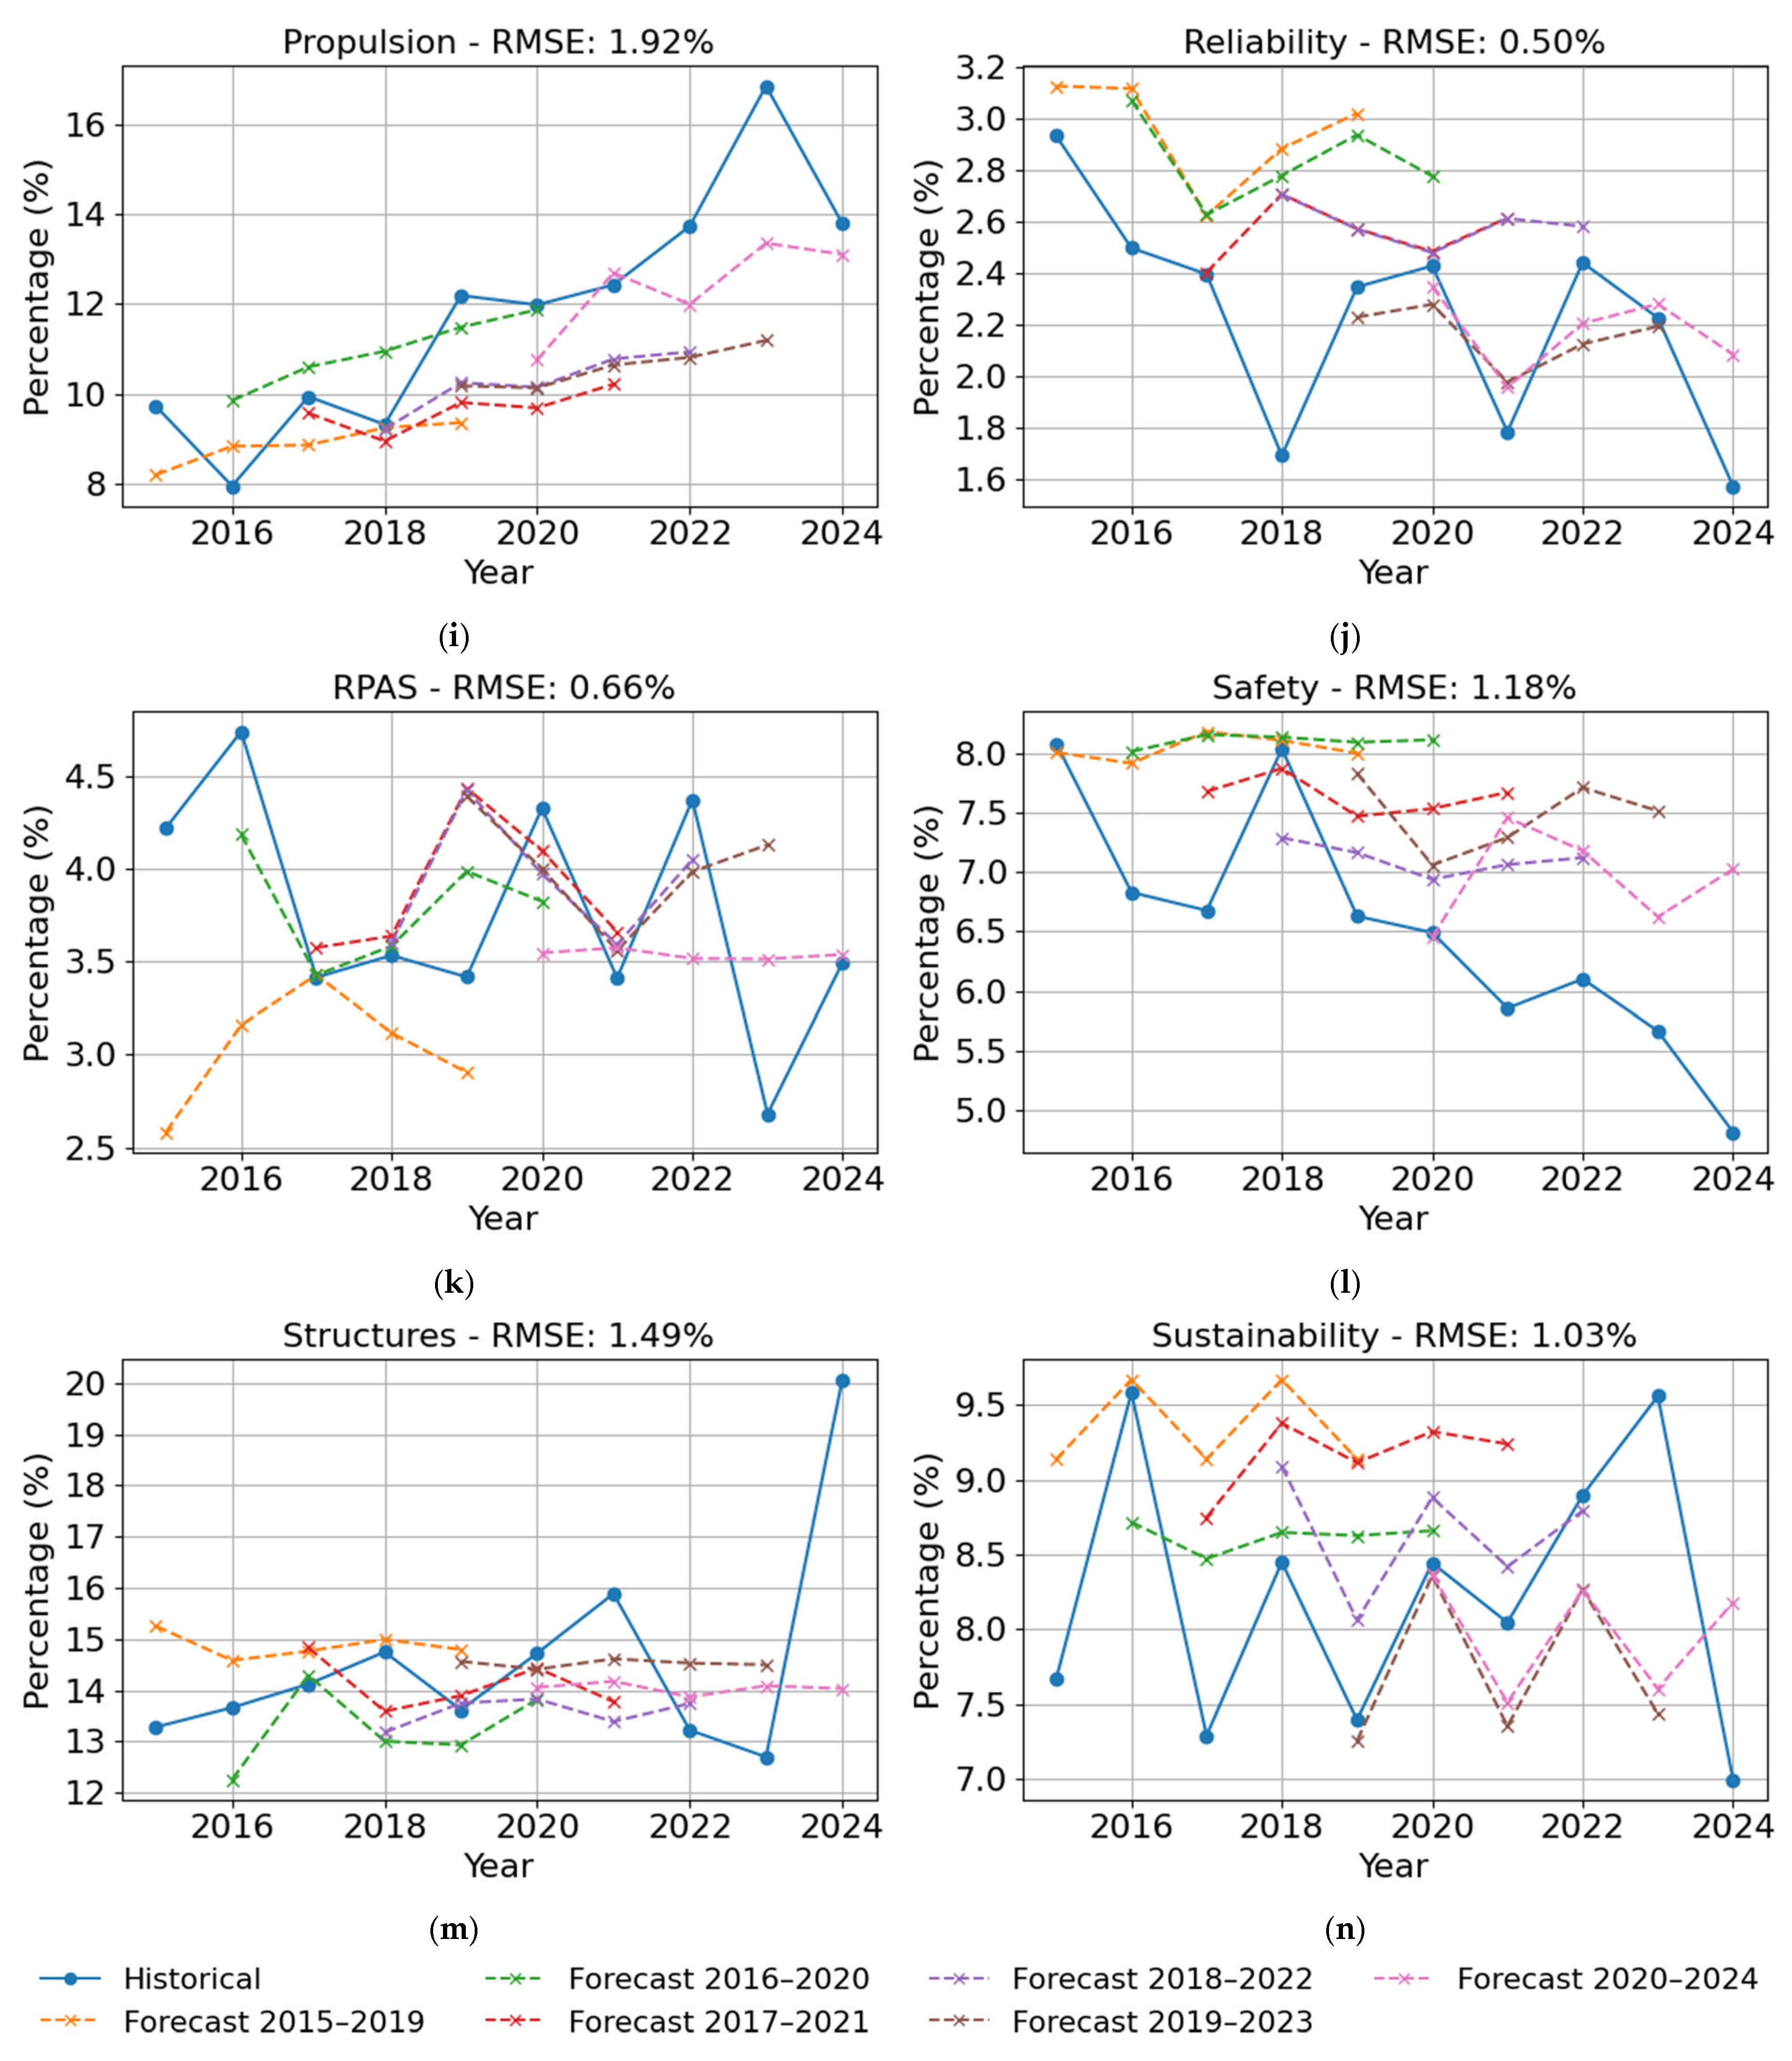
Figure 7 presents the historical data and predictions generated by the ARIMA model, built based on the Walk-Forward Validation technique, where the Root Mean Square Error (RMSE) values demonstrate a low margin of error in the ARIMA model predictions, with all results below 4%. This metric indicates high predictive accuracy, especially in categories such as Reliability (0.50%), Defense (0.64%), and RPAS (0.66%). Even in the classes with the highest variation, such as Design (3.44%) and Emerging Technologies (2.46%), errors remain within acceptable limits. This approach allowed us to evaluate the consistency of the model over time and its predictive robustness for different periods.
Table 3 provides a consolidated overview of all data, including the classifications from the A-BERT model and forecasts from the ARIMA model up to 2029. The analysis of the classified A-BERT data shows statistically significant trends (p < 0.05, Mann–Kendall trend test) in categories where there is a decreasing trend in the number of articles for Defense, Design, Safety, Structures, and Sustainability and an increasing trend for Aerodynamics, Emerging Technologies, Propulsion, and RPAS. Categories such as Maintenance, Management, Manufacturing, Operations, and Reliability, although not statistically significant (p > 0.05), display low forecast error rates. It is important to note that the reported RMSE percentages reflect the average deviation of predicted values compared to the actual total number of articles per class, thus providing a standardized measure of forecast accuracy. Additionally, to assess the temporal behavior of the model’s residuals and identify potential directional bias, the Mann–Kendall trend test was applied to the forecast errors. The lack of statistically significant trends in several classes supports the temporal reliability and consistency of the ARIMA forecasts. This may be because the ARIMA model can adapt to irregular but bounded fluctuations, even without a monotonic trend, by capturing weak seasonality, short-term shocks, and autocorrelated structures in time series [61]. See Figure A1 of Appendix B.
If the number of published articles is indicative of knowledge transfer to the industry, it is possible to observe a decrease in Management, Sustainability, Defense, Design, and Safety. In addition to the impact of automation and analytical tools, fluctuations in funding priorities, regulatory changes, evolving research interests, and broader socio-economic or geopolitical factors should be considered when interpreting trends in publication output within these domains. Applying the same correlation analysis, there is an anticipated increase in demand within the domains of Aerodynamics, Emerging Technologies, and Propulsion. While the surge in Emerging Technologies can be attributed to advancements in areas such as AI, Blockchain, and machine learning, the uptick in Aerodynamics and Propulsion may be linked to the optimization of aircraft, the development of new engines, the exploration of alternative fuels, and advancements in these technologies in general.

4.2. Limitations

The proposed A-BERT + ARIMA framework demonstrated strong performance in classifying the aviation-related literature and forecasting publication trends; however, several limitations should be acknowledged. First, the dataset comprised exclusively academic publications, without incorporating operational or proprietary aviation industry data. This constrains the immediate applicability of the results to real-world contexts, where data sources, formats, and temporal dynamics may differ substantially. We also acknowledge that applying the model to more specific or operationally relevant data—such as sub-domains within aerodynamics (e.g., subsonic or hypersonic aerodynamics)—would require retraining with appropriately representative datasets, as well as external validation using industry data, funding statistics, or adoption metrics to substantiate strategic planning claims. Furthermore, the scarcity of large, representative, and standardized aviation datasets limits the generalizability of the approach, and the classification accuracy of A-BERT remains dependent on the quality and consistency of annotated data, which may not be ensured in practical industry settings.
From a forecasting perspective, ARIMA was well-suited to the predominantly linear and non-seasonal trends observed—supported by Walk-Forward Validation results showing RMSE values below 2% in all classes, as demonstrated in Figure A1 of Appendix B. Nonetheless, its performance may deteriorate in the presence of complex nonlinear dynamics or pronounced seasonality. In such scenarios, alternative forecasting approaches, such as Long Short-Term Memory (LSTM) networks, transformer-based architectures, or hybrid statistical–machine learning models, could potentially offer improved predictive accuracy.
Finally, thematic overlap between semantically related categories—particularly Management, Operations, and Safety—remains a classification challenge. Future research could address this limitation through hierarchical or multi-label classification strategies, which may enhance model performance in domains with high conceptual proximity.

5. Conclusions

This study introduced the A-BERT + ARIMA hybrid framework, which combines a domain-specific adaptation of BERT for classifying aviation-related literature with statistical time series forecasting. A-BERT effectively categorized 45,823 scholarly articles into 14 thematic groups, surpassing the original BERT model on several key metrics. However, the Management category remained the most challenging due to overlapping themes with related categories. The subsequent use of ARIMA enabled accurate forecasting of publication trends up to 2029, with RMSE values consistently below 2% across all categories, demonstrating the robustness of the proposed approach.
These results demonstrate the framework’s potential for supporting evidence-based strategic planning, skills prediction, and research monitoring in the aviation industry. Although designed as a proof of concept, the A-BERT + ARIMA framework also offers a repeatable methodological template that can be applied to operational datasets, combined with hybrid forecasting techniques, and adapted for multi-label or hierarchical classification to address overlapping thematic areas better. By exploring these future directions, the framework can be further enhanced into a robust decision-support tool for industry and policy-making in aviation.

Author Contributions

Conceptualization, L.F.F.M.S., R.M. and D.V.; methodology, L.F.F.M.S., R.M. and D.V.; software, F.L.L.; validation, L.F.F.M.S., R.M. and D.V.; data curation, F.L.L., L.F.F.M.S. and R.M.; writing—original draft preparation, F.L.L.; writing—review and editing, L.F.F.M.S., R.M. and D.V.; visualization, F.L.L.; supervision, R.M. and D.V.; funding acquisition, R.M. and D.V. All authors have read and agreed to the published version of the manuscript.

Funding

The author Flávio Lázaro acknowledges a scholarship from Projecto de Desenvolvimento de Ciência e Tecnologia, from MESCTI, number 011/D-UL/PDCT-M003/2022. Authors acknowledge Fundação para a Ciência e a Tecnologia (FCT) for its financial support via the following projects: Laboratório Associado em Energia, Transportes e Aeroespacial (LAETA) Base Funding (DOI: 10.54499/UIDB/50022/2020); LAETA Programmatic Funding (DOI: 10.54499/UIDP/50022/2020), and project LA/P/0079/2020.

Institutional Review Board Statement

Not applicable.

Informed Consent Statement

Not applicable.

Data Availability Statement

The original contributions presented in this study are included in the article. Further inquiries can be directed to the corresponding author(s).

Conflicts of Interest

The authors declare no conflicts of interest.

Abbreviations

The following abbreviations are used in this manuscript:
A-BERTAviation Bidirectional Encoder Representations for Transformers
AIArtificial Intelligence
ARIMAAuto Regressive Integrated Moving Average
AUCArea Under the Curve
BERTBidirectional Encoder Representations for Transformers
CNNConvolutional Neural Networks
DLDeep Learning
LSTMLong Short-Term Memory
MLMachine Learning
NLPNatural Language Processing
NTSBNational Transportation Safety Board
RFRandom Forest
RMSERoot Mean Square Error
RNNRecurrent Neural Networks
RoBERTaRobustly Optimized Bidirectional Encoder Representations from Transformers
ROCReceiver Operating Characteristic
RPASRemotely Piloted Aircraft System
SciBERTScientific Bidirectional Encoder Representations for Transformers

Appendix A

The following tables present the detailed hyperparameters for both classification approaches (by one-shot and by epoch), as defined and applied within the scope of this research.
Table A1. One-shot method.
ComponentParameterValue
Tokenizer (Hugging Face)model_idbert-base-uncased
Tokenizer callpaddingTrue
truncationTrue
max_length512
return_tensors“tf”
BERT encodermodel_idbert-base-uncased
Encoding functionbatch_size16
Encoding/poolingpooling[CLS] token (last_hidden_state[:,0,:])
SMOTErandom_state42
Train/test splittest_size0.2
random_state42
LogisticRegressionmax_iter1000
GridSearchCVparam_grid{‘C’: [0.001, 0.01, 0.1, 1, 10, 100]}
cv5
Prediction (probabilities)batch_size16
Precision metricaverage“macro”
Learning curvecv5
scoring“accuracy”
n_jobs−1
train_sizesnp.linspace(0.1, 1.0, 5)
Table A2. Epochs method.
ComponentParameterValue
Tokenizer (Hugging Face)model_idbert-base-uncased
Tokenizer callpaddingTrue
truncationTrue
max_length512
return_tensors“tf”
BERT encodermodel_idbert-base-uncased
Encoding functionbatch_size16
Encoding/poolingpooling[CLS] token (last_hidden_state[:,0,:])
SMOTErandom_state42
Train/test splittest_size0.2
random_state42
SGDClassifierloss‘log_loss’
max_iter1
tolNone
learning_rate‘constant’
eta00.01
random_state42
SGD training loopepochs500
SGD partial_fitclassesnp.unique(labels)

Appendix B

Figure A1 illustrates the results and performances of the time series classified by the A-BERT model, with projections extended to the year 2029. The results obtained show the effectiveness of the ARIMA model, with consistently low RMSE values, which are all less than 2%. Categories such as Manufacturing (0.72%), Maintenance (0.82%), and Operations (0.83%) stand out, which demonstrate high stability and predictability. Even in more volatile classes such as Structures (1.72%) and Management (1.68%), errors remain within acceptable limits. These results confirm the strength of the A-BERT + ARIMA hybrid model for monitoring trends and offering strategic insights in the aviation domain.
Figure A1. A-BERT’s results and performances for different classes, forecasting 2025–2029: (a) Aerodynamics, (b) Defense, (c) Design, (d) Emerging Technologies, (e) Maintenance, (f) Management, (g) Manufacturing, (h) Operations, (i) Propulsion, (j) RPAS, (k) Reliability, (l) Safety, (m) Structures, (n) Sustainability.
Applsci 15 09403 g0a1aApplsci 15 09403 g0a1b

References

  1. Fatine, E.; Raed, J.; Niamat, U.I.H.; Marc, B.; Chad, K.; Safae, E.A. Applying systems modeling language in an aviation maintenance system. IEEE Trans. Eng. Manag. 2022, 69, 4006–4018. [Google Scholar] [CrossRef]
  2. Madeira, T.; Melicio, R.; Valério, D.; Santos, L. Machine learning and natural language processing for prediction of human factors in aviation incident reports. Aerospace 2021, 8, 247. [Google Scholar] [CrossRef]
  3. Keller, R.M. Ontologies for aviation data management. In Proceedings of the Digital Avionics Systems Conference (DASC), Sacramento, CA, USA, 25–29 September 2016; pp. 1–9. [Google Scholar] [CrossRef]
  4. Lázaro, F.L.; Nogueira, R.P.R.; Melicio, R.; Valério, D.; Santos, L.F.F.M. Human Factors as Predictor of Fatalities in Aviation Accidents: A Neural Network Analysis. Appl. Sci. 2024, 14, 640. [Google Scholar] [CrossRef]
  5. Devlin, J.; Chang, M.W.; Lee, K.; Toutanova, K. BERT: Pre training of deep bidirectional transformers for language understanding. arXiv 2018, arXiv:1810.04805. [Google Scholar] [CrossRef]
  6. Samarra, J.; Santos, L.F.; Barqueira, A.; Melicio, R.; Valério, D. Uncovering the hidden correlations between socio-economic indicators and aviation accidents in the United States. Appl. Sci. 2023, 13, 4797. [Google Scholar] [CrossRef]
  7. Amaral, Y.; Santos, L.F.F.M.; Valério, D.; Melicio, R.; Barqueira, A. Probabilistic and statistical analysis of aviation accidents. IOP Conf. Ser. Mater. Sci. Eng. 2023, 2526, 012107. [Google Scholar] [CrossRef]
  8. Andrade, S.R.; Walsh, H.S. SafeAeroBERT: Towards a Safety-Informed Aerospace-Specific Language Model. In AIAA AVIATION 2023 Forum; American Institute of Aeronautics and Astronautics (AIAA): San Diego, CA, USA, 2023; Paper AIAA 2023 3437. [Google Scholar] [CrossRef]
  9. Tikayat Ray, A.; Cole, B.F.; Pinon Fischer, O.J.; White, R.T.; Mavris, D.N. aeroBERT-Classifier: Classification of Aerospace Requirements Using BERT. Aerospace 2023, 10, 279. [Google Scholar] [CrossRef]
  10. New, M.D.; Wallace, R.J. Classifying Aviation Safety Reports: Using Supervised Natural Language Processing (NLP) in an Applied Context. Safety 2025, 11, 7. [Google Scholar] [CrossRef]
  11. Beltagy, I.; Lo, K.; Cohan, A. SciBERT: A Pretrained Language Model for Scientific Text. arXiv 2019, arXiv:1903.10676. [Google Scholar] [CrossRef]
  12. Liu, Y.; Ott, M.; Goyal, N.; Du, J.; Joshi, M.; Chen, D.; Levy, O.; Lewis, M.; Zettlemoyer, L.; Stoyanov, V. RoBERTa: A Robustly Optimized BERT Pretraining Approach. arXiv 2019, arXiv:1907.11692. [Google Scholar] [CrossRef]
  13. Nwoye, C.I.; Alapatt, D.; Yu, T.; Vardazaryan, A.; Xia, F.; Zhao, Z.; Xia, T.; Jia, F.; Yang, Y.; Wang, H.; et al. Cholectriplet2021: A benchmark challenge for surgical action triplet recognition. Neurocomputing 2023, 86, 102803. [Google Scholar] [CrossRef]
  14. Ali Gombe, A.; Elyan, E. MFC GAN: Class imbalanced dataset classification using multiple fake class generative adversarial network. Neurocomputing 2019, 361, 212–221. [Google Scholar] [CrossRef]
  15. Hashemi, A.; Dowlatshahi, M. Neural Networks and Deep Learning. In Neural Networks and Deep Learning; Springer Nature: Singapore, 2023; Chapter 1. [Google Scholar] [CrossRef]
  16. Sotvoldiev, D.; Muhamediyeva, D.T.; Juraev, Z. Deep learning neural networks in fuzzy modeling. IOP Conf. Ser. Mater. Sci. Eng. 2020, 1441, 012171. [Google Scholar] [CrossRef]
  17. Zhang, C. Text classification using deep learning methods. In Proceedings of the 2022 Conference on Topics in Computing Systems, New Orleans, LA USA, 29 April–5 May 2022; IEEE: Piscataway, NJ, USA, 2022; pp. 1327–1332. [Google Scholar] [CrossRef]
  18. Liang, K.; Sakakibara, Y. MetaVelvet DL: A MetaVelvet deep learning extension for de novo metagenome assembly. BMC Bioinform. 2021, 22, 373. [Google Scholar] [CrossRef]
  19. Sahu, S.K.; Mokhade, A.; Bokde, N.D. An overview of machine learning, deep learning, and reinforcement learning based techniques in quantitative finance: Recent progress and challenges. Appl. Sci. 2023, 13, 1956. [Google Scholar] [CrossRef]
  20. Kouris, P.; Alexandridis, G.; Stafylopatis, A. Text summarization based on semantic graphs: An abstract meaning representation graph to text deep learning approach. Res. Sq. 2022. preprint. [Google Scholar] [CrossRef]
  21. Maylawati, D.S.; Kumar, Y.J.; Kasmin, F.B.; Ramdhani, M.A. An idea based on sequential pattern mining and deep learning for text summarization. IOP Conf. Ser. Mater. Sci. Eng. 2019, 1402, 077013. [Google Scholar] [CrossRef]
  22. Gasparetto, A.; Marcuzzo, M.; Zangari, A.; Albarelli, A. A survey on text classification algorithms: From text to predictions. Information 2022, 13, 200. [Google Scholar] [CrossRef]
  23. Gorenstein, L.; Konen, E.; Green, M.; Klang, E. Bidirectional encoder representations from transformers in radiology: A systematic review of natural language processing applications. J. Am. Coll. Radiol. 2024, 21, 914–941. [Google Scholar] [CrossRef]
  24. Moon, S.; Chi, S.; Im, S.B. Automated detection of contractual risk clauses from construction specifications using bidirectional encoder representations from transformers (BERT). Autom. Constr. 2022, 142, 104465. [Google Scholar] [CrossRef]
  25. Chaudhry, P. Bidirectional encoder representations from transformers for modelling stock prices. Int. J. Res. Appl. Sci. Eng. Technol. 2022, 10, 404. [Google Scholar] [CrossRef]
  26. Özçift, A.; Akarsu, K.; Yumuk, F.; Söylemez, C. Advancing natural language processing (NLP) applications of morphologically rich languages with bidirectional encoder representations from transformers (BERT): An empirical case study for Turkish. J. Control Meas. Electron. Comput. Commun. 2021, 62, 226–238. [Google Scholar] [CrossRef]
  27. Özdil, U.; Arslan, B.; Taşar, D.E.; Polat, G.; Ozan, Ş. Ad text classification with bidirectional encoder representations. In Proceedings of the 2021 6th International Conference on Computer Science and Engineering (UBMK), Ankara, Turkey, 15–17 September 2021; IEEE: Piscataway, NJ, USA, 2021; pp. 169–173. [Google Scholar] [CrossRef]
  28. Nanyonga, A.; Wasswa, H.; Joiner, K.; Turhan, U.; Wild, G. A Multi-Head Attention-Based Transformer Model for Predicting Causes in Aviation Incidents. Modelling 2025, 6, 27. [Google Scholar] [CrossRef]
  29. Liu, H.; Shen, F.; Qin, H.; Gao, F. Research on Flight Accidents Prediction Based on Back Propagation Neural Network. arXiv 2024, arXiv:2406.13954. [Google Scholar] [CrossRef]
  30. Ma, N.; Meng, J.; Luo, J.; Liu, Q. Optimization of Thermal-Fluid-Structure Coupling for Variable-Span Inflatable Wings Considering Case Correlation. Aerosp. Sci. Technol. 2024, 153, 109448. [Google Scholar] [CrossRef]
  31. Verma, M.; Pardeep, K. Generic Deep-Learning-Based Time Series Models for Aviation Accident Analysis and Forecasting. Comput. Sci. 2023, 5, 32. [Google Scholar] [CrossRef]
  32. Lin, M. Civil aviation satellite navigation integrity monitoring with deep learning. Adv. Comput. Commun. 2023, 4, 260–264. [Google Scholar] [CrossRef]
  33. Nogueira, R.; Melicio, R.; Valério, D.; Santos, L. Learning methods and predictive modeling to identify failure by human factors in the aviation industry. Appl. Sci. 2023, 13, 4069. [Google Scholar] [CrossRef]
  34. Zhang, X.; Srinivasan, P.; Mahadevan, S. Sequential deep learning from NTSB reports for aviation safety prognosis. Saf. Sci. 2021, 142, 105390. [Google Scholar] [CrossRef]
  35. Wang, Z. Deep learning based foreign object detection method for aviation runways. Appl. Math. Nonlinear Sci. 2023, 8, 30. [Google Scholar] [CrossRef]
  36. Caballero, W.N.; Gaw, N.; Jenkins, P.R.; Johnstone, C. Toward automated instructor pilots in legacy air force systems: Physiology based flight difficulty classification via machine learning. Expert Syst. Appl. 2023, 231, 120711. [Google Scholar] [CrossRef]
  37. Jiang, Y.; Tran, T.H.; Williams, L. Machine learning and mixed reality for smart aviation: Applications and challenges. J. Air Transp. Manag. 2023, 111, 102437. [Google Scholar] [CrossRef]
  38. Li, P.; Liu, S.; Tian, Y.; Hou, T.; Ling, J. Automatic Perception of Aircraft Taxiing Behavior via Laser Rangefinders and Machine Learning. IEEE Sens. J. 2025, 25, 3964–3973. [Google Scholar] [CrossRef]
  39. Liang, Z.; Zhao, Y.; Wang, M.; Huang, H.; Xu, H. Research on the Automatic Multi-Label Classification of Flight Instructor Comments Based on Transformer and Graph Neural Networks. Aerospace 2025, 12, 407. [Google Scholar] [CrossRef]
  40. Xu, G.J.W.; Pan, S.; Sun, P.Z.H.; Guo, K.; Park, S.H.; Yan, F.; Wu, E.Q. Human-Factors-in-Aviation-Loop: Multimodal Deep Learning for Pilot Situation Awareness Analysis Using Gaze Position and Flight Control Data. IEEE Trans. Intell. Transp. Syst. 2025, 26, 8065–8077. [Google Scholar] [CrossRef]
  41. Helgo, M. Deep learning and machine learning algorithms for enhanced aircraft maintenance and flight data analysis. J. Robot. Spectrum 2023, 1, 090–099. [Google Scholar] [CrossRef]
  42. Lázaro, F.L.; Madeira, T.; Melicio, R.; Valério, D.; Santos, L.F.F.M. Identifying human factors in aviation accidents with natural language processing and machine learning models. Aerospace 2025, 12, 106. [Google Scholar] [CrossRef]
  43. Wei, M.; Yang, S.; Wu, W.; Sun, B. A multi-objective fuzzy optimization model for multi-type aircraft flight scheduling problem. Transport 2024, 39, 313–322. [Google Scholar] [CrossRef]
  44. Yang, C.; Huang, C. Natural Language Processing (NLP) in Aviation Safety: Systematic Review of Research and Outlook into the Future. Aerospace 2023, 10, 600. [Google Scholar] [CrossRef]
  45. Fredriksson, T.; Bosch, J.; Olsson, H.H. Machine learning models for automatic labeling: A systematic literature review. In Proceedings of the 15th International Conference on Software Technologies (ICSOFT), Paris, France, 7–9 July 2020; pp. 552–561. [Google Scholar] [CrossRef]
  46. Iqbal, M.; Naveed, A. Forecasting inflation: Autoregressive integrated moving average model. Eur. Sci. J. 2016, 12, 83. [Google Scholar] [CrossRef]
  47. Zou, Y.; Wang, T.; Xiao, J.; Feng, X. Temperature prediction of electrical equipment based on autoregressive integrated moving average model. In Proceedings of the 2017 32nd Youth Academic Annual Conference of Chinese Association of Automation (YAC), Hefei, China, 19–21 May 2017; pp. 197–200. [Google Scholar] [CrossRef]
  48. Yang, Y.; Wu, W.; Sun, L. Prediction of mechanical equipment vibration trend using autoregressive integrated moving average model. In Proceedings of the 10th International Congress on Image and Signal Processing, Biomedical Engineering and Informatics (CISP-BMEI), Shanghai, China, 14–16 October 2017; IEEE: Piscataway, NJ, USA, 2017; pp. 1–5. [Google Scholar] [CrossRef]
  49. Sameh, B.; Elshabrawy, M. Seasonal autoregressive integrated moving average for climate change time series forecasting. Am. J. Bus. Oper. Res. 2022, 8, 25–35. [Google Scholar] [CrossRef]
  50. Chodakowska, E.; Nazarko, J.; Nazarko, Ł. ARIMA Models in Electrical Load Forecasting and Their Robustness to Noise. Energies 2021, 14, 7952. [Google Scholar] [CrossRef]
  51. Yuwei, C.; Kaizhi, W. Prediction of satellite time series data based on long short term memory–autoregressive integrated moving average model (LSTM-ARIMA). In Proceedings of the 2019 IEEE 4th International Conference on Signal and Image Processing (ICSIP), Wuxi, China, 19–21 July 2019; pp. 308–312. [Google Scholar] [CrossRef]
  52. Ramakrishna, R.; Aregay, B.; Gebregergs, T. The comparison in time series forecasting of air traffic data by ARIMA, radial basis function and Elman recurrent neural networks. Res. Rev. J. Stat. 2018, 7, 75–90. [Google Scholar]
  53. Saboia, J. Autoregressive integrated moving average (ARIMA) models for birth forecasting. J. Am. Stat. Assoc. 1977, 72, 264–270. [Google Scholar] [CrossRef]
  54. Khashei, M.; Bijari, M.; Ardali, G.A.R. Hybridization of autoregressive integrated moving average (ARIMA) with probabilistic neural networks (PNNs). Comput. Ind. Eng. 2012, 63, 37–45. [Google Scholar] [CrossRef]
  55. Subhash, N.N.; Minakshee, P.M. Forecasting telecommunications data with ARIMA models. In Proceedings of the 2015 International Conference on Recent Advances in Engineering & Computational Sciences (RAECS), Chandigarh, India, 21–22 December 2015; IEEE: Piscataway, NJ, USA, 2015; pp. 1–6. [Google Scholar] [CrossRef]
  56. He, P.; Sun, R. Trend Analysis of Civil Aviation Incidents Based on Causal Inference and Statistical Inference. Aerospace 2023, 10, 822. [Google Scholar] [CrossRef]
  57. Schneider, P.; Xhafa, F. Anomaly Detection: Concepts and Methods. In Anomaly Detection and Complex Event Processing over IoT Data Streams; Schneider, P., Xhafa, F., Eds.; Academic Press: Cambridge, MA, USA, 2022; pp. 49–66. [Google Scholar] [CrossRef]
  58. Hamed, K.H.; Rao, A.R. A Modified Mann–Kendall Trend Test for Autocorrelated Data. J. Hydrol. 1998, 204, 182–196. [Google Scholar] [CrossRef]
  59. Raković, M.; Rodrigo, M.M.; Matsuda, N.; Cristea, A.I.; Dimitrova, V. Towards the Automated Evaluation of Legal Casenote Essays. In Artificial Intelligence in Education. AIED 2022; Rodrigo, M.M., Matsuda, N., Cristea, A.I., Dimitrova, V., Eds.; Lecture Notes in Computer Science; Springer: Cham, Switzerland, 2022; Volume 13355, pp. 139–151. [Google Scholar] [CrossRef]
  60. Oliveira, J.M.; Ramos, P. Evaluating the Effectiveness of Time Series Transformers for Demand Forecasting in Retail. Mathematics 2024, 12, 2728. [Google Scholar] [CrossRef]
  61. Kontopoulou, V.I.; Panagopoulos, A.D.; Kakkos, I.; Matsopoulos, G.K. A Review of ARIMA vs. Machine Learning Approaches for Time Series Forecasting in Data Driven Networks. Future Internet 2023, 15, 255. [Google Scholar] [CrossRef]
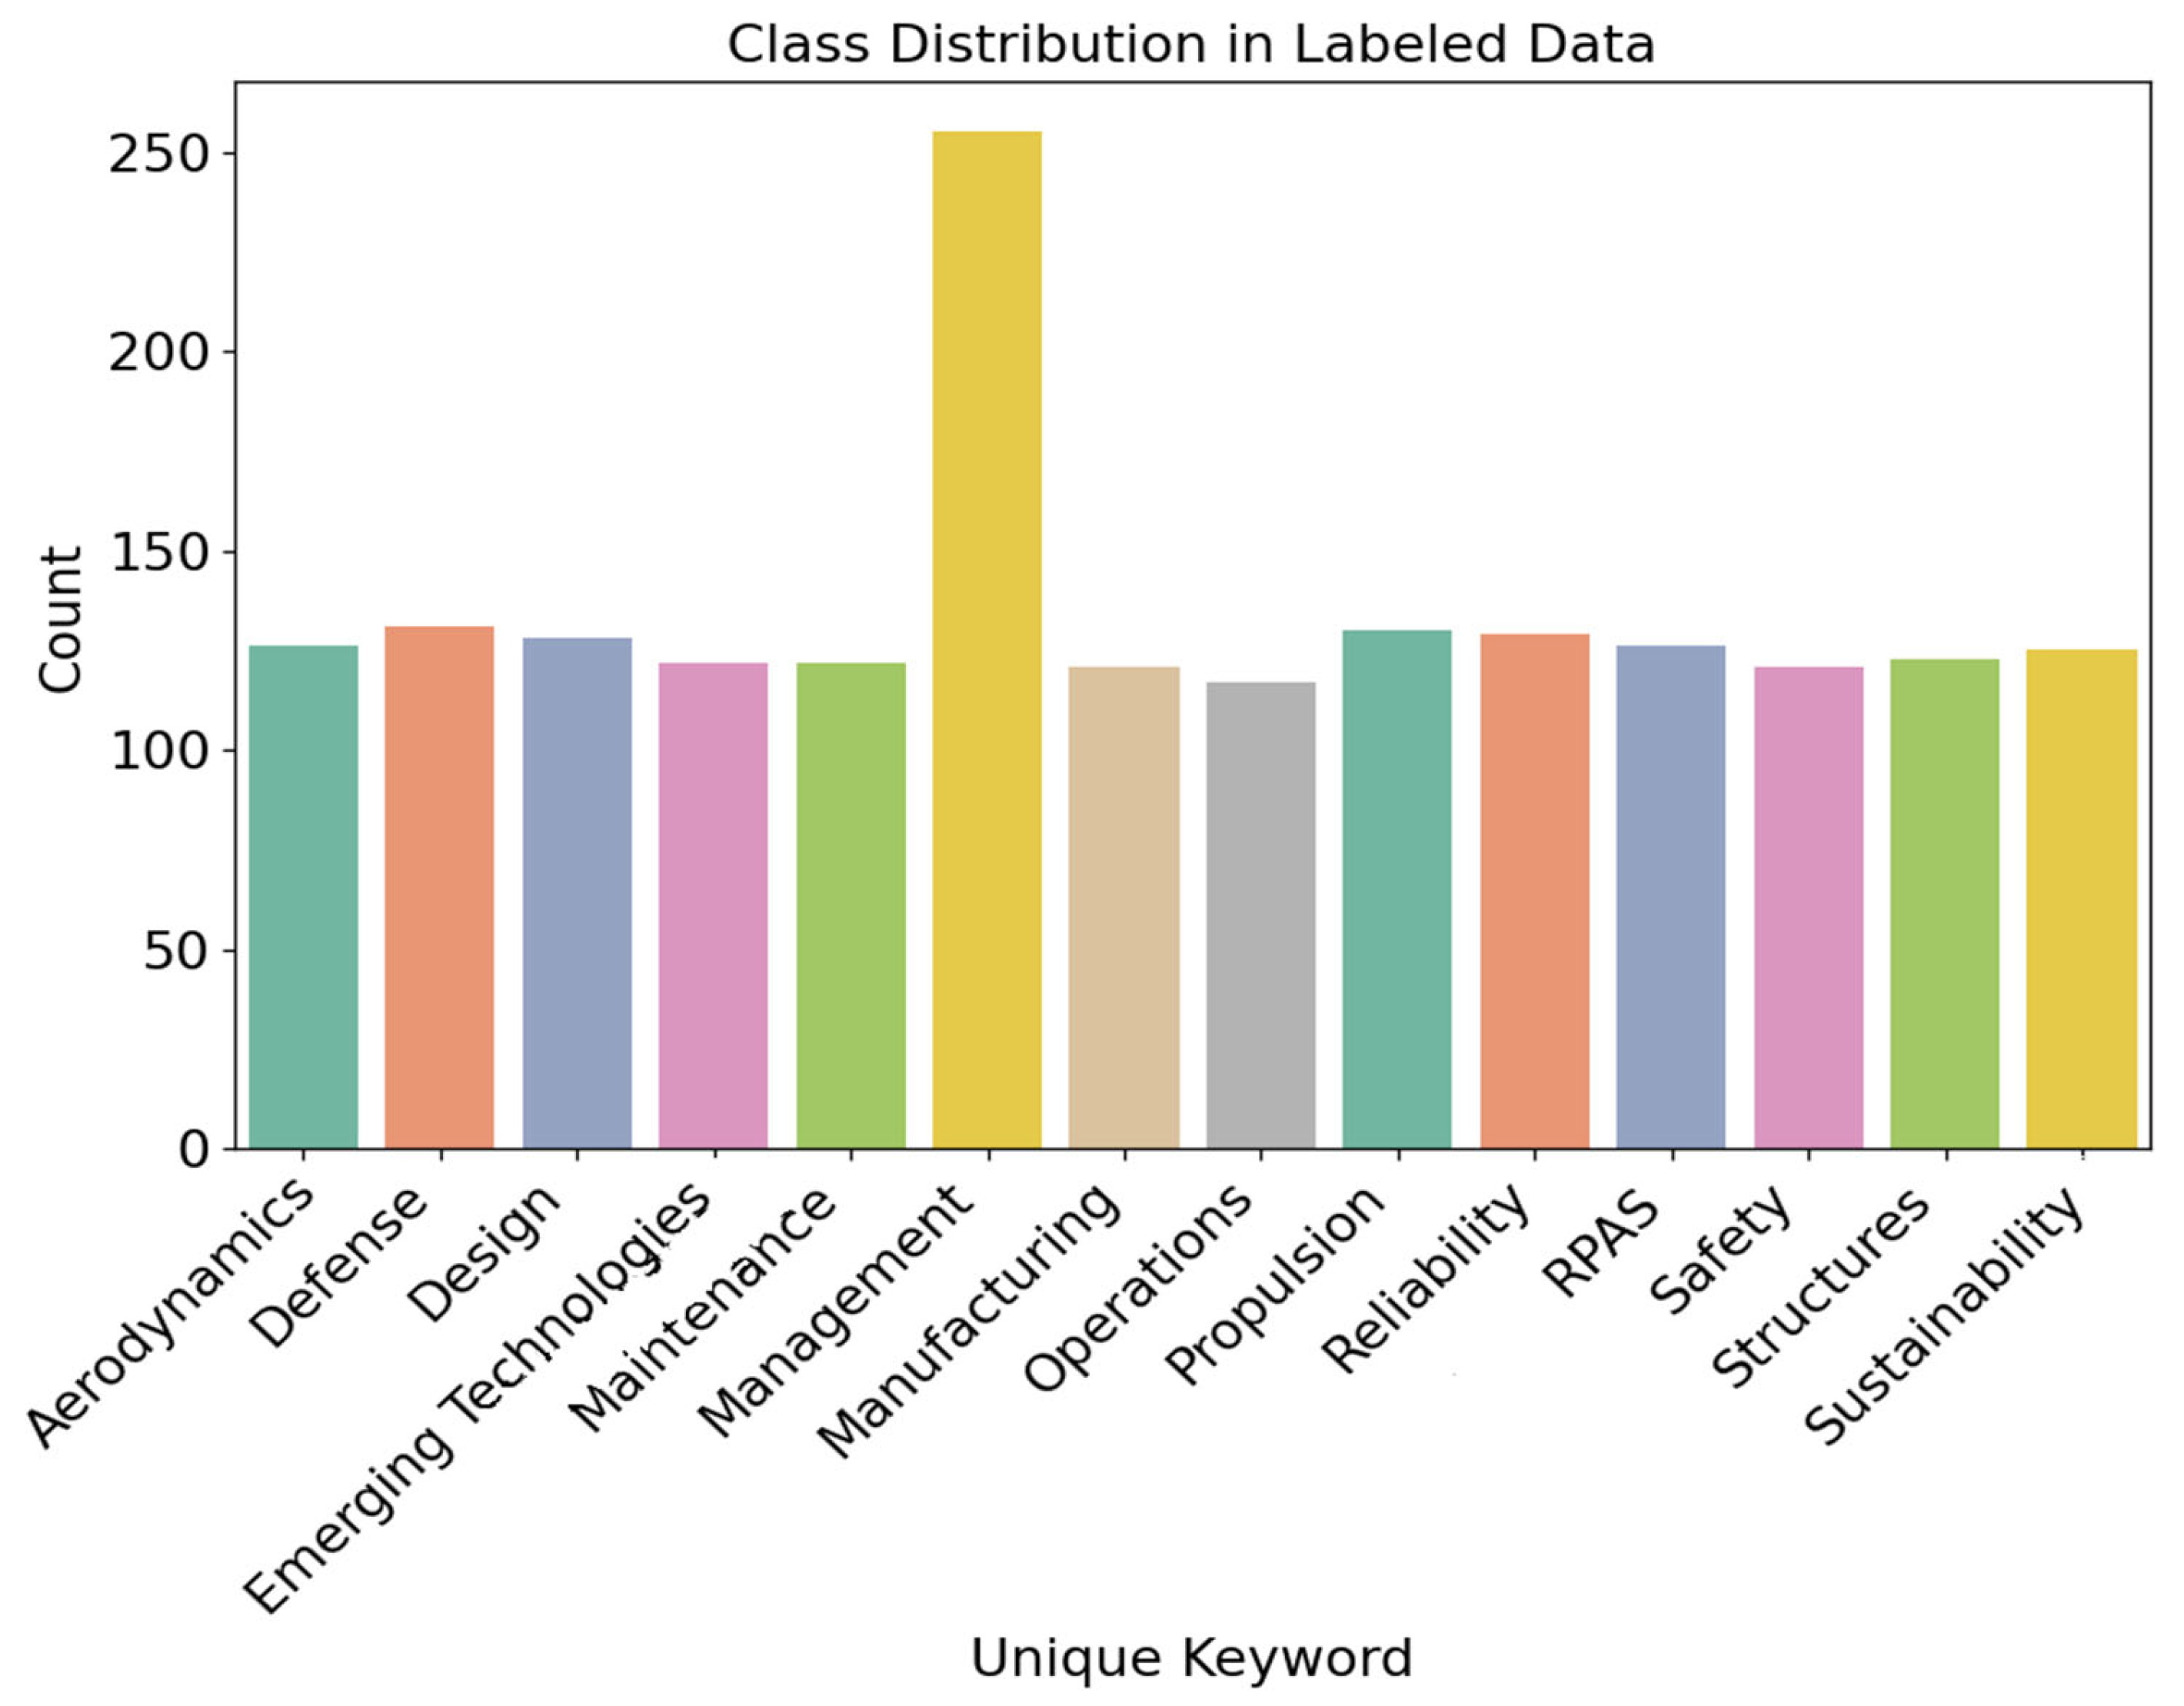
Figure 1. Labeled data for A-BERT model training.
Applsci 15 09403 g001
Figure 2. Data preprocessing pipeline flowchart.
Applsci 15 09403 g002
Figure 3. Normalized Confusion Matrix from A-BERT training dataset.
Applsci 15 09403 g003
Figure 4. ROC curve from A-BERT training dataset.
Applsci 15 09403 g004
Figure 5. Precision–recall curve from A-BERT training dataset.
Applsci 15 09403 g005
Figure 6. Comparison between A-BERT and RF: accuracy (a), AUC (b), precision (c), and recall (d) over 500 epochs.
Applsci 15 09403 g006
Figure 7. A-BERT’s results for different classes: (a) Aerodynamics, (b) Defense, (c) Design, (d) Emerging Technologies, (e) Maintenance, (f) Management, (g) Manufacturing, (h) Operations, (i) Propulsion, (j) RPAS, (k) Reliability, (l) Safety, (m) Structures, (n) Sustainability.
Applsci 15 09403 g007aApplsci 15 09403 g007b
Table 1. Collected papers from Web of Science.
YearNo.
Papers
YearNo.
Papers
YearNo.
Papers
YearNo.
Papers
YearNo.
Papers
2000143720051636201019802015194320201895
2001149820061716201118762016196220211964
2002142920071858201219732017196220221967
2003143920081954201319002018195320231977
2004167120091918201419812019196120241973
Table 2. Performance indicators comparing A-BERT and RF.
ClassA-BERTRandom Forest
F1 ScoreAUCPrecisionAccuracyF1 ScoreAUCPrecisionAccuracy
Aerodynamics0.890.9787.6%87.3%0.901.0087.2%86.5%
Defense0.951.000.961.00
Design0.830.970.790.98
Emerging Technologies0.891.000.891.00
Maintenance0.890.970.850.98
Management0.650.920.650.97
Manufacturing0.900.990.910.99
Operations0.810.980.800.98
Propulsion0.900.990.911.00
RPAS0.930.980.971.00
Reliability0.890.970.920.99
Safety0.890.990.870.99
Structures0.890.980.850.99
Sustainability0.910.990.840.99
Table 3. Consolidated form for A-BERT + ARIMA.
Class/Years200020012002200320042005200620072008200920102011201220132014
Aerodynamics55645175609491838095127108118143130
Defense6687768312610070991158510870797469
Design170124123114141169139148132141151159139145154
Emerging Technologies7182897711095115122140135112105138163156
Maintenance59717588677510095116117124102104102105
Management199208194205216203211226269211240300266231304
Manufacturing505665595556676152537250636267
Operations8196586965687670777695841069982
Propulsion8479102661059773114104117125109139154132
RPAS6137425373716193102537186998688
Reliability39594563765378879112297123978882
Safety121131134137167155167182168172177158164134156
Structures189222226233220233291279302323262248258234234
Sustainability192181149122189167175199205218219174203185222
Class/Years201520162017201820192020202120222023202420252026202720282029
Aerodynamics179183175171193222189189209172189186182187183
Defense645554474752475938414942434543
Design1129914110511488939273999091919191
Emerging Technologies137203159193201184212224238268253257259256258
Maintenance10988103987978789279948987898989
Management302280272274202217241246184136180191164167180
Manufacturing838887977880826663727067696969
Operations1001018686931001026997717785708573
Propulsion170146183169222222248269316305341343368376395
RPAS125101919984919410582809493878891
Reliability1027784768761746777607462736272
Safety11212611213914310512897108738769756669
Structures205222241226238233208208217361313262275293290
Sustainability143193174173180162168184196141174171170170170
Disclaimer/Publisher’s Note: The statements, opinions and data contained in all publications are solely those of the individual author(s) and contributor(s) and not of MDPI and/or the editor(s). MDPI and/or the editor(s) disclaim responsibility for any injury to people or property resulting from any ideas, methods, instructions or products referred to in the content.