Article

Modulating Effects of Urbanization and Age on Greenspace–Mortality Associations: A London Study Using Nighttime Light Data and Spatial Regression

1
School of GeoSciences, University of Edinburgh, Edinburgh EH8 9YL, UK
2
School of Management, Nanjing University of Posts and Telecommunications, Nanjing 210023, China
*
Author to whom correspondence should be addressed.
Appl. Sci. 2025, 15(17), 9328; https://doi.org/10.3390/app15179328 (registering DOI)
Submission received: 16 July 2025 / Revised: 22 August 2025 / Accepted: 24 August 2025 / Published: 25 August 2025

Abstract

Urban greenspace exposure associates with improved health outcomes, particularly chronic disease mitigation. Based on the need to characterize spatial heterogeneity in the health benefits of urban greenspaces, this study quantified the association between greenspace accessibility and chronic disease mortality in London, while examining the modulating effects of urbanization and age. Utilizing nighttime light (NTL) data to define urbanization gradients and road-network analysis to measure greenspace accessibility, we applied geographically weighted regression (GWR) across 983 neighborhoods. Key findings reveal that over 60% of central London residents live within 300 m of greenspace, yet 20% fall short of WHO standards. Greenspace accessibility showed significant negative associations with standardized mortality ratios for both cancer (β = −0.0759) and respiratory diseases (β = −0.0358), and this relationship was more pronounced in highly urbanized areas and neighborhoods with higher working-age populations. Crucially, central urban zones show amplified effects: a 100 m accessibility improvement was associated with a potential reduction in cancer deaths of 1.9% and in respiratory disease deaths of 2.4% in high-sensitivity areas. Urbanization levels and working-age population proportions exert significantly stronger moderating effects on greenspace–respiratory disease relationships than on cancer outcomes. While observational, our findings provide spatially explicit evidence that the greenspace–mortality relationship is context-dependent. This underscores the need for precision in urban health planning, suggesting interventions should prioritize equitable greenspace coverage in highly urbanized cores and tailor functions to local demographics to optimize potential co-benefits. This study reframes understanding of greenspace health benefits, enhances spatial management precision, and offers models for healthy planning in global high-density cities.

1. Introduction

Within contemporary scholarship, “urban greenspace” encompasses designated vegetated areas—including grasslands, woodlands, and parks—integrated into urban settings for aesthetic, landscaping, and recreational purposes [1,2]. Accelerating global urbanization presents urban planners and policymakers with the challenge of enhancing resident well-being through sustainable interventions [3]. The World Health Organization (WHO) [4] and a recent UK government report [5] on greenspaces have also highlighted the importance of greenspaces in urban environments for sustainable development as well as the health of residents. Provisioning high-quality urban greenspaces represents a key strategy, given robust evidence of their health benefits [6]. Greenspaces contribute to enhanced physical health, including cardiovascular disease prevention [7,8], reduced respiratory mortality [9] and obesity mitigation [10,11]. They further support mental well-being by elevating subjective well-being and reducing anxiety symptoms [12,13,14]. Furthermore, these spaces advance social equity by providing equitable access to recreational amenities and social interaction opportunities, thereby fostering community cohesion [15,16].
Mounting evidence indicates greenspace exposure reduces cause-specific mortality, particularly for chronic conditions such as cancer [17] and respiratory disease [18,19,20]. Proposed mechanisms include cancer risk reduction via increased physical activity opportunities, stress alleviation, mood regulation, and mental health protection [21], and respiratory benefit mediation through localized air quality improvement (e.g., pollution and allergen reduction) [22,23]. Greenspace exposure is frequently operationalized via coverage metrics or proximity-based counts within predefined buffers [24,25,26,27]. Alternative indicators, such as land-use-derived residential greenspace area, have also been linked to mortality [28,29]. However, such metrics often neglect actual greenspace utilization patterns. Crucially, health benefits primarily accrue through visitation and activity engagement [30], rather than just considering the size and number of greenspaces [31]. This emphasizes the positive contribution that greenspace accessibility can make to residents’ health outcomes [32,33,34]. Accessibility is conventionally quantified using Euclidean distance [35,36,37]. Contemporary research increasingly employs road-network distance analysis, as it more accurately reflects resident mobility [38,39]. Threshold standards for accessibility remain divergent. The World Health Organization [40] advocates for greenspaces of 0.5–2 hectares within 300–500 m of residences to meet basic activity needs. In England, the greenspace accessibility standard is instead designed to have at least one greenspace of no less than 0.5 ha within 200 m of a settlement, as longer distances are considered to reduce greenspace use [41].
In addition, there are challenges in studying the relationship between greenspace accessibility for chronic diseases mortality: they both vary spatially across socio-economic gradients [25,42,43,44]. Residents in socio-economically deprived areas often derive greater health benefits from greenspaces, attributable to higher baseline environmental pollution exposure and restricted mobility [45,46]. Greenspace-associated well-being also varies significantly by age, gender, socio-economic status, and environmental factors—notably urbanization level [47,48]. Thus, the relationship between greenspace accessibility and chronic disease mortality may exhibit spatial heterogeneity [25,42,49]. Most studies report stronger mortality-reduction effects in deprived urban areas [29,50,51], though exceptions exist [42]. Otherwise, evidence regarding age/gender moderation remains inconclusive [26,45]. It is worth noting that urban–rural gradient differences are often overlooked in these analyses [52], which may also be one of the main reasons for the spatial heterogeneity of the relationship between greening and mortality, as there is evidence that greenspaces are perceived differently by residents in areas with different levels of urbanization [53,54]. Past research in the field of urban greenspace and health has measured urbanicity based on measures of density (population density or residential density) [55] or measures of land cover (e.g., ratio of impervious to pervious surfaces) [53]. But sometimes these data cannot be updated in a timely manner due to their statistical difficulty and the long statistical period, etc. The introduction of nighttime light data can better solve the above problems [56]. Meanwhile, nighttime light data have also been shown to be significantly correlated with local GDP, building area, and other socio-economic indicators, as its brightness can reflect the level of urbanization as well as the level of the economy [57,58].
Based on the gaps in the above studies, we adopt WHO’s Healthy Cities Framework to conceptualize greenspace as a resilience infrastructure [59], positioning greenspaces at the nexus of environmental regulation, behavioral facilitation, and equitable health co-benefits. This tripartite framework elucidates how spatial disparities in urbanization modulate greenspace–mortality associations. The primary aim of this study is not only to quantify the overall association between network-based greenspace accessibility and cause-specific mortality in London but, more innovatively, to explicitly model and map the spatial heterogeneity of this relationship. We hypothesize that the association will be significantly moderated by the level of urbanization and the age structure of the local population. To achieve this goal through experimental design, this study attempts to answer the following research questions:
  • How does spatial accessibility to greenspaces associate with cause-specific mortality across London?
  • Is there any spatial heterogeneity in this association related to urbanization levels and other socio-economic levels?
We argue that improving the description of greening exposure measures into accessibility differences and discussing urban–rural gradient differences in cities is crucial for analyzing the impact of greening on chronic disease mortality, and may also provide some empirical experience of the inconsistent conclusions that have emerged from previous studies in this area. By employing nighttime light data as a continuous measure of urbanicity and spatial regression to reveal local effects, this study aims to reframe the understanding of greenspace health benefits from a static, global phenomenon to a dynamic, spatially explicit one. This approach provides a more nuanced evidence base for targeted, precision public health planning.

2. Materials and Methods

2.1. Study Area

The Greater London area encompasses 33 administrative units (Figure 1), subdivided into 983 Middle-layer Super Output Areas (MSOAs) as geographic units. Each MSOA averages 1.6 km2 in area and contains roughly 2000–6000 households and 5000–15,000 residents [60]. These MSOAs formed the geographic framework for integrating multisource data—including chronic disease mortality rates, greenspace accessibility metrics, and socio-economic indicators—enabling spatially explicit analysis of associations between environmental exposures and health outcomes.

2.2. Research Data

(1)
Chronic diseases mortality data
This study examines mortality from two chronic diseases—cancer and respiratory diseases—selected due to well-established associations with greenspace exposure [17,18,20,21]. Mortality data were sourced from standardized annual reports provided by the Office for National Statistics (ONS) to the Office for Health Improvement and Disparities [61]. This dataset provides indirect Standardized Mortality Ratios (SMRs) for each MSOAs in Greater London (2016–2020). The SMRs are calculated by dividing the total number of observed deaths in the area by the expected number of deaths and multiplying by 100, with the expected death rate calculated by applying the age-specific death rates for England from 2016 to 2020 to the population of each area. This standardization process can help to exclude the effects and biases introduced by factors such as age [62,63].
(2)
Greenspace data
The greenspace data were obtained from Greenspace Information for Greater London (GiGL), who provide the spatial location and boundaries of over 20,000 greenspaces in Greater London. Primary sources include the London Habitat Survey (1986–2008), supplemented by borough surveys, land-use datasets, and community-sourced inputs [64]. In line with the World Health Organization [40] and Natural England [41] guidelines, greenspaces < 0.5 ha were excluded. This threshold aligns with evidence indicating minimum size requirements for measurable health benefits [38,65,66]. The greenspaces in this dataset primarily include those defined as publicly accessible parks and gardens, natural and semi-natural urban greenspaces, green corridors, outdoor sports facilities, allotments, community gardens and urban farms, cemeteries, and civic spaces.
(3)
Geo-spatial data
Road-network data were sourced from Ordnance Survey Open Road [67], providing digital representations of roadway centerlines for nationally and locally classified highways.
Residential areas were derived from OpenStreetMap [68] building data, filtered for residential classifications and converted to GIS polygon format. To operationalize greenspace accessibility calculations, building centroids (generated using ArcGIS Pro 3.4) served as origin points for network analysis.
(4)
Socio-economic indicator
The English Index of Multiple Deprivation 2019 (IMD) was incorporated as a covariate. This granular metric quantifies relative deprivation across Lower-layer Super Output Areas (LSOAs) through seven domains: income, employment, education, health, crime, housing barriers, and living environment [69], with higher scores indicating greater deprivation. Using official methodology provided from the Ministry of Housing, Communities and Local Government [69], IMD values were aggregated to MSOA-level to align with mortality data. The IMD dataset additionally provided population demographics, including age-stratified counts (0–15 years, working-age (18–64), and ≥60 years), enabling subgroup analyses.
(5)
Nighttime light data
Nighttime light data from the Suomi National Polar-orbiting Partnership Visible Infrared Imaging Radiometer Suite (NPP-VIIRS) serve as primary indicators of urbanization gradients across Greater London. Compared to the Defence Meteorological Satellite Program’s Operational Linescan System (DMSP-OLS), NPP-VIIRS offers superior spatial resolution (500 m) and enhanced radiometric sensitivity [58]. Annual mean NPP-VIIRS composites for 2019 were acquired via Google Earth Engine (GEE, Santa Clara County, CA, USA). These radiance values quantify regional urbanization differentials in subsequent analyses.
(6)
Air quality data
Air quality data from The Greater London Authority (GLA) and Transport for London (TFL) were included as a covariate in the spatial analysis model because extensive evidence indicates that air quality has a significant impact on health [70].
All datasets are summarized in Table 1.
To examine spatial heterogeneity in cancer and respiratory disease mortality across urbanization and socio-economic gradients, and to quantify differential effects of greenspace accessibility on mortality, Greater London was stratified into equidistant quartiles (Levels 1–4) according to level of urbanization (URB) (the nighttime light level), overall level of deprivation (IMD), proportion of dependent children aged 0 to 15 years old (CHI), proportion of the working-age population aged 18–58/64 years (Work), and proportion of the elderly aged 60+ years (OLD). The quadratic approach ensures that each hierarchical category contains an almost equal sample size.

2.3. Methods

2.3.1. Greenspace Accessibility Measured by Shortest Road-Network Distance

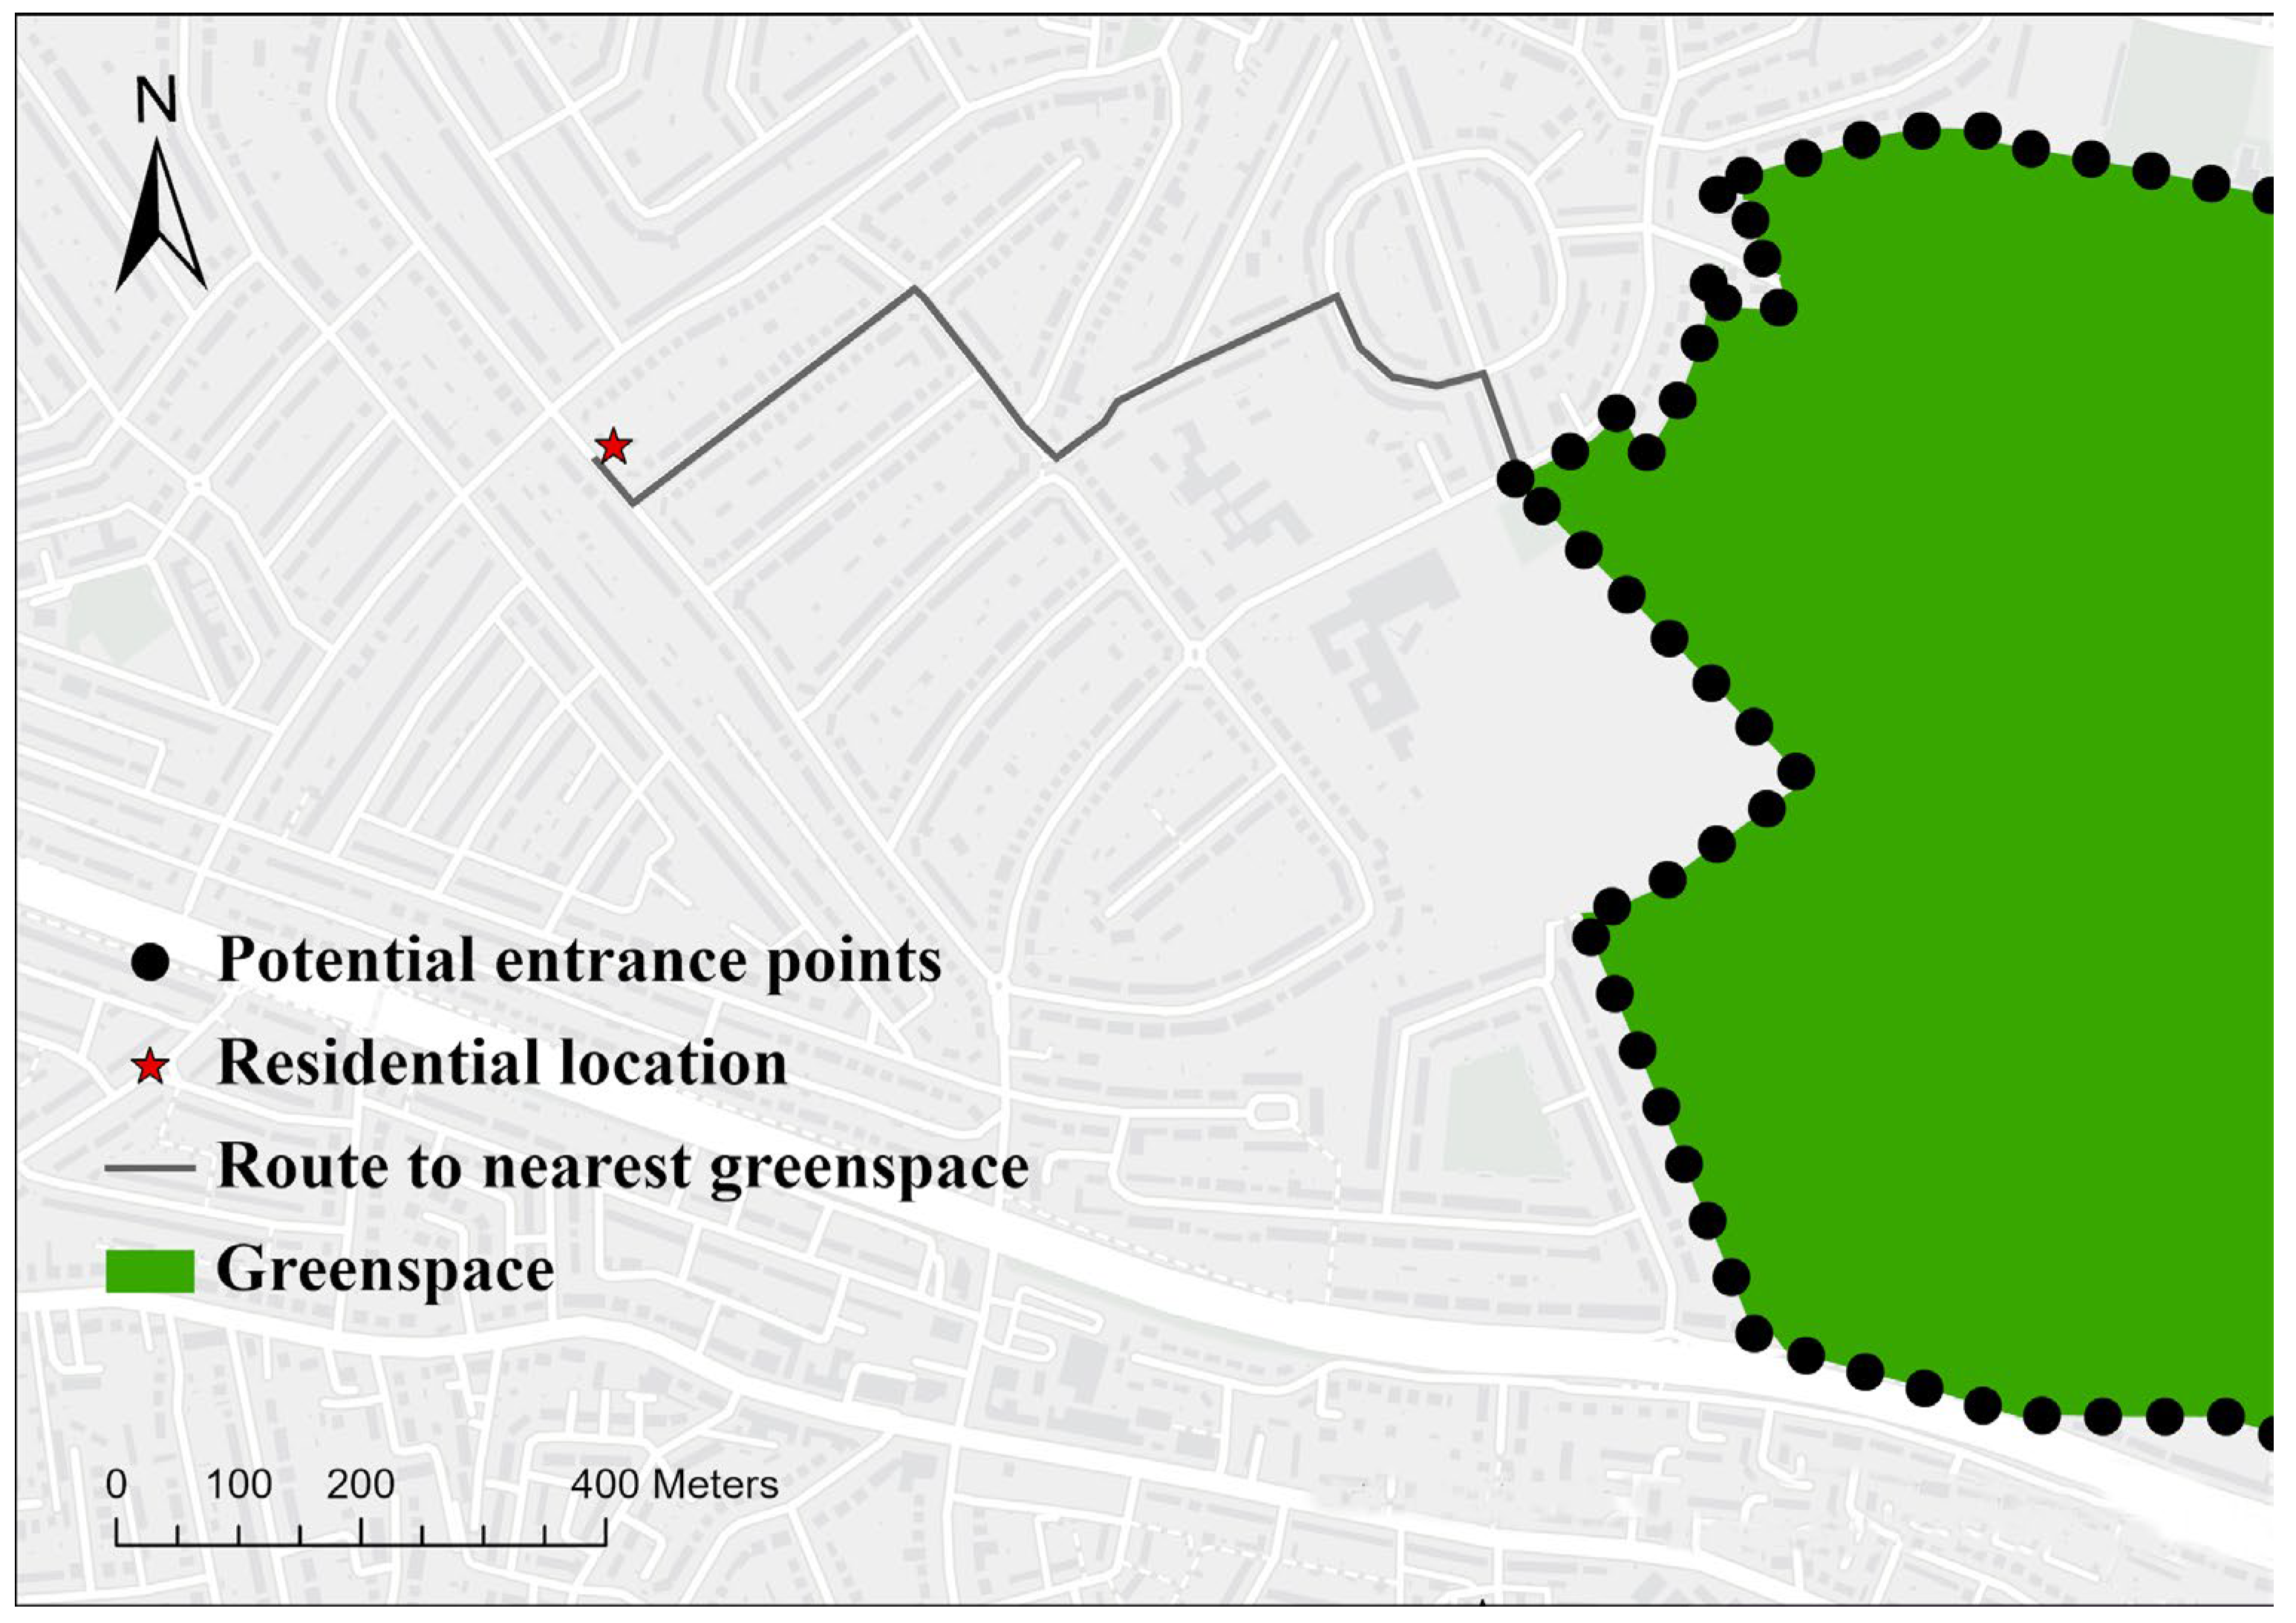
Greenspace accessibility was quantified via the road-network distance from residential locations to nearest greenspaces using spatial network analysis. Firstly, all greenspace boundaries were converted to point features at 50 m intervals to simulate realistic entry points [71]. Secondly, all residential locations and all greenspace boundary points were spatially linked to their nearest road network. A shortest path analysis was carried out using the settlements as the starting point and the greenspace boundary points as the end points to calculate the shortest network distance for each residential location within Greater London to reach a greenspace in its vicinity as a measure of the greenspace accessibility (Figure 2). The mean value of greenspace accessibility was calculated for each residential point within the MSOAs to be used as the main independent variable in the spatial modeling process.
Shortest network analysis is primarily based on Dijkstra’s algorithm, which aims to find the path with the lowest cumulative impedance (cost) between a specified starting point and destination in a network (composed of edges and intersections). The core steps are shown as Algorithm 1:
Algorithm 1 Dijkstra’s algorithm
Step 1 (Initialization): In a directed graph G, divide all vertices into two sets: the set of vertices with determined shortest paths (S) and the set of vertices with undetermined shortest paths (V-S). Initially, S contains only the source vertex, and V-S contains all other vertices.
Step 2 (loop): Find the vertex w closest to the source point in V-S and add it to S.
Step 3 (update): For each vertex u in V-S, if there is an edge (w, u), update the shortest path length of u to:
d u = m i n ( d u ,   d w + w u )
where:
d u denotes the shortest path length from the source vertex to vertex u
d w denotes the shortest path length from the source vertex to vertex w
w u denotes the weight of the edge from vertex w to vertex u
Step 4 (repetition): Repeat steps 2 and 3 until V-S is empty.
In this way, Dijkstra’s algorithm can gradually construct the shortest path from the residential locations to all other greenspace boundary entrances.

2.3.2. Geographically Weighted Regression

To investigate potential associations between greenspace accessibility and chronic disease mortality, we incorporated established covariates with documented relationships to population health outcomes [72,73,74]. These encompassed socio-economic indicators (income level, educational attainment, employment status, health), neighborhood conditions (crime, housing quality, built environment characteristics), and ambient air quality measures (Table 2). To examine the linear relationship between greenspace accessibility and mortality from two chronic diseases (cancer and respiratory diseases), we first constructed univariate ordinary least squares (OLS) regression models. After sequentially testing bivariate associations between each socio-economic variable and both greenspace accessibility and mortality, six variables—income, education, barriers to housing and services, geographic barriers, PM2.5 emissions, and NOx emissions—demonstrated significance (p < 0.01) with no evidence of multicollinearity (VIF < 7.5). These were subsequently included as covariates in multivariate OLS models.
We then developed multivariate OLS models with standardized cancer and respiratory disease mortality rates as dependent variables, and greenspace accessibility alongside the six covariates as independent variables. Model fit statistics (e.g., R2, AIC) were compared before and after adding greenspace accessibility to quantify its contribution.
Spatial autocorrelation in the dependent variables was assessed using Global Moran’s I, a measure that evaluates clustering by comparing values across spatial units against a distance-weighted neighborhood matrix [75,76]. This clustering value is a number between −1 and 1, with values closer to 1 indicating similar values clustered together, values closer to −1 indicating different values clustered together, and 0 indicating no relationship in space. Results indicated significant positive spatial clustering for both cancer mortality (Moran’s I = 0.19, z-score = 15.20, p < 0.01) and respiratory disease mortality (Moran’s I = 0.21, z-score = 16.94, p < 0.01)
Consistent with prior studies on greenspace and health [7,77], these spatial patterns support the use of geographically weighted regression (GWR) to explore localized relationships. GWR employs spatial distance-based weighting to estimate location-specific coefficients, thereby capturing non-stationary associations between greenspace accessibility and mortality [78,79]. The basic construction formula for GWR is shown in Equation (2) in the form of Table 3:
y i = β 0 u i , v i + β k u i , v i x i k + ε i
In the general case, a Gaussian kernel function is used to influence the local parameter estimation and weighting scheme. The larger the bandwidth, the larger the coverage of the search and the slower the weights’ decay with distance. In this study, the golden search method was used to determine the appropriate bandwidth for each GWR model, which is expressed as the number of neighbors: 56 neighbors for cancer and 39 neighbors for respiratory diseases.
We employed Geodetector to quantify the explanatory power of urbanization and age demographics on spatial heterogeneity in greenspace–mortality associations. This spatially explicit analytical method detects geographical differentiation and identifies driving factors through a non-linear framework. Its methodologically rigorous advantages include freedom from parametric assumptions and broad applicability across disciplines—demonstrated in social, environmental, and health sciences research [80]. The dependent variable was the local coefficient of greenspace accessibility derived from GWR models. The q-statistic measures the proportion of coefficient variance explained by URB and age demographics stratification.

3. Results

3.1. Descriptive Statistics for Chronic Diseases Mortality

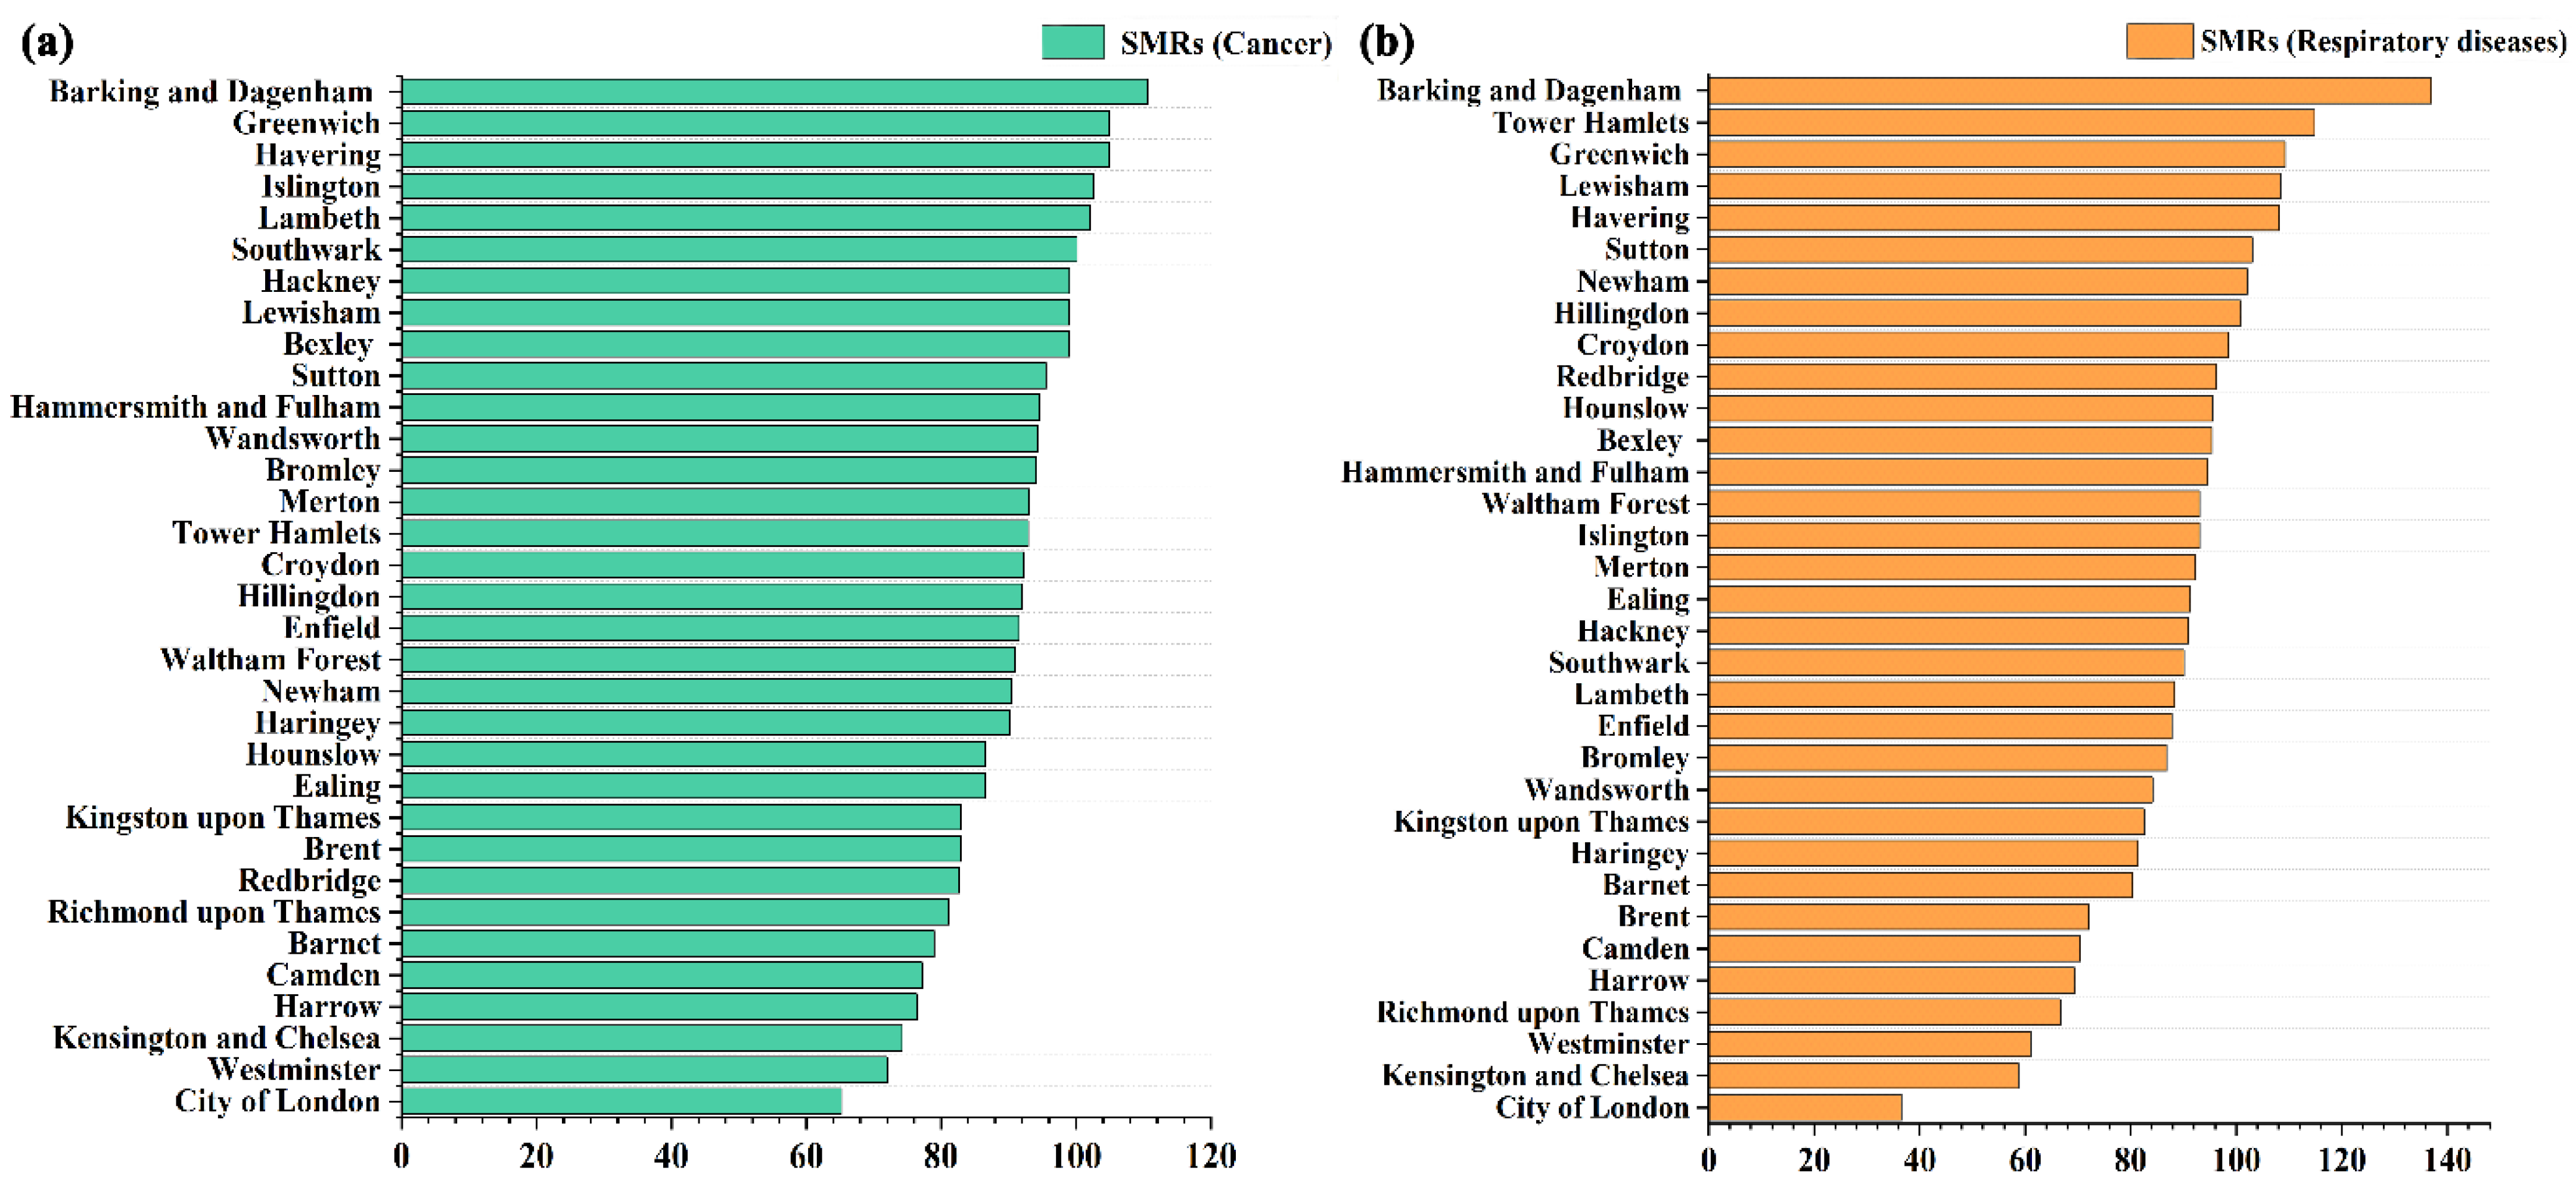
Mortality rates for both chronic diseases exhibit comparable spatial distributions across London’s 33 administrative districts (Figure 3). The City of London demonstrates the lowest standardized mortality ratios (SMRs) for cancer and respiratory diseases, whereas Barking and Dagenham exhibit the highest values for both conditions.
Table 4 presents stratified analyses of cancer and respiratory disease SMRs by five sociodemographic indicators (URB, IMD, CHI, OLD, Work). Notably, regions within the highest urbanization tertile (URB L1) show the greatest mean SMRs for both cancer (92.8) and respiratory diseases (92.6), though differences across urbanization levels were marginal. SMRs for both conditions increased progressively and significantly with rising area deprivation (IMD L1 to L4). Areas characterized by higher proportions of dependent children (CHI) consistently demonstrated elevated SMRs. Conversely, districts with larger elderly populations (OLD L1–L2) exhibited notably lower SMRs compared to those with smaller proportions (OLD L3–L4). Mortality patterns stratified by working-age population proportion (Work) showed no clear stratification across categories.

3.2. Greenspace Accessibility

Greenspace accessibility exhibits significant spatial heterogeneity across London (Figure 4). A continuous corridor of low accessibility (exceeding 600 m) characterizes outer suburban districts (e.g., Enfield, Havering, Bromley). Medium-low accessibility areas (>300 m) are evident in central-western sectors (notably near Brent), while high accessibility zones (<300 m) concentrate within the urban core.
Getis-Ord Gi* analysis confirmed significant spatial clustering of accessibility (Figure 4c). Five statistically significant cold spots (p < 0.01), indicating low accessibility clusters, were identified, averaging over 475 m. These predominantly occur in peripheral suburbs (e.g., Enfield, Bexley, Redbridge), with a notable exception encompassing Westminster and Brent in central-western London—potentially attributable to high residential density and insufficient greenspace provision. Conversely, five significant hot spots (p < 0.01), denoting high accessibility, averaged below 180 m.
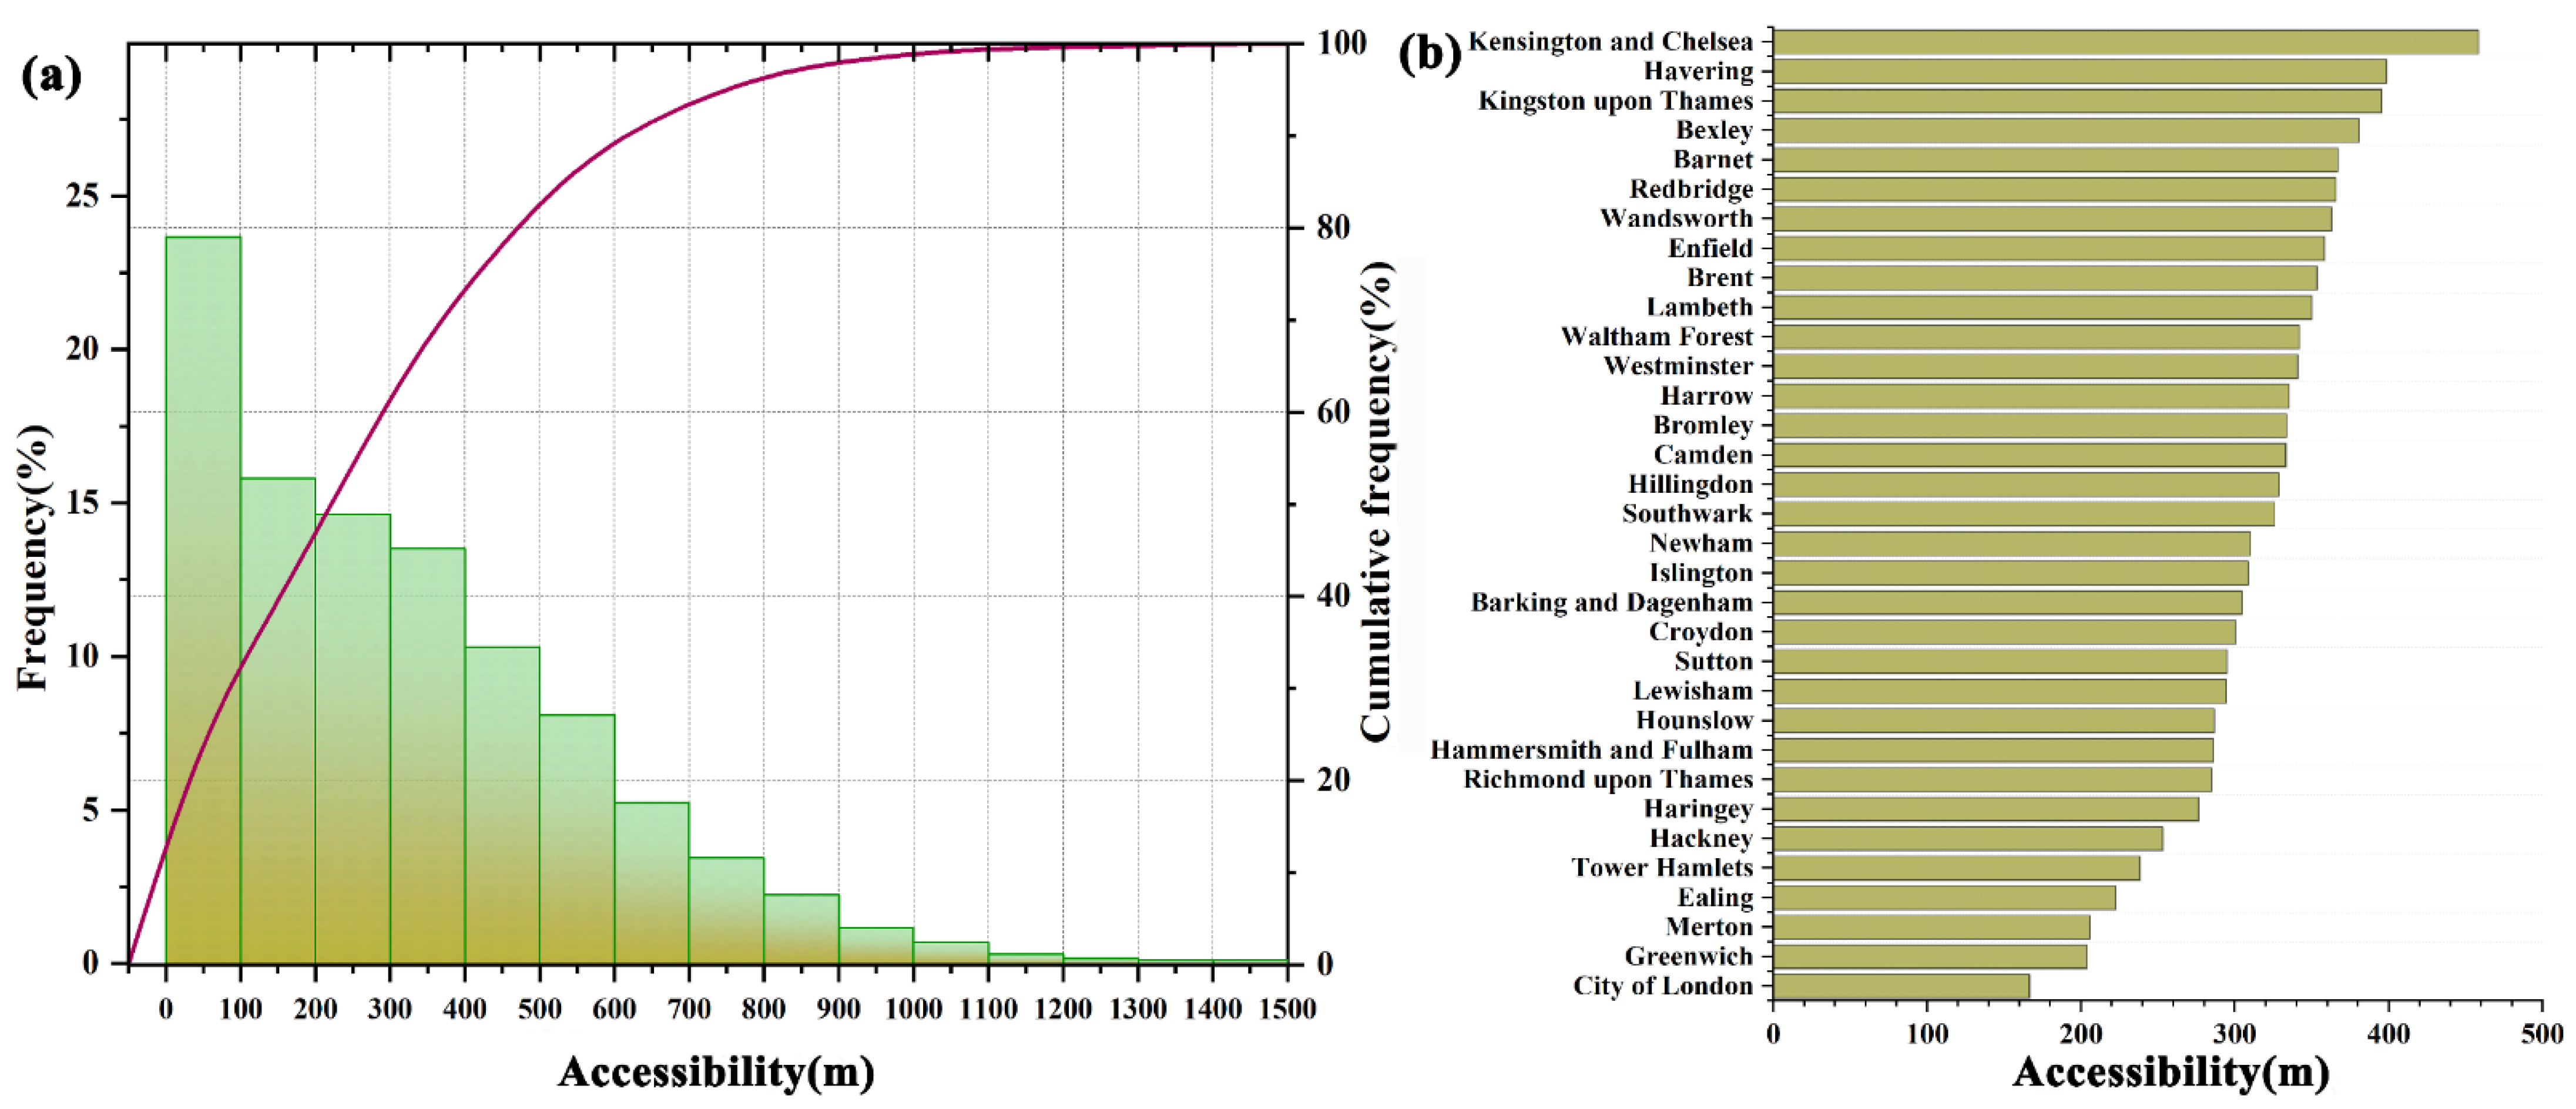
Cumulative distribution analysis reveals that over 60% of residents access the nearest greenspace within 300 m, exceeding 80% within 500 m (Figure 5a). Conversely, fewer than 20% exceed the 500 m WHO [40] accessibility standard. The mean greenspace accessibility is 315 m (range: 315–1498 m). District-level analysis (Figure 5b) identifies Kensington and Chelsea as having the lowest mean accessibility (>450 m), whereas the City of London exhibits the highest (166 m). Twelve districts average below 300 m, whereas ten exceed 350 m. In addition, over 70% of residents could reach the nearest greenspace within 400 m, which is consistent with the Greater London Authority report (74%) [81]. This confirms to a certain extent the robustness of our greenspace accessibility calculation method and results.

3.3. Spatial Associations Between Greenspace Accessibility and Standardized Mortality Ratios

Following covariate selection based on univariate OLS correlations and multicollinearity diagnostics, greenspace accessibility—alongside income, education, barriers to housing and services, geographic barriers, PM2.5 emissions, and NOx emissions—was incorporated into multivariate OLS models. Table 5 demonstrates significant negative associations (p < 0.05) between greenspace accessibility and both cancer and respiratory disease SMRs in both univariate and adjusted multivariate models.
Table 6 presents greenspace coefficient estimates (spatial means) from univariate and multivariate GWR models. Greenspace accessibility exhibits significant negative effects on cancer (β = −0.0759) and respiratory disease SMRs (β = −0.0358). The GWR model substantially outperforms OLS in explanatory power (cancer R2 = 0.4654 vs. 0.3013; respiratory disease R2 = 0.4978 vs. 0.2920), establishing its superiority for analyzing these relationships. Spatial autocorrelation analysis of residuals using Moran’s I showed non-significant values for cancer (I = 0.043, p = 0.346) and respiratory models (I = 0.017, p = 0.144), indicating random residual distribution and valid model fit without spatial bias.
In order to visualize the spatial variation in the impact of changes in greenspace accessibility on the SMRs of the two diseases, the distribution of coefficients for each model was plotted (Figure 6). Cancer SMR coefficients range from −0.21 to 0.02 (mean = −0.0759), while respiratory disease coefficients range from −0.18 to 0.08 (mean = −0.0358). GWR results confirm significant spatially varying negative association. In high-sensitivity areas (Kensington & Chelsea, Newham, and Hillingdon for cancer; Southwark and Kensington & Chelsea for respiratory disease), coefficients reached −0.21 and −0.18, respectively. Model estimates suggest that a 100-m reduction in accessibility distance could lower actual deaths by 1.9% (cancer) and 2.4% (respiratory disease) relative to expected mortality in these localities.
While globally protective, the influence of greenspace accessibility exhibits marked spatial variation across Greater London. For cancer SMRs (Figure 6c), 59% of areas show significant negative associations (p < 0.05), 4% show significant positive associations (p < 0.05), and 37% are non-significant. Significant negative effects cluster in western and eastern sectors, with isolated positive effects in central Hackney and Haringey. For respiratory disease SMRs (Figure 6d), 46% show significant negative effects, 18% show significant positive effects, and 36% are non-significant. Positive effects primarily occur in an outer corridor encompassing Bexley, Croydon, Hounslow, Barnet, Haringey, Newham, and Redbridge.
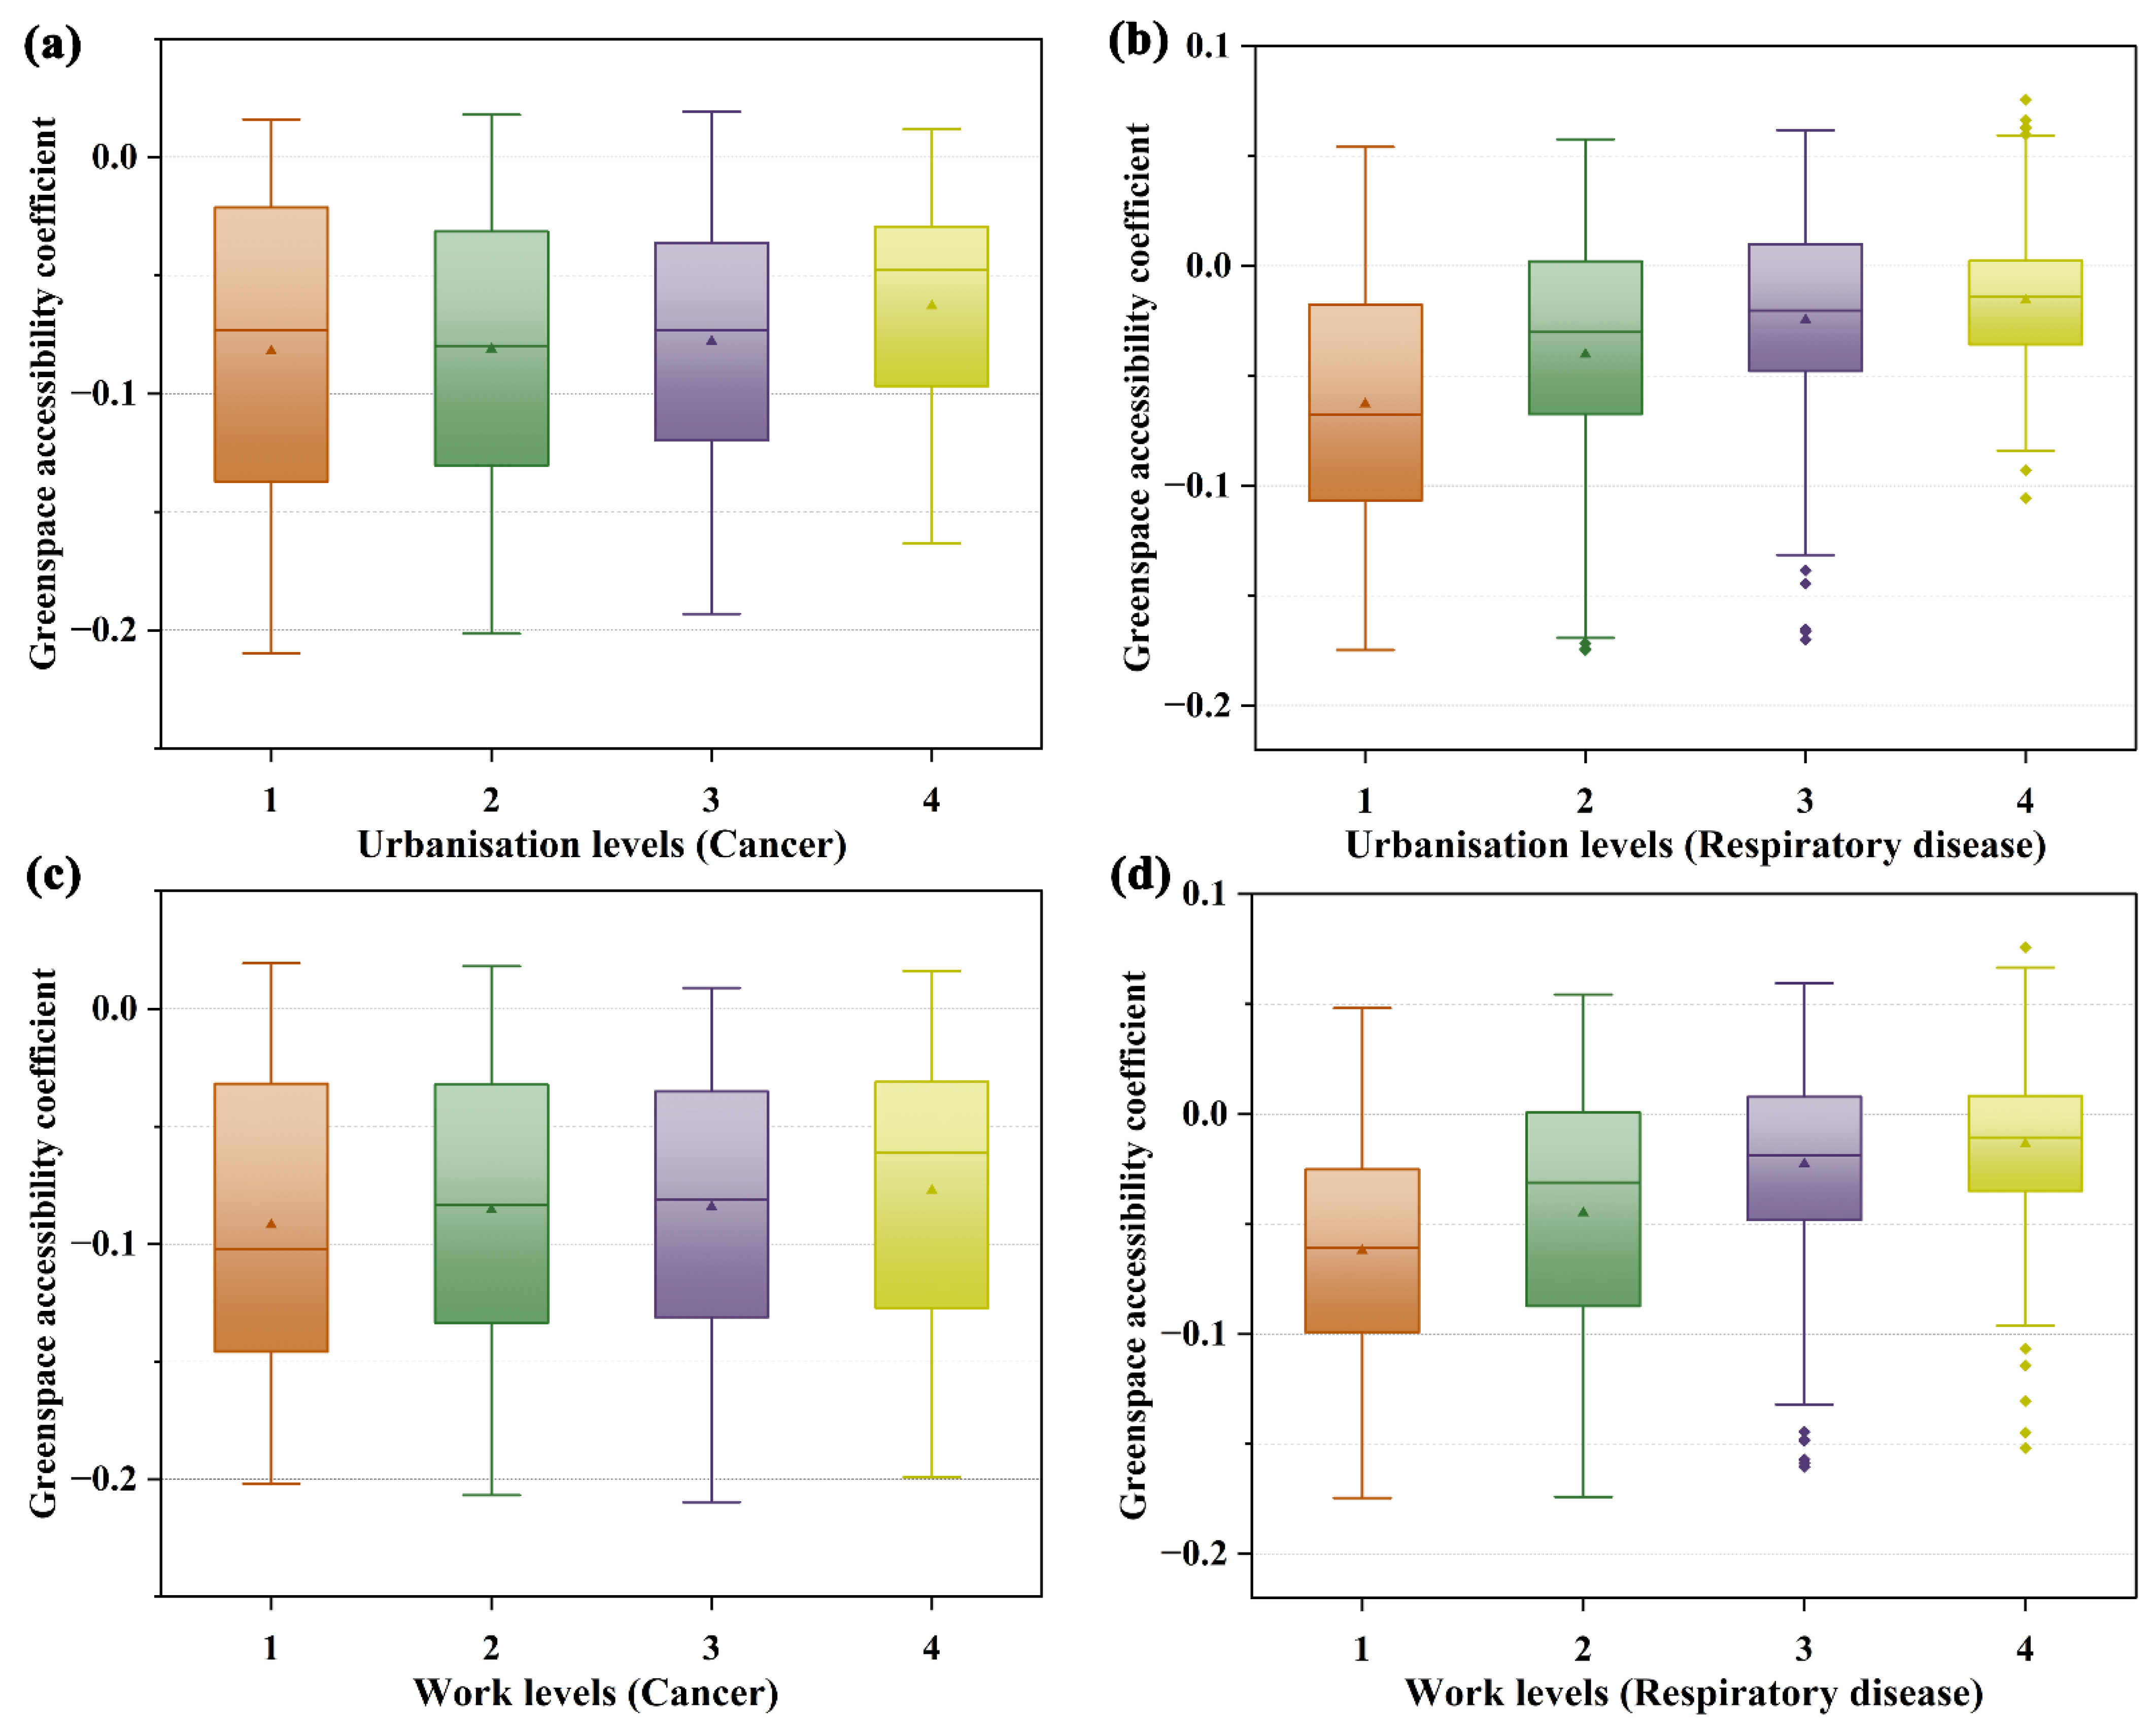
To examine spatial heterogeneity in greenspace accessibility coefficients across urbanization levels and age demographics, we conducted stratified analyses by quartile. Figure 7a,b illustrate coefficient distributions for cancer and respiratory disease SMR models across urbanization levels (L1–L4). A consistent pattern emerges: as urbanization intensity increases (L4 to L1), the negative association between greenspace accessibility and SMRs strengthens. Mean coefficients decline from −0.0629 to −0.0820 (cancer) and −0.0157 to −0.0628 (respiratory diseases). Similarly, Figure 7c,d reveal enhanced negative association in areas with higher working-age populations (18–59/64 years). Progressive increases in working-age proportion (L4 to L1) correspond to stronger negative associations, with mean coefficients decreasing from −0.0771 to −0.0919 (cancer) and −0.0136 to −0.0621 (respiratory diseases). No significant trends emerged for deprivation (IMD), dependent children (CHI), or elderly populations (OLD).
Kruskal–Wallis tests confirmed significant inter-group differences (p < 0.01). The post hoc Bonferroni comparisons revealed specific pairwise contrasts.
Urbanization levels: For cancer mortality, coefficients in URB-L1, URB-L2, and URB-L3 were significantly more negative than URB-L4 (p < 0.01). For respiratory disease, coefficients in URB-L1 were significantly more negative than in URB-L2, URB-L3, and URB-L4 (p < 0.01). Coefficients in URB-L2 were also significantly more negative than in URB-L3 and URB-L4 (p < 0.01).
Work levels: For cancer mortality, coefficients in areas with the highest working-age population (Work-L1) showed stronger negative associations than in Work-L4 (p < 0.01), and no significant differences were found between other groups. For respiratory disease, coefficients in Work-L1 were significantly more negative than in Work-L2, Work-L3, and Work-L4 (p < 0.01). Coefficients in Work-L2 were also significantly more negative than in Work-L3 and Work-L4 (p < 0.01).
Geodetector analysis reveals urbanization level explains 2.23% (q = 0.0223, p < 0.001) of spatial heterogeneity in greenspace coefficients for cancer mortality and 12.24% (q = 0.1224, p < 0.001) for respiratory disease mortality. In contrast, working-age population proportion accounts for 4.43% (q = 0.0443, p < 0.001) and 14.24% (q = 0.1424, p < 0.001) of heterogeneity in cancer and respiratory coefficients, respectively. These differential explanatory powers suggest urbanization and age demographics exert more substantial moderating effects on respiratory mortality relationships.
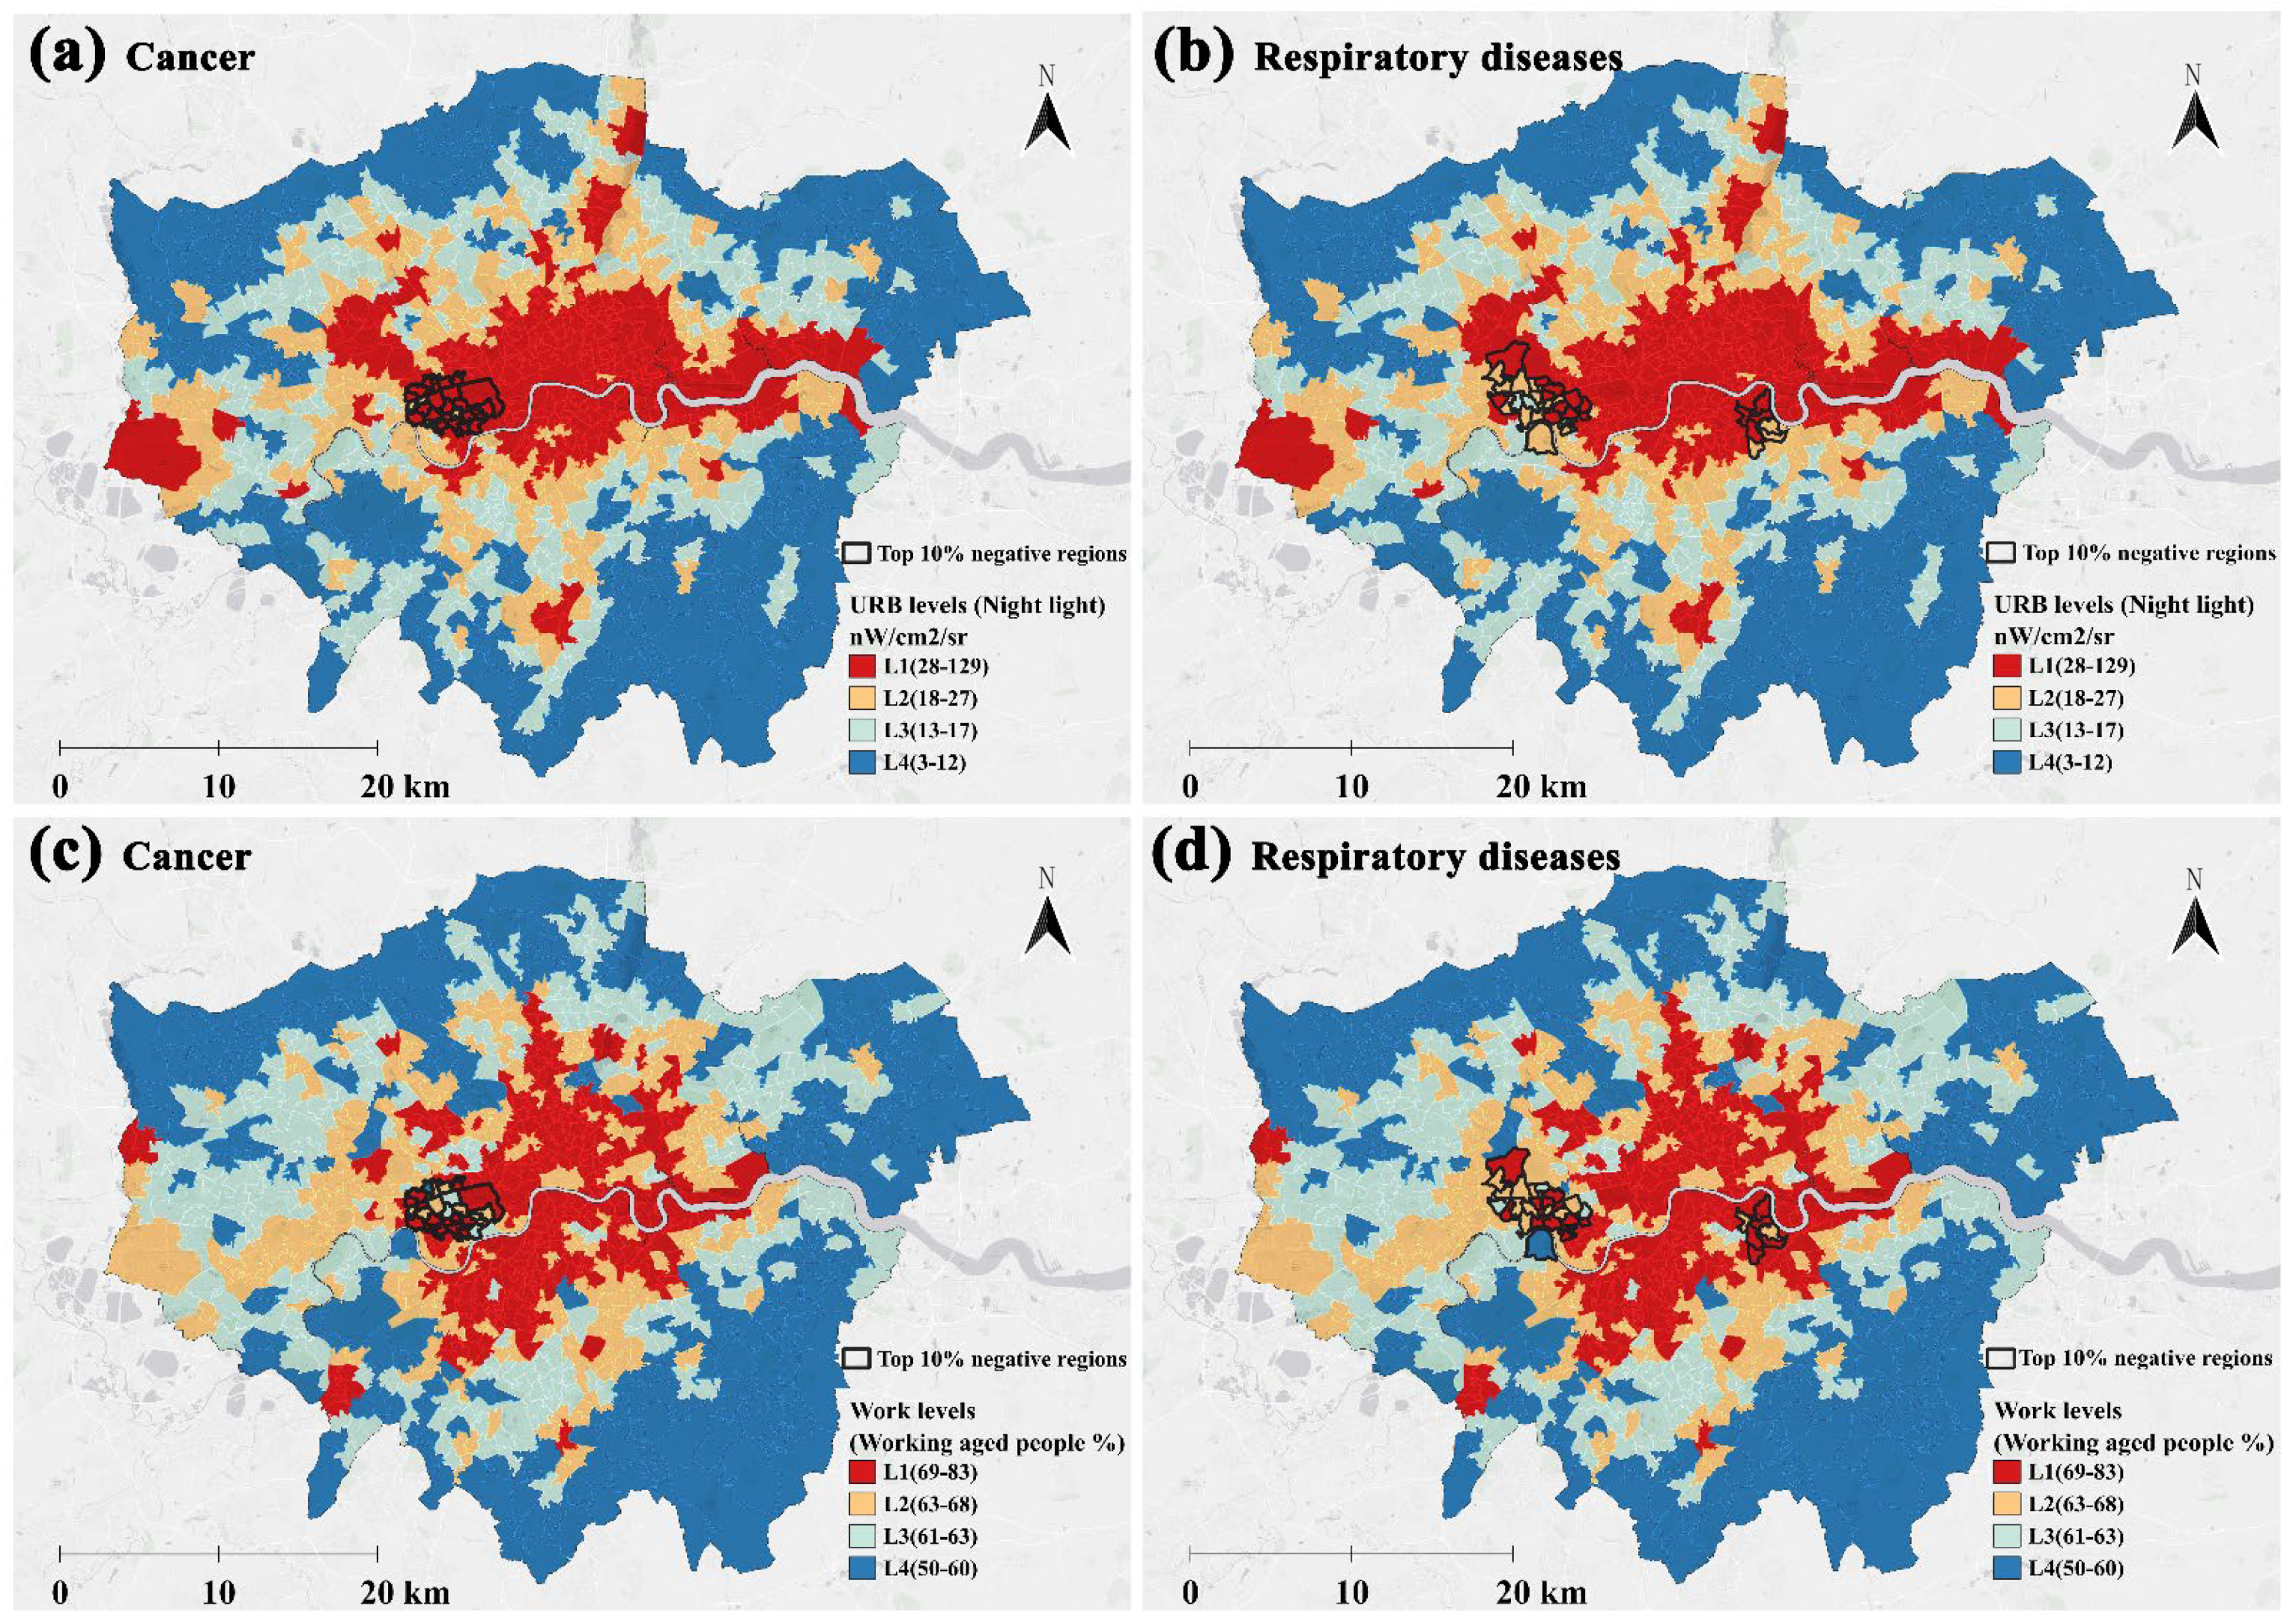
Among the 983 MSOAs in London, the strongest negative effect (top 10%, with coefficients ranging from −0.21 to −0.19) of greenspace accessibility on cancer mortality was observed in 26 regions, with 22 (85%) of these overlapping with the highest urbanization level (Level 1) regions (Figure 8a) and 14 (54%) overlapping with the highest working population proportion (Level 1) regions (Figure 8c). Greenspace accessibility had the strongest negative effect (top 10%, with coefficients ranging from −0.18 to −0.15) on respiratory disease mortality rates in 33 areas, 15 (45%) of which overlapped with the most urbanized areas (Level 1) (Figure 8b), and 17 (52%) of which overlapped with areas with the highest proportion of working-age population (Level 1) (Figure 8d). This further demonstrates the spatial coupling relationship between high urbanization and high working population proportion regions and strong negative effects.

4. Discussion

4.1. The Negative Impact of Greenspace Accessibility on Chronic Disease Mortality Is More Pronounced in Urban Central Areas

This study quantified greenspace accessibility as the distance from residential locations to the nearest greenspace across Greater London, examining its association with standardized mortality rates (SMRs) for cancer and respiratory diseases. Our analyses reveal a significant negative association between greenspace accessibility and mortality rates for both conditions. Crucially, geographically weighted regression (GWR) outperformed ordinary least squares (OLS) models in explanatory power (higher R2 values), establishing its superiority for capturing spatially heterogeneous relationships. Notably, the mean protective coefficient for greenspace accessibility was stronger for cancer (β = −0.0759) than respiratory diseases (β = −0.0358), suggesting a relatively stronger association with cancer mortality.
Spatial mapping of GWR coefficients revealed pronounced geographic heterogeneity in protective effects. The strongest negative associations clustered in central London, attenuating toward peripheral areas in the East, North, and South. This pattern aligns with known gradients in greenspace configuration: Central zones feature smaller, fragmented greenspaces (e.g., residential gardens and pocket parks) with high functional integration into daily life [25], while peripheral areas exhibit larger but less accessible green infrastructure. We posit that centrally located greenspaces confer enhanced protective effects through two interlinked pathways:
  • Proximity advantages: High accessibility enables routine exposure, integrating nature contact into habitual activities [42].
  • Microenvironmental mediation: Fine-grained urban greenery provides critical localized air quality improvements by filtering particulate matter and noxious gases [43]. This mechanism plausibly mitigates risks for pollution-sensitive conditions, including respiratory diseases and specific cancers—particularly lung cancer [82,83], but also emerging evidence links to prostate [84], skin, oral [85], breast [10], and rectal cancers [86].
However, we also observed that greenspaces in specific local areas had a neutral or even negative impact on health outcomes. Previous studies have also reported similar greenspace health outcomes, indicating that greenspaces are not necessarily beneficial in all area [25,87]. We believe that this seemingly strange spatial heterogeneity is unlikely to be spurious and instead points to a meaningful reflection of the complex social and ecological environment in which greenspaces are located. We posit that in areas showing neutral or negative associations with health, factors not captured by our model may be at play. These could include the following:
  • Variation in greenspace quality and function: A highly accessible greenspace in one area might be a well-maintained, multi-functional park encouraging physical activity and social cohesion, while in another area, it might be a less inviting, poorly maintained, or potentially unsafe space, explaining a neutral or even negative association [43,88].
  • Unmeasured local environmental confounders: The spatial variation might capture the uneven distribution of environmental factors we could not measure at this scale, such as localized pollution sources beyond our air quality metrics [87], specific industrial histories, or stark differences in social cohesion [89] and crime rates within the greenspaces themselves [90]. For example, in areas where the environmental stressors overwhelm the restorative capacity of the available greenspace, the expected protective relationship may be diminished, nullified, or even reversed.
  • Population characteristics: The GWR coefficient in a given area represents an average effect for that population. The mix of demographics, health behaviors, and cultural attitudes towards nature in one MSOA likely differs from that of its neighbor, modifying the average benefit derived from greenspace [25].
This pattern underscores that greenspace is not a universal panacea; its health implications are deeply embedded in the local socio-ecological context. Future research should prioritize integrating metrics of greenspace quality, usage patterns, and finer-scale environmental data to further unravel the drivers of this critical spatial context-dependency.

4.2. The Inhibitory Effect of Greenspace Accessibility on Chronic Disease Mortality Becomes Stronger as Urbanization Levels and the Proportion of the Working Population Increase

In terms of the statistical results for the urbanization difference partition, there was a stronger negative correlation between greenspace accessibility and the two disease SMRs in areas with higher levels of urbanization, suggesting that the impact of greenspace on health outcomes for cancer and respiratory diseases is stronger in highly urbanized areas. This is consistent with the results of many previously conducted studies [53,91,92]. Past research has shown that highly urbanized areas are often accompanied by high-stress environments such as the urban heat island effect, noise, and pollution, thus causing residents to suffer from higher levels of attentional demands and chronic sources of stress [93]. These factors make greenspaces in highly urbanized areas more physiologically and psychologically restorative for residents [94]. In addition, greenspaces in areas with high levels of urbanization tend to be more likely to be designed for physical activity and social interaction and to be more pedestrian-friendly [95,96]. Therefore, improving the accessibility of greenspaces in high-urbanization areas is more likely to increase the health benefits for residents than in low-urbanization areas. Our findings substantiate the aforementioned perspective, demonstrating that urban core greenspaces confer significant health benefits through mitigating environmental stressors and facilitating routine physical activity. Consequently, urban policymakers should prioritize proportionate funding allocation toward green infrastructure development and maintenance in highly urbanized zones. Given that the association between greenspace accessibility and chronic disease mortality varies across the urban–rural gradient, it seems sensible to increase government funding for greenspace development in highly urbanized areas, e.g., for greenspace expansion, removal of unnecessary fences, and enhancing connectivity between greenspaces and communities [97]. This is in line with the goals of healthy cities to pursue health equity and efficiency [59].
Our study found that the health benefits of greenspaces were more pronounced in areas with a higher proportion of working-age (18–59/64) groups, and less pronounced in areas with higher proportions of dependent children and older people. This is consistent with the findings of a number of existing studies on the relationship between greenspace use and health outcomes [7,24,51]. We hypothesize that this may be due to the fact that working people need to commute frequently every day, and some even choose to use the greenspace as their workspace, which gives them greater access to the greenspace and extends the health benefits of greenspace accessibility [98]. Contradicting the results of this study, Zhou and Lu [99] found that greenspaces in neighborhoods with higher levels of aging were more likely to reduce cancer and respiratory disease mortality by examining the influence of greenspace morphology on the health effects of greenspaces. A potential reason for this is that greenspace accessibility was chosen as an indicator of residents’ use of greenspace in this study, and the older age group may not be as sensitive to greenspace accessibility as the younger age group due to their limited mobility and activity space. The quality of the greenspace itself may be more sensitive to health outcomes for older people, such as the diversity of ecosystems within the greenspace and a more complex vegetation landscape, as older people have a greater need for sensory experiences [100,101], which would be beneficial in enhancing the positive health impacts of greenspaces for older people [102]. In the case of dependent children, a possible reason why greenspace accessibility did not have a significant impact on their health outcomes is that they visit greenspaces less frequently compared to adults and older adults [103,104], and are therefore less likely to enjoy the health benefits of greenspaces even when they are highly accessible. Another potential reason is that dependent children themselves have a lower prevalence of chronic disease than adults and the elderly [105], and changes in their mortality indicators are barely captured by the impact of greenspaces.
In addition, our Geodetector analysis reveals urbanization levels and working-age population proportions exert significantly stronger moderating effects on greenspace–respiratory disease relationships than on cancer outcomes. This differential aligns with the established understanding of cancer’s multifactorial etiology [84]. Cancer prevention via greenspace exposure appears more substantially mediated by individual-level factors—including smoking behaviors, genetic predisposition, and lifestyle habits [10,106]—whereas respiratory benefits operate predominantly through environmental–physiological pathways. Specifically, greenspaces’ phytoremediation capabilities facilitate rapid biological mediation of air pollutant exposure impacts [107,108].
Based on this, in order to improve the health status of residents with chronic diseases, future greenspace planning and improvement should be targeted and dynamically adjusted according to the age structure of the local community. For areas with a high proportion of working population, the service radius and accessibility should be extended through greenspace extension, expansion and removal of non-essential walls; for areas with a high proportion of elderly people, attention should be paid to improving the internal quality of greenspace, such as the configuration of aging-friendly facilities, natural landscape design, and the maintenance of biodiversity [103]; and for areas with a high proportion of dependent children, attention should be paid to enhancing the attractiveness of the greenspace itself, for example, by adding basketball courts, skateboard parks, outdoor fitness areas, and other sports venues [103].

4.3. Strengths and Limitations

This study replaced the greenspace exposure indicators commonly used in traditional greenspace and population health studies with accessibility indicators that take more account of actual greenspace use, and obtained a number of results that are consistent with previous studies [25]. However, the effect sizes were modest, consistent with the understanding that health outcomes are influenced by a complex multitude of factors, including individual characteristics as well as objective environmental characteristics. The primary and novel contribution of our analysis lies beyond this average effect; it lies in the demonstration of significant spatial non-stationarity using GWR. The fact that the association shifts from strongly protective to neutral or even detrimental within a few kilometers (Figure 6) is a critical finding. It moves the scientific inquiry from the question of “if” there is an association to “where and under what local conditions” the association holds [25,87]. Our stratification and Geodetector analyses provide a compelling explanation for the observed spatial heterogeneity. The stronger negative associations in areas with higher urbanization levels and higher proportions of working-age residents demonstrate that the greenspace–mortality relationship is systematically moderated by these factors. This means the same improvement in greenspace accessibility could have a different public health impact depending on the urbanicity and demographic profile of a neighborhood. This finding critically advances the field beyond one-size-fits-all recommendations.
The first limitation of this study is that as an ecological cross-sectional study, our analysis is inherently limited in its ability to infer causality. Our observed association between greenspaces and health outcomes remains potentially susceptible to unmeasured confounding. While key covariates—including the Multiple Deprivation Index (IMD), age structure, and air quality indicators—were adjusted for, our analysis lacked data on individual-level health behaviors (e.g., smoking, dietary patterns, activity-specific exercise), occupational exposures, and healthcare accessibility/quality [109,110]. Should these spatially structured factors correlate with both greenspace proximity and mortality, they may bias estimates of greenspace’s independent effects. Thus, findings should be interpreted as contextual associations rather than causal evidence that greenspace accessibility directly reduces mortality. Given inherent limitations of observational designs, residual confounding and reverse causality (e.g., selective migration of healthier individuals to greener areas) cannot be entirely excluded. The true causal effect of greenspace accessibility on health needs to be further verified in future studies using more detailed data (such as individual tracking data) and methods that better address endogeneity. Based on this, we explicitly frame our findings as identifying contextual associations and spatial disparities that are plausible and policy-relevant but require confirmation through more robust study designs. We also propose specific future research directions to better address causality, such as utilizing longitudinal data, natural experiments, or individual-level tracking studies. Moreover, in-depth research into the differences in potential biological and behavioral mechanisms among different populations and in different environmental contexts may be key to understanding the reasons behind spatial heterogeneity.
Additionally, our operationalization of greenspace exposure relies solely on accessibility metrics—a proximity-based construct rather than a direct measure of utilization. This approach partially overlooks residents’ actual engagement, as neither high exposure indices nor accessibility measures reflect on-site recreational facilities or capture lived experiences within greenspaces. Combined with the variability in the impact of greenspace accessibility on health outcomes across age-represented areas found in this study, future research should place greater emphasis on evaluating the full range of indicators of greenspace use, such as availability, quality, and attractiveness [52,111], while also considering the actual greenspace needs of different socio-economic groups as well as different age groups [103].
Another shortcoming of the study is that the measurements of greenspace accessibility may be biased, especially for areas on the outskirts of cities. This is because these areas are located on the edge of the study area, and there may be greenspaces closer to the study area that are not included in the accessibility calculation, which may lead to an underestimation of greenspace accessibility in these areas. Using London as the study area only serves as a replicable analytical framework; however, future research should examine diverse cultural settings, distinct urban forms, and varied developmental stages to assess the generalizability of observed spatial heterogeneity patterns in greenspace–health relationships and their underlying mechanisms. This study is inherently cross-sectional in design. While we captured fine-grained spatial heterogeneity in greenspace-mortality associations through geographically weighted regression, our analysis does not account for temporal dynamics. The observed relationships could partially reflect cohort effects or unmeasured temporal confounders.

5. Conclusions

This study employed an integrated methodology—synthesizing nighttime light data, road-network analysis, and geographically weighted regression (GWR)—to quantify the association between greenspace accessibility and chronic disease mortality across London. Our approach advances environmental health research by enabling dynamic socio-demographic stratification analysis, thereby reframing theoretical understanding of how health benefits from greenspaces are spatially modulated within socio-ecological systems. Our findings reveal that while over 60% of central London residents live within 300 m of a sizeable greenspace, a significant portion (20%) remain below WHO accessibility standards. We demonstrate significant negative associations between greenspace accessibility and standardized mortality ratios for both cancer (β = −0.0759) and respiratory diseases (β = −0.0358). Critically, model estimates indicate that 100-m accessibility improvements in high-sensitivity zones were associated with a potential reduction in cancer deaths of 1.9% and in respiratory disease deaths of 2.4% relative to expected mortality—a finding attributable to core–periphery differences in greenspace configuration. Notably, negative association intensified in high-urbanization and working-age-dense areas, though these demographic interactions warrant further causal interrogation through spatial effect decomposition. The primary contribution of this research lies in moving beyond a single average estimate to map the profound spatial heterogeneity of these associations. Crucially, our GWR models revealed that the strength of this relationship varied substantially across the city, being most protective in certain areas and attenuated or neutral in others. These findings suggest that the health benefits of greenspace are not uniform but are instead spatially modulated by the socio-ecological context. Our evidence supports targeted urban greening policies: strategic augmentation of greenspace provision in hyper-urbanized cores coupled with demographic-responsive design—such as activity-oriented spaces for working populations and sensory-rich landscapes for aged communities. Future longitudinal and intervention-based studies are needed to confirm causal relationships in the identified high-priority areas. Further research should also integrate metrics of greenspace quality, usage, and individual-level behaviors to fully unravel the mechanisms behind the observed spatial patterns. Ultimately, such a nuanced understanding is key to optimizing green infrastructure investments and effectively advancing towards the WHO Healthy Cities targets.

Author Contributions

Conceptualization, L.F.; methodology, L.F.; software, L.F. and W.C.; validation, L.F. and W.C.; formal analysis, L.F.; investigation, L.F.; resources, L.F. and W.C.; data curation, L.F.; writing—original draft preparation, L.F. and W.C.; writing—review and editing, L.F. and W.C.; visualization, L.F. and W.C.; supervision, W.C.; project administration, W.C. All authors have read and agreed to the published version of the manuscript.

Funding

This research received no external funding.

Institutional Review Board Statement

Not applicable.

Informed Consent Statement

Not applicable.

Data Availability Statement

The original contributions presented in this study are included in the article. Further inquiries can be directed to the corresponding author.

Acknowledgments

The authors would like to thank the editor and anonymous reviewers who read the manuscript and provided helpful comments for improvements.

Conflicts of Interest

The authors declare no conflicts of interest.

References

  1. Zhou, Q.; Liao, Y.; Wang, J. Mapping global urban greenspace: An analysis based on open land-cover data. Urban For. Urban Green. 2022, 74, 127638. [Google Scholar] [CrossRef]
  2. Seyler, B.C.; Luo, H.; Wang, X.; Zuoqiu, S.; Xie, Y.; Wang, Y. Assessing the impact of urban greenspace on physical health: An empirical study from Southwest China. Front. Public Health 2023, 11, 1148582. [Google Scholar] [CrossRef] [PubMed]
  3. Asri, A.K.; Lee, H.-Y.; Wu, C.-D.; Spengler, J.D. How does the presence of greenspace related to physical health issues in Indonesia? Urban For. Urban Green. 2022, 74, 127667. [Google Scholar] [CrossRef]
  4. World Health Organization. Urban Green Spaces and Health: A Review of Evidence; World Health Organization: Copenhagen, Denmark, 2016. [Google Scholar]
  5. Public Health England. Improving Access to Greenspace: A New Review for 2020; Care, D.H.S., Ed.; Public Health England: London, UK, 2020. [Google Scholar]
  6. Zhang, J.; Lim, Y.-H.; Chen, J.; Hyman, S.; Cole-Hunter, T.; Tuffier, S.; Napolitano, G.; Bergmann, M.; Mortensen, L.H.; Brandt, J.; et al. Residential greenspace and COVID-19 morbidity and mortality: A nationwide cohort study in Denmark. Environ. Int. 2024, 194, 109173. [Google Scholar] [CrossRef]
  7. Dong, R.; Yuan, H.; Xu, G.; Li, Y.; Xu, Y.; Fu, C. Impact of Different Greenspace Metrics on Cardiovascular Disease Incidence in Urban Settings: A Comparative Analysis. J. Urban Health 2025, 102, 274–289. [Google Scholar] [CrossRef]
  8. Godina, S.L.; Rosso, A.L.; Hirsch, J.A.; Besser, L.M.; Lovasi, G.S.; Donovan, G.H.; Garg, P.K.; Platt, J.M.; Fitzpatrick, A.L.; Lopez, O.L.; et al. Neighborhood greenspace and cognition: The cardiovascular health study. Health Place 2023, 79, 102960. [Google Scholar] [CrossRef]
  9. Mueller, W.; Milner, J.; Loh, M.; Vardoulakis, S.; Wilkinson, P. Exposure to urban greenspace and pathways to respiratory health: An exploratory systematic review. Sci. Total Environ. 2022, 829, 154447. [Google Scholar] [CrossRef]
  10. Odebeatu, C.C.; Darssan, D.; Roscoe, C.; Ahmed, M.; Reid, S.; Osborne, N.J. Greenspace and risk of obesity-related cancer in the UK Biobank cohort: An analysis of private residential gardens and other greenspace types. Sci. Total Environ. 2024, 943, 173833. [Google Scholar] [CrossRef]
  11. Mayne, S.L.; Kelleher, S.; Hannan, C.; Kelly, M.K.; Powell, M.; Dalembert, G.; McPeak, K.; Jenssen, B.P.; Fiks, A.G. Neighborhood Greenspace and Changes in Pediatric Obesity During COVID-19. Am. J. Prev. Med. 2023, 64, 33–41. [Google Scholar] [CrossRef]
  12. Cui, W.; Xu, J.; Tang, F.; Gao, M.M.; Zheng, Y.; Zhou, D.; Yang, S.; Han, Z.R. Perceived Greenspace Exposure and Children’s Emotional Well-Being in Daily Life: Comparisons between Children Living in Urban and Rural Areas. J. Happiness Stud. 2025, 26, 65. [Google Scholar] [CrossRef]
  13. He, Q.; Liu, L.; Zhang, H.; Chen, R.; Dong, G.; Yan, L.; Zeng, Y.; Kim, Y.; Ji, J.S. Environmental greenspace, subjective well-being, and all-cause mortality in elderly Chinese: Association and mediation study in a prospective cohort. Environ. Res. 2023, 227, 115732. [Google Scholar] [CrossRef] [PubMed]
  14. Houlden, V.; Albuquerque, J.P.d.; Weich, S.; Jarvis, S. Does nature make us happier? A spatial error model of greenspace types and mental wellbeing. Environ. Plan. B Urban Anal. City Sci. 2021, 48, 655–670. [Google Scholar] [CrossRef]
  15. Elbakidze, M.; Teitelbaum, S.; Dawson, L. Urban greenspace to support social integration of immigrants? Case studies across Sweden. Urban For. Urban Green. 2025, 111, 128868. [Google Scholar] [CrossRef]
  16. Clarke, M.; Cadaval, S.; Wallace, C.; Anderson, E.; Egerer, M.; Dinkins, L.; Platero, R. Factors that enhance or hinder social cohesion in urban greenspaces: A literature review. Urban For. Urban Green. 2023, 84, 127936. [Google Scholar] [CrossRef]
  17. Li, J.; Xie, Y.; Xu, J.; Zhang, C.; Wang, H.; Huang, D.; Li, G.; Tian, J. Association between greenspace and cancer: Evidence from a systematic review and meta-analysis of multiple large cohort studies. Environ. Sci. Pollut. Res. 2023, 30, 91140–91157. [Google Scholar] [CrossRef]
  18. Gao, Y.; Pa, K.; Li, H.; Zhao, B. Greenspace Exposure with Chronic Obstructive Pulmonary Disease: A Systematic Review. Forest 2024, 15, 634. [Google Scholar] [CrossRef]
  19. Frank, L.D.; Wali, B. Treating two pandemics for the price of one: Chronic and infectious disease impacts of the built and natural environment. Sustain. Cities Soc. 2021, 73, 103089. [Google Scholar] [CrossRef]
  20. Wali, B.; Frank, L.D.; Chapman, J.; Fox, E.H. Role of Walkability, Bike Infrastructure, and Greenspace in Combatting Chronic Diseases: A Heterogeneous Ecological Analysis in the United States. Sustain. Cities Soc. 2024, 113, 105550. [Google Scholar] [CrossRef]
  21. Li, R.; Liu, M.; Song, J.; Xu, Y.; He, A.; Hu, X.; Yang, S.; Ding, G.; Chen, M.; Jin, C. Association between residential greenspace and mental health among cancer survivors in Shanghai, China. Environ. Res. Lett. 2023, 238, 117155. [Google Scholar] [CrossRef]
  22. Venter, Z.S.; Krog, N.H.; Barton, D.N. Linking green infrastructure to urban heat and human health risk mitigation in Oslo, Norway. Sci. Total Environ. 2020, 709, 136193. [Google Scholar] [CrossRef]
  23. Sun, S.; Sarkar, C.; Kumari, S.; James, P.; Cao, W.; Lee, R.S.-Y.; Tian, L.; Webster, C. Air pollution associated respiratory mortality risk alleviated by residential greenness in the Chinese Elderly Health Service Cohort. Environ. Res. Lett. 2020, 183, 109139. [Google Scholar] [CrossRef]
  24. Bauwelinck, M.; Casas, L.; Nawrot, T.S.; Nemery, B.; Trabelsi, S.; Thomas, I.; Aerts, R.; Lefebvre, W.; Vanpoucke, C.; Nieuwenhuyse, A.V.; et al. Residing in urban areas with higher green space is associated with lower mortality risk: A census-based cohort study with ten years of follow-up. Environ. Int. 2021, 148, 106365. [Google Scholar] [CrossRef]
  25. Houlden, V.; Albuquerque, J.P.d.; Weich, S.; Jarvis, S. A spatial analysis of proximate greenspace and mental wellbeing in London. Appl. Geogr. 2019, 109, 102036. [Google Scholar] [CrossRef]
  26. James, P.; Hart, J.E.; Banay, R.F.; Laden, F. Exposure to Greenness and Mortality in a Nationwide Prospective Cohort Study of Women. Environ. Health Perspect. 2016, 124, 1344–1352. [Google Scholar] [CrossRef]
  27. Labib, S.M.; Lindley, S.; Huck, J.J. Estimating multiple greenspace exposure types and their associations with neighbourhood premature mortality: A socioecological study. Sci. Total Environ. 2021, 789, 147919. [Google Scholar] [CrossRef]
  28. Klompmaker, J.O.; Hoek, G.; Bloemsma, L.D.; Marra, M.; Wijga, A.H.; Brink, C.v.d.; Brunekreef, B.; Lebret, E.; Gehring, U.; Janssen, N.A.H. Surrounding green, air pollution, traffic noise exposure and non-accidental and cause-specific mortality. Environ. Int. 2020, 134, 105341. [Google Scholar] [CrossRef] [PubMed]
  29. Nieuwenhuijsen, M.J.; Gascon, M.; Martinez, D.; Ponjoan, A.; Blanch, J.; Garcia-Gil, M.d.M.; Ramos, R.; Foraster, M.; Mueller, N.; Espinosa, A.; et al. Air Pollution, Noise, Blue Space, and Green Space and Premature Mortality in Barcelona: A Mega Cohort. Int. J. Environ. Res. Public Health 2018, 15, 2405. [Google Scholar] [CrossRef] [PubMed]
  30. Kabisch, N.; Strohbach, M.; Haase, D.; Kronenberg, J. Urban green space availability in European cities. Ecol. Indic. 2016, 70, 586–596. [Google Scholar] [CrossRef]
  31. Ryan, S.C.; Sugg, M.M.; Runkle, J.D.; Thapa, B. Advancing Understanding on Greenspace and Mental Health in Young People. GeoHealth 2024, 8, e2023GH000959. [Google Scholar] [CrossRef]
  32. Baka, A.; Mabon, L. Assessing equality in neighbourhood availability of quality greenspace in Glasgow, Scotland, United Kingdom. Landsc. Res. 2022, 47, 584–597. [Google Scholar] [CrossRef]
  33. Ye, Y.; Xiang, Y.; Qiu, H.; Li, X. Revealing urban greenspace accessibility inequity using the carrying capacity-based 3SFCA method and location big data. Sustain. Cities Soc. 2024, 108, 105513. [Google Scholar] [CrossRef]
  34. Zhang, J.; Yu, Z.; Zhao, B.; Sun, R.; Vejre, H. Links between green space and public health: A bibliometric review of global research trends and future prospects from 1901 to 2019. Environ. Res. Lett. 2020, 15, 063001. [Google Scholar] [CrossRef]
  35. Viinikka, A.; Paloniemi, R.; Assmuth, T. Mapping the distributive environmental justice of urban waters. Fenn. Int. J. Geogr. 2018, 196, 9–23. [Google Scholar] [CrossRef]
  36. Mears, M.; Brindley, P.; Jorgensen, A.; Maheswaran, R. Population-level linkages between urban greenspace and health inequality: The case for using multiple indicators of neighbourhood greenspace. Health Place 2020, 62, 102284. [Google Scholar] [CrossRef] [PubMed]
  37. Koliotsis, P.T.A.; Papadopoulou, M.P. Spatial Analysis of the Accessibility of Urban Greenspace at the City Level. Eur. J. Environ. Sci. 2020, 10, 15–21. [Google Scholar] [CrossRef]
  38. Barber, A.; Haase, D.; Wolff, M. Permeability of the city—Physical barriers of and in urban green spaces in the city of Halle, Germany. Ecol. Indic. 2021, 125, 107555. [Google Scholar] [CrossRef]
  39. Tannous, H.O.; Major, M.D.; Furlan, R. Accessibility of green spaces in a metropolitan network using space syntax to objectively evaluate the spatial locations of parks and promenades in Doha, State of Qatar. Urban For. Urban Green. 2021, 58, 126892. [Google Scholar] [CrossRef]
  40. World Health Organization. Urban Green Spaces: A Brief for Action; World Health Organization: Geneva, Switzerland, 2017. [Google Scholar]
  41. Natural England. Green Infrastructure Standards for England—Summary; Natural England: London, UK, 2023. [Google Scholar]
  42. Roscoe, C.; Mackay, C.; Gulliver, J.; Hodgson, S.; Cai, Y.; Vineis, P.; Fecht, D. Associations of private residential gardens versus other greenspace types with cardiovascular and respiratory disease mortality: Observational evidence from UK Biobank. Environ. Int. 2022, 167, 107427. [Google Scholar] [CrossRef]
  43. Wang, R.; Feng, Z.; Pearce, J. Neighbourhood greenspace quantity, quality and socioeconomic inequalities in mental health. Cites 2022, 129, 103815. [Google Scholar] [CrossRef]
  44. Jalkanen, J.; Fabritius, H.; Vierikko, K.; Moilanen, A.; Toivonen, T. Analyzing fair access to urban green areas using multimodal accessibility measures and spatial prioritization. Appl. Geogr. 2020, 124, 102320. [Google Scholar] [CrossRef]
  45. Markevych, I.; Schoierer, J.; Hartig, T.; Chudnovsky, A.; Hystad, P.; Dzhambov, A.M.; Vries, S.d.; Triguero-Mas, M.; Brauer, M.; Nieuwenhuijsen, M.J.; et al. Exploring pathways linking greenspace to health: Theoretical and methodological guidance. Environ. Res. 2017, 158, 301–317. [Google Scholar] [CrossRef] [PubMed]
  46. Moran, M.R.; Bilal, U.; Dronova, I.; Ju, Y.; Gouveia, N.; Caiaffa, W.T.; Friche, A.A.d.L.; Moore, K.; Miranda, J.J.; Rodríguez, D.A. The equigenic effect of greenness on the association between education with life expectancy and mortality in 28 large Latin American cities. Health Place 2021, 72, 102703. [Google Scholar] [CrossRef] [PubMed]
  47. Mitchell, R.; Popham, F. Effect of exposure to natural environment on health inequalities: An observational population study. Lancet 2008, 372, 1655–1660. [Google Scholar] [CrossRef] [PubMed]
  48. Hartig, T.; Astell-Burt, T.; Bergsten, Z.; Amcoff, J.; Mitchell, R.; Feng, X. Associations between greenspace and mortality vary across contexts of community change: A longitudinal ecological study. J. Epidemiol. Community Health 2020, 74, 534–540. [Google Scholar] [CrossRef]
  49. Schinasi, L.H.; Kondo, M.C.; Edwards, J.; Clougherty, J.E.; Roos, A.J.D.; Bilal, U. Does Urban Greenspace Reduce Mortality Inequalities Based on Poverty, Race, or Both in Philadelphia, PA? J. Urban Health 2023, 100, 686–695. [Google Scholar] [CrossRef]
  50. Maas, J.; Verheij, R.A.; Vries, S.d.; Spreeuwenberg, P.; Schellevis, F.G.; Groenewegen, P.P. Morbidity is related to a green living environment. J. Epidemiol. Community Health 2009, 63, 967–973. [Google Scholar] [CrossRef]
  51. Orioli, R.; Antonucci, C.; Scortichini, M.; Cerza, F.; Marando, F.; Ancona, C.; Manes, F.; Davoli, M.; Michelozzi, P.; Forastiere, F.; et al. Exposure to residential greenness as a predictor of cause-specific mortality and stroke incidence in the rome longitudinal study. Environ. Health Perspect. 2019, 127, 027002. [Google Scholar] [CrossRef]
  52. Jarvis, I.; Gergel, S.; Koehoorn, M.; Bosch, M.v.d. Greenspace access does not correspond to nature exposure: Measures of urban natural space with implications for health research. Landsc. Urban Plan. 2020, 194, 103686. [Google Scholar] [CrossRef]
  53. Browning, M.H.E.M.; Rigolon, A.; McAnirlin, O.; Yoon, H.V. Where greenspace matters most: A systematic review of urbanicity, greenspace, and physical health. Landsc. Urban Plan. 2022, 217, 104233. [Google Scholar] [CrossRef]
  54. Cao, Y.; Yu, W.; Li, C.; Chu, Z.; Guo, B.; Wang, H.; Ma, W.; Xu, X.; Liu, Q.; Zhao, Q. Association between greenspace morphology and dengue fever in China. Parasites Vectors 2025, 18, 115. [Google Scholar] [CrossRef]
  55. Helbich, M.; Blüml, V.; Jong, T.d.; Plener, P.L.; Kwan, M.-P.; Kapusta, N.D. Urban–rural inequalities in suicide mortality: A comparison of urbanicity indicators. Int. J. Health Geogr. 2017, 16, 39. [Google Scholar] [CrossRef] [PubMed]
  56. Liu, S.; Shi, K.; Wu, Y.; Chang, Z. Remotely sensed nighttime lights reveal China’s urbanization process restricted by haze pollution. Build. Environ. 2021, 206, 108350. [Google Scholar] [CrossRef]
  57. Zheng, Q.; Seto, K.C.; Zhou, Y.; You, S.; Weng, Q. Nighttime light remote sensing for urban applications: Progress, challenges, and prospects. ISPRS J. Photogramm. Remote Sens. 2023, 202, 125–141. [Google Scholar] [CrossRef]
  58. Li, T.; Guo, Z.; Ma, C. Dynamic Characteristics of Urbanization Based on Nighttime Light Data in China’s “Plain–Mountain Transition Zone”. Int. J. Environ. Res. Public Health 2022, 19, 9230. [Google Scholar] [CrossRef]
  59. World Health Organization. Healthy Cities: Effective Approach to a Rapidly Changing World; World Health Organization: Geneva, Switzerland, 2020. [Google Scholar]
  60. Greater London Authority. MSOA Atlas. Available online: https://data.london.gov.uk/dataset/msoa-atlas/ (accessed on 2 April 2023).
  61. Office for Health Improvement and Disparities. Public Health Profiles. Available online: https://fingertips.phe.org.uk/profile/health-profiles (accessed on 25 February 2025).
  62. Brousmiche, D.; Lanier, C.; Occelli, F.; Pochet, L.; Degezelle, S.; Genin, M.; Deram, A.; Cuny, D. Spatial scale and spatial effects: Shedding light on how a change of scale can affect the characterization of environmental health inequalities. Environ. Sci. Policy 2023, 144, 20–30. [Google Scholar] [CrossRef]
  63. Lachowycz, K.; Jones, A.P. Does walking explain associations between access to greenspace and lower mortality? Soc. Sci. Med. 2014, 107, 9–17. [Google Scholar] [CrossRef]
  64. Greenspace Information for Greater London CIC. Our Data Holdings. Available online: https://www.gigl.org.uk/our-data-holdings/ (accessed on 9 February 2023).
  65. Cao, X.; Onishi, A.; Chen, J.; Imura, H. Quantifying the cool island intensity of urban parks using ASTER and IKONOS data. Landsc. Urban Plan. 2010, 96, 224–231. [Google Scholar] [CrossRef]
  66. Zhang, F.; Qian, H. A comprehensive review of the environmental benefits of urban green spaces. Environ. Res. Lett. 2024, 252, 118837. [Google Scholar] [CrossRef]
  67. Ordnance Survey. OS Open Roads Data. Available online: https://docs.os.uk/os-downloads/networks/os-open-roads/os-open-roads-overview/os-open-roads-data (accessed on 19 November 2024).
  68. OpenStreetMap. OSM Buildings Data. Available online: https://cesium.com/platform/cesium-ion/content/cesium-osm-buildings/ (accessed on 9 May 2024).
  69. Noble, S.; McLennan, D.; Noble, M.; Plunkett, E.; Gutacker, N.; Silk, M.; Wright, G. The English Indices of Deprivation 2019 Research Report Ministry of Housing; Ministry of Housing, Communities & Local Government: London, UK, 2019.
  70. Yang, Z.; Kwan, M.-P.; Liu, D.; Huang, J. How objective and subjective greenspace, combined with air and noise pollution, impacts mental health through the mediation of physical activity. Urban For. Urban Green. 2025, 105, 128683. [Google Scholar] [CrossRef]
  71. Viinikka, A.; Tiitu, M.; Heikinheimo, V.; Halonen, J.I.; Nyberg, E.; Vierikko, K. Associations of neighborhood-level socioeconomic status, accessibility, and quality of green spaces in Finnish urban regions. Appl. Geogr. 2023, 157, 102973. [Google Scholar] [CrossRef]
  72. Weeks, W.B.; Chang, J.E.; Pagán, J.A.; Aerts, A.; Weinstein, J.N.; Ferres, J.L. An observational, sequential analysis of the relationship between local economic distress and inequities in health outcomes, clinical care, health behaviors, and social determinants of health. Int. J. Equity Health 2023, 22, 181. [Google Scholar] [CrossRef]
  73. Cheng, J.; Cui, Y.; Wang, X.; Wang, Y.; Feng, R. Spatial characteristics of health outcomes and geographical detection of its influencing factors in Beijing. Front. Public Health 2024, 12, 1424801. [Google Scholar] [CrossRef] [PubMed]
  74. Kwon, D.H.; Kwon, Y.D. Patterns of health literacy and influencing factors differ by age: A cross-sectional study. BMC Public Health 2025, 25, 1556. [Google Scholar] [CrossRef] [PubMed]
  75. Wang, Z.; Liu, Y.; Zhang, Y.; Liu, Y.; Wang, B.; Zhang, G. Spatially Varying Relationships between Land Subsidence and Urbanization: A Case Study in Wuhan, China. Remote Sens. 2022, 14, 291. [Google Scholar] [CrossRef]
  76. Yuan, X.; Li, Y.; Song, Y.; Lu, H.; Wang, Y.; Ge, B.; Wang, J. Spatial Distribution Characteristics and Driving Factors of 777 Traditional Villages in Yunnan Province: A Study Based on GWR Model and Geodetector. Land 2024, 13, 2004. [Google Scholar] [CrossRef]
  77. Yang, C.; Li, R.; Sha, Z. Exploring the Dynamics of Urban Greenness Space and Their Driving Factors Using Geographically Weighted Regression: A Case Study in Wuhan Metropolis, China. Land 2020, 9, 500. [Google Scholar] [CrossRef]
  78. Huang, B.; Wu, B.; Barry, M. Geographically and temporally weighted regression for modeling spatio-temporal variation in house prices. Int. J. Geogr. Inf. Sci. 2010, 24, 383–401. [Google Scholar] [CrossRef]
  79. Kupfer, J.A.; Farris, C.A. Incorporating spatial non-stationarity of regression coefficients into predictive vegetation models. Landsc. Ecol. 2007, 22, 837–852. [Google Scholar] [CrossRef]
  80. Wang, H.; Qin, F.; Xu, C.; Li, B.; Guo, L.; Wang, Z. Evaluating the suitability of urban development land with a Geodetector. Ecol. Indic. 2021, 123, 107339. [Google Scholar] [CrossRef]
  81. Greater London Authority. Access to Public Open Space and Nature by Ward; Greater London Authority: London, UK, 2012.
  82. Pang, Z.; Xie, B.; An, Z.; Wang, L. Spatial and moderating effects of greenspace on the association between air pollution and lung cancer incidence. Appl. Geogr. 2024, 164, 103207. [Google Scholar] [CrossRef]
  83. Tan, L.Y.; Wang, Y.; Yang, L.; Chen, C.-S.; Zhang, F.; Yua, M.-T.; Guo, P.; Zhang, Q.-Y. Residing in areas with high residential greenspace is associated with increased COPD risk and decreased lung function of adults in eastern China. Heart Lung 2025, 70, 329–338. [Google Scholar] [CrossRef]
  84. Cao, Z.; Xu, C.; Li, S.; Wang, Y.; Yang, H. Residential greenspace and risk of cancer: A prospective cohort study from the UK Biobank. Sci. Total Environ. 2023, 871, 162145. [Google Scholar] [CrossRef] [PubMed]
  85. Datzmann, T.; Markevych, I.; Trautmann, F.; Heinrich, J.; Schmitt, J.; Tesch, F. Outdoor air pollution, green space, and cancer incidence in Saxony: A semi-individual cohort study. BMC Public Health 2018, 18, 715. [Google Scholar] [CrossRef] [PubMed]
  86. Sakhvidi, M.J.Z.; Yang, J.; Siemiatycki, J.; Dadvand, P.; Hoogh, K.d.; Vienneau, D.; Goldberg, M.; Zins, M.; Lequy, E.; Jacquemin, B. Greenspace exposure and cancer incidence: A 27-year follow-up of the French GAZEL cohort. Sci. Total Environ. 2021, 787, 15. [Google Scholar] [CrossRef] [PubMed]
  87. Douglas, J.A.; Archer, R.S.; Alexander, S.E. Ecological determinants of respiratory health: Examining associations between asthma emergency department visits, diesel particulate matter, and public parks and open space in Los Angeles, California. Prev. Med. Rep. 2019, 14, 100855. [Google Scholar] [CrossRef]
  88. Wang, R.; Feng, Z.; Pearce, J.; Zhou, S.; Zhang, L.; Liu, Y. Dynamic greenspace exposure and residents’ mental health in Guangzhou, China: From over-head to eye-level perspective, from quantity to quality. Landsc. Urban Plan. 2021, 215, 104230. [Google Scholar] [CrossRef]
  89. Wilson, B.; Neale, C.; Roe, J. Urban green space access, social cohesion, and mental health outcomes before and during COVID-19. Cities 2024, 152, 105173. [Google Scholar] [CrossRef]
  90. Ambrey, C.L.; Shahni, T.J. Greenspace and wellbeing in Tehran: A relationship conditional on a neighbourhood’s crime rate. Urban For. Urban Green. 2017, 27, 155–161. [Google Scholar] [CrossRef]
  91. Milà, C.; Ranzani, O.; Sanchez, M.; Ambrós, A.; Bhogadi, S.; Kinra, S.; Kogevinas, M.; Dadvand, P.; Tonne, C. Land-Use Change and Cardiometabolic Risk Factors in an Urbanizing Area of South India: A Population-Based Cohort Study. Environ. Health Perspect. 2020, 128, 47003. [Google Scholar] [CrossRef]
  92. Fong, K.C.; Hart, J.E.; James, P. A Review of Epidemiologic Studies on Greenness and Health: Updated Literature Through 2017. Curr. Environ. Health Rep. 2018, 5, 77–78. [Google Scholar] [CrossRef]
  93. Krabbendam, L.; Vugt, M.v.; Conus, P.; Söderström, O.; Empson, L.A.; Os, J.v.; Fett, A.-K.J. Understanding urbanicity: How interdisciplinary methods help to unravel the effects of the city on mental health. Psychol. Med. 2021, 51, 1099–1110. [Google Scholar] [CrossRef]
  94. Dzhambov, A.M.; Browning, M.H.E.M.; Markevych, I.; Hartig, T.; Lercher, P. Analytical approaches to testing pathways linking greenspace to health: A scoping review of the empirical literature. Environ. Res. Lett. 2020, 186, 109613. [Google Scholar] [CrossRef]
  95. Vukomanovic, J.; Singh, K.K.; Vogler, J.B.; Meentemeyer, R.K. Protection status and proximity to public-private boundaries influence land use intensification near U.S. parks and protected areas. Conserv. Sci. Pract. 2020, 2, e190. [Google Scholar] [CrossRef]
  96. Rigolon, A. A complex landscape of inequity in access to urban parks: A literature review. Landsc. Urban Plan. 2016, 153, 160–169. [Google Scholar] [CrossRef]
  97. Smith, A. Beyond the pale: Fencing off parks for festivals. Urban Stud. 2023, 60, 2763–2778. [Google Scholar] [CrossRef]
  98. Xie, X.; Zhou, H.; Gou, Z.; Yi, M. Spatiotemporal Patterns of the Use of Green Space by White-Collar Workers in Chinese Cities: A Study in Shenzhen. Land 2021, 10, 1006. [Google Scholar] [CrossRef]
  99. Zhou, Y.; Lu, Y. Health effects of greenspace morphology: Large, irregular-shaped, well-connected, and close-clustered greenspaces may reduce mortality risks, especially for neighborhoods with higher aging levels. Environ. Res. Lett. 2024, 263, 120095. [Google Scholar] [CrossRef] [PubMed]
  100. Astell-Burt, T.; Feng, X. Association of Urban Green Space With Mental Health and General Health Among Adults in Australia. JAMA Netw. Open 2019, 2, e198209. [Google Scholar] [CrossRef]
  101. He, Q.; Liu, L.; Chang, H.-T.; Wu, C.-D.; Ji, J.S. Residential green space structures and mortality in an elderly prospective longitudinal cohort in China. Environ. Res. Lett. 2021, 16, 094003. [Google Scholar] [CrossRef]
  102. Zhou, W.; Wang, Q.; Kadier, A.; Wang, W.; Zhou, F.; Li, R.; Ling, L. The role of residential greenness levels, green land cover types and diversity in overweight/obesity among older adults: A cohort study. Environ. Res. Lett. 2023, 217, 114854. [Google Scholar] [CrossRef]
  103. Creed, C.; Carvalho, J.S. Exploring the user experience, quality, and provision of urban greenspace: A mixed-method approach. Urban For. Urban Green. 2024, 100, 128470. [Google Scholar] [CrossRef]
  104. Dawson, L.; Elbakidze, M.; Ermel, L.E.K.v.; Olsson, U.; Ongena, Y.P.; Schaffer, C.; Johansson, K.-E. Why don’t we go outside?—Perceived constraints for users of urban greenspace in Sweden. Urban For. Urban Green. 2023, 82, 127865. [Google Scholar] [CrossRef]
  105. Cheng, J.; Lu, M.; Sun, H.; Mao, Y. A survival analysis of patients with an acute exacerbation of chronic obstructive pulmonary disease discharged from the respiratory intensive care unit. Ann. Palliat. Med. 2020, 9, 1812–1820. [Google Scholar] [CrossRef]
  106. Sakhvidi, M.J.Z.; Yang, J.; Mehrparvar, A.H.; Dzhambov, A.M.; Ebrahimi, A.; Dadvand, P.; Jacquemin, B. Exposure to greenspace and cancer incidence, prevalence, and mortality: A systematic review and meta-analyses. Sci. Total Environ. 2022, 838, 156180. [Google Scholar] [CrossRef]
  107. Dong, P.-P.; Chen, G.; Wen, Y.; Heinrich, J.; Fuertes, E.; Zhao, T.; Idrose, N.S.; Lin, L.-Z.; Gui, Z.-H.; Qin, X.; et al. Greenspace and respiratory diseases and symptoms in Chinese children: A large-scale study exploring joint associations with ozone. Sustain. Cities Soc. 2025, 124, 106329. [Google Scholar] [CrossRef]
  108. Takashima, M.D.; Grimwood, K.; Vilcins, D.; Knibbs, L.D.; Sly, P.D.; Lambert, S.B. Association of antenatal and early childhood air pollution and greenspace exposures with respiratory pathogen upper airway acquisitions and respiratory health outcomes. Int. J. Environ. Health Res. 2024, 34, 3147–3160. [Google Scholar] [CrossRef] [PubMed]
  109. Cruz-Piedrahita, C.; Roscoe, C.J.; Howe, C.; Fecht, D.; Nazelle, A.d. Holistic approach to assess the association between the synergistic effect of physical activity, exposure to greenspace, and fruits and vegetable intake on health and wellbeing: Cross-sectional analysis of UK Biobank. Front. Public Health 2022, 10, 886608. [Google Scholar] [CrossRef] [PubMed]
  110. Barbey, C.; Bonvallot, N.; Clerc, F. Health Outcomes Related to Multiple Exposures in Occupational Settings: A Review. Saf. Health Work. 2024, 15, 382–395. [Google Scholar] [CrossRef]
  111. Biernacka, M.; Kronenberg, J.; Łaszkiewicz, E. An integrated system of monitoring the availability, accessibility and attractiveness of urban parks and green squares. Appl. Geogr. 2020, 116, 102152. [Google Scholar] [CrossRef]
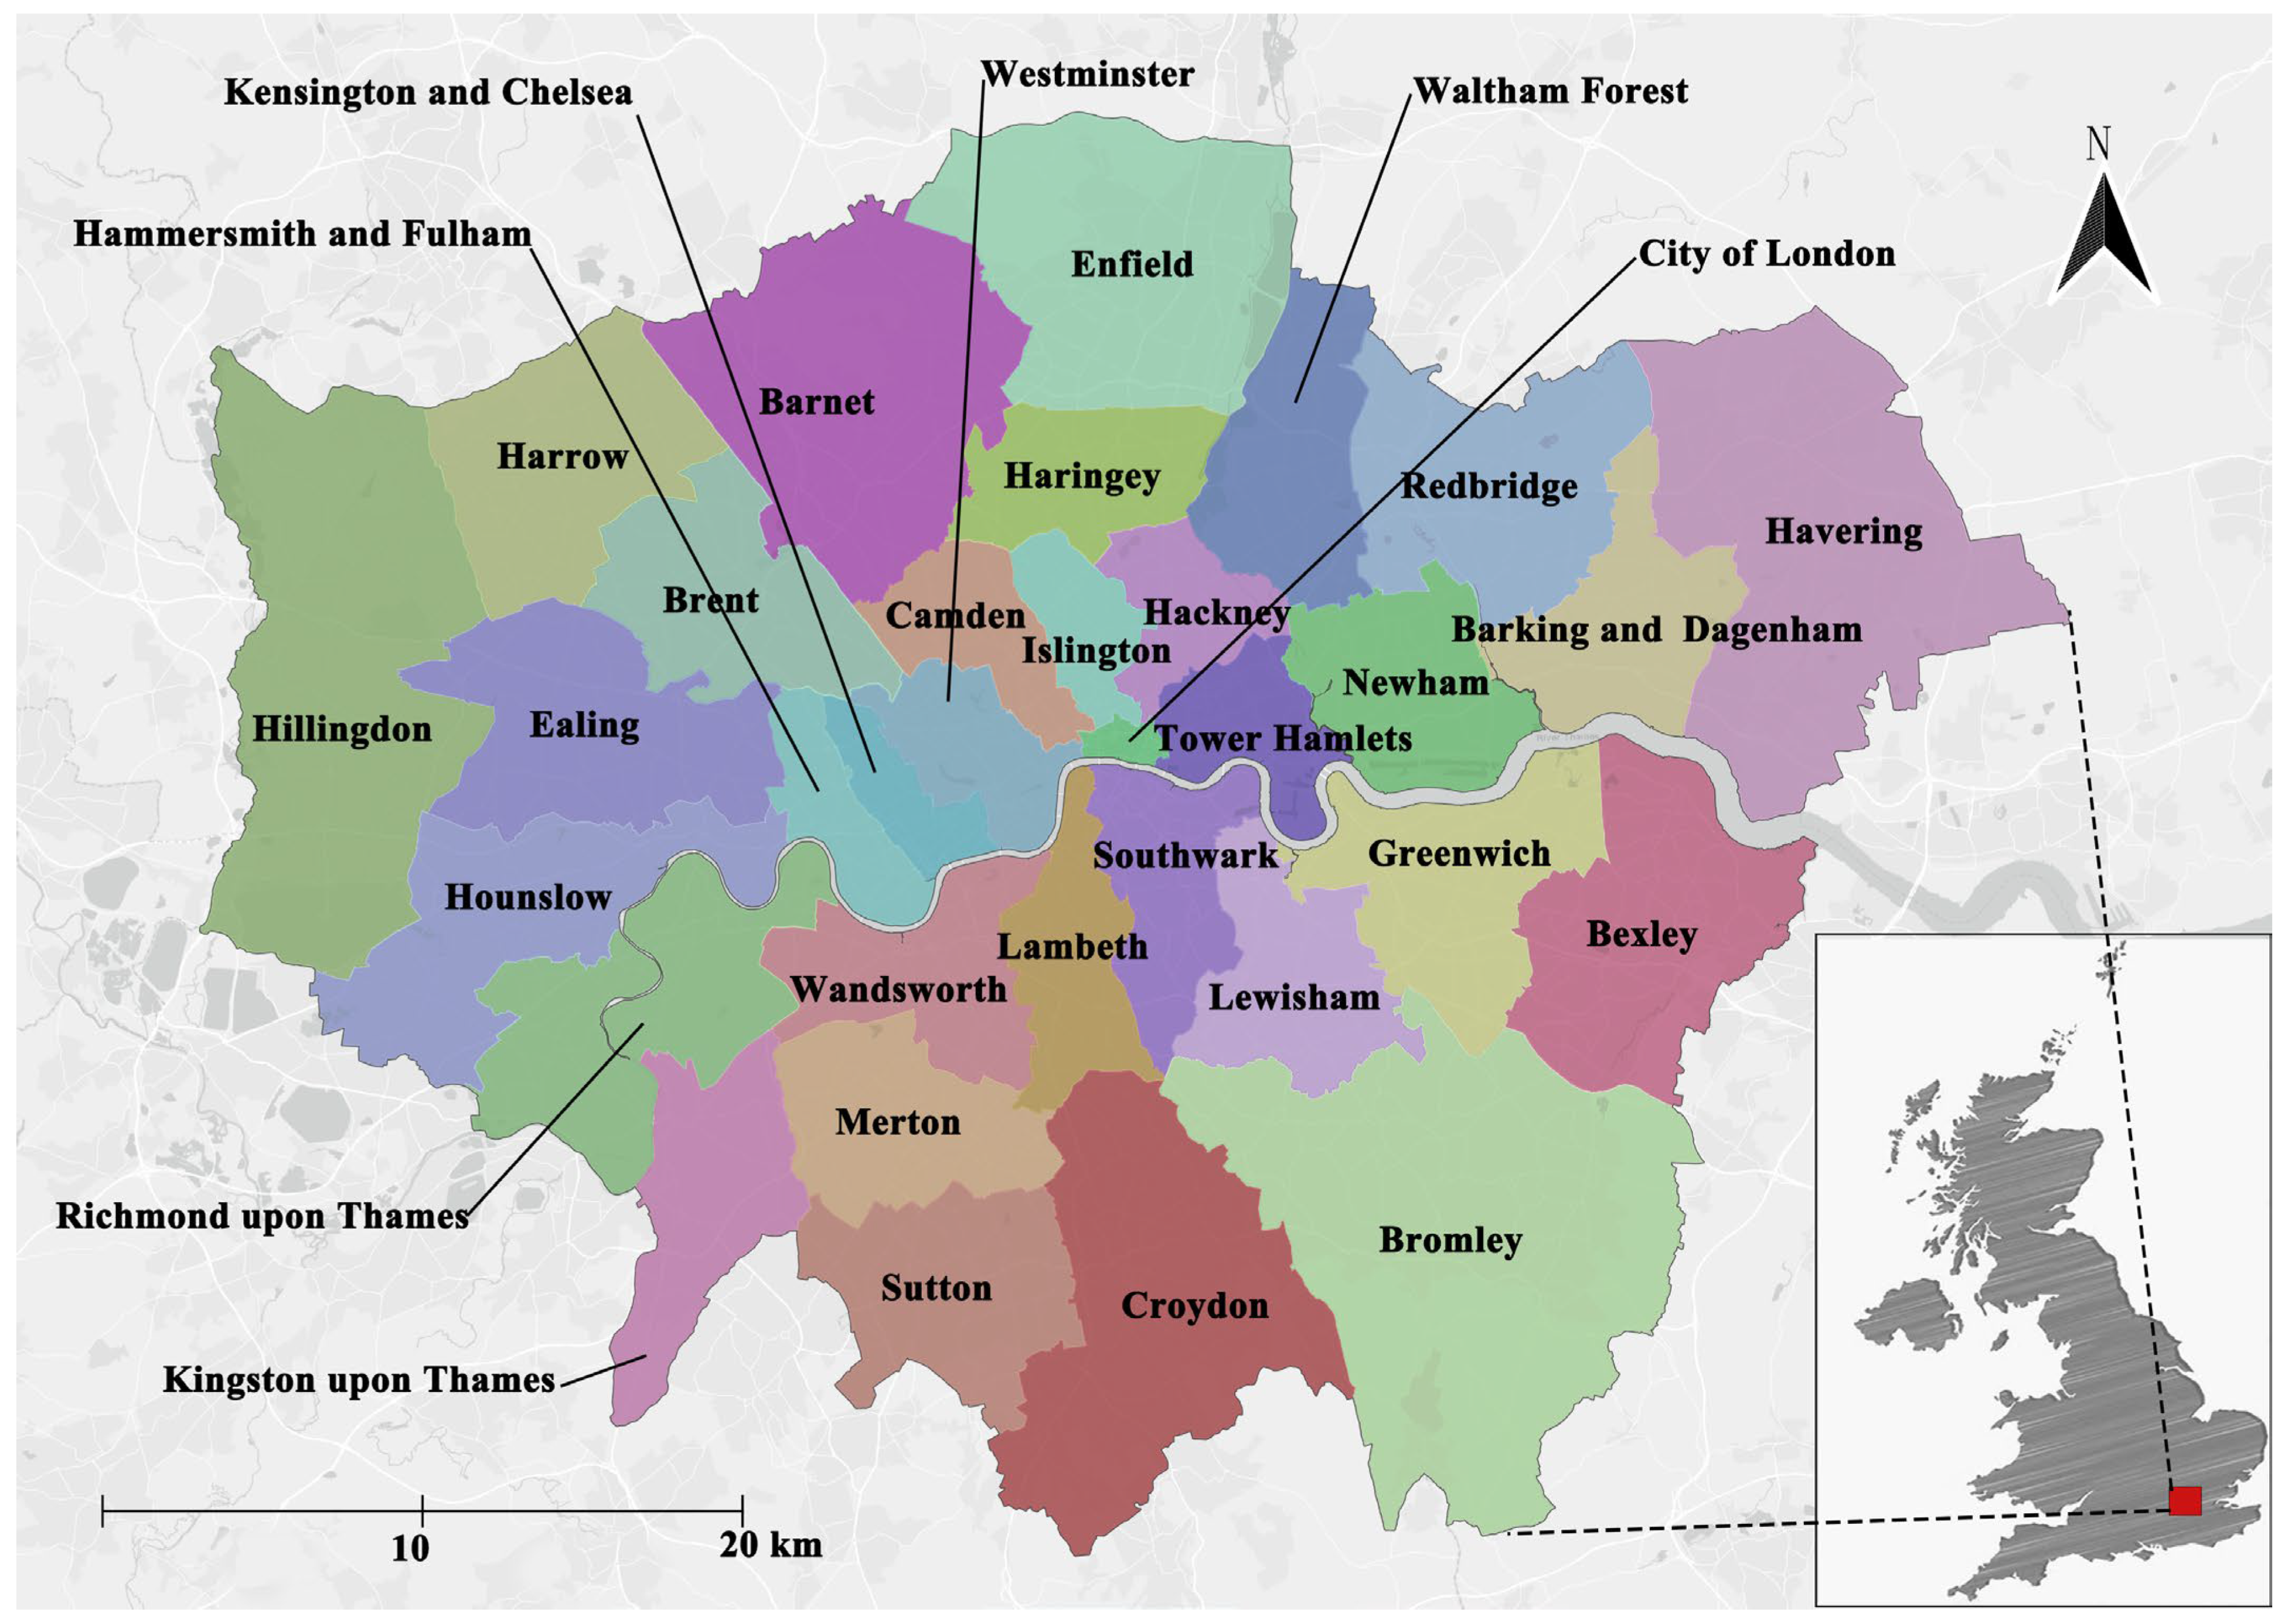
Figure 1. Map of Greater London.
Applsci 15 09328 g001
Figure 2. Greenspace accessibility measurement.
Applsci 15 09328 g002
Figure 3. Distribution of SMRs for cancer (a) and respiratory diseases (b) across the 33 administrative regions of Greater London.
Applsci 15 09328 g003
Figure 4. Raw greenspace accessibility (based on residential locations) (a), MSOA summary (b), and the spatial clusters (c).
Applsci 15 09328 g004
Figure 5. Cumulative distribution of greenspace accessibility for residential locations (a) and distribution of greenspace accessibility across 33 administrative districts in London (b).
Applsci 15 09328 g005
Figure 6. Spatial distribution of GWR greenspace accessibility coefficients with cancer (a) and respiratory diseases (b), and the effect of greenspace accessibility on cancer (c) and respiratory disease (d).
Applsci 15 09328 g006
Figure 7. Distribution of GWR greenspace accessibility coefficients according to urbanization levels ((a) for cancer and (b) for respiratory diseases) and proportion of working population ((c) for cancer and (d) for respiratory diseases).
Applsci 15 09328 g007
Figure 8. Spatial coupling between strong negative effects and urbanization levels (a,b) and the proportion of working population (c,d).
Applsci 15 09328 g008
Table 1. Datasets used in this study.
DatasetSourceDescriptionTime Range (Year)
Chronic diseases mortality dataOffice for National Statistics (ONS)Includes indirect standardized mortality ratios for cancer and respiratory diseases in Greater London. For ethical considerations, the data do not include personal privacy characteristics or medical records.2016–2020
Greenspace dataGreenspace Information for Greater London (GiGL)Providing geo-spatial data on more than 20,000 greenspaces in Greater London. 1986–2008
Geo-spatial data (road network and residential area)Ordnance Survey/OpenStreetMapProviding road-network data and residential area data for Greater London.2025
Socio-economic indicator (IMD 2019)Ministry of Housing, Communities and Local GovernmentProvides socio-economic data for various areas within London, including seven different dimensions: income, employment, educational attainment, health, crime, barriers to housing and services, and living conditions.2019
Nighttime light dataGoogle Earth Engine (GEE)Used to measure the level of urbanization in Greater London2019
Air quality dataThe Greater London Authority (GLA) and Transport for London (TFL)Includes emissions at grid level for NOx, PM2.5, and CO2 in tonnes/year, for all sources.2019
Table 2. Description of variables.
VariablesDescription
Dependent variablesCancer SMRsIndirect standardized mortality ratios for cancer
Respiratory disease SMRsIndirect standardized mortality ratios for respiratory diseases
Core independent variableGreenspace accessibilityGreenspace accessibility measured by shortest road-network distance
CovariatesIncomeThe proportion of the population in an area experiencing deprivation relating to low income
EducationThe proportion of the population lacking attainment and skills
EmploymentThe proportion of the working-age population in an area involuntarily excluded from the labor market
CrimeThe risk of personal and material victimization at local level
HousingThe physical and financial accessibility of housing and local services
HealthThe risk of premature death and the impairment of quality of life through poor physical or mental health.
Built environmentThe quality of the local
environment
Air qualityEmissions at grid level for NOx, PM2.5, and CO2 in tonnes/year
Table 3. Description of the key parameters used in GWR.
VariablesDefinition
y i Predicted value of the standardized mortality ratio (cancer and respiratory diseases) at position i
u i , v i Coordinates of point i
β 0 u i , v i Intercept
β k u i , v i Regression coefficient of the kth independent variable on point i; can be obtained using the weight function approach
ε i Error term at position i
x i k Value of the independent variable (including greenspace accessibility and other socio-economic factors) at position i
Table 4. Subgroups of cancer and respiratory disease SMRs by age, urbanization, and deprivation.
CancerL1 *L2 *L3 *L4 *
URB92.8 92.6 89.4 90.2
IMD80.8 86.7 94.0 103.5
CHI97.6 90.5 88.8 88.1
OLD84.4 87.8 96.4 96.3
Work92.0 91.4 91.4 90.2
Respiratory diseases
URB92.6 89.5 92.5 89.2
IMD72.8 84.0 96.8 110.2
CHI105.7 92.2 85.8 80.1
OLD78.9 87.9 96.8 100.2
Work87.3 92.4 95.5 88.6
* L1–L4 in URB represent the intensity of light at night from the strongest to the weakest, i.e., the level of urbanization from high to low; L1–L4 in IMD represent the lowest to the highest level of overall deprivation; L1–L4 in CHI, OLD, and Work represent the proportions of specific populations from high to low.
Table 5. OLS results with greenspace coefficients before and after the inclusion of the six variables.
VariablesCancerRespiratory Diseases
Coefficient (β)p-ValueR2Coefficient (β)p-ValueR2
Greenspace accessibility−0.12650.00010.0144−0.12330.00010.0115
Greenspace accessibility with other six variables−0.04990.03940.3013−0.04860.01420.2920
Table 6. GWR results with greenspace coefficients before and after the inclusion of the six variables.
VariablesCancerRespiratory Diseases
Coefficient (β)p-ValueR2Coefficient (β)p-ValueR2
Greenspace accessibility−0.1342<0.0010.2274−0.1102<0.0010.2458
Greenspace accessibility with other six variables−0.0759<0.0010.4654−0.0358<0.0010.4978
Disclaimer/Publisher’s Note: The statements, opinions and data contained in all publications are solely those of the individual author(s) and contributor(s) and not of MDPI and/or the editor(s). MDPI and/or the editor(s) disclaim responsibility for any injury to people or property resulting from any ideas, methods, instructions or products referred to in the content.