1. Introduction
Thermal stratification in water is a natural phenomenon where temperature-induced density differences create a stable vertical structure under the influence of gravity [
1]. This phenomenon is prevalent in various aquatic environments, including rivers, lakes, oceans, and deep-water reservoirs [
2]. It directly influences crucial ecological processes, such as dissolved oxygen levels [
3] and the abundance and community structure of phytoplankton and zooplankton [
4,
5,
6]. Concurrently, it significantly impacts marine engineering, affecting the thermal wake characteristics and stealth performance of underwater vehicles [
7,
8]. Given the pressing demand for controllable, thermally stratified environments for both testing the stealth performance of underwater vehicles [
9] and studying aquatic ecosystems, creating stable stratification at a laboratory scale holds significant scientific and applied value for environmental fluid dynamics and related interdisciplinary fields.
Despite the prevalence of thermal stratification in nature, methods for replicating this phenomenon in a laboratory setting have received limited research attention [
10].
The prevailing techniques can be categorized as follows:
- (1)
Electric Heating: This method uses resistive elements to heat the water. For instance, Wang et al. [
11] and Zhang et al. [
12] employed resistance wires for localized heating, while Gu et al. [
13] and Zhang et al. [
14] deployed helical heaters at the surface to establish stratification. Although this technique is efficient for creating localized stratification, its application to large-scale environments is limited by long heating periods, high energy consumption, and safety concerns;
- (2)
Radiation Heating: This technique simulates solar radiation using lamps. For example, Wang et al. [
1] positioned solar lamps above the water to induce surface stratification via radiant heat transfer. However, this method also suffers from low efficiency and significant safety risks;
- (3)
Hot and Cold Water Mixing: This method involves introducing hot water into a colder ambient body. Wu [
15], for example, layered hot water onto the surface in a towing tank, while Liu et al. [
16] and Zhang et al. [
17] employed a single-side injection to create various stratification profiles. Owing to its operational simplicity and enhanced safety, this mixing method has become the primary approach for establishing large-scale stratification in laboratory settings.
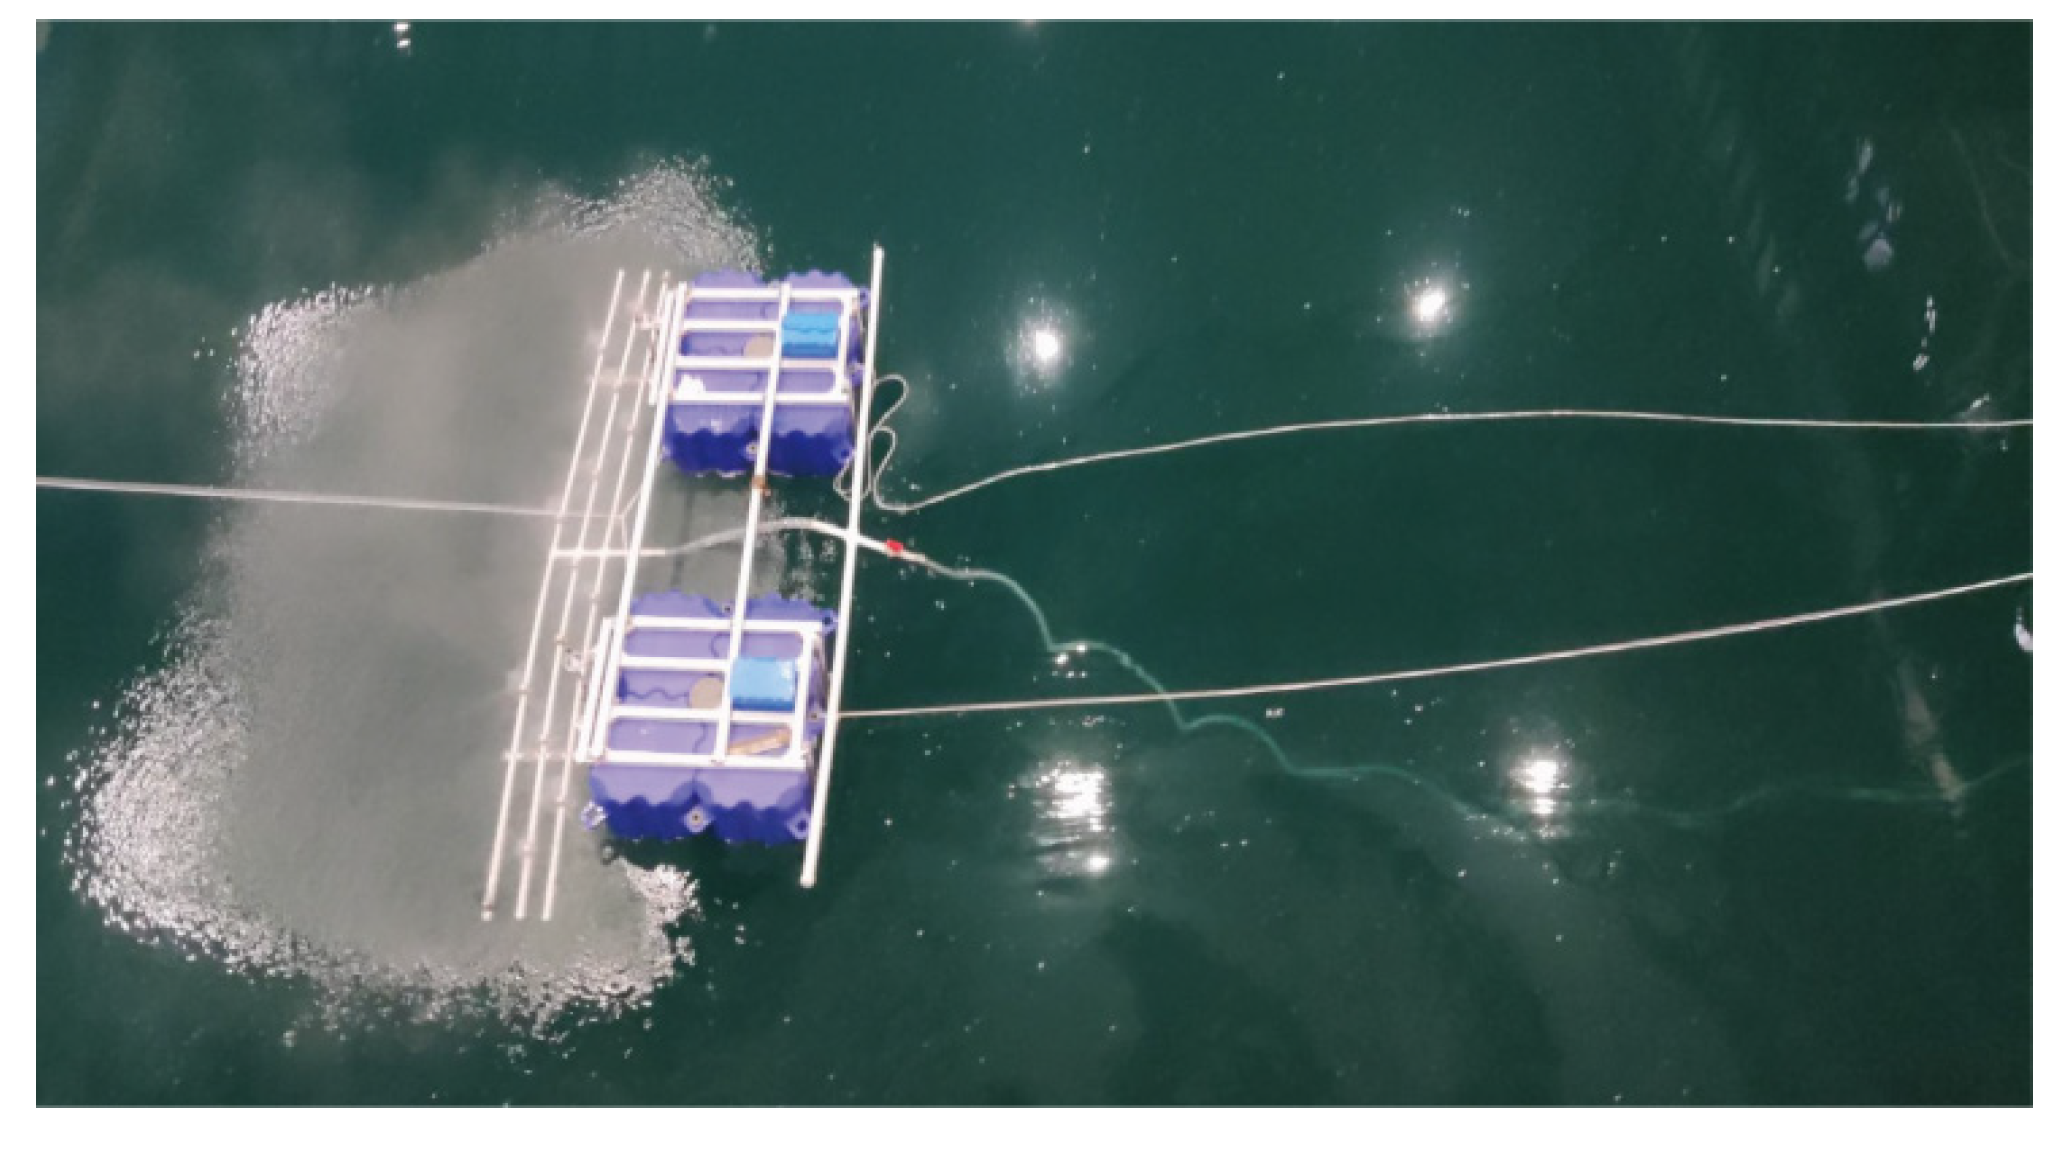
However, most existing mixing techniques rely on single-side injection, which depends on slow natural convection for thermal diffusion. This approach often leads to prolonged formation times and poor surface temperature uniformity. To overcome these limitations, we have designed a novel apparatus for generating thermal stratification (
Figure 1). Its core feature is a towed discharge mode, which utilizes mobile heat injection to enhance mixing, improve surface uniformity, and thereby enable the creation of large-scale, controllable stratification in a laboratory setting. To assess the stability and uniformity of the stratification produced via this new apparatus, we employed computational fluid dynamics (CFD) to simulate the generation process. This numerical investigation analyzes the influence of different hot water mixing strategies on the resulting thermal structure.
Numerical simulation has become a cornerstone for investigating the mechanisms of thermal stratification, with its theoretical foundations and application depth advancing significantly over the past decades. Early research focused on developing fundamental numerical methods [
18]. For instance, Vilet et al. [
19] proposed a finite-difference-based approach that effectively simulated stratification under simple flow conditions. Subsequently, the focus shifted to the mathematical modeling of stratified turbulence and simulations under complex conditions. Gao et al. [
20] and Eidelman et al. [
21], for example, investigated models for turbulent thermal stratification, while Jin et al. [
22] and Hu et al. [
23] simulated flows with combined temperature and salinity gradients. Furthermore, Lian et al. [
24] proposed a novel thermal curtain and used simulations to study its impact on water temperature distribution. More recently, the research scope has broadened to address stratification in specific fluids and flow regimes. For example, Hayat et al. [
25] studied the behavior of Oldroyd-B fluids under thermal influences, while Rorai et al. [
26] discussed stratification in flows exhibiting both laminar and turbulent characteristics. Regarding quantitative assessment, Caulfield et al. [
27] proposed using dimensionless numbers to evaluate stratification in complex scenarios involving both temperature and salinity gradients. Following this, Castell et al. [
28] systematically compared various dimensionless parameters—including the MIX number, Richardson number (Ri), heating efficiency, Péclet number, and Reynolds number—and concluded that the Ri number offers a significant advantage in accurately representing the actual temperature distribution. In summary, numerical simulation, particularly three-dimensional (3D) modeling [
29,
30,
31], has become an indispensable tool for stratification research. Its advantages—low cost, high efficiency, and the ability to capture detailed flow field processes—have made it central to both revealing physical mechanisms and guiding engineering practice [
32].
In summary, while mixing hot and cold water is a primary method for creating laboratory-based stratification, existing techniques, particularly those relying on single-side fixed injection, show significant limitations in stability and uniformity. These methods depend on slow natural convection and thermal diffusion, making the process not only time-consuming, but also ineffective at achieving a uniform temperature distribution across the water surface. In the realm of numerical simulation, despite extensive research on thermal stratification itself, studies focusing on the active generation of stratification using towed dynamic mixing are notably scarce. The core technical challenge in simulating such moving boundary problems is that conventional mesh methods often encounter issues of grid distortion and reduced computational accuracy.
To address the aforementioned challenges, this study proposes an innovative solution. We employ the advanced overlapping dynamic mesh technique, which effectively handles complex moving boundary problems, ensuring computational stability and accuracy during the simulation of nozzle movement, making it an ideal mathematical tool for solving such engineering problems [
33]. Therefore, this study aims to fill the existing research gap through systematic three-dimensional (3D) numerical simulations. Specifically, we will compare four distinct hot water injection modes: single-side fixed discharge (Model-1), towed horizontal discharge (Model-2), towed vertical upward discharge (Model-3), and multi-nozzle towed vertical upward discharge (Model-4). Through comparative analysis, this research aims to clearly reveal the mechanisms by which key factors—such as nozzle mobility, discharge direction, and the heat source scale—influence the final stability and uniformity of the stratification. The findings will provide theoretical guidance and a basis for optimizing the efficient creation of stable and uniform stratified environments, holding significant practical value for applications such as underwater vehicle thermal stealth testing and aquatic ecosystem simulation.
To clearly present this research, the paper is organized as follows:
Section 2 details the mathematical and physical models employed, including the governing equations, numerical methods, boundary condition settings, and the grid and time-step independence studies conducted to ensure computational accuracy.
Section 3 presents and discusses in detail the numerical simulation results under various discharge strategies, providing a quantitative comparison of the stability and uniformity of the resulting stratification. Finally,
Section 4 summarizes the entire study and offers an outlook on the potential application value of this research.
2. Numerical Model and Validation
A three-dimensional (3D) transient numerical simulation was developed to systematically evaluate the influence of various hot water discharge methods on thermal stratification characteristics, thereby providing engineering guidance for practical applications. This section details the key components of the numerical method.
2.1. Mathematical Model
The primary fluids considered in this study are air and water, whose physical properties directly influence the computed flow and temperature fields.
2.1.1. Physical Properties of Air
For computational simplicity, the physical properties of air were treated as constant. This assumption is justified because the air temperature variation is minimal, and its influence on the thermal stratification process is primarily confined to the pressure boundary at the free surface and minor heat exchange. The constant values adopted for these properties are listed in
Table 1.
Given the relatively minor variations in air temperature anticipated within the scope of this study, and acknowledging that its influence on the thermal stratification process predominantly manifests through the pressure boundary condition at the free surface and limited thermal exchange, air is treated as a fluid with constant physical properties to simplify the computational model. The constant values adopted for these air properties are itemized in
Table 1 [
34].
2.1.2. Thermophysical Properties of Water
During the injection process, the density difference between the injected hot water and the colder ambient water drives natural convection. Simultaneously, turbulence enhances the mixing of the fluids, and heat is transferred via conduction from warmer to cooler regions. Over time, the interplay of these phenomena—natural convection, turbulent mixing, and heat conduction—leads to the formation of a stable vertical thermal stratification.
To enhance the simulation’s fidelity and accuracy, the physical properties of water, which are known to be temperature-dependent, were defined as functions of temperature. These temperature-dependent functions were implemented in the ANSYS Fluent 2022 R1 solver [
35] via User-Defined Functions (UDFs).
The density of water,
, is calculated using the following formula:
The specific heat capacity of water is determined using the following expression:
The dynamic viscosity of water is given using the following equation:
The thermal conductivity of water is calculated using the following formula:
In these equations, represents the temperature, with units of Kelvin (K).
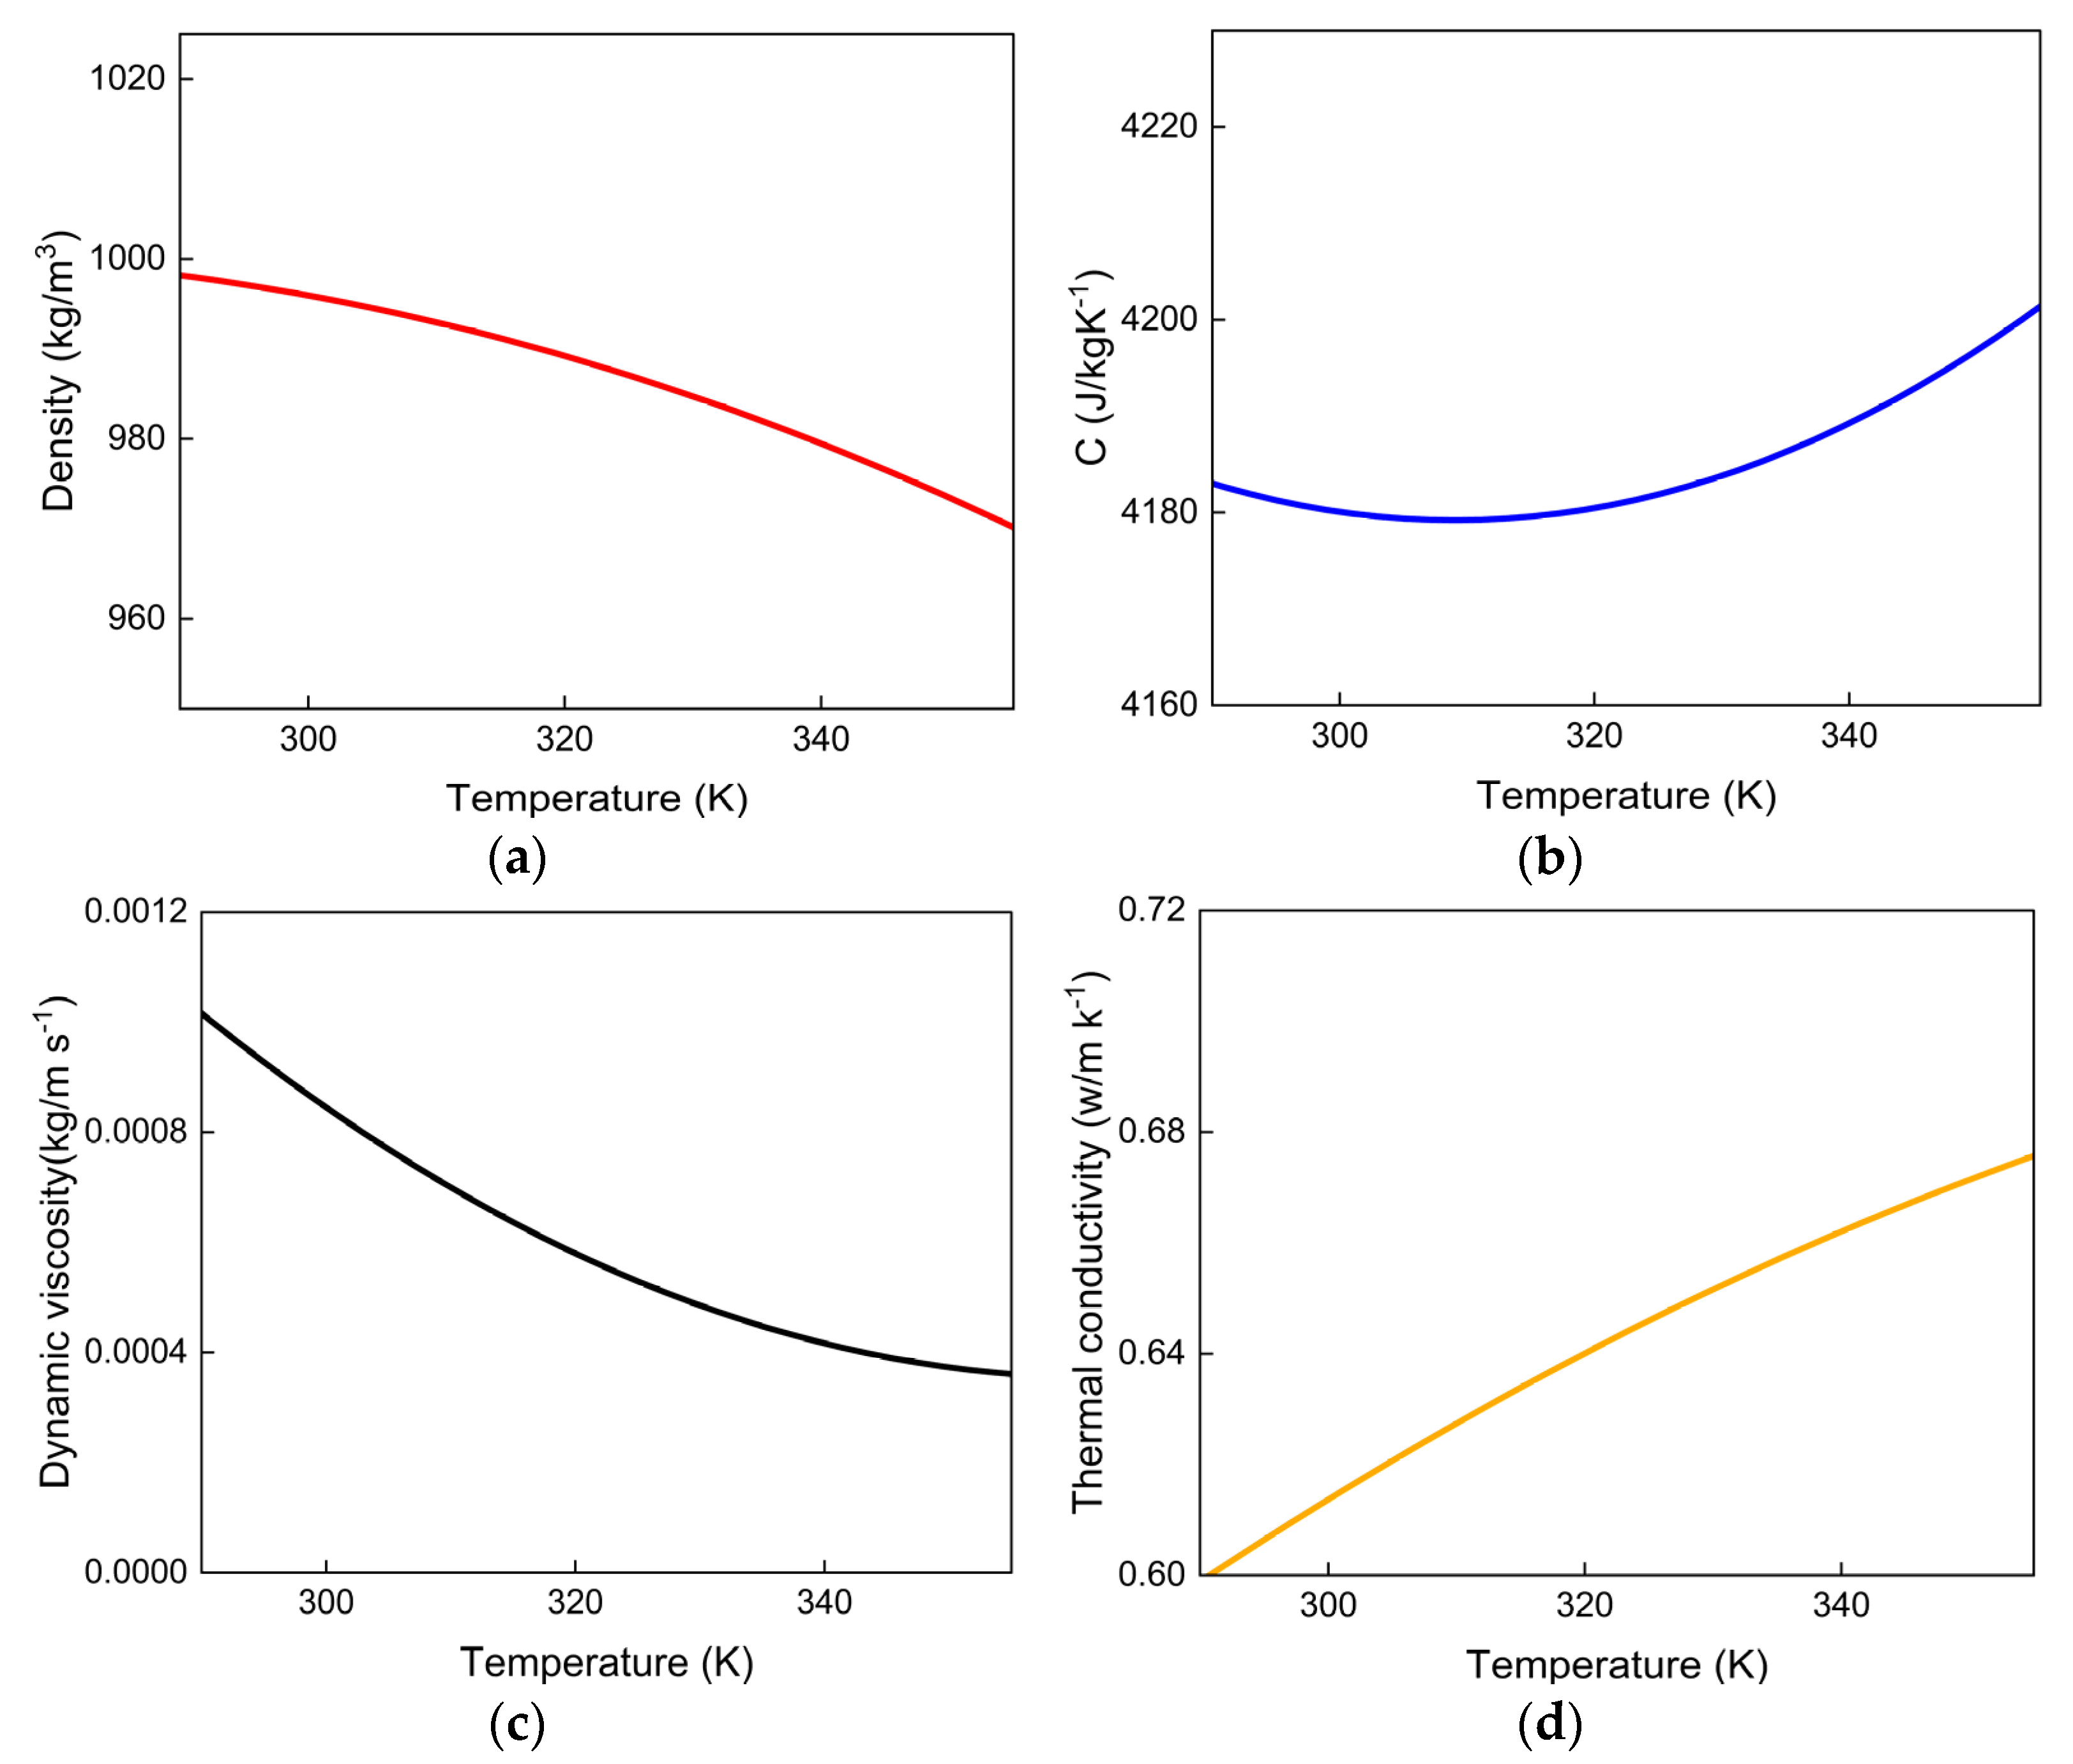
To visually represent these temperature-dependent properties over the operational range of this study, the curves derived from Equations (1)–(4) are plotted in
Figure 2. As is evident in
Figure 2a, the density of water decreases significantly with increasing temperature, which is the key physical mechanism driving the buoyancy effects and thermal stratification. This non-linear behavior validates the necessity of implementing these precise definitions via User-Defined Functions (UDFs).
In fluid dynamics, the Reynolds number (Re) is the primary criterion used to determine the flow regime. For flow within a pipe, a Reynolds number below 2100 generally indicates laminar flow, whereas a value above 4000 signifies turbulent flow. The Reynolds number is calculated as follows:
The dimensionless Reynolds number (
), calculated as follows:
where
is the fluid density (kg/m
3),
is the fluid velocity (m/s),
is the characteristic length (m), and
is the dynamic viscosity of the fluid (kg/(m·s)).
2.1.3. Governing Equations
To accurately capture the physics of thermal stratification, the simulation must account for variations in fluid density. Although the physical properties of the air phase are assumed to be constant for computational simplicity, the system as a whole is treated as a variable-density flow. This is justified by two key aspects of the model:
- (1)
The Volume of Fluid method is employed to track the air–water interface, where the density ρ in a computational cell is a volume-fraction-weighted average of the two phases, making it inherently variable in space and time;
- (2)
More critically, the density of water is defined as a function of temperature (as shown in Equation (1)) to model the buoyancy forces that drive natural convection. Consequently, the general forms of the conservation equations, which accommodate these density variations, are required and presented below.
This study numerically solves the continuity equation, the momentum conservation equations, and the energy equation.
The continuity equation is expressed as follows:
The momentum conservation equations, accounting for buoyancy and turbulence effects, are expressed as follows:
The energy equation, accounting for heat transfer via both convection and conduction, is expressed as follows:
For this study’s configuration—a nozzle diameter of 20 mm and a discharge velocity of 0.112 m/s—the resulting Reynolds number at the outlet exceeds 4000, indicating turbulent flow at the point of injection. Furthermore, transitional zones between laminar and turbulent flow are expected within the larger water body. Therefore, to accurately capture these complex flow phenomena, the Realizable k-ε model was selected from among the various Reynolds-Averaged Navier–Stokes (RANS) models. This choice is justified by its superior performance in simulating engineering flows. The Realizable k-ε model is an enhanced version of the standard k-ε model, incorporating constraints on Reynolds stresses to ensure more physically realistic behavior.
Considering the turbulent characteristics of the nozzle jet in this study, the complex mixing process generated by the interaction between the thermal plume and the ambient water body, as well as the requirements for computational resources and solution stability, this study selected the Realizable
k-
ε turbulence model in the computational setup.
Precisely capturing the dynamic evolution of the air–water interface is essential for accurately modeling the thermal stratification process and the associated heat exchange at the free surface. To achieve this, the Volume of Fluid (VOF) method, a widely established technique in multiphase flow simulation, was employed. This model tracks the interface between immiscible fluids by solving a single set of momentum equations and tracking the volume fraction (
) of each phase within every computational cell [
36]. The volume fraction of the
q-th phase,
, is governed by the following continuity equation:
A cell is considered empty of the q-th phase if = 0, full if = 1, and to contain the phase interface if . The interface itself is tracked throughout the domain by solving the volume fraction transport equation.
2.2. Physical Model
2.2.1. Model Similarity Criteria
To ensure the simulation accurately replicates the actual physical process, the numerical model must be constructed based on the principle of physical similarity. Consequently, the physical model must satisfy the criteria of both geometric and gravitational similarity. For flows involving a free surface where gravitational effects are significant, the Froude number (
Fr) is a critical dimensionless similarity criterion, as it represents the ratio of inertial forces to gravitational forces. The Froude number is defined as follows:
where
is the characteristic velocity,
is the gravitational acceleration, and
is the characteristic length. Accordingly, the Froude similarity criterion guides the geometric model design and the setup of operating conditions, ensuring that dynamic similarity is maintained across different scales.
2.2.2. Computational Mesh and Overlapping Mesh Technology
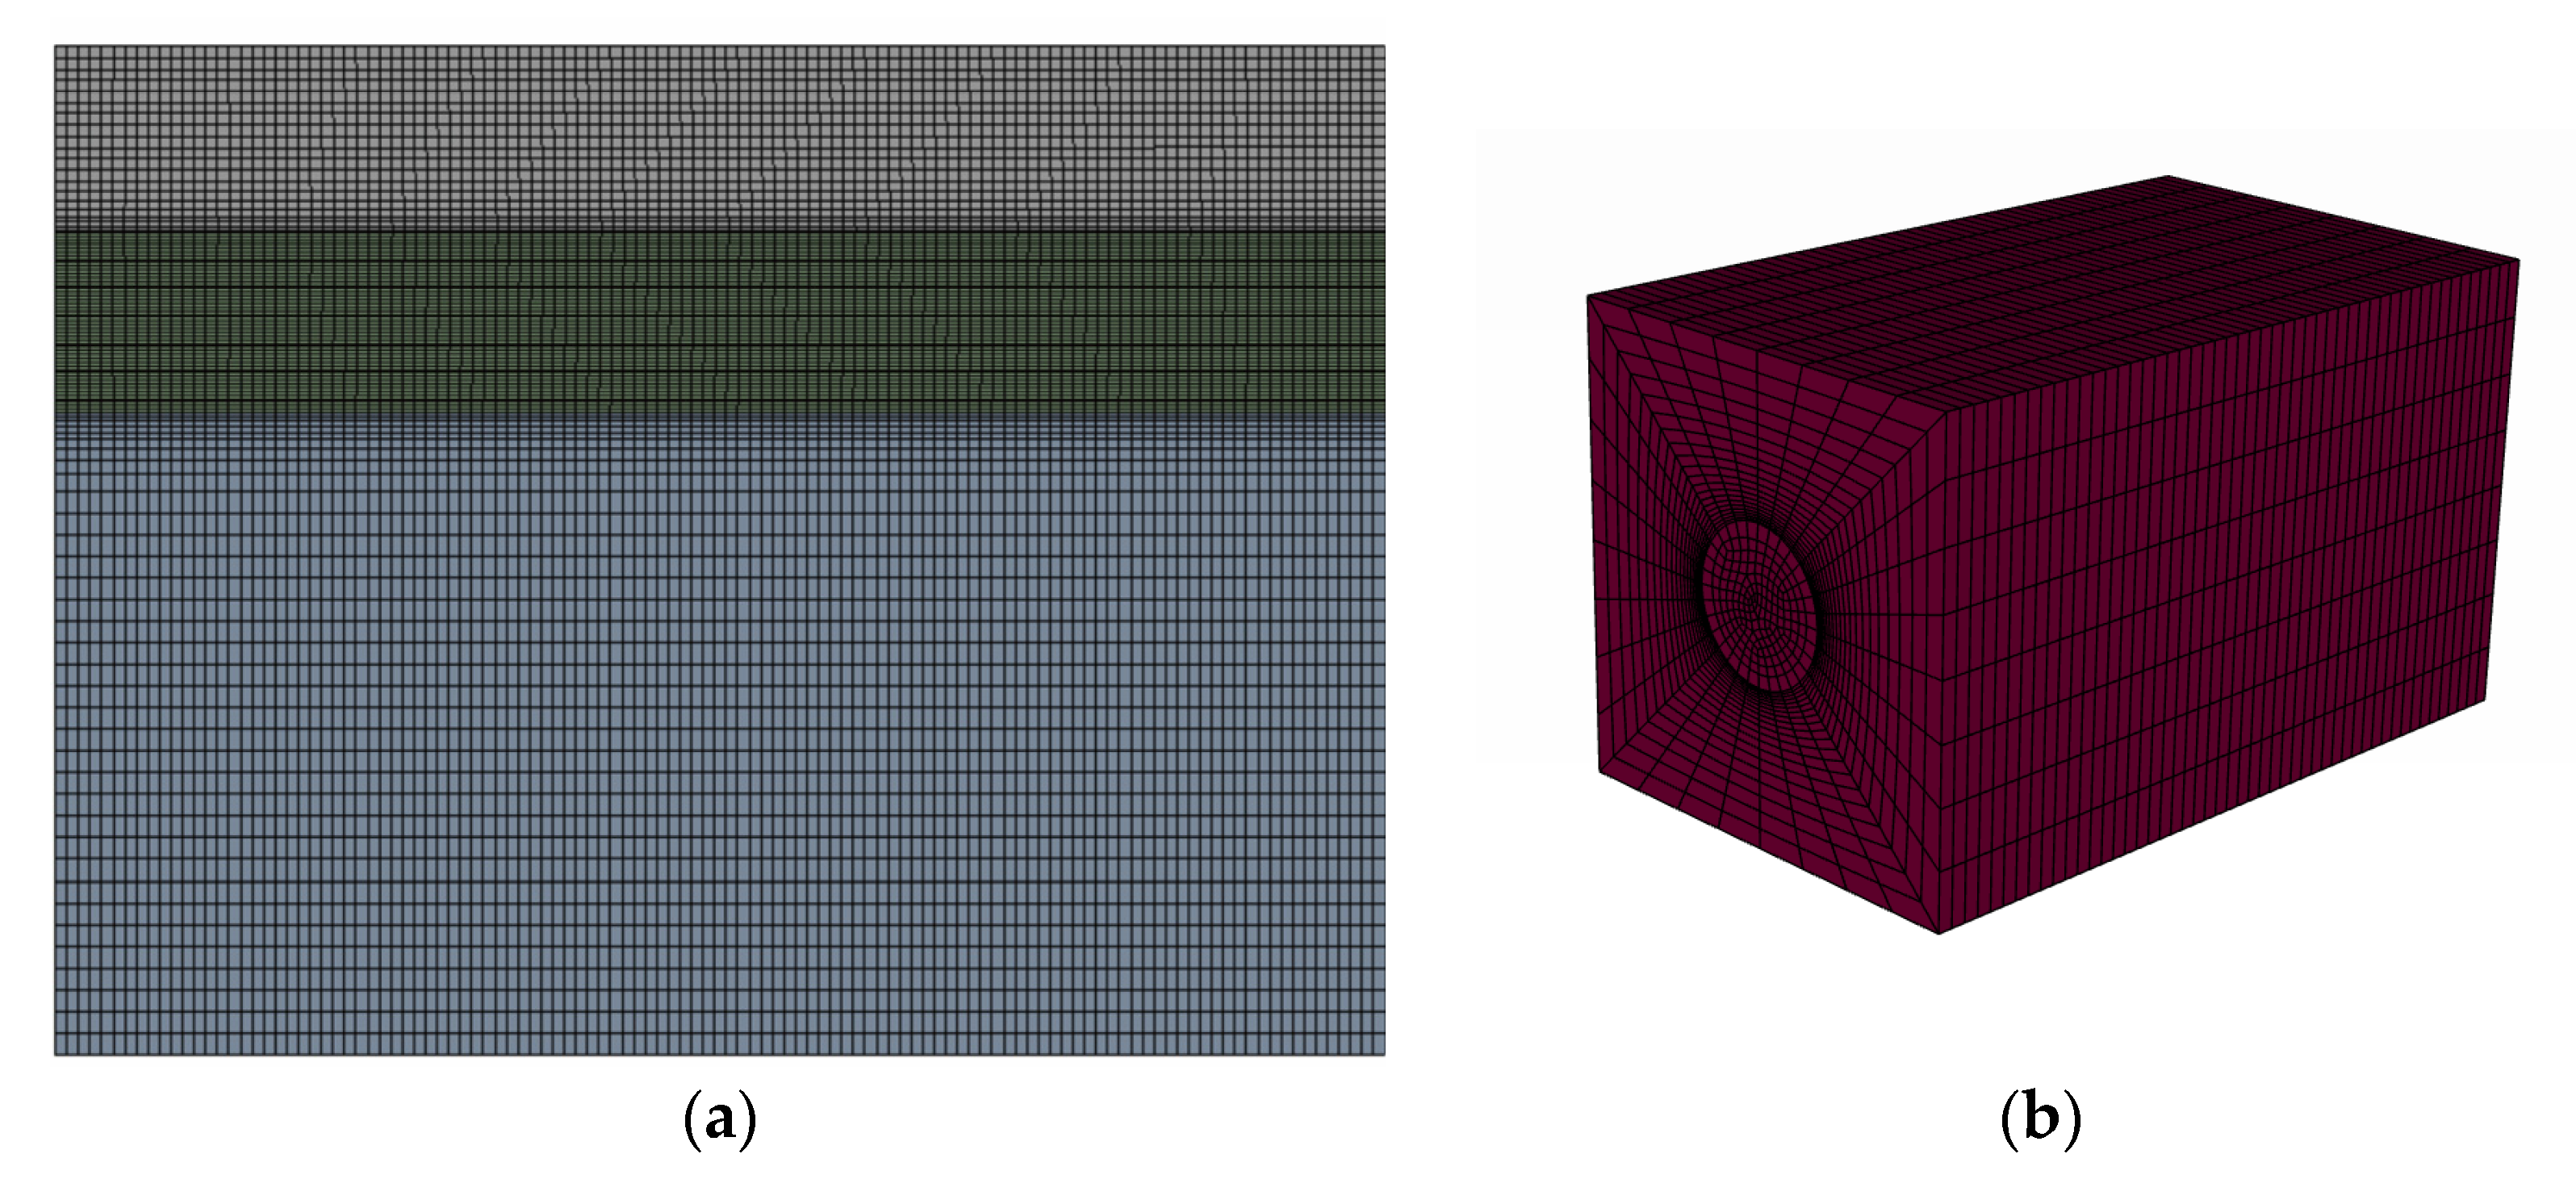
The dynamic process of discharging hot water from a moving nozzle represents a classic moving boundary problem in numerical simulation. To accurately simulate this process, the overlapping mesh technique was employed. This technique facilitates the decomposition of a complex computational domain into several simpler subdomains, each of which can be meshed independently with high quality. As illustrated in
Figure 3, the computational domain is composed of two primary mesh components:
- (a)
Background Mesh: This primary, static mesh encompasses the main water body and the overlying air domain. It is discretized with structured hexahedral cells to ensure both high mesh quality and computational efficiency;
- (b)
Component Mesh: This independent subdomain mesh envelops the moving nozzle and its immediate vicinity, translating concurrently with it. To accommodate the nozzle’s complex geometry and precisely capture the intricate surrounding flow field, this component mesh is discretized with an unstructured hybrid grid. Specifically, this grid is a hybrid composition of polyhedral and hexahedral cells, generated within the ANSYS Fluent Meshing environment.
2.3. Fundamental Assumptions and Boundary Conditions
To enhance computational efficiency and convergence while preserving the essential physics, the model was simplified based on the following assumptions:
- (a)
Adiabatic Walls: All solid boundaries of the water domain are assumed to be adiabatic, meaning there is no heat transfer between the system and the external environment through these surfaces;
- (b)
Continuous Heat Source: The hot water injection from the nozzle is treated as a steady, continuous heat source, characterized by a constant flow rate and temperature throughout the simulation;
- (c)
Negligible External Forces and Internal Heat Sources: The only body force considered is gravity. All other external forces and any internal heat generation within the fluid are neglected.
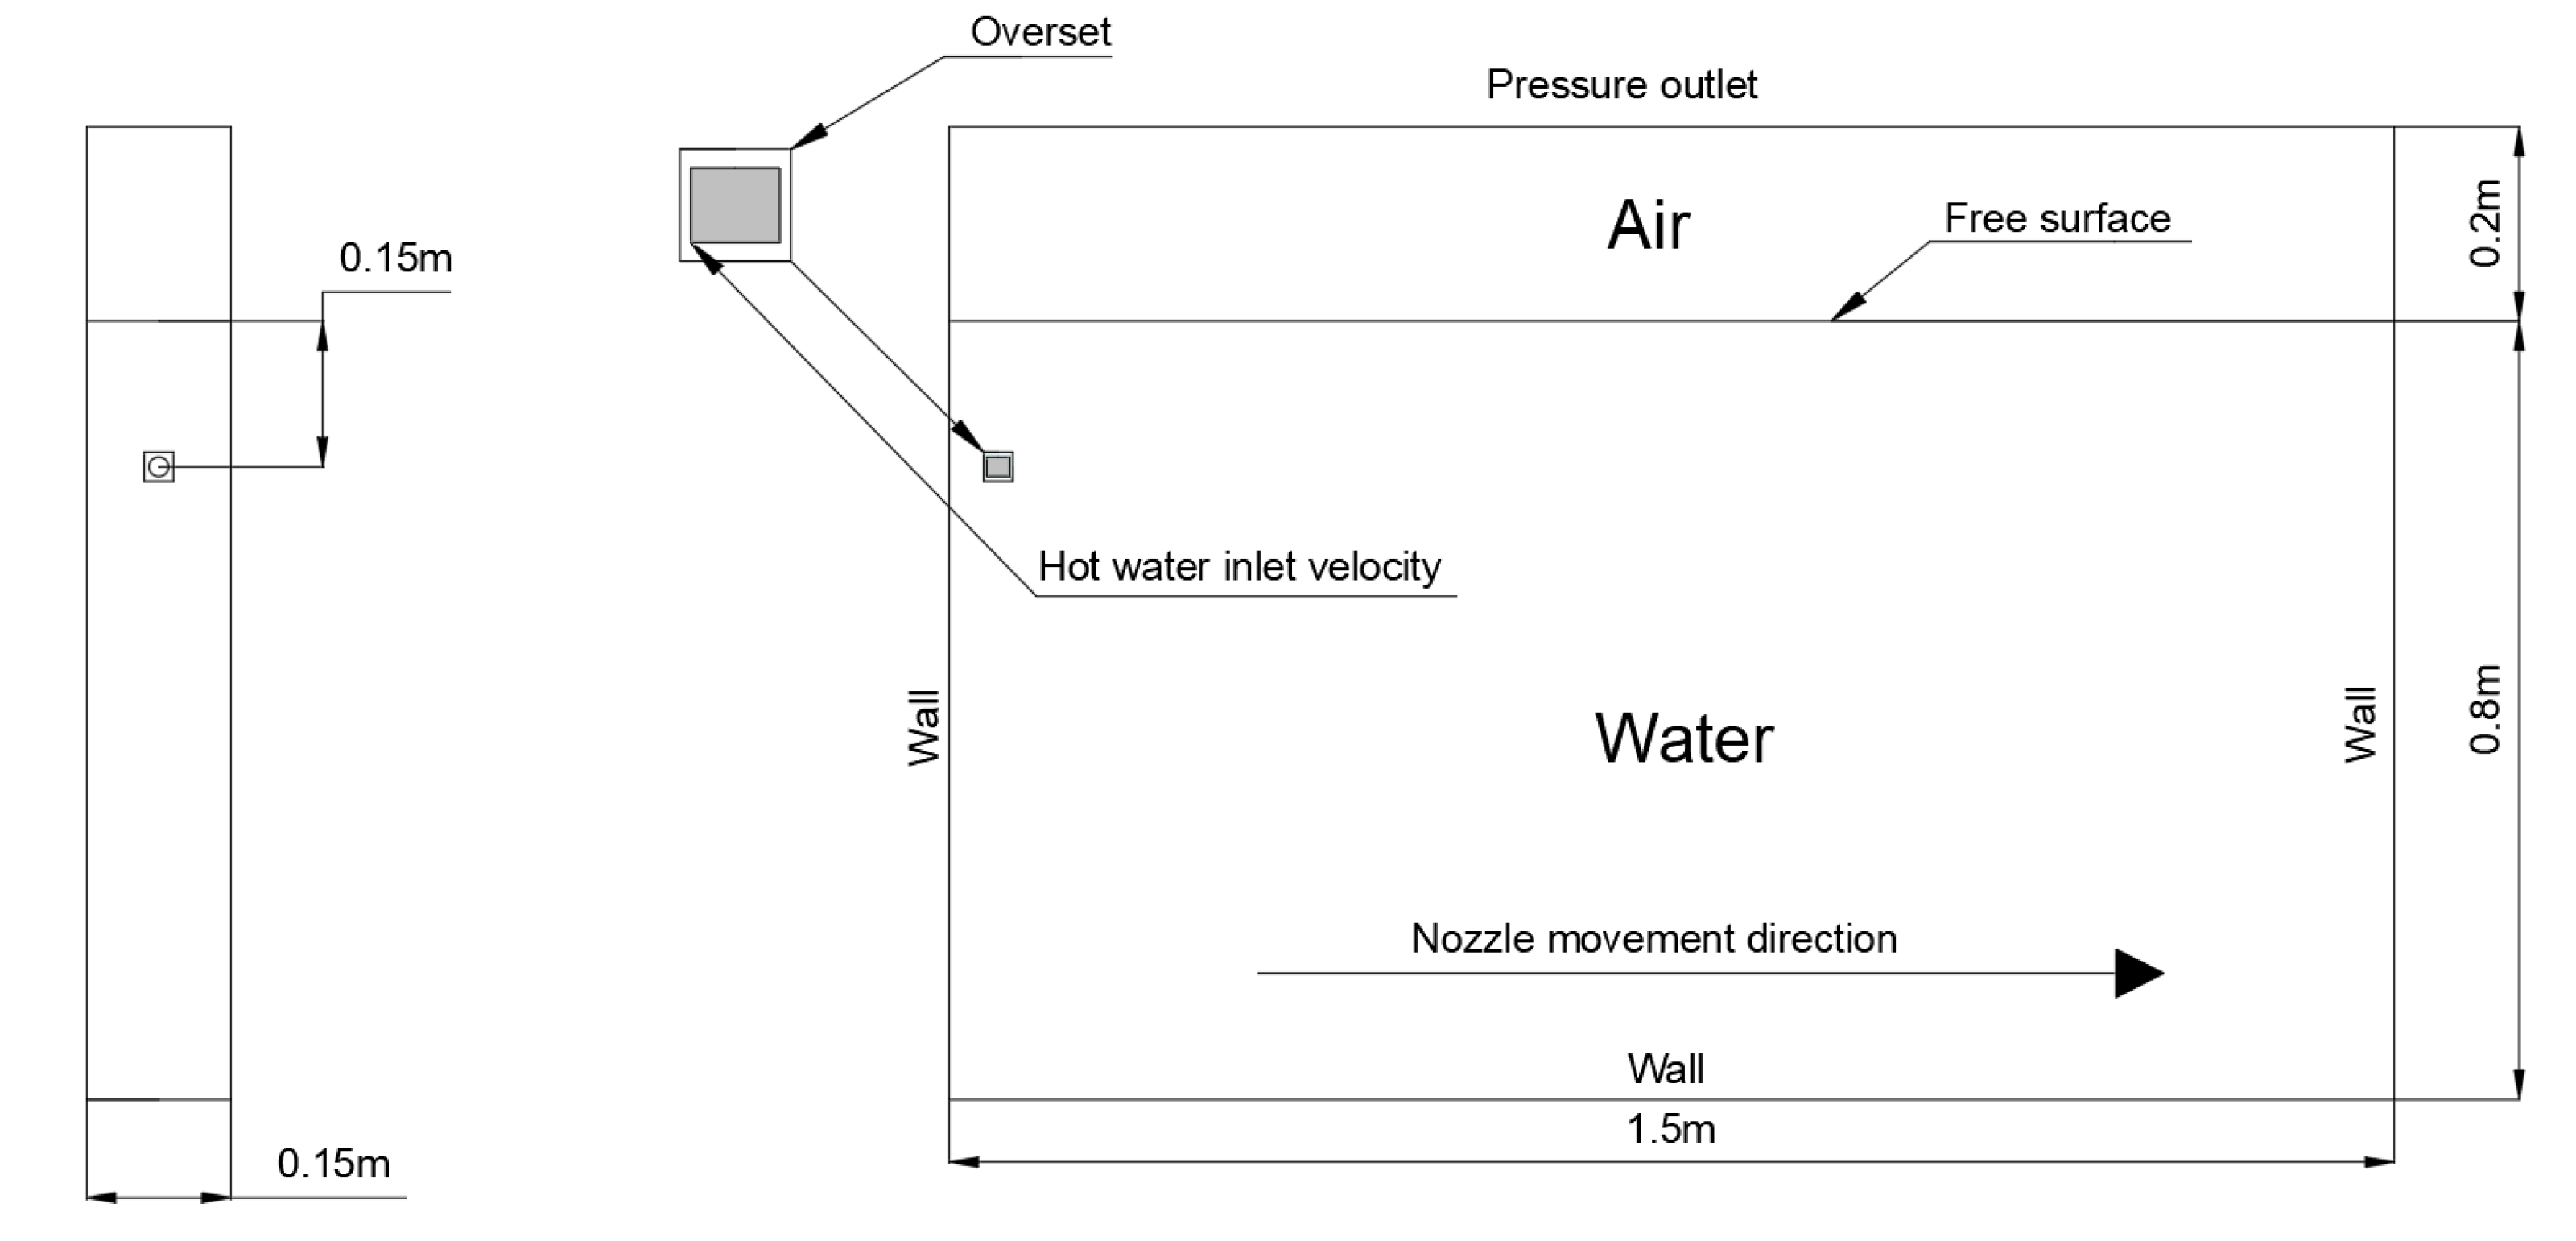
The computational domain and its associated boundary conditions are illustrated in
Figure 4. The top surface was defined as a pressure outlet boundary, while the nozzle orifice was set as a velocity inlet. The remaining boundaries—the front, back, left, right, and bottom surfaces—were configured as stationary, no-slip walls. The nozzle’s transverse motion was prescribed using a User-Defined Function (UDF). The dynamic mesh zone, corresponding to the component mesh, was defined to include the nozzle surface and its immediate surrounding region.
A velocity inlet boundary condition was specified at the nozzle outlet. Given the coupling between the energy and momentum equations, a pressure-based solver was employed to solve the governing equations. The convection terms were discretized using the second-order upwind scheme. The solution was deemed converged when the following criteria were met: the residual for the continuity equation fell below 10−3 and the residuals for all other governing equations dropped below 10−6.
The model utilized a hybrid mesh, combining both structured and unstructured elements. To enhance computational accuracy and accelerate convergence, the solver was configured as follows: The SIMPLE algorithm was employed for pressure–velocity coupling. Gradients were discretized using the Green–Gauss Cell-Based scheme, and pressure interpolation was handled via the PRESTO! scheme. A second-order upwind scheme was applied to discretize the momentum and energy equations. The under-relaxation factors were set to 0.3 for pressure, 0.7 for momentum, and 0.8 for energy. A maximum of 20 iterations were performed per time step.
2.4. Simulation Cases
To investigate the role of different discharge strategies in creating and maintaining thermal stratification, four representative models were designed for comparative analysis. The key parameters for each model are detailed in
Table 2.
Model-4 features a water volume three times that of Model-3 and employs three equally spaced, upward-discharging nozzles. The total heat input is also tripled, thereby maintaining an average heat input per unit volume that is comparable to that of Model-3. The simulation of this large-scale, multi-nozzle model is intended to provide engineering guidance for optimizing stratification strategies in larger water bodies, as shown in
Figure 5.
2.5. Dimensionless Parameters Characterizing the Equations
To gain a deeper insight into the complex mechanisms of thermal diffusion and to ensure that the findings are generalizable beyond specific geometric scales and fluid properties, this study employs dimensionless analysis. The goal of this non-dimensionalization is to distill the complex physical processes into controlling relationships governed by a few key parameters. The key dimensionless parameters employed in this analysis, along with their definitions, are presented below.
Since temporal evolution is a critical aspect of the transient stratification process, physical time is non-dimensionalized to create a normalized timescale for comparison. It is defined as the ratio of the physical time,
, to the total simulation duration,
. The formula is as follows:
To facilitate a scale-independent analysis of the vertical temperature profile, the vertical coordinate (
) is non-dimensionalized. This dimensionless height,
, represents the ratio of the local vertical position,
, to the total water depth,
:
The water body vertical stability coefficient is a direct indicator for measuring the static stability of a water body, reflecting the water body’s ability to resist disturbance and maintain stratification. This paper uses the water body vertical stability coefficient
to judge whether water body thermal stratification occurs. When
, the water body is considered to be a mixed water body. When
, the water body is considered to be a weakly stratified water body. When
, the water body is considered to be a stratified water body [
37].
where
is the water body vertical stability coefficient;
,
ρo are, respectively, the bottom-layer and surface-layer water body density;
is the water body vertical average density; and
is the water depth.
The Richardson number (
Ri) was selected in this study to quantify the stability of the thermal stratification. As a dimensionless parameter, it represents the ratio of buoyancy forces (which suppress turbulence) to shear-induced mixing forces (which generate turbulence). A low
Ri value indicates that mixing is dominant, whereas a high
Ri value signifies that buoyancy prevails, leading to strong and stable stratification [
38]. It is calculated as follows:
where
g is the acceleration due to gravity (
);
is the thermal expansion coefficient of water (
);
H represents the total height of the water body (m);
and
are the temperatures at the top and bottom of the water body, respectively (K); and
is the inlet velocity (
).
The spatial uniformity of the thermal stratification is quantified using two distinct metrics:
This is the range of temperatures along a monitoring line, calculated as the difference between the maximum and minimum recorded values.
This is the standard deviation of all temperature points along the monitoring line. It serves as a robust statistical measure of thermal non-uniformity, where a higher value indicates greater temperature variation.
2.6. Mesh and Time-Step Independence Study
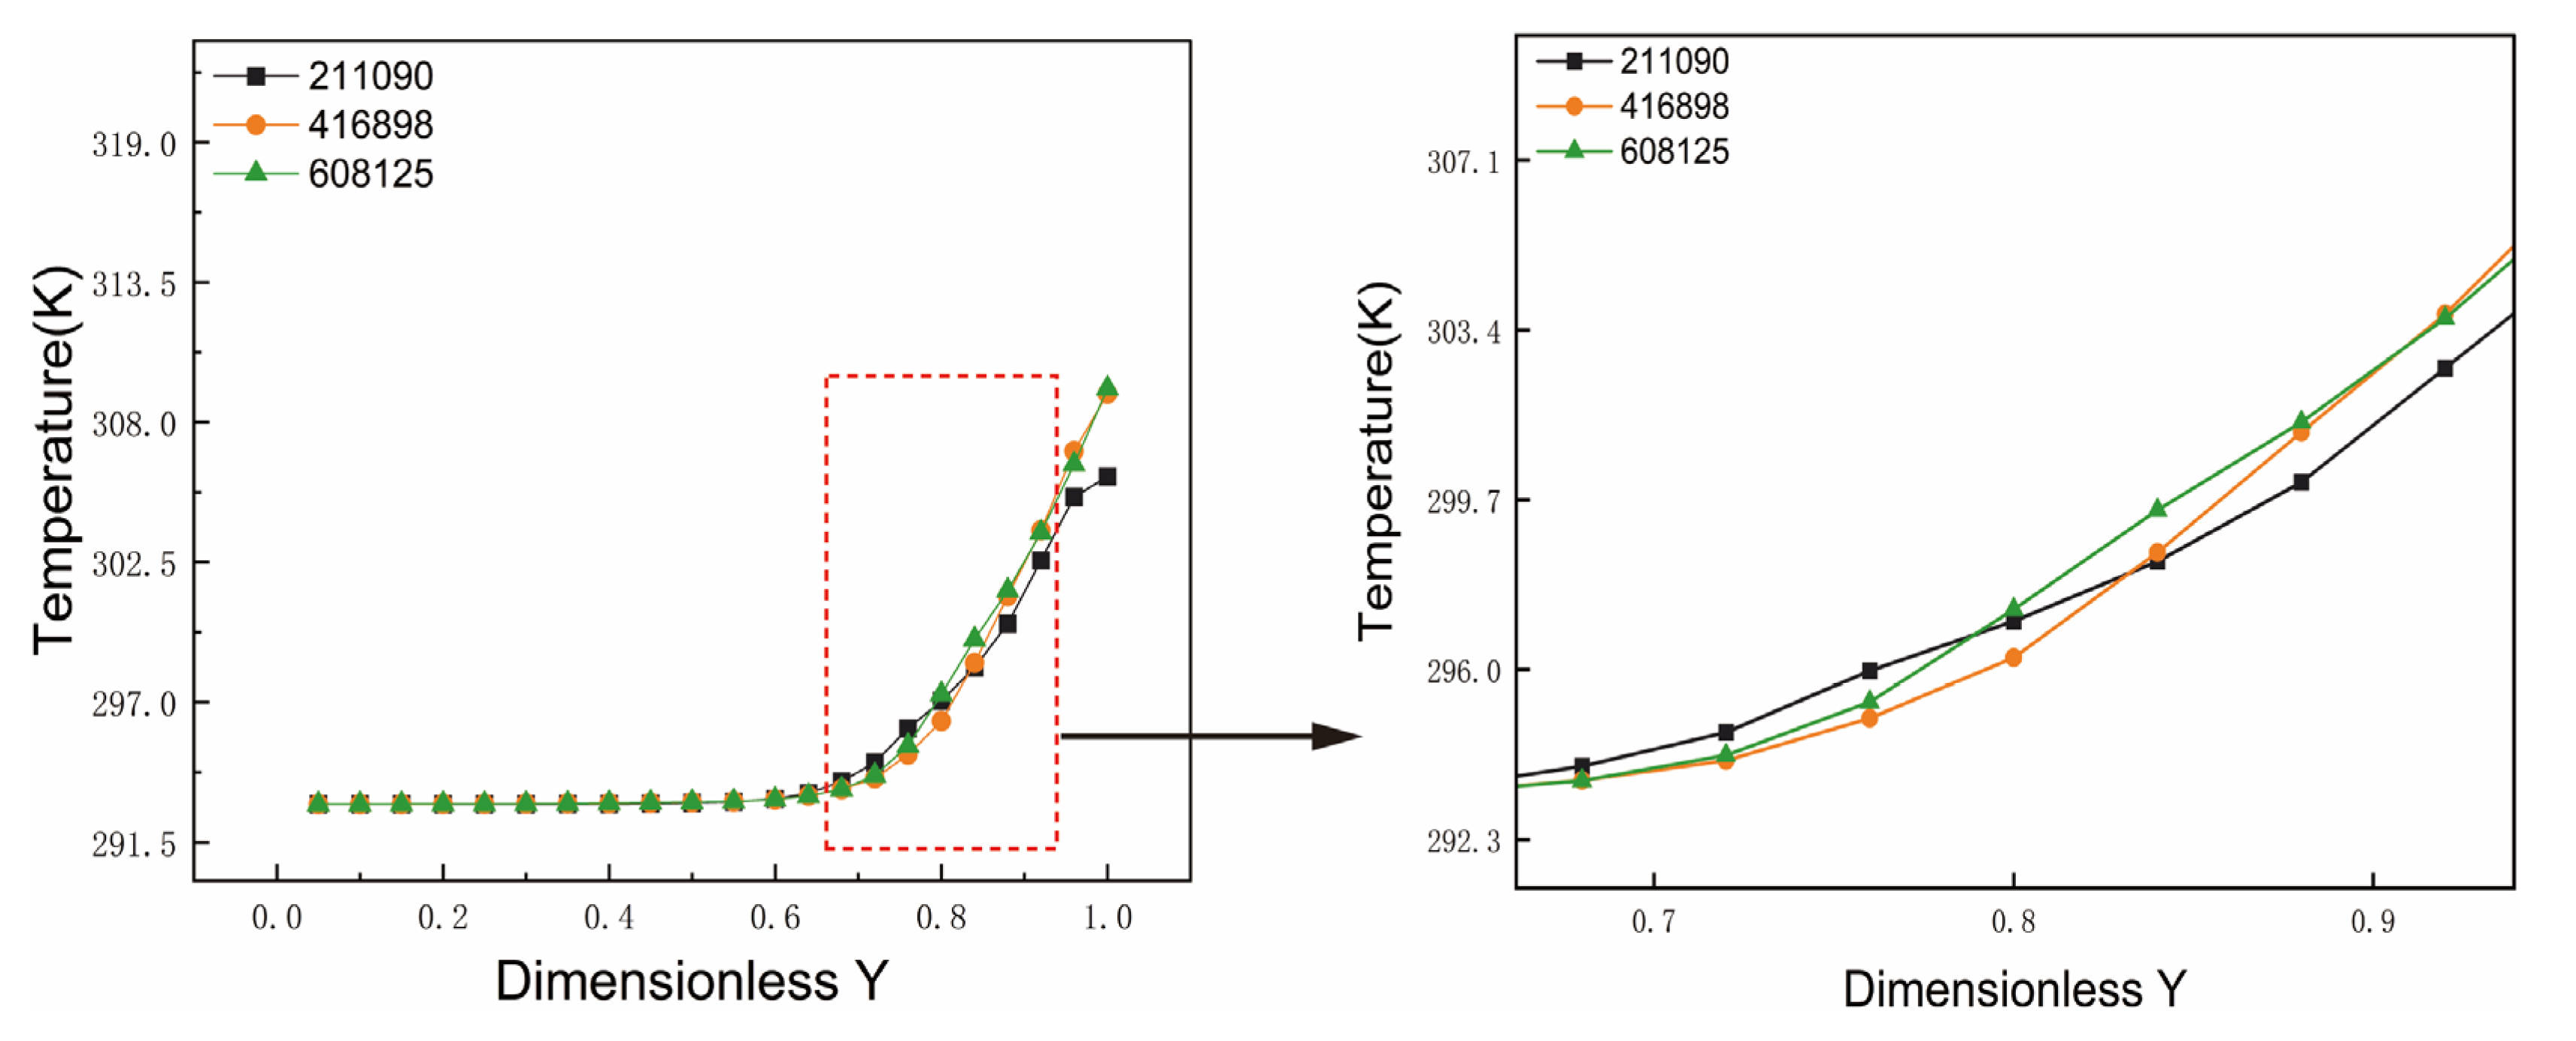
To balance computational efficiency with the accuracy and convergence of the numerical solution, a systematic study of grid and time-step independence was conducted. The objective of this validation was to identify an optimal discretization scheme that yields high-fidelity results at an acceptable computational cost. The validation was performed under the following conditions: an initial water temperature of 293 K and a nozzle outlet temperature of 353 K. The temperature distribution along the central axis at a snapshot in time () was chosen as the key metric to assess the impact of different discretization schemes.
Mesh density is a critical factor that directly affects both computational accuracy and cost. To identify a suitable mesh resolution, three configurations with varying cell counts were tested: a coarse mesh (211,090 cells), a medium mesh (416,898 cells), and a fine mesh (608,125 cells).
Figure 6 illustrates the temperature profiles obtained from the three mesh configurations. The profile from the coarse mesh deviates noticeably from those of the other two, particularly in regions with high temperature gradients, showing a maximum discrepancy of 1%. In contrast, the medium and fine meshes yield nearly identical results, with the maximum difference between their profiles being only 0.35%, which is considered negligible. This indicates that grid independence is achieved with the 416,898-cell mesh, as further refinement does not significantly alter the solution. Therefore, to balance computational accuracy with resource efficiency, the medium mesh (416,898 cells) was selected for all subsequent simulations. This configuration ensures reliable results while maintaining a manageable computational cost.
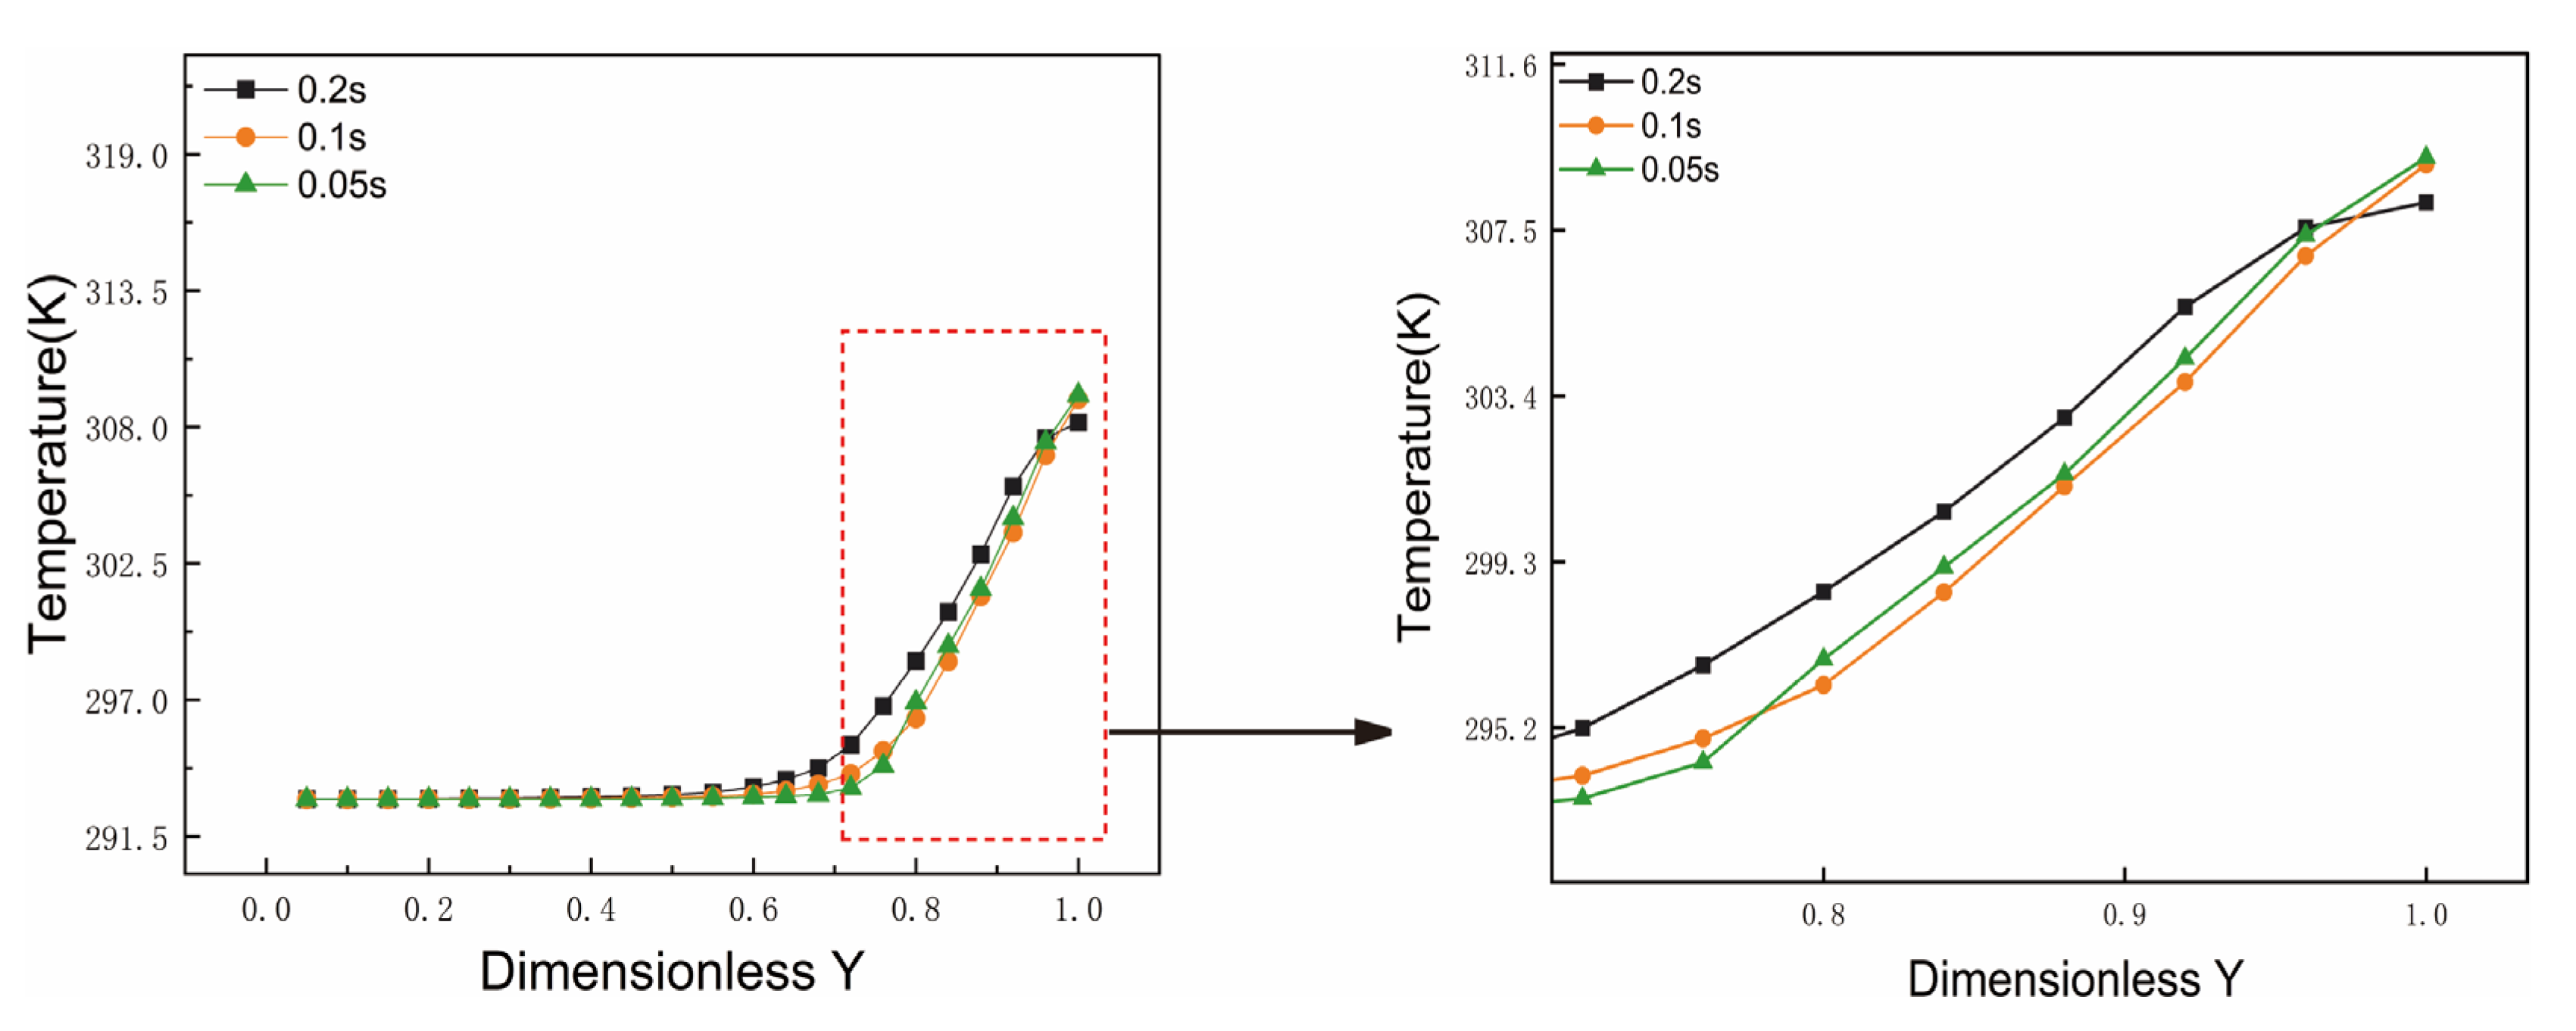
The choice of time step (Δ
t) is also critical for the stability and accuracy of transient simulations. Using the selected 416,898-cell mesh, a time-step independence study was conducted by testing three different values: Δ
t = 0.2 s, 0.1 s, and 0.05 s.
Figure 7 presents the resulting centerline temperature profiles for each time step. The results show nearly identical temperature profiles for all three time steps. The curves for Δ
t = 0.1 s and Δ
t = 0.05 s are virtually indistinguishable, indicating that further reduction in the time step beyond 0.1 s yields no significant improvement in the solution’s accuracy. Given that a smaller time step (e.g., 0.05 s) substantially increases the computational load without offering a discernible accuracy benefit over Δ
t = 0.1 s, a time step of Δ
t = 0.1 s was chosen as the optimal balance between accuracy and computational cost for all subsequent simulations.
3. Numerical Analysis of the Effects of Varying Inlet Parameters on Thermal Stratification
To systematically evaluate the role of different discharge strategies in creating and maintaining thermal stratification, this study comparatively analyzes four representative models: Model-1, a conventional single-side fixed discharge; Model-2, a towed horizontal discharge; Model-3, a towed vertical upward discharge; and Model-4, a multi-nozzle towed vertical upward discharge. Using transient numerical simulations, this investigation explores the effects of three key factors on the resulting thermal stratification: nozzle mobility (fixed vs. towed), discharge orientation (horizontal vs. vertical), and scale (single-point vs. multi-point heat source). The stability and uniformity of the stratification formed via each method are quantitatively assessed by comparing key metrics, including the water body vertical stability coefficient () and the Richardson number (Ri). The results of these comparative simulations are presented and discussed in detail in the subsequent sections.
3.1. Effects of Different Discharge Configurations on Thermal Stratification
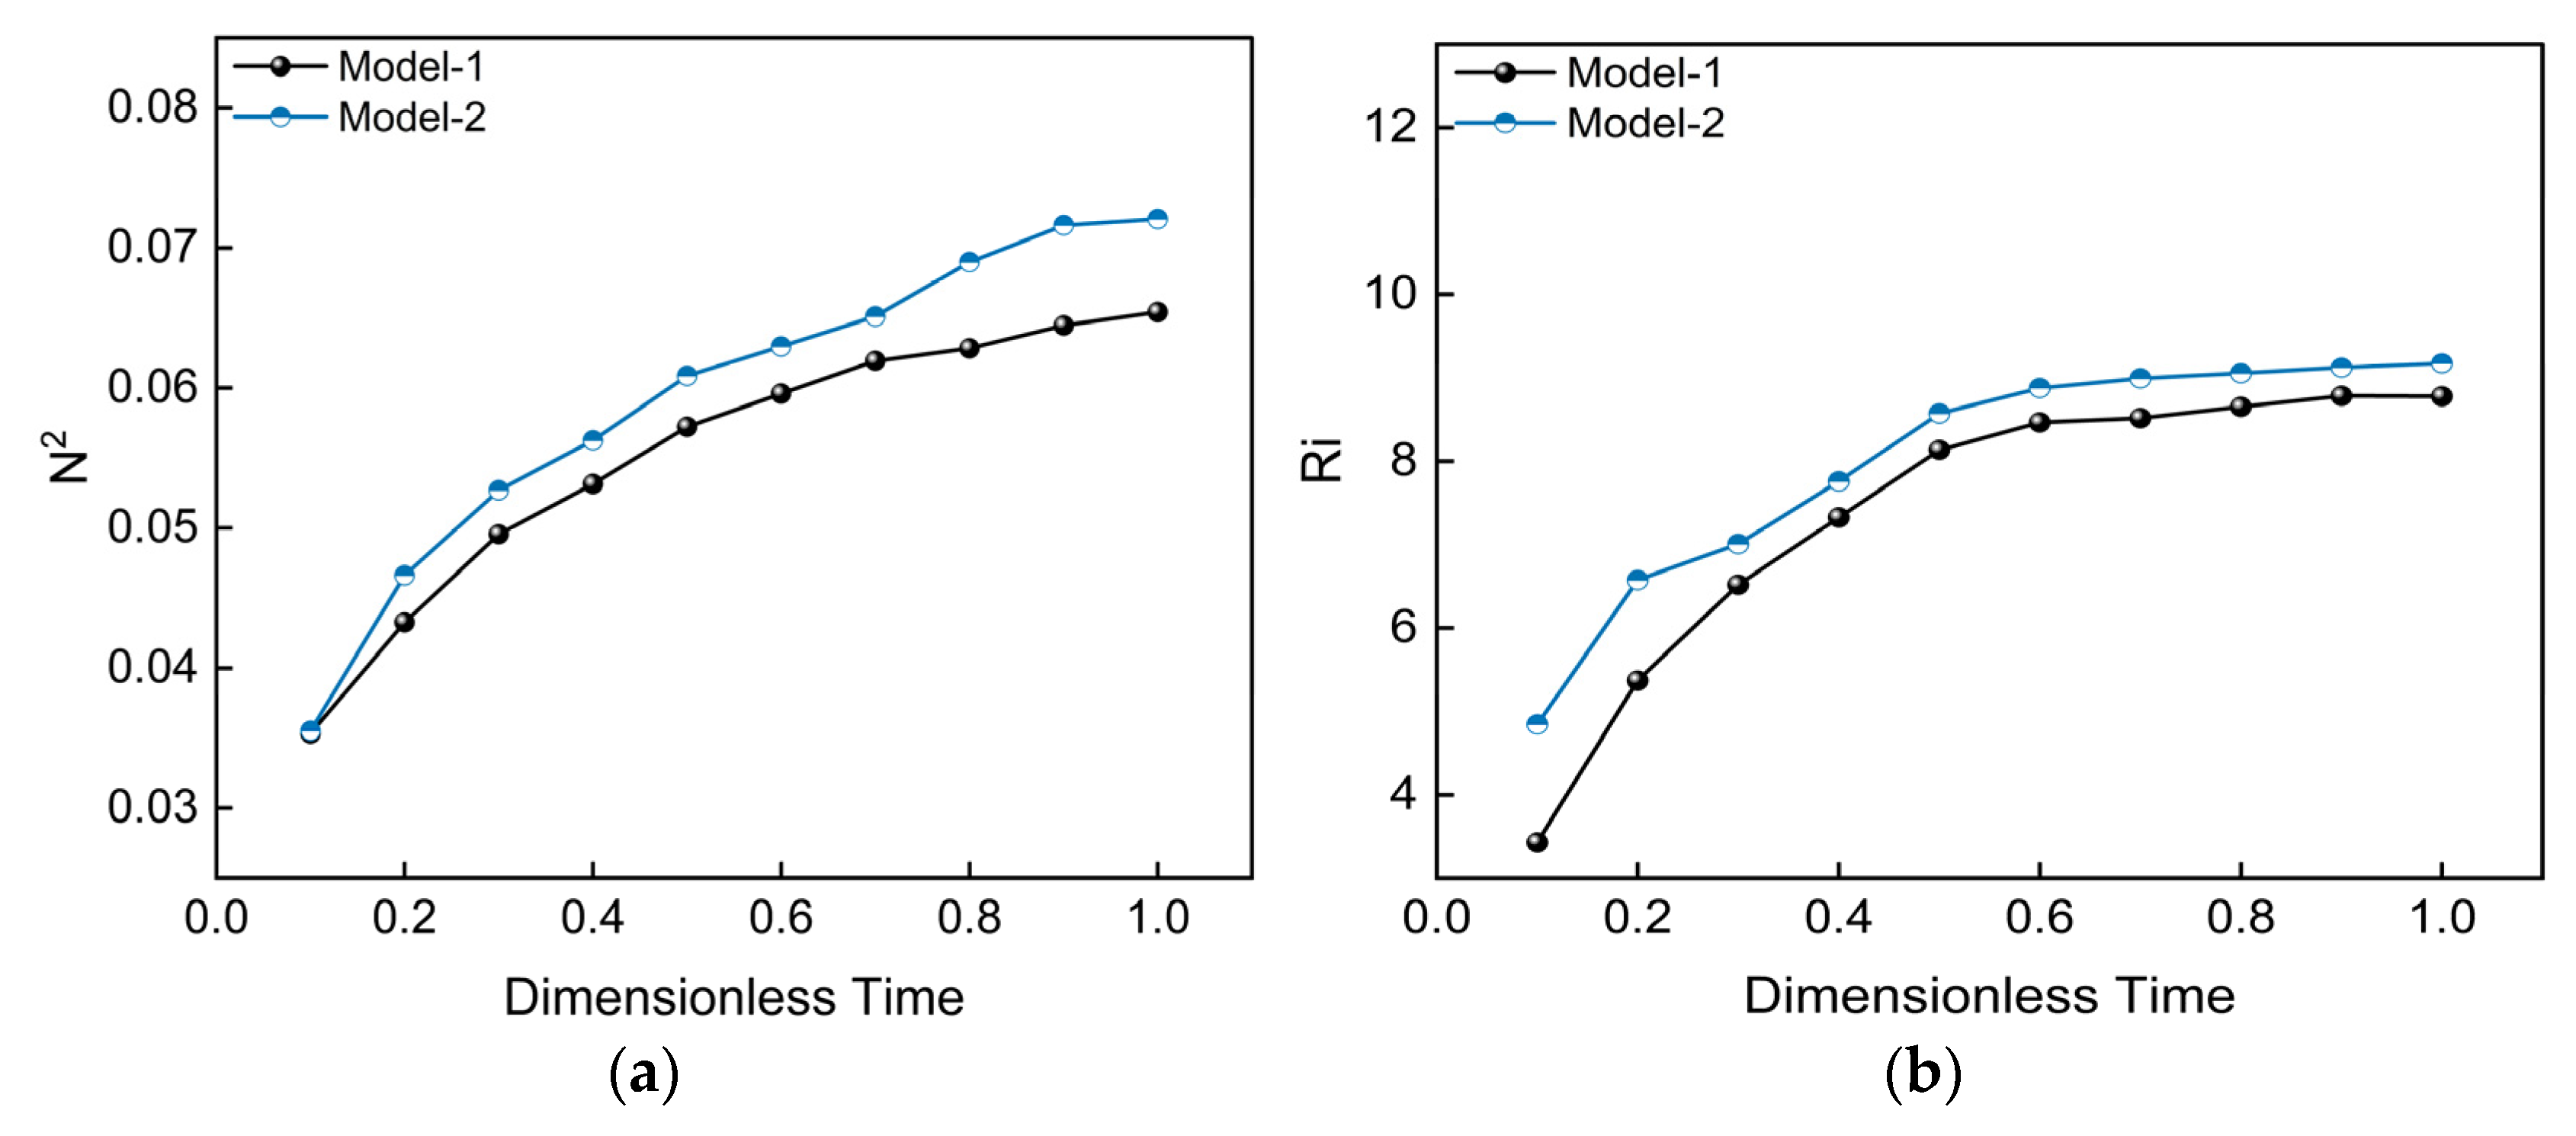
To isolate the effect of nozzle mobility on thermal stratification, this section presents a comparative analysis between the conventional fixed discharge (Model-1) and the towed horizontal discharge (Model-2). The initial temperature of the water body is 293 K, and the hot water is discharged at 353 K. For the 20 mm-diameter nozzle, the discharge velocity of 0.112 m/s was determined based on the Froude similarity criterion.
Figure 8a illustrates the temporal evolution of the water body vertical stability coefficient,
, for both the fixed (Model-1) and towed horizontal (Model-2) discharge strategies. For both models, specifically,
increases monotonically with dimensionless time, indicating a continuous enhancement of the stratification’s static stability. Notably, Model-2 maintains a higher
value than Model-1 throughout the simulation, achieving a 10.1% greater peak value at the final time step. This advantage stems from the towed discharge’s ability to distribute heat more uniformly over a wider area This process effectively suppresses the intense local mixing associated with a fixed injection point, thereby establishing a more robust thermal stratification.
As shown in
Figure 8b, the Richardson number (
Ri) for both models also exhibits a monotonic increase with dimensionless time. Throughout the entire simulation, the
Ri value for Model-2 is consistently and significantly higher than that of Model-1. At the final time step, its peak value shows a 4.5% improvement. This result is highly consistent with the
observations and further corroborates the conclusion that stratification stability is continuously enhanced over time.
The quality of thermal stratification is characterized by two key aspects: its vertical stability and its surface temperature uniformity. To provide a direct visualization of the latter, the temperature distribution on the free surface is analyzed, as illustrated in
Figure 9.
Figure 9a presents the final surface temperature field for Model-1. The field is characterized by extreme non-uniformity, with heat highly concentrated near the fixed injection point on the left, creating a distinct high-temperature core. From this core, heat slowly dissipates outward, leaving the majority of the surface area at a significantly lower temperature. This result clearly demonstrates that by relying solely on passive diffusion and natural convection, the fixed-point method is incapable of uniformly distributing heat across a large surface within a practical timeframe, leading to severe thermal gradients and poor overall uniformity.
Figure 9b shows the final surface temperature field for Model-2, where the temperature distribution is markedly more uniform. This vast improvement is a direct result of the active heat transport provided by the moving nozzle, which overcomes the passive diffusion limitations inherent to the fixed-point method. The small, high-temperature spot on the right is an expected artifact, representing the instantaneous position of the nozzle at the conclusion of the simulation.
To further quantify the impacts of stationary and mobile horizontal discharges on the uniformity of thermal stratification, the longitudinal centerline at the water–air interface, evaluated at a time snapshot taken 0.1 dimensionless time units after the discharge process had ceased, was selected as a monitoring profile. The magnitude of temperature variation along this profile was characterized by the temperature standard deviation and the maximum temperature difference. Specifically, the temperature standard deviation directly indicates the degree to which local temperatures depart from the profile’s average temperature, making its fluctuation range and magnitude key metrics for assessing thermal homogeneity.
Figure 10 presents a comparison of these metrics between Model-1 and Model-2.
The analysis of the temperature standard deviation (
) curves, presented in
Figure 10, reveals the pronounced advantage of the towed discharge in enhancing surface temperature uniformity. Model-1 exhibits significant temperature fluctuations along the centerline, reflected by its large maximum temperature difference (
= 0.98). This poor uniformity is a direct consequence of the single-point injection, where heat distribution relies solely on slow natural convection and diffusion. In stark contrast, Model-2 leverages its mobile heat source to actively distribute thermal energy along the axis, thereby dramatically reducing the deviation from the mean temperature. This is evidenced by a much smaller maximum temperature difference (
= 0.37). Although the horizontal jet in Model-2 still introduces some temperature variations due to mixing and surface spreading, its overall homogeneity is far superior to that of Model-1, effectively preventing the formation of extreme local temperature gradients.
The preceding analysis conclusively demonstrates that the towed horizontal discharge (Model-2) offers significant advantages over the conventional fixed-point injection (Model-1) in establishing both stable and uniform thermal stratification.
3.2. Influence of Varying Discharge Angles on Thermal Stratification
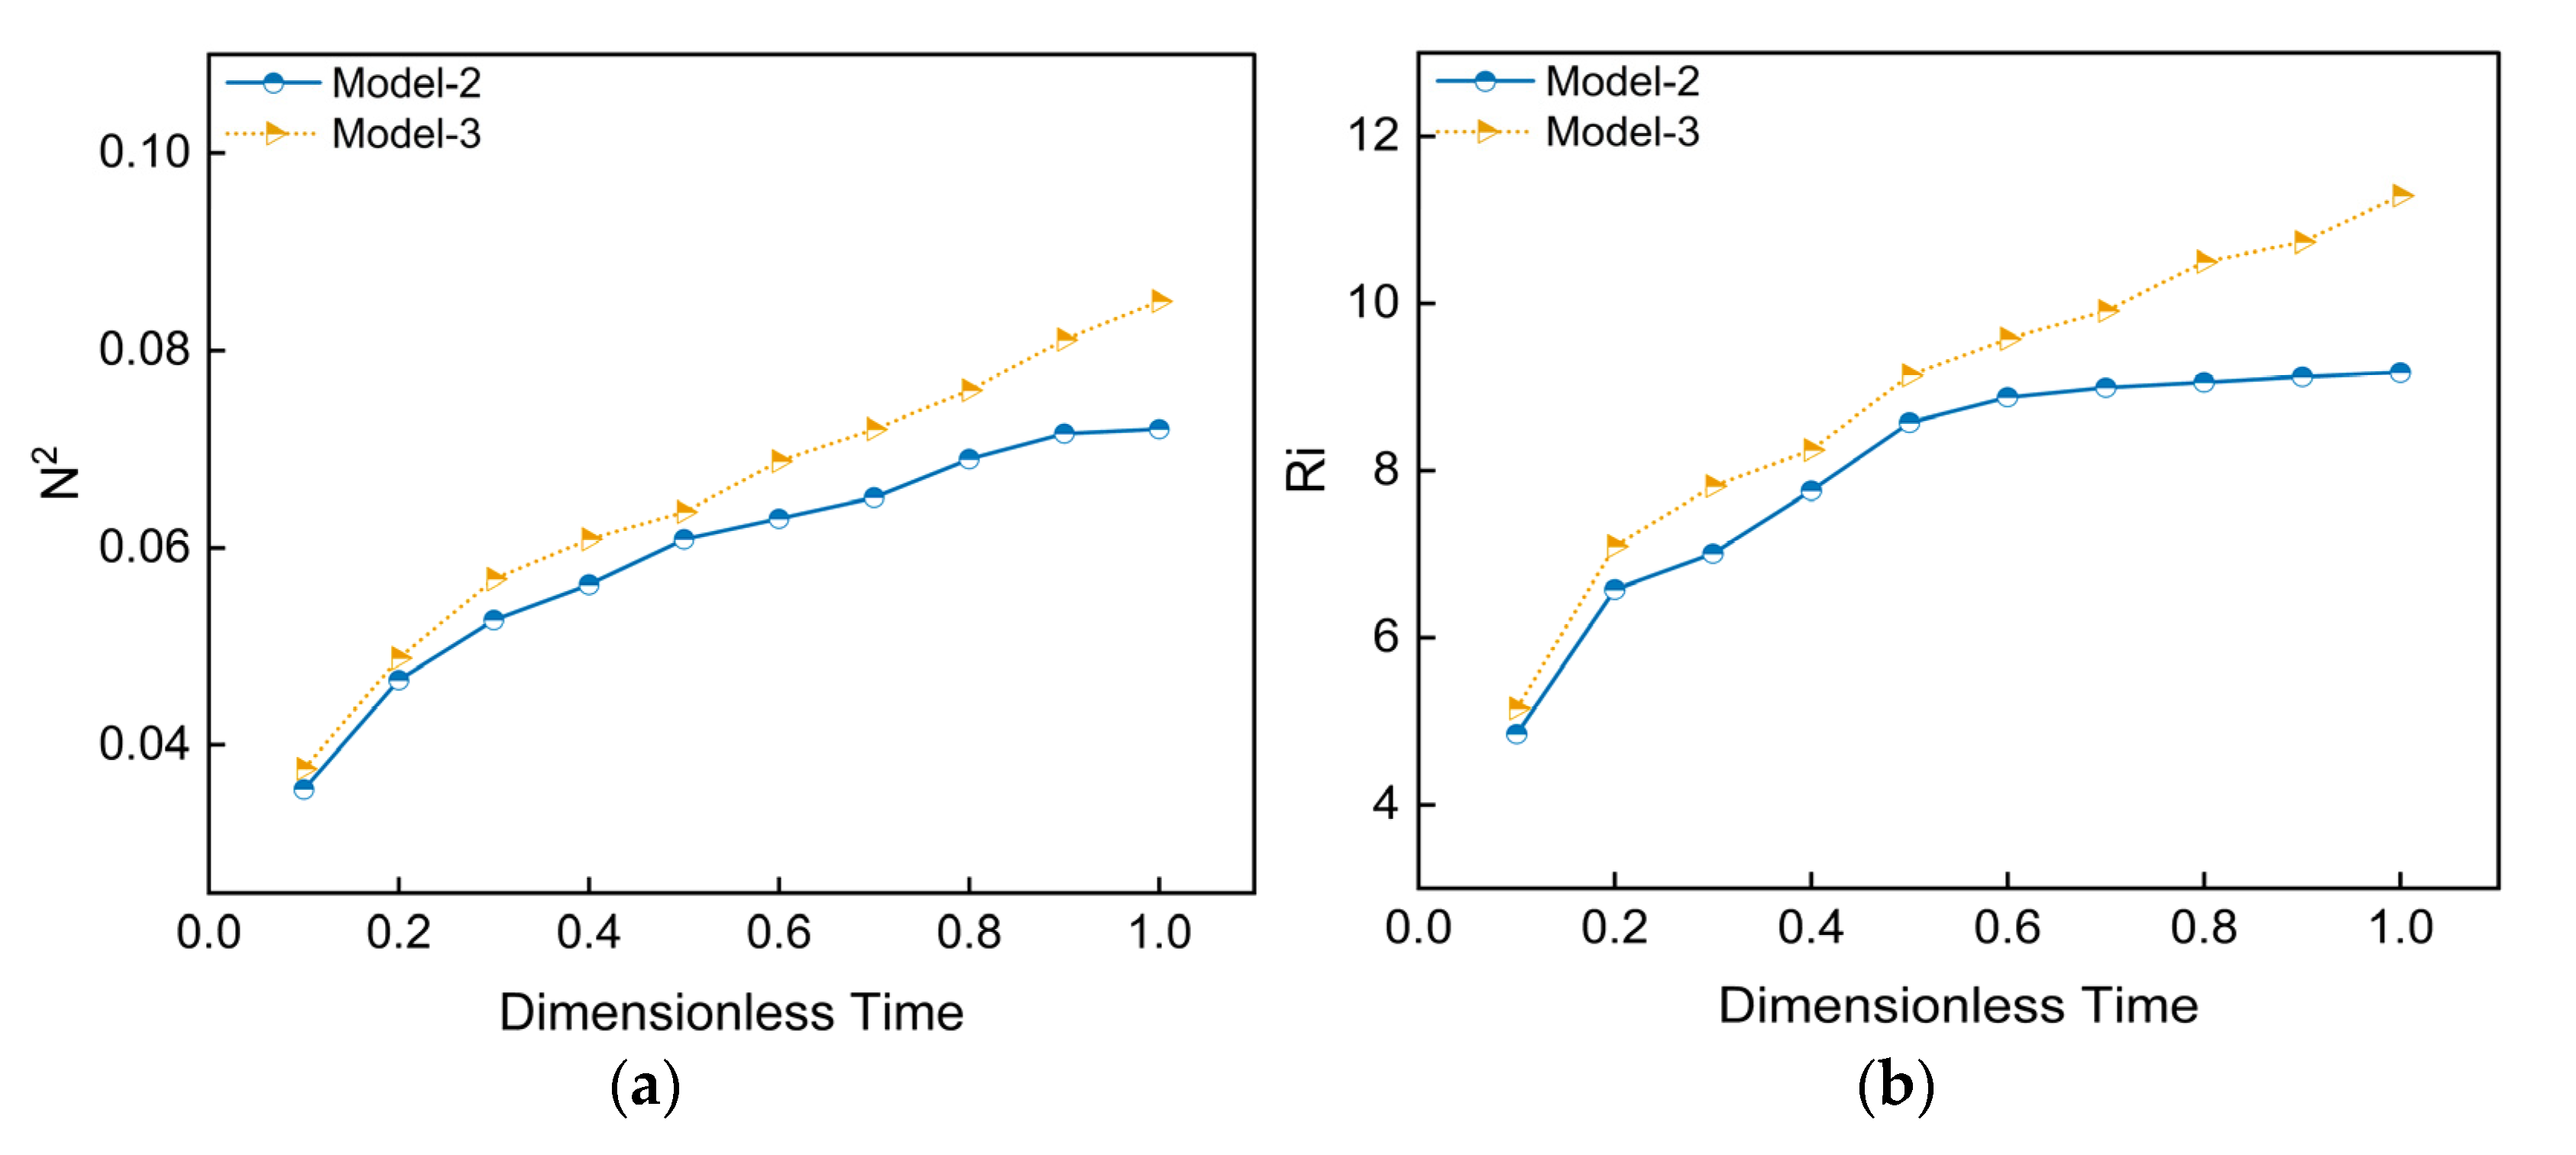
Having established the superiority of the towed discharge method, this section now investigates the influence of the discharge orientation. A quantitative analysis of dimensionless parameters is performed, comparing the towed horizontal discharge (Model-2) with the towed vertical upward discharge (Model-3). The objective is to identify the optimal orientation for establishing the most stable and uniform thermal stratification.
Figure 11a,b reveal that while both
and
Ri increase over time for both towed configurations, the vertical discharge (Model-3) consistently outperforms the horizontal discharge (Model-2). At the final time step, Model-3 achieves peak values for
and
Ri that are 17.9% and 23% higher, respectively. This indicates a markedly stronger static stability. The superior performance of Model-3 is attributed to its mechanism: the vertical discharge directly transports the buoyant, hot water plume to the upper layer. This path minimizes entrainment with the surrounding colder water, leading to a more efficient establishment of a robust thermal structure. Conversely, the initial horizontal momentum of the jet in Model-2 induces significant mixing near the discharge point. Furthermore, its subsequent buoyant ascent through the water column allows for greater thermal dissipation, ultimately resulting in a comparatively weaker final stratification.
As illustrated in
Figure 12, the vertical upward discharge mode also establishes a large-scale uniform temperature zone on the water surface, reinforcing the general superiority of towed discharge over fixed-point methods. However, in contrast to the towed horizontal discharge (Model-2; cf.
Figure 9b), the vertical method transports heat more directly to the surface. This mechanism allows the heat to diffuse more effectively into the lateral regions surrounding the nozzle. Consequently, the thermal signature appears more concentrated in the immediate vicinity of the discharge, leading to a smaller temperature difference at the far end of the domain.
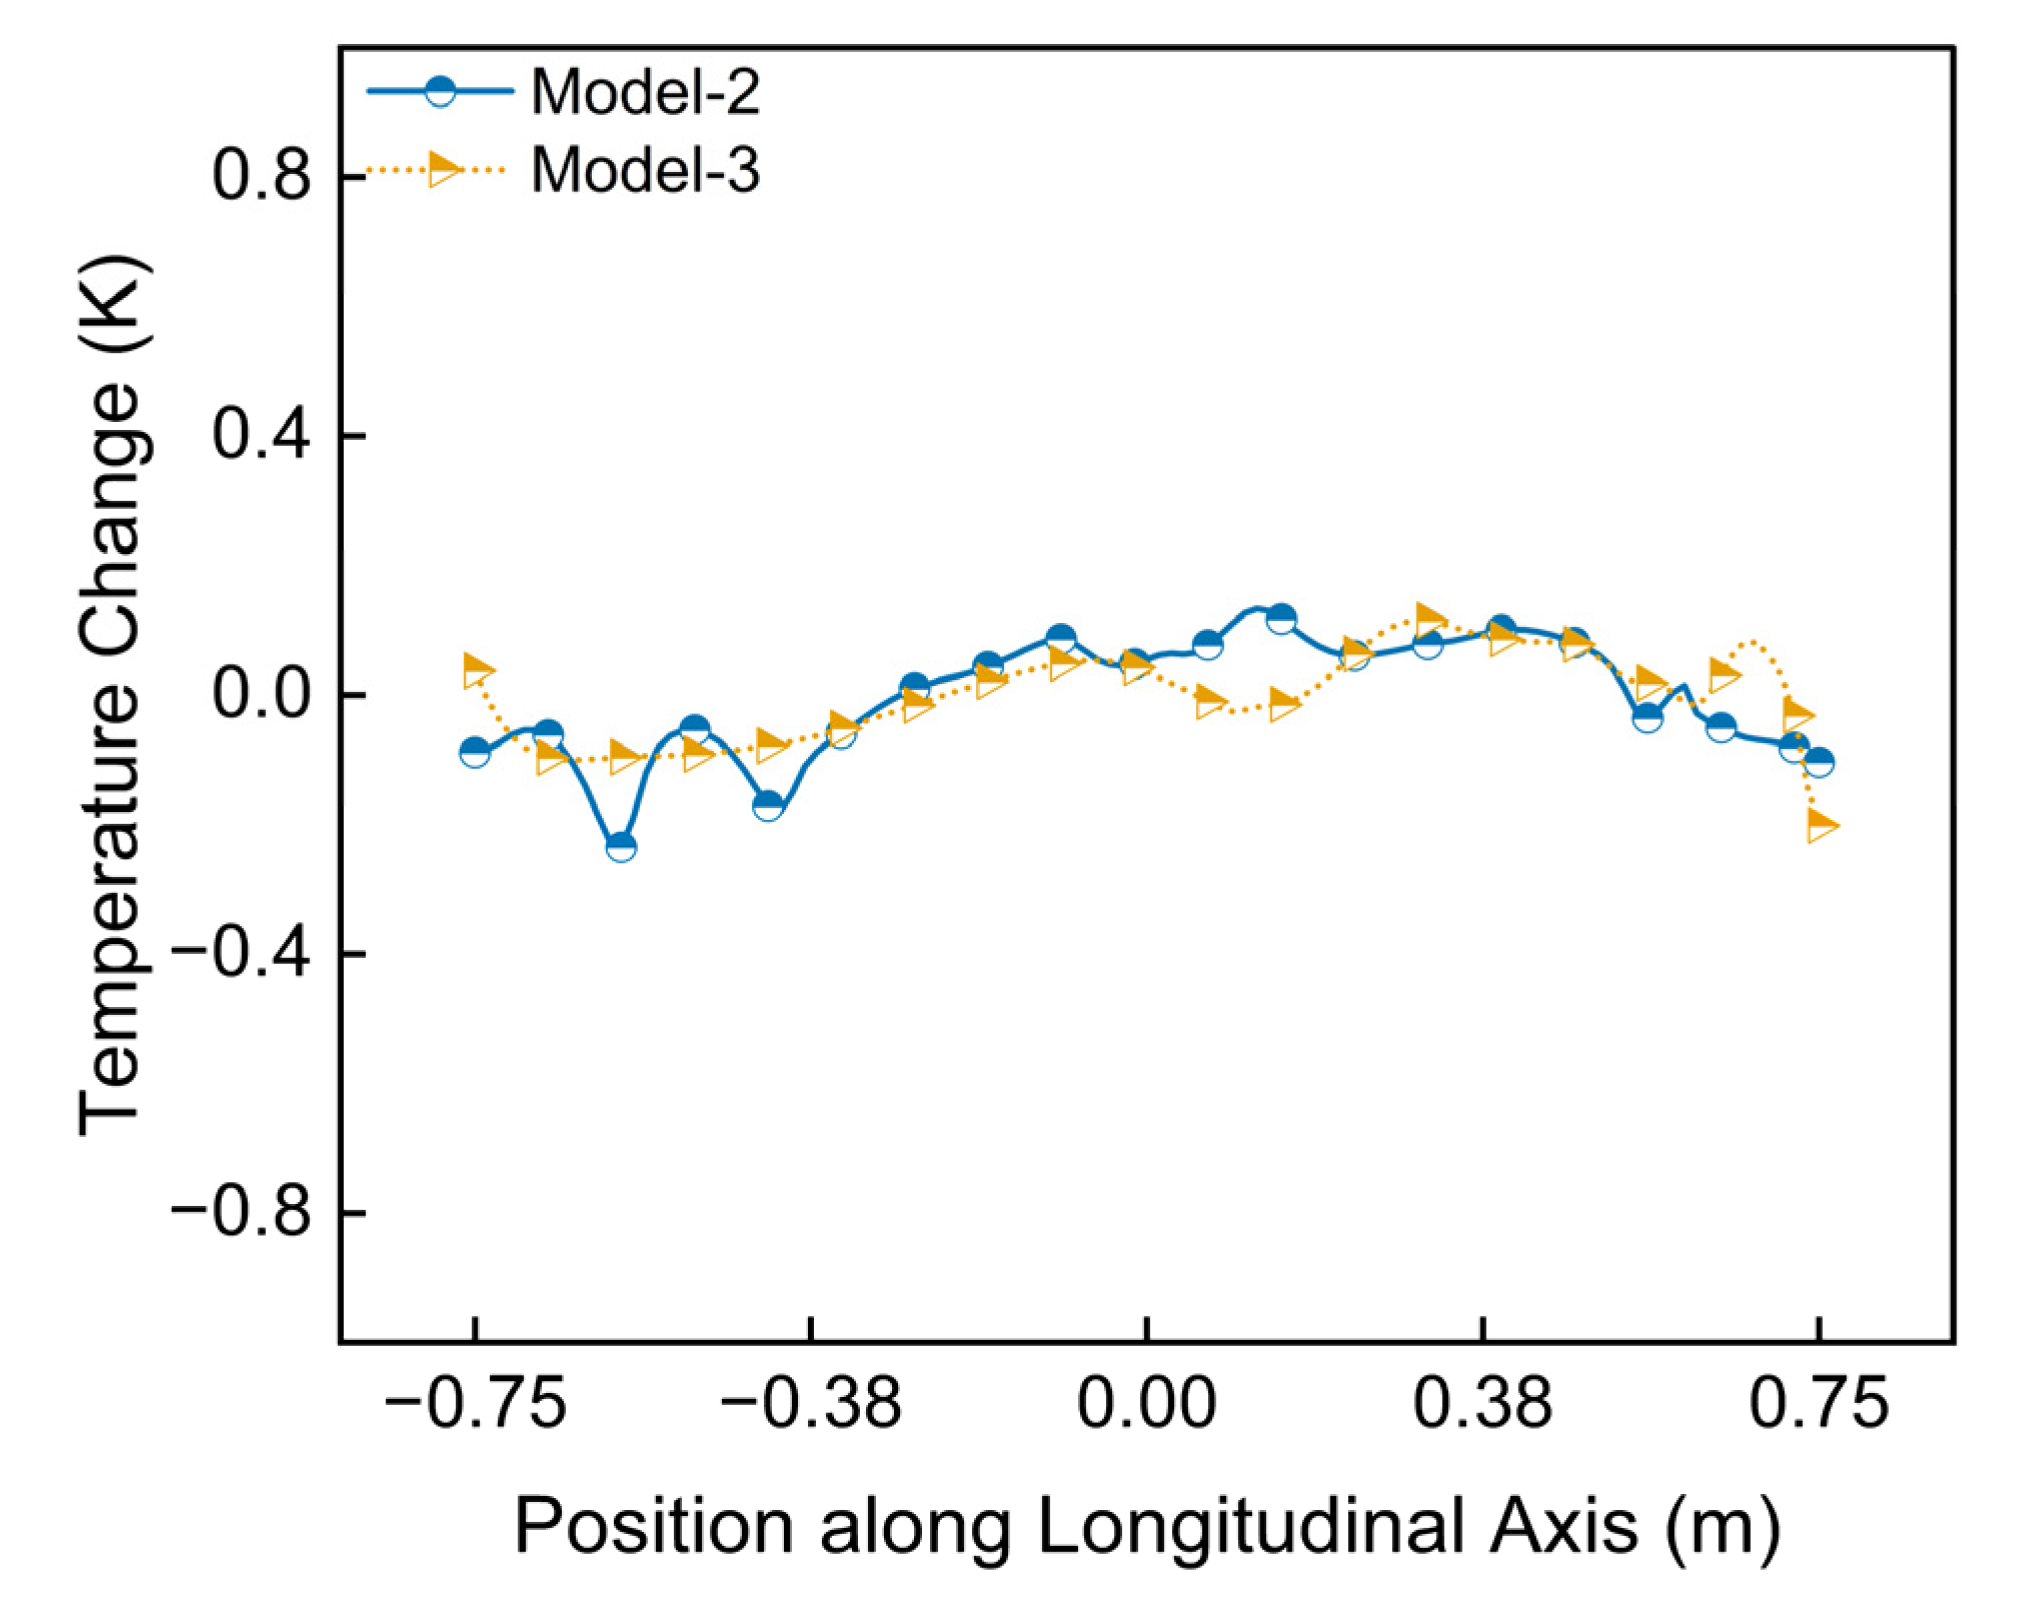
Figure 13 compares the surface temperature uniformity for the horizontal (Model-2) and vertical (Model-3) discharge strategies, using the temperature standard deviation (Δ
T) as the key metric. The results show that the ΔT curve for Model-3 is consistently lower and exhibits smaller fluctuations than that of Model-2. Additionally, Model-3 achieves a maximum temperature difference (
Kd) of only 0.32 along the centerline. This superior uniformity is because the vertical discharge delivers heat directly to the surface with minimal mixing during ascent. This process promotes a more stable and even temperature distribution along the centerline, mitigating the localized non-uniformities caused by the buoyant rise of a horizontal jet.
3.3. Effect of Discharge Scale on Thermal Stratification
Previous sections have demonstrated that a single-nozzle, towed upward discharge can effectively establish stable and uniform thermal stratification. This suggests that the stratification structure can be optimized by adjusting various inlet parameters. However, to assess the applicability of this method to larger scales and to investigate the synergistic effects of multiple heat sources, an expanded numerical model, designated as Model-4, was developed.
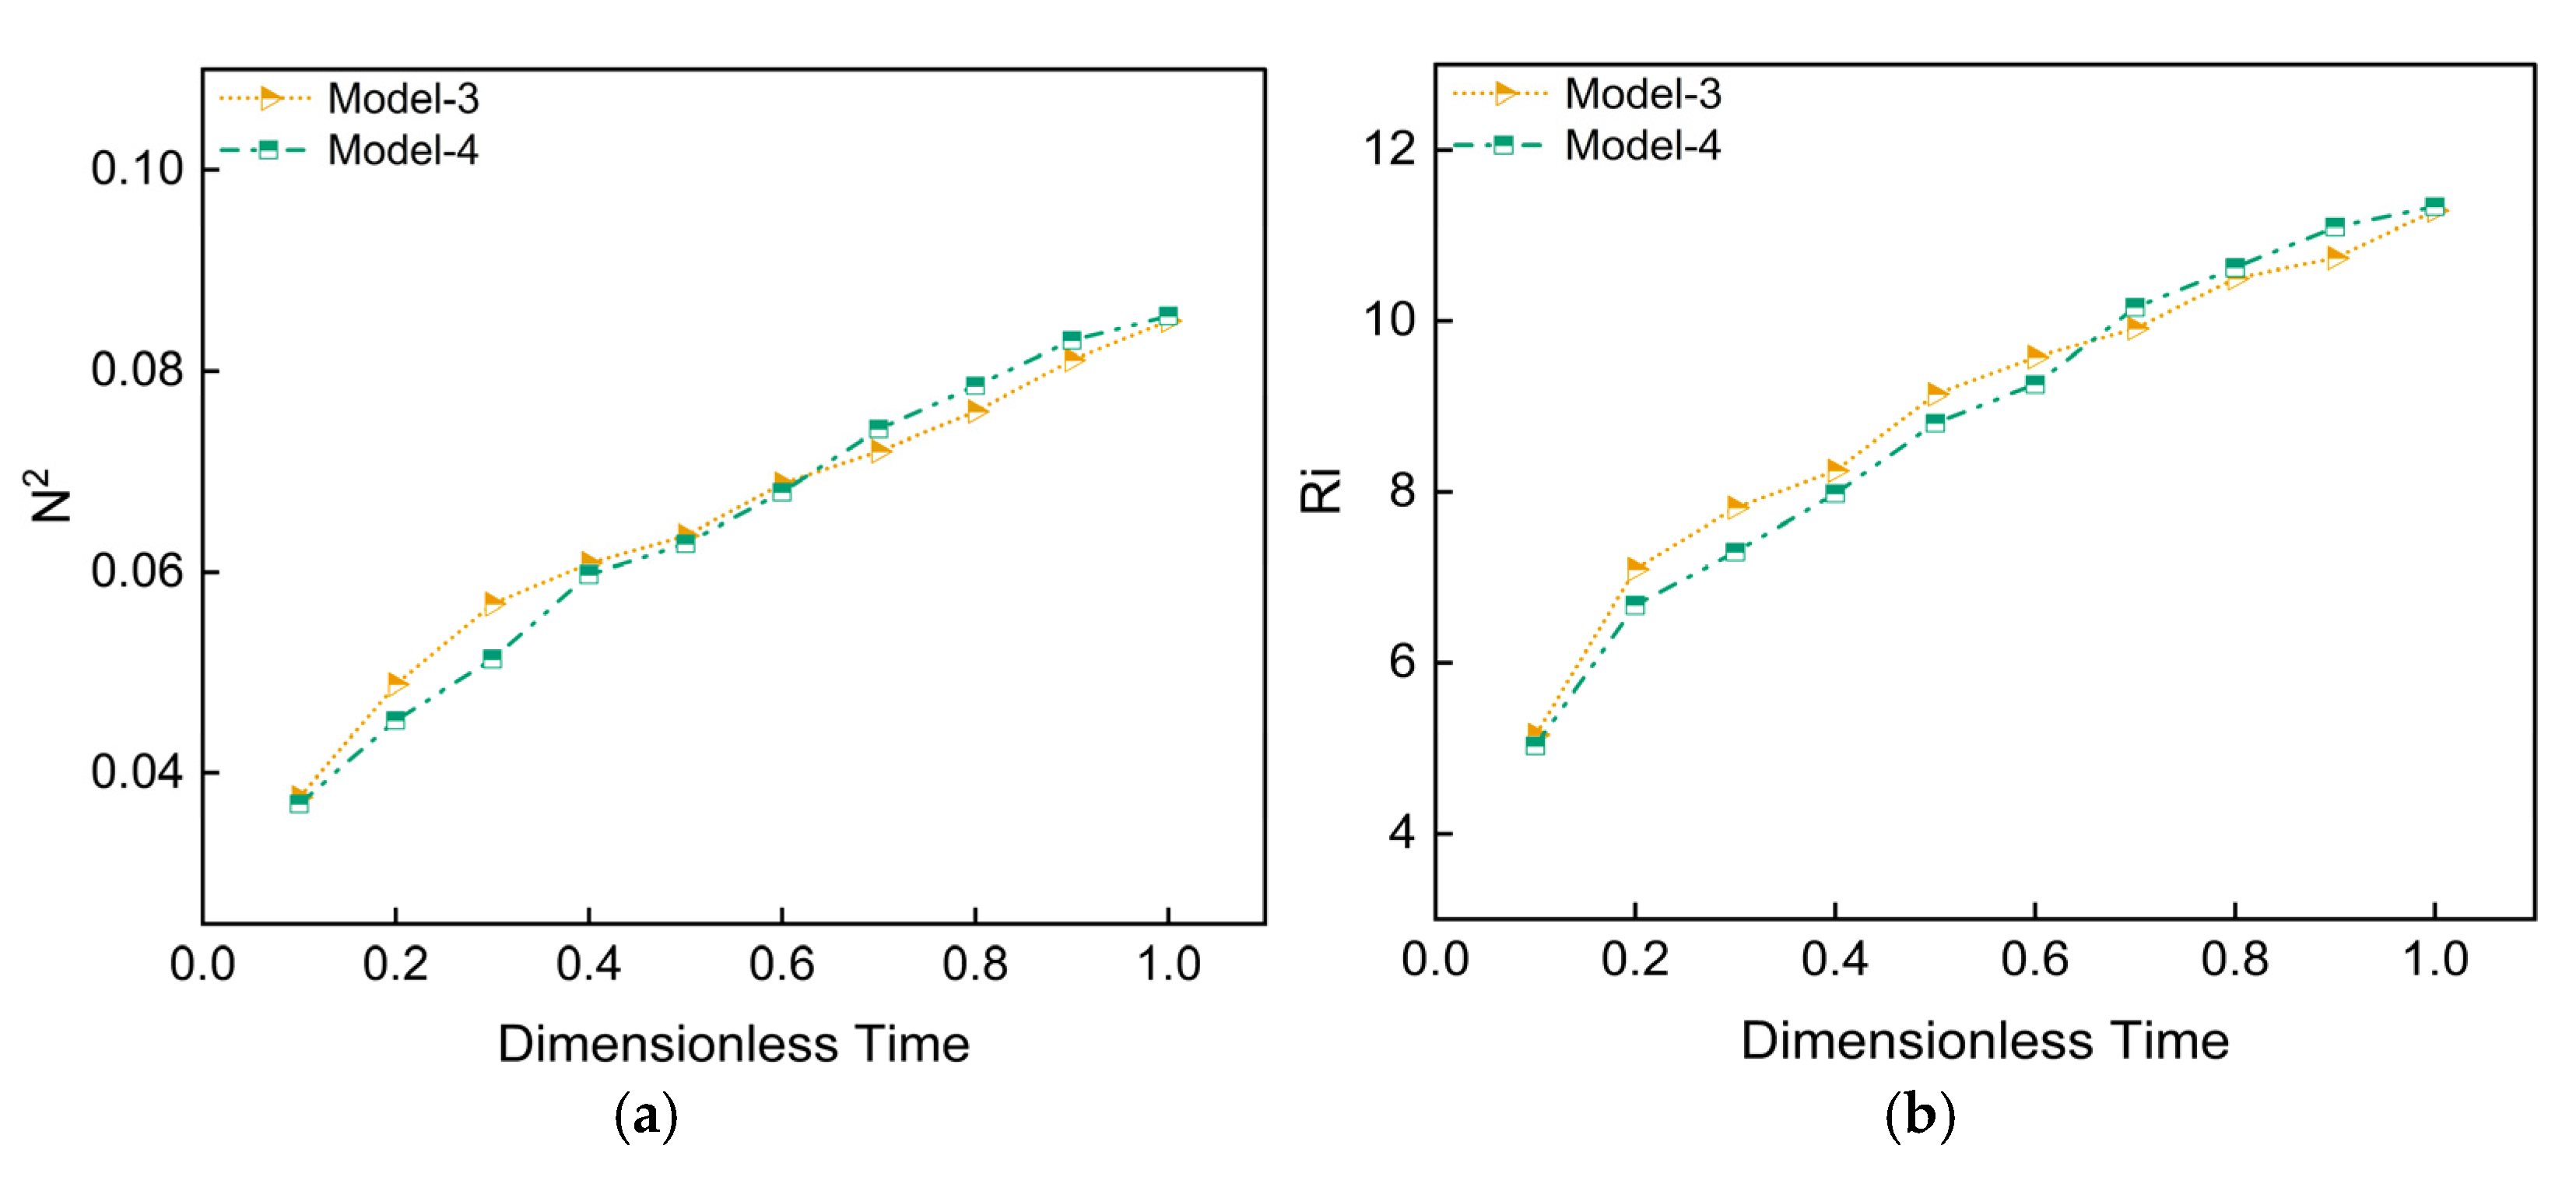
Figure 14a,b show that for both the single-nozzle (Model-3) and multi-nozzle (Model-4) configurations,
and
Ri exhibit a monotonic increase over time. This trend signifies that the stratification stability progressively develops and strengthens with continuous heat injection. Initially, Model-3 shows slightly higher values for both
and
Ri. This initial advantage is attributed to the more rapid formation of a strong local temperature gradient by the single, concentrated heat source within a smaller water volume. However, as the simulation progresses, the values for Model-4 gradually overtake those of Model-3, ultimately achieving final
and
Ri values that are 0.55% and 0.44% higher, respectively.
Although Model-4 exhibits a slight initial lag in establishing domain-wide stratification compared to Model-3, this gap diminishes rapidly, and the final stability metrics of the two systems become nearly identical. This key finding demonstrates the excellent scalability of the multi-nozzle towed discharge method. It proves that the strategy can effectively distribute heat over a larger area to achieve a final stratification structure that is quantitatively comparable to its smaller-scale, single-nozzle counterpart.
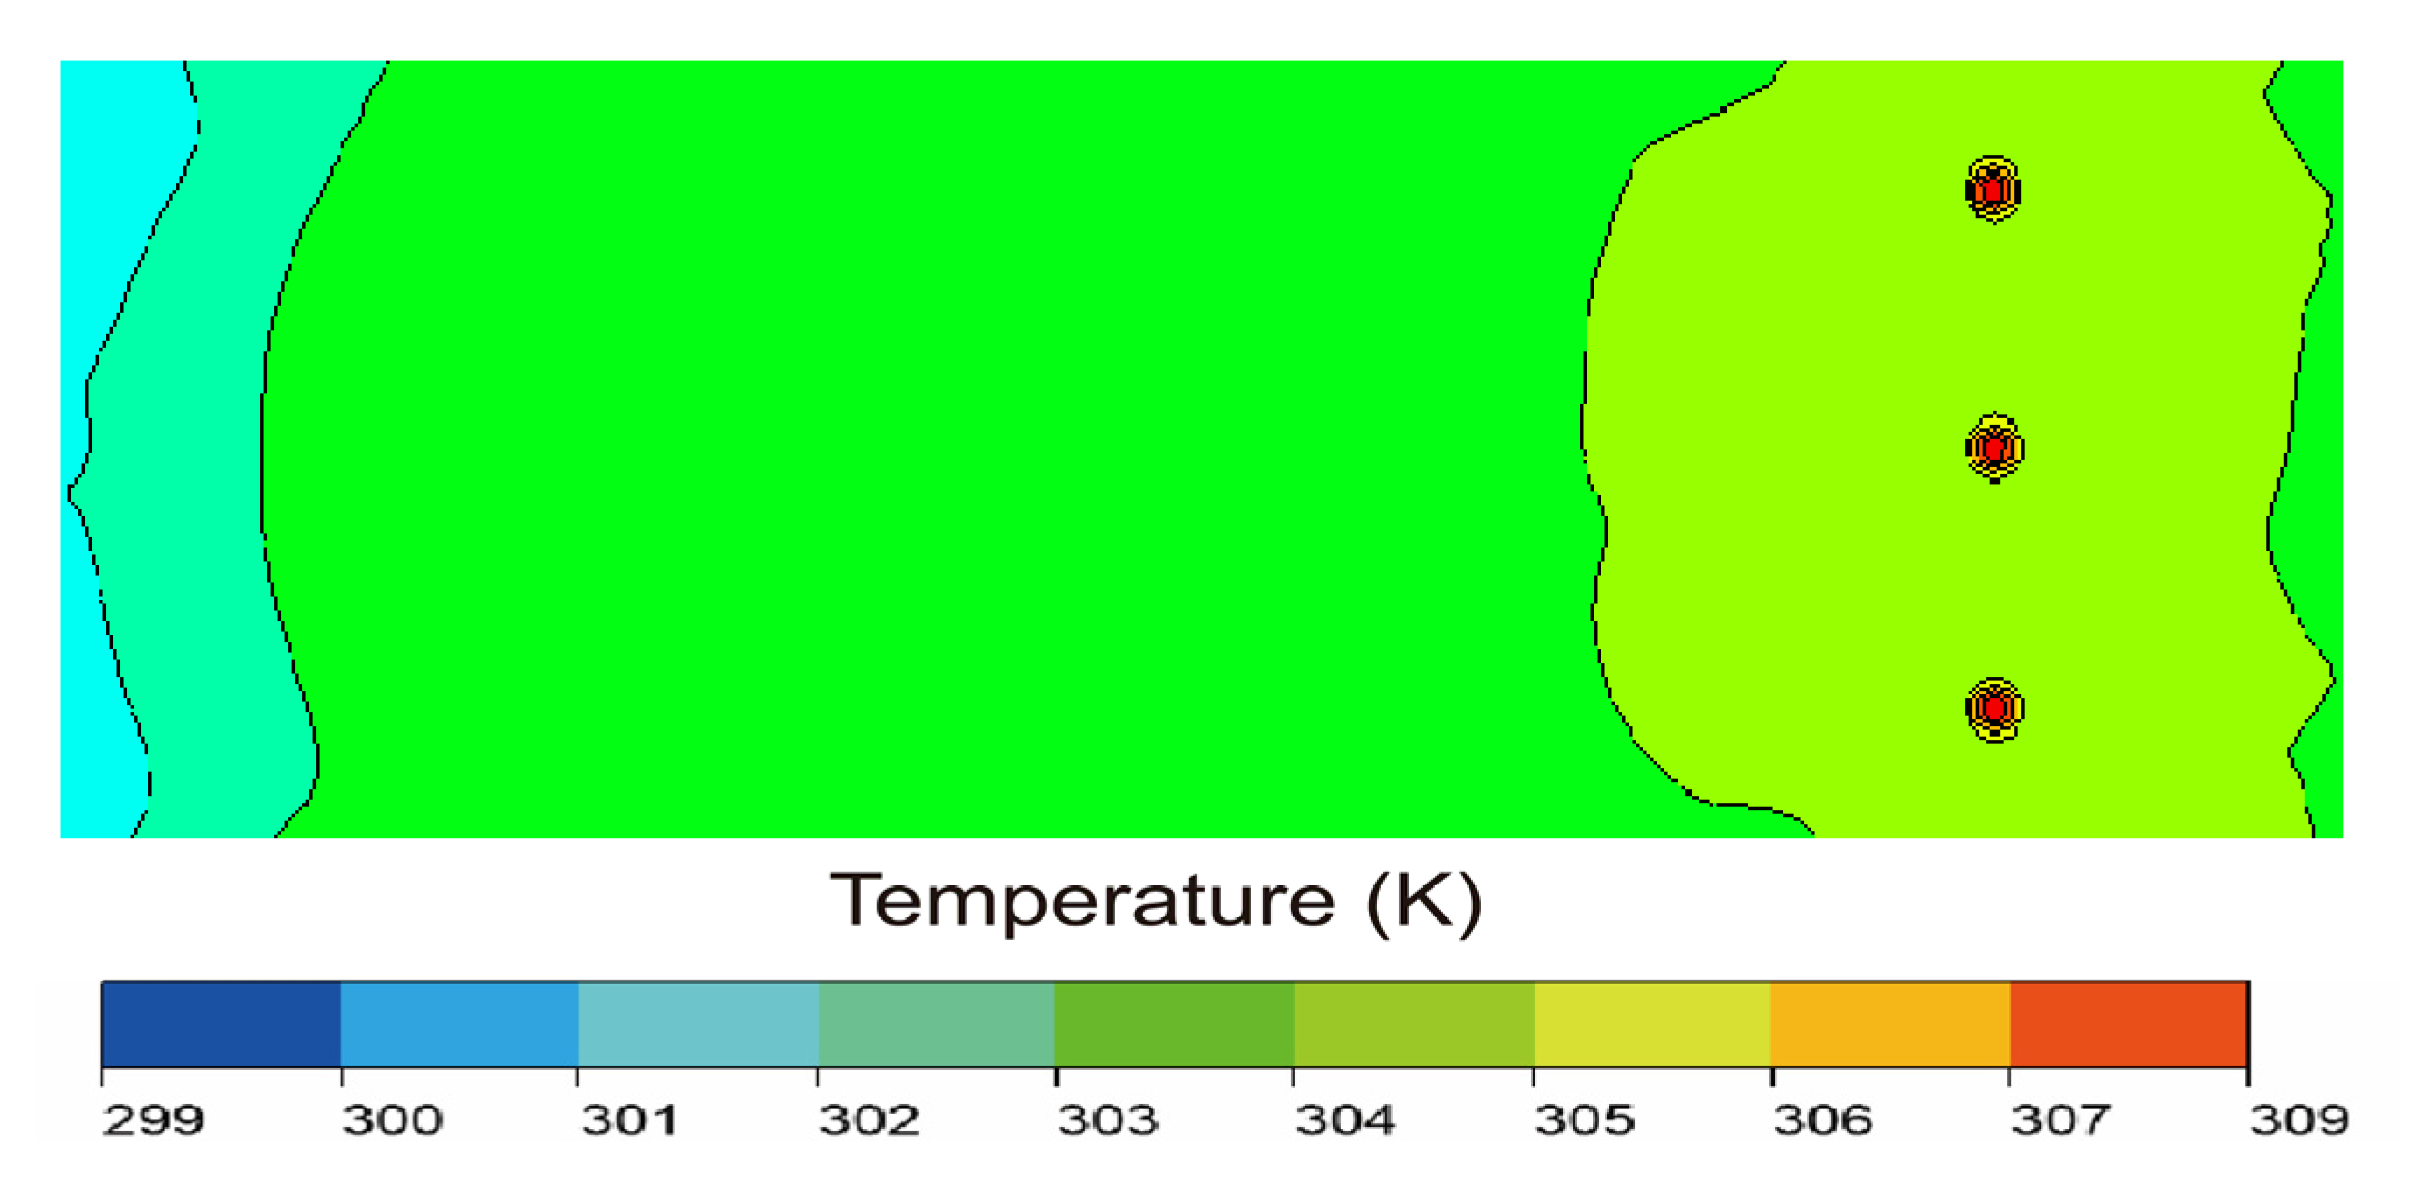
To visually assess the feasibility of the towed vertical upward discharge method for large-scale applications and to evaluate the synergistic effects of multiple nozzles,
Figure 15 presents the surface temperature distribution for the large-scale, multi-nozzle towed vertical upward discharge at the final time step. The temperature distribution shows remarkable similarity to its small-scale, towed vertical upward discharge, with the vast majority of the water surface exhibiting thermal uniformity and lacking significant temperature gradients. Clearly visible within the domain are three distinct, well-defined instantaneous hot spots, which precisely align with the final positions of the three upward-discharging nozzles at the simulation’s conclusion.
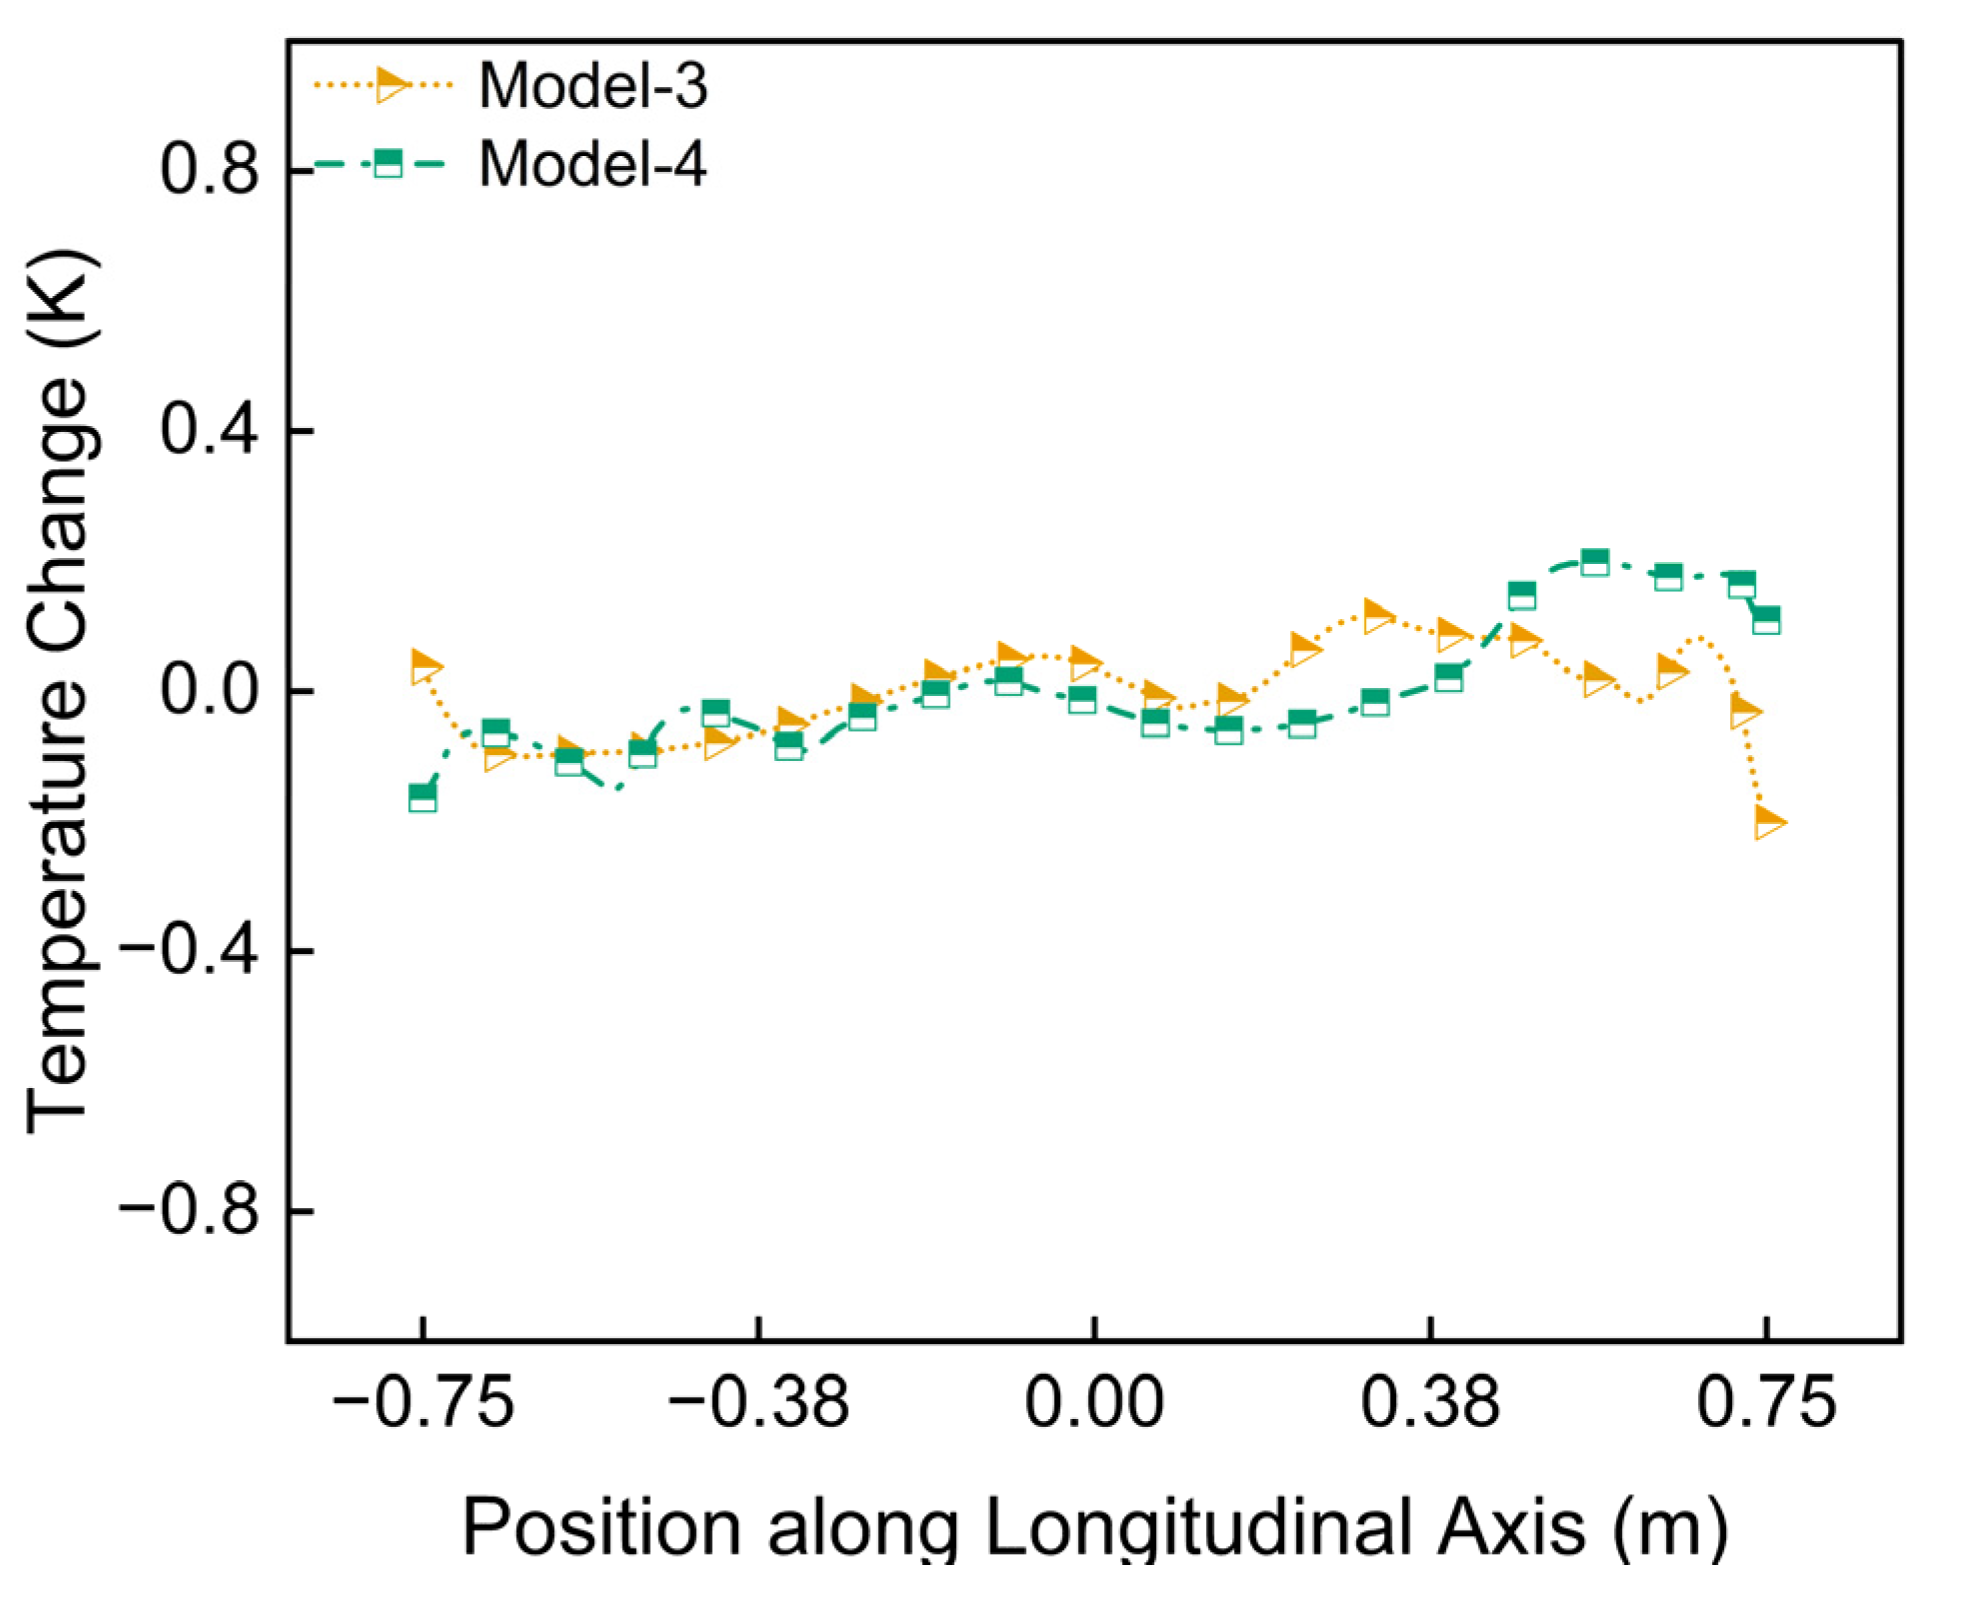
Figure 16 displays the longitudinal temperature standard deviation at the water–air interface for the towed vertical upward discharge method, comparing different system scales and heat source configurations. The comparison reveals the potential of the multi-nozzle, large-scale system (Model-4) to enhance surface temperature uniformity over the single-nozzle, small-scale system (Model-3). The results show that while both models employ the same discharge method, the temperature deviation profile of Model-4 exhibits slightly greater fluctuations along the monitoring line (with a maximum temperature difference of 0.36 K). Nevertheless, Model-4 demonstrates overall much smoother temperature gradients. This suggests that, for a given average heat input intensity per unit volume, employing multiple, coordinated towed vertical upward discharge nozzles can distribute heat more effectively, thereby offering a viable solution for establishing thermally stratified flow fields in large-scale water bodies.
This chapter systematically analyzes the effects of different discharge methods on water body stratification through a comparative study of four models. The findings indicate that a mobile heat source (towed discharge) achieves superior stability and uniformity in the water body compared to a fixed source. Furthermore, an upward vertical discharge is identified as the most effective strategy, as it delivers heat directly to the upper water strata while minimizing energy dissipation. Finally, the successful validation of a multi-nozzle model confirms the high scalability of this optimized approach for large water bodies.
4. Conclusions
This study, based on the computational fluid dynamics method, combined the overlapping mesh technique to handle the moving boundary problem of the nozzle and the Volume of Fluid multiphase model to accurately capture the free surface. Three-dimensional transient numerical simulations were conducted for the operational conditions of four distinct hot water discharge strategies (single-side fixed, towed horizontal, towed vertical upward, and multi-nozzle towed vertical upward). The numerical model was physically simplified with reasonable assumptions, primarily considering the hydrodynamics and heat transfer under the influence of gravity. The surrounding walls and bottom of the water body were treated as adiabatic, the top surface as a pressure outlet, and the nozzle as a constant velocity inlet. The accuracy and reliability of the computational results were ensured through rigorous grid and time-step independence studies. This research systematically revealed the influence of different discharge strategies on the formation, stability, and uniformity of thermal stratification. The main conclusions are as follows:
The discharge method is a fundamental factor influencing thermal stratification. Compared to the conventional fixed-point method, the towed discharge strategy more efficiently establishes a stable stratified structure. It produces a significantly more stable final state, as evidenced by the final N2 and Ri values that are 10.1% and 4.5% higher, respectively. Furthermore, the towed method results in a markedly more uniform surface temperature distribution, with the maximum temperature difference significantly decreasing from 0.98 K to 0.37 K, and a smoother surface temperature standard deviation profile.
Discharge orientation is a critical factor in optimizing stratification. The towed vertical upward discharge (Model-3) demonstrates a significant improvement in both stability and uniformity compared to the horizontal discharge (Model-2), with its final N2 and Ri values being 17.9% and 23% higher, respectively. This superiority is attributed to the vertical discharge mechanism, which transports the buoyant plume directly to the surface, thereby minimizing entrainment and thermal loss to the surrounding colder water and leading to a more efficient and robust stratification.
The multi-nozzle configuration (Model-4) successfully demonstrates the scalability of the towed vertical discharge method for large-scale applications. While maintaining the same heat input per unit volume, the large-scale system achieved a final state of stability and uniformity that is quantitatively comparable to its small-scale, single-nozzle counterpart (Model-3).
The advantage of this study lies in its use of numerical simulation to systematically conduct a parametric investigation of complex operational conditions at a low cost and high efficiency, with results that can directly guide physical experiments and engineering practice. In conclusion, for applications requiring the rapid and efficient construction of reliable thermal stratification, the towed upward discharge method is a strategy demonstrably superior to the conventional fixed-point injection approach. The findings provide a clear design criterion for field applications: a mobile, vertical upward discharge scheme should be prioritized. Furthermore, this method exhibits excellent scalability. The established numerical model and the dimensionless parameters employed, such as the Richardson number (Ri), can be used to guide practical adjustments when scaling up with multi-nozzle configurations and a proportionally increased heat input, ensuring a robust transition from simulation to real-world application. This is of significant practical value in fields such as building test environments for underwater vehicle thermal stealth and simulating aquatic ecosystems. Future work could focus on optimizing the efficacy of this large-scale approach by investigating various multi-nozzle layouts (e.g., spacing and arrangement) and their interaction with different total heat input rates.
