Featured Application
The main application direction of this study is the research related to aircraft engine shaft faults. It can improve the prediction accuracy of axial load evolution after aircraft engine shaft faults and further provide a basis for the passive safety design for shaft faults.
Abstract
This study investigates the evolution of axial loads in the secondary air system following shaft failure in aeroengines. It addresses a significant gap in the existing literature regarding the effects of inertial forces within the cavity, as well as the unclear mechanisms by which the geometric parameters of the flow path influence these forces. A combined approach of three-dimensional simulation and experimental validation is utilized to propose a method for analyzing the evolution of axial loads during the fast transient response process, based on changes in the Cavity Inertial Force Dominant Zone (CIDZ). The research examines both single cavities and cavity–tube combination flow paths to explore the impact of inertial forces on the axial load response process and, subsequently, the influence of flow path geometric parameters on this response. The results demonstrate that inertial forces within the cavity and the geometric parameters of the flow path significantly affect the axial load response process by influencing the intensity, phase, and minor oscillation amplitude of the axial load response at various end faces within the cavity. The variation in a single geometric parameter in this study resulted in a maximum impact exceeding 500% on the differences in axial loads at different end faces within the cavity. The study offers theoretical support for the load response analysis of the secondary air system in the context of shaft failure, serving as a foundation for safety design related to this failure mode.
1. Introduction
When a shaft failure occurs in an aeroengine, the turbine decouples from the compressor, resulting in turbine overspeed and compressor surge within 0.12 s and 0.14 s, respectively [1]. Concurrently, the risk of blade rupture and other hazardous incidents, such as rotor non-containment, may arise due to turbine overspeed and rotor displacement, posing a serious threat to the safe operation of the aeroengine [2]. To mitigate the risk of such incidents, passive safety designs are implemented to address the failure processes. For instance, a “brake” structure is designed between the turbine rotor and stator, which increases friction between the fractured shaft rotor and the stator through axial loads to decelerate the turbine [3]. Additionally, limiting bearings are employed at the compressor end of the rotor to restrict compressor displacement following shaft failure, thereby preventing contact between the compressor rotor and stator [4]. Regardless of the type of passive safety design, the evolution of axial loads following a shaft failure serves as a critical basis for the design. Accurately understanding the evolution of axial loads in the aeroengine after a shaft failure is essential for ensuring the effective functioning of passive safety designs.
The axial loads in an aeroengine arise from the pressure differentials at the compressor and turbine inlets and outlets. To mitigate these axial loads during operation, specific designs have been implemented for both the mainstream flow path and the secondary air system, including a twin-rotor configuration for the mainstream flow path and the integration of a relief cavity within the secondary air system. The turbine shaft of the aeroengine is situated within the secondary air system, and a shaft failure directly modifies the geometric configuration of the flow path in the secondary air system, thereby affecting its capacity to balance axial loads and subsequently influencing the evolution of axial loads following a shaft failure [5]. Consequently, an in-depth investigation into the evolution of axial loads in the secondary air system after a shaft failure is crucial for accurately understanding the load dynamics within the aeroengine.
The turbine shaft is situated within the secondary air system of the aeroengine. A shaft failure can result in a sudden connection between the internal and external flow paths of the turbine shaft. Due to the pressure differential on both sides of the shaft, this failure introduces a geometric and sudden pressure change boundary in the secondary air system, lasting no longer than 10 ms [5]. During the transient response process of the secondary air system triggered by this sudden change boundary, the axial load within the secondary air system also fluctuates. Components exhibiting transient effects within the secondary air system can further influence its transient response process. According to relevant studies, the components that exhibit transient effects and impact the axial load response primarily include the compressor, turbine disk cavity, and various tubes within the secondary air system [6]. The compressor and turbine disk cavity possess a large projected area and serve as the primary sources of axial load in the secondary air system. The tube components affect the evolution of axial load by influencing the pressure response time within the compressor and turbine disk cavity. Since the various cavities are interconnected by tubes, the key to investigating the evolution of axial load in the secondary air system following a shaft failure lies in exploring the response mechanisms of axial load in the combined flow paths of the cavity and tubes under the sudden change boundary.
Existing research has focused on the fast transient response processes of cavities and tubes under sudden change boundaries, yielding significant results. Given that these fast transient response processes primarily occur within complex flow paths under sudden change boundaries, system-level studies have predominantly employed low-dimensional simulations and experiments, while component-level investigations have incorporated three-dimensional simulation methods. After initially proposing low-dimensional simulation methods for cavities and tubes, Benson et al. [7,8] further developed tube simulation techniques to effectively capture the pressure wave propagation process within the tubes [9,10], which has been validated experimentally [11]. Calcagni and Gallar [12,13], Gallar and Calcagni [14], and Liu Chuan-kai et al. [15] each established low-dimensional simulation models for cavities and applied them in low-dimensional simulations of the secondary air system; these cavity models were validated using the cavity charging and discharging tests conducted by Dutton and Coverdill [16] and Thorncroft et al. [17]. Additionally, Gao Wenjun et al. [18] investigated the effects of the number and relative positions of cavity inlets and outlets through experiments and three-dimensional simulation methods.
In the aforementioned studies, the low-dimensional models for tubes have been validated through practical internal combustion aeroengine tests; however, the establishment and validation of cavity models were conducted under conditions with relatively small inlet and outlet areas. Under these conditions, the fast transient response processes of cavities under sudden change boundaries align with the assumption proposed by Calcagni and Gallar [12] during low-dimensional simulation modeling, which disregards the influence of inlet and outlet areas, specifically that the relationship between the inlet and outlet areas and the cavity volume meets criterion . At this point, the flow rates at the inlets and outlets are relatively small compared to the cavity volume, so fluid inertia forces within the cavity were neglected during the research process. However, the actual flow path structure of the aeroengine secondary air system is complex, and not all cavities can satisfy this assumption. To achieve a more accurate response history of axial loads under sudden change boundaries, it is essential to consider the effects of inertia forces within the cavity.
For the response process of cavity–tube combination flow paths under transient boundaries, Calcagni and Gallar [13] focused on a dual-cavity single-tube oscillating flow path and established a low-dimensional model to analyze the influence of tube length on the response process of the cavity–tube combination flow path. Yan et al. [19], in exploring the influence of cavities on the propagation of explosive shock waves, employed a combination of experimental and three-dimensional simulation methods to investigate how cavity shape affects shock wave propagation. Although these studies have clarified the influence of geometric parameters, including tube length and cavity shape, on pressure changes within cavities during flow path response processes, the underlying mechanisms by which these parameters affect flow path responses have yet to be thoroughly investigated.
In summary, while existing research has made certain advancements in related fields, key issues remain unresolved. On the one hand, the mechanisms by which inertial forces within cavities affect axial loads are not yet clear; on the other hand, there is a lack of systematic research on the mechanisms by which geometric parameters of flow path features influence axial loads during flow path responses under sudden change boundaries.
To address the aforementioned issues, this study utilizes a validated three-dimensional simulation method, focusing on a single-cavity flow path. By comparing changes in the Cavity Inertial Force Dominant Zone (CIDZ), the study investigates the mechanisms through which inertial forces influence axial loads during fast transient responses under sudden change boundaries as the parameter increases from the order of 0.01 to 0.1. Building on this, the research examines the cavity within the cavity–tube flow path, analyzing how characteristic geometric parameters affect axial loads during fast transient responses under sudden change boundaries under condition . This study aims to enhance the understanding of fast transient response mechanisms in single-cavity flow paths and cavity–tube combination flow paths under sudden change boundaries, thereby providing a solid theoretical foundation for understanding the load response processes of secondary air systems following shaft failures, ultimately offering valuable insights for the safe design and optimization of aeroengines.
2. Verification of Simulation Methods
This paper primarily employs three-dimensional simulation technology, referencing the simplification method from the literature [5], to model the flow paths between the turbine disk cavity and the compressor disk cavity, as well as the flow path within the compressor disk cavity as tubes. The combined flow paths of the disk cavities and tubes in the secondary air system, following simplification, are illustrated in Figure 1. This study aims to investigate in depth the geometric parameters of the flow path features that influence the fast transient response processes under sudden change boundaries, along with their underlying mechanisms.
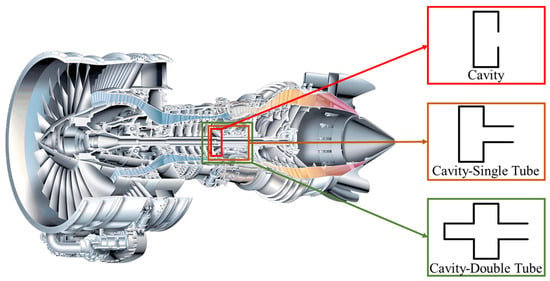
Figure 1.
Simplification of the secondary air system cavity–tube combined flow path.
To ensure the reliability and accuracy of the research results, validating the employed three-dimensional simulation method is crucial. Previous studies have confirmed that this simulation accurately models the cavity charging and discharging process through comparisons with experimental data. However, as noted earlier, in existing cavity charging and discharging experiments, the inlet and outlet areas of the cavity are relatively small, allowing for the neglect of gas inertia effects within the cavity. Furthermore, no experiments have been conducted on the fast transient response process of the cavity–tube combined flow path under sudden change boundaries. Therefore, this study specifically designs a fast transient cavity–tube combined experimental platform to investigate the fast transient response process of the cavity–tube combined flow path under sudden change boundaries, where the inlet and outlet areas of the cavity do not satisfy condition . This will provide supplementary validation of the feasibility of the three-dimensional simulation method in modeling this process.
2.1. Experimental Platform
This study presents the design of a fast transient cavity–tube combined experimental platform to investigate the fast transient response process of a cavity–tube combined flow path with initial pressure under sudden change boundaries. The experimental platform primarily comprises five components: the gas supply system, the test section, the sudden change boundary simulation device, the experimental auxiliary tools, and the data acquisition system. The schematic diagram of the experimental platform and the testing procedure are illustrated in Figure 2 and Figure 3. This platform is capable of conducting cavity–tube combined venting tests under sudden change boundary conditions. The experimental geometry and initial conditions are detailed in Table 1.
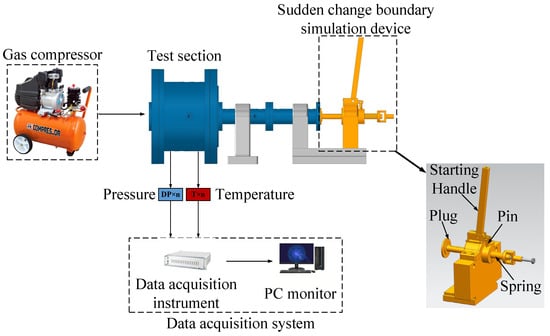
Figure 2.
Schematic diagram of the fast transient chamber-tube combined test platform.
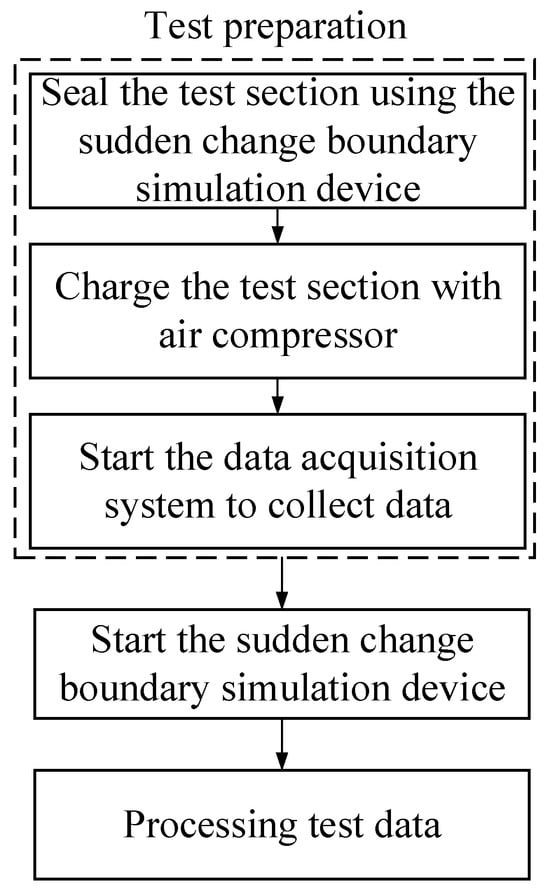
Figure 3.
Flowchart of the main experimental process.

Table 1.
Main parameters of the model.
The sudden change boundary required for the experiment is supplied by a sudden change boundary simulation device, as illustrated in Figure 4. This device rapidly moves a plug to connect the flow path of the test specimen with the atmosphere, facilitating a swift change in the flow path boundary. The device can complete boundary changes within 6 ms, which is comparable to the time scale of structural changes occurring during shaft failures [3], thereby meeting the experimental requirements.

Figure 4.
Schematic diagram of the sudden change boundary simulation device.
2.2. Numerical Method
Figure 5 illustrates the computational model of the fast transient response process for the cavity–tube combined flow path under sudden boundary changes. This simplified model comprises the cavity–tube fluid domain and the atmospheric fluid domain, corresponding to the green and blue sections in Figure 5, respectively. In the experiment, the gas within the cavity–tube flow path directly enters the atmosphere. To simulate the influence of the atmospheric environment on the outlet boundary conditions of the flow path, a dual fluid domain modeling approach is employed, with both fluid domains lacking inlets or outlets. The entire fast transient response process occurs within these two fluid domains. The initial pressures of the cavity–tube fluid domain and the atmospheric fluid domain differ; at the beginning of the simulation, the two fluid domains are connected to facilitate the abrupt boundary change in the cavity–tube combined flow path. Additionally, to ensure that atmospheric pressure remains relatively constant during the simulation, the volumes of the two fluid domains meet condition . Relevant parameters for the atmospheric fluid domain are presented in Table 2, while other model parameters are consistent with those in Table 1.
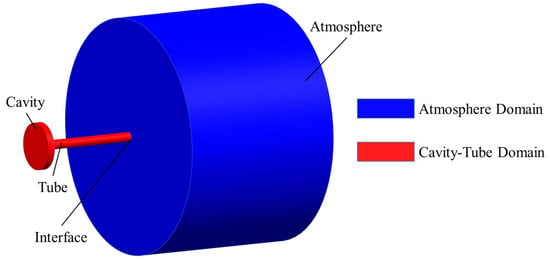
Figure 5.
Schematic diagram of the cavity-single tube model.

Table 2.
Main parameters of the atomsphere domain.
The entire model is constructed using a hexahedral mesh. The O-Block partitioning technique is utilized to separately address the cavity–tube fluid domain and the atmospheric fluid domain, facilitating the creation of a regular hexahedral mesh structure on the curved surfaces. To capture flow details more accurately in critical areas, the mesh in the wall regions, the interface between the two fluid domains, and the junction between the cavity and the tube has been refined. The initial layer mesh height is set to 0.05 mm, with a normal growth rate of 1.2, allowing for a gradual transition between refined and non-refined meshes. The results of the mesh partitioning are presented in Figure 6.
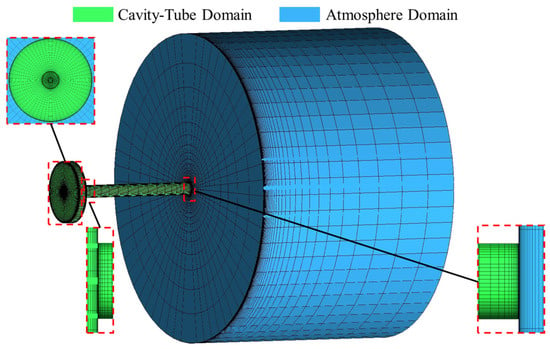
Figure 6.
The schematic diagram of the cavity–tube model mesh partitioning.
This study employs ANSYS CFX 2021 software for three-dimensional transient numerical simulations. The fluid is represented as an ideal gas, with the convective terms in the momentum, energy, and turbulence equations discretized using a second-order upwind scheme. The entire fast transient response occurs over a very short time frame, and wall heat transfer is not considered; all walls are defined as adiabatic no-slip boundaries. Due to the small diameter of the interaction interface between the fluid domains, the flow near the inlet and outlet of the cavity resembles a circular jet. According to the research by Kmecova et al. [20], the SST turbulence model exhibits high simulation accuracy for circular jet modeling; therefore, this study prioritizes the SST turbulence model and performs grid independence and time step analyses prior to selecting the turbulence model. Throughout the simulation process, convergence is deemed achieved when the residuals reach approximately times 10−4.
The appropriate grid resolution is determined through grid independence verification, with the time step temporarily set to times 10−5 s, aligning with the precision of the experimental data collection. The model is simulated using grid counts of 0.03 million, 0.06 million, 0.09 million, 0.14 million, 0.31 million, and 0.52 million. Static pressure monitoring points are established in the model based on the locations of pressure measurement points from the experiments. By comparing the variations in static pressure at these monitoring points, an appropriate grid resolution is identified; the locations of the measurement points and the comparison results are presented in Figure 7. Once the grid count reaches 0.31 million, further increases in grid count have a minimal impact on the simulation results. Thus, this study selects 0.31 million as the grid count for subsequent research.
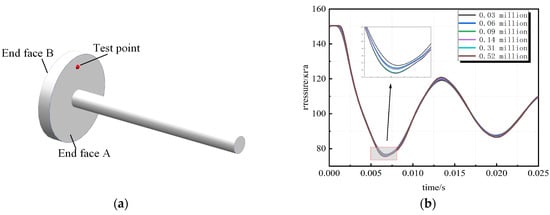
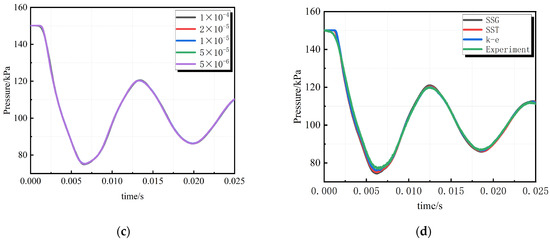
Figure 7.
(a) Test point and end faces; (b) Grid independence analysis; (c) Time step independence analysis; (d) Turbulence model analysis.
Using the 0.31 million grid, a time step independence analysis is conducted, with simulations carried out at time steps of 1 × 10⁻⁴ s, 5 × 10⁻⁵ s, 2 × 10⁻⁵ s, 1 × 10⁻⁵ s, 5 × 10⁻⁶ s, and 2 × 10⁻⁶ s. The pressure variations at the monitoring points are similarly compared with the results presented in Figure 7. The time step has a minimal impact on the simulation results, and this study adopts 1 × 10⁻⁵ s, consistent with the experimental conditions, as the time step for subsequent research.
The model was simulated using various turbulence models under conditions of 0.31 million grids and a time step of times 10−5 s. The simulation results were compared with experimental data, as illustrated in Figure 7. The maximum errors were 2.7% for the k-e model, 2.2% for the SSG model, and 2.1% for the SST model. The different turbulence models exhibited minimal impact on the pressure variation at the monitoring points. Based on the findings in reference [20], this paper selects the SST model as the turbulence model for subsequent research.
The amplitude of pressure oscillations in the simulation was relatively greater than that observed in the experiments. Considering the presence of friction on the wall surfaces of the flow path during the experiments, while the simulated sudden change boundary represents an ideal boundary without time variation, these factors would contribute to a reduction in the amplitude of pressure oscillations in the experiments, aligning with the comparison results. Therefore, this validates the accuracy of the three-dimensional simulation and establishes a solid foundation for further in-depth research based on this simulation method.
3. Comparative Parameters and Dimensional Analysis
This study investigates the influence mechanism of the characteristic geometric parameters of the flow path under sudden boundary conditions, considering the effects of inertial forces within the cavity on the fast transient response of the flow path. To establish a foundation for the mechanism analysis, a comparative analysis is conducted to examine the impact of inertial forces within the cavity on the fast transient response of the flow path under sudden boundary conditions. Based on the simplified secondary air system configuration of the cavity–tube combination derived from Figure 1, various characteristic geometric parameters are determined, and these parameters are non-dimensionalized to serve as standards for subsequent simulation data processing.
3.1. Effects of Inertial Forces Acting Within the Cavity
Analysis of existing research findings indicates that considering the effects of inertial forces within the cavity significantly alters the fast transient response process of the flow path under sudden change boundary conditions. Table 3 and Table 4 provide a detailed comparison of the influence of the fluid’s inertial forces within the cavity on the main stages of the cavity venting response process. It is observed that these inertial forces can continue to drive the flow even in the absence of a pressure differential, resulting in periodic reversals of both the pressure differential and flow direction before reaching a stable state. This phenomenon significantly impacts the evolution of flow path loads. This study focuses on the characteristics of the flow phase driven solely by inertial forces within the cavity under varying geometric parameter conditions of the flow path, aiming to analyze and summarize the mechanisms by which these geometric parameters influence the fast transient response process under sudden change boundary conditions.

Table 3.
Comparison of each stage of chamber venting without inertial force influence.

Table 4.
Comparison of each stage of chamber venting with inertial force influence.
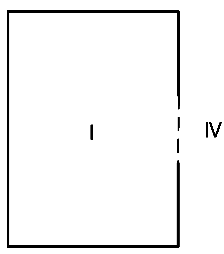
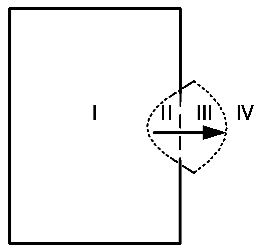
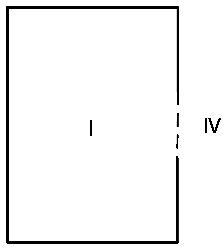
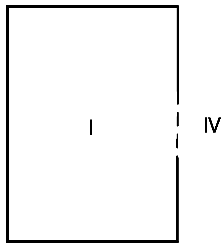
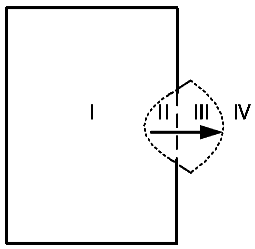
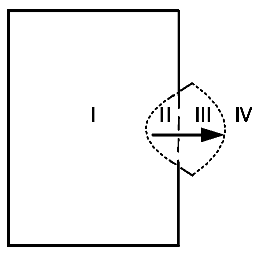
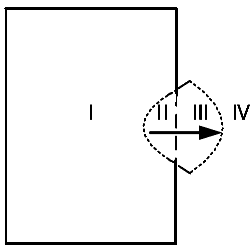
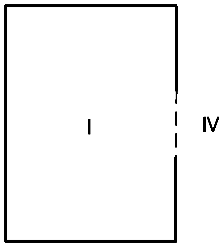
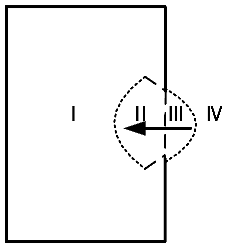
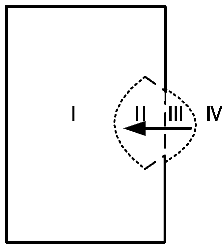
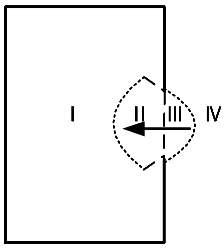
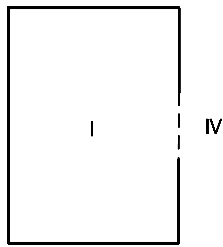
Analysis of Table 4 reveals that during the flow phase driven by inertial forces, the flow is primarily influenced by the inertial forces in regions II and III. Accordingly, region II is defined as the Cavity Inertial Force Dominant Zone (CIDZ), while region III is designated as the Environmental Inertial Force Dominant Zone (EIDZ). A larger extent of CIDZ and EIDZ indicates a stronger influence of inertial forces during this flow phase. Throughout the research process, the impact of the geometric parameters of the flow path on CIDZ and EIDZ can be evaluated by comparing the distribution cloud maps at the same stage within the cavity, thereby clarifying their effects on inertial forces.
The fast transient response process of the flow path under sudden boundary conditions is categorized as a transient process. To facilitate analysis and research, the time required for the gas within the flow path to completely exit at the local speed of sound is defined as the ideal time . The actual time is non-dimensionalized using the ideal time , as demonstrated in Equations (1) and (2).
—Gas density in the flow path; —Volume of the flow path; —Local speed of sound; —Relative time of the response process.
3.2. Relative Change in Gas Volume Within the Chamber
Considering the uneven distribution of gas parameters within the cavity in the three-dimensional simulation, this study identifies the change in gas mass m within the cavity as a key comparative parameter for distinguishing different stages of the response process and quantifying the influence of inertial forces within the cavity. The ranges of m corresponding to the various stages are presented in Table 3 and Table 4, where ms represents the total mass of gas exiting the cavity when the response process reaches a steady state; mCrest denotes the peak value of the total mass of gas exiting the cavity; and mTrough indicates the trough value of the total mass of gas exiting the cavity. The relevant expressions for m are provided in Equations (3) and (4).
—Chamber pressure; —External pressure; —Inlet and outlet area of the chamber; —Specific heat ratio of the gas; —Gas constant; —Inlet temperature at the orifice; —Flow coefficient.
Based on the above equations, this study will conduct research under the condition that , , and remain constant, comparing the distribution of within the flow paths at moments , , and , as well as the values of . To facilitate subsequent comparative analysis, the parameters required for the study will be non-dimensionalized. The change in gas mass-related parameters within the cavity will be non-dimensionalized using the initial gas mass within the cavity, with the expressions for each parameter presented in the following equations:
—Flow path volume; —Molar mass of the gas; —Relative mass of gas exiting the chamber; —First peak of the oscillation of the relative mass of gas exiting the chamber; —First trough of the oscillation of the relative mass of gas exiting the chamber; —Steady value of the relative mass of gas exiting the chamber.
3.3. Relative Axial Force
Based on the research needs concerning the load response mechanism of the secondary air system following shaft failure, it is essential to analyze the variation in axial loads within the flow path under sudden change boundaries and to investigate the influence mechanisms of the flow path’s geometric parameters. When accounting for the effects of inertial forces within the cavity and the inlet and outlet areas, the axial forces acting on the two end faces of the cavity will vary. For the purposes of this study, the end face closer to the atmosphere is designated as the A end face, while the end face farther from the atmosphere is designated as the B end face, as illustrated in Figure 7a. The variations in the axial forces and at the two end faces during the response process are analyzed, summarizing the influence mechanisms of the flow path’s geometric parameters on the evolution of axial loads under sudden boundary conditions. Here, represents the axial force at the A end face, and represents the axial force at the B end face, as indicated in Equations (10) and (11).
—Average pressure at the A end face; —Average pressure at the B end face; —Area of the A end face; —Area of the B end face.
The initial axial forces on each end face are non-dimensionalized with respect to and , as expressed in the following equations.
—Initial average pressure at the A end face; —Initial average pressure at the B end face; —Relative axial force at the A end face; —Relative axial force at the B end face; —Difference in relative axial forces between the A and B end faces.
3.4. Parameters of Flow Path Characteristics
In this study, both the initial pressure and ambient pressure are maintained at constant values. Based on the previous equations, it is clear that the inlet and outlet area of the cavity is the primary geometric factor influencing the CIDZ area. According to the simplified flow path structure presented in Figure 1, the research focuses on the cavity flow path and the combination of the cavity and tube flow paths, as illustrated in Figure 8. In addition to , the key geometric parameters include the shape of the cavity and the length of the tube. The aforementioned influencing factors have been non-dimensionalized, as shown in Table 5. In the combined cavity and tube flow path, the diameter of the tube matches that of the cavity inlet and outlet. Under the specified conditions for , it is sufficient to increase the non-dimensional length of the tube to accurately characterize it.
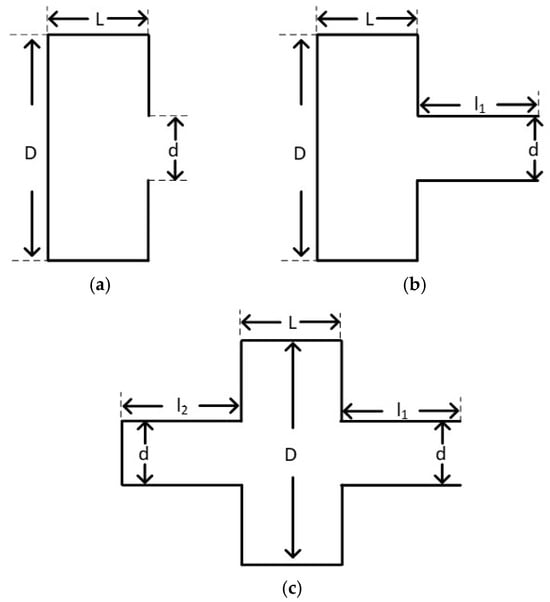
Figure 8.
(a) Cavity flow; (b) Cavity-single tube flow; (c) Cavity-double tube flow.

Table 5.
Dimensional analysis of research parameters.
4. Results
Based on the geometric dimensions of the test specimen from reference [16], this study utilizes a validated three-dimensional simulation method. It performs a three-dimensional simulation analysis of single cavity and combined cavity–tube flow path models, focusing on various combinations of geometric parameters related to flow path characteristics. The changes in the total mass of gas exiting the cavity and the evolution of axial loads within the cavity are compared. Based on the different influencing factors analyzed, the simulation results are categorized, enabling an in-depth examination of the mechanisms by which the geometric parameters of flow path characteristics influence the evolution of axial loads during the fast transient response process under a sudden change boundary.
4.1. Inlet and Outlet Area on the Cavity
In the study of the effects of inlet and outlet area on the cavity, the cavity volume , initial pressure ratio , and cavity shape are maintained at 4.92 × 10⁶, 1.5, and 0.4, respectively. Table 6 presents the range of variation for , and subsequent research will be conducted under these conditions.

Table 6.
Comparative analysis of the effect of on operating conditions.
The relative change in gas quantity within the cavity is a crucial parameter in this study for distinguishing among the various stages of the response process, with changes in being the direct cause of axial load variations within the cavity. Figure 9 illustrates the effect of on the temporal changes in the relative gas quantity , as well as the relative changes in the oscillation peak , oscillation trough , and oscillation period as increases, using condition as the baseline for comparison.
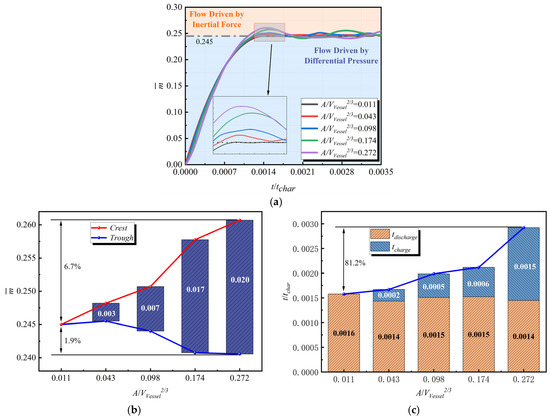
Figure 9.
(a) Evolution of ; (b) Comparison of oscillation amplitude of ; (c) Comparison of Period of .
As increases, the variation of exhibits oscillations, with the amplitude of these oscillations gradually increasing. At the same time, the oscillation period also progressively lengthens. The significant changes in the variation of directly and critically affect the airflow parameters within the cavity, thereby profoundly altering the evolution of the axial load within the cavity. This process clearly demonstrates the important influence of on the inertial forces within the cavity.
Figure 10 provides a more intuitive illustration of the influence of on the inertial forces within the cavity. Specific moments are selected for comparison based on the data presented in Figure 9. At moment , the variation of stabilizes, facilitating the determination of at time . In this study, since the cavity volume, initial pressure in the flow path, and environmental pressure remain constant, is consistently 0.245. The first oscillation period of the response process is examined, with moment during the depressurization process designated as , moment during the pressurization process designated as , and moment during the pressurization process designated as . The changes in CIDZ and EIDZ as increases are compared from the initial moment to and from moment to , with the time interval from to recorded as , as shown in Figure 10.
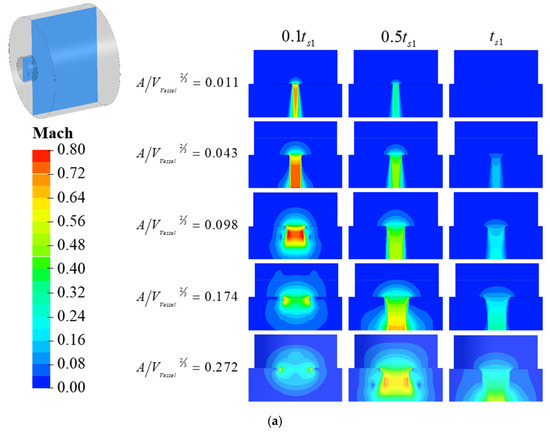
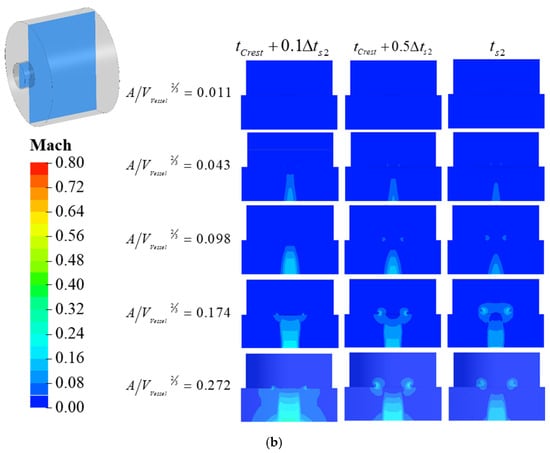
Figure 10.
Comparison of flow field variation in different single cavity flow path (a) discharge process; (b) charge process.
This analysis examines the effect of changes in during the depressurization process on CIDZ and EIDZ in conjunction with Equation (4). An increase in results in a corresponding increase in , which directly leads to an increase in the volume of CIDZ. Simultaneously, it reduces the absolute time required to reach , bringing EIDZ closer to the inlet and outlet of the cavity, thereby enhancing its driving effect on the gas within the cavity.
Based on the previously analyzed mechanism of the influence of increasing on the inertial forces within the cavity, a further examination of its impact on the axial loads within the cavity is conducted. Figure 11 compares the variations in the relative axial force at the A end face and the relative axial force at the B end face, along with the difference in relative axial forces as increases from 0.011 to 0.272. This analysis primarily focuses on the first oscillation period. A comparison is made between the minimum value during the decrease in the relative axial force and the maximum value during the increase, with specific values presented in Table 7. It can be observed that as increases, both and begin to oscillate, with their amplitudes and periods continuously increasing. Additionally, the phase difference between the two oscillations gradually increases, resulting in oscillations in with a significantly larger amplitude.
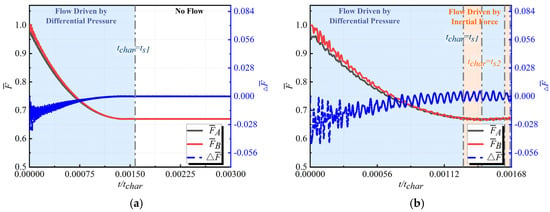
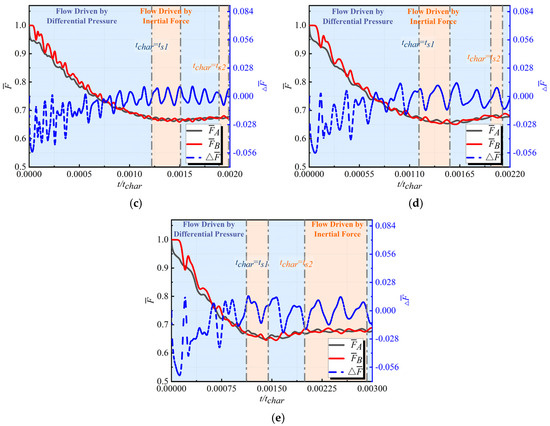
Figure 11.
Comparative analysis of the effect of on (a) ; (b) ; (c) ; (d) ; (e) .

Table 7.
Comparison of parameters for different end face relative axial load variation processes.
During the fast transient response of the flow path under the sudden change boundary, an increase in directly amplifies the effects of inertial forces within the cavity. This not only induces oscillations in the axial load responses at both ends of the cavity but also results in a lack of synchronization in the oscillation phases; the larger the value of , the greater the phase difference.
The aforementioned research indicates that, compared to current studies that do not consider the effects of inertial forces within the cavity, accounting for these forces increases the complexity of the axial load evolution process during the fast transient response under the sudden change boundary. Moreover, this complexity escalates with the increasing influence of inertial forces.
4.2. Tube Length
In conjunction with the conclusions drawn in Section 4.1, this study aims to in-depth investigate the influence mechanism of geometric parameters of the flow path under conditions affected by inertial forces within the cavity, with consistently maintained at 0.272 in subsequent research. In this section, the cavity volume, initial pressure ratio, and cavity shape are kept consistent with those in Section 4.1. Based on the relative positions of the tubes to the cavity, simulations are conducted for both the cavity-single tube and cavity-dual tube flow models. The analysis compares the impact mechanism of increasing the lengths of the inlet and outlet tubes and the non-inlet and outlet tubes on the evolution of axial loads within the cavity during the fast transient response of the flow path, as detailed in the conditions listed in Table 8.

Table 8.
Comparative analysis of the effects of length of tube on operating conditions.
4.2.1. The Influence of Tube Length in Cavity-Single Tube Flow
Study quantifies the effect of on the inertial force within the cavity using the relative gas change . Figure 12 illustrates the variation of under different conditions. Using the oscillation-related parameters at as a comparative baseline, during the 2 increase of from 0 to 1.5, decreases linearly, while and both show a notable decrease followed by an increase. When , the changes in and are relatively minor; however, when , the amplitude of changes in and increases. By combining the distribution of in the cavity at moments and in Figure 13, the differences in CIDZ and EIDZ under varying conditions are further analyzed to elucidate the mechanism by which affects the inertial force within the cavity.
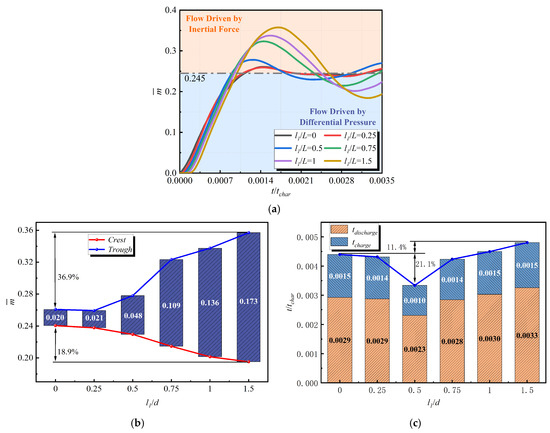
Figure 12.
(a) Evolution of ; (b) Comparison of oscillation amplitude of ; (c) Comparison of Period of .
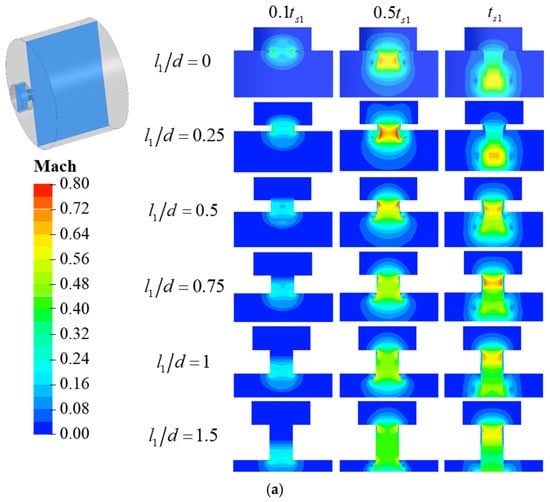
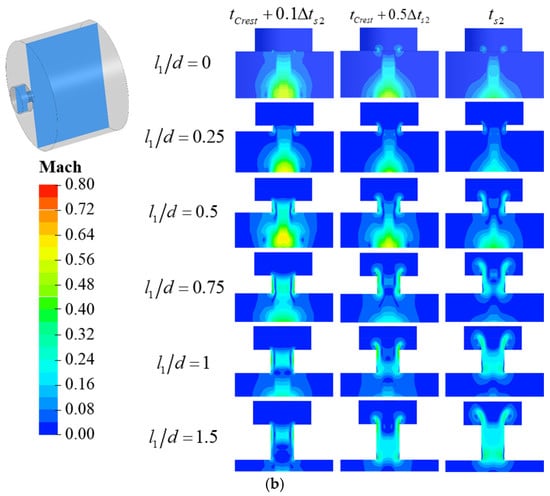
Figure 13.
Comparison of flow field variation in different cavity-single tube flow path (a) discharge process; (b) charge process.
When occurs, the mutation of does not occur at the position of the flow path contraction; instead, the tube structure acts as a hole within the flow path. During the venting process, the distance from EIDZ to CIDZ increases with , while the highest region is located within EIDZ. Consequently, the influence of EIDZ on CIDZ diminishes as increases. At this point, remains constant, and the axial range of CIDZ decreases with increasing , resulting in a slight reduction in the inertial forces within the cavity and a shorter venting duration. This also impacts the axial load response within the cavity, leading to an increased oscillation period for , a greater phase difference between and , and an increase in . During the inflation process, the range of EIDZ expands with , causing to decrease.
When occurs, the mutation of takes place at the flow path contraction, and the tube structure serves as a conduit within the flow path. During the venting process, the positions of CIDZ and EIDZ remain unchanged. At this stage, due to the continuity of flow, the region within the tube becomes equivalent to CIDZ, thereby enlarging its area. Meanwhile, the highest region is situated within the tube and exerts a significant influence on CIDZ. As increases, the highest initially rises and then declines, leading to a corresponding increase followed by a decrease in its impact on CIDZ. Consequently, during the venting process, the inertial forces within the cavity are affected by the coupling of and the highest , generally increasing with , although the rate of increase varies. The enlargement of the CIDZ area shortens the oscillation period of , reduces the phase difference between and , and results in a decrease in .
During the inflation process, both the CIDZ and EIDZ areas increase with . Additionally, due to flow continuity, the region within the tube is equivalent to EIDZ, leading to a significant increase in the inertial force as rises, causing to decrease with increasing and resulting in an increase in inflation time.
Building on the analysis above, the mechanism by which an increase in influences the inertial forces within the cavity is further examined concerning its impact on the axial loads. Figure 14 illustrates the variations in the relative axial force at the A end face, the relative axial force at the B end face, and their relative axial force difference during the process of increasing from 0 to 1.5. In the first oscillation cycle, the peak values of the relative axial forces at both end faces and the relative axial force difference are presented in Table 9.
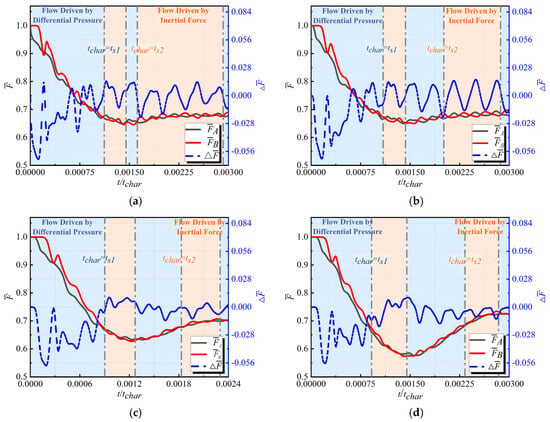
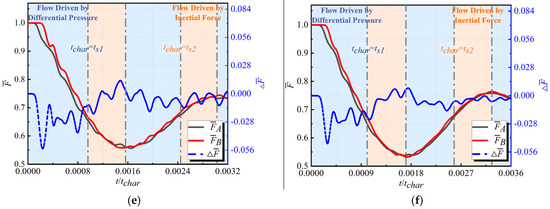
Figure 14.
Comparative analysis of the effect of on (a) ; (b) ; (c) ; (d) ; (e) ; (f) .

Table 9.
Comparison of parameters for different end face relative axial load variation processes.
When occurs, as increases, the duration of the axial force acting within the cavity decreases, while the oscillation peak values of the relative axial loads at both end faces and the relative axial load difference exhibit a slight decrease. When occurs, as increases, the duration of the axial force acting within the cavity increases, while the oscillation peak values of the relative axial forces at both end faces increase; however, the relative axial force difference decreases.
Overall, although the difference in axial loads at both end faces decreases as increases, the underlying reasons differ. At various stages of , it exerts distinct effects on the axial loads within the cavity. When occurs, the tube structure acts as an aperture in the flow path; as increases, the CIDZ range diminishes, resulting in a reduction in the inertial forces within the cavity and a weakening of the axial load oscillations. When occurs, as increases, the equivalent CIDZ range within the tube expands, minimally affecting the CIDZ range within the cavity. This increase in the equivalent CIDZ range within the tube extends the duration of the inertial forces in the cavity, while the essentially unchanged CIDZ range within the cavity has little impact on the oscillation phase difference between and . Consequently, both and increase as increases, while decreases as increases.
4.2.2. The Influence of Tube Length in Cavity-Double Tube Flow
This subsection quantifies the influence of on the inertial forces within the cavity by analyzing the relative variation in the gas quantity . Figure 15 illustrates the effect of the increase in on the variation history of . Using the oscillation-related parameters at as a comparative baseline, it is observed that as increases, the parameters associated with the variation history of change slightly, exhibiting an overall decreasing trend. By examining the distribution of within the cavity at moments and in Figure 16, we further investigate the mechanism by which influences the inertial forces within the cavity.
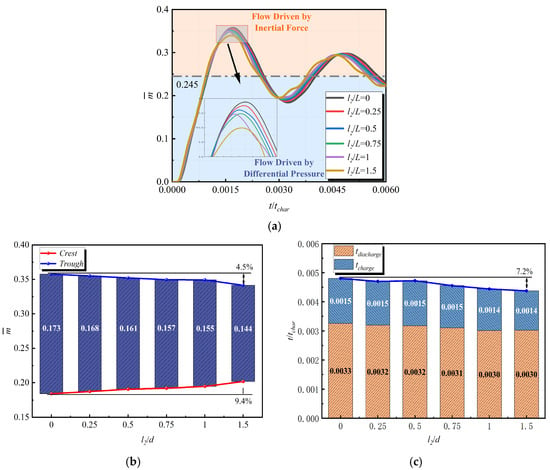
Figure 15.
(a) Evolution of ; (b) Comparison of oscillation amplitude of ; (c) Comparison of period of .
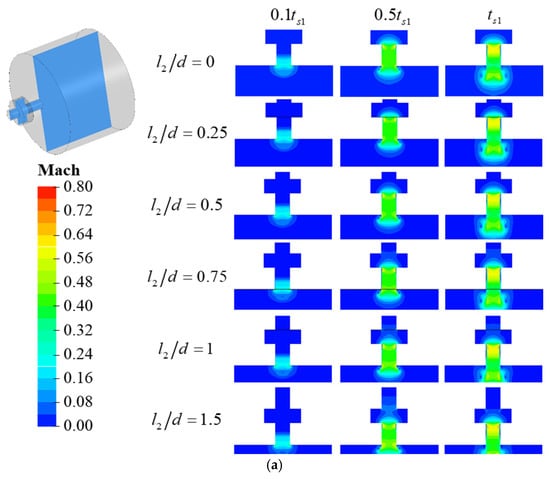
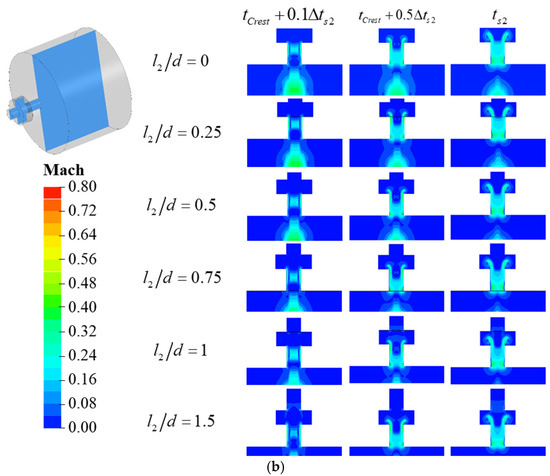
Figure 16.
Comparison of flow field variation in different cavity-double tube flow path (a) discharge process; (b) charge process.
To analyze the impact of changes in , we examine the variations in the distribution range of within the cavity at moments and , as illustrated in Figure 16. Due to the differing positions of the tube within the flow path, an increase in does not allow the region within the tube to be equivalent to the CIDZ range; rather, it increases the volume of the flow path, thereby diminishing the influence of inertial forces within the flow path.
Figure 17 compares the variation in the axial force-related parameter within the cavity as increases from 0 to 1.5. As increases, the oscillation amplitudes and periods of and exhibit slight decreases, while the phase difference remains relatively unchanged, resulting in minimal impact on . A detailed comparison of the parameters is presented in Table 10. Due to the differing positions of the tube, the variation of primarily influences the sudden change boundary response process by altering the flow path volume, without directly affecting the CIDZ. Consequently, the impact on the evolution of axial loads within the cavity is less significant than that of .
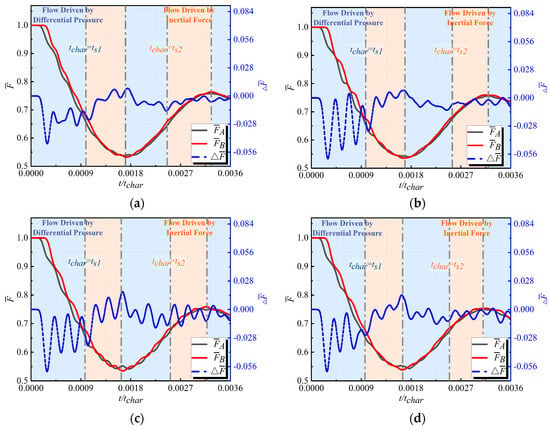
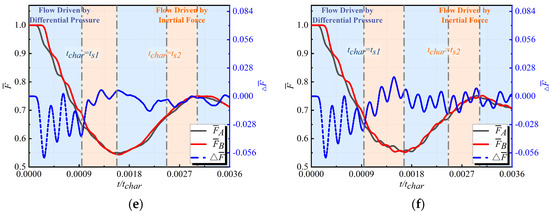
Figure 17.
Comparative analysis of the effect of on (a) ; (b) ; (c) ; (d) ; (e) ; (f) .

Table 10.
Comparison of parameters for different end face relative axial load variation processes.
4.3. Shape of the Cavity
Based on the analysis above, as CIDZ increases, it becomes increasingly constrained by the shape of the cavity. In Section 4.2, the cavity-single tube and cavity-dual tube flow models exhibit different numbers of inlet and outlet ports. This section focuses on investigating the mechanism by which the shape of the cavity influences performance, utilizing these two models as subjects. The cavity volume and initial pressure ratio remain consistent with those in Section 4.1, while and in the cavity-double tube model are compared under the operating conditions presented in Table 11.

Table 11.
Comparative analysis of the effects of on operating conditions.
4.3.1. The Influence of Shape of the Cavity in Cavity-Single Tube Flow
Figure 18 illustrates the effect of the variation of on the variation trajectory of in the cavity–tube flow path. During the process of increasing from 0.15 to 0.40, the amplitude and phase of the variation trajectory of change slightly; however, when increases from 0.40 to 1.86, the variation trajectory of changes significantly. An analysis of the influence patterns at different stages is conducted.
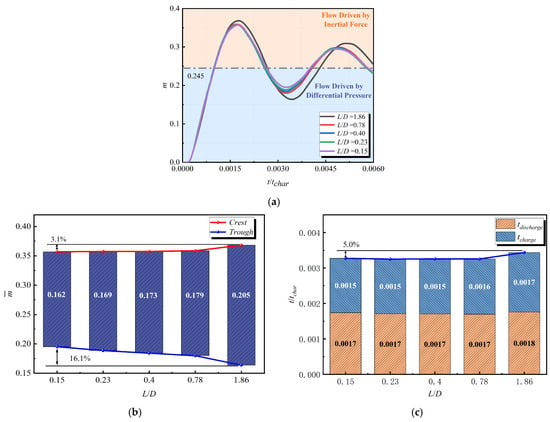
Figure 18.
(a) Evolution of ; (b) Comparison of oscillation amplitude of ; (c) Comparison of period of .
Select and as the comparison moments for the venting and inflation processes, respectively, and compare the variation in the distribution range of within the cavity during these processes, as shown in Figure 19. The variation in is achieved by altering the axial and radial distances of the cavity, thereby influencing the fast transient response of the flow path through the constraints of the CIDZ.
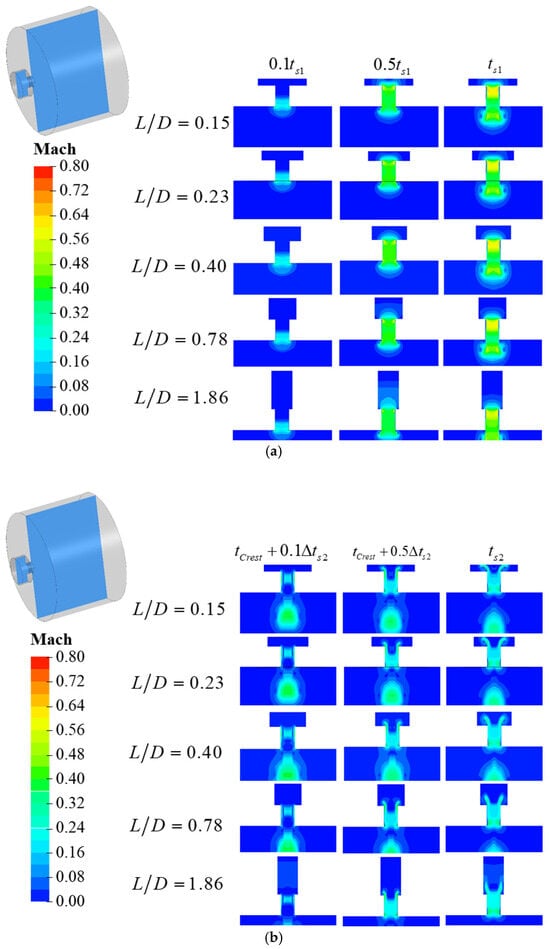
Figure 19.
Comparison of flow field variation in different cavity-single tube flow path (a) discharge process; (b) charge process.
During the venting process, as increases, the axial distance constraint gradually weakens, while the radial distance constraint gradually strengthens. Prior to the axial distance becoming unconstrained, CIDZ increases slowly; however, once the axial distance is unconstrained, CIDZ increases significantly. Due to differences in flow direction, variations in the axial distance of the cavity exert a greater influence on the inflation process. Similarly, during the inflation process, as increases, the axial distance constraint weakens, allowing the flow to fully develop within the cavity, which results in an increase in CIDZ. When the radial distance is constrained, the flow develops along the axis, leading to an increase in the distribution of inertial forces within the cavity.
Figure 20 illustrates the impact of various parameters on the axial load response during the fast transient response process of the cavity–tube flow path. Within the range of 0.15 to 0.4, the effects of on and are minimal, remaining above 2%. As increases from 0.4 to 1.86, the variations in and increase significantly, reaching a maximum of 7.5%. Changes in directly influence the phase difference between the response processes of and ; consequently, continuously varies with . During the increase from 0.15 to 1.86, rises by more than 250%, while decreases by over 400%. Specific parameters are detailed in Table 12.
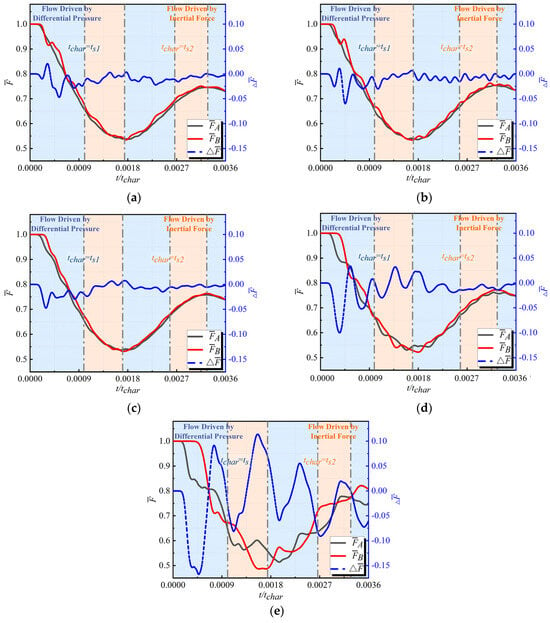
Figure 20.
Comparative analysis of the effect of on (a) ; (b) ; (c) ; (d) ; (e) .

Table 12.
Comparison of parameters for different end face relative axial load variation processes.
Overall, when is small, it does not restrict the CIDZ range and thus has minimal impact on the fast transient response process of the downstream flow path at the sudden change boundary. It also does not affect the axial load response process within the cavity. However, as increases, it gradually begins to restrict the CIDZ range, thereby influencing the inertial forces within the cavity. Considering the effect of the increase in on the phase difference in the axial load response history at both ends of the cavity, variations in complicate the evolution of the axial load in the flow path.
4.3.2. The Influence of Shape of the Cavity in Cavity-Double Tube Flow
Figure 21 illustrates the impact of variations in on the evolution of within the cavity–tube flow path. Similar to the cavity-single tube flow path, the influence of increasing on the evolution of is primarily observed during the phase when increases from 0.40 to 1.86. Further analysis is conducted in conjunction with the distribution of within the cavity.
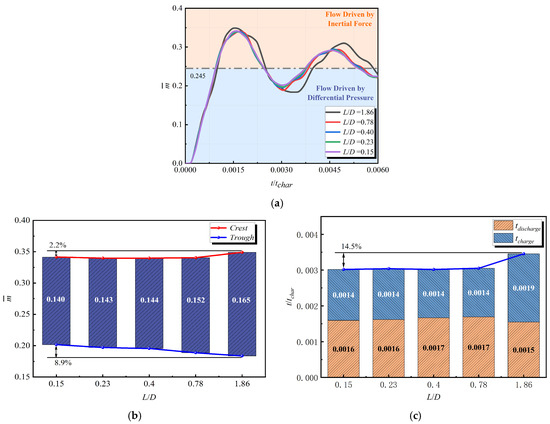
Figure 21.
(a) Evolution of ; (b) Comparison of oscillation amplitude of ; (c) Comparison of period of .
Select and as the comparison moments for the flow path during the depressurization and pressurization processes, respectively, to examine the variations in the distribution range of within the cavity, as shown in Figure 22. CIDZ exhibits a minor increase during the axial distance-constrained phase and a substantial increase during the radial distance-constrained phase. Compared to the cavity-single tube flow path, the variation in in the cavity-double tube flow path also influences the duration the fluid spends in the cavity, thereby having a more pronounced effect on the oscillation phases of , , and .
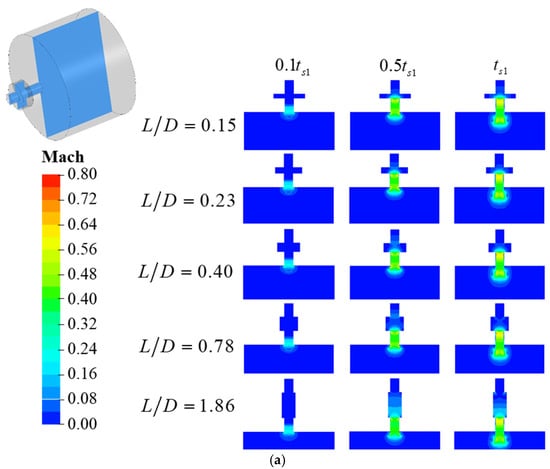
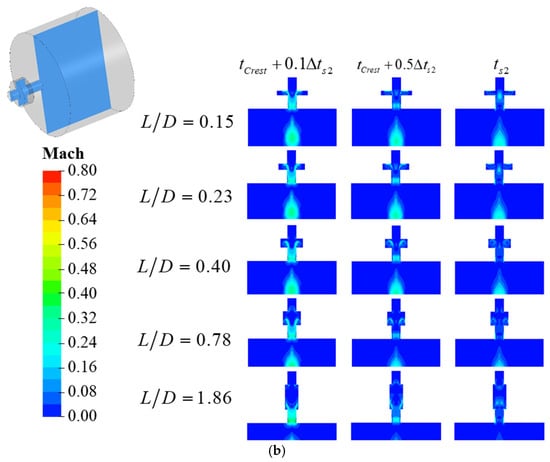
Figure 22.
Comparison of flow field variation in different cavity-double tube flow path (a) discharge process; (b) charge process.
According to Figure 23, the influence of on the axial load response during the fast transient response process of the cavity–tube flow path under the sudden change boundary is illustrated. Similar to the cavity-single tube flow path, the effect of on the responses of and is primarily concentrated in the range when increases from 0.78 to 1.86, during which the variation in restricts the CIDZ range. Furthermore, changes in continue to affect the phase difference in the responses of and , resulting in variations in the response of with changes in , where increases by over 100% and decreases by over 500%. Specific parameters are presented in Table 13.
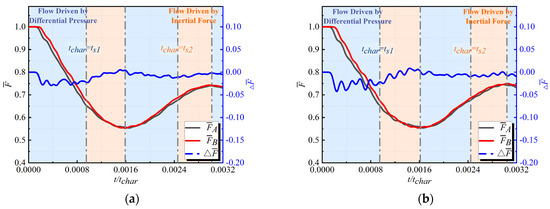
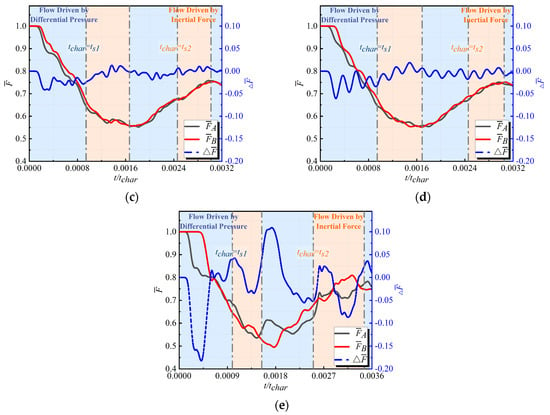
Figure 23.
Comparative analysis of the effect of on (a) ; (b) ; (c) ; (d) ; (e) .

Table 13.
Comparison of parameters for different end face relative axial load variation processes.
Comparing the influence of on the response of in the cavity-single tube flow path, it is observed that during the venting process, the cavity–tube combination flow path, having a larger volume, increases the phase difference in the responses of and . Meanwhile, during the inflating process, the flow directly passes through the cavity, resulting in a higher average flow velocity within the cavity, which reduces the phase difference in the responses of and . Therefore, in the cavity–tube combination flow path, has a greater impact on the reduction of while exerting a smaller effect on the increase of .
5. Conclusions
This study investigates the mechanisms by which the geometric parameters of flow paths influence axial loads during fast transient response processes under existing sudden change boundaries, with particular emphasis on the effects of inertial forces within the cavity. Various single-cavity flow paths and cavity–tube combined flow paths are selected as research subjects. Utilizing a validated three-dimensional model based on experimental data, this research performs an in-depth analysis of the fast transient response processes under sudden change boundaries. From the perspective of inertial forces, and considering the relative gas mass changes within the cavity and the variations in the distribution of , this study analyzes and summarizes the mechanisms by which the inlet and outlet areas of the cavity, tube lengths, and cavity shapes affect the evolution of axial loads in the flow paths. The main research conclusions are as follows:
(1) The variation of directly affects the range of CIDZ within the cavity, influencing the magnitude of the inertial forces present. During the fast transient response process of the flow path under the sudden change boundary, an increase in directly amplifies the influence of these inertial forces, leading to oscillations in the axial load response within the cavity, with both the oscillation period and amplitude gradually increasing. Furthermore, due to the influence of the inertial forces, a phase difference arises in the axial force oscillations at different end faces within the cavity, which enhances the oscillation of the axial force difference between the two end faces, thereby complicating the evolution of the axial load in the flow path.
(2) For the cavity–tube flow path, changes in primarily affect the equivalent CIDZ range and influence the duration of inertial forces within the cavity, while having minimal impact on the magnitude of these forces. When falls within different ranges, the tube serves distinct functions in the flow path. Under the conditions established in this study, when , the tube acts as an orifice in the flow path, and an increase in reduces the impact of EIDZ on CIDZ, thereby diminishing the influence of inertial forces within the cavity. This results in a decrease in the amplitude of axial load oscillations within the cavity while increasing the phase difference in axial force oscillations at both ends, leading to greater discrepancies in axial forces between the two ends. Conversely, when , the tube functions as a conduit in the flow path, and an increase in directly enlarges the equivalent range of EIDZ, thereby enhancing the influence of inertial forces within the cavity. This leads to an increase in the amplitude of axial load oscillations within the cavity and reduces the phase difference in axial force oscillations at both ends, resulting in smaller discrepancies in axial forces between the two ends. For the cavity-double tube flow path, changes in primarily affect the volume of the flow path, reducing the influence of CIDZ on the flow path and consequently decreasing the axial load oscillation process within the cavity.
(3) Whether in the cavity-single tube flow path or the cavity-double tube flow path, primarily influences the phase of the axial load response process while also affecting the magnitude of the inertial forces within the cavity by limiting the axial and radial ranges of CIDZ. When is small, it mainly restricts the axial range of CIDZ; as increases, the limitation gradually shifts from the axial range to the radial range. In this study, when is present, the axial range of CIDZ is primarily constrained, and the increase in has a minimal impact on the axial load oscillation process. Conversely, when is present, the radial range of CIDZ is primarily constrained, and the increase in significantly enhances its effect on the axial load oscillation.
It is important to note that this study focuses solely on simple cavity and cavity–tube component combinations, while the component combinations in actual aeroengine secondary air systems are significantly more complex and diverse. Future research will address this issue by conducting a more in-depth and comprehensive analysis of these complex component combinations, with the aim of further refining the relevant theories and providing a stronger theoretical foundation for the design and safe operation of aeroengines.
Author Contributions
Conceptualization, K.Z., S.D., P.L., T.Q., Z.L. and C.L.; Methodology, K.Z. and C.L.; Software, K.Z.; Validation, J.W.; Formal analysis, P.L. and Z.L.; Investigation, K.Z., S.D., P.L., T.Q. and J.W.; Resources, S.D.; Writing—original draft, K.Z.; Writing—review & editing, S.D., P.L., T.Q. and C.L.; Visualization, J.W. and Z.L.; Supervision, C.L. All authors have read and agreed to the published version of the manuscript.
Funding
This research received no external funding.
Institutional Review Board Statement
Not applicable.
Informed Consent Statement
Not applicable.
Data Availability Statement
The datasets presented in this article are not readily available because the data are part of an ongoing study. Requests to access the datasets should be directed to the corresponding author.
Conflicts of Interest
The authors declare no conflict of interest.
Abbreviations
The following abbreviations are used in this manuscript:
| CIDZ | Cavity Inertial Force Dominant Zone |
| EIDZ | Environment Inertial Force Dominant Zone |
References
- Liu, C.; Li, Y.; Qiu, T. Performance modeling of turbofan engine in event of shaft failure. J. Aerosp. Power 2017, 32, 2855–2861. [Google Scholar]
- FAA. e-CFR 14 Part 33, Airworthiness Standards: Aircraft Engines; FAA: Washington, DC, USA, 2009.
- Eryilmaz, I.; Pachidis, V. Turbine thermomechanical modelling during excessive axial movement and overspeed. Aeronaut. J. 2019, 123, 248–264. [Google Scholar] [CrossRef]
- Yang, Z.; Hong, J.; Wang, D.; Ma, Y.; Cheng, R. Failure analysis of an aero-engine inter-shaft bearing due to clearance between the outer ring and its housing. Eng. Fail. Anal. 2023, 150, 107298. [Google Scholar] [CrossRef]
- Gallar, L. Gas Turbine Shaft Over-Speed/Failure Performance Modelling. Ph.D. Thesis, School of Engineering, Power and Propulsion, Cranfield University, Cranfield, UK, 2010. [Google Scholar]
- Zhu, P. Numberiacal Simulation and Experimental Study on the Transient Process of the Air System in Aerogine. Ph.D. Thesis, Northwestern Polytechnical University, Xi’an, China, 2017. [Google Scholar]
- Benson, R.S.; Garg, R.D.; Woollatt, D. A numerical solution of unsteady flow problems. Int. J. Mech. Sci. 1964, 6, 117–144. [Google Scholar] [CrossRef]
- Benson, R.S. A Comprehensive Digital Computer Program to Simulate a Compression Ignition Engine Including Intake and Exhaust Systems; SAE Technical Paper No. 710173; SAE International: Warrendale, PA, USA, 1971. [Google Scholar]
- Chevalier, A.; Müller, M.; Hendricks, E. On the validity of mean value engine models during transient operation. SAE Trans. 2000, 109, 1571–1592. [Google Scholar]
- Cipollone, R.; Sughayyer, M. A new modeling of air dynamics inside ICE intake manifolds. In Proceedings of the 7th International Conference, The Role of Experimentation in the Automotive Product Development Process (ATA 2001), Firenze, Italy, 23–25 May 2001. [Google Scholar]
- Lu, X. Computational Study on One-Dimensional Fluid Flow and Design of Performance Simulation Software for Internal Combustion Engine. Ph.D. Thesis, Shanghai Jiaotong University, Shanghai, China, 2014. [Google Scholar]
- Calcagni, C.; Gallar, L. Development of a one Dimensional Dynamic Gas Turbine Secondary Air System Model-part I: Tool components development and validation. In Power for Land, Sea, and Air, Proceedings of the ASME Turbo Expo 2009, Orlando, FL, USA, 1 January 2009; American Society of Mechanical Engineers: New York, NY, USA, 2009; pp. 457–465. [Google Scholar]
- Calcagni, C.; Gallar, L. Development of a one Dimensional Dynamic Gas Turbine Secondary Air System Model -part II: Assembly and validation of a complete network. In Power for Land, Sea, and Air, Proceedings of the ASME Turbo Expo 2009, Orlando, FL, USA, 1 January 2009; American Society of Mechanical Engineers: New York, NY, USA, 2009; pp. 466–474. [Google Scholar]
- Gallar, L.; Calcagni, C. Time Accurate Modelling of the Secondary Air System Response to rapid transients. J. Aerosp. Eng. 2011, 225, 946–958. [Google Scholar] [CrossRef]
- Liu, C.; Liu, H.; Li, Y. Modularized simulation modeling of air system with fast transients. J. Aerosp. Power 2015, 30, 1826–1833. [Google Scholar]
- Dutton, J.C.; Coverdill, R.E. Experiments to Study the Gaseous Discharge and Filling of Vessels. Int. J. Eng. Educ. 1997, 13, 123–134. [Google Scholar]
- Thorncroft, G.; Patton, J.S.; Gordon, R. Modeling compressible air flow in a charging or discharging vessel and assessment of polytropic exponent. In Proceedings of the 2007 Annual Conference & Exposition, Honolulu, HI, USA, 24 June 2007; pp. 1–12. [Google Scholar]
- Gao, W.; Liu, Z.; Zhu, P.; Lv, Y. Numerical and Experimental Investigation of Transient Response of Static Disc Cavity in Aero-Engine. J. Propuls. Technol. 2019, 40, 496–503. [Google Scholar]
- Yan, Z.; Mu, C.; Yuan, S. Influence of cacity aspect ratio on the propagation law of gas explosion shock wave. J. China Coal Soc. 2020, 45, 1803–1811. [Google Scholar]
- Kmecova, M.; Sikula, O.; Krajcik, M. Circular free jets: CFD simulations with various turbulence models and their comparison with theoretical solutions. IOP Conf. Ser.: Mater. Sci. Eng. 2019, 471, 062045. [Google Scholar] [CrossRef]
Disclaimer/Publisher’s Note: The statements, opinions and data contained in all publications are solely those of the individual author(s) and contributor(s) and not of MDPI and/or the editor(s). MDPI and/or the editor(s) disclaim responsibility for any injury to people or property resulting from any ideas, methods, instructions or products referred to in the content. |
© 2025 by the authors. Licensee MDPI, Basel, Switzerland. This article is an open access article distributed under the terms and conditions of the Creative Commons Attribution (CC BY) license (https://creativecommons.org/licenses/by/4.0/).
