Article

Analysis of Internal Explosion Vibration Characteristics of Explosion-Proof Equipment in Coal Mines Using Laser Doppler

1
School of Mechanical Engineering, Xi’an University of Science and Technology, Xi’an 710054, China
2
Shaanxi Key Laboratory of Mine Electromechanical Equipment Intelligent Detection and Control, Xi’an 710054, China
3
Shaanxi ‘Four Subjects and One Union’ Coal Mine Intelligent Management and Control System and Disaster Prevention Equipment School-Enterprise Joint Research Center, Xi’an 710054, China
4
CCTEG Shenyang Research Institute, Shenyang 113122, China
*
Author to whom correspondence should be addressed.
Appl. Sci. 2025, 15(17), 9255; https://doi.org/10.3390/app15179255
Submission received: 14 July 2025 / Revised: 16 August 2025 / Accepted: 20 August 2025 / Published: 22 August 2025
(This article belongs to the Special Issue Advanced Blasting Technology for Mining)

Abstract

Currently, there is a lack of methods for detecting the mechanism of gas explosion propagation within flameproof enclosures and the dynamic behavior of flameproof enclosures under explosion impact. Therefore, this paper studies a method for detecting the vibration characteristics of coal mine explosion-proof equipment under internal gas explosions using laser Doppler. First, a model of gas explosion propagation and explosion transmission response in flameproof enclosures is established to reveal the mechanism of gas explosion transmission inside coal mine flameproof enclosures. Second, a laser Doppler measurement method for coal mine flameproof enclosures is proposed, along with a step-by-step progressive vibration characteristic analysis method. This begins with a single-frequency dimension analysis using the Fourier transform (FFT), extends to time–frequency joint analysis using the short-time Fourier transform (STFT) to incorporate a time scale, and then advances to a three-dimensional linkage of scale, time, and frequency using the wavelet transform (DWT) to solve the limitation of the fixed window length of the STFT, thereby achieving a dynamic characterization of the detonation response characteristics. Finally, a non-symmetric Gaussian impact load inversion model is constructed to validate the overall scheme. The experimental results show that the FFT analysis identified a 2000 Hz main frequency, along with the global frequency components of the flameproof enclosure vibration signal, the STFT analysis revealed the dynamic evolution of the 2000 Hz main frequency and global frequency over time, and the wavelet transform achieved higher accuracy positioning of the frequency amplitude in the time domain, with better time resolution. Finally, the experimental platform showed an error of less than 5% compared with the actual measured impact load, and the error between the inverted impact load and the actual load was less than 15%. The experimental platform is feasible, and the inversion model has good accuracy. The laser Doppler measurement method has significant advantages over traditional coal mine flameproof equipment measurement and analysis methods and can provide further failure analysis and prevention, design optimization, and safety performance evaluation of flameproof enclosures in the future.

1. Introduction

Coal accounts for more than 90% of China’s fossil energy resources and is the most stable, economical, and independently secure energy source. China’s coal mining geological conditions are complex and characterized by high levels of flammable and explosive gases, and failures of key components of coal mine equipment, such as flameproof enclosures, can cause gas explosions and other disasters. The safety of explosion-proof equipment in coal mines directly impacts the smooth and safe operation of coal mine production. The frequent occurrence of methane explosions and other accidents have placed higher demands on the performance of explosion-proof equipment [1]. On 19 July 2022, the National Mine Safety Administration issued the “14th Five-Year Plan for Mine Safety Production”, explicitly stating the need to enhance the safety and reliability of equipment and eliminate production safety accidents caused by equipment failures. Currently, the performance of flameproof enclosures is mainly judged based on the requirements of GB3836.2 [2] and past experience. Pressure resistance tests are used to verify the strength of flameproof enclosures, but this method cannot reveal the explosion process inside the enclosure, nor can it obtain rich dynamic data, and it is even more difficult to measure the dynamic response of the enclosure for mechanical performance analysis. Therefore, it is of great significance to study the propagation and action mechanism of gas explosions inside flameproof enclosures, to improve the testing methods and analysis techniques for flameproof enclosures, to prevent safety accidents caused by the failure of flameproof enclosures, to optimize explosion-proof designs, and to reduce testing costs.
As an important part of coal mine equipment, the explosion-proof performance of flameproof enclosures directly determines the safety of equipment in explosive environments. Among these, explosion-proof type “d” is the most reliable and widely used type of electrical explosion protection [3]. Its principle mainly relies on the explosion resistance of the outer shell, requiring the flameproof enclosure to have sufficient strength to withstand the explosion pressure of explosive gases inside the outer shell. Currently, research on the mechanisms of methane explosions is relatively well developed. Early studies [4] examined the generation of methane explosion flames and pressure waves based on chemical reactions, while Kundu [5] and others investigated combustion, explosion, deflagration, and detonation phenomena related to pressure waves. Concurrently, scholars have also studied various explosion theory models, including general models, isothermal models, and isochoric adiabatic models [6]. Many scholars [7,8] have also conducted research on gas explosion pressure and the mechanical behavior of flameproof enclosures based on the above models, but there is a lack of research on the explosion transmission mechanism of flameproof enclosures under the action of gas explosions. At present, the measurement system for coal mine flameproof enclosures is relatively basic. At this stage, pressure sensors are used to collect pressure data through pressure resistance tests [9] on flameproof enclosures, which serve as the evaluation criteria for product explosion-protection qualification. Therefore, current research on testing methods for flameproof enclosures is limited to pressure sensor measurement research [10,11], which can only obtain the impact load of gas explosions and cannot determine the dynamic response of the enclosure. Laser Doppler measurement technology has the advantages of high accuracy and high time resolution in explosion enclosure measurement in other fields [12] and can fully obtain the dynamic response of the enclosure surface, providing a new technical reference for the measurement of coal mine flameproof enclosures. The explosion-proof testing and qualification assessment of coal mine equipment primarily rely on the aforementioned type tests. While this method can, to some extent, verify the explosion-proof qualification of the equipment, pressure sensors cannot capture the dynamic response of the equipment in a real-world explosion environment, nor can they analyze mechanical behavior for quantitative assessment, and they cannot optimize designs at weak points [13]. Therefore, dynamic response analysis methods for flameproof enclosures are currently lacking, whereas laser Doppler measurement can achieve response characteristics through time–frequency-domain analysis of the collected signals [14,15,16]. Therefore, laser Doppler technology can be used to analyze the vibration response of coal mine flameproof enclosures, conduct in-depth research on the mechanical characteristics of flameproof enclosures, and establish scientific analysis methods, which can provide more effective data support and more scientific guidance for improving coal mine safety production, analyzing and preventing the failure of explosion-proof equipment, and designing and manufacturing equipment.
In summary, this paper establishes a model for gas explosion propagation and explosion response in flameproof enclosures. The model reveals the propagation process from the start of the gas explosion inside the enclosure to the enclosure wall, as well as the response pattern after the explosion. A laser Doppler measurement method for flameproof enclosures is proposed, which solves the problems of relying on single pressure measurement data and difficult pressure sensor installation in traditional methods. It proposes a method for analyzing the vibration characteristics of flameproof enclosures by combining one-dimensional FFT frequency domain to STFT time–frequency and DWT scale–time–frequency three-dimensional linkage. This method gradually reveals the vibration characteristics of flameproof enclosures in multiple dimensions and scales, and has significant advantages over traditional coal mine flameproof equipment explosion-proof characteristic testing and analysis methods.

2. Principles of Measurement and Analysis of Vibration Characteristics of Coal Mine Flameproof Enclosures

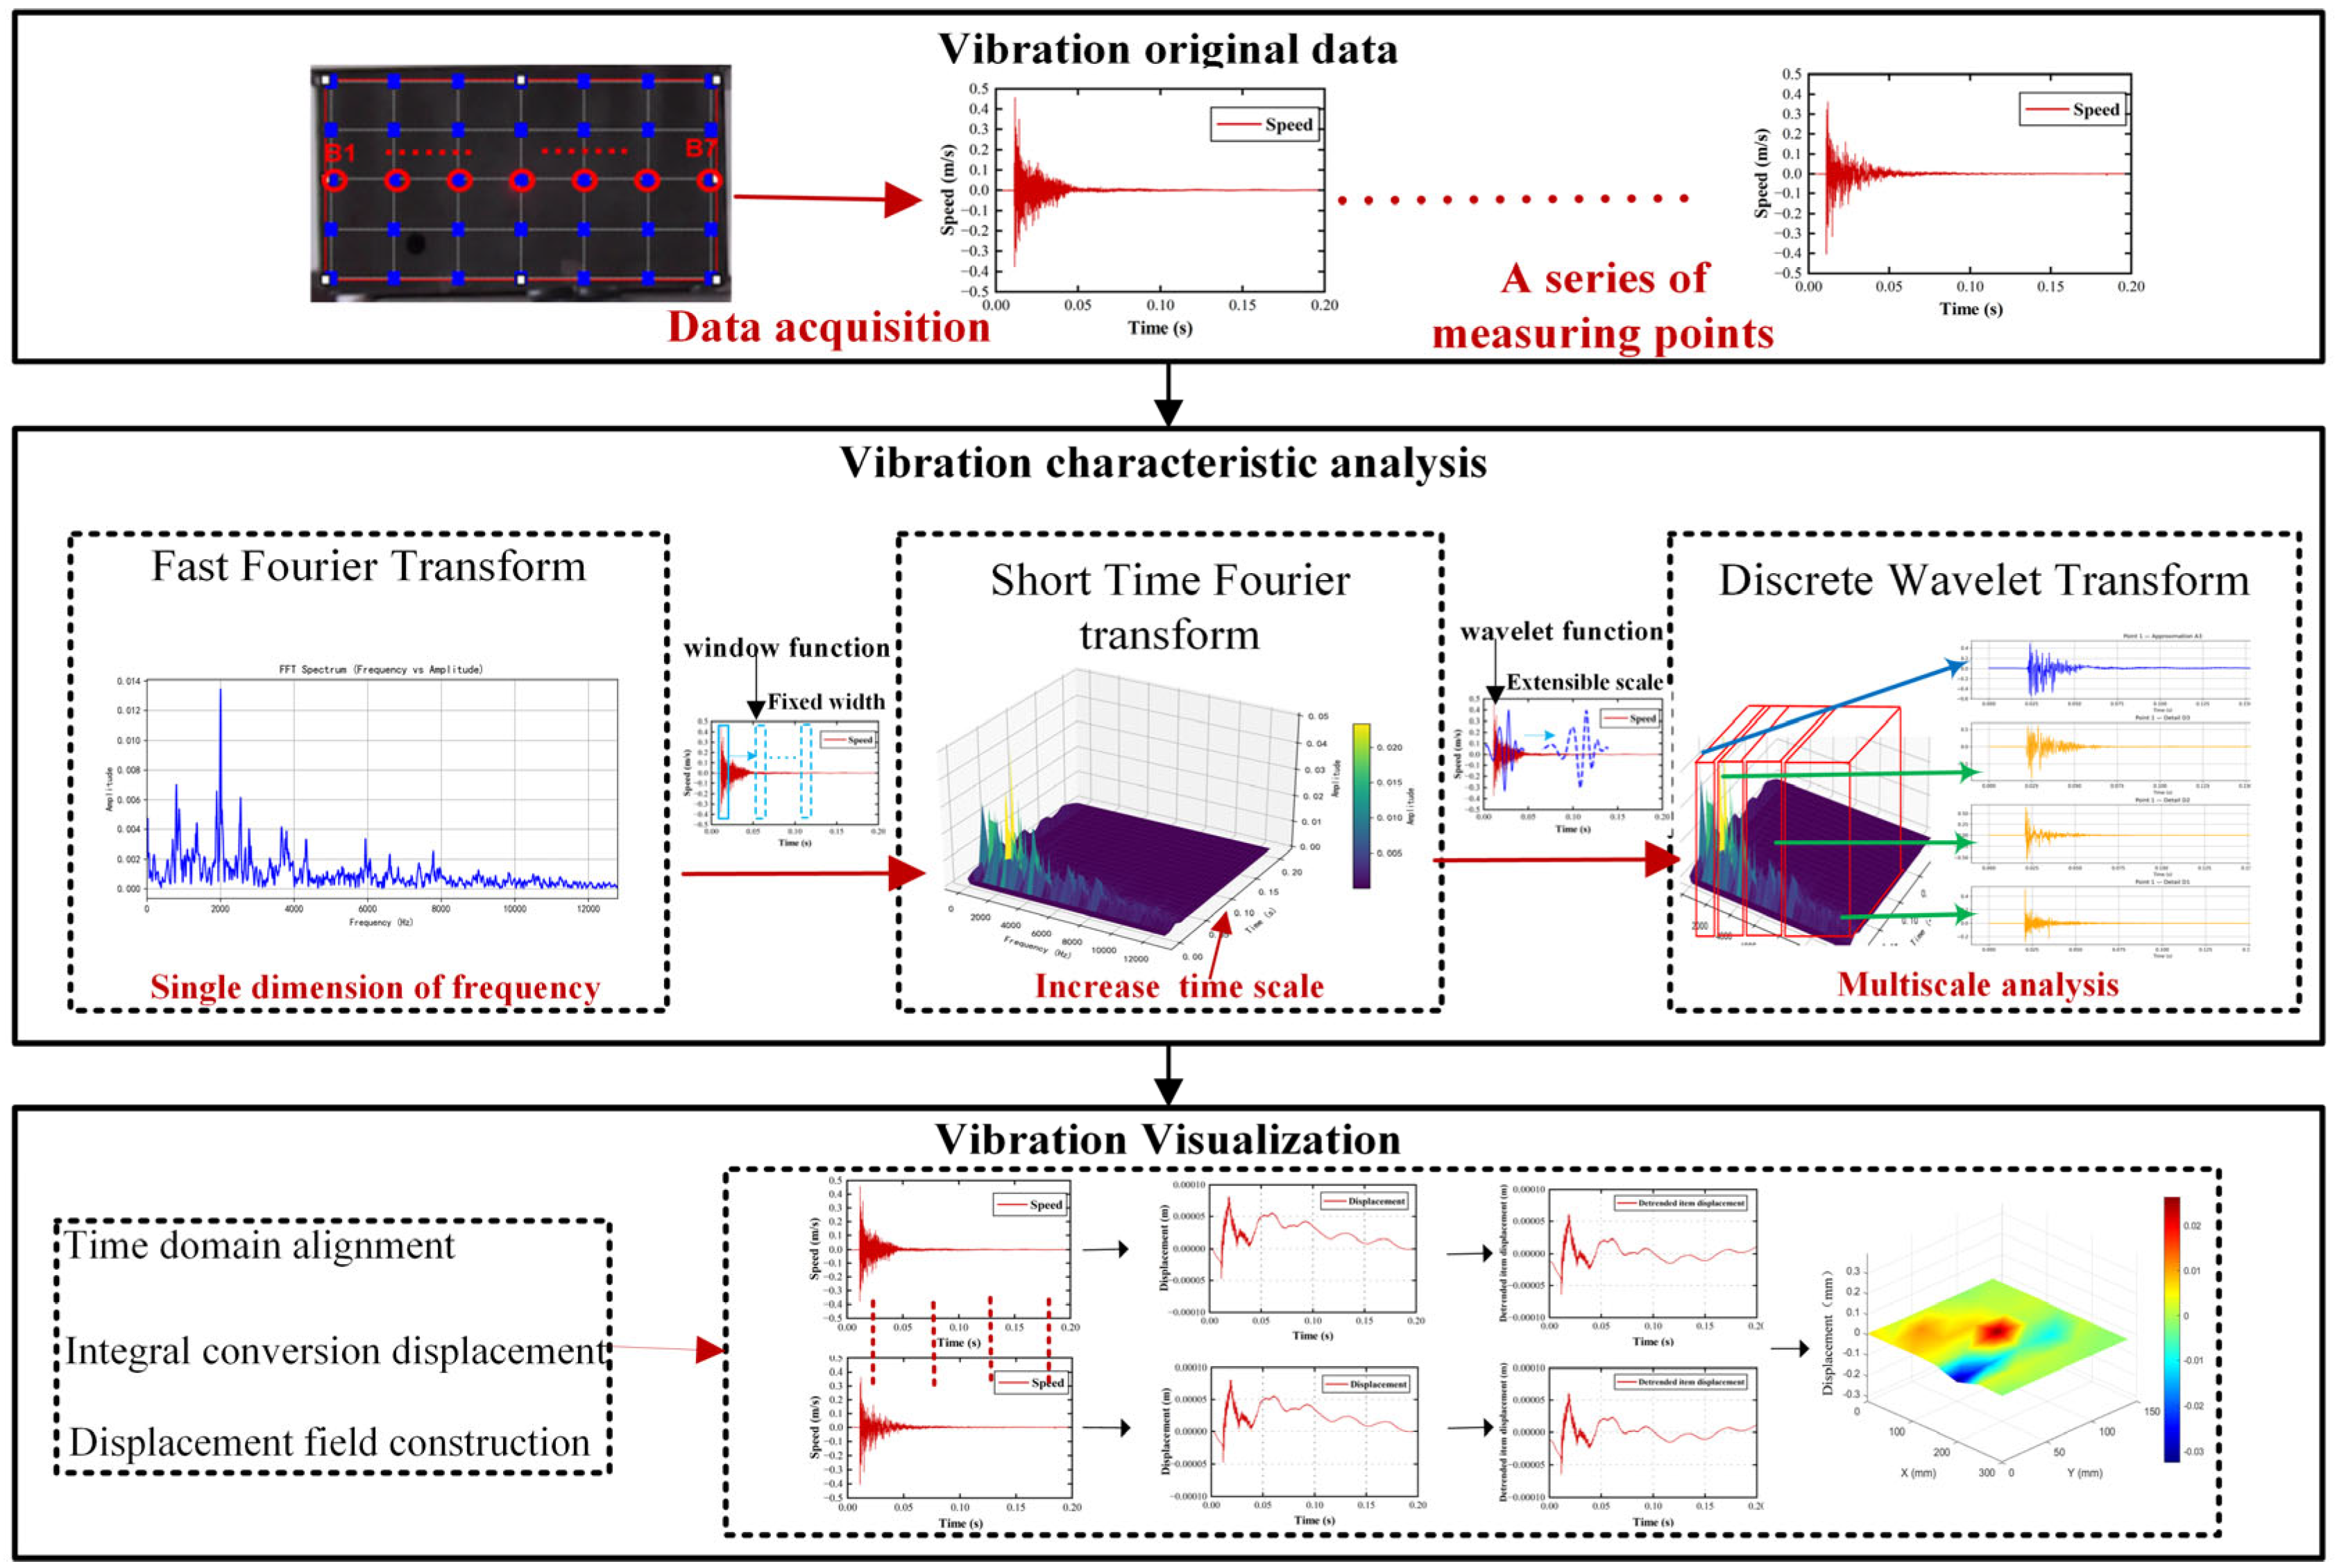
This study aims to systematically analyze the vibration response characteristics of explosion-proof equipment in coal mines under internal explosion conditions. It uses laser Doppler technology to replace traditional pressure contact measurement methods and establishes a complete technical path from theoretical analysis, detection methods, and vibration characteristic analysis. The overall research process is shown in the Figure 1 below and mainly includes three core links:
(1) Gas explosion propagation and detonation transmission response model for flameproof enclosures
In the explosion propagation and response model section, the basic mechanism of gas explosions and their propagation characteristics in flameproof enclosures are discussed. By establishing a gas explosion propagation model inside flameproof enclosures and an explosion transmission response model for the enclosures, a theoretical basis is provided for subsequent laser Doppler measurement layout, impact simulation experiment design, and physical interpretation of vibration response data.
(2) Laser Doppler measurement method for flameproof enclosures
In the vibration measurement of coal mine flameproof enclosures, the laser Doppler measurement method (LDV) is proposed, which can accurately capture the dynamic response of flameproof enclosures under the impact of explosions, avoiding the signal interference and installation complexity of contact sensors during explosions. The accuracy and reliability of vibration measurement are ensured by using the direct measurement method and the global measurement point layout.
(3) Method for analyzing vibration characteristics of flameproof enclosures
We propose a step-by-step progressive method for analyzing the vibration characteristics of coal mine flameproof enclosures, starting from a single-frequency dimension analysis using FFT, to a two-dimensional time–frequency joint analysis using STFT, and finally to a three-dimensional scale–time–frequency joint analysis using DWT. This method enables a step-by-step progressive analysis of vibration characteristics, revealing the frequency and energy distribution patterns of vibration signals during the propagation of explosion shock waves. By constructing a vibration displacement field through time-domain alignment and the integration of vibration measurements obtained using laser Doppler technology, this method enables a comprehensive understanding of vibration characteristics from point to surface.
(4) Overall verification
Finally, an impact load inversion model was constructed based on an asymmetric Gaussian model, combining the least squares method and modal decomposition to invert the time history of the impact load from laser Doppler data, confirming the feasibility of the laser Doppler measurement method and its potential to replace traditional methods.

3. Coal Mine Explosion-Prevention Equipment: Methane Explosion Transmission and Detonation Response Model

3.1. Gas Explosion Propagation Model

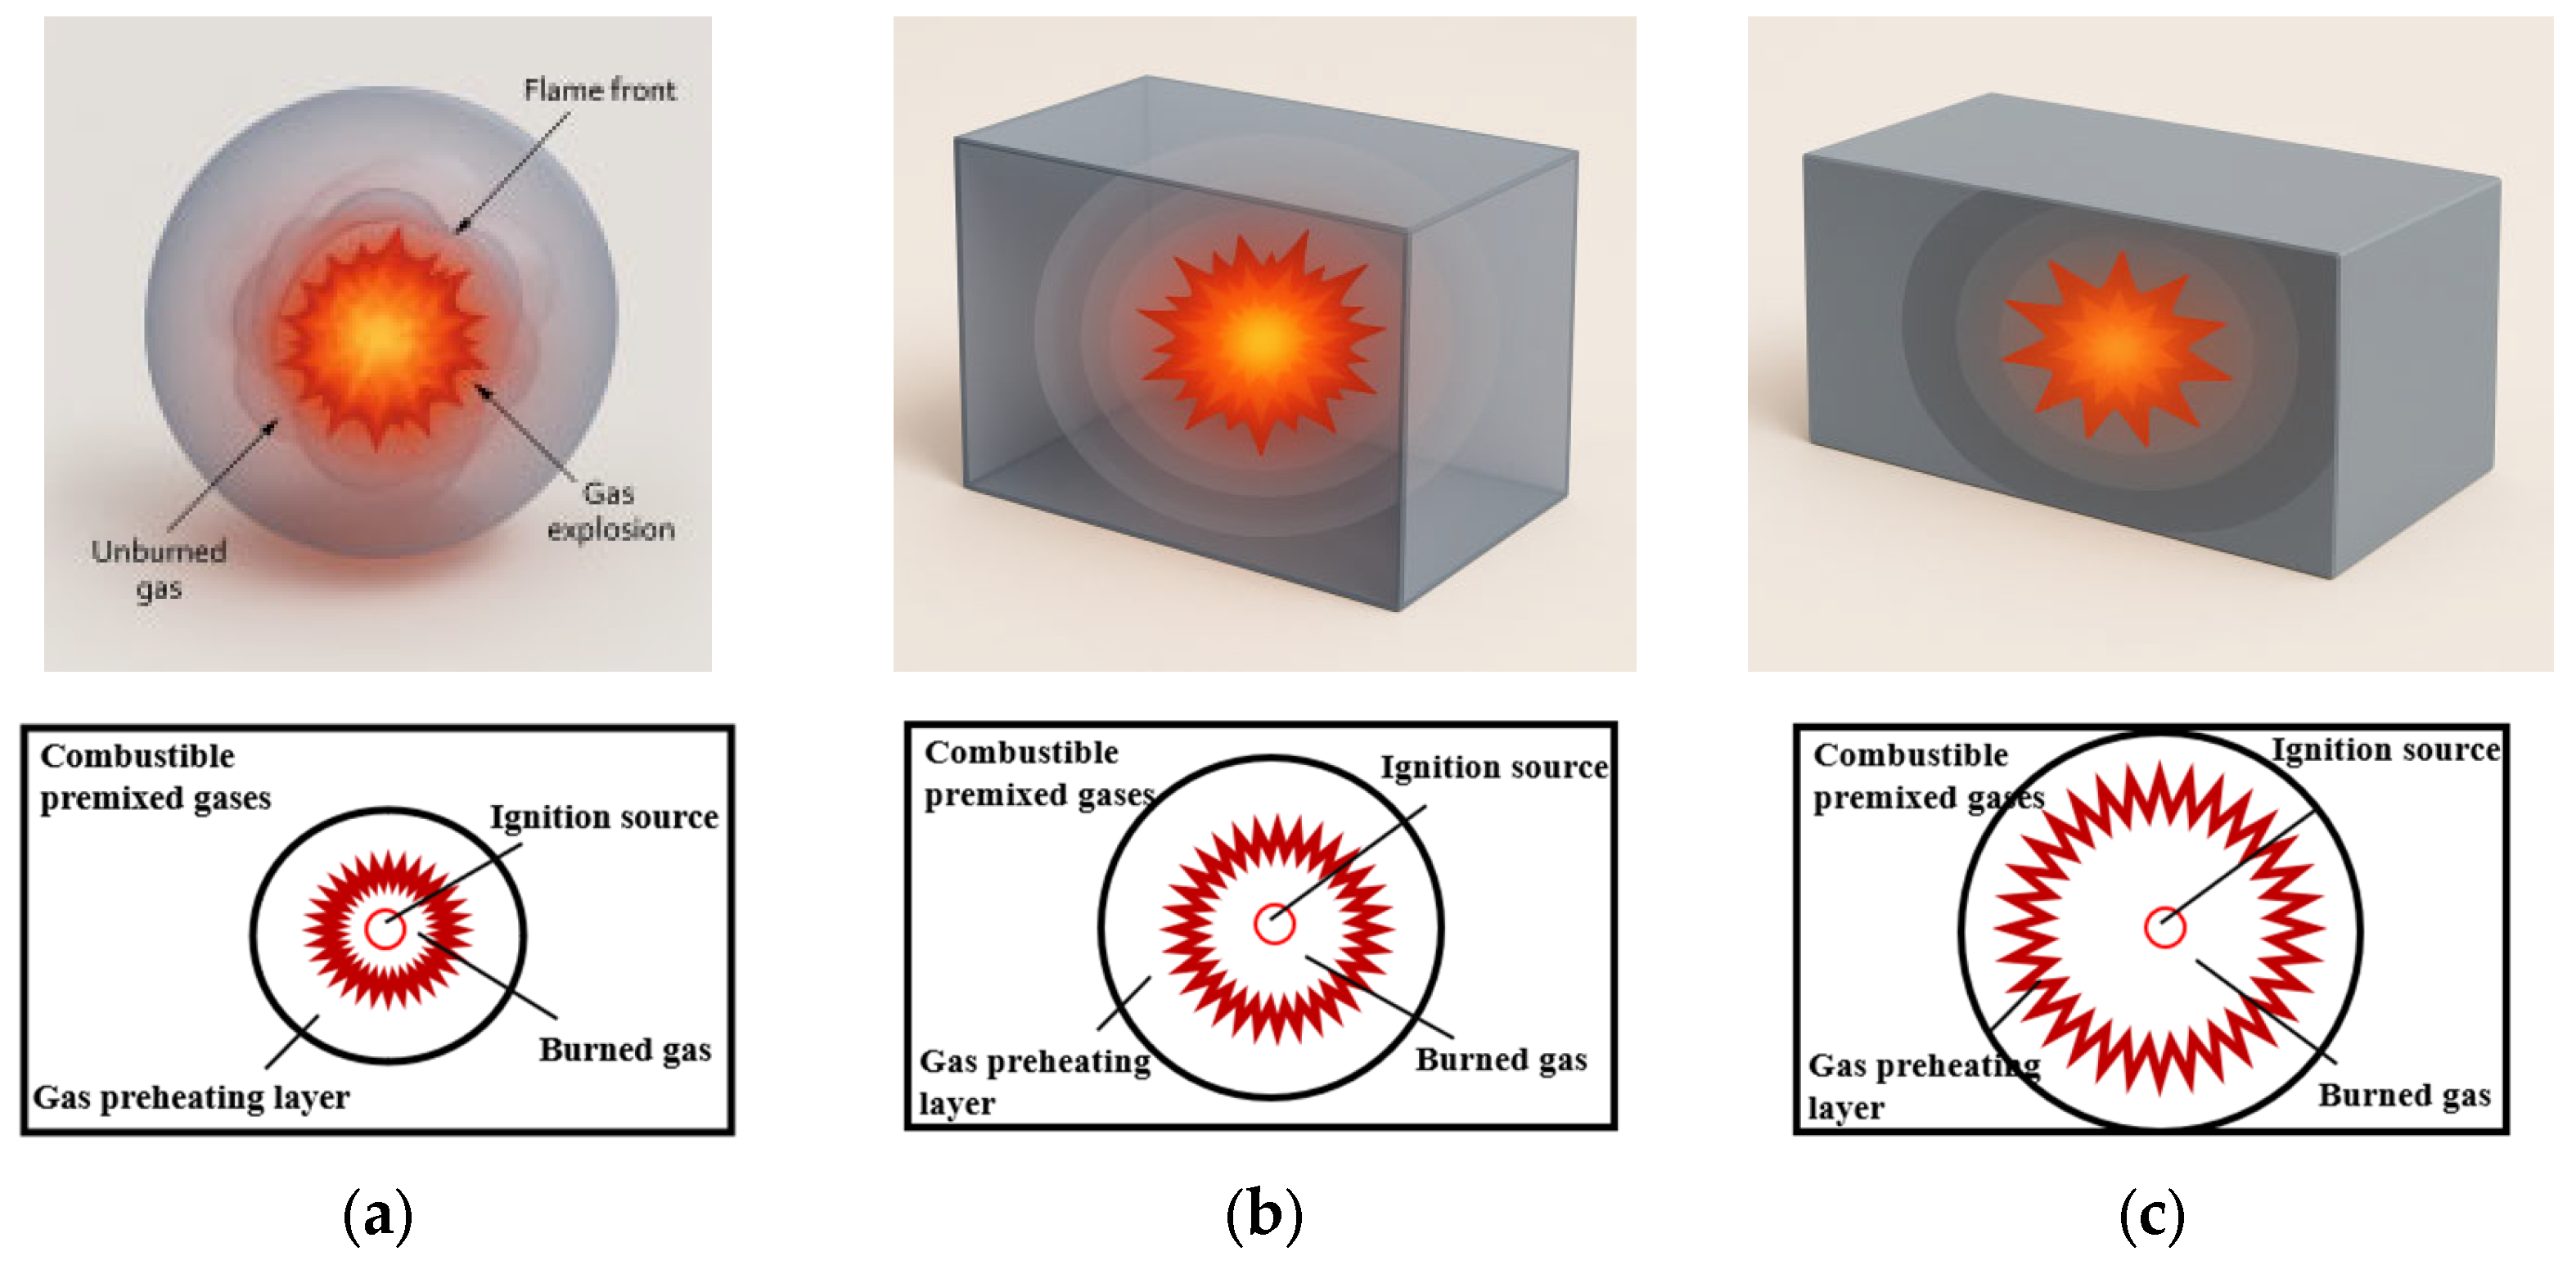
In the explosion test, the gas explosion inside the flameproof enclosure was achieved by igniting a mixture of methane and oxygen at a standard concentration. The explosion process released a large amount of heat and generated an impact force, with the shock wave propagating outward in a spherical direction [17], as shown in Figure 2a, including a precursor wavefront and a flame wavefront, whose propagation can be expressed by the following equation:
R t = ξ E ρ 0 1 / 5 t 2 / 5
where R t is the shock wave radius (m); E and ρ 0 are the total energy released by the explosion (J) and the medium density (kg/m3), respectively; and ξ is a dimensionless constant related to the specific heat ratio γ .
Currently, explosion models include isothermal models, adiabatic models, and general models. Explosions inside flameproof enclosures are classified as closed container explosions, with no heat exchange with the outside environment, and are suitable for constant-volume adiabatic models [18]. It is assumed that the temperature of unreacted gas T u and the temperature of reacted gas T b increase as the pressure P in the container increases:
T u = T 0 P P 0 1 1 Y u T b = T m P P m 1 1 Y b
where P 0 is the initial pressure, T 0 is the initial temperature, Y u and Y b represent the specific heat ratio of the unreacted gas and the specific heat ratio of the reacted gas. The fixed-volume explosion pressure can be obtained using the ideal gas equation of state:
P n = n m T m n 0 T 0 P 0
where P 0 is the initial pressure, n m and T m are the molar quantities and temperatures of the reaction products, and n 0 and T 0 are the molar quantities and temperatures of the reactants.
In the aforementioned model, within a sealed container, the chemical reaction rate is extremely high, causing the temperature to rise sharply and the pressure to increase rapidly, leading to an explosion. Finally, the explosion shock wave is transmitted to the shell wall, as shown in Figure 2b,c,with the center of the wall being the first to be affected, as it is the earliest and strongest point of impact of the explosion shock wave. This can be regarded as the center of the wall array being affected, and subsequent research is based on this theory. When the shock wave reaches the wall, the shell will produce a strong response, which initially manifests as a vibration response.

3.2. Detonation Transmission Response Model for Flameproof Enclosures

After an explosion occurs during an explosion test, the gas inside the flameproof enclosure burns instantaneously, releasing heat and expanding rapidly, forming a high-amplitude, short-duration instantaneous impact load. On a time scale, this load can be approximated as a pulse excitation. The pulse excitation characteristics of a gas explosion determine how it affects the structure. This pulse excitation can be expressed by the following equation:
F t = F 0 δ t
where F 0 represents the intensity of the pulse impact, and δ t represents the instantaneous impact force.
The response of flameproof enclosures to this pulse impact can be modeled using a single-degree-of-freedom system, whose system dynamics equation is as follows:
m q ¨ t + c q ˙ t + k q t = P 0 δ t
where q t represents the displacement of a point, m is the mass, c is the damping coefficient, and k is the stiffness. The impulse response function is obtained as follows:
h t = 1 m ω d e ξ ω 0 t sin ω d t
where ω 0 represents the natural frequency of the shell without damping, and ω d represents the natural frequency of the shell with damping.
To more accurately reflect the true dynamic characteristics of thin plate shells under explosive impact, this paper introduces a multi-modal vibration model based on the material properties of Q235 steel on the basis of the traditional single-degree-of-freedom system. This model comprehensively considers the natural modal distribution of rectangular thin plates under four-sided fixed boundary conditions, modal coupling effects, and additional damping caused by welds and fixed constraints, making the calculation results closer to the actual structural response. By applying corrections based on equivalent mass, equivalent damping, and equivalent stiffness, complex multi-modal responses can be mapped to an equivalent single-degree-of-freedom system. Equivalent mass is used to reflect the contribution of each modal order to the overall inertial characteristics, equivalent damping represents the combined effect of material internal dissipation and boundary energy dissipation, and equivalent stiffness combines the bending stiffness of thin plates and boundary constraint stiffness to perform equivalent processing on the overall stiffness of the system.
(1) Structural damping and stiffness of materials
In order to more accurately describe the dynamic response of coal mine flameproof enclosures, considering the internal damping of Q235 steel and the additional damping caused by welds and fixed boundaries, the vibration energy will rapidly decay in a short period of time. Therefore, we introduce equivalent mass, equivalent damping coefficients, and stiffness coefficients, and the dynamic equation is improved as follows:
m e q q ¨ t + c e f q ˙ t + k e f q t = P 0 δ t
where m e q is to correct the mass coefficient, c e q is to correct the damping coefficient, and k e q is to correct stiffness coefficient.
(2) Material and structural parameter expression
The equivalent stiffness of the shell is derived from thin plate theory as follows:
k e q = 4 D π 2 a 2 + π 2 b 2 2 , D = E h 3 12 1 ν 2
The equivalent mass is the effective mass under the first-order mode of the structure:
m e q 0.236 ρ h a b
where E is Young’s modulus, h is the shell thickness, ab is the panel size, ν is Poisson’s ratio, and D is the bending stiffness; all parameters can be determined through shell design parameters.
(3) Improved response function
Combining (7), (9), and the initial response function (6), we obtain the improved response function for a unit pulse as follows:
h t = 1 m e q ω d e ζ ω n t sin ω d t H t , ω d = ω n 1 ζ 2
In summary, by modeling the propagation process of gas explosions and their impact response on flameproof enclosures, the spatial distribution of explosion excitation and the response characteristics of the enclosures were clarified, providing a theoretical basis for subsequent laser Doppler measurement layout, impact simulation experiment design, and physical interpretation of vibration response data. Based on this propagation and response model, this paper further constructs a measurement and analysis system to carry out the dynamic analysis of the vibration behavior of the enclosures and the identification of impact loads.

4. Principle of Explosion Shock Vibration Measurement Using Flameproof Enclosures with Laser Doppler

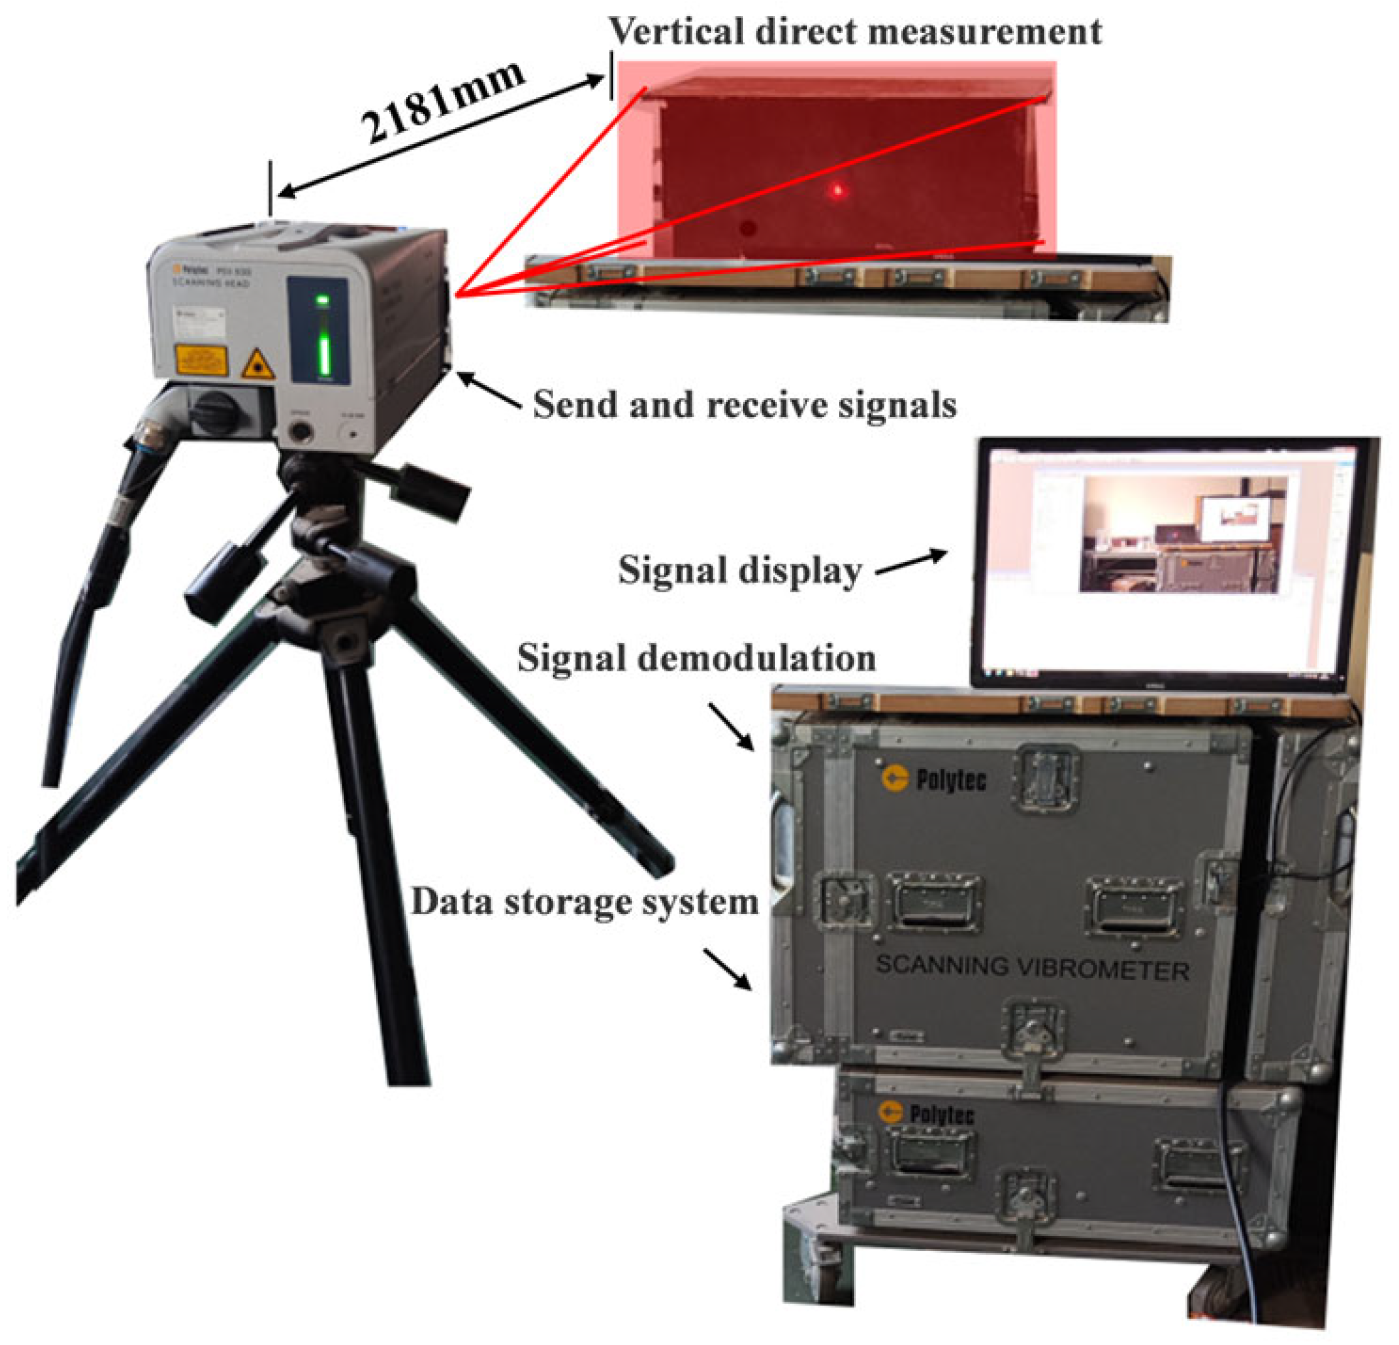
Laser Doppler measurement flameproof enclosures technology is based on the laser Doppler frequency shift effect [19], using a single-frequency coherent light beam emitted by a laser, which is separated into a reference beam and a measurement beam by a beam splitter. The measurement beam is irradiated onto the surface of the flameproof enclosure, and the reflected light carries the instantaneous velocity information of the target surface.
The principle is shown in Figure 3 below.
The following measurement methods are specified for flameproof enclosures:
(1)
Direct measurement method
The amount of laser frequency shift reflected back is directly proportional to the object’s velocity v . By demodulating the frequency shift signal based on the laser Doppler effect, the target’s vibration velocity can be determined. The detected Doppler frequency shift f d has the following relationship with the measured object’s velocity v :
f d = v λ cos θ 1 + cos θ 2
where λ is the wavelength, θ 1 and θ 2 are the angles between the incident light direction, the scattered light direction, and the object’s motion direction, respectively.
In order to simplify the expression of Doppler frequency shift and improve measurement accuracy, this paper adopts a direct measurement method, where the incident direction of the laser beam is parallel to the vibration direction of the target, and the incident angle and reflection angle are both zero ( θ 1 = θ 2 = 0°). The expression for calculating the object’s velocity using Doppler frequency shift is
f d = 2 v λ
where f d is the Doppler shift; v is the object’s velocity; and λ is the wavelength of light.
By calculating the time-varying frequency difference f d between the transmitted wave and the reflected wave from a single acquisition, the vibration velocity curve of a single point on the shell surface can be obtained.
(2)
Measurement point layout
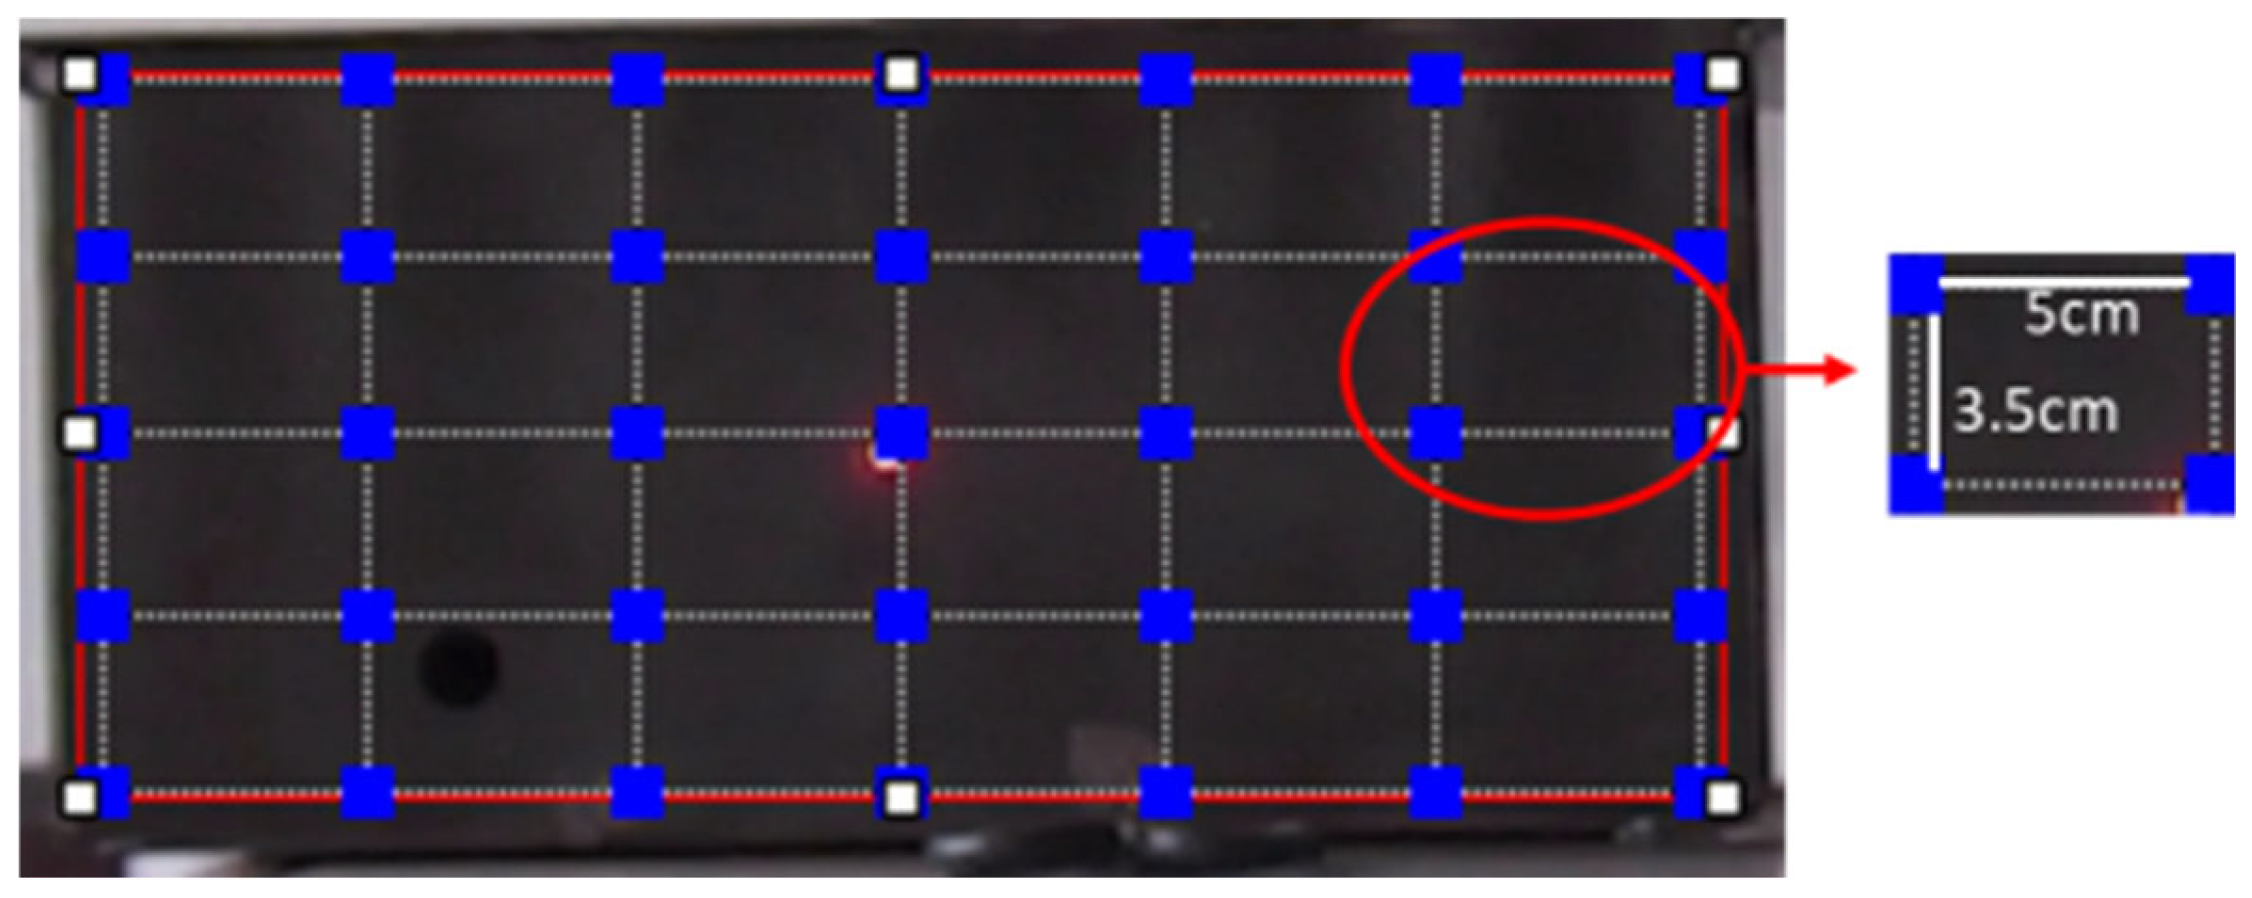
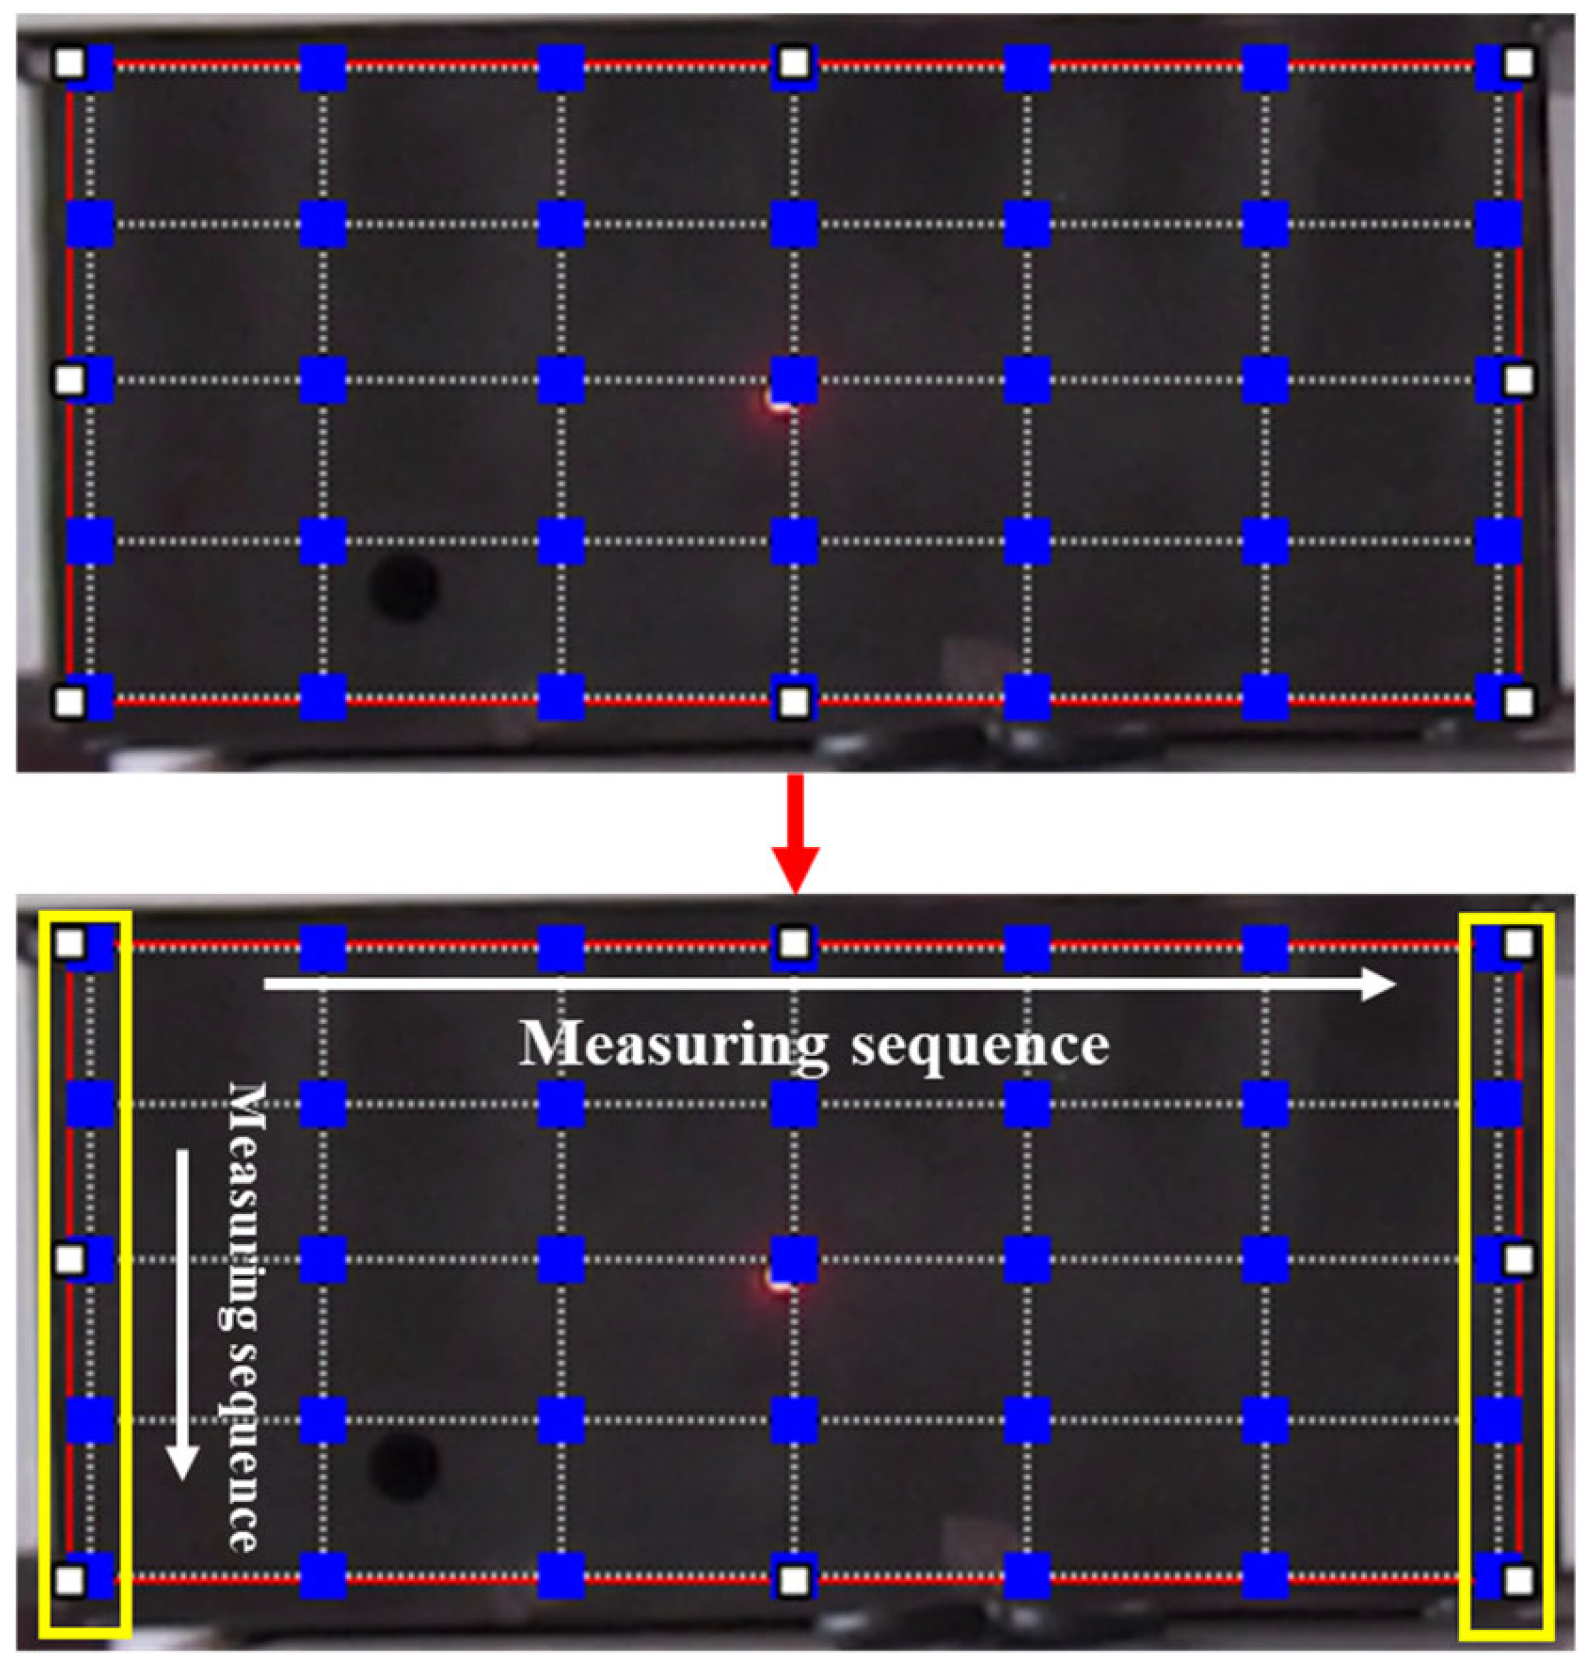
To comprehensively measure the vibration characteristics of the shell structure, a two-dimensional rectangular array grid is arranged on the surface of the test area, as shown in Figure 4. There are a total of 35 measurement points arranged in seven columns and five rows, with a spacing of 5 cm in the horizontal direction and 3.5 cm in the vertical direction to ensure that the spatial sampling meets the structural modal resolution requirements.
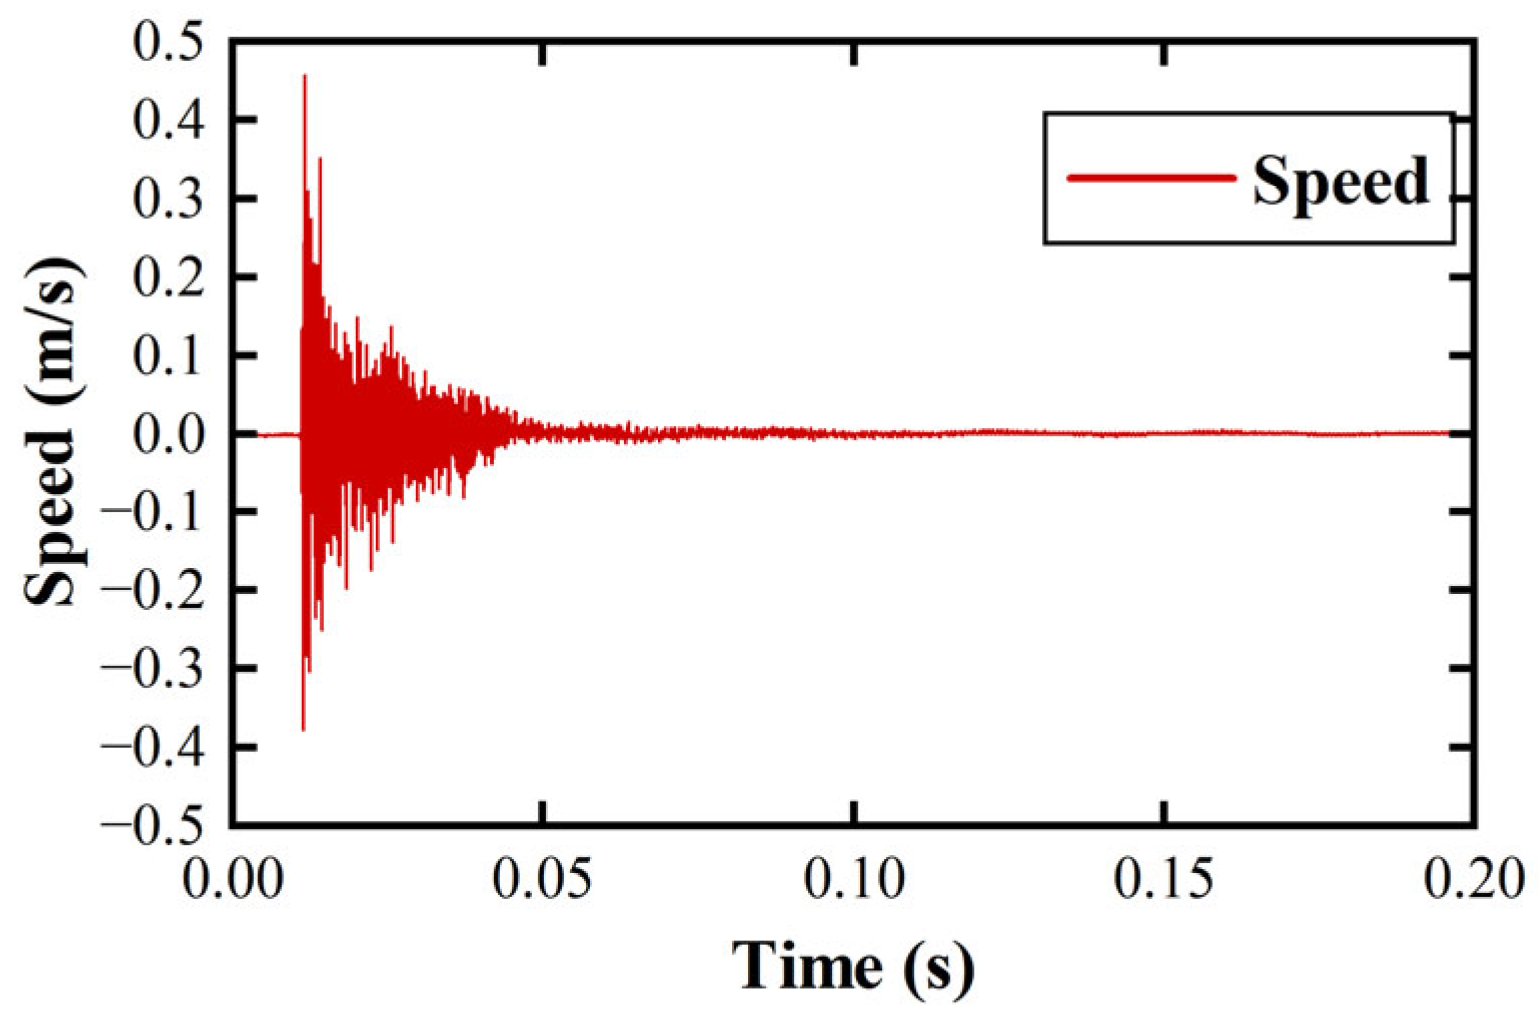
Repeat experiments were conducted at each measurement point to ensure that the excitation remained consistent during each collection. The laser beam was vertically incident on the center of the measurement point during each collection to achieve “direct measurement,” thereby maximizing the signal-to-noise ratio and simplifying Doppler shift calculations. This arrangement is suitable for subsequent parameter extraction and structural response visualization processing, providing high-resolution data support for the study of shell dynamic behavior. The single-point data collected is shown in Figure 5.

5. Method for Analyzing Vibration Characteristics of Flameproof Enclosures

Vibration signals from flameproof enclosures have obvious transient characteristics, non-stationarity, and complex time-varying characteristics, such as multi-frequency component superposition. A comprehensive analysis of their time–frequency characteristics is required. Therefore, a time–frequency analysis method of vibration characteristics of coal mine explosion-proof shell is proposed. The method progresses from the single-frequency dimension analysis using Fourier transform (FFT) to two-dimensional time–frequency joint analysis with the short-time Fourier transform (STFT), and finally to three-dimensional scale–time–frequency linkage through the wavelet transform (DWT).
The specific method is shown in Figure 6. The FFT is used to obtain the frequency distribution of the explosion vibration signal, but this method lacks time-varying frequency information. Therefore, the window function introduced by the STFT is used to obtain the signal frequency distribution in each time window, but its fixed window width cannot take into account both time and frequency resolution. Therefore, DWT is further applied to perform multi-level filtering and down-sampling of the signal, analyzing the signal in layers based on different frequency bands. The scalability of the wavelet basis functions within the time window achieves high frequency resolution in the high-frequency band and high time resolution in the low-frequency band, optimizing the resolution balance issue of STFT. The analytical methods not only gradually expand in processing dimensions but also progressively enhance their ability to reveal features. Finally, a displacement field is constructed based on the single-sided measurement point data of the flameproof enclosures, achieving a comprehensive understanding of the vibration distribution of the flameproof enclosures, from point to surface and from local features to the whole.

5.1. Time–Frequency Analysis Method for Vibration Characteristics of Flameproof Enclosures

(1)
Fourier transform method for analyzing vibration characteristics
The FFT method maps the time-domain signal of flameproof enclosures to the frequency domain, reflecting the global distribution of each frequency component through the spectrum [20]. The conversion formula for the FFT transformation is as follows:
X k = n = 0 N 1 x n · e j 2 π k / n
where x n is the nth sample value of the input signal, N is the total number of samples, and e j 2 π k / n is the Fourier basis function.
FFT can only obtain the frequency components contained in the vibration signals of flameproof enclosures. The spectrum obtained is global, and it is impossible to obtain the dynamic changes in the frequencies and corresponding vibration energy of the explosion vibration signals at different times.
(2)
Vibration characteristic analysis method of short-time Fourier transform
The STFT method extends the analysis dimension of FFT, which can only be observed in the frequency domain, to a combined time–frequency representation [21]. It uses a window function to perform a Fourier transform on each small segment of the time domain to analyze the frequency transient changes and time-varying characteristics of explosive vibration non-stationary signals. The formula is as follows:
X m , ω = n = 0 N 1 x n · w n m e j 2 π k / n
where x n is the original time-domain discrete vibration signal, w n m is the window function, and n is the sampling point time index.
The width of the STFT window function results in a trade-off between time and frequency resolution, as it is not possible to achieve both simultaneously. A narrow window provides higher time accuracy but limits the ability to judge signal periodicity, resulting in lower frequency resolution. A wide window has the opposite effect. Therefore, STFT cannot achieve high-precision time–frequency analysis across the entire frequency band.
(3)
Vibration characteristic analysis method of wavelet transform
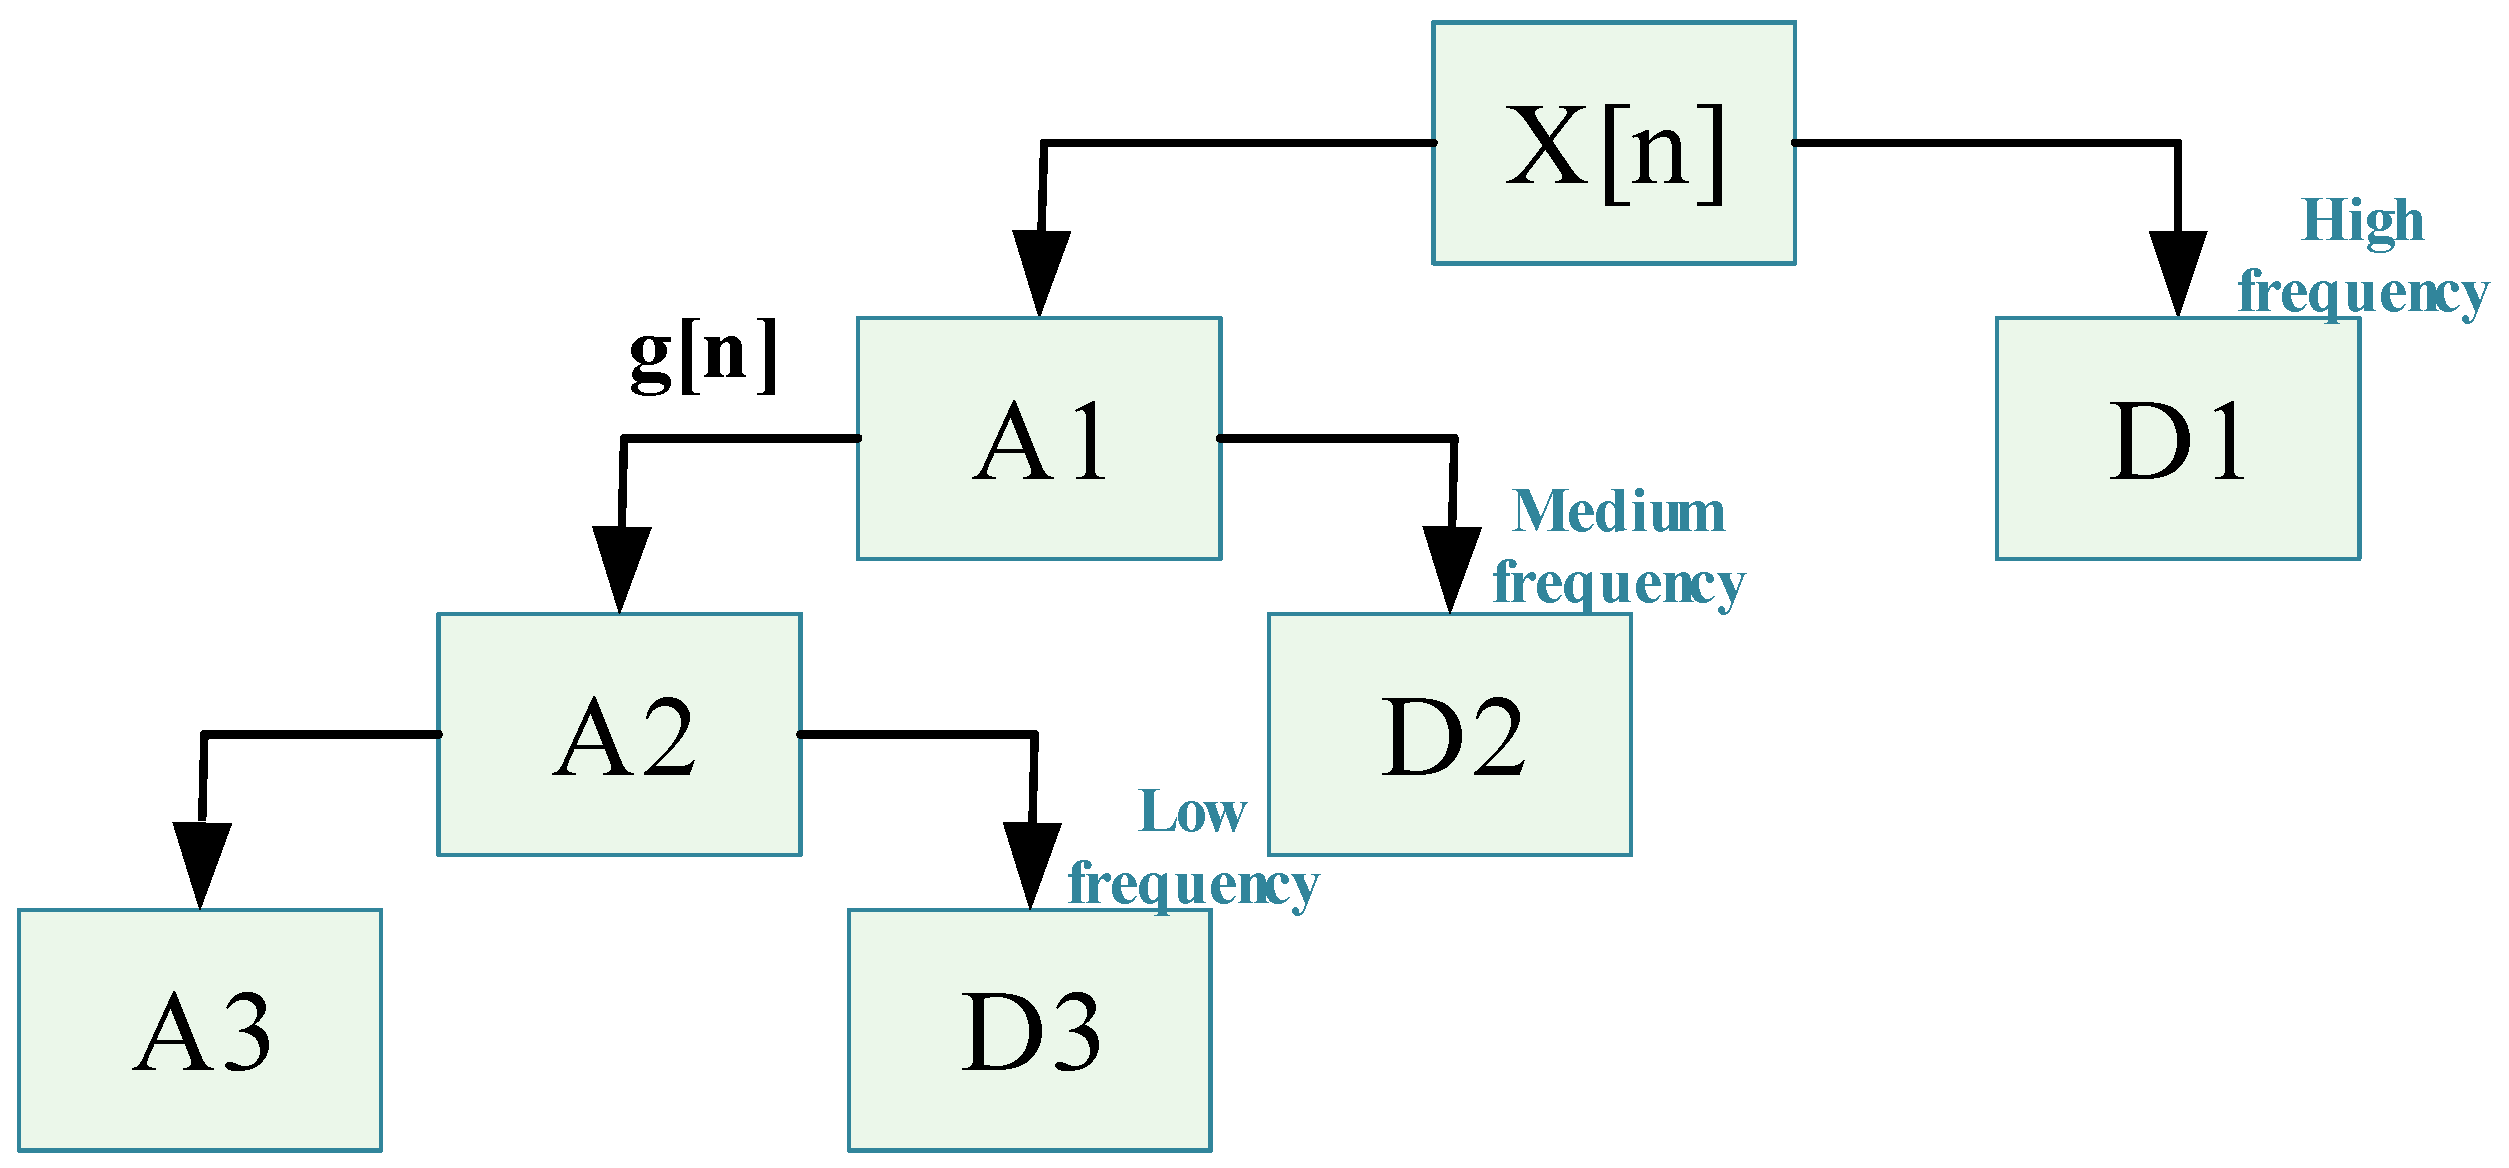
The wavelet transform (CWT) replaces the window function in STFT with a wavelet function, which can be scaled arbitrarily to solve the STFT resolution trade-off problem [22]. Vibration signals are discrete data, and discrete wavelet transform (DWT) is used to decompose the signal into different frequency bands through multiscale filtering, thereby achieving multiscale analysis of the vibration characteristics of flameproof enclosures. The wavelet function, decomposition formula, and principle are as follows:
ψ j , k t = 2 j / 2 ψ 2 j t k
a k = n = 0 n = k 1 x n · h 2 k n         d k = n = 0 k 1 x n · g 2 k n
where j is the scale parameter, k is the translation parameter, x n is the shell vibration signal, d k is the high-frequency filtered signal, and a k is the low-frequency filtered signal.
Figure 7 shows that each layer of the vibration signal x n extracts detailed information d k through a high-pass filter g n , extracts approximate information a k through a low-pass filter h n , and recursively decomposes the approximate part to ultimately obtain a multi-scale representation of different frequency bands. The signals in each frequency band have good time localization capabilities, which optimizes the resolution trade-off problem of STFT under fixed window function constraints.

5.2. Displacement Field Construction

The above method for analyzing the vibration characteristics of flameproof enclosures targets individual measurement points and analyzes the time–frequency characteristics of the vibration signals of flameproof enclosures. It further constructs the enclosure displacement field based on the time-series measurement point data to visualize the vibration response in the spatial dimension, thereby progressing from a description of local point characteristics to a description of the overall deformation mode.
The velocity signals measured at single points on the flameproof enclosures are integrated and converted into displacement signals, which are then aligned on a time axis to construct multi-point synchronous time series data, thereby forming a high-resolution displacement field of the single-sided structure. This displacement field can show the overall dynamic deformation profile of the flameproof enclosures under explosion excitation, thereby realizing the visualization of the vibration displacement field.

6. Impact Load Inversion Model

Laser Doppler replaces pressure sensors. Since the pressure distribution of how gas explosion shock waves act on flameproof enclosures is unknown, a model of the relationship between the vibration response of the enclosure surface and the internal wall impact pressure can be constructed to reconstruct the gas explosion impact pressure. Generally, the contour of any shock time history can be approximated as a Gaussian-like function [23], while methane explosion shock loads are closer to a non-symmetric Gaussian model, with the mathematical formula as follows:
f t = α · exp t t 0 σ 2 · 1 + β · t t 0 σ
where α is the intensity factor of the impact force, t 0 is the start time, σ is the standard deviation, which controls the width of the force, β is the parameter controlling asymmetry.
The acceleration response a t of flameproof enclosures under impact loads can be expressed as a linear combination of a set of modes, as shown in the following formula:
a t = j = 1 p   ϕ j c · a j · h ¨ j t
where ϕ j c is the displacement shape of the j th mode, a j is the modal coefficient, and h ¨ j t is the acceleration response of the jth mode.
We can fit the acceleration response using experimental acceleration data am and obtain j and other modal parameters. The difference between the acceleration response a1 of the impact load model fitted by the least squares method and the experimentally measured acceleration response a2 is expressed by the objective function:
J α , β , t 0 , σ = i = 1 n   a ^ t i ; α , β , t 0 , σ a m t i 2
where a ^ t i ; α , β , t 0 , σ is the acceleration response predicted by fitting the impact force history, and a m t i is the actual measured acceleration data. By minimizing the objective function, we can obtain the optimal parameters α , β , t 0 ,   a n d   σ .
Once the least squares fitting is completed, and the optimal parameter is obtained, we can calculate the peak load fmax based on the fitted impact force model, thereby reconstructing the impact load history f t .

7. Analysis

7.1. Experimental Design for Vibration Measurement of Flameproof Enclosures

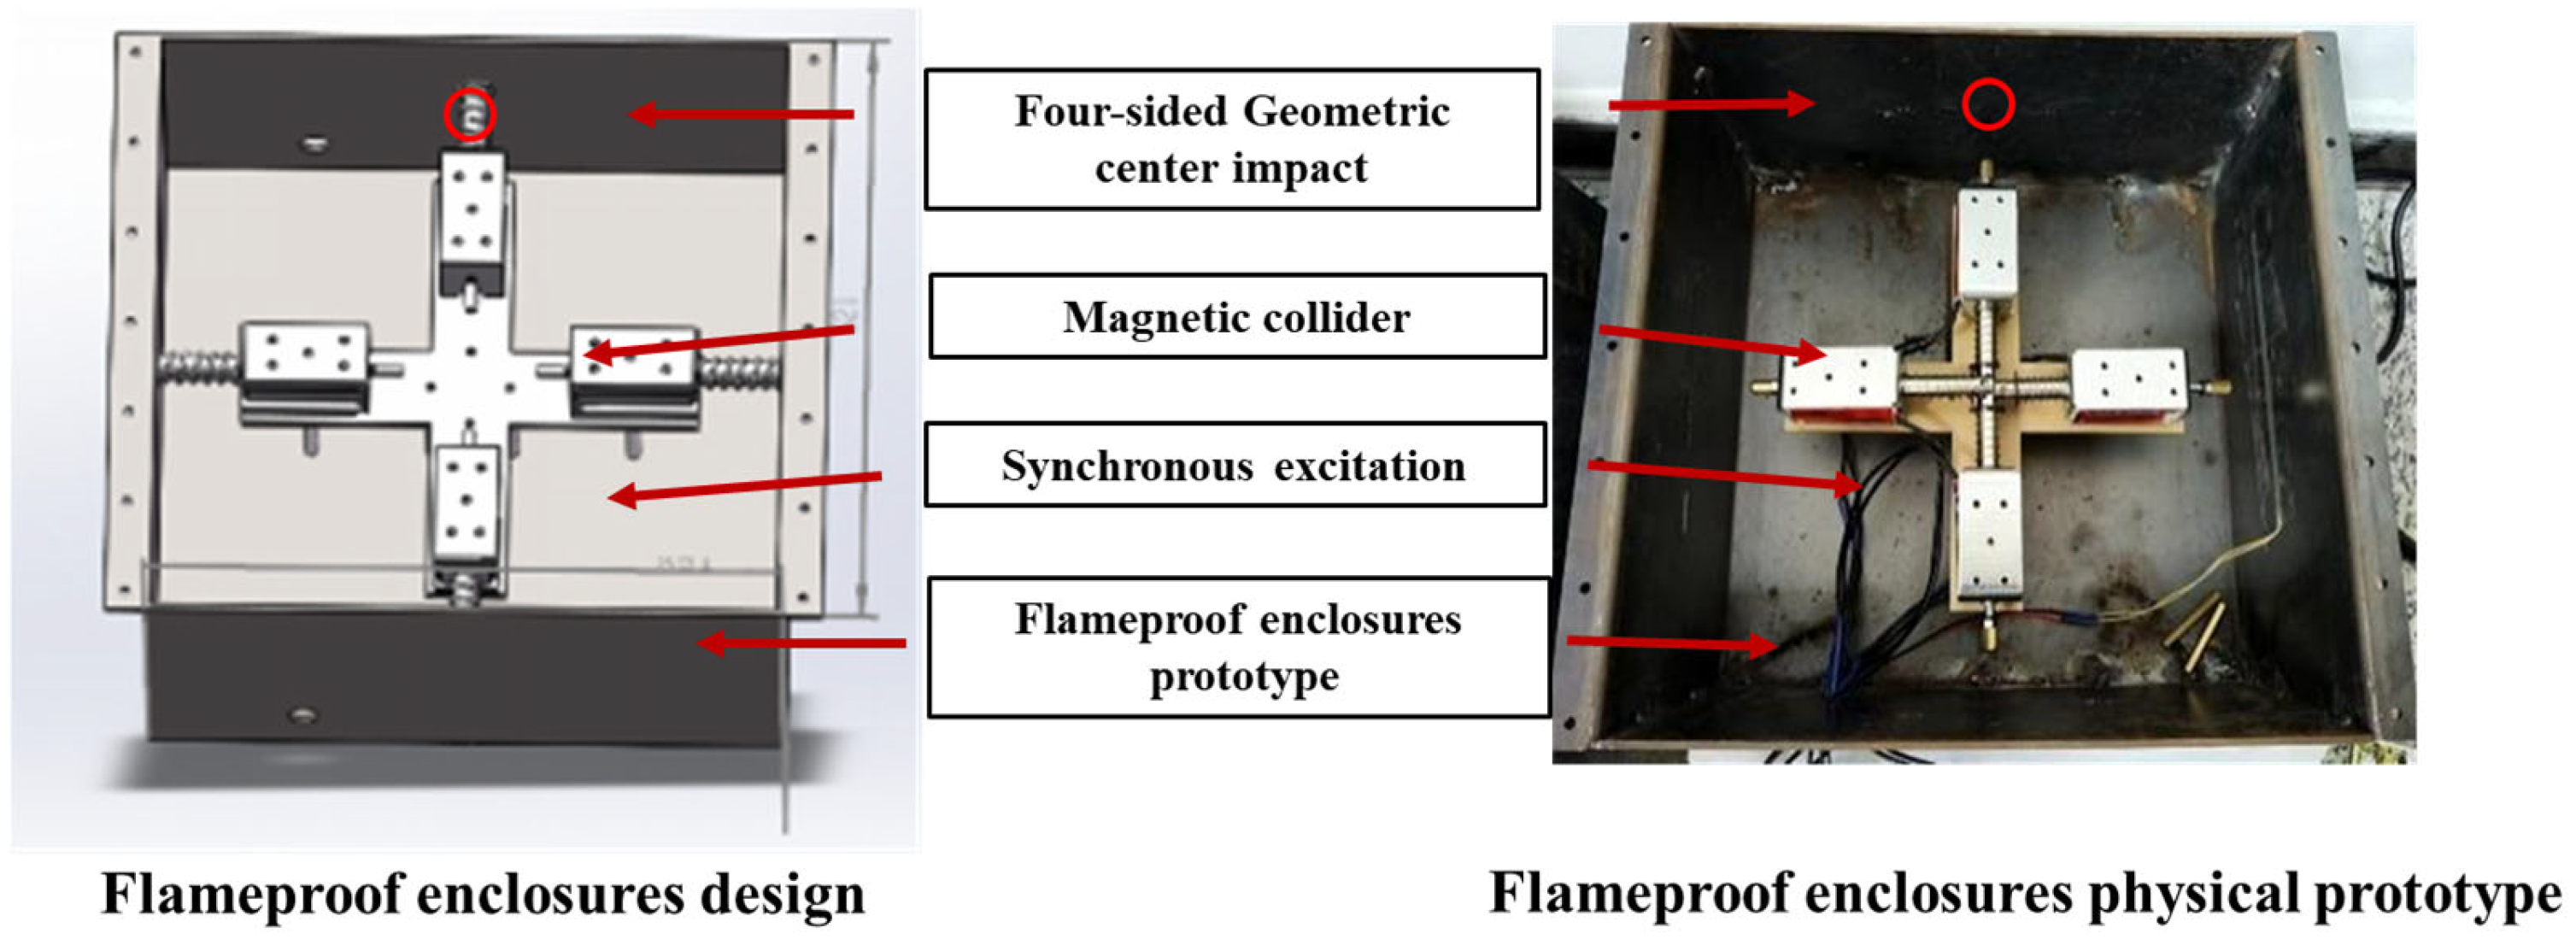
Based on the aforementioned explosion model and propagation mechanism, it is evident that the shock wave expands spherically in all directions during an explosion. Therefore, theoretically, the four central points are the first points to be subjected to force, and the initial impact is the most significant factor influencing the shell’s response. Thus, the impact model is simplified to a central impact at the four corners of the shell. Therefore, this paper simulates the process of an explosion-proof enclosure being subjected to shock waves using mechanical impact simulation. This configuration employs a magnetic impactor to form a two-dimensional impact array, simulating the scenario of multi-point synchronous impact in a real explosion, and possesses good scalability and reproducibility.
The laboratory simulation test used a flameproof enclosure model with dimensions of 321 mm × 321 mm × 160 mm and a thickness of 3 mm. The impact force of a single magnetic impactor was fixed at 60 N, which was calculated to generate a pressure of approximately 0.36 MPa, consistent with the pressure generated by a gas explosion in the explosion test described in the literature [24]. The complete test device is shown in Figure 8:
The experimental platform for collecting surface vibrations at the moment of explosion in coal mine flameproof enclosures was constructed as shown in Figure 9. The laser detection point of the laser vibration meter was placed on the front of the flameproof enclosure, and the measurement parameters are shown in Table 1. The sampling frequency was set to 25,600 Hz. Due to the characteristics of the helium–neon laser as the light source, its measurement distance has a periodic effect on the signal-to-noise ratio. Specifically, the optimal measurement distance is S = 141 mm + n × 204 mm. A measurement distance of 2181 mm was taken to ensure that the laser head camera fully covered the flameproof enclosure for the arrangement of measurement points. Perform 2D alignment on one side of the flameproof enclosure to ensure the accuracy of the measurement point layout. According to the method described in 3.1 above, use the rectangular single side of the enclosure as the measurement area, set up a 7 × 5 rectangular grid layout for the measurement points, and arrange the measurement point spacing as shown in Figure 10. During measurement, ensure that the lens is aligned with the shell surface, and the measurement distance remains constant. Measure the 35 measurement points sequentially from top to bottom and from left to right. The excitation device is synchronously triggered at each point to achieve real-time measurement of the vibration response.

7.2. Vibration Characteristics Analysis of Flameproof Enclosures

7.2.1. Time–Frequency Domain Analysis of Flameproof Enclosures Under Vibration

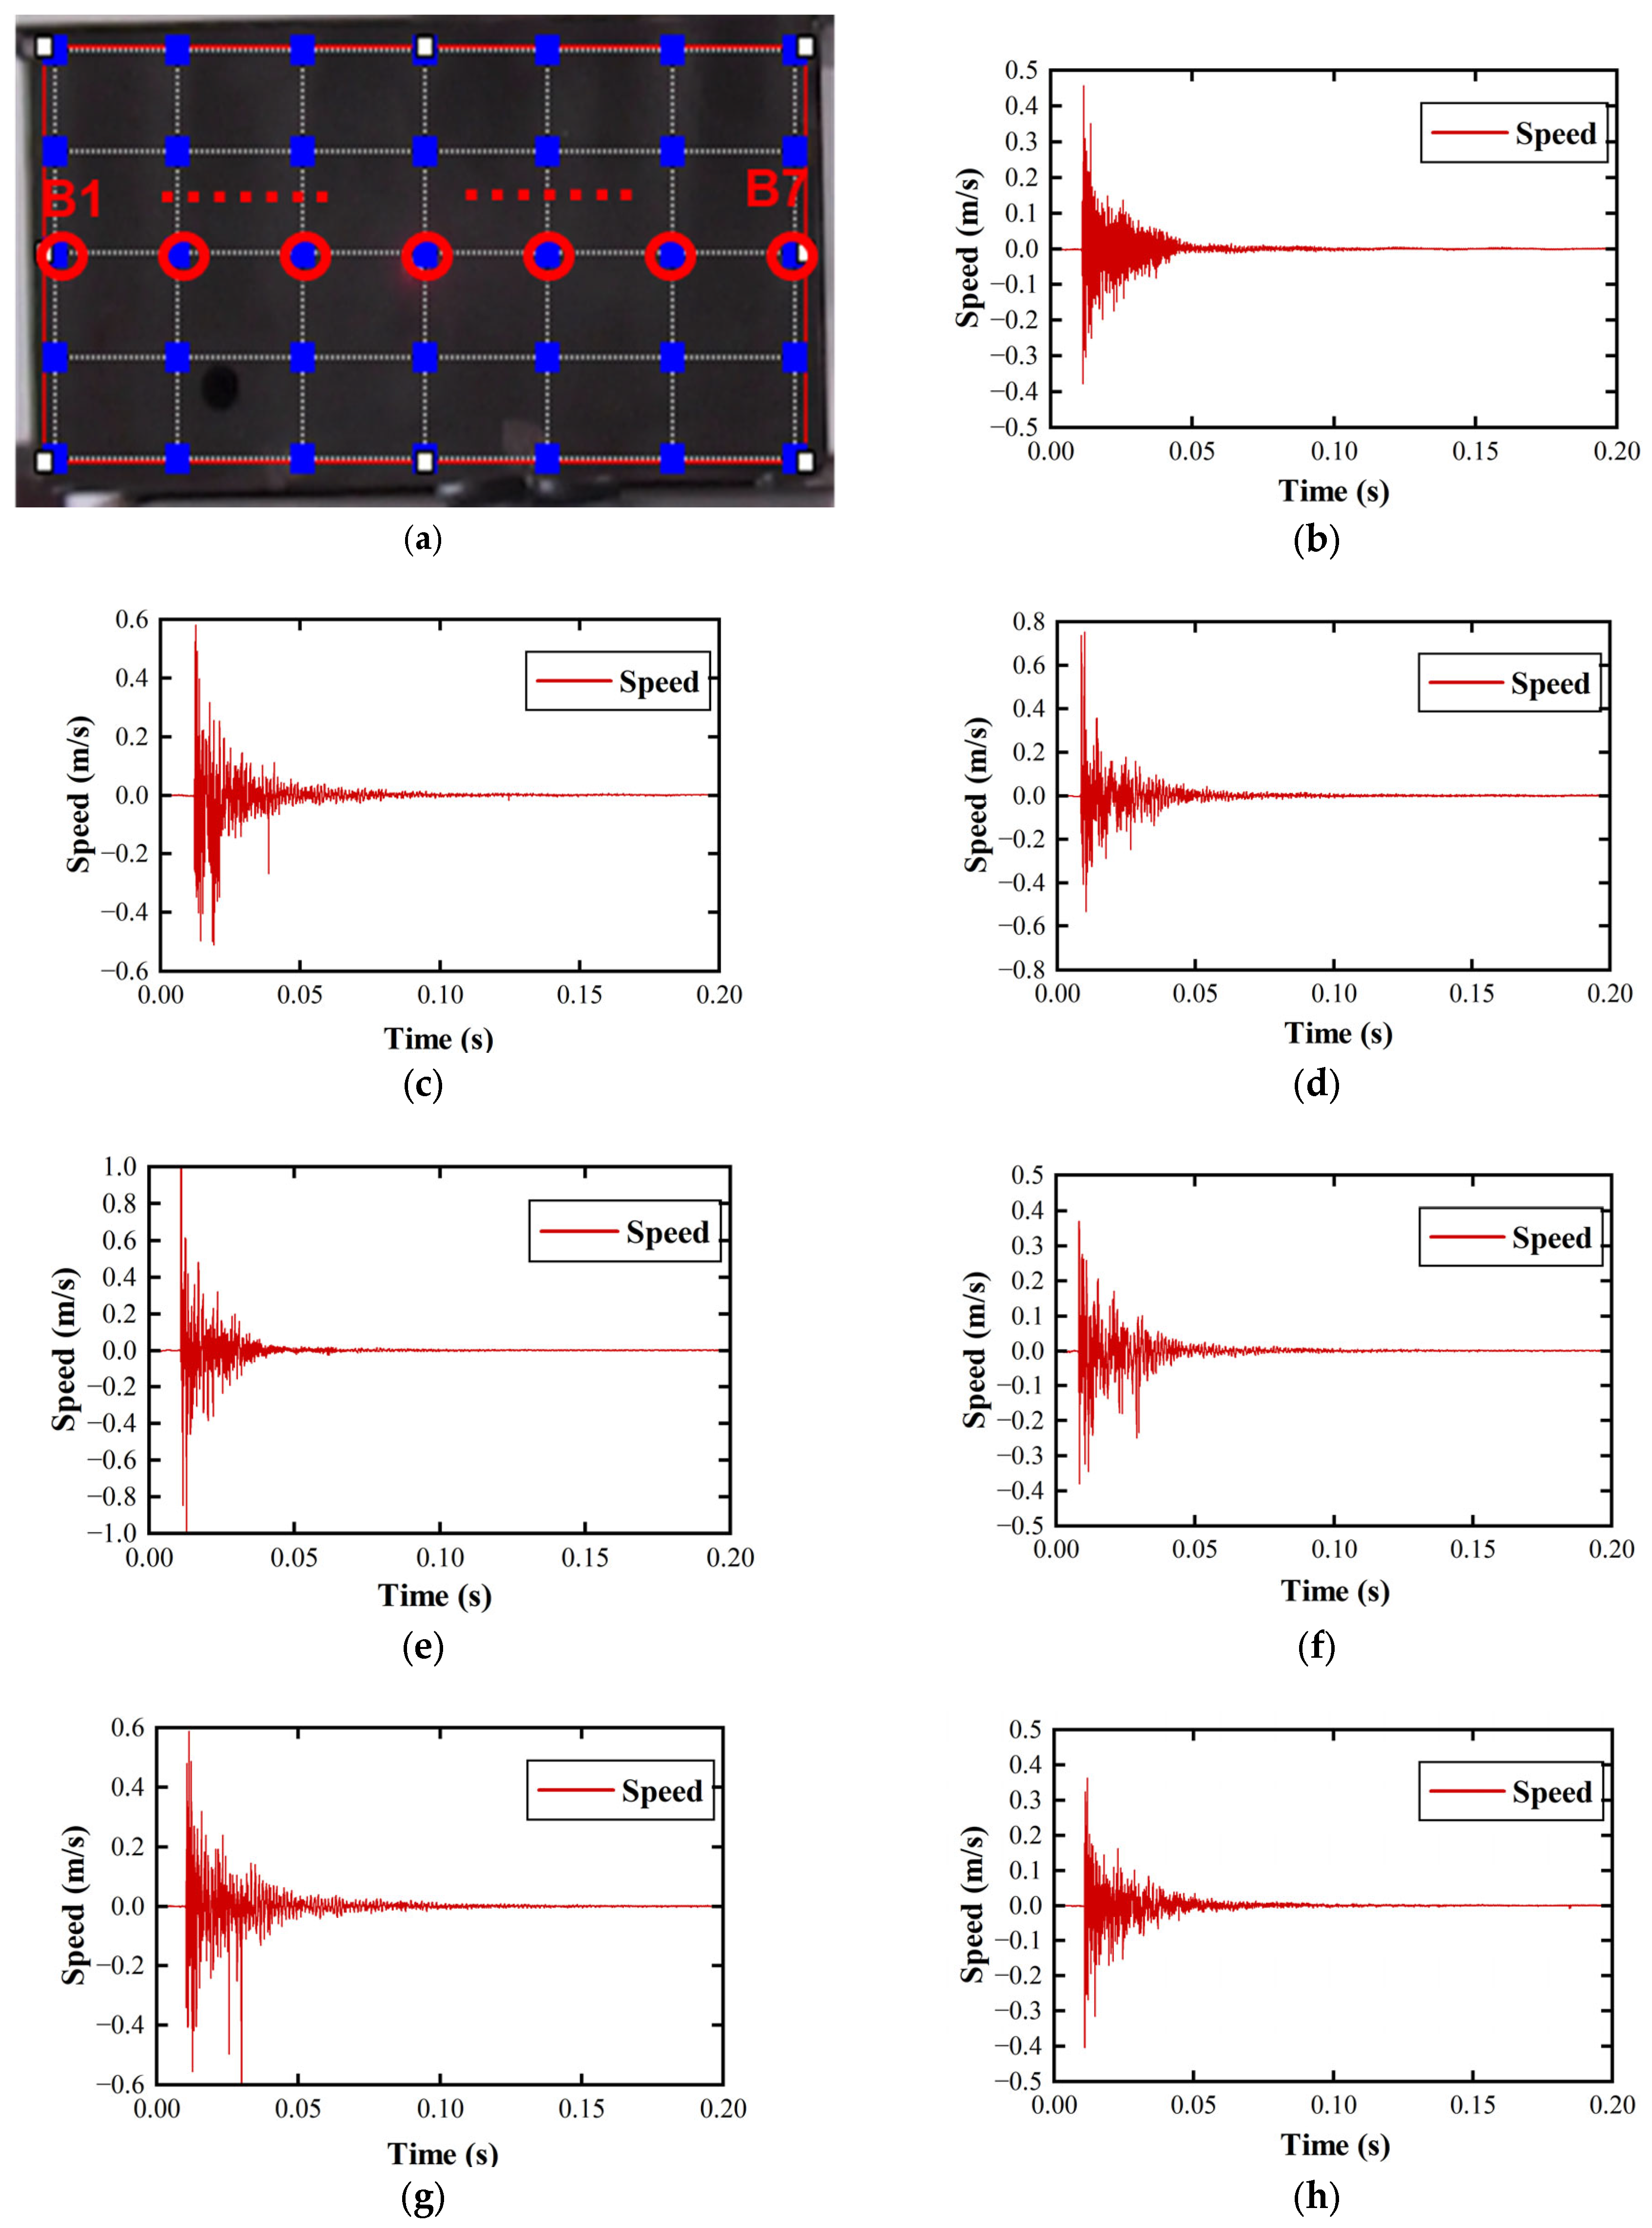
Laser Doppler was used to collect the vibration velocity signals of the outer surface of the explosion-proof enclosure at the moment of impact. Through equivalent repeated experiments, the above three calibrated measurement points were collected in sequence. The results are shown in the middle row, as shown in Figure 11. The row data vibration time-domain diagrams correspond to the measurement points (B1–B7) in order from left to right.
Based on the maximum vibration amplitude and vibration waveform diagram of the middle row, it can be observed that the curve exhibits a relatively large initial vibration amplitude, which gradually decreases over time. This is due to the free vibration generated by the explosion-proof housing after being subjected to an instantaneous impact load gradually decaying, with the vibration amplitude stabilizing around 0.1 s. Additionally, under conditions where the impact value remains constant, as the distance from the impact source increases, the maximum vibration velocity and vibration amplitude exhibit a gradual decreasing trend. That is, the maximum vibration velocity and vibration amplitude are inversely proportional to distance, and the intensity of the shock wave gradually decays as the propagation distance increases.
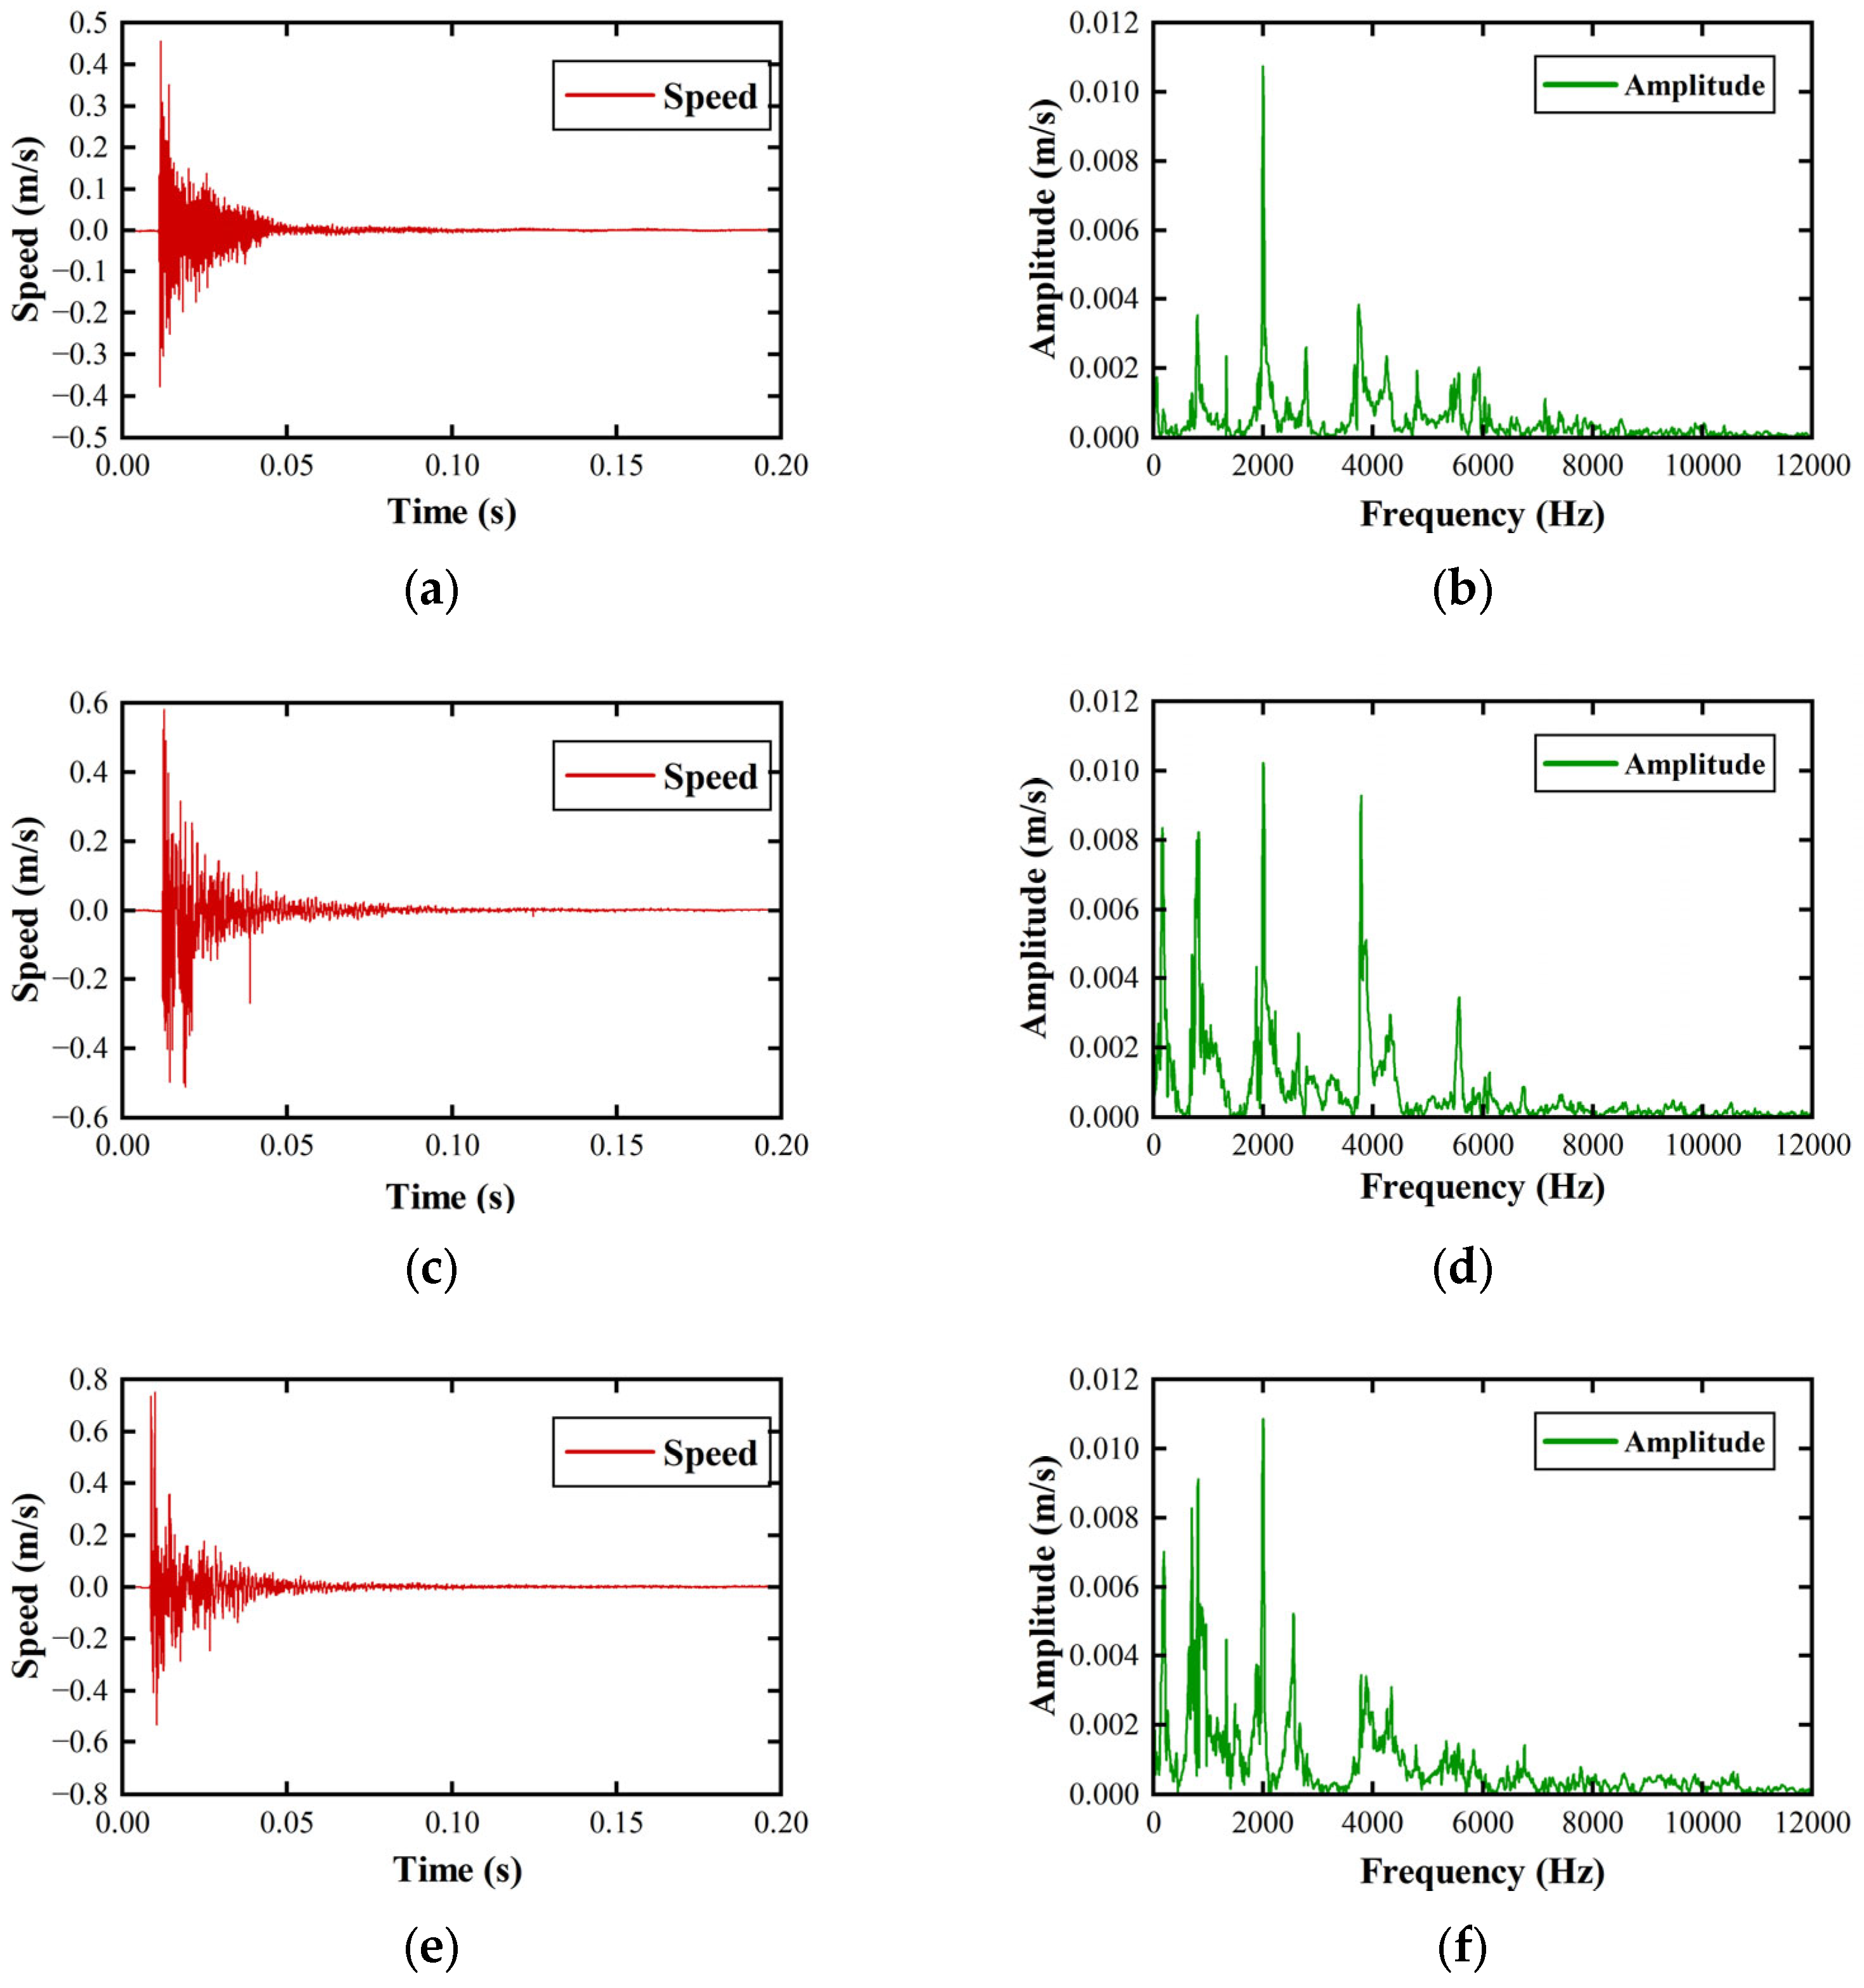
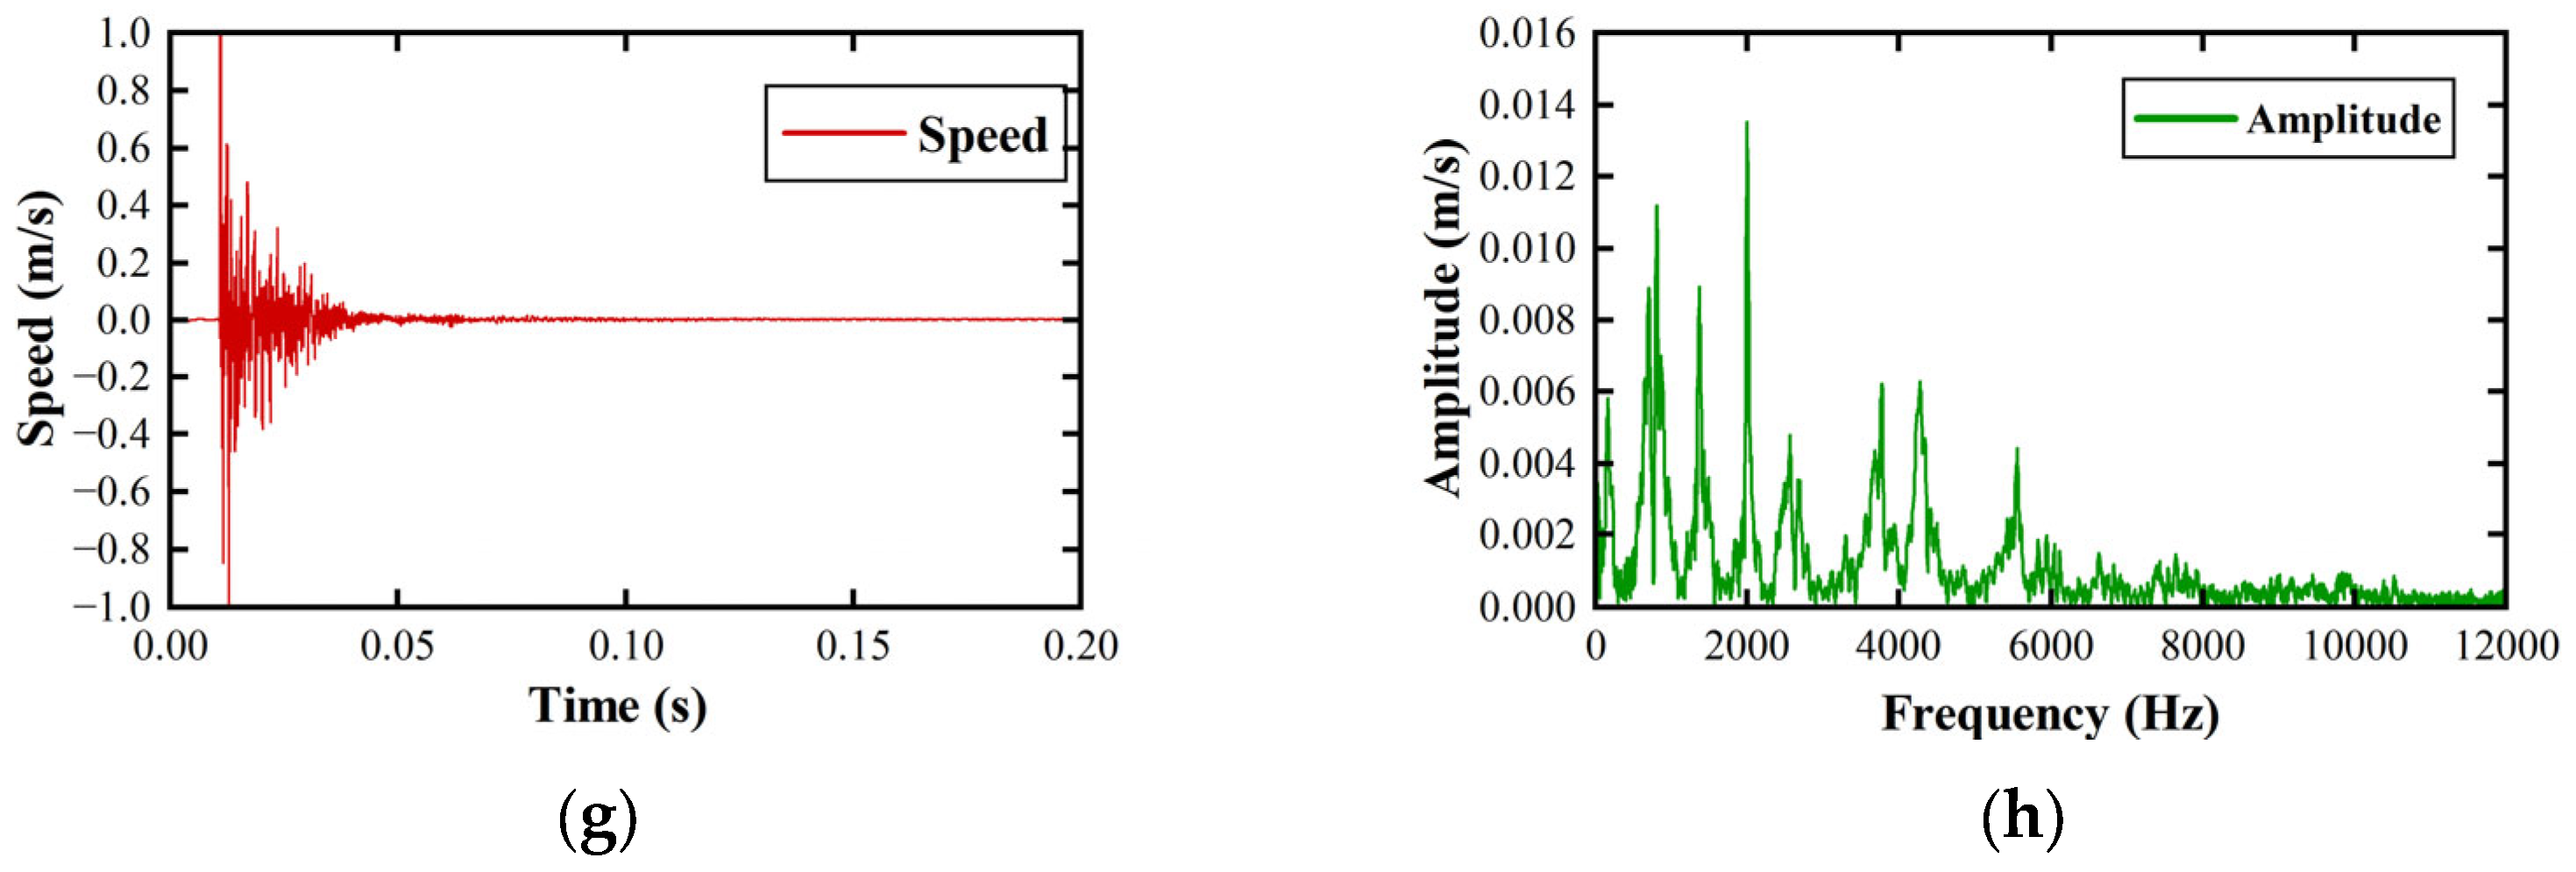
The four points B1–B4 mentioned above have a larger data span and are more representative, so they were selected as the vibration analysis objects. Initially, Fourier transform (FFT) was used to convert the time-domain signal to the frequency domain. The results are shown in Figure 12, where the right column shows the frequency-domain distribution obtained by FFT for measurement points B1–B4.
B1, being the farthest edge point from the impact location, shows a time-domain plot where the vibration amplitude first increases and then decreases. The peak value of 0.46 m/s is reached at 0.001 s, with the frequency-domain peak corresponding to a frequency of 2000 Hz. This indicates that the corresponding time at this frequency is 0.001 s, and it is the dominant frequency. B2 has a time-domain peak of 0.6 m/s, slightly higher than B1, and its corresponding frequency-domain dominant frequency is also 2000 Hz. B3 has a time-domain peak of 0.78 m/s, slightly higher than B2, and its corresponding dominant frequency is also 2000 Hz. B4, being the closest point to the impact center, has a time-domain amplitude of 1 m/s, which is the highest peak value among the four measurement points, corresponding to the main frequency of 2000 Hz. It can be seen that the main peak values at different positions increase as the distance from the impact center decreases, indicating that the explosive energy is primarily concentrated in the central region of the shell, with higher energy levels closer to the impact center. In addition, the frequency distribution of each measurement point is relatively broad, mainly distributed between 500 Hz and 8000 Hz. Except for the main frequency at 2000 Hz, each measurement point also shows relatively obvious sub-frequencies at 800 Hz, 1300 Hz, 4000 Hz, and 6000 Hz, indicating that the overall vibration distribution at each position on the single side of the shell is relatively consistent.
Based on the above FFT analysis, STFT analysis was performed, and the results are shown in Figure 13. The left figure shows the two-dimensional time–frequency results of measurement points B1 to B4 after STFT. In addition to obtaining the frequency distribution of the FFT results, the changes in each frequency and corresponding amplitude over time can be clearly seen. The right figure shows the three-dimensional time–frequency distribution of each measurement point after STFT, which more clearly displays the amplitudes corresponding to different frequencies.
The two-dimensional time–frequency plot of B1 is most prominent at 2000 Hz, consistent with the 2000 Hz dominant frequency obtained from the FFT. It reaches a peak of 0.051 m/s within the range of 0.014 s to 0.016 s. Subsequently, the amplitude of this dominant frequency gradually decays to zero, corresponding to the decay of the shell impact and the disappearance of vibration, with a duration of approximately 0.05 s. The corresponding three-dimensional plot clearly shows a trend of first increasing and then decreasing. The dominant frequency obtained for B2 is also consistent with the FFT results, reaching a peak of 0.055 m/s within the range of 0.014 s to 0.016 s, with a motion pattern consistent with B1; B3 reaches its peak of 0.071 m/s between 0.014 s and 0.016 s; B4, being the closest point to the impact, also reaches its peak between 0.014 s and 0.016 s, at 0.086 m/s. It can be clearly seen that the dominant frequencies at each measurement point are generally consistent with the FFT results, and the corresponding energy changes over time also follow a trend of first increasing and then decreasing. This temporal variation is an advantage that the FFT does not possess. Additionally, the four measurement points can clearly distinguish the sub-frequencies at 800 Hz, 1300 Hz, 4000 Hz, and 6000 Hz, and the energy corresponding to these frequencies also follows a trend of first increasing and then decreasing.
STFT adds a time scale to FFT, allowing for a clear view of the dynamic changes in different frequencies and corresponding energies over time, resulting in a qualitative improvement in the dynamic analysis and multi-dimensional analysis of vibration characteristics.
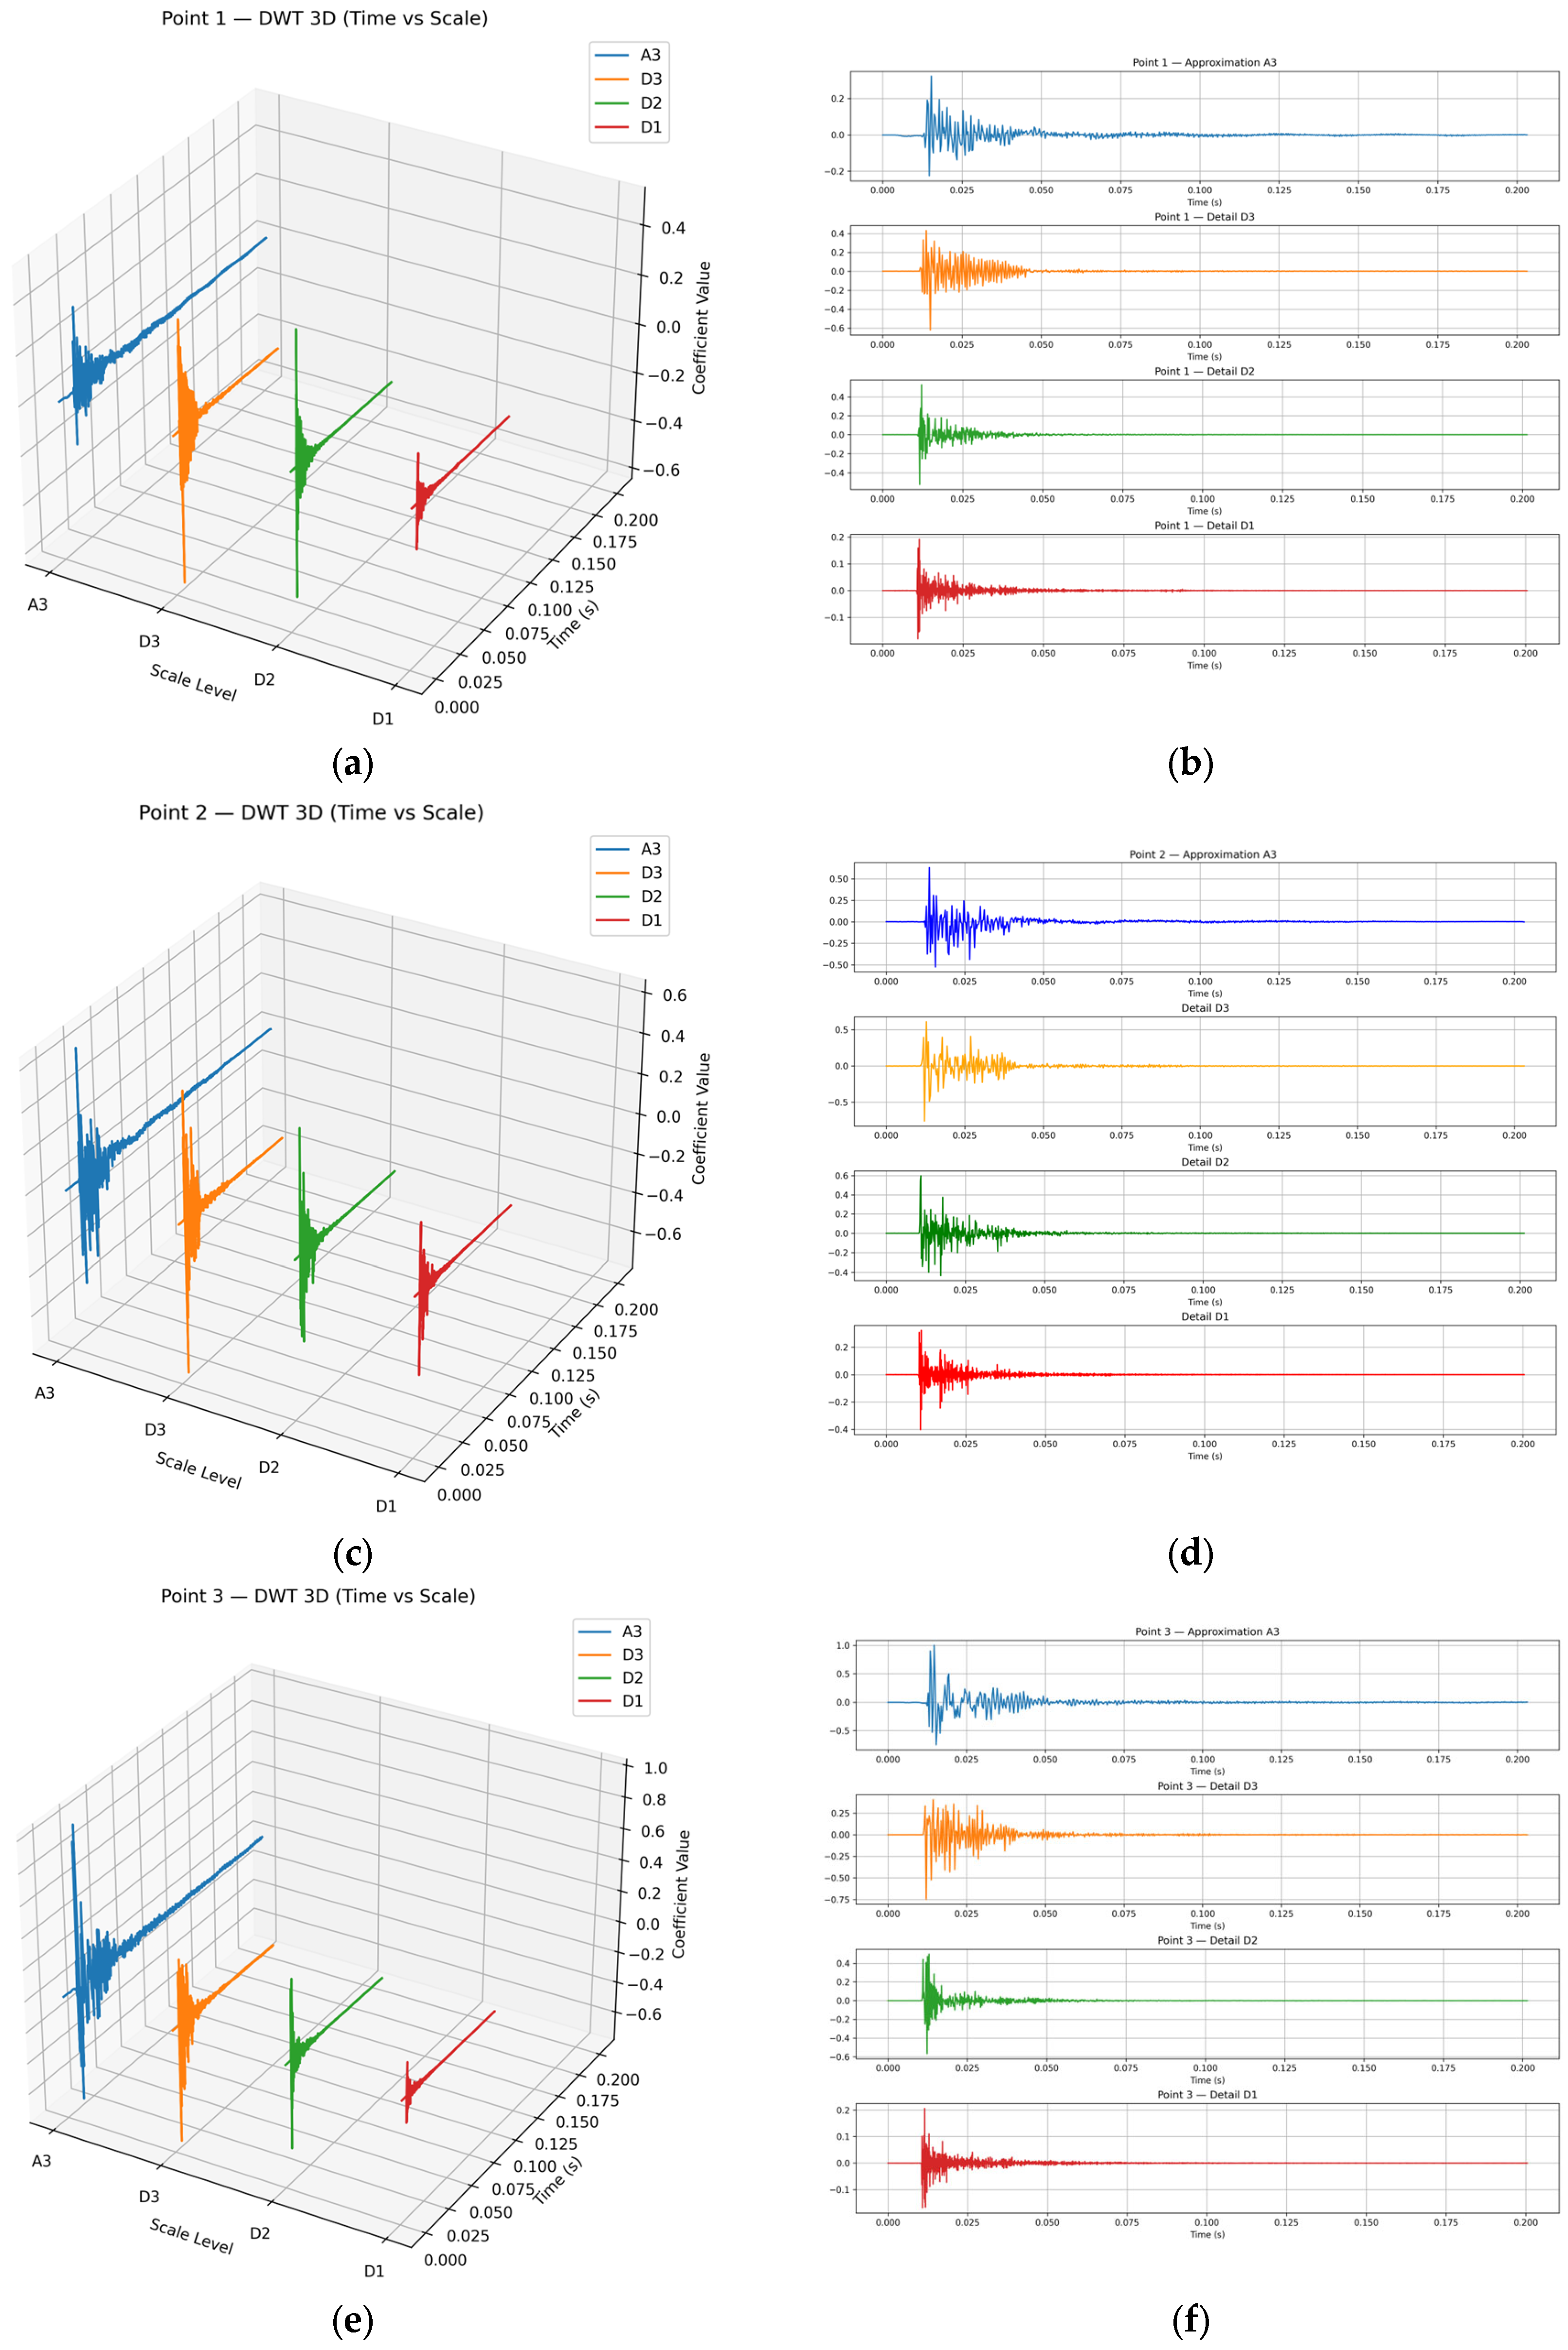
Further analysis of the four points of the flameproof enclosure using wavelet transform, three-layer wavelet decomposition of the flameproof enclosure vibration signal, and frequency information for each layer is shown in Table 2. The wavelet transform results are shown in Figure 14. The left figure displays the wavelet transform results for B1 to B4 in sequence, while the right figure shows the specific information for each scale of the corresponding wavelet transform. Each measurement point can precisely divide the scale of each layer according to the desired frequency range, enabling the precise observation of the decomposed signals at each scale.
The aforementioned B1 point in the frequency range includes a main frequency of 2000 Hz. It can be clearly seen that the signal reaches its peak at 0.015 s, while the peak position obtained from the STFT is located within a short time interval, with its accuracy influenced by the window width. It is evident that the time localization accuracy of the wavelet transform is significantly higher than that of the STFT. The peaks of B1 to B4 in this frequency band are 0.41, 0.58, 0.53, and 1.12, respectively, and the amplitude changes over time can be precisely determined at specific time points. The wavelet transform demonstrates superior time resolution. Additionally, although each layer of the wavelet transform represents the results of a specific frequency range, each scale exhibits a clearer overall trend. For example, at the high-frequency scale of measurement point B1, the vibration amplitude gradually increases from the 0 s mark, reaching a peak of 0.29 at the 0.015 s mark, and then gradually decreases. It decays to 0 at 0.075 s. The vibration amplitude values of measurement points B2 to B4 also follow this pattern. It can be seen that although STFT has advantages in continuous spectrum expression, wavelet transform has multi-scale time–frequency resolution capabilities and performs better in identifying non-steady sudden changes and high-frequency impact responses, such as explosion vibrations in flameproof enclosures, demonstrating its unique advantages for flameproof enclosure vibration analysis.

7.2.2. Visualization of Vibration in Flameproof Enclosures

The vibration velocity signal is converted into a displacement signal using numerical integration methods, as shown in Figure 15a. However, during the integration process, there is interference from trend terms. The least squares method is used to remove the trend terms. The signal changes exhibit more symmetrical characteristics, thereby more accurately reflecting the true displacement characteristics of the explosion-proof enclosure during the vibration process, as shown in Figure 15b.
By aligning the time domain of each measurement point, a single-sided displacement field of the enclosure was constructed to achieve preliminary visualization of the vibration. The displacement fields at four different times are shown in Figure 16.
Figure 16a shows the displacement field of the shell at 0.01 s after impact, which is the state just before large-scale deformation occurs. Figure 16b shows the displacement field of the shell surface at 0.02 s after impact, at which point the shell has already undergone significant deformation. Figure 16c shows the deformation state of the shell at 0.03 s, with larger displacement than at 0.02 s. Figure 16d shows the deformation state of the shell surface at 0.04 s. Since the shell deformation is in a back-and-forth oscillating state, the displacement field at this time is opposite to that at 0.03 s and more intense. Subsequently, the displacement field oscillates and decreases with time until it reaches zero.
The dynamic changes in the displacement field provided a comprehensive understanding of the vibration characteristics of coal mine flameproof enclosures from point to surface.

7.3. Impact Load Inversion Verification

To verify the feasibility of the experimental platform and the accuracy of the impact load inversion model, the following dual verification scheme was designed:
(1)
Platform impact simulation capability verification
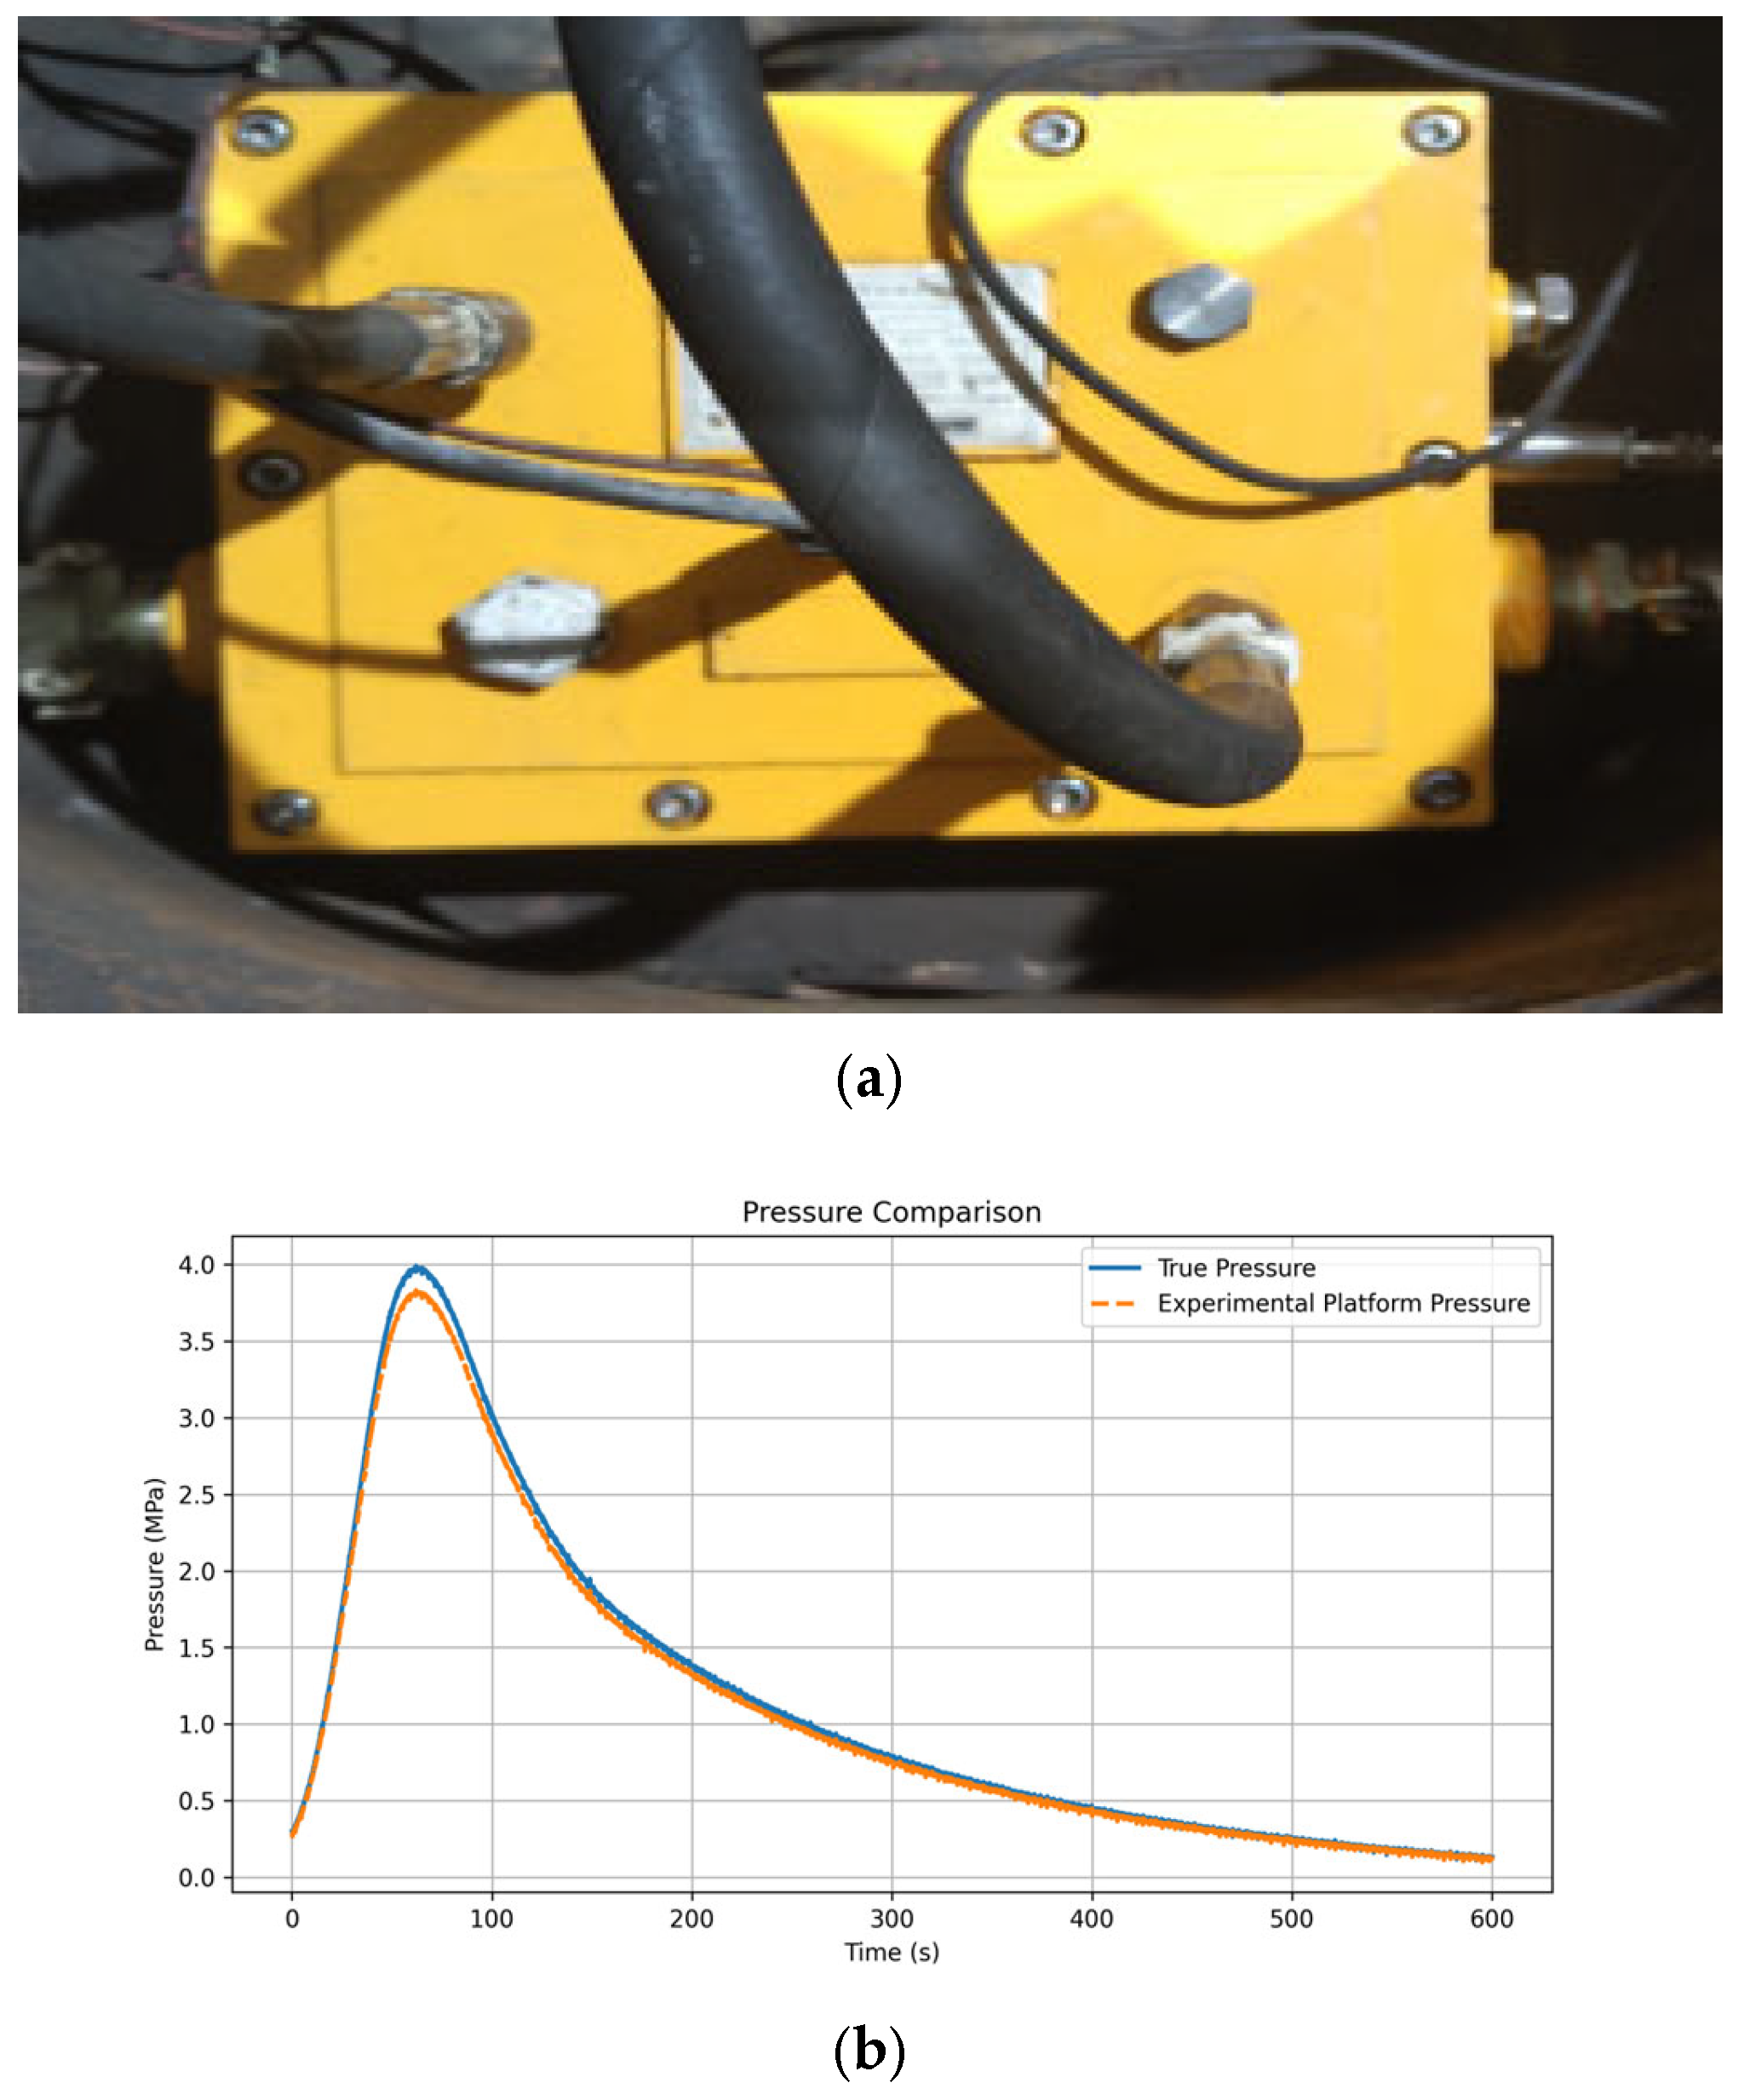
The center impact measurement point B4 was selected, and the pressure sensor measured the impact load time history of the experimental platform. The results were compared with the gas explosion impact pressure data from the actual explosion test. The actual explosion test platform is shown in Figure 17a. The comparison of the results is shown in Figure 17b. The various errors are shown in Table 3. All errors are within 5%, indicating that the experimental platform can simulate a gas explosion impact.
(2)
Verification of the accuracy of the impact load inversion model
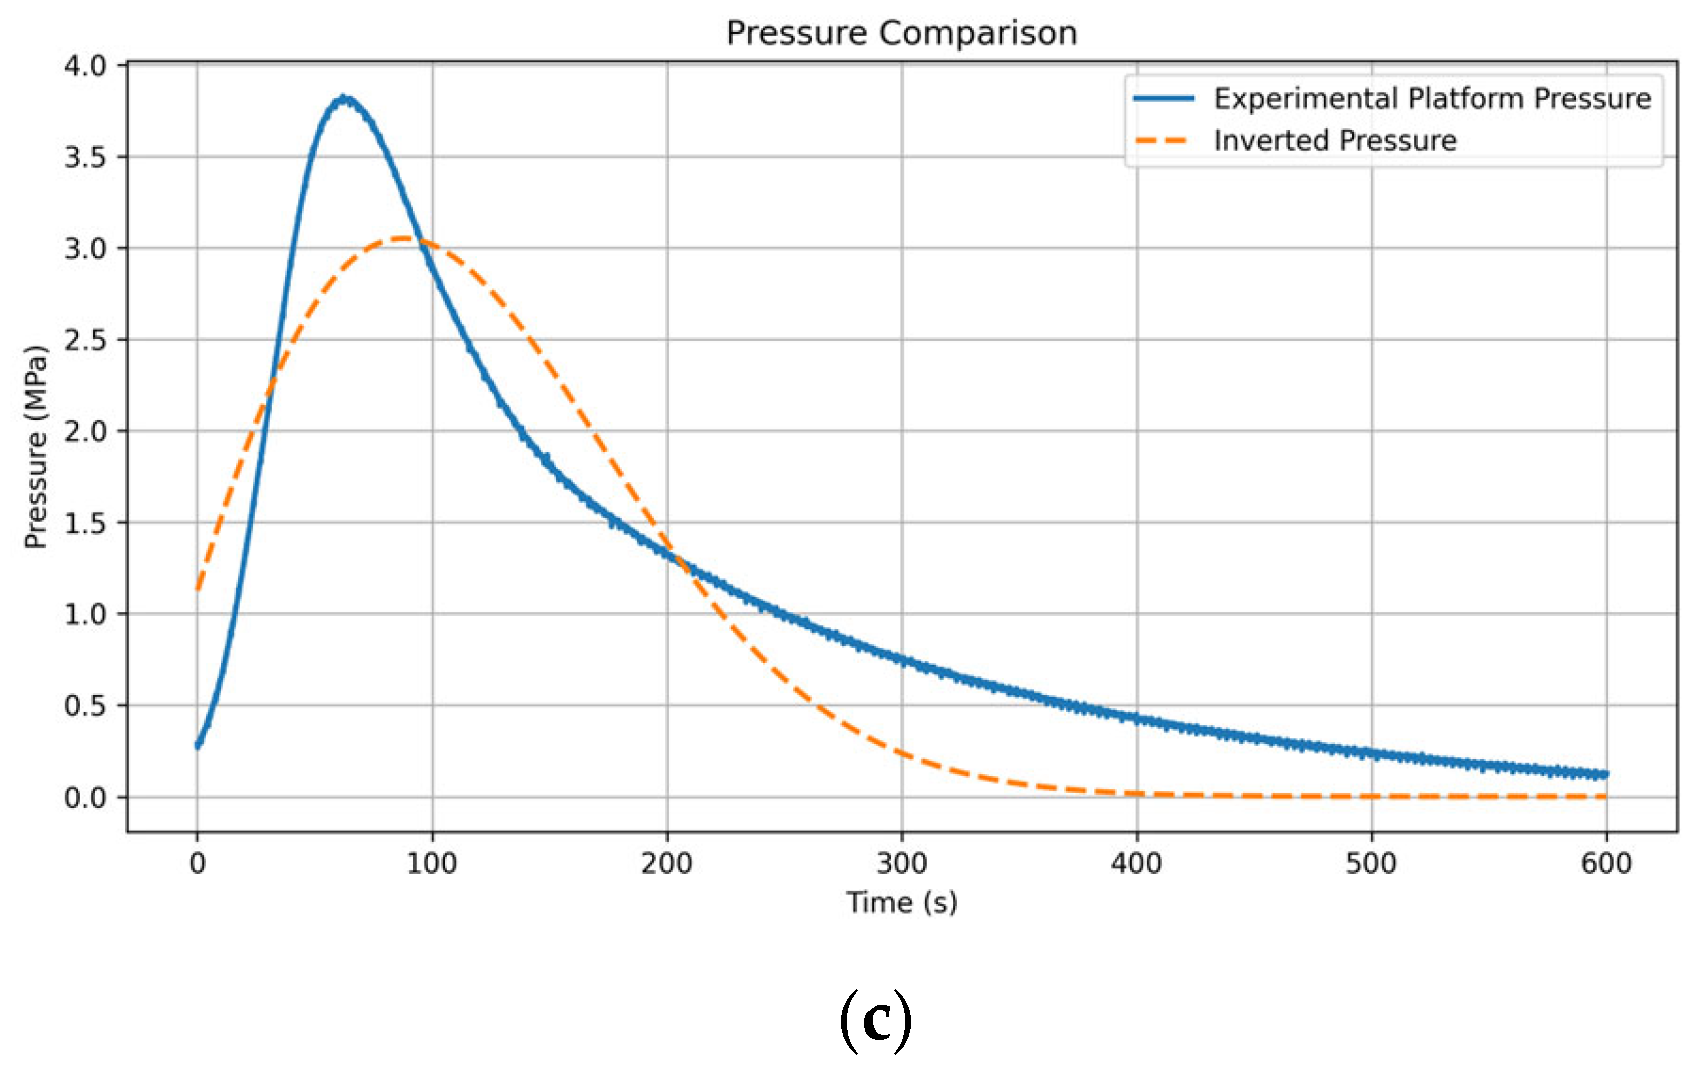
Based on the platform feasibility verification, in order to further evaluate the accuracy of the inversion model, the inversion model obtained the impact force inversion results according to the vibration response signals of the flameproof enclosures measured by laser Doppler. Figure 17c above shows the inverted impact pressure and the measured impact pressure curve of the experimental platform. The error between the inversion impact force and the known actual impact force is shown in the Table 4 below. All errors are within 15%, and the model has good inversion accuracy, indicating that the laser Doppler measurement method can replace traditional pressure measurement.
By comparing the above 7.2 laser Doppler analysis data with the actual explosion test pressure data in Figure 14, it can be seen that traditional pressure measurement can only obtain the time history of the impact force but cannot determine the dynamic response of the shell. The laser Doppler measurement method not only provides richer data, but also characterizes the dynamic response characteristics of the surface of flameproof enclosures, providing new technical means for measuring coal mine flameproof enclosures and providing data support for the failure mode and analysis, failure prevention, design and safety performance evaluation of flameproof enclosures in the future.

8. Conclusions

In summary, a gas explosion propagation and flameproof enclosure detonation transmission model was established, and a laser Doppler measurement method for flameproof enclosures was proposed to address issues with traditional pressure measurement methods. Through stepwise vibration analysis, the frequency and energy distribution patterns of explosion shock waves were revealed, offering enhanced data richness and substitutability. The main conclusions are as follows:
(1)
A model for gas explosion propagation inside flameproof enclosures was established. The single pulse response function was improved by introducing the material and structural characteristics of flameproof enclosures, and a detonation transmission response model for flameproof enclosures was established, providing a theoretical basis for the propagation laws and detonation transmission characteristics of gas explosion shock waves in coal mine flameproof equipment.
(2)
Laser Doppler replaces traditional explosion test pressure measurement, using direct measurement and global measurement point layout to accurately capture the dynamic response of flameproof enclosures, solving the installation difficulties of traditional contact measurement.
(3)
FFT, STFT, and DWT were used to analyze the vibration characteristics of the surface of flameproof enclosures. The experimental results show that the FFT method can be used to obtain the global time-domain distribution of vibrations, while the STFT can be used to further analyze the changes in the main frequency and other significant frequencies over time. The DWT can be used to further analyze each frequency band’s amplitude to a specific time through multi-scale analysis, gradually revealing the vibration characteristics of flameproof enclosures in multiple dimensions and scales.
(4)
The measured values of the experimental platform and the actual explosion test impact pressure error index are both less than 5%, and the inversion load errors are all within 15%, which verifies the feasibility of the experimental platform, the accuracy of the model inversion, and the good substitutability of the laser Doppler measurement method.
(5)
Vibration analysis and comparison with traditional explosion test data solved the problem of traditional pressure measurement data being single and unable to characterize the dynamic response of the enclosure. The laser Doppler measurement method provided new technical support for measuring and analyzing flameproof enclosure failure modes.

Author Contributions

X.X.: writing—review and editing, validation, software, resources, formal analysis. J.Q.: writing—original draft, methodology, investigation, formal analysis, data curation. H.Z.: writing—review and editing, supervision, resources, project administration, conceptualization. W.Y.: validation, software, resources. H.W.: software, resources, methodology, investigation. F.C.: project administration and conceptualization. All authors have read and agreed to the published version of the manuscript.

Funding

This research was funded by the National Key Research Development Program Young Scientists Project of China, 2022YFF0605300, and by the, Shaanxi Provincial Department of Education serves local special—industrialization cultivation project, 23JC048.

Institutional Review Board Statement

Not applicable.

Informed Consent Statement

Not applicable.

Data Availability Statement

The supported anchor-rod dataset presented in this article is not publicly available due to the data being part of ongoing research.

Conflicts of Interest

The authors declare no conflict of interest.

References

  1. Liu, H. Laying a solid foundation and taking multiple measures to shape a new trend of safe development in mines. China Coal Ind. 2025, 56–57. [Google Scholar]
  2. Zhang, Y. Analysis of Explosion Pressure and Its Influencing Factors of Flameproof Shell. Colliery Mech. Electr. Technol. 2023, 44, 67–70. [Google Scholar]
  3. Chen, F. Influence Factors of Reference Pressure Measurement in Pressure Test of Flameproof Shell. Saf. Coal Mines 2019, 232–234. [Google Scholar] [CrossRef]
  4. Deffet, L.; Brinkley, S.R.; Laderman, A.J.; Urtiew, P.A.; Oppenheim, A.K. On the Generation of a Shock Wave by Flame in an Explosive Gas. In Symposium (International) on Combustion; Elsevier: Amsterdam, The Netherlands, 1963; pp. 265–274. [Google Scholar]
  5. Kundu, S.; Zanganeh, J.; Moghtaderi, B. A review on understanding explosions from methane–air mixture. J. Loss Prev. Process Ind. 2016, 40, 507–523. [Google Scholar] [CrossRef]
  6. Ogle, R.A. Explosion hazard analysis for an enclosure partially filled with a flammable gas. Process Saf. Prog. 1999, 18, 170–177. [Google Scholar] [CrossRef]
  7. Ma, H.; Long, Y.; Li, X.; Zhong, M.; Wu, J.; Zhou, Y. Study on Vibration Characteristics of Natural Gas Pipeline Explosion Based on Improved MP-WVD Algorithm. Shock. Vib. 2018, 2018, 8969675. [Google Scholar] [CrossRef]
  8. Liang, Y.; Wang, L.; Luo, H.; Fen, W.; Tian, F. Computational model of reaction kinetic for gas explosion in constant volume combustion reactor. J. China Coal Soc. 2015, 40, 1853–1858. [Google Scholar]
  9. Li, H. Pressure Test System of Flameproof Enclosure and Analysis of Influencing Factors. Electr. Explos. Prot. 2020, 36–38. [Google Scholar] [CrossRef]
  10. Zhou, W. Method to Test Explosion Pressure of Flameproof Enclosure and Analysis on Influence Factors. Coal Sci. Technol. 2012, 40, 91–94. [Google Scholar]
  11. An, P. Pressure Testing method on Flameproof Enclosure of Electrical Equipment. Electr. Explos. Prot. 2010, 38–40. [Google Scholar] [CrossRef]
  12. Liu, H.L.; Shao, L.; Zuo, H.B.; Liu, N. Application of Laser Doppler Technique in Measurement of Explosive Container Based on Frequency Correction. Appl. Mech. Mater. 2013, 391, 497–500. [Google Scholar] [CrossRef]
  13. Li, M. Discussion on the Main Problems and Precautions in the Processing of Mining Flameproof Enclosure. Electr. Explos. 2025, 20–23. [Google Scholar] [CrossRef]
  14. Xiao, T.; Shi, F.; Yi, X.; Chen, X. Research on vibration characteristics of electric spindle of milling machine based on laser vibration measurement technology. Chin. J. Constr. Mach. 2024, 22, 191–195. [Google Scholar]
  15. Bai, X.; Guo, P.; Chen, S.; Zhang, Y.; Chen, H.; Bu, Z. Simulation in the Time Domain and Time-Frequency Analysis for Coherent Doppler Wind Lidar. Chin. J. Laser 2015, 42, 0114003. [Google Scholar]
  16. Labelle, L.; Roozen, N.B.; Vandenbroeck, J.; Akasaka, S.; Glorieux, C. Elastic characterization of polymer fibers by laser Doppler vibrometry. Opt. Lasers Eng. 2017, 99, 88–97. [Google Scholar] [CrossRef]
  17. Taylor, G.I. The formation of a blast wave by a very intense explosion I. Theoretical discussion. Proc. R. Soc. Lond. A 1950, 201, 159–174. [Google Scholar]
  18. Zhang, W.; Zou, Y.; Jia, Y. Influence of filling ratio on gas explosion in flameproof chamber. Saf. Coal Mines 2023, 54, 229–233. [Google Scholar]
  19. Briggs, M.E.; Hill, L.; Hull, L.; Shimas, M. Application and Principles of Photon-Doppler Velocimetry for Explosives Testing (No. LA-UR-10-01427; LA-UR-10-1427); Los Alamos National Laboratory (LANL): Los Alamos, NM, USA, 2010. [Google Scholar]
  20. Nian, G.; Gu, X.; Cheng, F.; Zeng, X. The Research on Vibration Characteristic of Cylindrical Explosive Vessel with Flat End Plat. J. Proj. Rocket. Missiles Guid. 2011, 31, 105–108. [Google Scholar]
  21. Wang, K.; Pan, H.; Zhang, T.; Wang, H. Experimental study on the radial vibration characteristics of a coal briquette in each stage of its life cycle under the action of CO2 gas explosion. Fuel 2022, 320, 123922. [Google Scholar] [CrossRef]
  22. Huang, D.; Cui, S.; Li, X. Wavelet packet analysis of blasting vibration signal of mountain tunnel. Soil Dyn. Earthq. Eng. 2019, 117, 72–80. [Google Scholar] [CrossRef]
  23. Goutaudier, D.; Gendre, D.; Kehr-Candille, V.; Ohayon, R. Single-sensor approach for impact localization and force reconstruction by using discriminating vibration modes. Mech. Syst. Signal Process. 2020, 138, 106534. [Google Scholar] [CrossRef]
  24. Li, S. On Explosion Pressure in Explosion-Proof Enclosures and Its Influencing Factors. Saf. Coal Mines 2003, 101–103. [Google Scholar] [CrossRef]
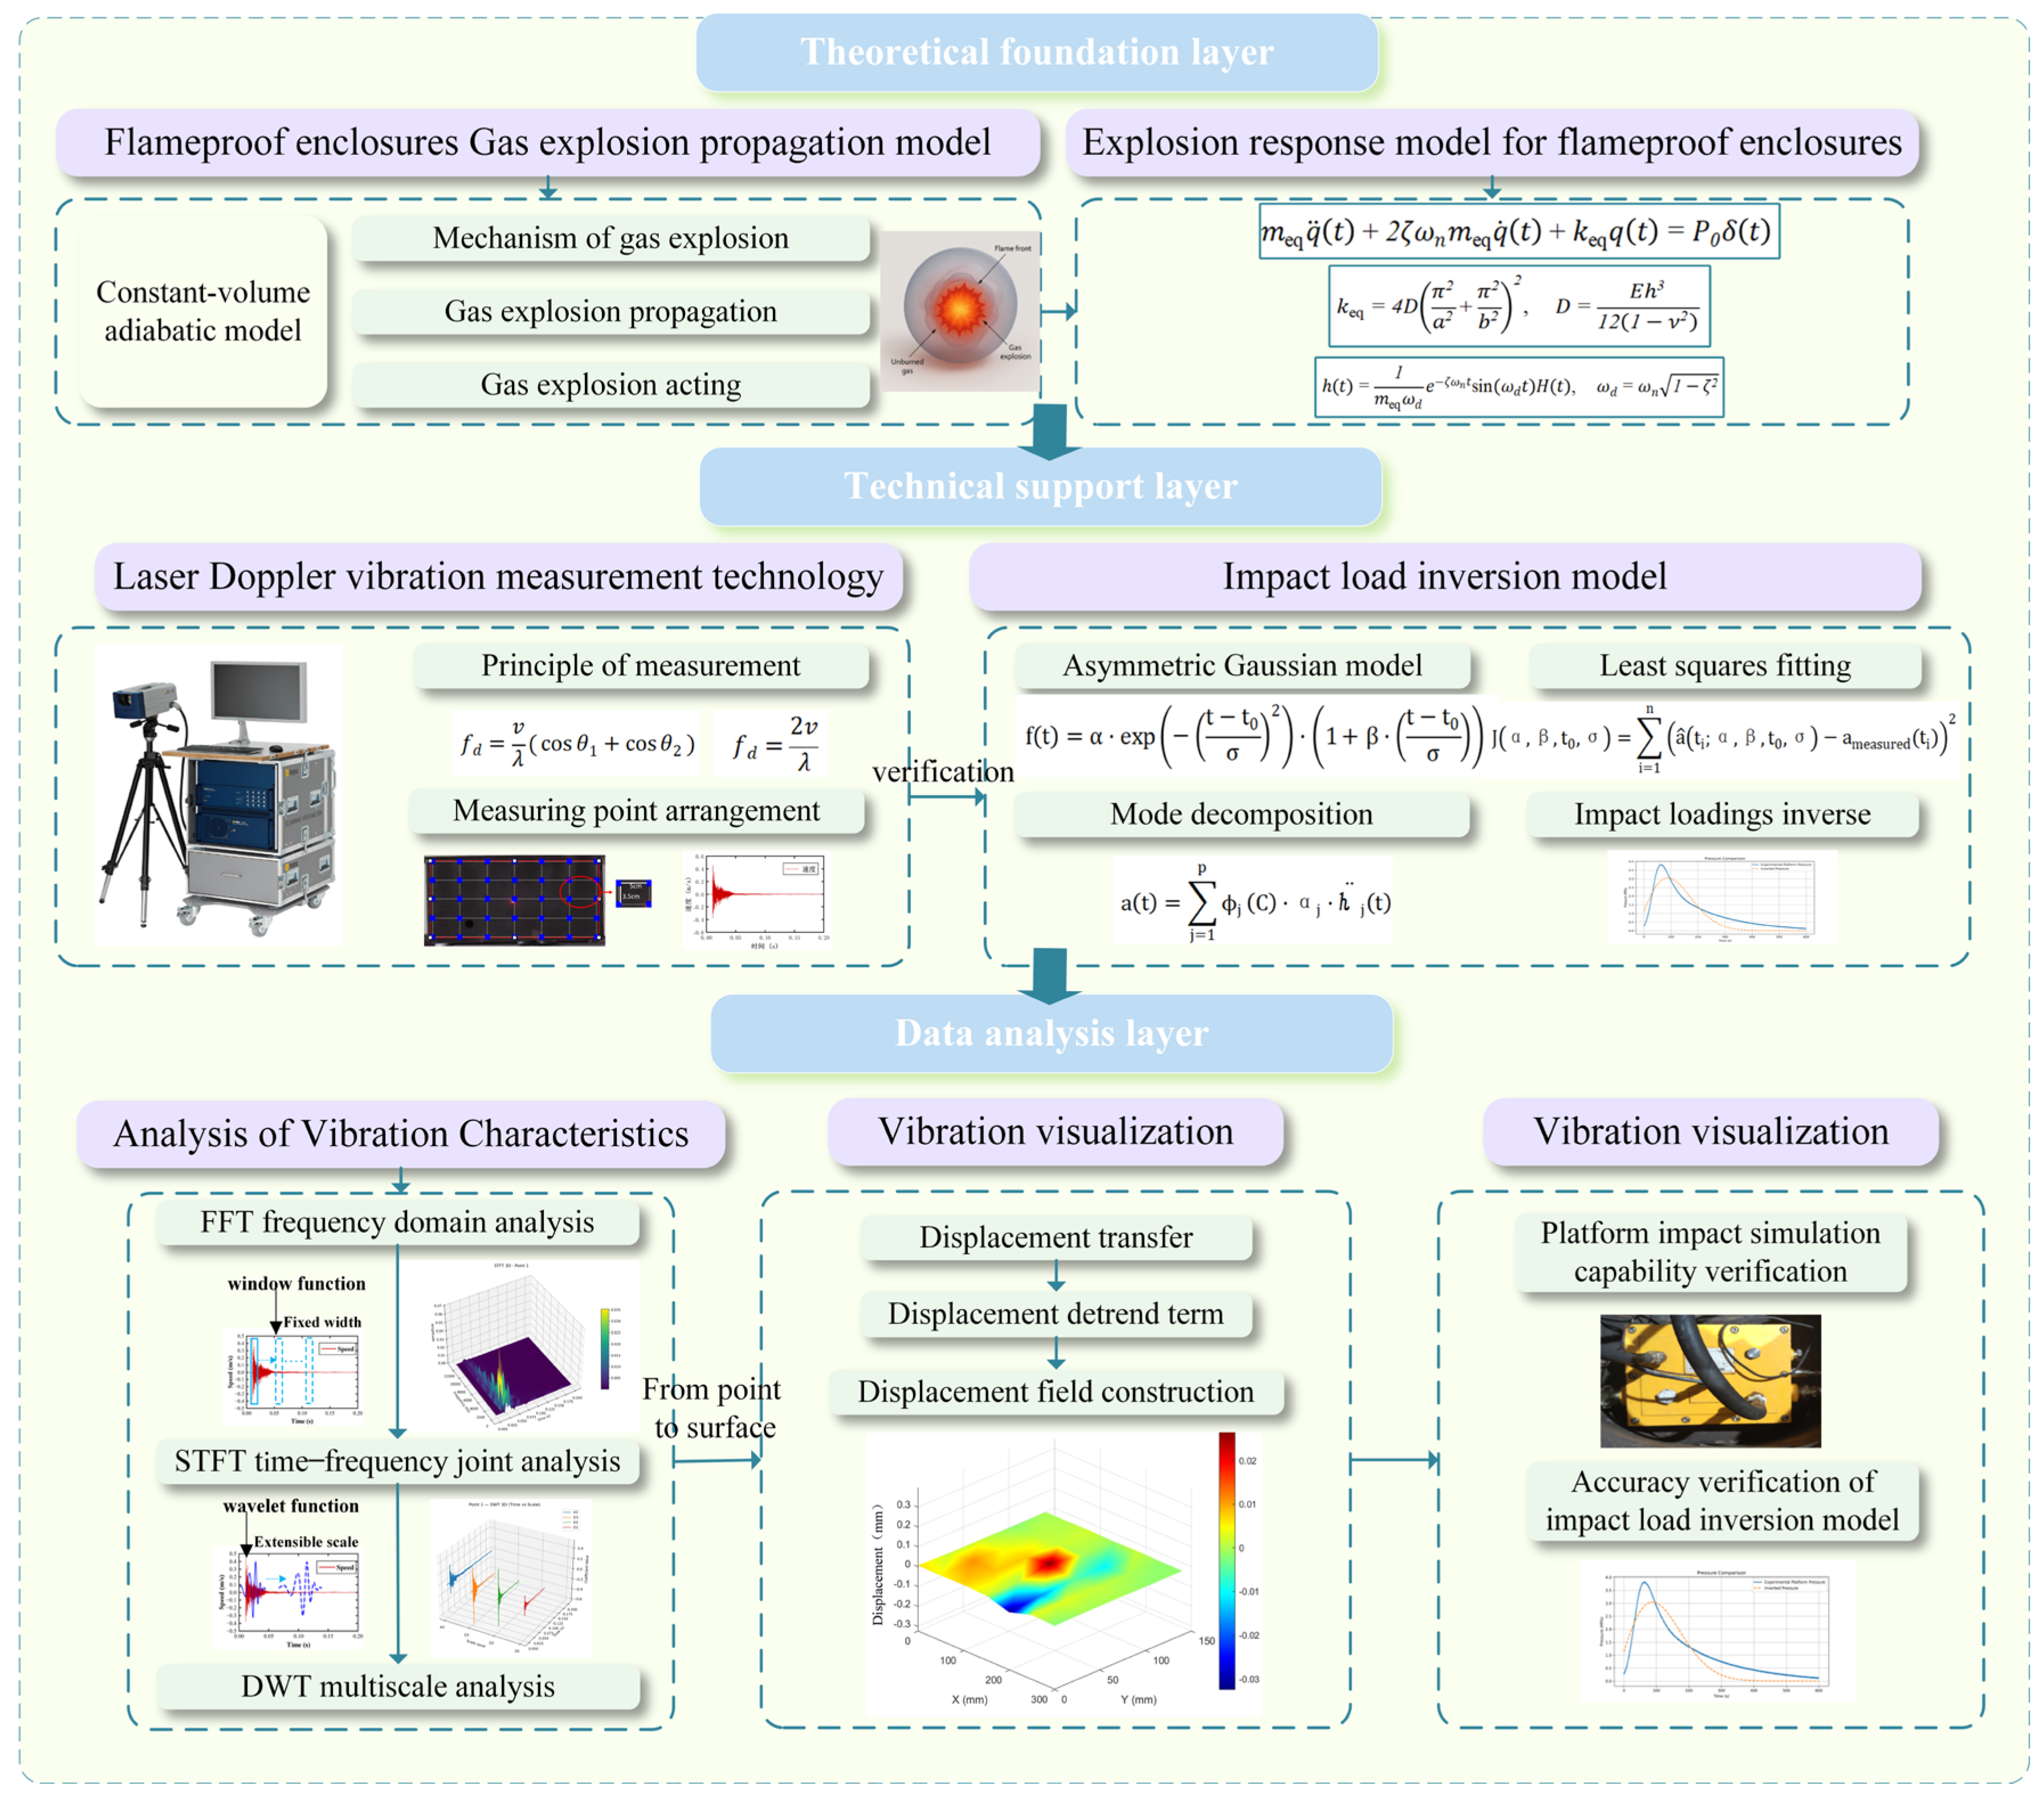
Figure 1. Principle of vibration characteristic measurement and analysis of explosion-proof equipment in coal mines.
Applsci 15 09255 g001
Figure 2. Shock wave propagation diagram of internal gas explosions in an explosion-proof shell. (a) Initial state. (b) Propagation state. (c) Interaction state.
Applsci 15 09255 g002
Figure 3. Schematic diagram of laser Doppler measurement in flameproof enclosures.
Applsci 15 09255 g003
Figure 4. Measurement point layout.
Applsci 15 09255 g004
Figure 5. Data example.
Applsci 15 09255 g005
Figure 6. Method for analyzing the vibration characteristics of flameproof enclosures.
Applsci 15 09255 g006
Figure 7. DWT decomposition principle.
Applsci 15 09255 g007
Figure 8. Experimental subjects.
Applsci 15 09255 g008
Figure 9. Experimental platform.
Applsci 15 09255 g009
Figure 10. Measuring point arrangement and measuring sequence.
Applsci 15 09255 g010
Figure 11. Display of row data results. (a) Arrangement of data points in the middle row. (b) B1 measurement point. (c) B2 measurement point. (d) B3 measurement point. (e) B4 measurement point. (f) B5 measurement point. (g) B6 measurement point. (h) B7 measurement point.
Applsci 15 09255 g011
Figure 12. Time-domain and frequency-domain diagrams for measurement points B1–B4. (a) Time-domain diagram of measurement point B1. (b) Frequency-domain diagram of measurement point B1. (c) Time-domain diagram of measurement point B2. (d) Frequency-domain diagram of measurement point B2. (e) Time-domain diagram of measurement point B3. (f) Frequency-domain diagram of measurement point B3. (g) Time-domain diagram of measurement point B3. (h) Frequency-domain diagram of measurement point B3.
Applsci 15 09255 g012aApplsci 15 09255 g012b
Figure 13. Time–frequency diagram of measurement points B1–B4 after STFT. (a) Two-dimensional time–frequency plot of STFT at measurement point B1. (b) Three-dimensional time–frequency diagram of STFT at measurement point B1. (c) Two-dimensional time–frequency plot of STFT at measurement point B2. (d) Three-dimensional time–frequency diagram of STFT at measurement point B2. (e) Two-dimensional time–frequency plot of STFT at measurement point B3. (f) Three-dimensional time–frequency diagram of STFT at measurement point B3. (g) Two-dimensional time–frequency plot of STFT at measurement point B4. (h) Three-dimensional time–frequency diagram of STFT at measurement point B4.
Applsci 15 09255 g013
Figure 14. Wavelet transform results for measurement points B1–B4. (a) Wavelet transform results for measurement point B1. (b) Wavelet transform of B1 measurement point at various scales. (c) Wavelet transform results for measurement point B2. (d) Wavelet transform of B2 measurement point at various scales. (e) Wavelet transform results for measurement point B3. (f) Wavelet transform of B3 measurement point at various scales. (g) Wavelet transform results for measurement point B1. (h) Wavelet transform of B1 measurement point at various scales.
Applsci 15 09255 g014aApplsci 15 09255 g014b
Figure 15. Displacement curve of measurement points on flameproof enclosures. (a) Displacement after integration. (b) Elimination of trend displacement.
Applsci 15 09255 g015
Figure 16. Visualization of displacement fields at different times.
Applsci 15 09255 g016
Figure 17. Experimental verification. (a) Explosion test platform. (b) Comparison of actual pressure and platform pressure. (c) Comparison of platform pressure and inversion pressure.
Applsci 15 09255 g017aApplsci 15 09255 g017b
Table 1. Laser Doppler vibrometer parameters.
Measurement RangeResolutionSampling FrequencySpeed RangeLaser WavelengthNumber of Channels
0–15 mµm level0–50 MHz±10 m/s633 nm He-Nesingle channel
Table 2. Hierarchical information in wavelet transforms.
Frequency BandD1D2D3A3
Frequency f s 4 , f s 2 = [ 6400,12800 ] f s 8 , f s 4 = [ 3200,6400 ] f s 16 , f s 8 = [ 1600,3200 ] f s 0 , f s 16 = [ 0,1600 ]
ExplanationHigh-frequency detailsMid–high frequency detailsMidrange detailsLow-frequency trend
Table 3. Platform measurement of impact load and error in actual pressure resistance test load.
Indicator NameMSEPeak ErrorAscent Rate ErrorAttenuation Rate Error
Error0.0391.5%4.1%3.9%
Table 4. Inverse impact load and platform measurement load error.
Indicator NameMSEPeak ErrorAscent Rate ErrorAttenuation Rate Error
Error0.18311.33%13.12%13.89%
Disclaimer/Publisher’s Note: The statements, opinions and data contained in all publications are solely those of the individual author(s) and contributor(s) and not of MDPI and/or the editor(s). MDPI and/or the editor(s) disclaim responsibility for any injury to people or property resulting from any ideas, methods, instructions or products referred to in the content.