Article

Equity Evaluation of Park Green Space Based on SDG11: A Case Study of Jinan City, Shandong Province, China

College of Surveying and Mapping Geo-Informatics, Shandong Jianzhu University, Jinan 250101, China
*
Author to whom correspondence should be addressed.
Appl. Sci. 2025, 15(17), 9239; https://doi.org/10.3390/app15179239
Submission received: 7 May 2025 / Revised: 16 August 2025 / Accepted: 19 August 2025 / Published: 22 August 2025

Abstract

Urban spatial justice is a critical issue in the context of rapid urbanization. Improving public well-being depends on the efficient use of park green space (PGS) resources. This study evaluates the spatial distribution equity and social equity of PGS in Jinan City, Shandong Province, China, with the aim of optimizing their spatial layout, mitigating poor accessibility due to uneven spatial distribution, and improving the quality of life for all inhabitants. Firstly, based on Sustainable Development Goal 11 (SDG11), we constructed an urban sustainable development index system to quantify residents’ demand levels. The supply level was measured through three dimensions: quantity, quality, and accessibility of PGS utilizing multi-source geospatial data. A coupling coordination degree model (CCDM) was employed to analyze the supply-demand equilibrium. Secondly, Lorenz curves and Gini coefficients were utilized to evaluate the equity of PGS resource distribution to disadvantaged populations. Finally, a k-means clustering algorithm found the best sites for additional parks in low-accessibility regions. The results show that southern areas—that is; those south of the Yellow River—showed greater supply-demand equilibrium than northern ones. With a Gini index for PGS services aimed at vulnerable populations of 0.35, the citywide social level distribution appeared to be relatively balanced. This paper suggests an evaluation technique to support fair resource allocation, establishing a dual-perspective evaluation framework (spatial and social equality) and giving a scientific basis for PGS planning in Jinan.

1. Introduction

The rapid urbanization and population growth in cities have led to a surge in demand for recreational spaces such as park green space (PGS) among urban residents. Equitable access to the ecological and social benefits of PGS is a fundamental right for all societal members [1]. However, disparities in urban public space allocation and uneven socioeconomic development have resulted in imbalanced PGS resource distribution, raising widespread concerns over the equity of supply-demand dynamics [2]. In 2021, the Jinan Municipal Government promulgated the Implementation Opinions on Promoting High-Quality Development of Urban Landscape and Forestry Greening (http://www.jinan.gov.cn/art/2021/2/2/art_2612_4768744.html (accessed on 18 August 2025)), prioritizing ecological enhancement, biodiversity conservation, and citizen-centric urban greening. Despite an increase in park quantity, spatial disparities persist, characterized by a “Concentrated south, fragmented north” pattern. Suboptimal per capita green space availability further underscores the need for strategic revisions to PGS planning in Jinan.
Urban spatial justice fundamentally aims to protect individuals’ spatial rights and interests, encompassing not only equitable physical space distribution but also the integration of residents’ spatial usage rights into urban planning processes. This ensures their active participation in urban spatial production and equitable access to resource allocation. Since the 1950s, methodologies for assessing PGS equity have prioritized spatial accessibility analysis, particularly through quantifying park-residence proximity. In 1959, American planning scholars Hansen and Walter introduced the accessibility concept, applying it to analyze land use-transportation interactions in Washington, D.C. [3]. A pivotal advancement occurred in 1990 when C. Liston Heyes incorporated PGS accessibility into academic discourse, focusing on Dartmoor National Park’s leisure value while establishing foundational theories for distance-based accessibility assessments [4]. By the 1990s, socioeconomic stratification and geographic information system (GIS) advancements prompted researchers to examine PGS utilization across demographic groups. Methodologies diversified during this period, combining qualitative approaches (e.g., surveys, interviews) with GIS-driven quantitative analyses. For instance, Erkip (1997) employed questionnaires to evaluate correlations between park usage rates, citizen income levels, and service area distances in Ankara [5], while Coutts et al. utilized GIS to statistically link green space accessibility with county-level mortality rates in Florida [6].
Recent advances in remote sensing technologies and big data have entirely changed how we evaluate park green space (PGS). Remote sensing now provides us high-resolution spatial data, and big data analytics provide us detailed information on all the parts of a city. Researchers use remote sensing data and big data analytics with geographic information systems (GIS) to accurately map park green space (PGS) and other urban features [7]. Accessibility analysis looks at how easy it is for different groups of people to arrive at PGS by looking at things like distance, transit networks, and land use [8]. The Gini coefficient, which comes from economics, measures how fair the allocation of resources is by measuring how unequal access is between different groups of people. Higher values mean that access is more uneven [9]. Models of supply-demand equilibrium are becoming more common. They take into account supply (PGS quantity, quality, and layout) and demand (residential demands based on population density, demographics, and consumption patterns) [10]. Using spatial demographics and network accessibility metrics, Tan et al. created a spatially weighted regression model combining land cover and population data to evaluate PGS equity in central Wuhan [11]. Additionally, Semenzato et al. created multidimensional accessibility metrics for Padua, Italy’s urban parks to underline their vital importance in maximizing urban planning and guaranteeing fair citizen access to open spaces [12]. Chen Y et al. used the Lorenz curve and Gini coefficient to evaluate whether inhabitants’ possibilities to access green space resources were balanced when optimizing the urban green space pattern [13]. Meng & Li quantified green space supply-demand dynamics in Beijing’s Haidian District using an accessibility study of non-park urban open spaces, broadening the scope [14]. Emerging methods also include mobile signaling data and social media analytics to track PGS use in real time. Especially, Xiao et al. creatively examined utilizing large-scale mobility datasets spatiotemporal patterns of green space access for millions of Shanghai inhabitants [15].
In the late 19th century, economist Alfred Marshall established the fundamental supply and demand theory to elucidate market dynamics and resource allocation [16]. Analyzing equity in urban PGS indicates that the balance between supply and demand emphasizes the fair allocation of resources for green infrastructure across geographically diverse and age-segmented populations. For instance, Wu et al. utilized gravity modeling and GIS techniques to statistically evaluate the spatial equity of PGS in Futian District based on the theoretical framework for evaluating the spatial equity of urban PGS [17]. Building on this, Wang et al. introduced a framework for evaluating the spatial fairness of public green spaces in Xuhui District, Shanghai, based on social justice principles and the characteristics of residential population and green space distribution [18]. Further advancing this discourse, Wang et al. advanced this discussion by investigating the discrepancies in park accessibility between high-income and low-income populations in Beijing’s urban center [1].
Conventional urban PGS supply and demand analyses frequently ignore the diverse requirements of urban populations, restricting demand assessment to population density and economic characteristics. Chen et al. adeptly incorporated Sustainable Development Goal 11 (SDG11) into a framework for evaluating green space equity in central Wuhan, thereby establishing a spatial correlation between resource distribution and social development indicators, thus correcting this shortcoming [19]. This strategy is consistent with the United Nations 2030 Agenda for Sustainable Development (Changing Our World, 2015), which continues the Millennium Development Goals (MDGs) [20]. Considered a globally acknowledged benchmark for evaluating urban development [21], SDG11 specifically advocates for the establishment of “inclusive, safe, resilient, and sustainable human communities”. Its multidimensional indicators encompass housing accessibility, transportation efficiency, cultural preservation, vulnerable population support, and environmental quality [22] provide a robust framework for evaluating resident-centric social demands. Environmental justice is fundamentally reliant on the spatial fairness of public green space distribution, as the intentional allocation of green infrastructure among demographic groups improves urban ecological systems and fosters social equity, which is essential for sustainable urbanization [23].
This study aims to synthesize existing evaluation methodologies for fairness in urban park green space (PGS) and further assess the fairness of PGS in Jinan City using multi-source geographic big data. To achieve this goal, the research will first integrate the SDG11 framework for urban sustainable development into the equity assessment of PGS by examining the supply-demand dynamics between residents and PGS resources. Based on this, an evaluation index system for urban sustainable development will be created to show how much urban residents want PGS resources. The supply level of PGS resources will be shown through factors like the number, quality, and accessibility of comprehensive PGS. After that, we will utilize geographic information technology to perform spatial analysis to figure out the necessary indicators. We will also use the Lorenz curve and Gini coefficient to see how fairly PGS resources are distributed across vulnerable groups. We will also look into specific tactics for improving the selection of PGS sites in places. The research framework is illustrated in Figure 1.

2. Materials and Methods

2.1. Study Area

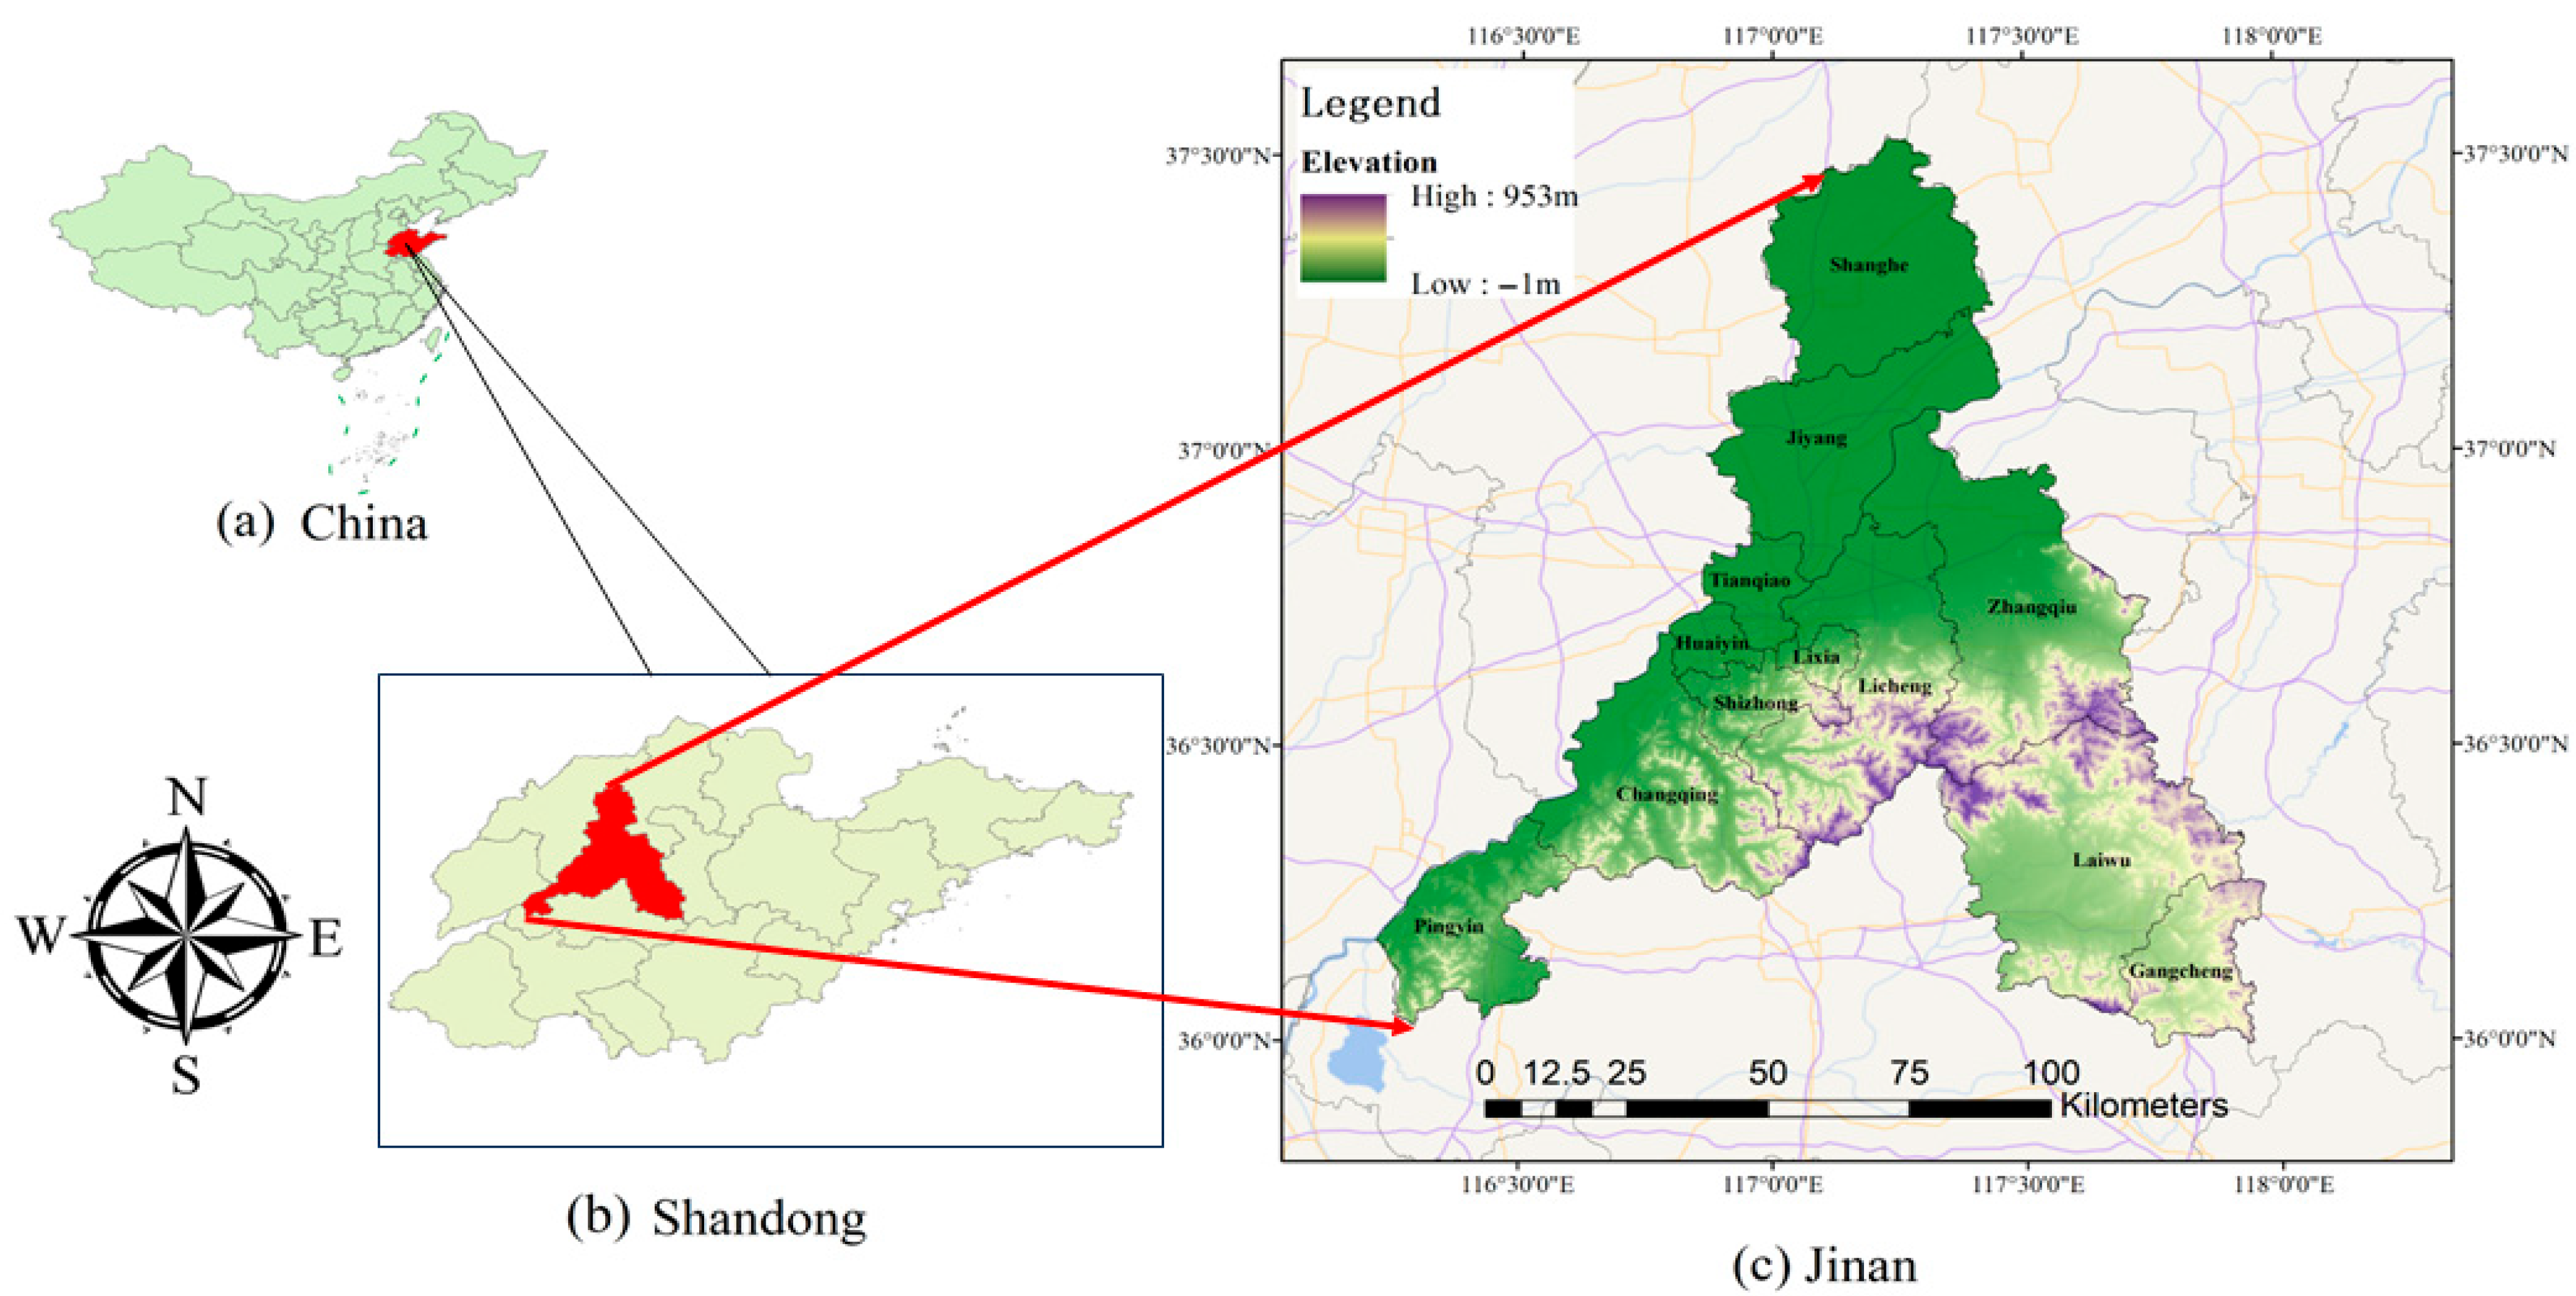
This study focuses on Jinan (Figure 2), located in Shandong Province, covering 12 districts (counties). Jinan has an area of 10,244 square kilometers and has a resident population of 9.415 million as of the end of 2022. Jinan, the capital and a renowned cultural city of Shandong Province, has recently achieved significant advancements in the development of PGS. By 2023, Jinan will own over 300 parks of diverse classifications, with a total area over 3000 hectares, resulting in a per capita area of public green space of 12 square meters.

2.2. Data Resource

In assessing the supply-demand relationship and equity of urban PGS, statistical data, while providing basic macro-level information (such as total population and economic indicators), has significant limitations. On one hand, statistical data are mostly aggregated at the administrative division level, making it difficult to accurately reflect differences in resource distribution at the micro-spatial scale. On the other hand, some key indicators (such as refined built-up area scope and real-time air quality) are insufficiently covered in the traditional statistical system, and the update frequency cannot meet the needs of dynamic assessment. To break through this limitation, this paper innovatively integrates spatial data and web-based open big data to construct a multi-source data fusion analysis framework. Through high-resolution land cover data and PM2.5 spatial datasets, it achieves a refined portrayal of the urban built environment and ecological quality. With the help of Gaode Map POI/AOI data and OpenStreetMap road network information, it accurately captures PGS boundaries, the distribution of cultural facilities, and the characteristics of transportation networks, making up for the shortcomings of statistical data in spatial granularity and timeliness. The collaborative application of such multi-source data not only improves the accuracy and spatial resolution of indicator measurement but also provides a new perspective for analyzing the micro-mechanism of PGS supply and demand and revealing the spatial heterogeneity of equity, which becomes an important innovation in the methodological aspect of this study. The data used in this paper and their sources are shown in Table 1.

2.3. Method

2.3.1. Entropy Value Method

The concept of “entropy” was first introduced by Shannon [26] to indicate the degree of uncertainty. The entropy method is an objective method of calculating weights, which can avoid the subjectivity of artificially assigning weights and can effectively weaken the influence of information superposition between indicators. The entropy value method solving process and formula are as follows:
1.
Data standardization
Data standardization [27] is the normalization of indicator values within the range of (0,1), with the aim of eliminating differences in scale and units between indicators. Indicators are divided into positive and negative indicators based on their impact on evaluation results. Normalization formula for positive and negative indicators [28]:
y i j is positive indicators:
y i j = ( x i j x j m i n ) ( x j m a x x j m i n )
y i j is negative indicators:
y i j = ( x j m a x x i j ) ( x j m a x x j m i n )
where y i j is the standardized value; notes i-th districts (counties); j   ( 1 j n ) denotes j-th indicator; and x j m i n are the maximum and minimum values of j-th indicator; x i j is the raw value of the indicator [29].
2.
Weight quantification
When calculating the proportion of indicators P i j , in order to avoid P i j = 0 for information entropy calculation, it is standardized to increase y i j by 0.1 in the calculation [30], and the formula is as follows:
P i j = ( y i j + 0.1 ) i = 1 m y i j + 0.1
The larger the entropy value, the more the indicator is about instability, so the weights are inversely proportional to the information entropy. The quantitative formula for Shannon information entropy ( e j ) and weight ( W i ) is as follows:
e j = 1 ln ( m ) × i = 1 m ( P i j × ln P i j ) W i = 1 e j / j = 1 m 1 e j
3.
Composite Score Calculation
Finally, we calculated a composite score by combining the weights and normalized values of each indicator. In order to make the presentation of the results more intuitive, we normalized the final scores to the [60, 100]. The formula for calculating comprehensive evaluation indicators ( U i ) is as follows:
U i = j = 1 m W j × y i j

2.3.2. Two-Step Floating Catchment Area

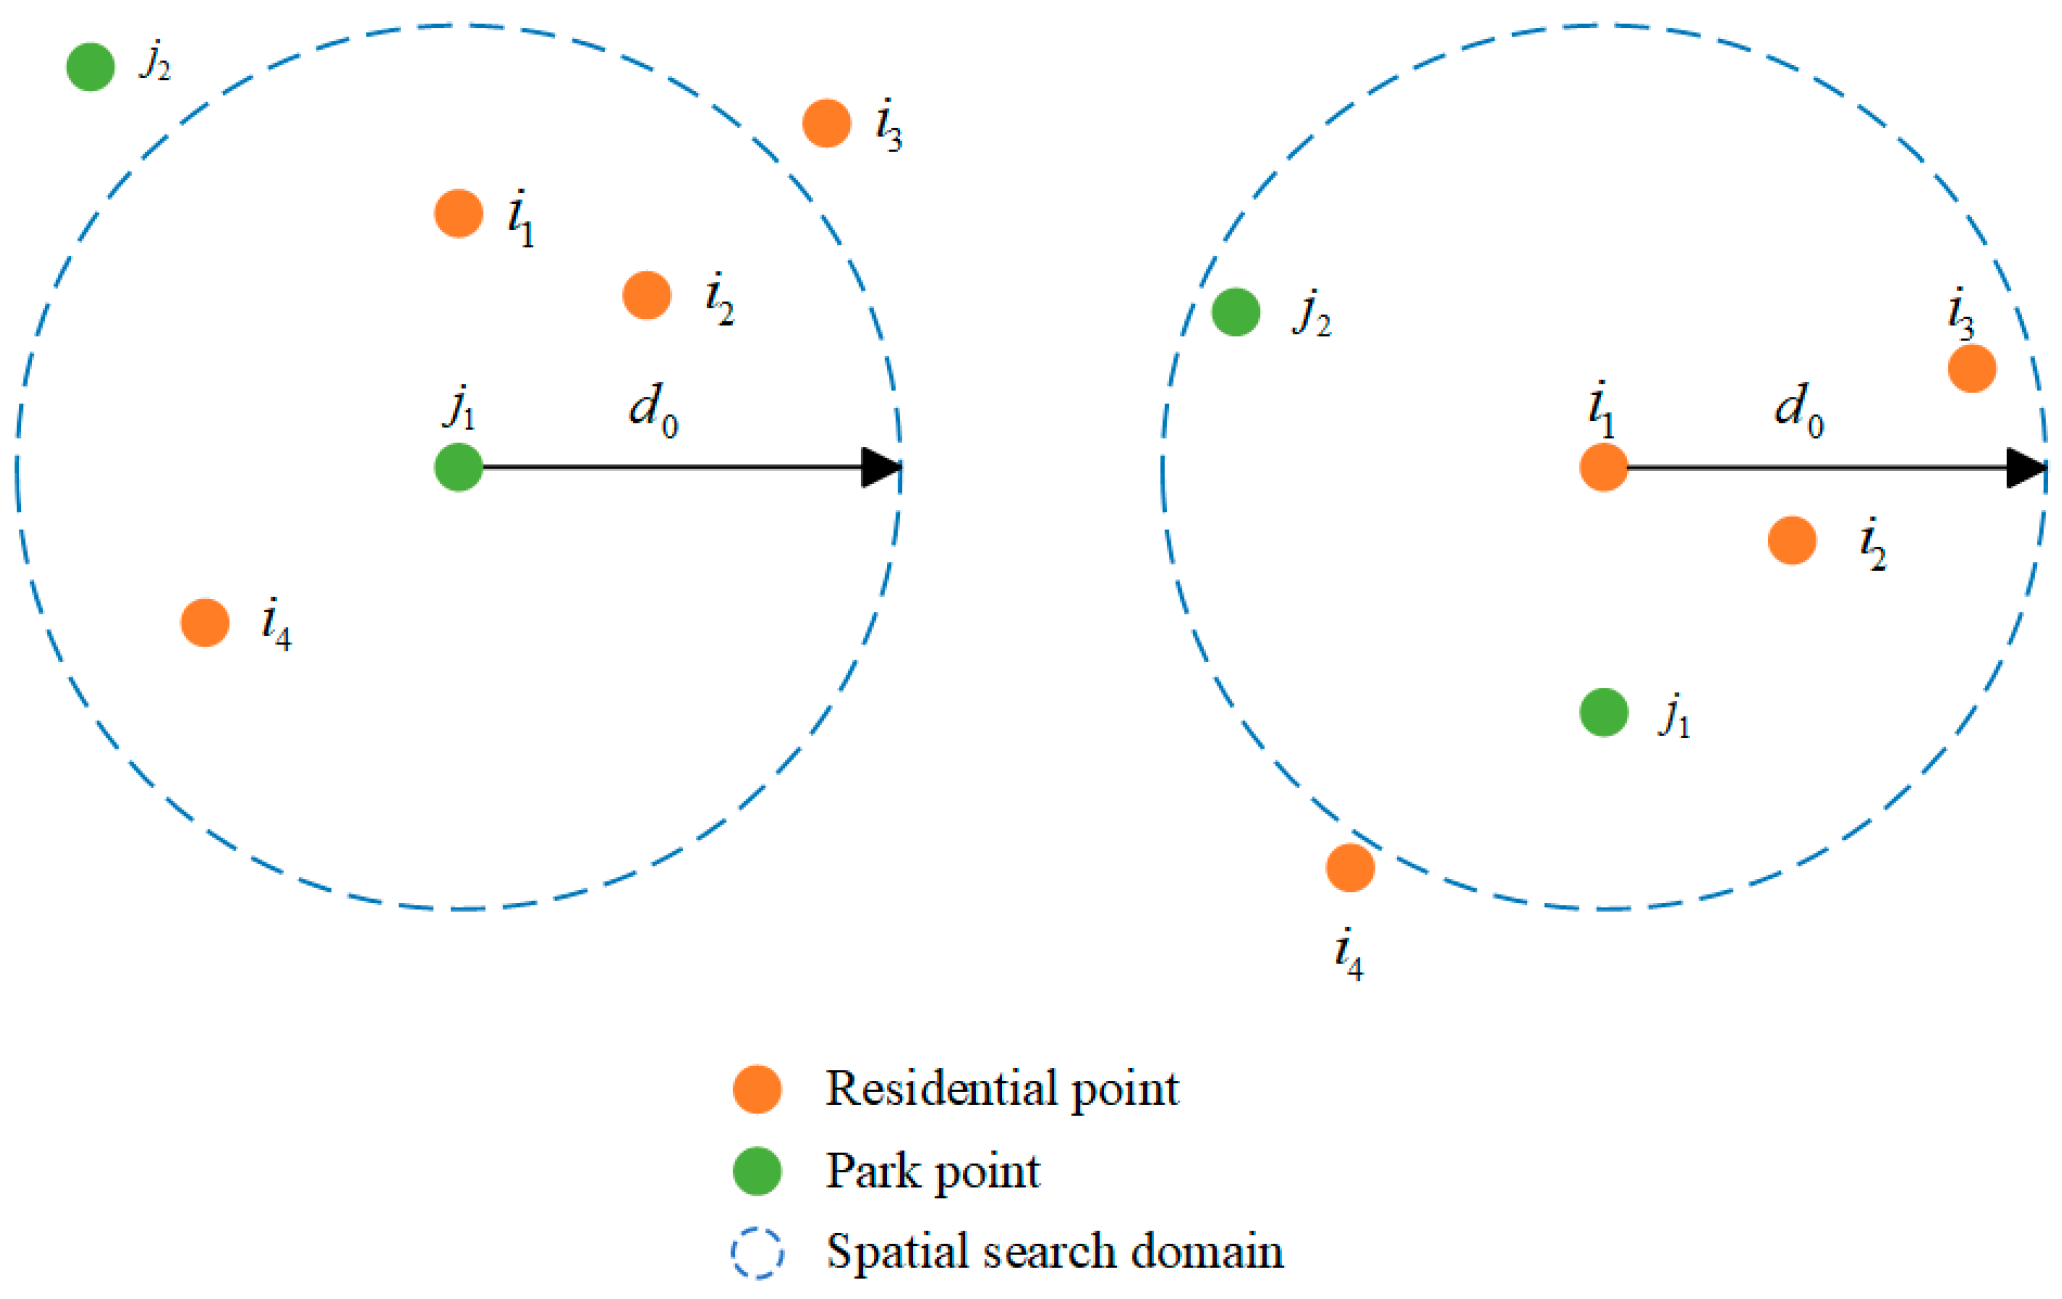
Two-step floating catchment area (2SFCA) is an important method for studying the accessibility of public service facilities [31], measuring accessibility by analyzing the spatial distribution of supply and demand points and their interactions [32]. Figure 3 illustrates the principle of the 2SFCA method.
The Gaussian 2SFCA considers distance attenuation, whether urban parks and green spaces are fully utilized, the services of different levels of urban parks and green spaces, and the changes in accessibility of urban parks and green spaces with distance based on the traditional 2SFCA search method. Its results are more reliable the calculation formula is as follows:
Firstly, calculate the supply-demand ratio [33]:
R j = S j i k D i × G ( d i j ) , i d i j d 0
where R j is the supply-demand ratio; S j is the service capacity of the PGS, which is referred to here by the area of the PGS, and d 0 is the radius of the search; d i j is the distance between the demand point and the supply point, and D i is the scale of the demand of the community within the search range ( d i j d 0 ), which is expressed in terms of the number of population; G ( d i j ) is the distance attenuation function, as the willingness of the residents to use the PGS decreases with the increase in the distance. The distance decay function formula considering spatial friction is as follows:
G ( d i j ) = exp [ ( 1 2 ) × ( d i j d 0 ) 2 ] 1 exp ( 1 2 ) , d i j d 0 0 , d i j d 0
The reachability formula is as follows:
a i = i m R j × G ( d i j ) , i d i j d 0
where a i is accessibility of each settlement point; m is the number of [34] parklands falling within the interval centered on i and with d 0 as the radius of the search [35].

2.3.3. Lorenz Curve and Gini Coefficient

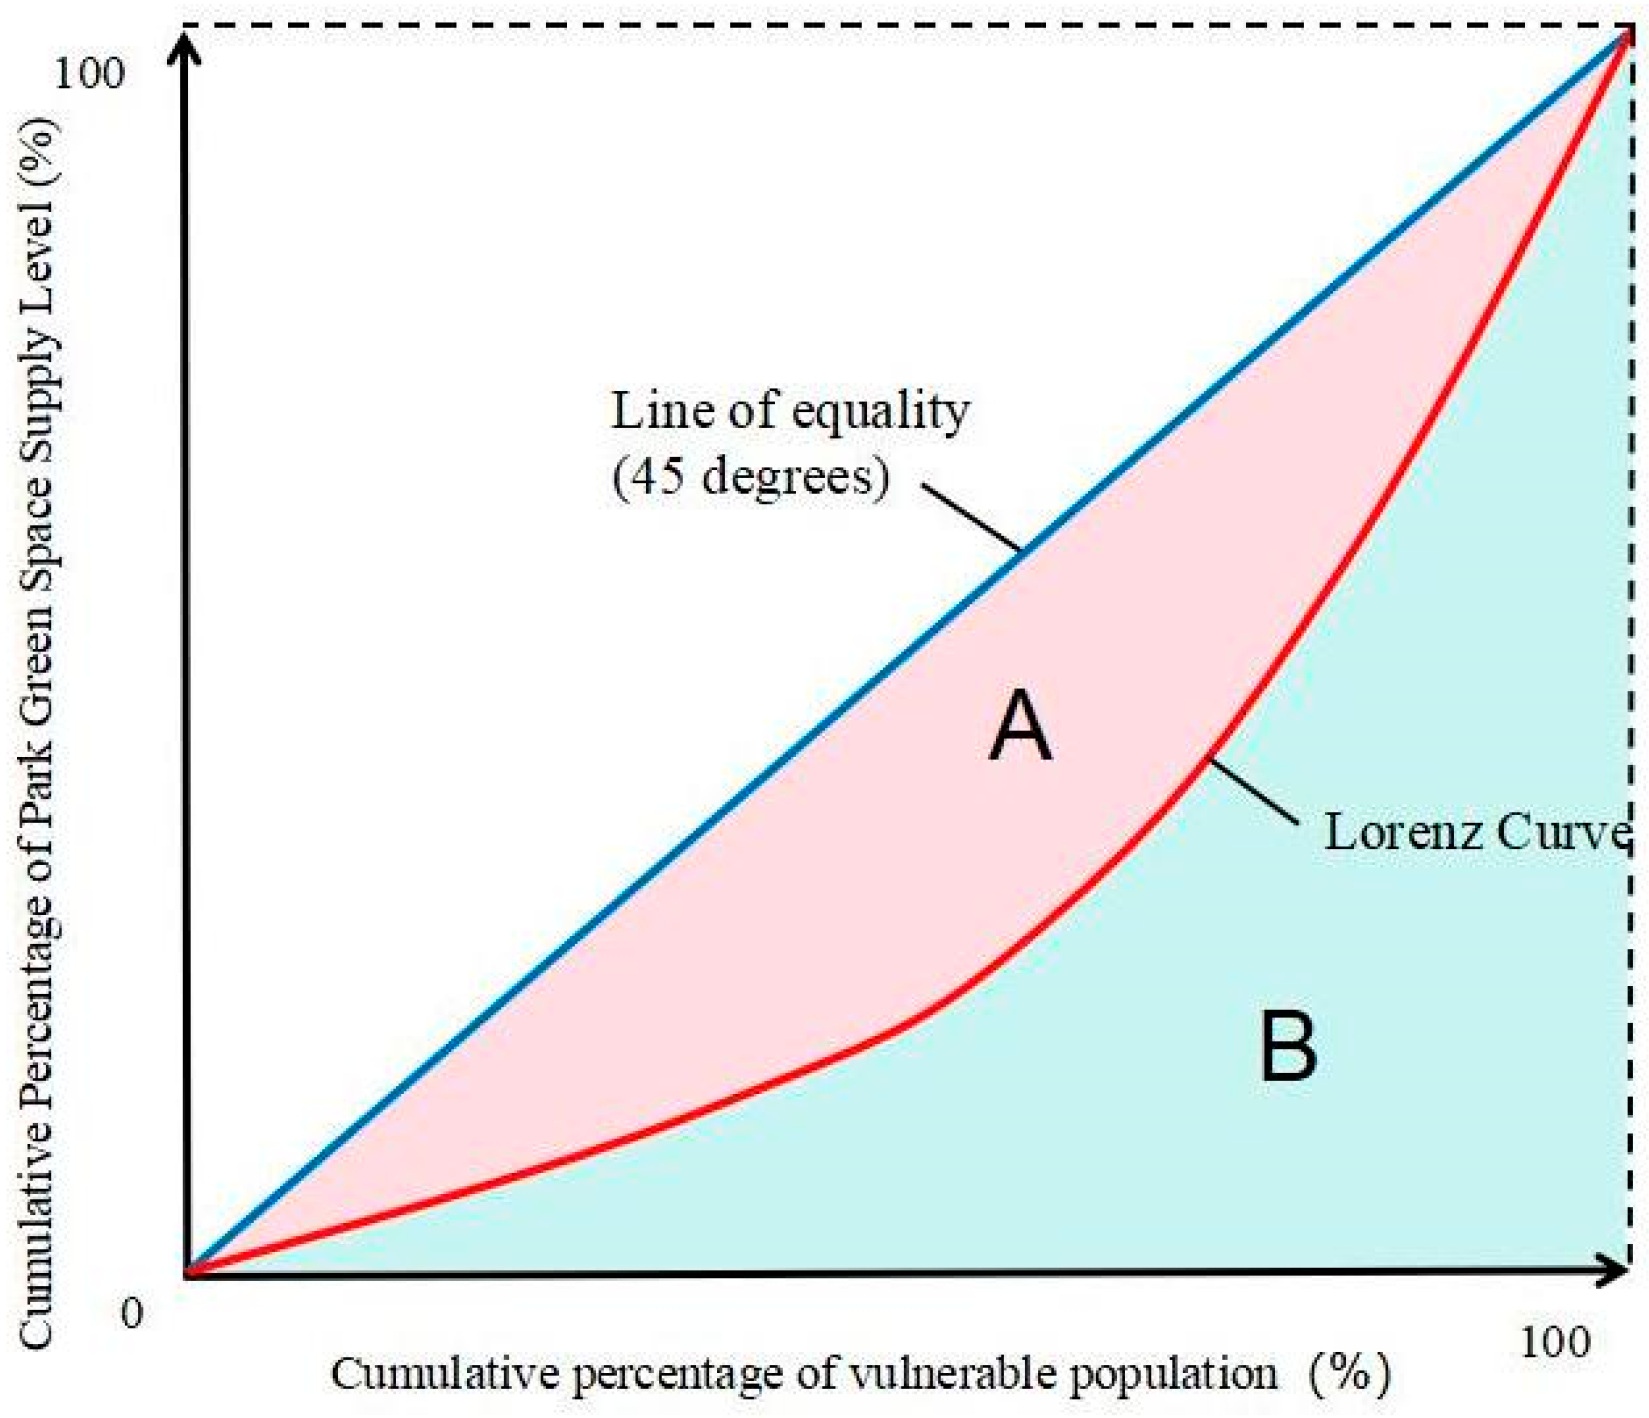
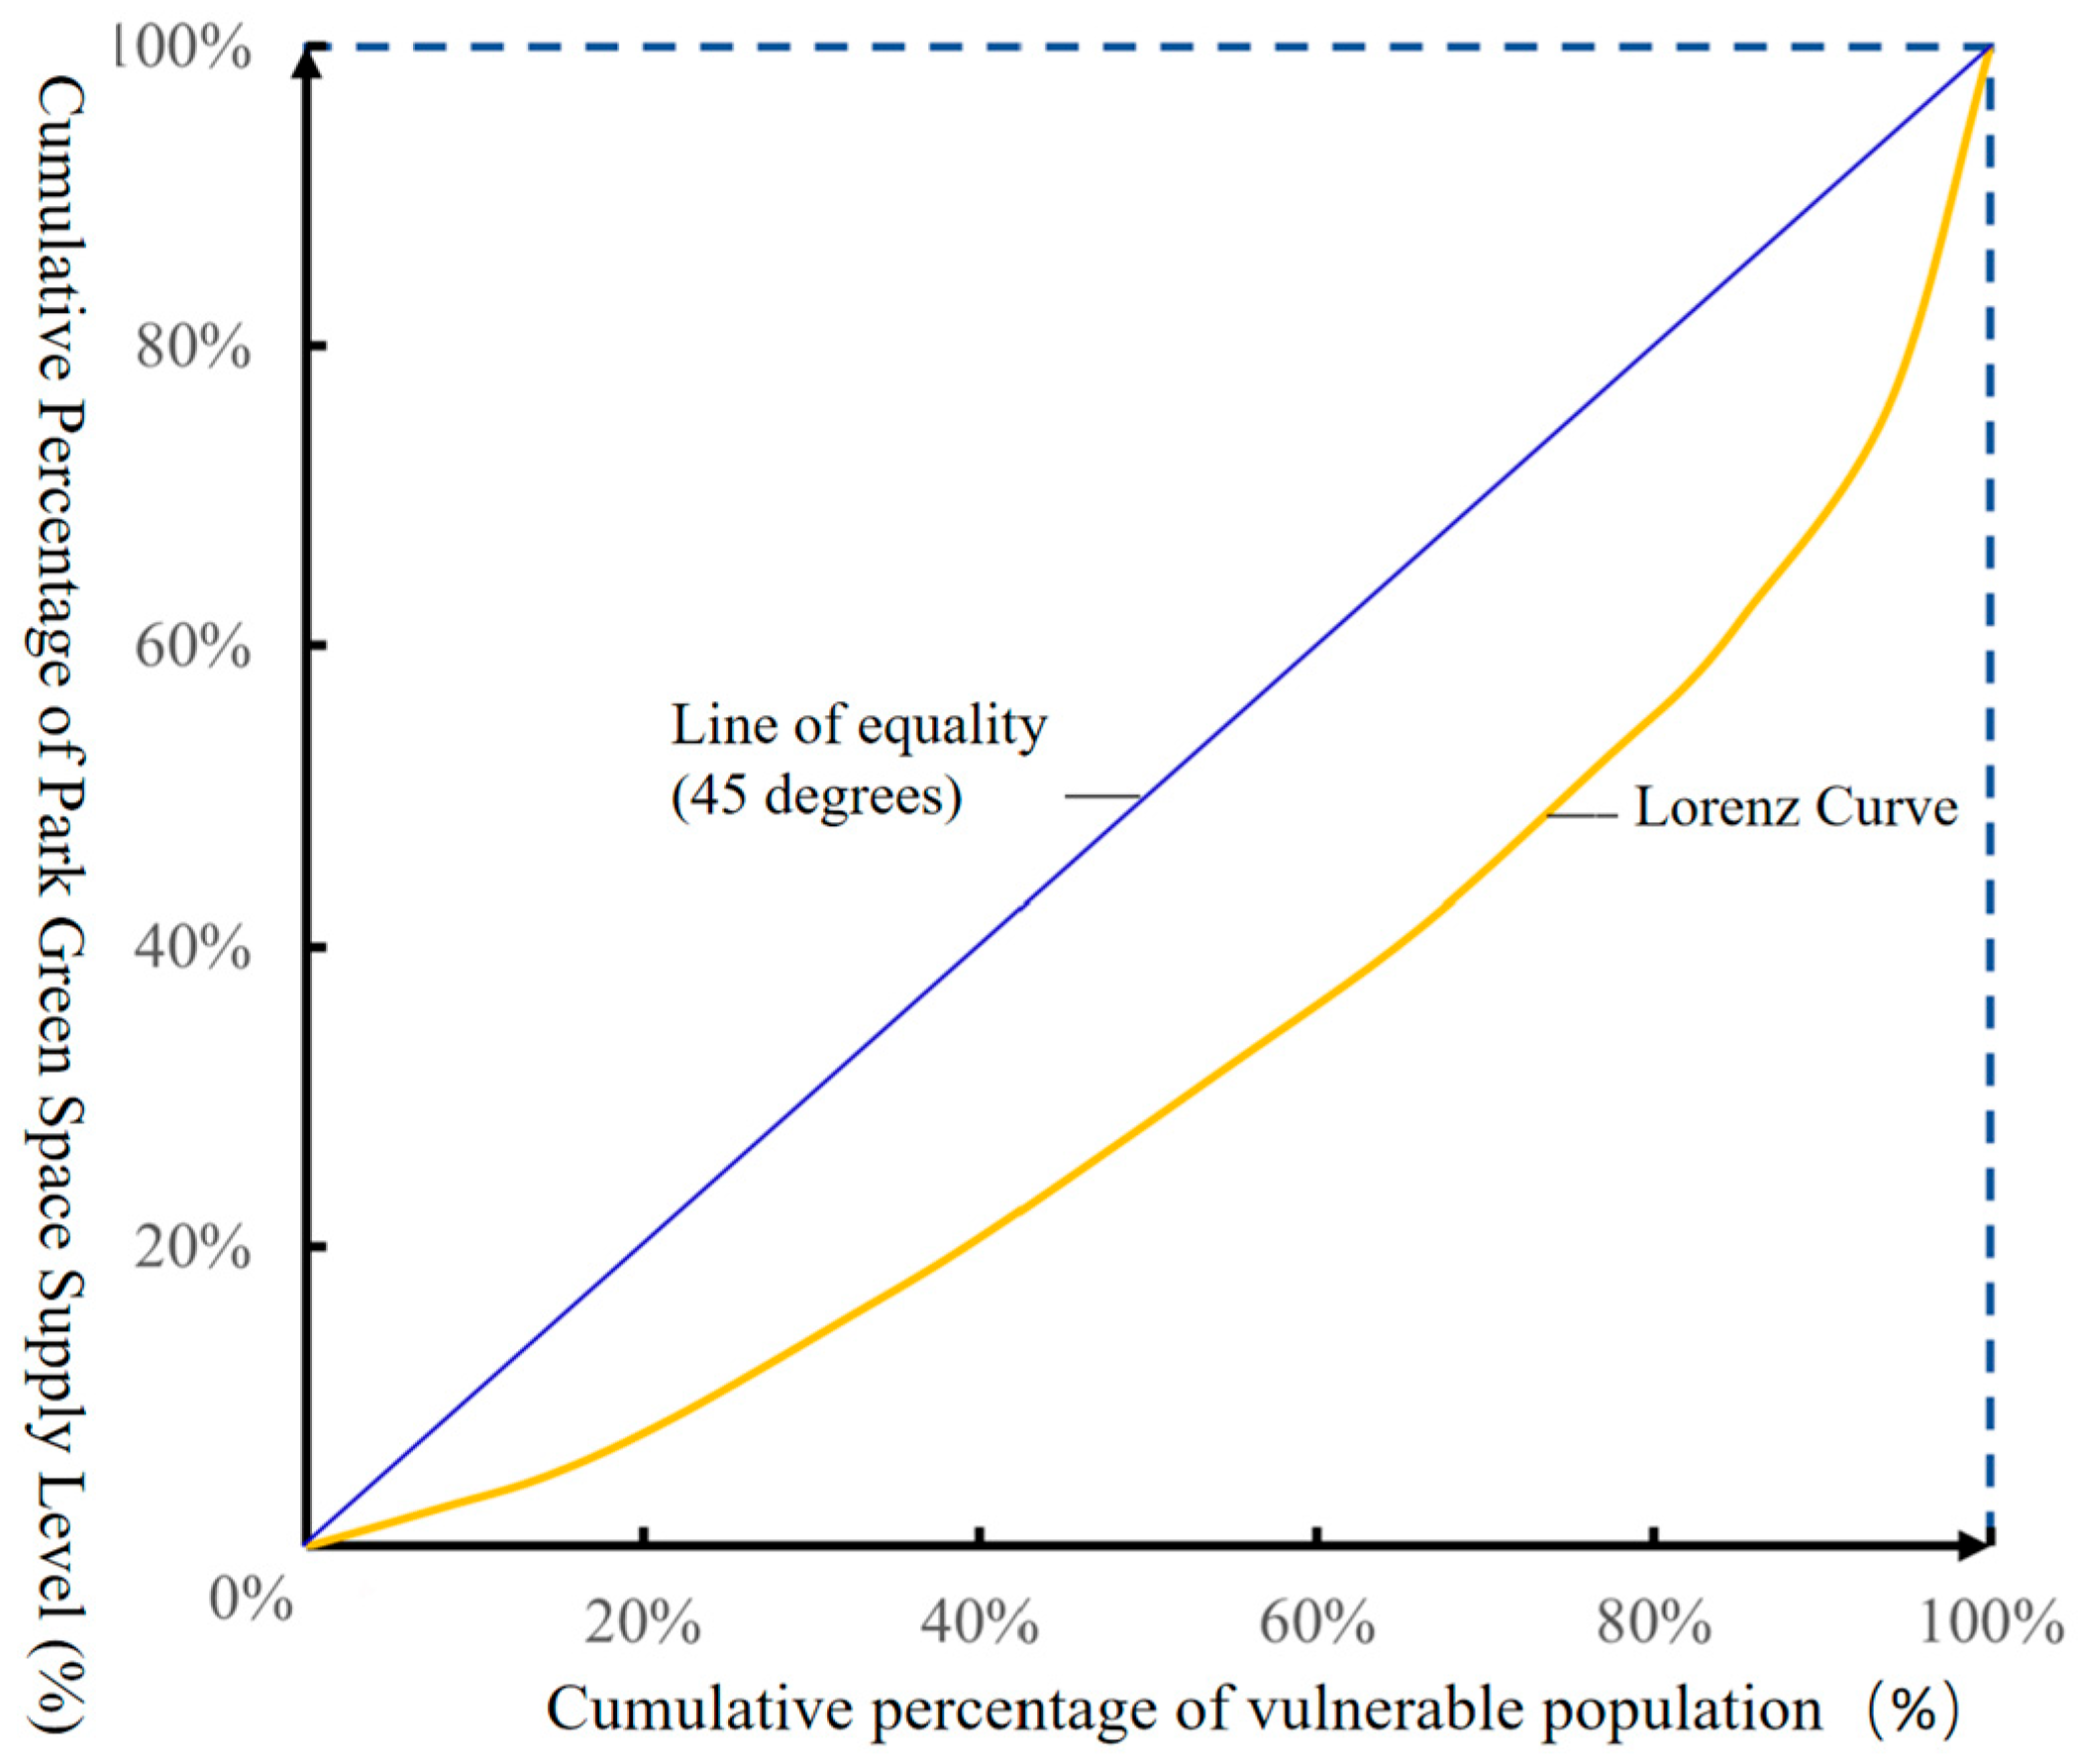
The Lorenz curve is a mathematical model for analyzing the balance of social resource distribution proposed by the American statistician Lorenz [36], which is widely used to analyze the fairness of the distribution of national income [37], and the graph of the Lorenz curve is demonstrated in Figure 4. In the study of environmental equity, the Lorenz curve is usually used to evaluate the overall fairness level of the object. The Gini coefficient, on the other hand, is derived from the Lorenz curve, i.e., the ratio of the area between the Lorenz curve and the absolute fairness line to the overall area under the absolute fairness line, and is used to quantify the level of inequality [38]. In this study, the Lorenz curve and the Gini coefficient are used to analyze the distribution of PGS resources among different age groups in Jinan City. Assuming that the area between the Lorenz curve and the absolute equality line is A , and the area between the Lorenz curve and the horizontal axis of the coordinates is B , the Gini coefficient of supply and demand for the comprehensive service level of urban PGS can be expressed by the formula [10]:
G i n i       C o e f f i c i e n t = A ( A + B )
A Gini coefficient below 0.2 indicates a highly balanced distribution of PGS resources; 0.2 to 0.3 is considered relatively balanced; 0.3 to 0.4 is considered relatively balanced; 0.4 to 0.5 is considered seriously unbalanced; when the Gini coefficient exceeds 0.5, it indicates that there is a wide gap in the distribution of PGS resources, which is highly unbalanced [39,40].

2.3.4. Coupling and Coordination Degree Model

The term “coupling” originated in physics to describe the interaction of two or more systems. The coupling degree (CD) is a measure of the level of interaction between two or more systems [41], and its value ranges from (0,1). The higher the degree of coupling, the stronger the dependence between the system. The coupling coordination degree model (CCDM) is often used to assess the state of holistic and synergistic development between two or more systems [42]. There is a phenomenon of errors in the results and interpretation of the coupling coordination degree due to ignoring the range of coupling degree values in the research. Wang, et al. summarized the misconceptions of the coupling coordination degree model used in the domestic research, and proposed a correction method [18]. This study adopts the coupling degree formula corrected based on the error in the value range of the formula, which is as follows:
C = n × U 1 × U 2 × × U n 1 n ( U 1 + U 2 + + U n )
where C is the coupling degree of the system, U i is the value of the development level of the system [43]. Assuming that the importance of each subsystem is the same, the same value is assigned to each system weight a, i.e., α 1 = α 2 = = α n = 1 n , and the value of the overall development level of the system, T, is calculated by the arithmetic weighting method [44], with the following formula:
T = α 1 U 1 + α 2 U 2 + + α n U n
The formula for the degree of coupling coordination, derived by combining the degree of coupling and the level of development of the system [45], is as follows:
D = C × T

2.4. Methodological Workflow

To thoroughly evaluate the equality of urban parks and green spaces from spatial and social perspectives, we employed a multi-step methodological approach. At the spatial level, the demand (urban sustainability indicators) and supply (in terms of quality, quantity, and accessibility) of urban green spaces were measured. At the social level, the assessment starts with the Gini coefficient. The measures were then combined to achieve the research goal of thoroughly evaluating the fairness of PGS resource distribution in the case study area.

2.4.1. Acquisition and Classification of PGS

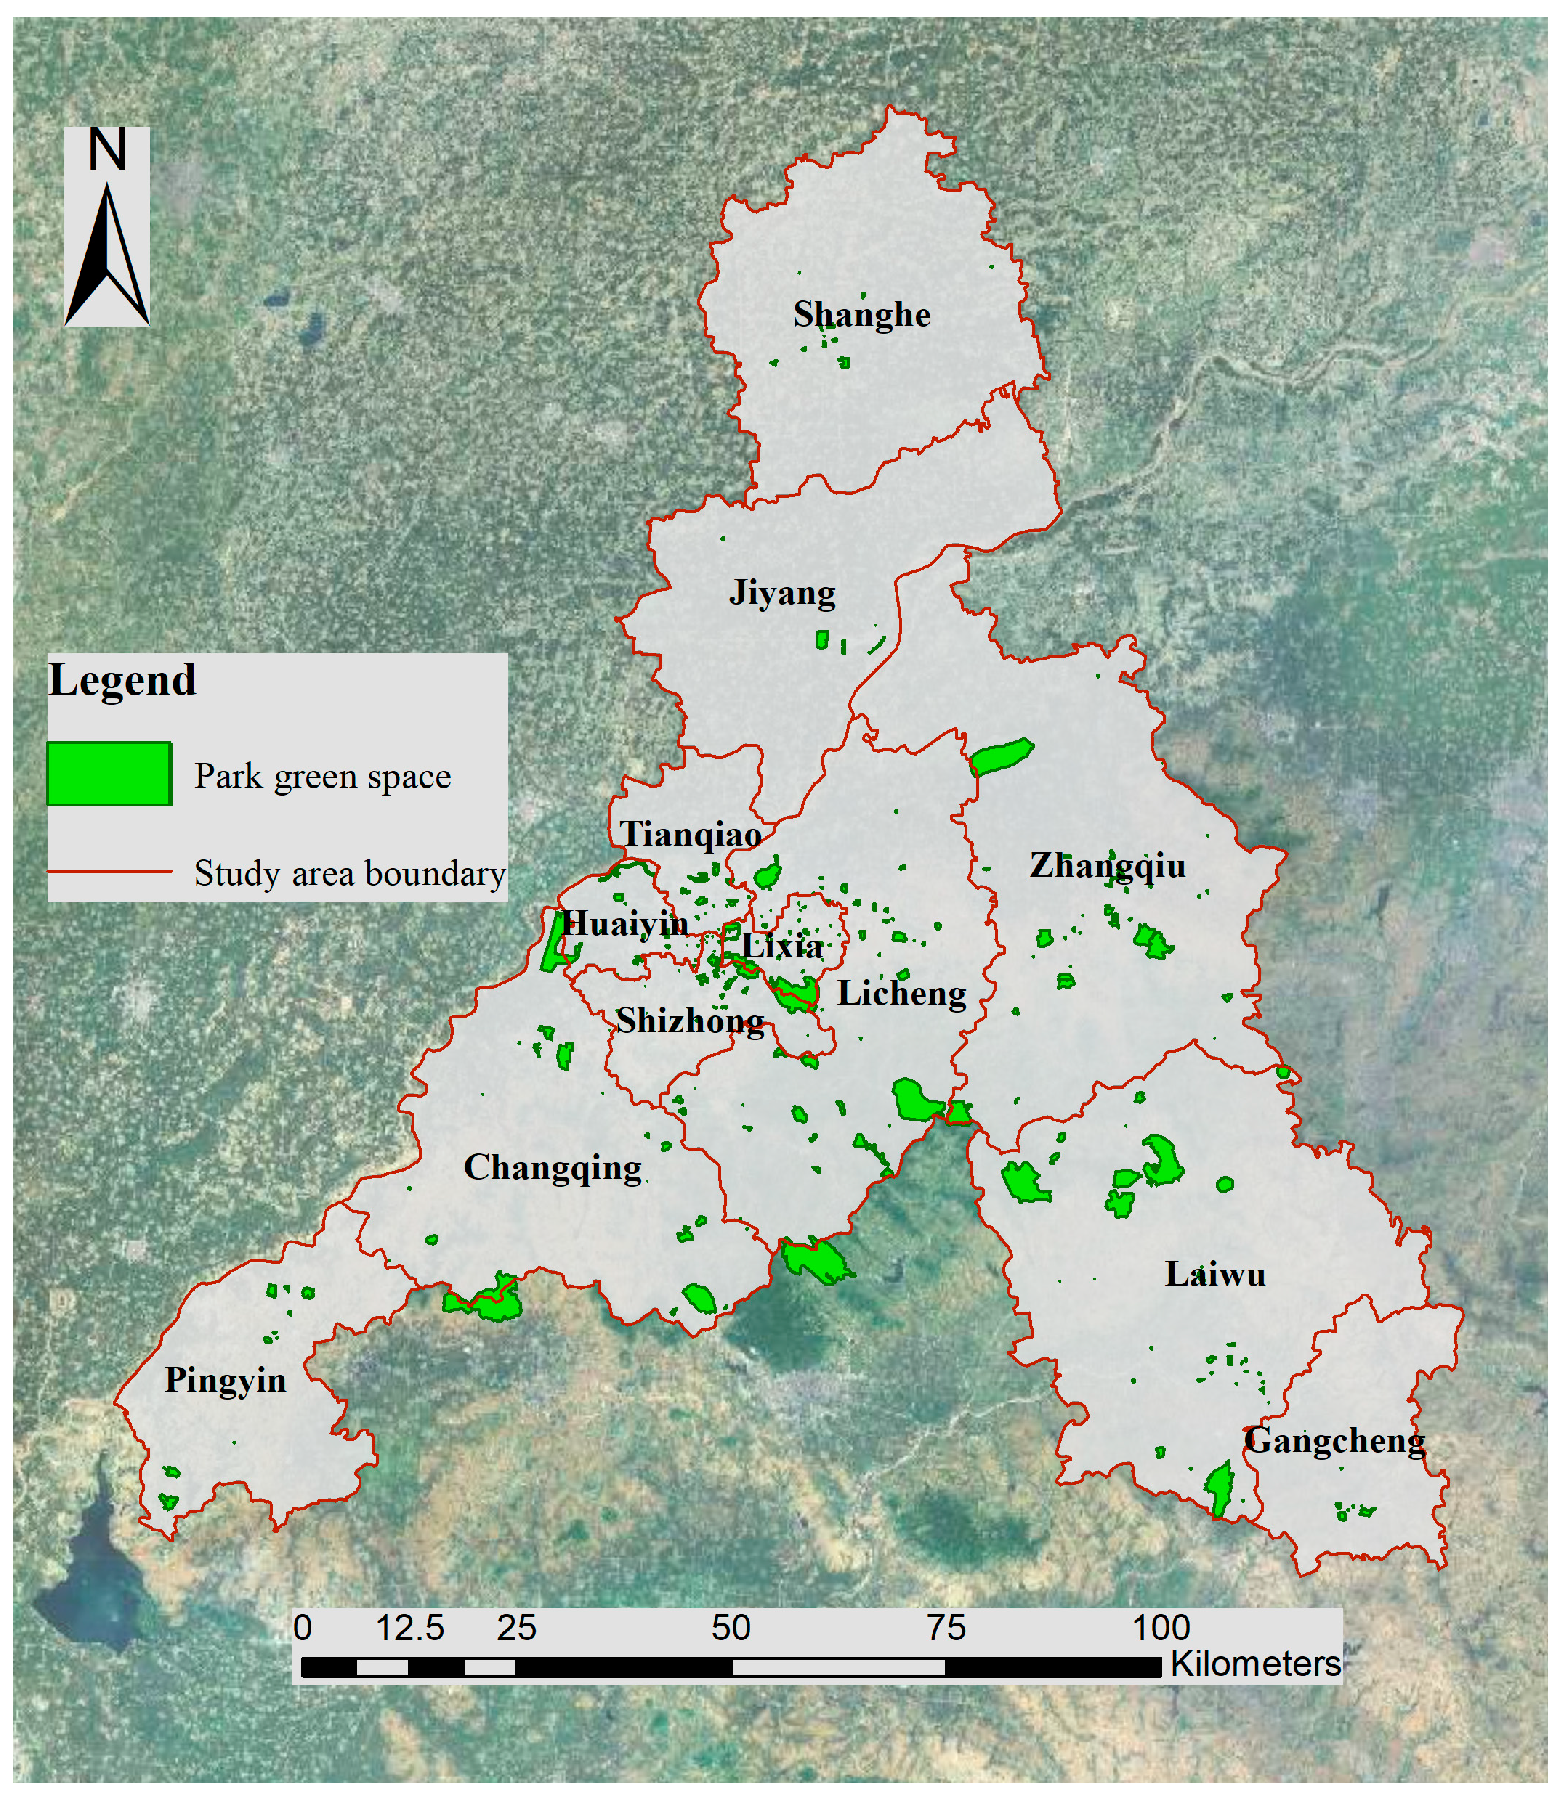
The AOI of the tourist attraction category is used as the original data of the park boundary by referring to the Jinan City Park List (the first batch) (http://www.shandong.gov.cn/jpaas-jpolicy-web-server/front/info/detail?iid=523ae6c69075425ebda62b557190cdb7 (accessed on 18 August 2025)), which was released by the Jinan City Bureau of Gardening and Forestry and Greening in 2021, along with the screening and addition of high-resolution remote sensing imagery of Jinan City, resulting in a total of 300 parks (Figure 5).
As per the classification criteria outlined in the Standard for planning of urban green space (2019) [46], parks are categorized into four types: comprehensive parks, community parks, specialized parks, and specialized parks, with the service radius expanding in accordance with the park’s size. This study establishes the classification criteria, as presented in Table 2, based on the aforementioned criteria and the attributes of parks in Jinan.
Figure 6 illustrates the numerical and area statistics of different park categories in Jinan City. The comprehensive parks constitute the largest proportion, serving as the primary venues for recreation and leisure for residents. Specialized parks, which include botanical gardens, zoos, and other function-specific parks, rank second. Community parks, designed for residents’ daily relaxation, exhibit moderate numbers and areas. And playgrounds are characterized by their limited numbers and areas.

2.4.2. Demand Level Quantification

This paper utilizes an evaluation method for urban sustainable development, informed by geo-big data [20,47], and integrates existing data and the urban development characteristics of Jinan. Guided by Sustainable Development Goal 11 (SDG11), an urban sustainable development index system was constructed to characterize residents’ demand for PGS. We chose seven indicators to show aspects of housing, urban development, cultural preservation, and environmental quality. These include the housing price-to-income ratio, the percentage of vulnerable people, and the PM2.5 concentration (Table 3).

2.4.3. Supply Level Measurement

PGS supply was evaluated through three dimensions:
1.
Quantity indicator
PGS is an urban land use with vegetation as the main form of existence, which has the roles of ecology, environment, recreation, and beautification [45]. In this study, the PGS quantity indicators were set from the characteristics of the park and the residents’ use of the park, respectively. Indicators including park count, total area, per capita PGS location entropy, and per capita service location entropy were quantified, with weights determined via the entropy method.
2.
Quality indicator
The quality of PGS pertains to the dimensions, shape, and inherent ecological functions inside the green space [21]. The greater the fragmentation of green spaces, the more detrimental the ecological and social service functions [53]. The Landscape Pattern Index can effectively convey extensive information regarding landscape patterns. It serves as both a visual representation of the compositional and spatial attributes of landscape structures and a succinct quantitative metric that enables rapid and precise comprehension and analysis of landscape complexity and diversity [54]. Nine distinct landscape indices were chosen for quantitative analysis to represent the evolving aspects of landscape structure, as illustrated in Table 4.
3.
Accessibility indicator
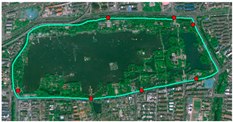
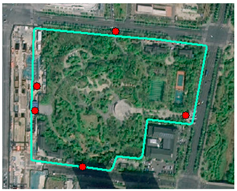
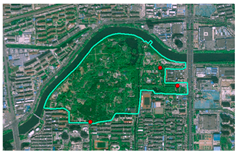
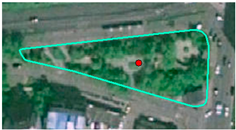
The accessibility of parks can be used to measure the ease of access to green resources for residents [55], which also reflects the supply capacity of parks and green spaces. In this study, the 2SFCA method was used to calculate the accessibility of PGS in each district (county) of Jinan. Taking park gates as supply points, this study used the Gaode map coordinate picking tool to obtain the geographic coordinates of these points. Parks that are not marked on the Gaode map but have an area of more than 1 hectare are located with reference to remote sensing imagery and road network data, while those with an area of less than 1 hectare are replaced by the center of mass. Table 5 shows the boundaries and gates of various types of parks.
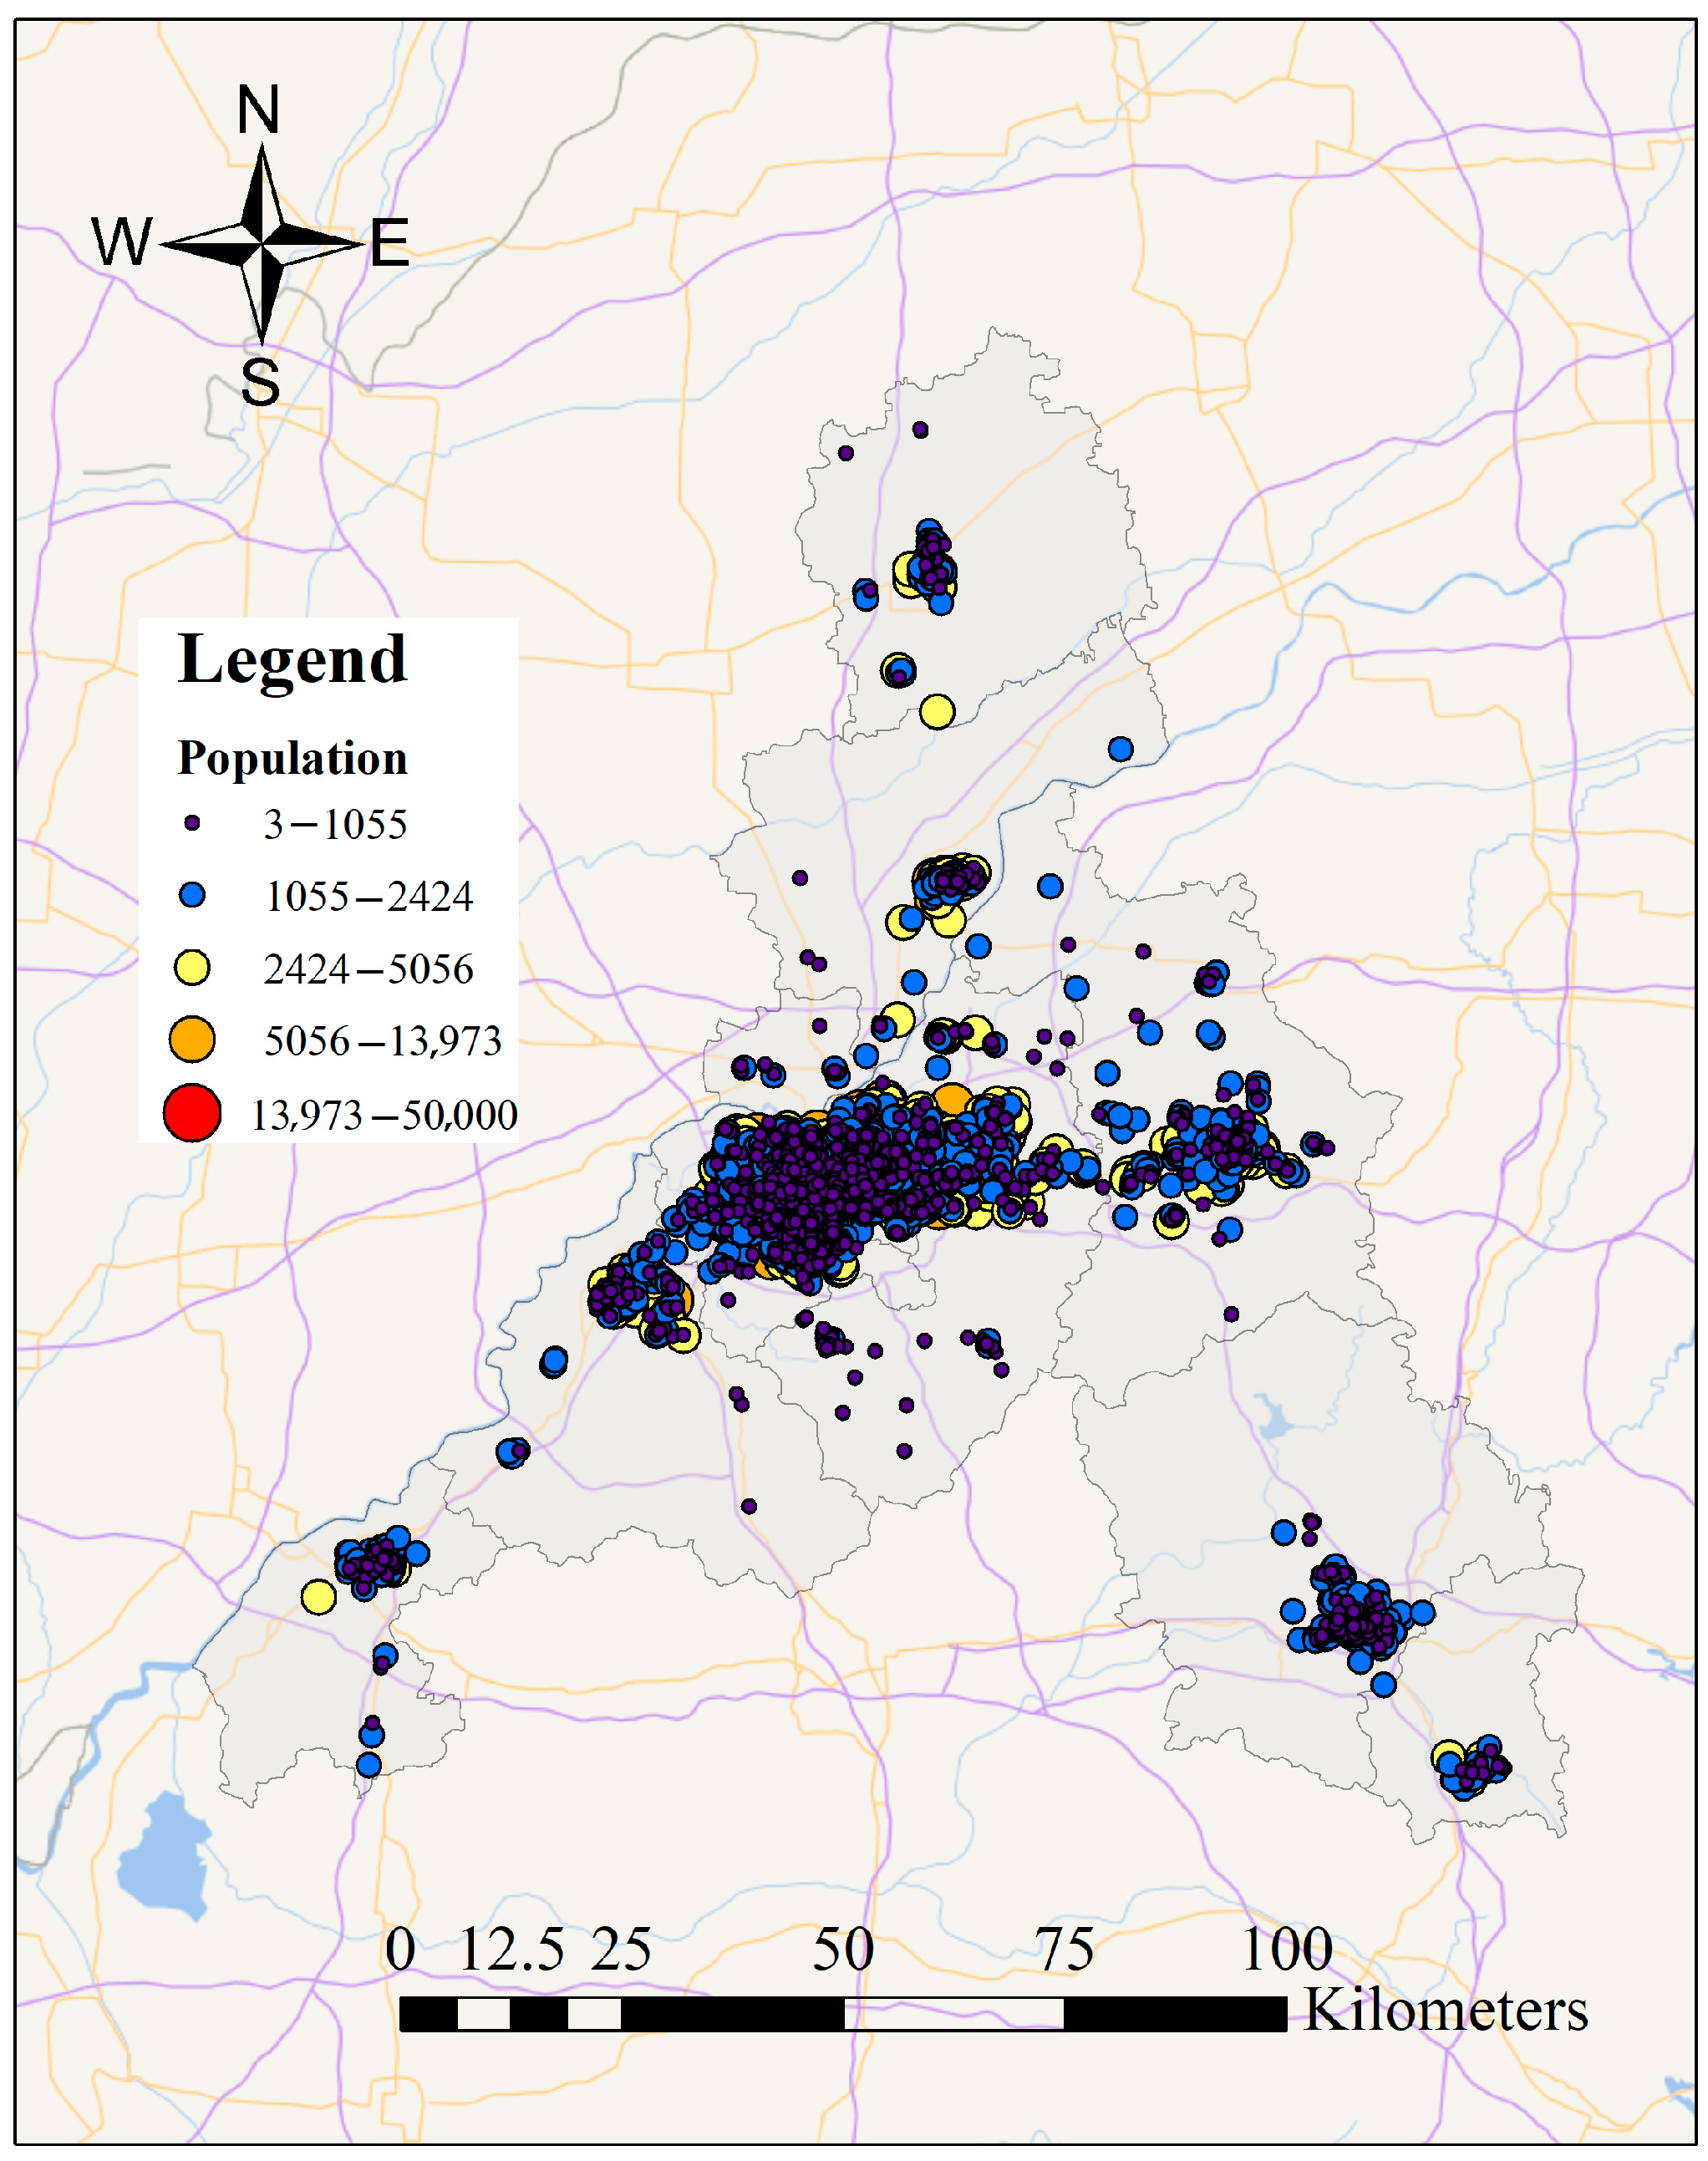
This study used apartment complex locations as demand points (Figure 7). The 2SFCA must take advantage of the population size of cell points; however, despite the high utility of population raster data like WorldPOP and LandScan, their spatial resolutions (100 m × 100 m and 1 km × 1 km, respectively) are insufficient for micro-scale applications such as apartment complex points. This study acquires residential neighborhood data in Jinan City, encompassing the name, location, and household count of residential neighborhoods via online data sources. The population of each neighborhood point is computed based on the “number of households” (persons per household) from the seventh census data.
Using the processed road network data, a network dataset is constructed, and an OD cost matrix from the new park gate to the residential area point is created. The starting and ending points are imported, and the service range is set according to the service radius of various parks. After solving, the supply and demand ratio is obtained by inputting it into the formula. Similarly, establish an OD cost matrix from the community to the park and calculate the distance attenuation coefficient. By inputting the supply-demand ratio and attenuation coefficient obtained above into the accessibility formula, the accessibility of PGS in each residential area can be determined. After conducting zoning statistics, the accessibility of parks and green spaces in each district (county) was obtained.

3. Results

3.1. PGS Demand Analysis

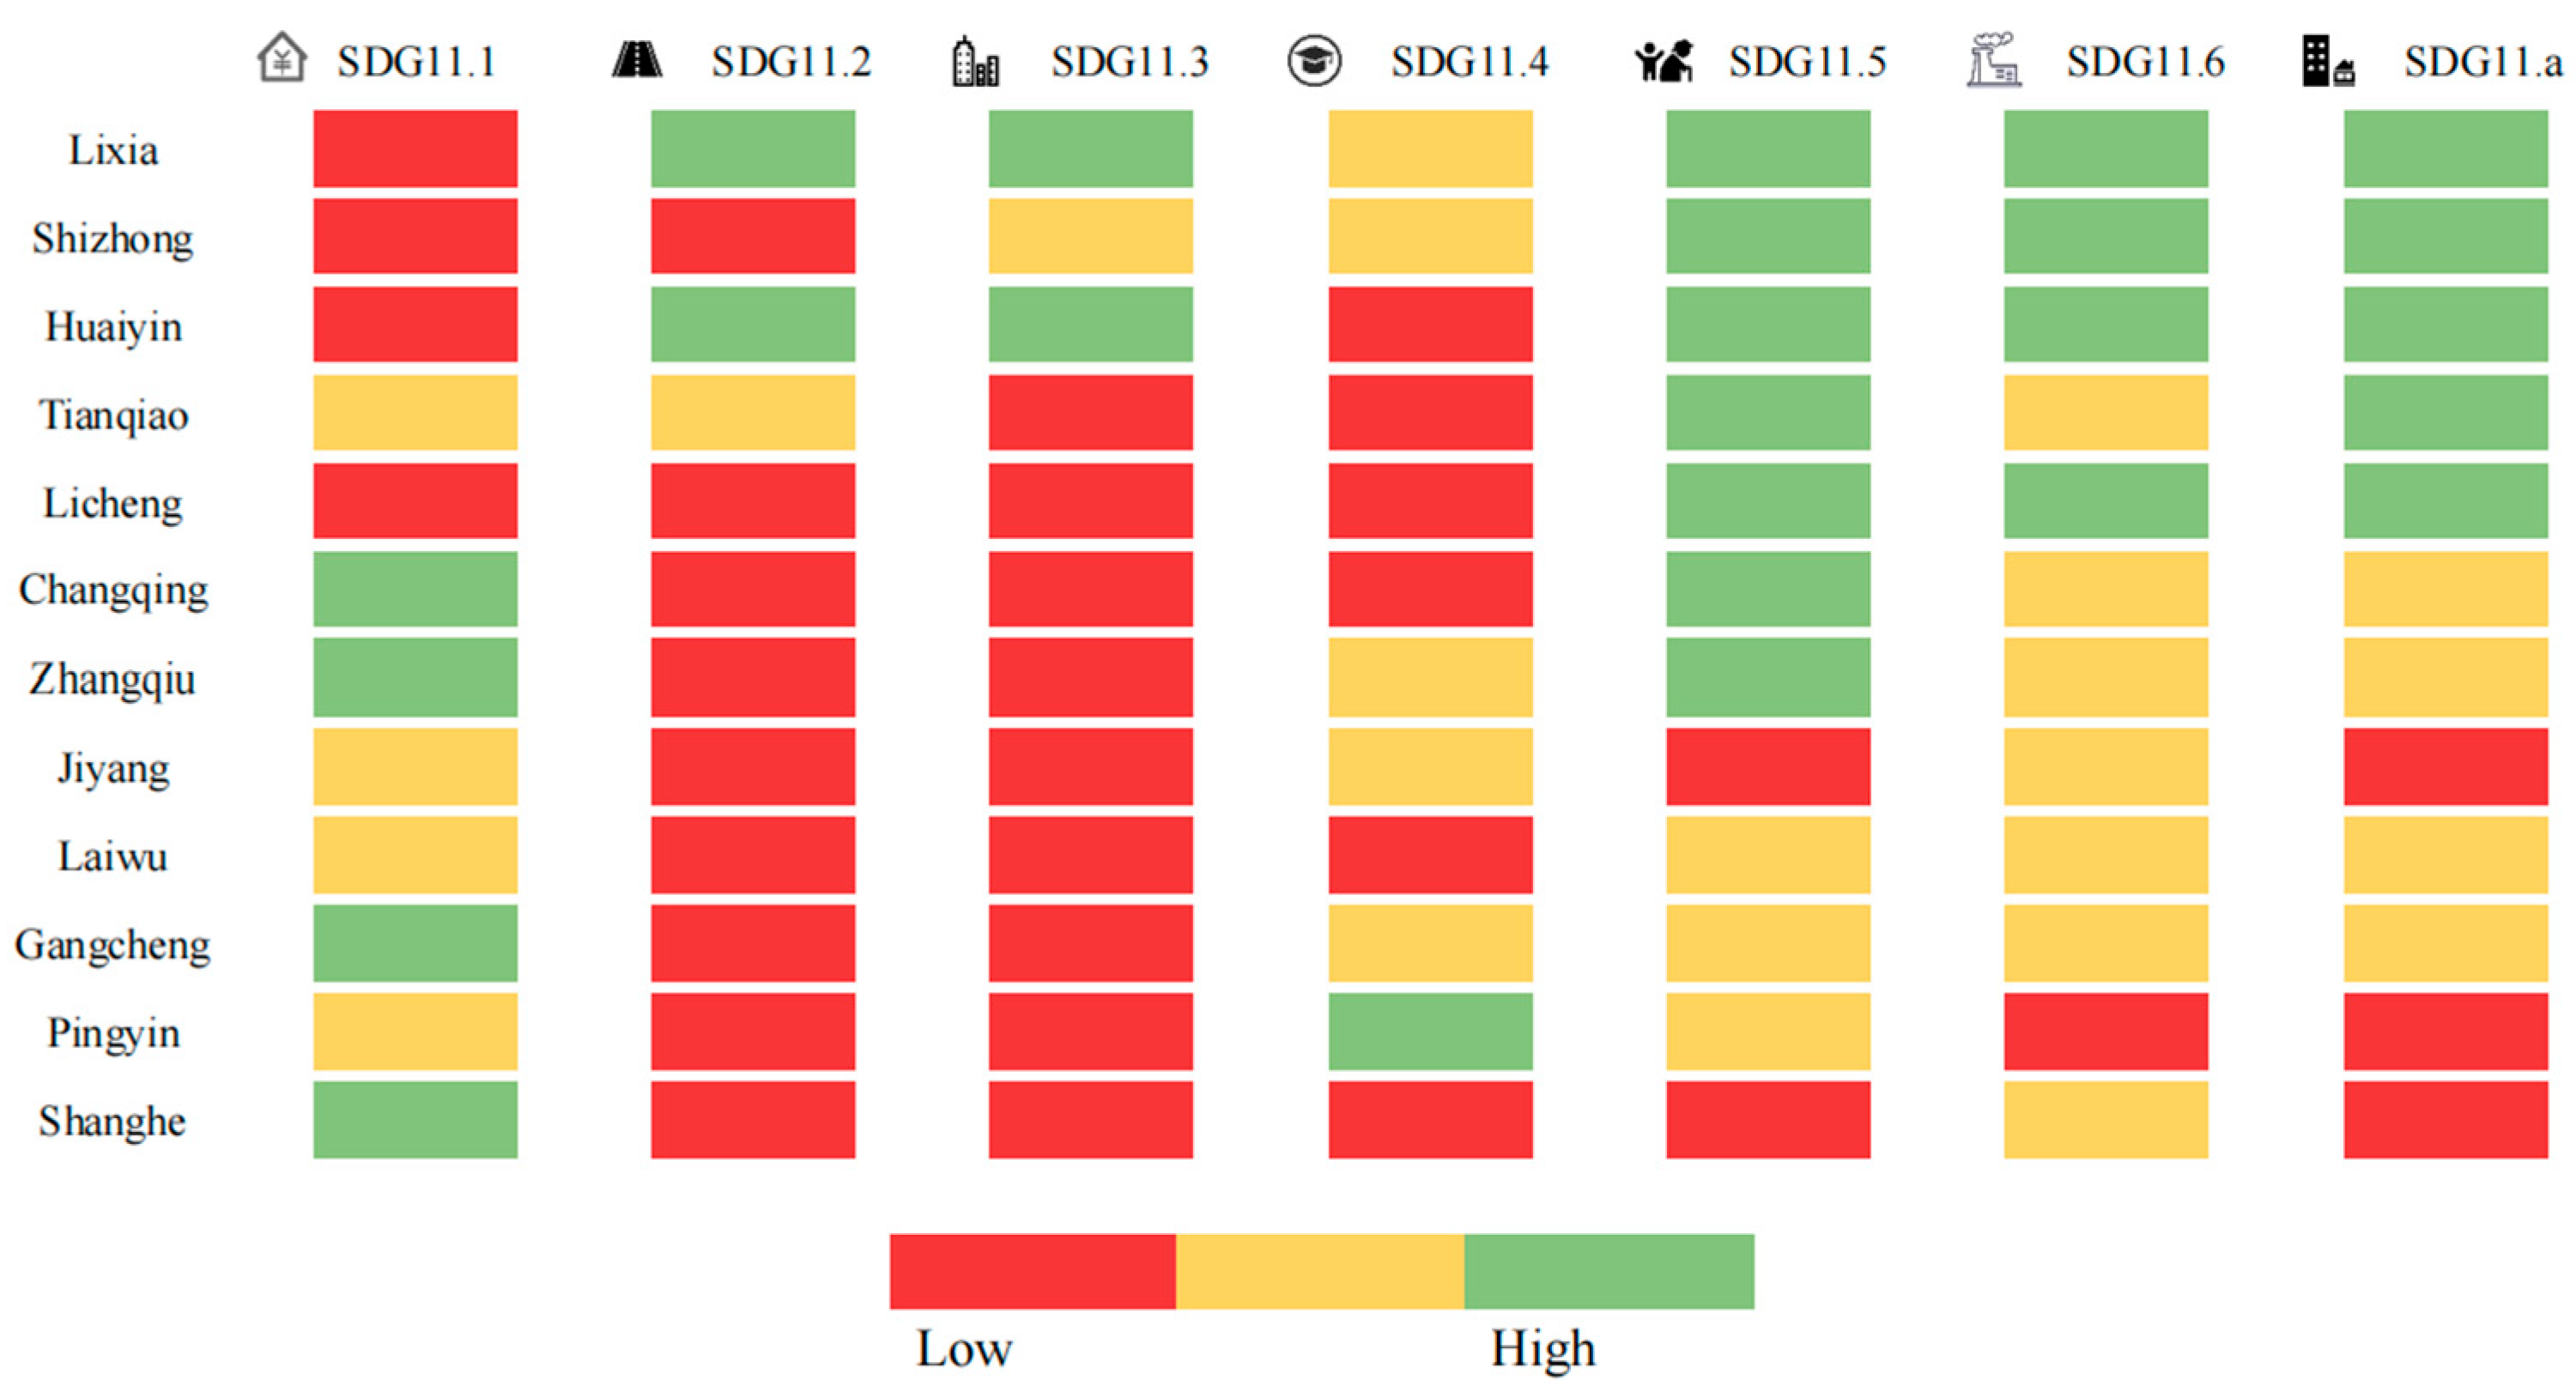
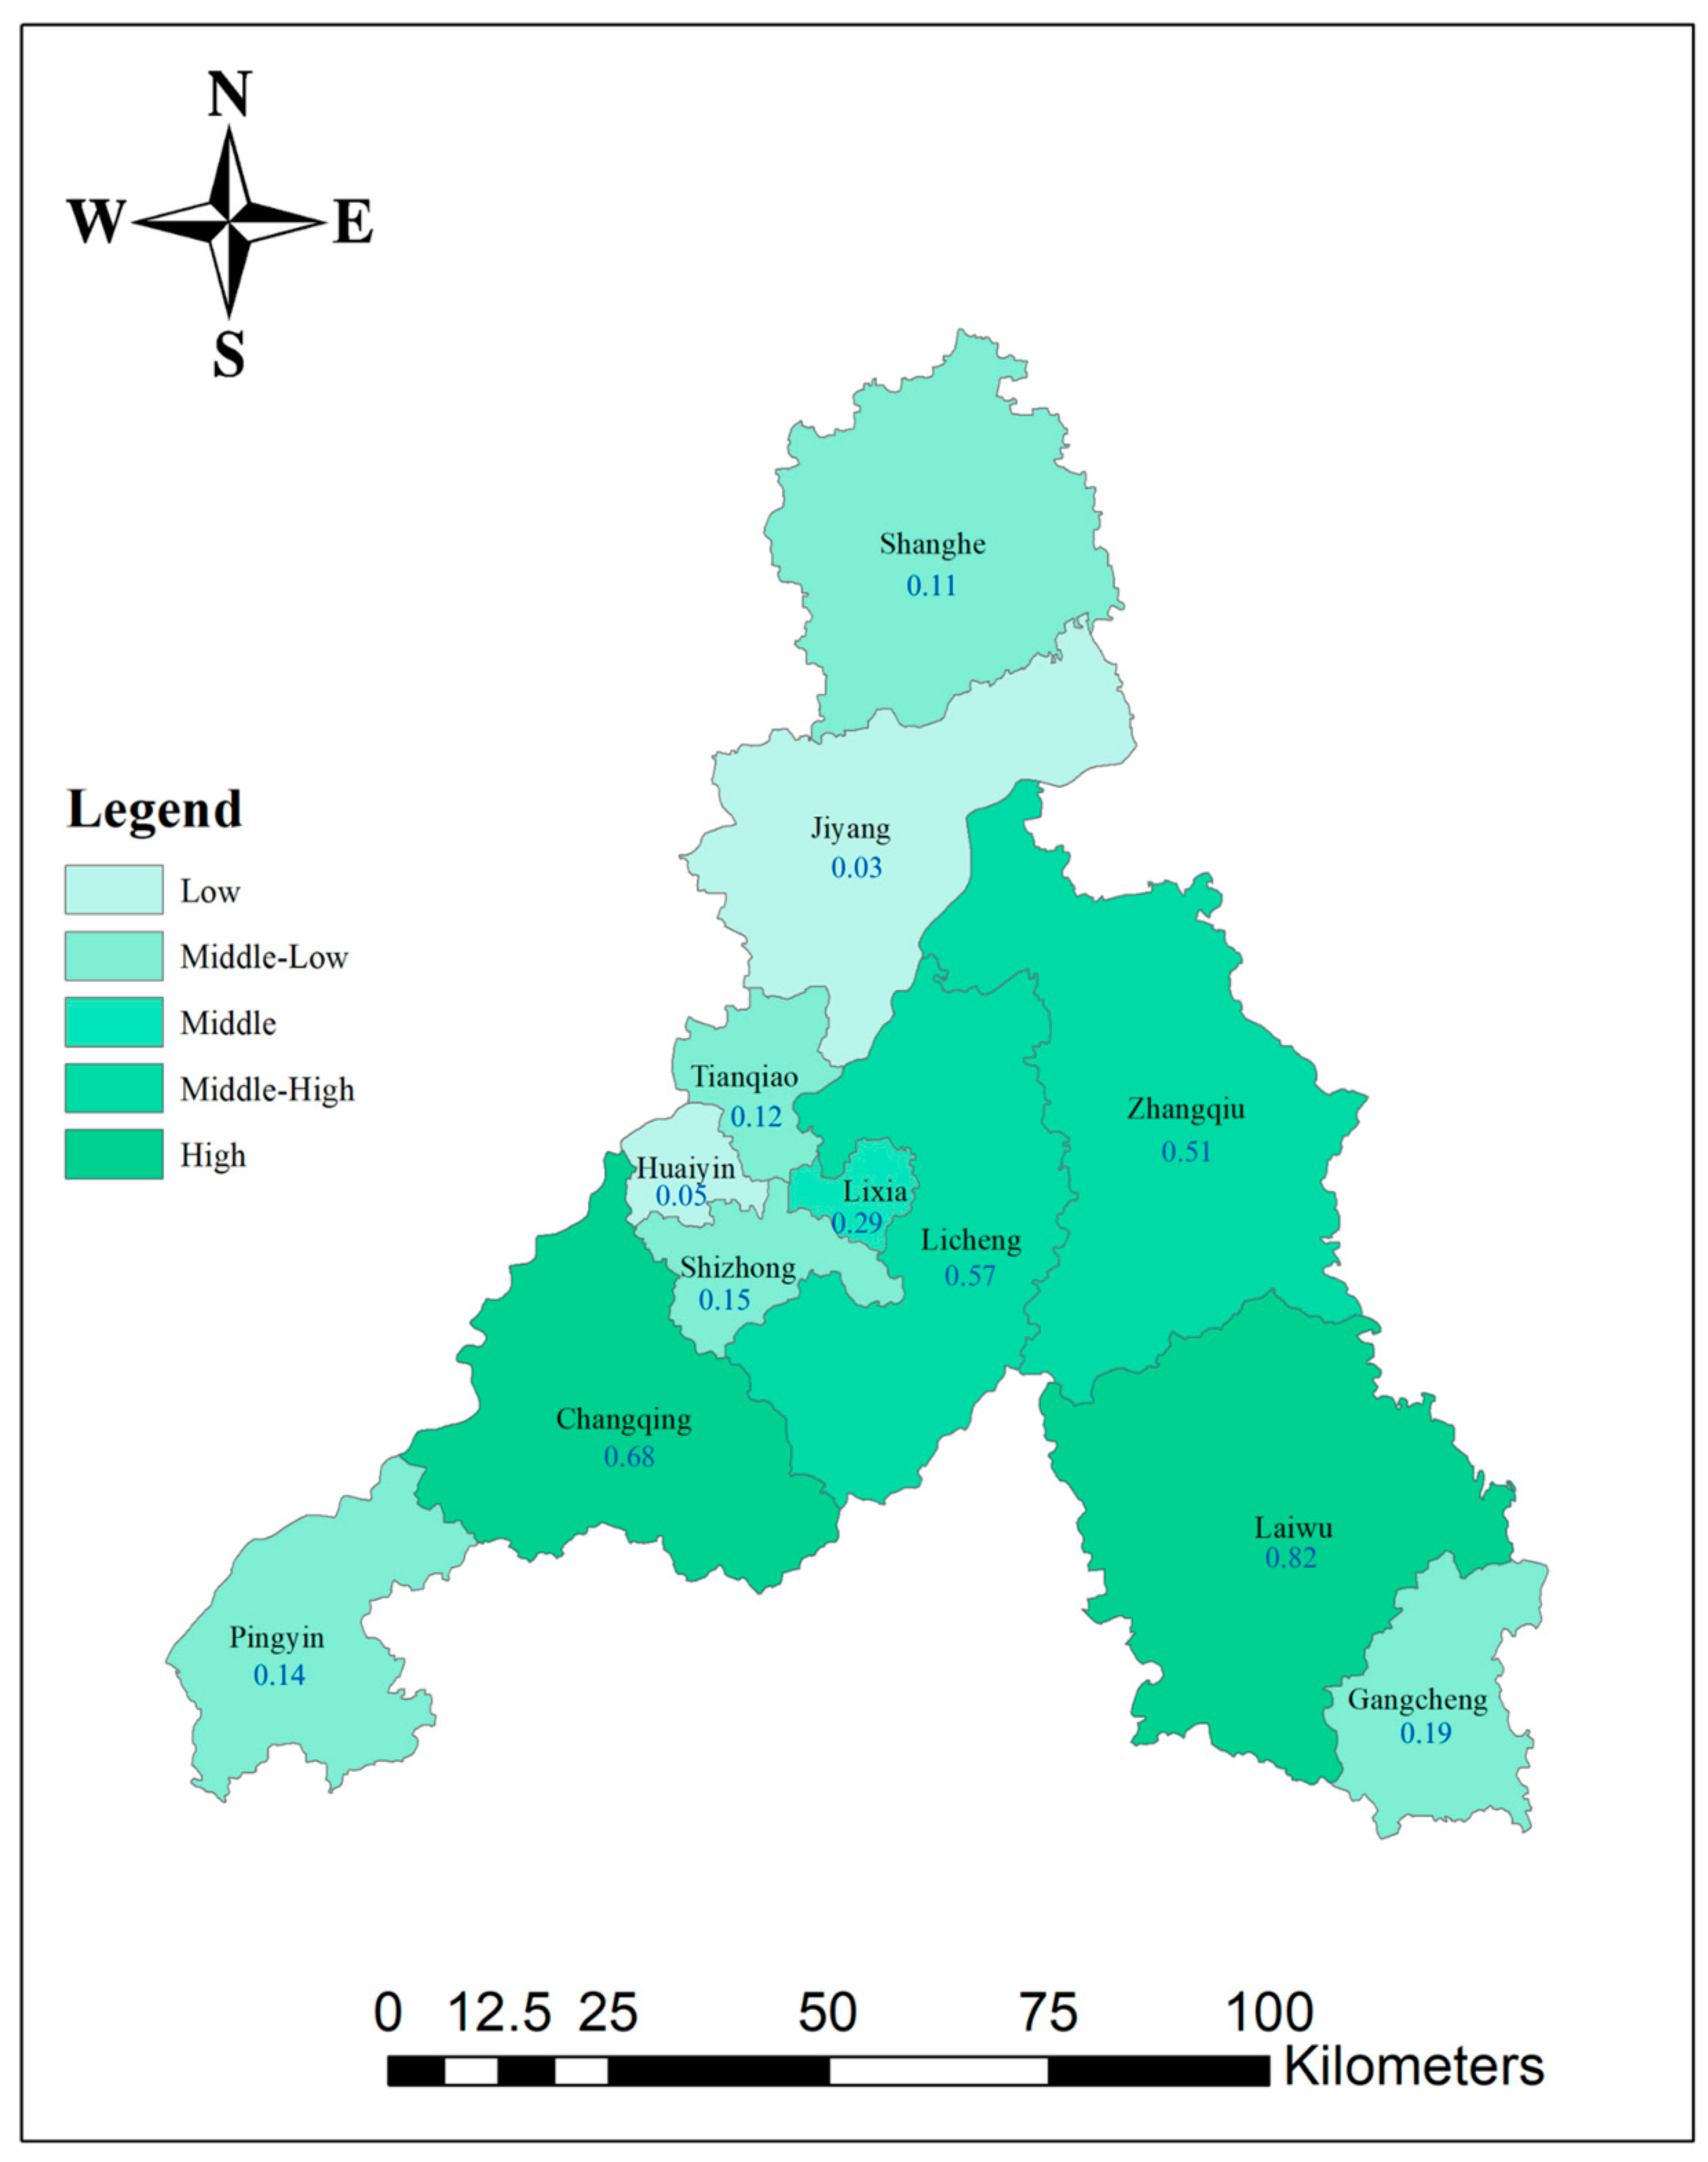
Take advantage of the entropy technique formula to standardize the indicator data (Figure 8) and determine the weight of each indication (Table 6). The assessed degree of sustainable development for each district (county) characterizes the demand level of urban people, with results normalized in this article to the range of [60, 100] for visual representation.
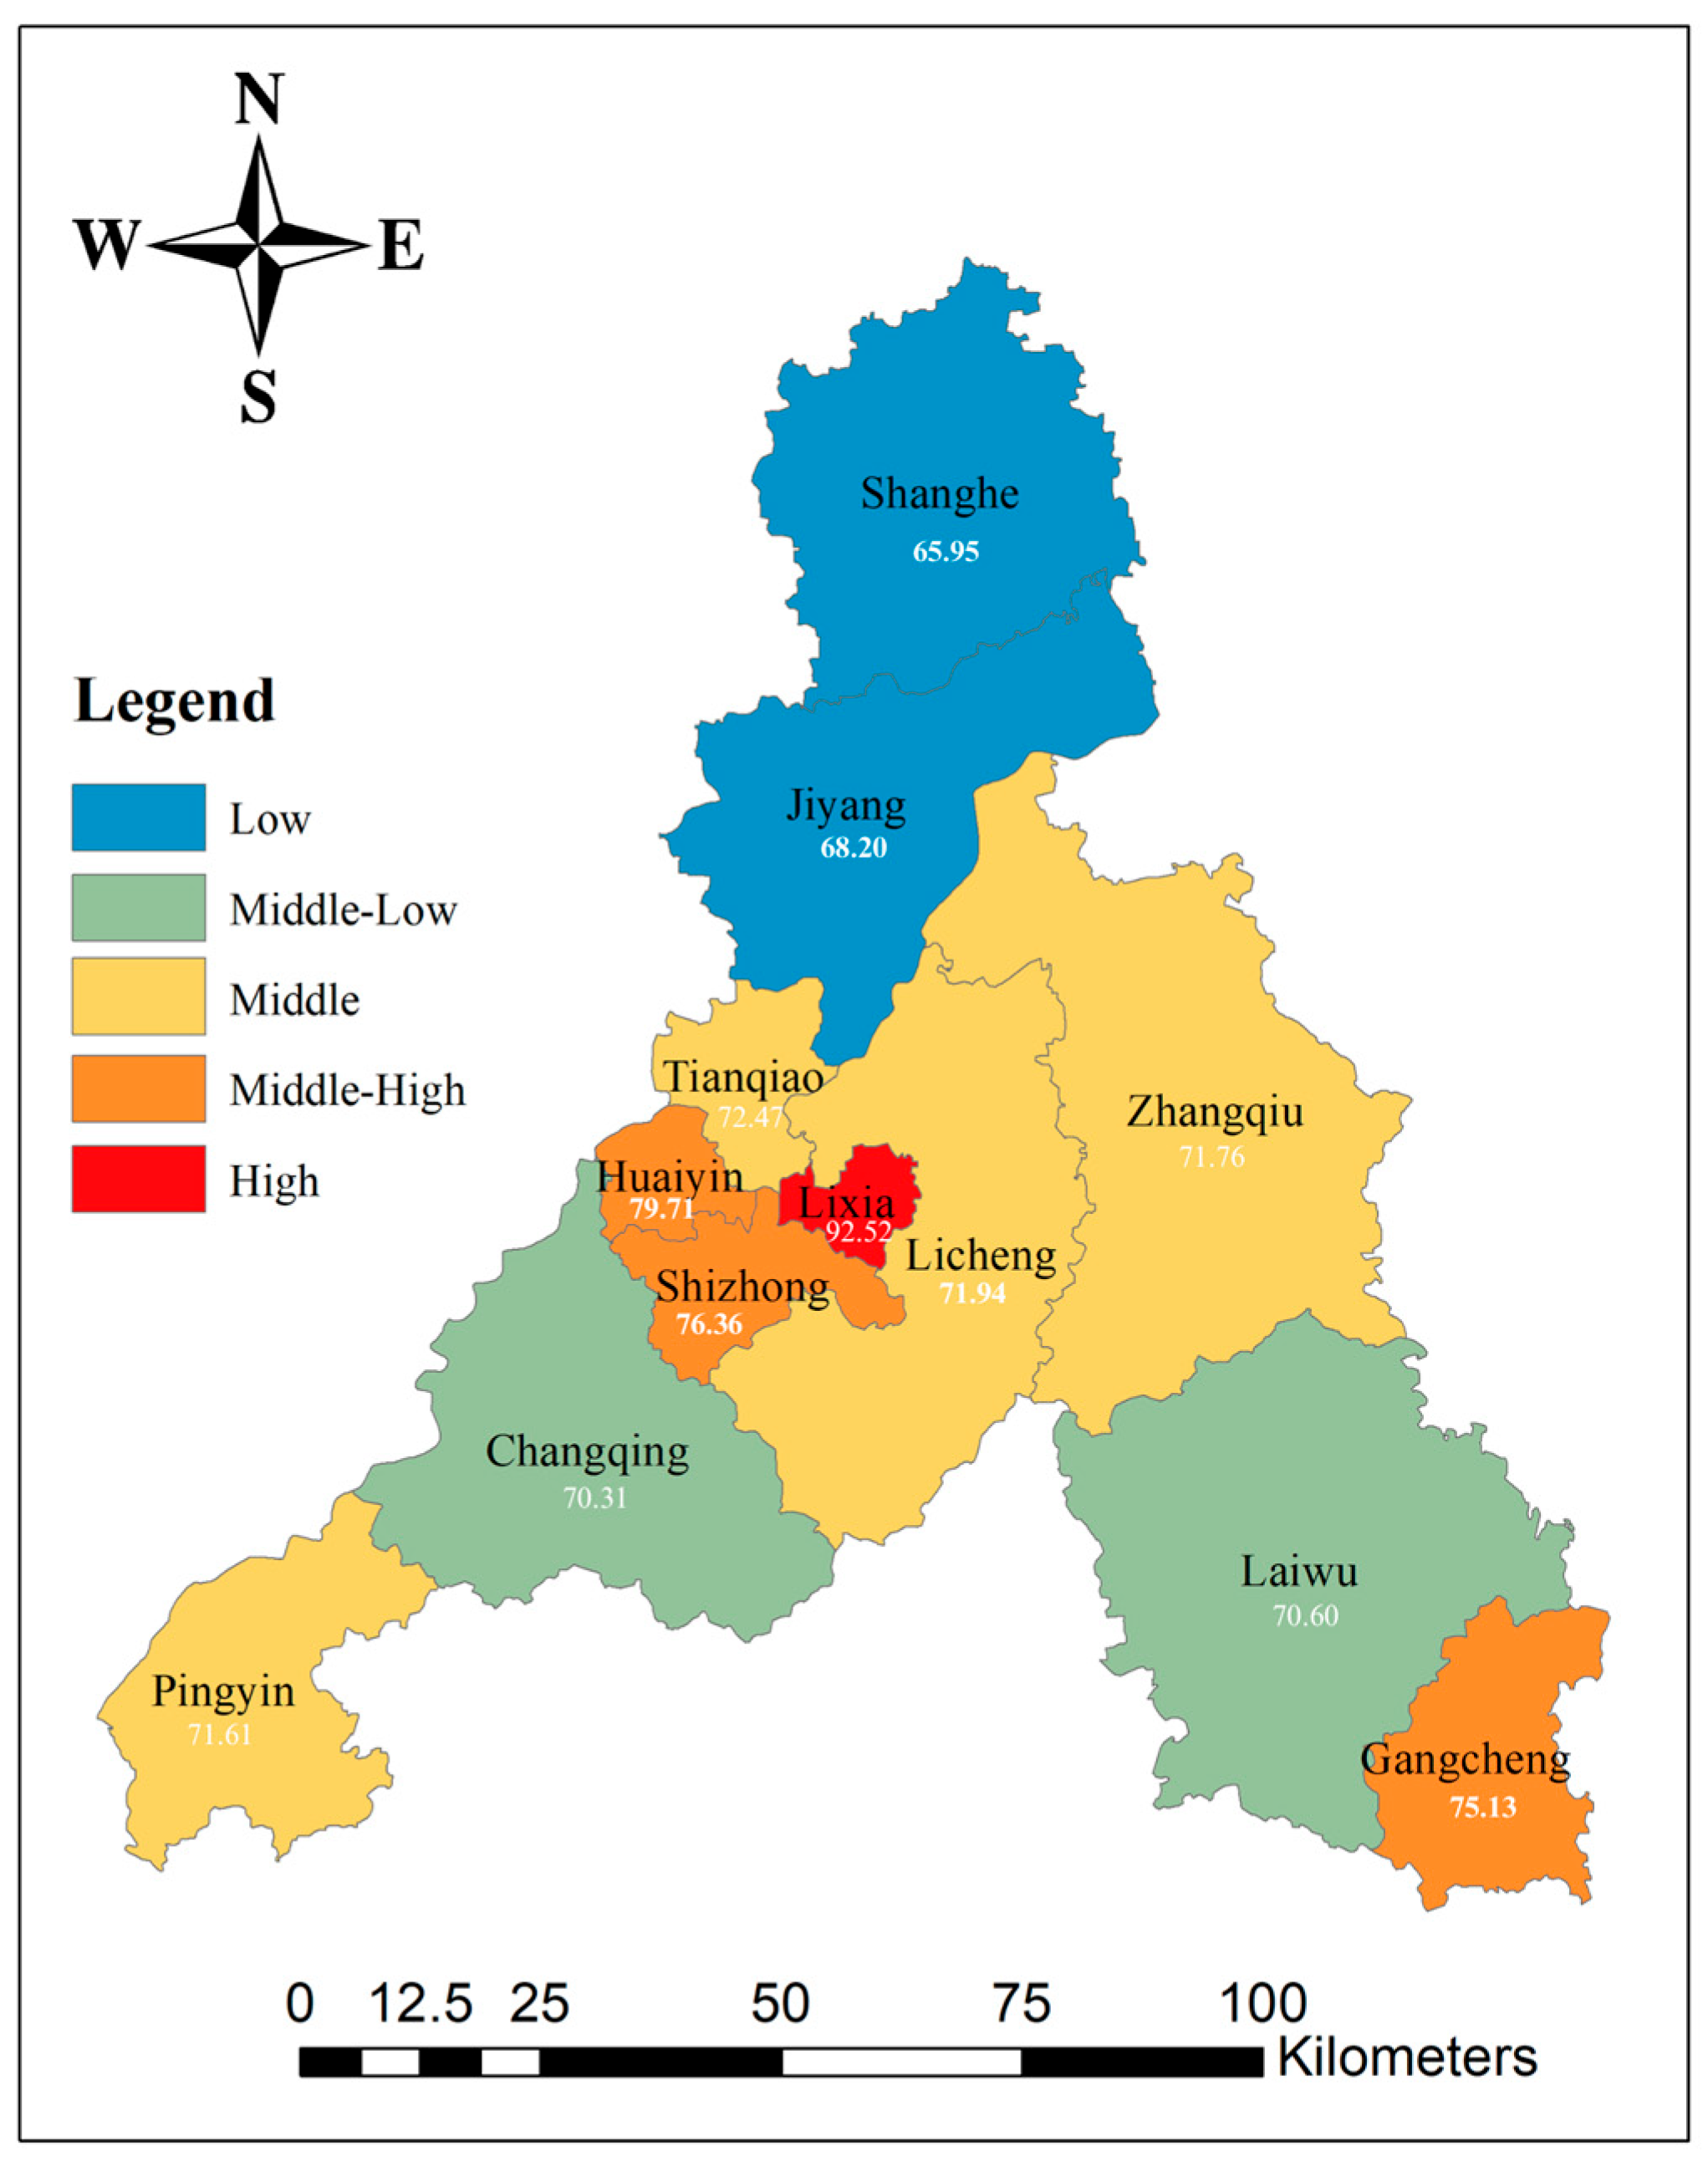
In areas characterized by advanced sustainable development, where ecological preservation and green space construction are prioritized, urban inhabitants increasingly depend on and engage with parks and green spaces, thereby directly influencing their demand for and utilization of these areas. Therefore, the higher the level of sustainable development in a region, the higher the level of residents’ demand for green park space. Figure 9 illustrates the spatial distribution of green space demand levels in Jinan. The evaluation results indicate that Lixia District possesses the greatest demand level, achieving a score of 92.52 points. Huaiyin District, Shizhong District, and Gangcheng District are classified as “middle-high” level; Tianqiao District, Lixiong District, Pingyin County, and Zhangqiu District are categorized as “middle” level; Changqing District and Laiwu District are designated as “middle-low” level; and Jiyang District and Shanghe County are identified as “low” level. Lixia District, in the historical urban core of Jinan City, is addressed in the Jinan New Urbanization Plan (2021–2035) [56] released by the Jinan Municipal Government. The plan emphasizes the necessity to enhance the human environment, safeguard the historical and cultural integrity of the city, rehabilitate urban villages and shantytowns, establish a multi-dimensional transportation network, and advance comprehensive community services. Consequently, the transportation infrastructure, urban development, and cultural amenities in Lixia District are comparatively comprehensive, and the degree of sustainable development is elevated. Shanghe County is in the northernmost region of Jinan City, characterized by an inadequate transportation infrastructure and a predominance of primary industry. It exhibits a pronounced urban-rural divide, a low urbanization rate, and is currently undergoing construction and development, resulting in a diminished level of sustainable development.

3.2. PGS Supply Analysis

3.2.1. Quantitative Indicator Analysis

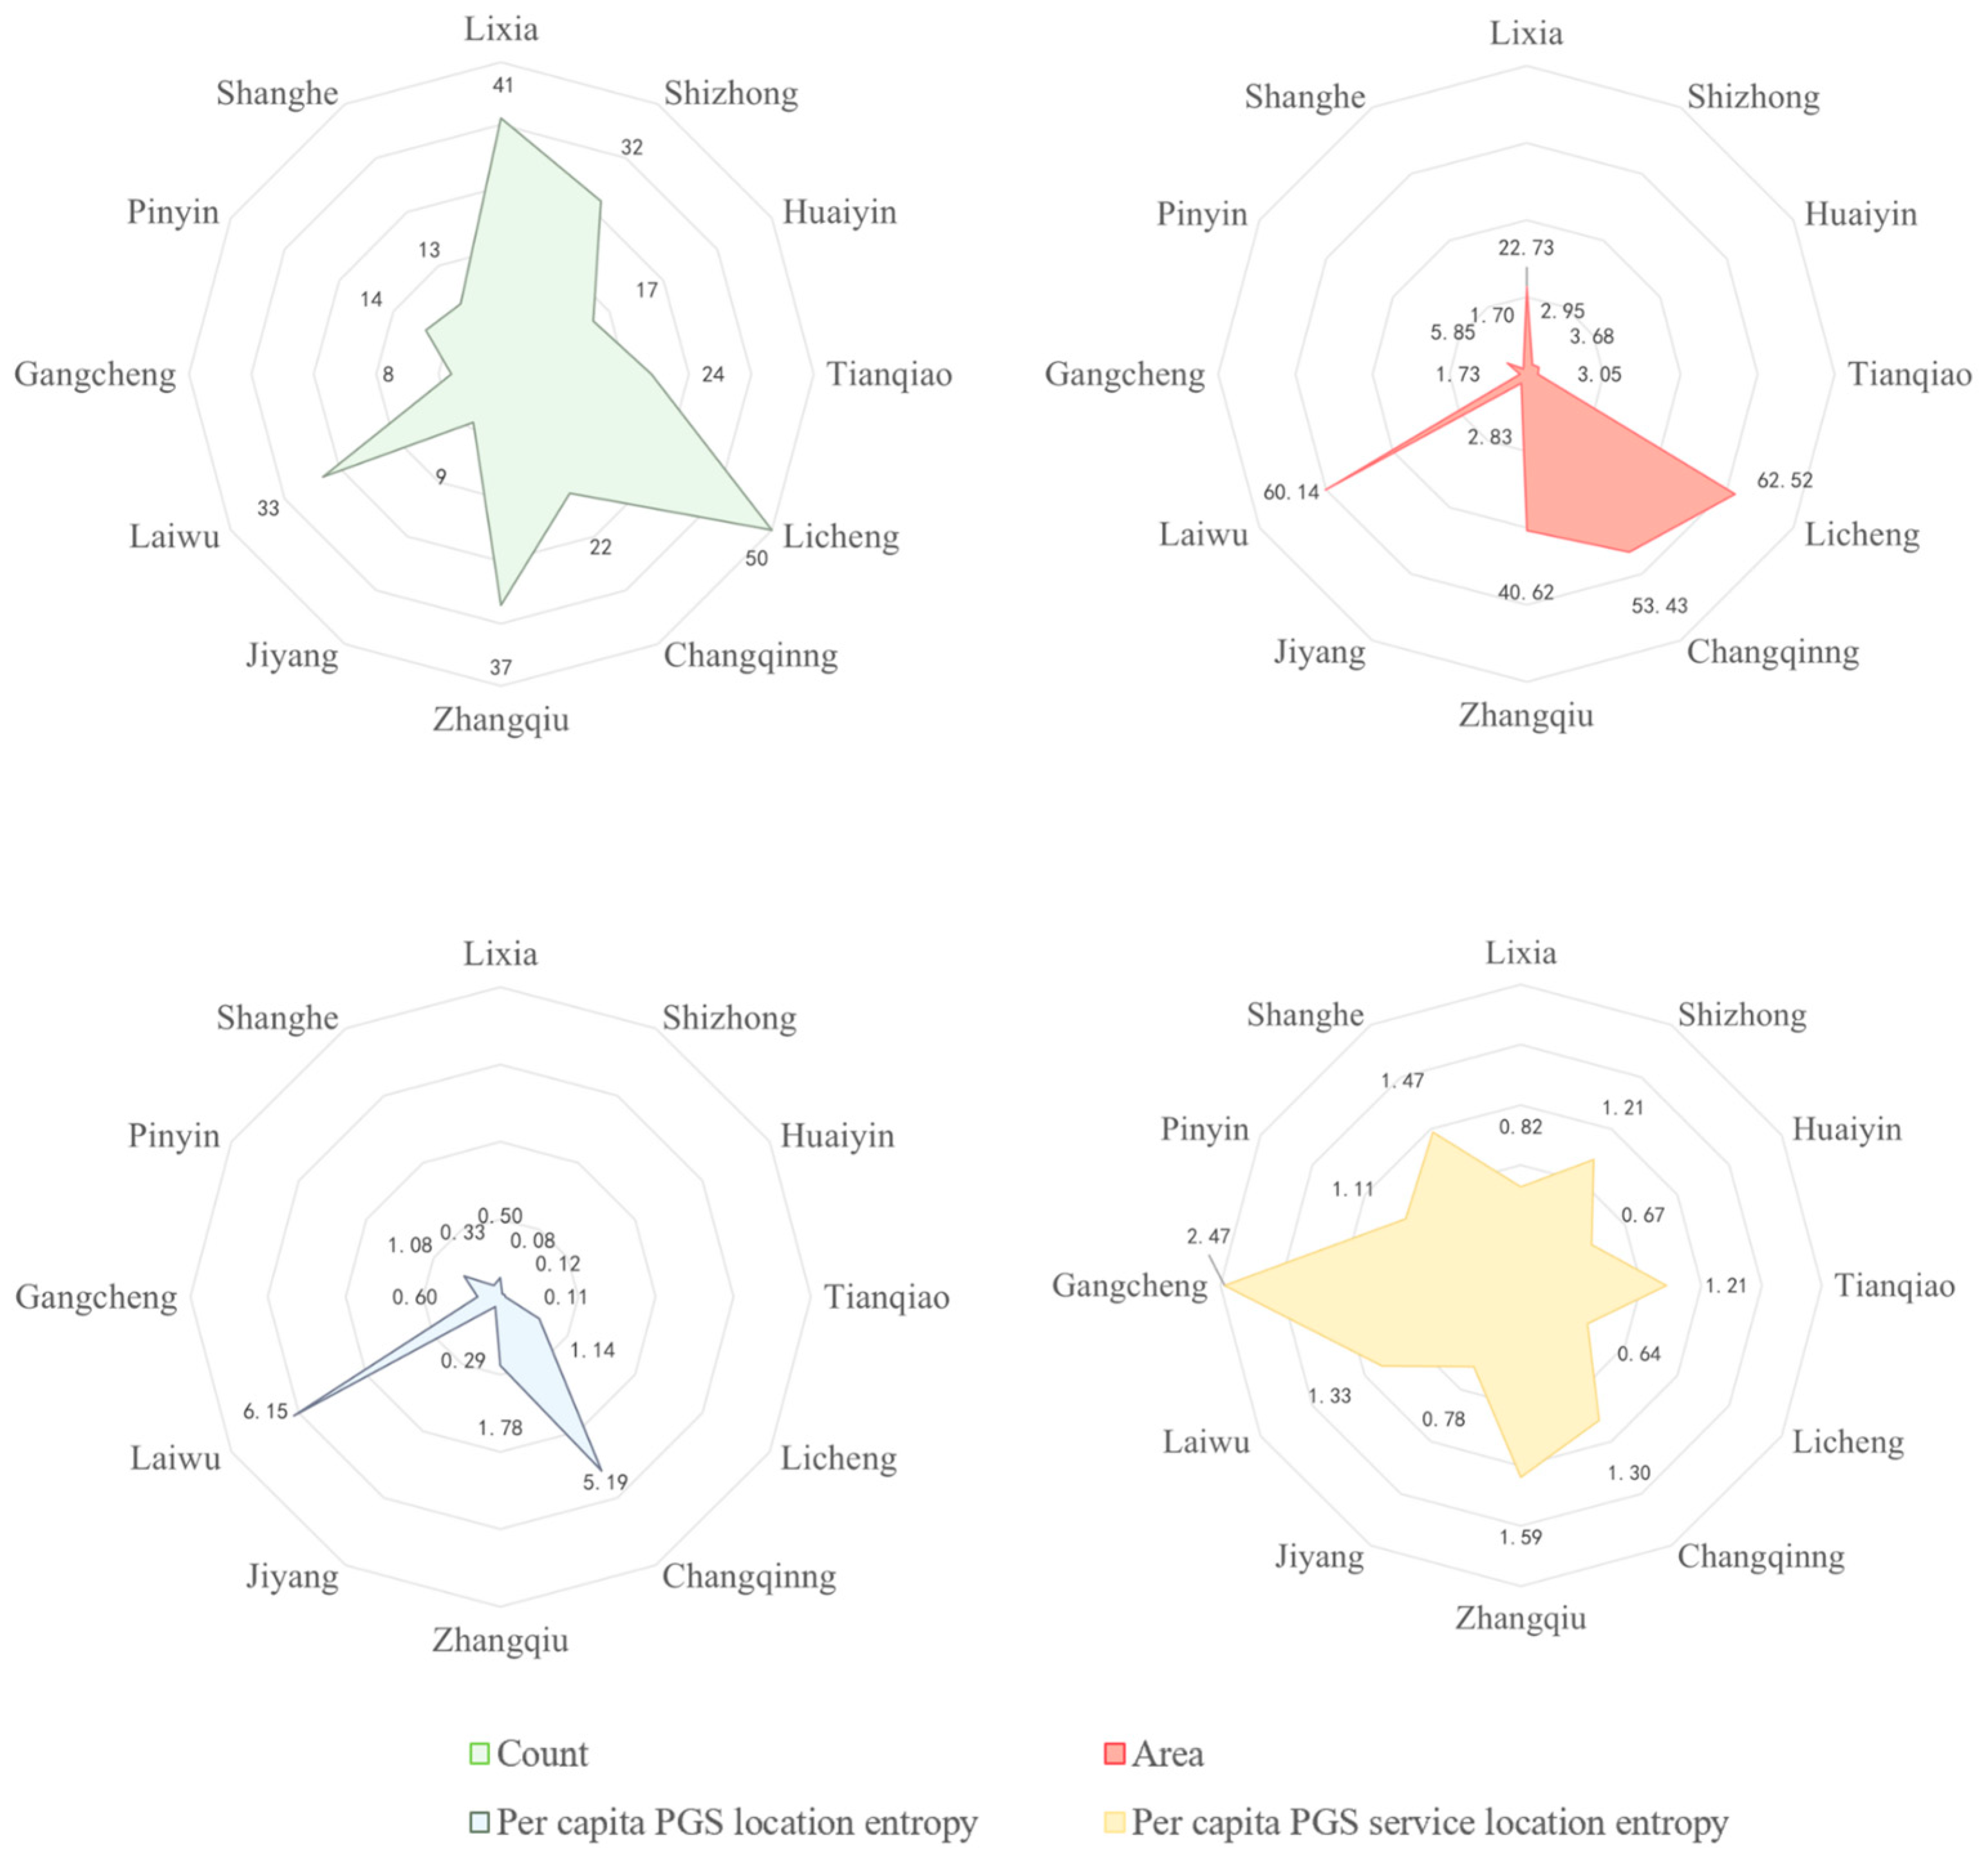
Indicators encompass count, area, per capita PGS location entropy, and per capita PGS service location entropy [19]. The PGS of districts’ (counties’) statistical indicators and statistical results are shown in Figure 10. The entropy technique formula is employed to compute the PGS scores for Jinan City, with the weighting results presented in Table 7. The weighting results indicate that the green space area holds the highest weight, while the per capita PGS location entropy ranks second.
As shown in Figure 11, the quantitative indicators of PGS in Jinan are uneven, exhibiting significant value discrepancies. Laiwu, Changqing, Licheng, and Zhangqiu exhibit high indicator values; Shizhong, Huaiyin, Gangcheng, Pingyin, and Tianqiao display middle-low indicator values; while Jiyang and Shanghe are characterized by low indicator values. According to the park quantity indicator results, Lixia District, despite having the highest number of parks, possesses a greater proportion of playgrounds, a smaller total park area, and a substantial population base, resulting in moderate calculation outcomes. Conversely, Laiwu District has the highest ranking in the quantity indicator due to the large number of comprehensive parks within its jurisdiction, a larger overall area, and an advantage in the area of per capita PGS, so it has the best overall results; and Steel City District has the smallest number of parks in its jurisdiction, and so the calculation results of the quantity indicator scored the least.

3.2.2. Quality Indicator Analysis

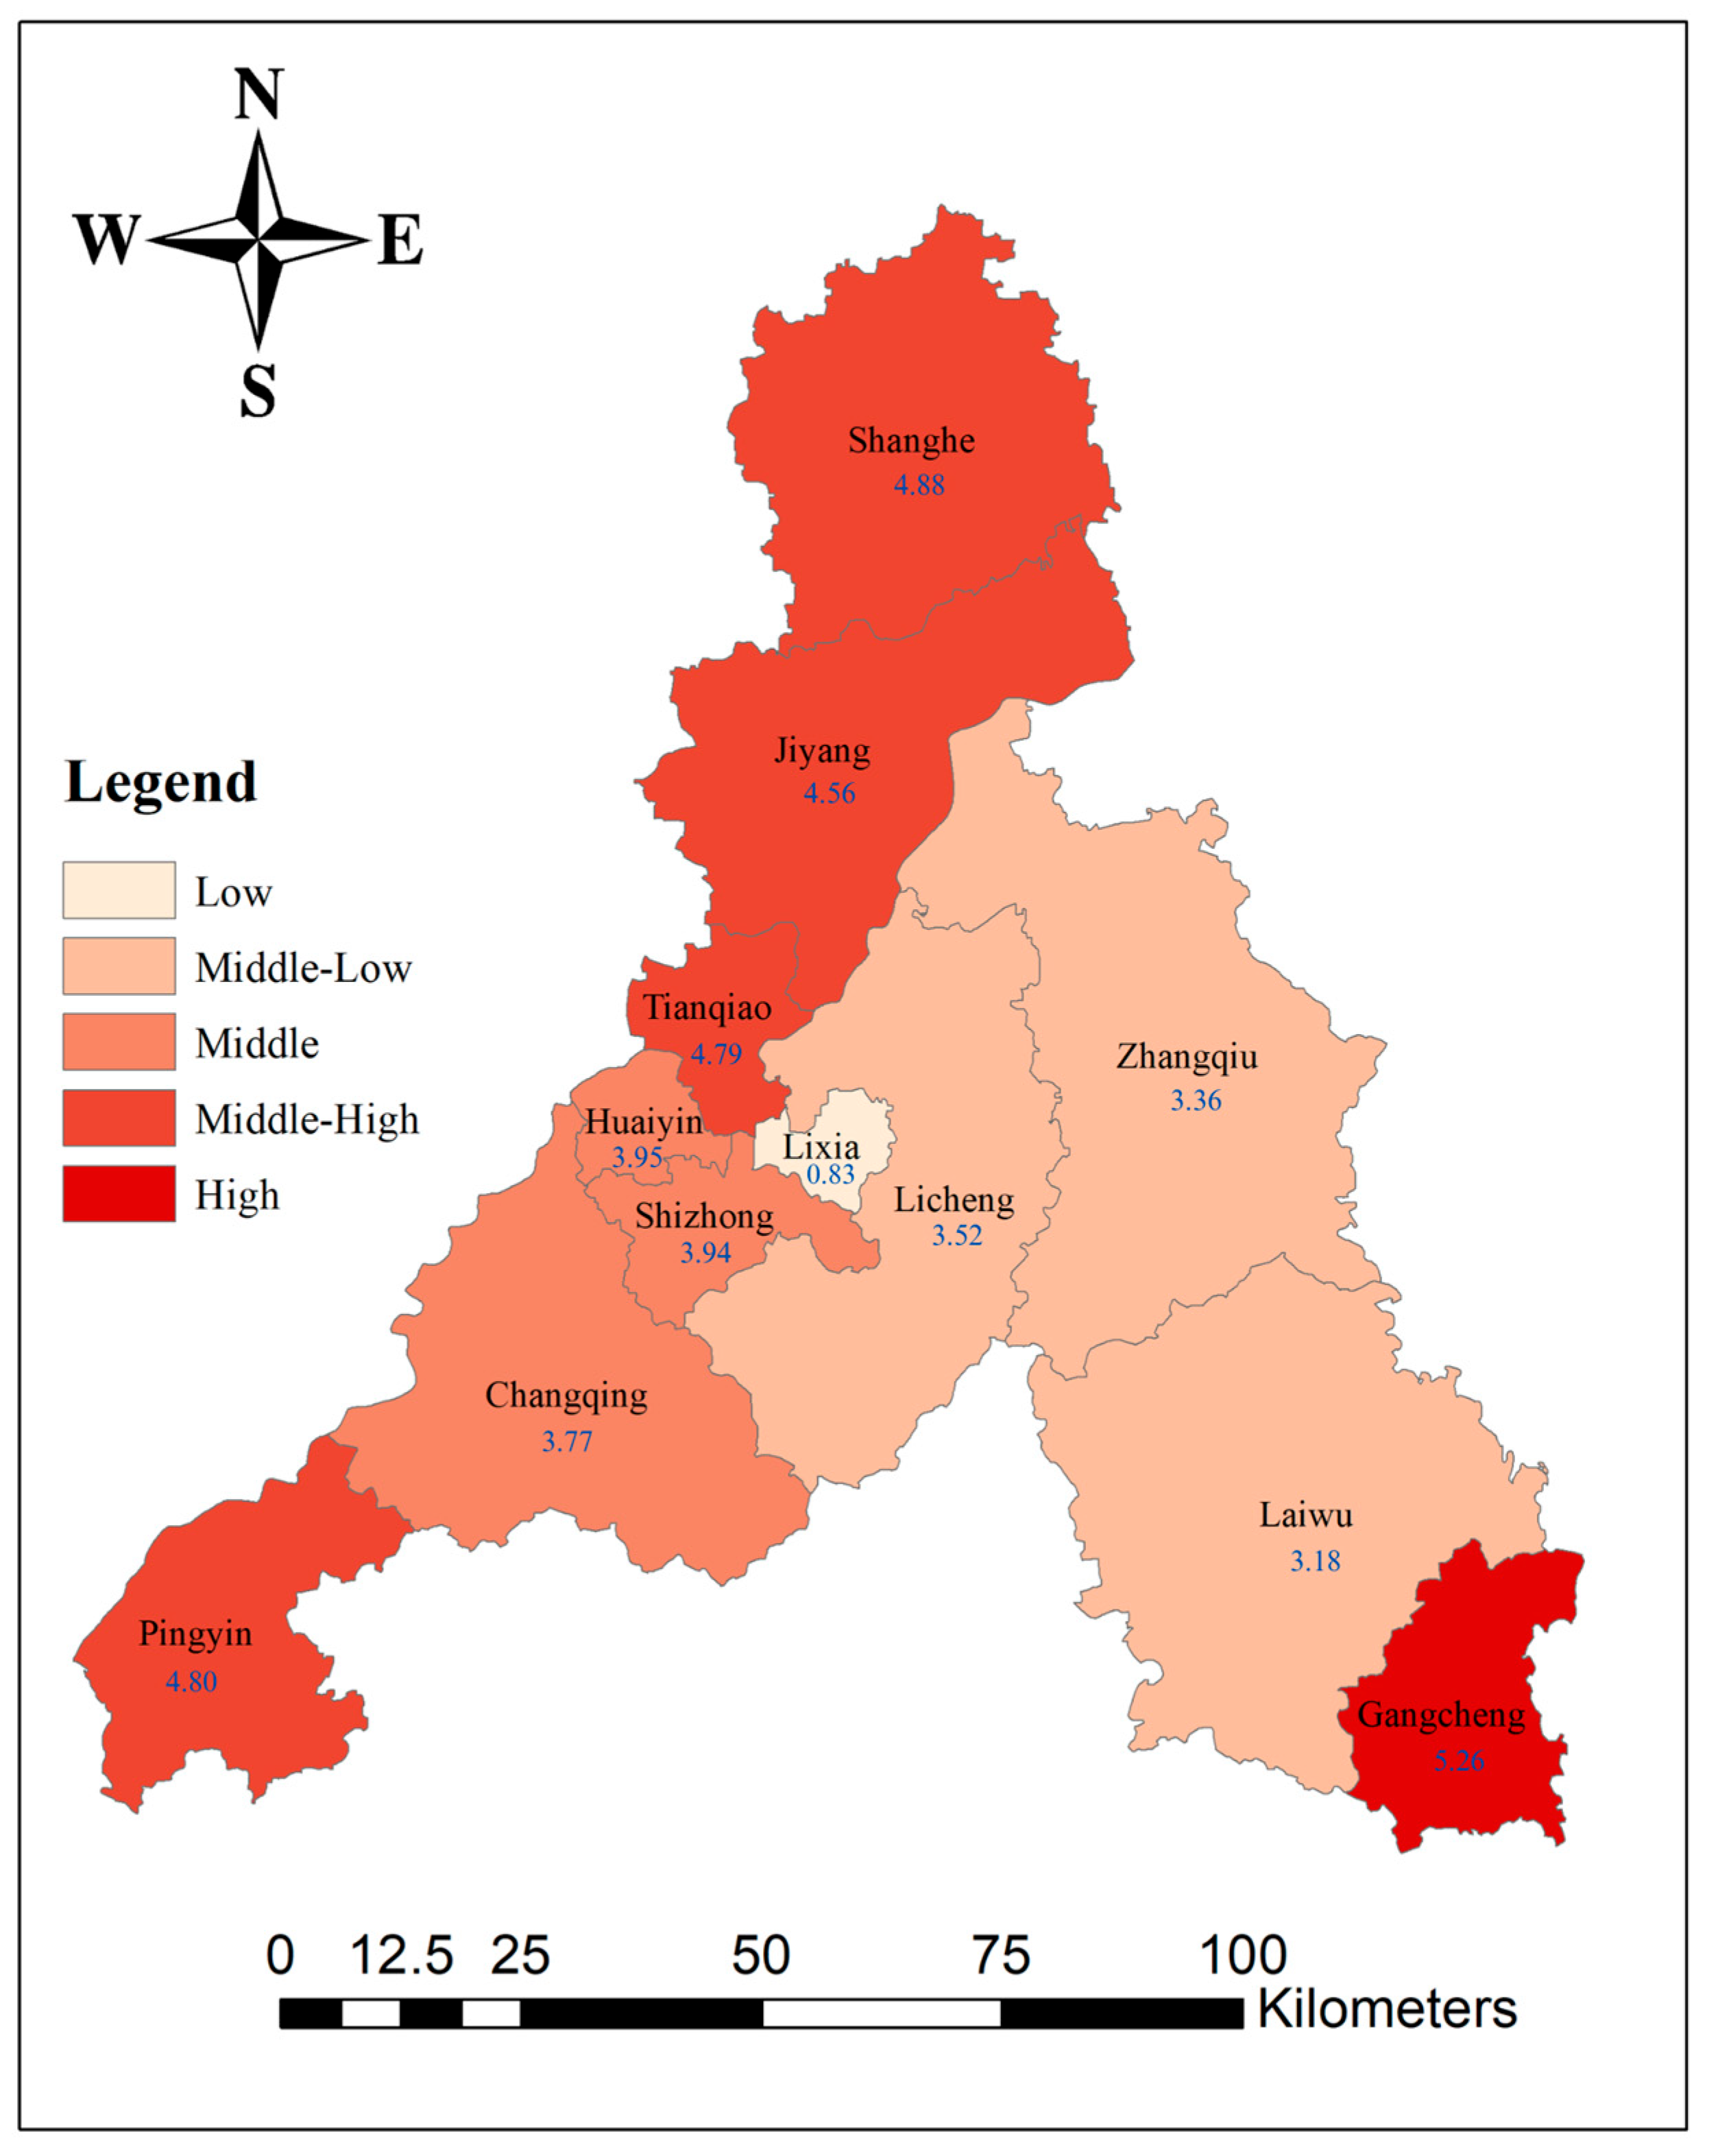
The park quality indicators (Figure 12) indicate that Lixia District possesses the lowest quality indicator values of PGS, whereas Gangcheng District exhibits the best quality of PGS. The rapid urbanization of Jinan, particularly in Lixia District, the city’s core sector, is seeing significant pressure for land development. The continuous development of commercial, residential, office, and other construction projects may lead to the fragmentation of green landscapes. Gangcheng District may prioritize the development of a green space network at the urban planning stage to ensure the continuity and extent of green space. At the same time, an efficient green space management strategy ensures the longevity and stability of green spaces and reduces the risk of human damage and fragmentation.

3.2.3. Analysis of Accessibility Indicator

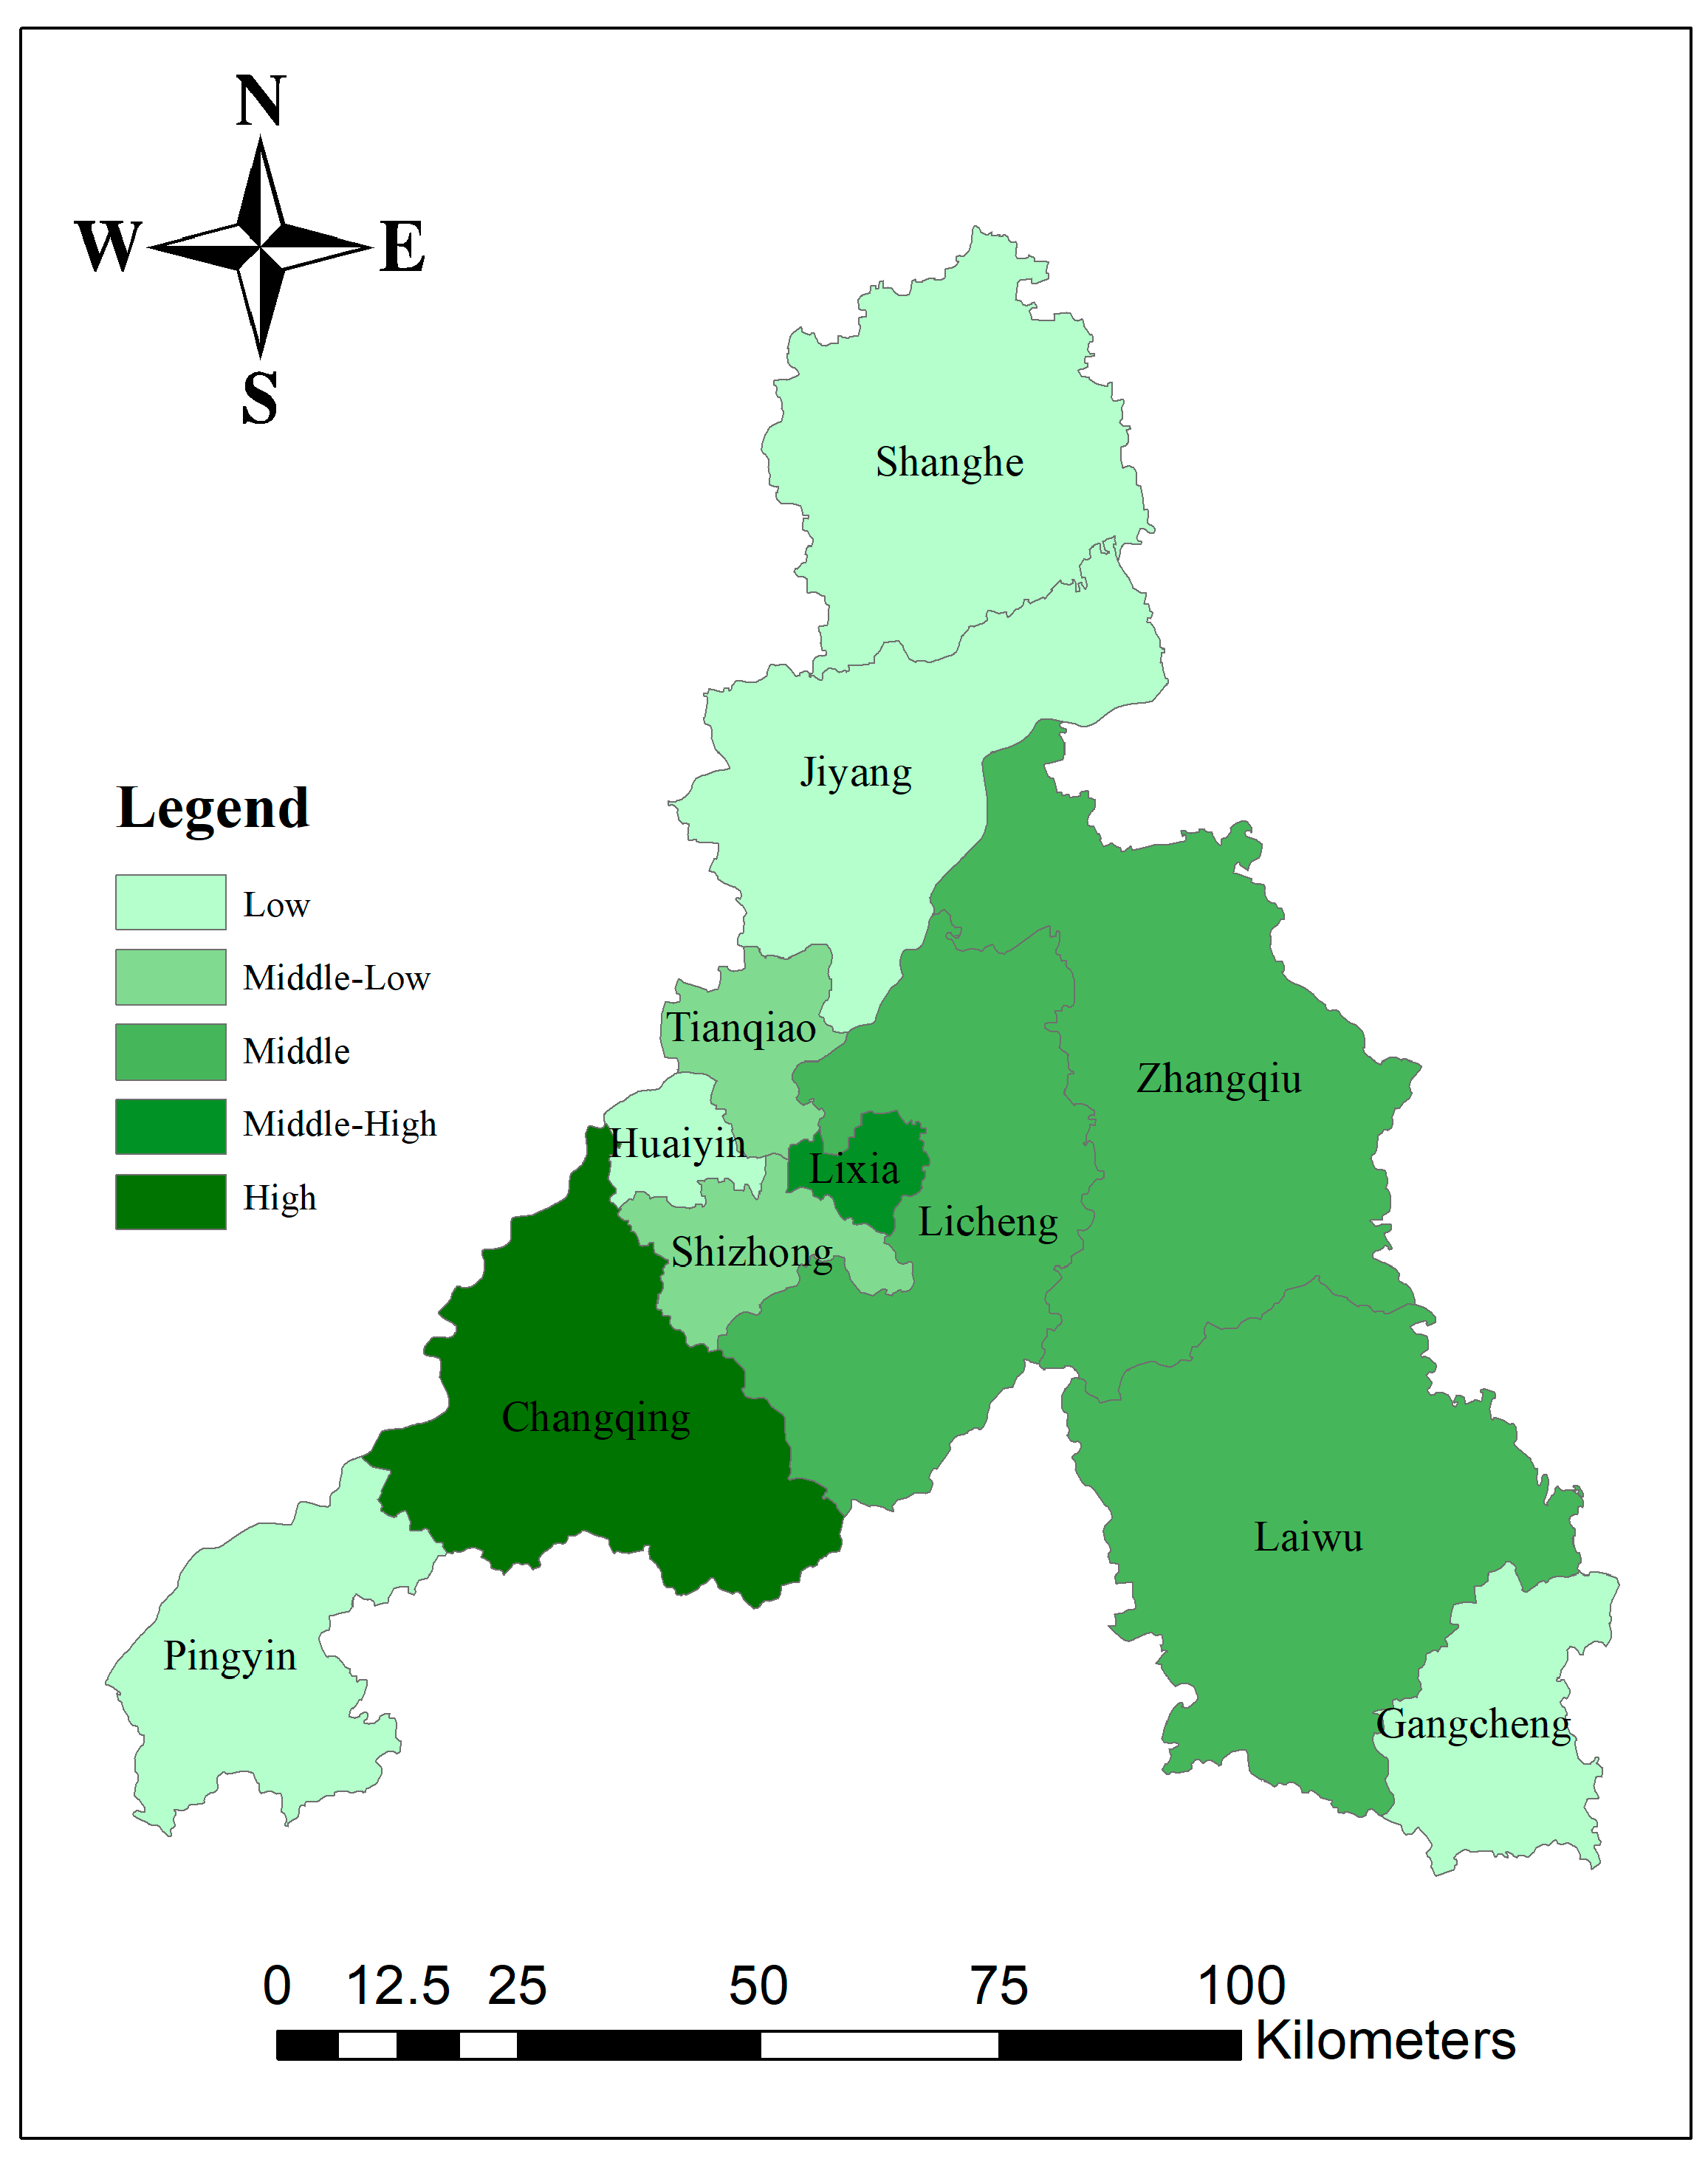
The results (Figure 13) show that the spatial distribution of PGS in Jinan is uneven, as are the quantitative and qualitative indicators. From the data, Changqing and Lixia districts are at the highest level of accessibility; Shizhong and Huaiyin districts have higher values of accessibility; Tianqiao, Lixia, Changqing, and Zhangqiu districts have medium levels of accessibility; Shanghe, Pingyin, and Laiwu districts have low levels of accessibility; and Jiyang and Gangcheng districts have the lowest levels of accessibility. The high accessibility of PGS in Changqing and Lixia Districts is mainly due to the optimization of the layout of the green space system in their urban planning, the well-developed transportation network, and the perfect service facilities, as well as the policy support and sufficient investment, which together enhance the residents’ experience of enjoying the green spaces in a fast and convenient way. In contrast, the lower green space accessibility in Steel City and Jiyang Districts may stem from the physical separation of green spaces from residential areas during urban expansion, the relative lag in transport facilities, the uneven distribution of green spaces, as well as lower levels of economic development and non-prioritized urban planning strategies, which together make reaching PGS more challenging for residents of these two districts.

3.2.4. Comprehensive Supply Level Analysis

This study calculated the quantity, quality, and accessibility indicators ofPGS in various districts (counties) of Jinan City and integrated the indicator data using the entropy method to reflect the supply level of PGS in each district (county) [57]. Evaluation results of PGS supply level (Figure 14). Looking at it, Changqing District has the highest supply level due to its balanced development in terms of the quantity, quality, and accessibility of PGS. Although Lixia District has disadvantages in quality indicators, its advantage in accessibility indicators makes its comprehensive service level ranking second only to Changqing District; however, nearly half of the districts (counties) in Jinan still have a low level of PGS supply and insufficient quantity and quality of PGS, coupled with inconvenient transportation, resulting in low accessibility and making it difficult for citizens to fully benefit from PGS resources.

3.3. Analysis of Supply and Demand Coordination of PGS

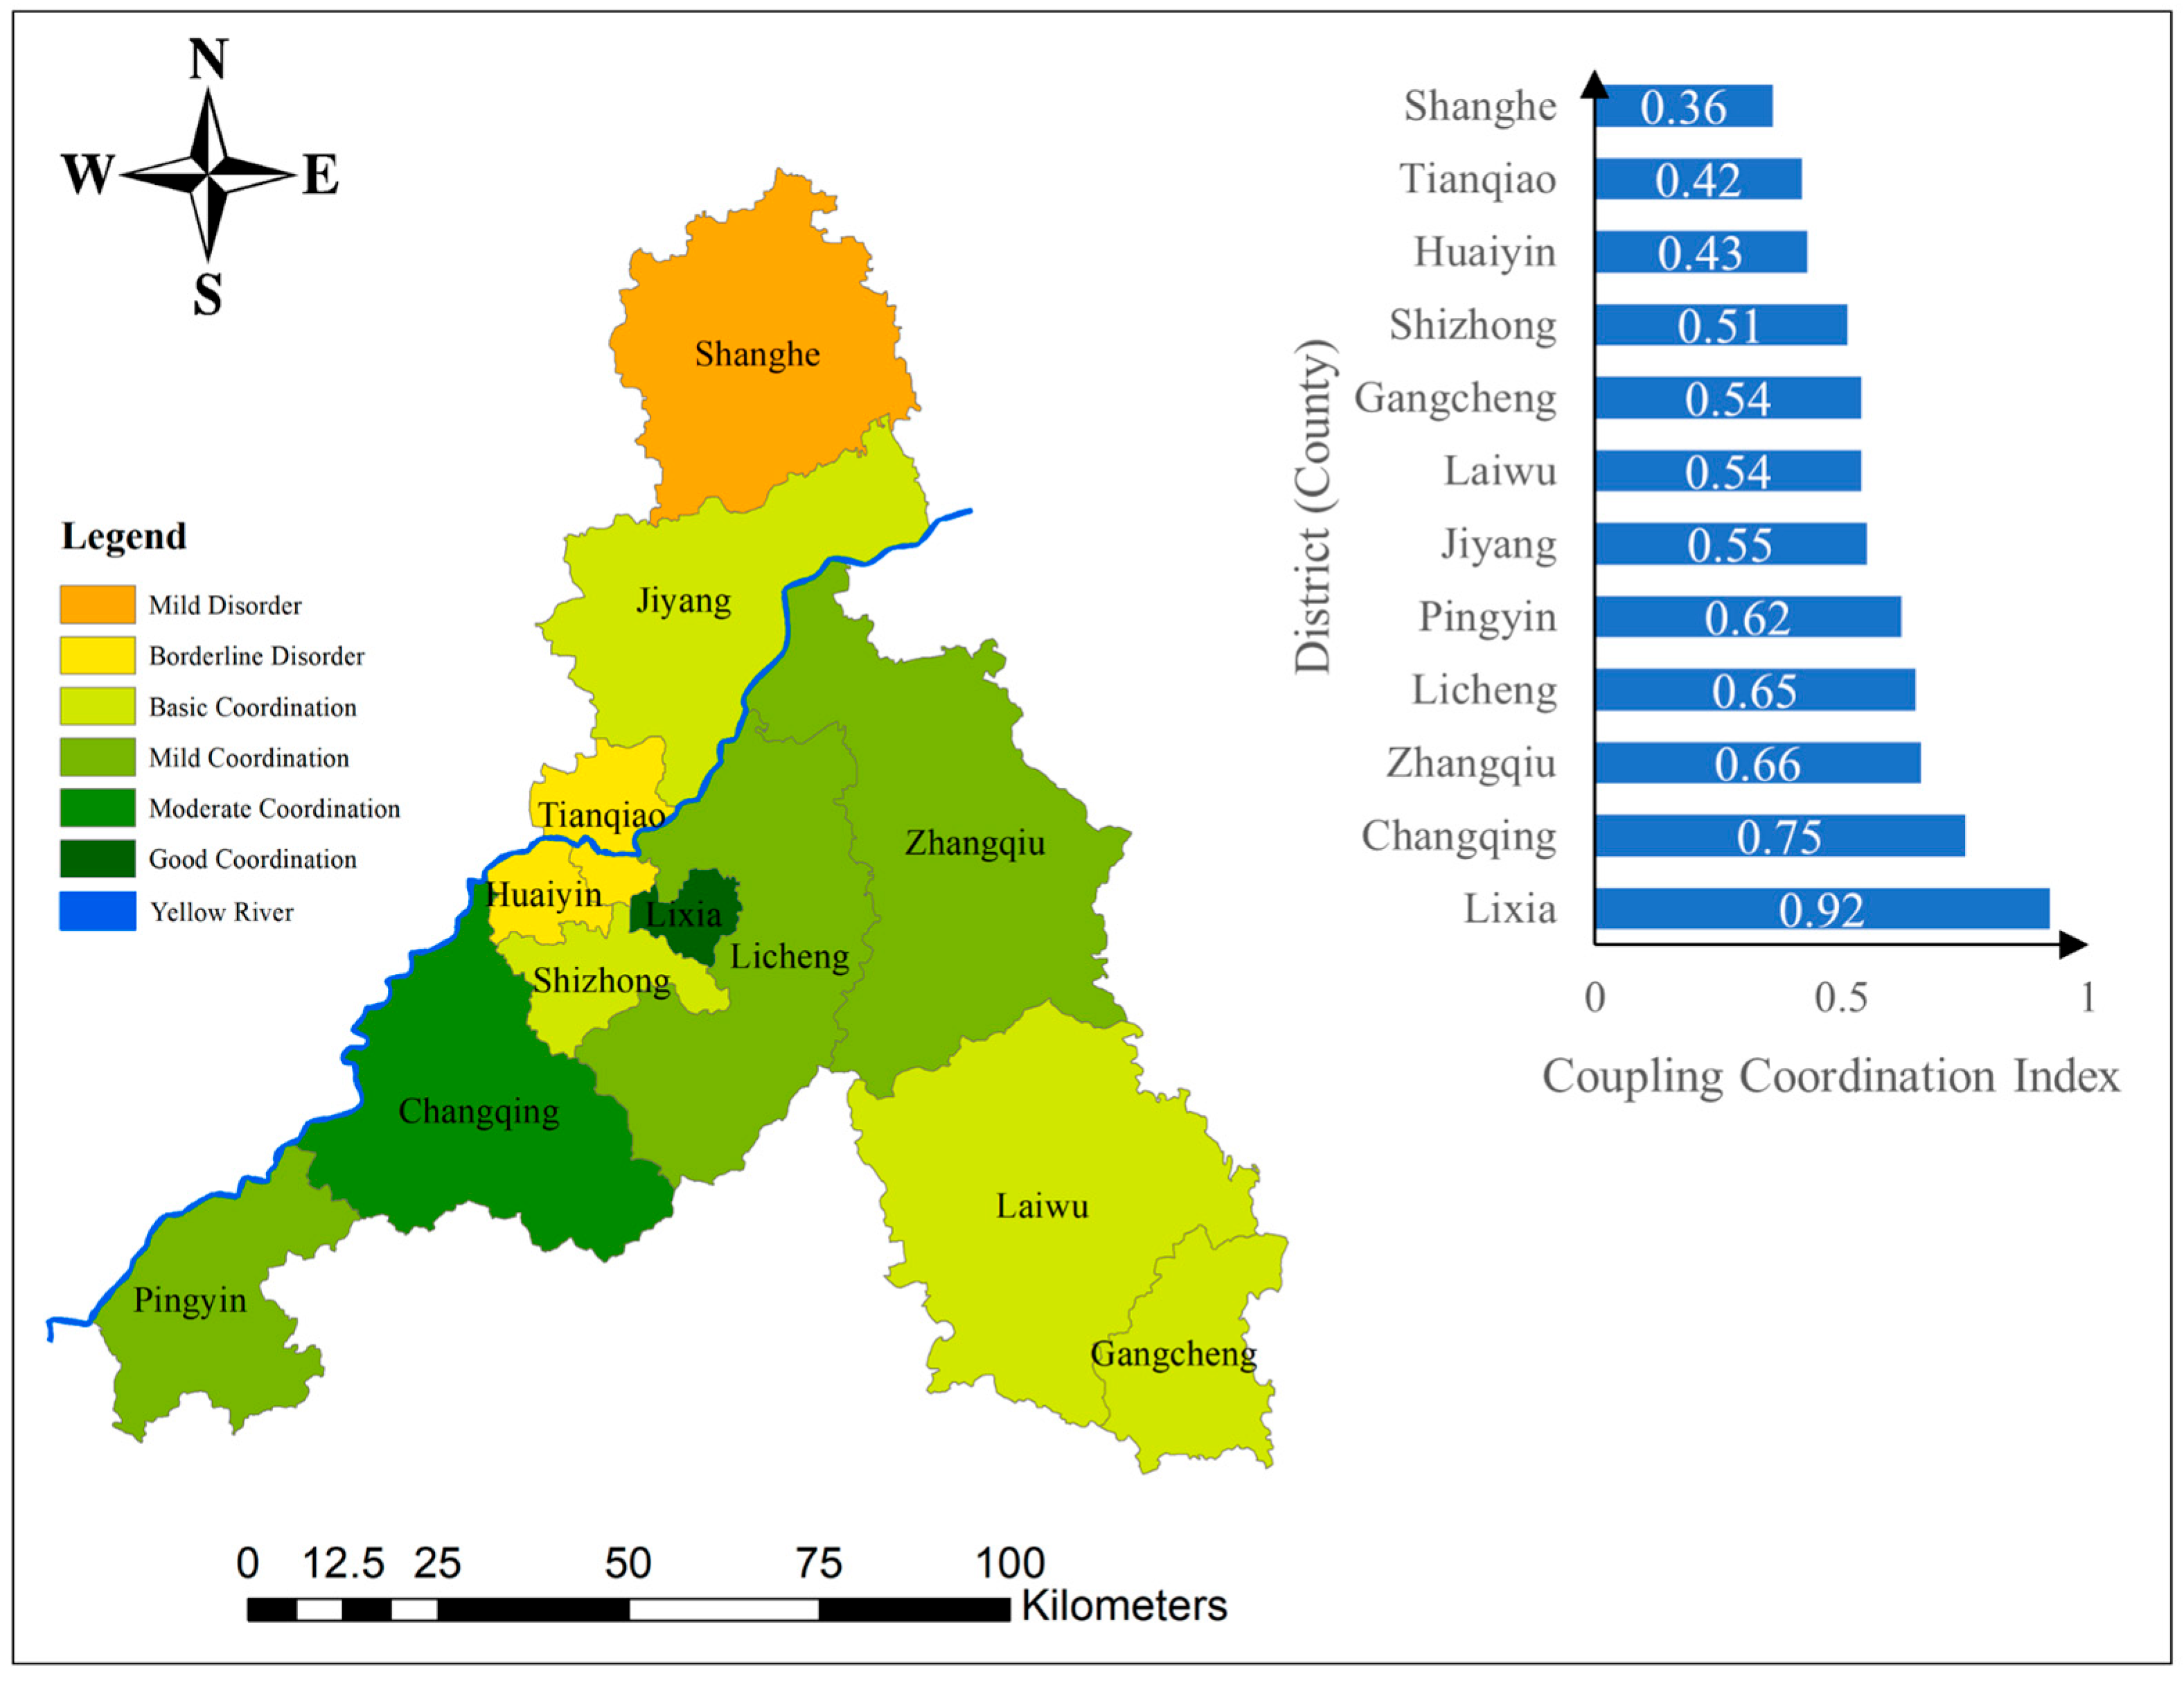
This study analyzed the supply-demand coordination level of parks and green spaces in various districts (counties) of Jinan City through the Coupled Coordination Degree Model (CCDM) [58]. The coupling coordination degree model can effectively evaluate the balance state between supply and demand, thereby revealing the coordination degree of PGS resource allocation in different regions.
Analysis of Supply and Demand Relationship Results (Figure 15). It can be seen that the supply-demand coupling coordination in Lixia District is well coordinated, while Huaiyin District and Zhangqiu District are on the verge of imbalance, and Shanghe County is in a mild imbalance state. This indicates that there are significant differences in the spatial layout of parks and green spaces in Jinan City, especially in the uneven allocation of resources between the north and south regions. This indirectly reflects that cities with higher levels of sustainable development have higher resident dependence and participation in parks and green spaces, which in turn promotes further strengthening of green space construction in cities and forms a virtuous cycle.

3.4. Measuring the Fairness of PGS Based on Gini Coefficient

Taking the cumulative percentage of the comprehensive service level of PGS as the vertical axis and the cumulative percentage of the disadvantaged population (including the elderly and minors) in Jinan as the horizontal axis, the Lorenz curve reflecting the PGS resources in the disadvantaged groups is plotted, as shown in Figure 16, aiming to analyze in depth the differences of the environmental justice among the social groups. The results show that the Lorenz curve of green space resources for disadvantaged populations is closer to the absolute equality line, and the Gini coefficient is calculated to be 0.35, indicating that the distribution of PGS resources in Jinan is in a relatively balanced state at the social level.

3.5. Optimization Strategies for Fairness in PGS

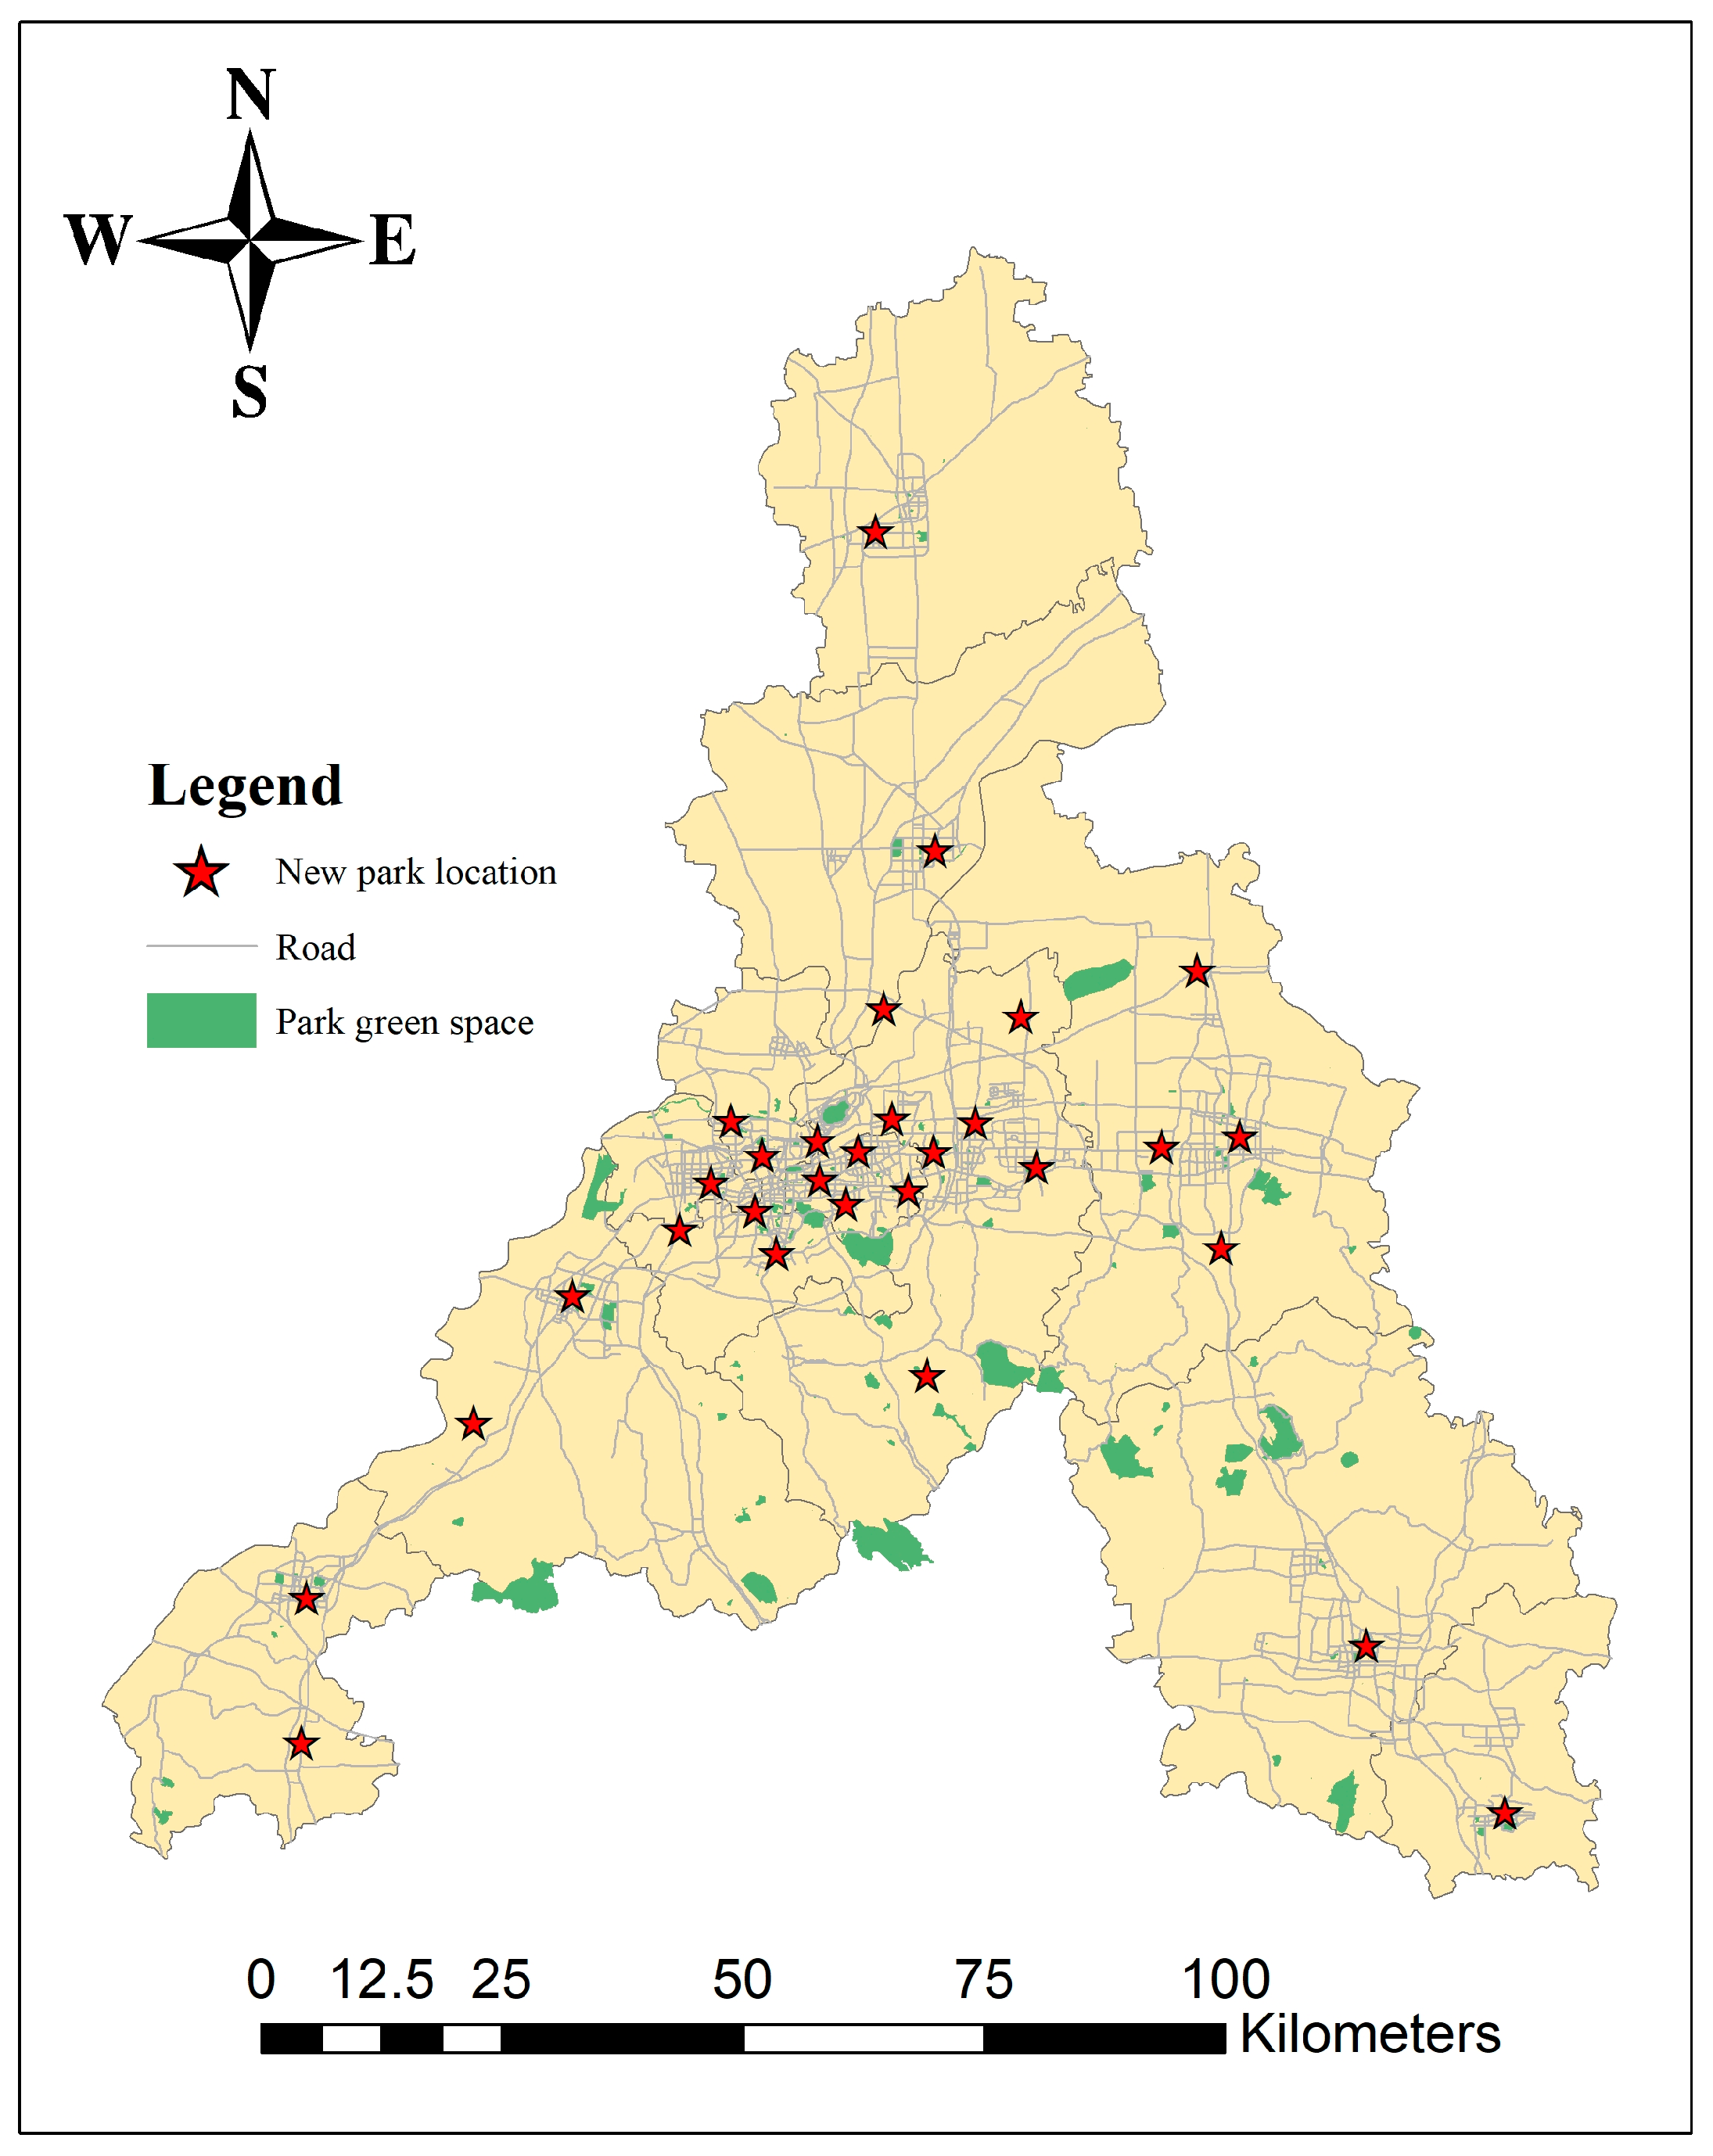
In response to the above issues, this study proposes to add parks in residential areas with low accessibility, optimize site selection, and improve the overall accessibility of PGS [59]. Firstly, using quartiles to determine residential areas with PGS accessibility less than 19 as blind spots for PGS accessibility. Secondly, the improved k-means clustering algorithm is used to analyze the site selection of the newly added park. K-means is a fundamental partitioning method in cluster analysis, often using the sum of squared errors criterion function as the clustering criterion [60]. The main advantage is that the algorithm is simple, fast, and can effectively process large datasets. The improved algorithm utilizes a clustering effectiveness evaluation function constructed from the sum of inter-centroid distances and intra-distances to determine the optimal number of clusters for the data. Within the potential number of clusters in the data, determine the optimal number of clusters by finding the minimum value of the function. Finally, using MATLAB R20222a software to write algorithm programs, we obtained the following: In Figure 17, the clustering curve is shown, the optimal number of clusters calculated is 30, and the coordinates of the optimized site selection point are obtained. The visualization result is shown in Figure 18.

4. Discussion

This study assessed the equity of park green space (PGS) in Jinan City from spatial and social perspectives. The results of the assessment indicate a pattern of spatially uneven distribution of PGS and a path for future optimization [61]. In addition to validating the precise conclusions of the study, this discussion situates these conclusions within the framework of academic debates on the equity of urban green spaces, emphasizing methodological innovations and exploring their implications for theory and practice.

4.1. Methodological Innovation in Green Space Equity Assessment

Many existing methods for assessing green space equity use only one metric, such as the Gini coefficient [9] or accessibility [8], which may oversimplify the intricate socio-spatial dynamics. This study advances this topic by using a multidimensional model to investigate social equity and supply-demand relationships. The degree of spatial equilibrium between PGS supply and residential demand is measured through the Coupled Coordination Degree Model (CCDM). Meanwhile, the distributional equity of disadvantaged groups is measured through the Lorenz curve and the Gini coefficient. Chen et al. [19] point out that traditional supply and demand analyses almost never incorporate the impacts of the SDGs or segmentation on specific populations, and this dual framework fills this critical gap.
Combining these approaches offers two major benefits:
  • Holistic measurement: This study is significantly different from previous explorations that focused only on spatial accessibility [15]. While traditional studies are often limited to static analysis of spatial elements, which makes it difficult to truly touch the actual needs and experiences of residents, our approach realizes the deep coupling between spatial patterns and residents’ real needs. On the one hand, we anchor the core indicators of Sustainable Development Goal 11 (SDG11) that are closely related to the quality of life of urban residents and incorporate key elements such as housing affordability and air quality into the assessment system, which directly reflect the basic needs of residents in terms of housing costs and health environment; on the other hand, we innovatively introduce geographic big data technology by crawling and integrating online open platforms of residents’ data. This way of obtaining information based on geographic big data breaks through the limitations of traditional research data with limited sample size and insufficient timeliness and is able to reflect in real time and comprehensively the differences in the spatial use habits and needs of different groups, providing a more persuasive empirical basis for understanding the interactive relationship between urban space and residents’ needs.
  • Social sensitivity: This study identifies minors (under 18) and the elderly (over 65) as PGS-vulnerable groups because cities have physiological and structural differences that make them more vulnerable. It uses the Gini coefficient to show how these groups are vulnerable in the allocation of PGS resources, echoing Wang et al.’s [23] criticism of ‘neutral’ analyses that hide power dynamics. It connects demographic data to spatial patterns, addressing concerns related to earlier aggregate scores in terms of methodology. Showing the differences in PGS quality and amenities between the north and south of Jinan is in accordance with global results [7] that are not often mentioned in Chinese research [57]. The result shows how PGS distribution may be changed for vulnerable groups, which has an effect on Jinan’s 2030 plan. Such evidence makes equity-centered analysis possible.

4.2. Vulnerable Groups and Green Space Justice

This study identifies children and older people as vulnerable groups, a categorization that is based on both empirical and theoretical evidence. These populations are uniquely dependent on local green spaces: minors require safe recreational environments for their development [62], while older adults benefit from physical activity and mental health in the vicinity of green spaces [61]. In addition, they often face mobility constraints, which makes accessibility a key equity dimension that is lacking in analyses that focus only on total population indicators [39].
The Gini coefficient for disadvantaged groups in Jinan (0.35) shows relative balance, which is consistent with global studies showing moderate equity in East Asian cities [37], but masks intra-city differences. For example, northern areas such as Shanghe have low accessibility, mirroring the situation in Beijing [1], where low-income and marginal neighborhoods face a shortage of green space. This highlights the need for further disaggregation of ‘vulnerability’—future research should incorporate socio-economic status and disability; as suggested by Zhao et al. [53]; to avoid homogenizing different needs.

4.3. Implications for Decision-Making

The results supply urban planners and policy makers with assistance on many levels:
  • Insights at the regional level: the complete findings of the park equity assessment enable the Jinan New Urbanization Plan (2021–2035) [56] to decide how to best use resources across different administrative entities.
  • Improvement of spatial effects: Finding the best locations for areas with low accessibility and for parks (Figure 18) can help with small-scale renovations, such as planning new parks in the neighborhoods that need them most to meet the needs of their residents, a strategy that has been very effective in Shanghai [15] and Padua [12].
It is worth noting that the study focuses on SDG 11 coherence to ensure that recommendations are aligned with the international sustainable development agenda, helping cities to achieve local and global goals [21]. In the case of Jinan, prioritizing greenfield investments in the northern region would simultaneously promote equity and SDG11 goals related to inclusive communities.

4.4. Unaddressed Dimensions and Future Work

While this study advances equity assessment, it recognizes the limitations associated with green space quality and use dynamics. These factors were not measured here, but factors such as congestion, availability of amenities (e.g., playgrounds and seating), and ecological quality (e.g., biodiversity) can have a significant impact on actual utilization [7,54]. For example, as Hoffman et al. [7] point out in their study of southern European cities, a well-traveled but poorly maintained park may not be able to achieve the expected benefits.
  • User behavior data: surveys or cell phone signaling data could record, for example, how often residents visit the park [15], which could be a component of future research.
  • Multiple-use benefits: assessing co-benefits such as carbon sequestration or impacts on mental health [51] extends the equity conversation beyond use.
  • Temporal dynamics: tracking the long-term impacts of policy changes or urban sprawl on green space equity [63].
These additions would address the critique that current equity frameworks often treat green spaces as static entities rather than dynamic social-ecological systems [64].

5. Conclusions

This study demonstrates that a robust framework for assessing the fairness of park green space (PGS) resources can be established by combining the principles of SDG 11 with various equity analysis techniques. In Jinan, PGS exhibits a pattern of “concentrated in the south, dispersed in the north”, indicating significant spatial inequality. With a Gini coefficient of 0.35 for vulnerable groups, which suggests that Jinan has a relatively balanced level of social equity but masks significant disparities in the peripheral areas. The proposed approach offers three key contributions to urban sustainability research:
  • The innovative value of this framework lies in its departure from conventional single-indicator analyses. In this study, a comprehensive assessment model of PGS equity (both spatial equity and social distributive justice) is constructed by integrating the indicators of SDG11, the Coupled Coordination Degree Model (CCDM), the Lorenz curve, and Gini coefficients. This connects the fairness of public green space to the larger goal of sustainable urban development and is different from basic approaches that only look at accessibility.
  • Explicitly focusing on minors (under 18) and the elderly (over 65) as vulnerable groups. This is because both groups experience mobility constraints, and minors require safe recreational environments for their development, while older adults benefit from nearby green spaces. Vibrant intra-urban disparities, such as lower PGS accessibility for vulnerable groups in northern districts like Shanghe compared to southern cores like Lixia, are concealed by Jinan’s citywide per capita green space of 12 m2 and Gini coefficient of 0.35.
  • These research findings provide a reference for decision-makers. Based on the evaluation results, PGS resource allocation can be guided, with priority given to northern regions. K-means clustering analysis can determine the optimal location for building new parks in areas with low accessibility, ensuring that intervention measures are consistent across the system and tailored to local conditions.
According to Jinan, constructing parks in northern districts (like Shanghe and Jiyang) and modifying existing PGS to better serve vulnerable groups would promote sustainability and equity. Moreover, this study emphasizes that, in line with SDG11’s universal vision, green space justice necessitates not only equal access but also access to high-quality, useful, and contextually relevant green spaces.
In order to make sure that equity assessments continue to be responsive to changing urban needs, future research should build on these findings by integrating user experience data and long-term monitoring. In the end, this study reaffirms that fair distribution of PGS is essential to just, resilient, and sustainable cities and is not just a planning objective.

Author Contributions

Conceptualization, M.S. and Y.S. (Yingjun Sun); Methodology, M.S. and Y.S. (Yingjun Sun); Software, M.S. and Y.S. (Yingjun Sun); Validation, M.S. and Y.S. (Yingjun Sun); Formal analysis, M.S. and Y.S. (Yingjun Sun); Investigation, M.S., Y.S. (Yingjun Sun), W.M., and Y.S. (Yanshuang Song); Resources, M.S. and Y.S. (Yingjun Sun); Data curation, M.S., Y.S. (Yingjun Sun) and Y.S. (Yanshuang Song); Writing—original draft, M.S. and Y.S. (Yingjun Sun); Writing—review and editing, M.S., Y.S. (Yingjun Sun) and W.M.; Visualization, M.S. and Y.S. (Yingjun Sun); Supervision, Y.S. (Yingjun Sun); Project administration, Y.S. (Yingjun Sun); Funding acquisition, Y.S. (Yingjun Sun). All authors have read and agreed to the published version of the manuscript.

Funding

This research was funded by the cultivation platform for integrating production, science, and education jointly built by Shandong Province and Peking University (20221830).

Institutional Review Board Statement

Not applicable.

Informed Consent Statement

Not applicable.

Data Availability Statement

The original contributions presented in this study are included in the article. Further inquiries can be directed to the corresponding author.

Acknowledgments

The authors sincerely thank the experts for their reviewing, editing, publishing, and dissemination of this work.

Conflicts of Interest

The authors declare no conflicts of interest.

Abbreviations

The following abbreviations are used in this manuscript:
SDGSustainable development goal
PGSPark green space
GISGeographic information systems
PDPatch density
LPILargest patch index
LSILandscape shape index
AIAggregation index
SPLITSplitting index
MESHEffective mesh size

References

  1. Wang, Z.H.; Yan, G.G.; Wang, S.Y. Fairness Evaluation of Landscape Justice in Urban Park Green Space: A Case Study of the Daxing Part of Yizhuang New Town, Beijing. Sustainability 2023, 15, 370. [Google Scholar] [CrossRef]
  2. Yu, J.; Yi, L.W.; Xie, B.G.; Li, X.Q.; Li, J.H.; Xiao, J.Y.; Zhang, L. Matching and coupling coordination between the supply and demand for ecosystem services in Hunan Province, China. Ecol. Indic. 2023, 157, 111303. [Google Scholar] [CrossRef]
  3. Hansen, W.G. How Accessibility Shapes Land Use. J. Am. Inst. Plan. 1959, 25, 73–76. [Google Scholar] [CrossRef]
  4. Liston-Heyes, C.; Heyes, A. Recreational benefits from the Dartmoor National Park. J. Environ. Manag. 1999, 55, 69–80. [Google Scholar] [CrossRef]
  5. Erkip, F.B. The distribution of urban public services: The case of parks and recreational services in Ankara. Cities 1997, 14, 353–361. [Google Scholar] [CrossRef]
  6. Coutts, C.; Horner, M.; Chapin, T. Using geographical information system to model the effects of green space accessibility on mortality in Florida. Geocarto Int. 2010, 25, 471–484. [Google Scholar] [CrossRef]
  7. Hoffimann, E.; Barros, H.; Ribeiro, A.I. Socioeconomic Inequalities in Green Space Quality and Accessibility-Evidence from a Southern European City. Int. J. Environ. Res. Public Health 2017, 14, 916. [Google Scholar] [CrossRef] [PubMed]
  8. Li, M.T.; Yang, L.B.; Wei, Y. Improved Gaussian based 2-step floating catchment area method:A case study of green space accessibility in Shanghai. Prog. Geogr. 2016, 35, 990–996. [Google Scholar] [CrossRef]
  9. Khattak, M.M.H.; Khan, M.A.; Din, S.U.; Khan, M.Z.; Habib, M.F. Examining equity of walking accessibility to green spaces: A case study of Islamabad. Ain Shams Eng. J. 2023, 14, 102556. [Google Scholar] [CrossRef]
  10. Wu, J.S.; Men, X.N.; Liang, J.T.; Zhao, Y.H. Research on supply and demand equilibrium of ecosystem services in Guangdong Province based on the gini coefficient. Acta Ecol. Sin. 2020, 40, 6812–6820. [Google Scholar] [CrossRef]
  11. Tan, C.D.; Tang, Y.H.; Wu, X.F. Evaluation of the Equity of Urban Park Green Space Based on Population Data Spatialization: A Case Study of a Central Area of Wuhan, China. Sensors 2019, 19, 2929. [Google Scholar] [CrossRef]
  12. Semenzato, P.; Costa, A.; Campagnaro, T. Accessibility to urban parks: Comparing GIS based measures in the city of Padova (Italy). Urban For. Urban Green. 2023, 82, 127896. [Google Scholar] [CrossRef]
  13. Chen, Y.Y.; Men, H.L.; Ke, X.L. Optimizing urban green space patterns to improve spatial equity using location-allocation model: A case study in Wuhan. Urban For. Urban Green. 2023, 84, 127922. [Google Scholar] [CrossRef]
  14. Meng, L.; Li, L. Relationship between supply and demand of green open space in Haidian District of Beijing based on accessibility. J. Beijing For. Univ. 2023, 45, 108–119. [Google Scholar] [CrossRef]
  15. Xiao, Y.; Wang, D.; Fang, J. Exploring the disparities in park access through mobile phone data: Evidence from Shanghai, China. Landsc. Urban Plan. 2019, 181, 80–91. [Google Scholar] [CrossRef]
  16. Alfred, M. Principles of Economics, 8th ed.; University of Minnesota Libraries Publishing: Minneapolis, MN, USA, 1890. [Google Scholar]
  17. Wu, J.S.; Si, M.L.; Li, W.F. Spatial equity analysis of urban green space from the perspective of balance between supply and demand: A case study of Futian District, Shenzhen, China. Chin. J. Appl. Ecol. 2016, 27, 2831–2838. [Google Scholar] [CrossRef]
  18. Wang, M.; Zhu, A.N.; Wang, J.Q.; Lu, T.F. Supply and demand relationship of urban park green space allocation based on social equity and justice: A case study of Xuhui District, Shanghai. Acta Ecol. Sin. 2019, 39, 7035–7046. [Google Scholar] [CrossRef]
  19. Chen, Y.L.; Yu, P.H.; Li, Z.G.; Wang, J.; Chen, Y.Y. Environmental Equity Measurement of Urban Green Space from the Perspective of SDG11: A Case Study of the Central Urban Area of Wuhan. Geogr. Geo-Inf. Sci. 2021, 37, 81–89. Available online: https://hfgfy2b08d79e045e4fd4su9fu65c0oxcu6ooxficg.res.gxlib.org.cn/kcms2/article/abstract?v=xhAGsX4BfX4Fm4CsMOpmvWaT2Zg1IxTBnXY6Aux7zyLVt3zGt63JfSHrrKQGNzGSmk2HOx7m4f6VjRcsk9BL09MTV-21T7T6O4yMUkuezIC2XwIrpS-gUiMOmpQ4Js1RC99M6yGBYKHCBylAvuRGgV60BmFF7OCC_UfwM0-_m4Ae86s77qHEPXNEP9MENi6j&uniplatform=NZKPT&language=CHS (accessed on 18 August 2025).
  20. Huang, C.L.; Sun, Z.C.; Jiang, H.P.; Wang, J.H. Big Earth Data Supports Sustainable Cities and Communities: Progress and Challenges. Bull. Chin. Acad. Sci. 2021, 36, 914–922. [Google Scholar] [CrossRef]
  21. Abastante, F.; Lami, I.M.; Gaballo, M. Pursuing the SDG11 Targets: The Role of the Sustainability Protocols. Sustainability 2021, 13, 3858. [Google Scholar] [CrossRef]
  22. Akuraju, V.; Pradhan, P.; Haase, D.; Kropp, J.P.; Rybski, D. Relating SDG11 indicators and urban scaling—An exploratory study. Sustain. Cities Soc. 2020, 52, 101853. [Google Scholar] [CrossRef]
  23. Wang, X.; Meng, Q.; Liu, X.; Allam, M.; Zhang, L.; Hu, X.; Bi, Y.; Jancsó, T. Evaluation of Fairness of Urban Park Green Space Based on an Improved Supply Model of Green Space: A Case Study of Beijing Central City. Remote Sens. 2023, 15, 244. [Google Scholar] [CrossRef]
  24. Yang, J.; Huang, X. The 30 m annual land cover dataset and its dynamics in China from 1990 to 2019. Earth Syst. Sci. Data 2021, 13, 3907–3925. [Google Scholar] [CrossRef]
  25. Wei, J.; Li, Z.; Chen, X.; Li, C.; Sun, Y.; Wang, J.; Lyapustin, A.; Brasseur, G.; Jiang, M.; Sun, L.; et al. Separating daily 1 km PM2.5 inorganic chemical composition in China since 2000 via deep learning integrating ground, satellite, and model data. Environ. Sci. Technol. 2023, 57, 18282–18295. [Google Scholar] [CrossRef]
  26. Shannon, C.E. A Mathematical Theory of Communication. Bell Syst. Tech. J. 1948, 27, 379–423. [Google Scholar] [CrossRef]
  27. Wu, J.; Yang, S.; Zhang, X. Interaction Analysis of Urban Blue-Green Space and Built-Up Area Based on Coupling Model—A Case Study of Wuhan Central City. Water 2020, 12, 2185. [Google Scholar] [CrossRef]
  28. Ji, Y.Y.; Zh, L.J. Comparative analysis of spatial–temporal differences in sustainable development between the Yangtze River Economic Belt and the Yellow River Economic Belt. Environ. Dev. Sustain. 2023, 25, 979–994. [Google Scholar] [CrossRef]
  29. Chen, J.; Zhang, Y.L.; Chen, Z.Y.; Nie, Z.L. Improving assessment of groundwater sustainability with analytic hierarchy process and information entropy method: A case study of the Hohhot Plain, China. Environ. Earth Sci. 2015, 73, 2353–2363. [Google Scholar] [CrossRef]
  30. Yin, H.Y.; Xiao, R.; Fei, X.F.; Zhang, Z.H.; Gao, Z.; Wan, Y.; Tan, W.f.; Jiang, X.C.; Cao, W.; Guo, Y.X. Analyzing “economy-society-environment” sustainability from the perspective of urban spatial structure: A case study of the Yangtze River delta urban agglomeration. Sustain. Cities Soc. 2023, 96, 104691. [Google Scholar] [CrossRef]
  31. Xun, J.; Zhang, M.; Xu, G.F.; Guo, X.Y. Diversity and Influencing Factors of Public Service Facilities in Urban (Suburban) Railway Life Circle—Evidence from Beijing Subway Line S1, China. Land 2024, 13, 1286. [Google Scholar] [CrossRef]
  32. Wang, F. Quantitative Methods and Applications in GIS, 1st ed.; CRC Press: Boca Raton, FL, USA, 2006. [Google Scholar]
  33. Zheng, Z.C.; Shen, W.; Li, Y.; Qin, Y.C.; Wang, L. Spatial equity of park green space using KD2SFCA and web map API: A case study of zhengzhou, China. Appl. Geogr. 2020, 123, 102310. [Google Scholar] [CrossRef]
  34. Lin, Y.Q.; Liu, Y.B.; Ouyang, Z.Y.; Meng, C.; Xiao, Y. Mechanisms and influencing factors of cultural ecosystem services value realization. Environ. Sustain. Indic. 2025, 26, 100584. [Google Scholar] [CrossRef]
  35. Ke, X.L.; Huang, D.Y.; Zhou, T.; Men, H.L. Contribution of non-park green space to the equity of urban green space accessibility. Ecol. Indic. 2023, 146, 109855. [Google Scholar] [CrossRef]
  36. Lorenz, M.O. Methods of Measuring the Concentration of Wealth. Publ. Am. Stat. Assoc. 1905, 9, 209–219. [Google Scholar] [CrossRef]
  37. Zhou, Y.; Xie, H.; Liu, X.; Wang, X.; Wang, Z. From service capacity to spatial equity: Accurately and comprehensively evaluating urban park green space distribution under multi-trips mode. PLoS ONE 2024, 19, e0296629. [Google Scholar] [CrossRef]
  38. Drezner, T.; Drezner, Z.; Guyse, J. Equitable service by a facility: Minimizing the Gini coefficient. Comput. Oper. Res. 2009, 36, 3240–3246. [Google Scholar] [CrossRef]
  39. Rao, Y.X.; Zhong, Y.; He, Q.S.; Dai, J.Y. Assessing the Equity of Accessibility to Urban Green Space: A Study of 254 Cities in China. Int. J. Environ. Res. Public Health 2022, 19, 4855. [Google Scholar] [CrossRef]
  40. Song, H.F.; Tian, W.; Wang, Y.M.; Zhang, Z. Regional high-quality development evaluation and spatial balance analysis. Procedia Comput. Sci. 2022, 214, 1032–1039. [Google Scholar] [CrossRef]
  41. Zhang, Y.; Zhu, T.X.; Guo, H.Y.; Yang, X.H. Analysis of the coupling coordination degree of the Society-Economy-Resource-Environment system in urban areas: Case study of the Jingjinji urban agglomeration, China. Ecol. Indic. 2023, 146, 109851. [Google Scholar] [CrossRef]
  42. Bi, Y.Z.; Zheng, L.; Wang, Y.; Li, J.F.; Yang, H.; Zhang, B.W. Coupling relationship between urbanization and water-related ecosystem services in China’s Yangtze River economic Belt and its socio-ecological driving forces: A county-level perspective. Ecol. Indic. 2023, 146, 109871. [Google Scholar] [CrossRef]
  43. Qu, W.; Lian, H.; Wang, Y.; Ma, Y. Spatiotemporal Evolution of the Coupling Coordination Relationship of “Population–Environment” Development in the Xi’an Metropolitan Area. Sustainability 2023, 15, 4533. [Google Scholar] [CrossRef]
  44. Lu, C.; Li, S.; Liu, J.; Xu, K. Coupling Coordination and Dynamic Response Analysis of New-Type Urbanization, Urban Infrastructure and Urban Environment—A Case Study of the Jiaodong Economic Circle. Environ. Res. Public Health 2022, 19, 14909. [Google Scholar] [CrossRef] [PubMed]
  45. Tong, A.Q.; Xu, L.H.; Ma, Q.W.; Shi, Y.J.; Feng, M.; Lu, Z.W.; Wu, Y.Q. Evaluation of the level of park space service based on the residential area demand. Urban For. Urban Green. 2024, 93, 128214. [Google Scholar] [CrossRef]
  46. GB/T 51346-2019; Standard for Planning of Urban Green Space. National Standard of the People’s Republic of China: Beijing, China, 2019; pp. 10–20. Available online: https://www.mohurd.gov.cn/gongkai/zc/wjk/art/2019/art_17339_242194.html (accessed on 18 August 2025).
  47. Belén, M.; Ortega, E.; Rodrigo, C.W.; Antonio, L.; Andrea, D.M. Assessing road network resilience: An accessibility comparative analysis. Transp. Res. Part D Transp. Environ. 2021, 95, 102851. [Google Scholar] [CrossRef]
  48. Suhaida, M.S.; Tawil, N.M.; Hamzah, N.; Che-Ani, A.I.; Basri, H.; Yuzainee, M.Y. Housing Affordability: A Conceptual Overview for House Price Index. Procedia Eng. 2011, 20, 346–353. [Google Scholar] [CrossRef]
  49. Jing, Y.; Cui, J.X.; Ma, D.; Chen, Y.Y. Editorial: Towards sustainable urban development: Use of geographic big data for spatial planning. Front. Environ. Sci. 2023, 11, 1202661. [Google Scholar] [CrossRef]
  50. Guo, R.; Ann Diehl, J.; Zhang, R.; Wang, H.C. Spatial equity of urban parks from the perspective of recreational opportunities and recreational environment quality: A case study in Singapore. Landsc. Urban Plan. 2024, 247, 105065. [Google Scholar] [CrossRef]
  51. Yue, H.B.; He, C.Y.; Huang, Q.X.; Zhang, D.; Shi, P.J.; Moallemi, E.A.; Xu, F.J.; Yang, Y.; Qi, X.; Ma, Q.; et al. Substantially reducing global PM2.5-related deaths under SDG3.9 requires better air pollution control and healthcare. Nat. Commun. 2024, 15, 2729. [Google Scholar] [CrossRef]
  52. Zhao, Z.X.; Pan, Y.; Zhu, J.; Wu, J.X.; Zhu, R. The Impact of Urbanization on the Delivery of Public Service–Related SDGs in China. Sustain. Cities Soc. 2022, 80, 103776. [Google Scholar] [CrossRef]
  53. Zhao, Y.Q.; Gong, P. Optimal site selection strategies for urban parks green spaces under the joint perspective of spatial equity and social equity. Front. Public Health 2024, 12, 1310340. [Google Scholar] [CrossRef] [PubMed]
  54. Ma, J.H.; Wang, X.F.; Zhou, J.T.; Jia, Z.X.; Feng, X.M.; Wang, X.X.; Zhang, X.R.; Tu, Y.; Yao, W.J.; Sun, Z.C.; et al. Exploring the response of ecosystem services to landscape change: A case study from eastern Qinghai province. J. Geogr. Sci. 2023, 33, 1897–1920. [Google Scholar] [CrossRef]
  55. Yan, W.Q.; Wang, S.J. Analysis on the spatial accessibility of parks and green spaces and optimal site selection—Taking Weifang prefecture-level city as an example. IOP Conf. Ser. Earth Environ. Sci. 2021, 865, 012020. [Google Scholar] [CrossRef]
  56. Government, Jinan Municipal People’s. Jinan New Urbanization Plan (2021–2035). 2022. Available online: http://www.jinan.gov.cn/art/2022/7/15/art_2612_4924052.html?xxgkhide=1http://www.jinan.gov.cn/art/2022/7/15/art_2612_4924052.html?xxgkhide=1 (accessed on 18 August 2025).
  57. Huang, Y.; Yu, P.; Xie, P. Analysis and Optimized Location Selection of Comprehensive Green Space Supply in the Central Urban Area of Hefei Based on GIS. Buildings 2023, 13, 2731. [Google Scholar] [CrossRef]
  58. Wang, C.X.; Huang, S.Y.; Deng, M.T.; Wei, W. Research on Equity of Park Green Spaces in High-density Cities from the Perspective of Supply-demand Coupling Coordination: A Case Study of Longhua District, Shenzhen. Chin. Landsc. Archit. 2023, 39, 79–84. [Google Scholar] [CrossRef]
  59. Yang, J.P. Research on optimization strategies for urban park green space planning in Nanjing based on GIS from the perspectives of network analysis and Thiessen polygon theory. Int. J. Mod. Phys. C 2023, 36, 2441002. [Google Scholar] [CrossRef]
  60. Fan, F.X.; Zheng, R.X.; Zeng, C.R.; Xu, H.Y.; Wang, X.X.; Tian, G.L.; Wang, S.H.; Wang, C.; Liu, P.F.; Shu, C.Z. Synergistically dissipating the local strain and restraining lattice oxygen escape by fine-tuning of microstructure enabling Ni-rich cathodes with superior cyclabilities. J. Energy Chem. 2025, 105, 24–34. [Google Scholar] [CrossRef]
  61. Jin, M.J.; Deng, Q.T.; Wang, S.Y.; Wei, L.T. Equity Evaluation of Elderly-Care Institutions Based on Ga2SFCA: The Case Study of Jinan, China. Sustainability 2023, 15, 16943. [Google Scholar] [CrossRef]
  62. Zhang, S.J.; Yu, P.H.; Chen, Y.Y.; Jing, Y.; Zeng, F.X. Accessibility of Park Green Space in Wuhan, China: Implications for Spatial Equity in the Post-COVID-19 Era. Int. J. Environ. Res. Public Health 2022, 19, 5440. [Google Scholar] [CrossRef] [PubMed]
  63. Gao, J.; Zhang, Z.H.; Li, W.Y.; Sun, F.Y.; Hu, Y.N.; Wang, L.X.; Fu, J.; Li, X.; Cheng, G.D. Urban Sustainable Development Evaluation with Big Earth Data: Data, Indicators, and Methods. Bull. Chin. Acad. Sci. 2021, 36, 940–949. [Google Scholar] [CrossRef]
  64. Gu, K.; Liu, J.M.; Wang, D.; Dai, Y.; Li, X.Y. Analyzing the Supply and Demand Dynamics of Urban Green Spaces Across Diverse Transportation Modes: A Case Study of Hefei City’s Built-Up Area. Land 2024, 13, 1937. [Google Scholar] [CrossRef]
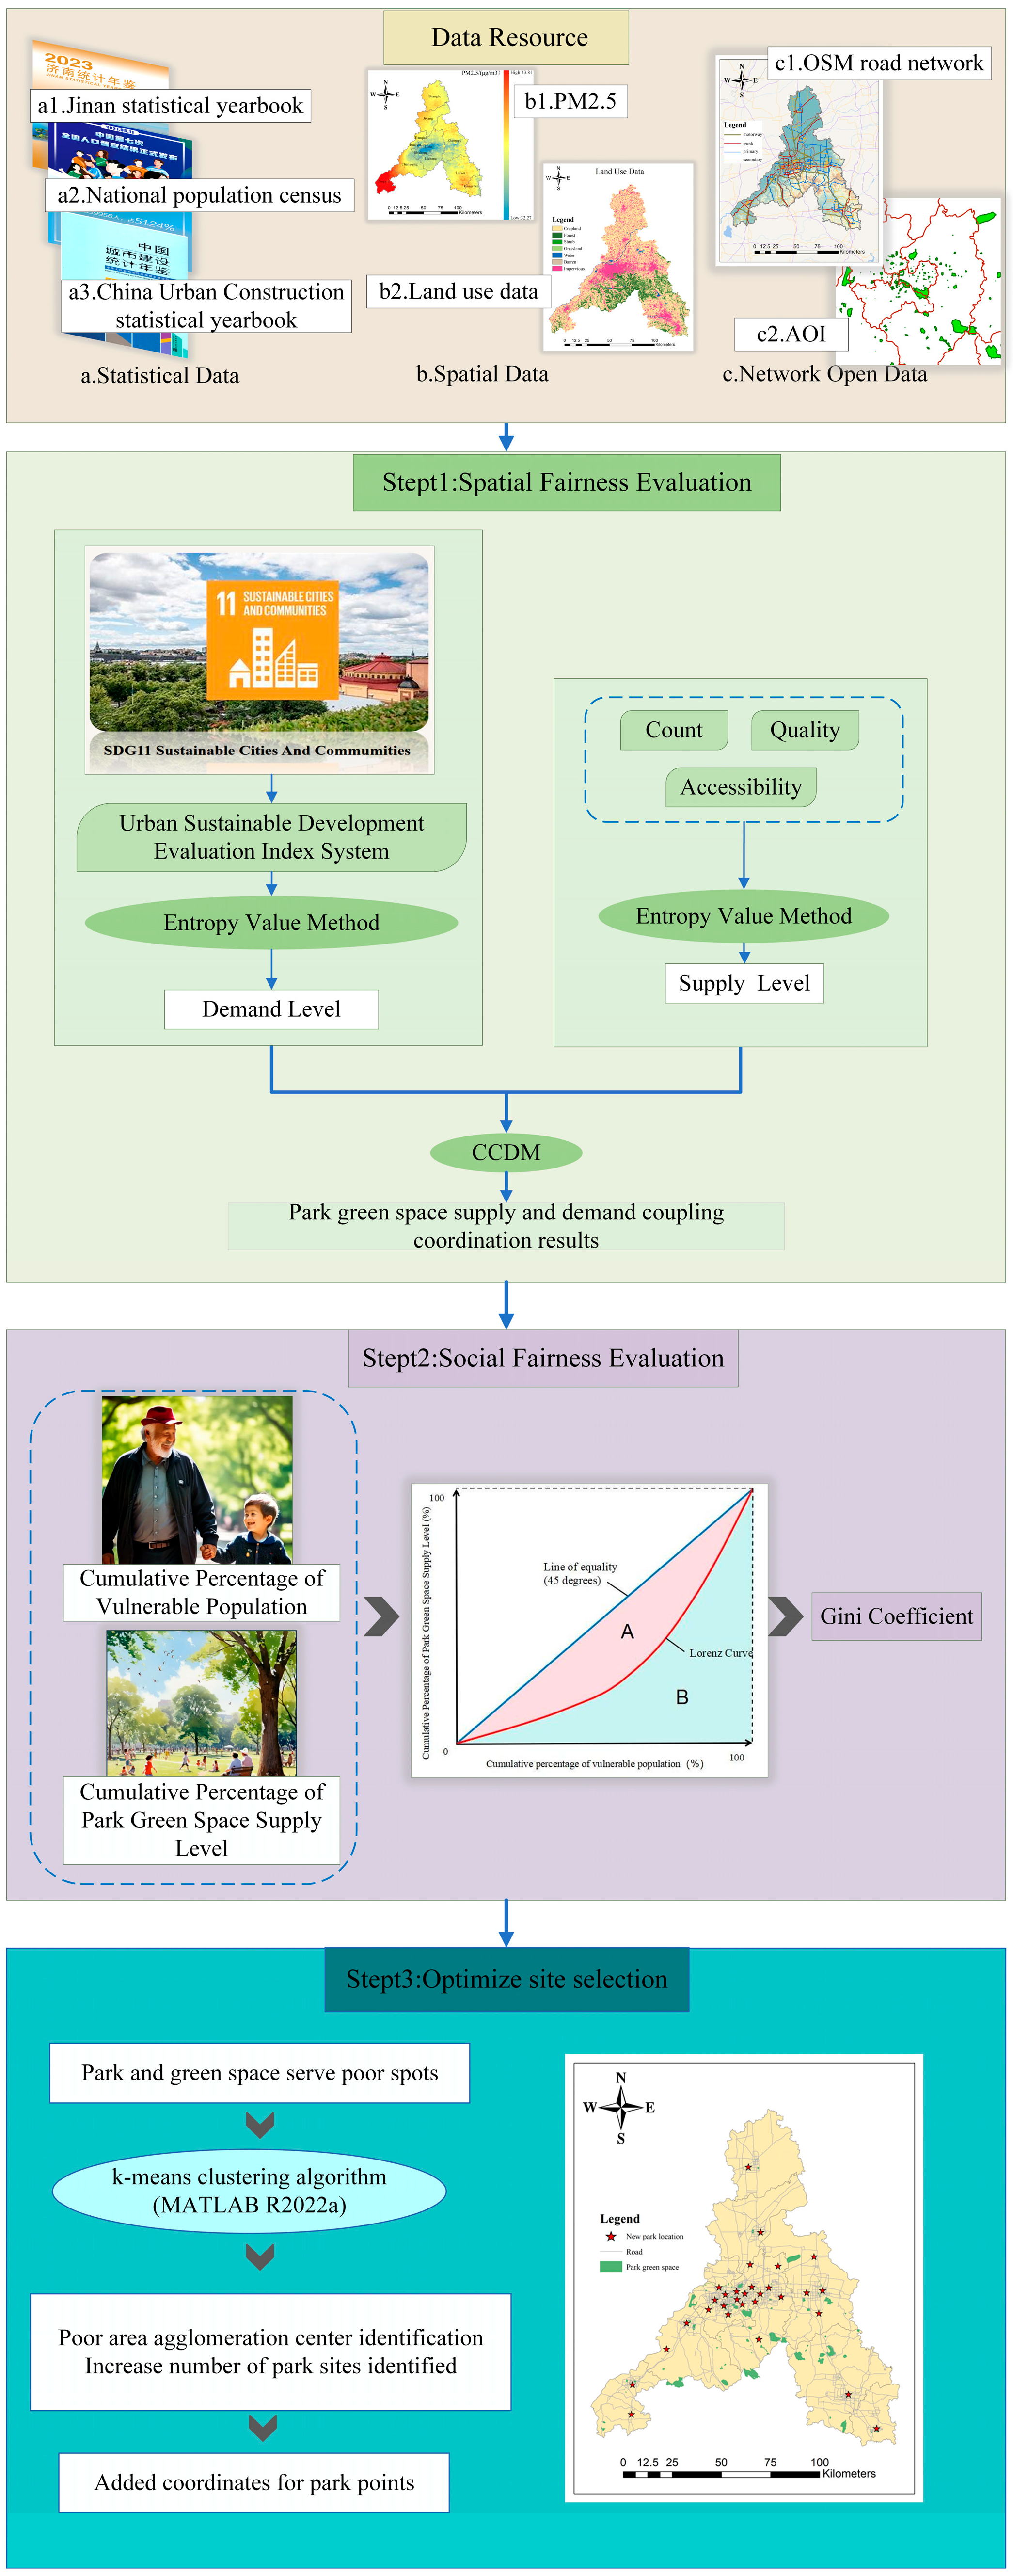
Figure 1. Parks and Greenspace Equity Assessment Technical Track. This technical route integrates multi-source data, assesses the spatial fairness of parks and green spaces and social fairness through entropy value method, and then completes the optimization of site selection through the k-means clustering algorithm to construct a complete flow of data acquisition, fairness assessment, and spatial optimization. The complete process from data acquisition and equity assessment to spatial optimization is constructed.
Applsci 15 09239 g001
Figure 2. The overview map of the study area. (a,b) Locational context of the study area in China and Shandong. (c) Elevation distribution in Jinan.
Applsci 15 09239 g002
Figure 3. Schematic diagram of 2SFCA. Green points are park points (supply points), orange points are residential points (demand points), d 0 is the search radius, and blue dashed circles are search domains formed with supply (demand) points as centers.
Applsci 15 09239 g003
Figure 4. Schematic diagram of Lorentz curve. The horizontal axis shows the cumulative percentage of the vulnerable population, and the vertical axis shows the cumulative percentage of PGS supply. The 45-degree “Line of equality” represents perfect distribution equality; the “Lorenz Curve” shows the actual distribution, with Area A (between them) and Area B (under the curve) used to calculate the Gini coefficient reflecting distribution inequality.
Applsci 15 09239 g004
Figure 5. The PGS layout of the study area.
Applsci 15 09239 g005
Figure 6. Statistics of the quantity and area of different types of parks.
Applsci 15 09239 g006
Figure 7. The apartment complex points layout of the study area.
Applsci 15 09239 g007
Figure 8. Standardized results for sustainable urban development. (Performance of Various Regions on SDG11 Indicators (SDG11.1–SDG11.6, SDG11.a): Red = Low, Yellow = Medium, Green = High).
Applsci 15 09239 g008
Figure 9. Spatial distribution of PGS demand level.
Applsci 15 09239 g009
Figure 10. PGS Indicator Statistics by Region: Count (Green), Area (Red), Per Capita PGS Location Entropy (Blue), Per Capita PGS Service Location Entropy (Yellow).
Applsci 15 09239 g010
Figure 11. Spatial distribution of indicators for the quantities of PGS.
Applsci 15 09239 g011
Figure 12. Spatial distribution of quality indicators for PGS.
Applsci 15 09239 g012
Figure 13. Accessibility of PGS.
Applsci 15 09239 g013
Figure 14. Spatial Distribution of Integrated Service Levels of Parks and Green Spaces.
Applsci 15 09239 g014
Figure 15. PGS supply-demand coupled coordination results.
Applsci 15 09239 g015
Figure 16. Lorenz curve of PGS level: with cumulative percentage of vulnerable population on X-axis and cumulative percentage of supply level on Y-axis.
Applsci 15 09239 g016
Figure 17. k-means clustering curve: X-axis for number of clusters (k), Y-axis for clustering validity score.
Applsci 15 09239 g017
Figure 18. The addition park points layout of study area.
Applsci 15 09239 g018
Table 1. List of data sources.
TypeDataSource
Statistical dataStatistical yearbookhttp://jntj.jinan.gov.cn/art/2023/12/21/art_27523_4750235.html (accessed on 18 August 2025)
National population census https://www.stats.gov.cn/sj/pcsj/rkpc/d7c (accessed on 18 August 2025)
China urban construction statistical yearbookhttps://www.mohurd.gov.cn/gongkai/fdzdgknr/sjfb/tjxx/jstjnj/index.html (accessed on 18 August 2025)
Spatial dataLand use data [24]https://zenodo.org/record/8176941 (accessed on 21 August 2025)
PM2.5 data [25]https://data.tpdc.ac.cn/zh-hans/data/6168e75d-93ab-4e4a-b7ff-33152e49d0bf (accessed on 18 August 2025)
Web-based open dataOSM datahttp://planet.openstreetmap.org (accessed on 21 August 2025)
POI/AOI datahttps://www.amap.com (accessed on 21 August 2025)
Table 2. Types of parks and scope of services.
TypeArea (hm2)Scope of Services (m)
Comprehensive Park>503000
20–502000
10–201000
Community Park5–10800
1–5500
Playground<1300
Specialized Park/Determine the scope of services based on the size of the area
Table 3. Indicators for the evaluation of sustainable urban development.
CategorySDG11 IndicatorProxy IndicatorsExplanations
Housing
conditions
SDG 11.1Urban Housing
Price-to-Income Ratio
PIR = Urban   Housing   Price Income [48]
Urban constructionSDG11.2Road Network
Density
K = Road   length District   Area [47]
Urban constructionSDG11.3Constructed AreaThe area within the urban administrative area that has actually been developed and constructed, and the municipal public facilities and public facilities are basically equipped [49].
Cultural protectionSDG11.4Location Entropy of Cultural Venues Q   = ( L ij / L i ) ( L kj / L k )
where Q is locational entropy, Lij Li denotes the sum of the j factors in region i, Lkj denotes the sum of the j factors in region y and Lk denotes the sum of the factors in region k [50].
Vulnerable groupsSDG11.5Proportion of the vulnerable populationMinors and the elderly are two groups that are relatively disadvantaged socially, economically, and in terms of health and require appropriate policies and services. In this study, minors under the age of 18 and older persons over the age of 65 are collectively referred to as the “vulnerable population” [13,19].
Air pollutionSDG11.6Annual average PM2.5 concentrationThis indicator reflects the annual average concentration of fine suspended particles with a diameter of less than 2.5 μm. Good air quality is the basis for a healthy life for urban residents and sustainable urban development [51].
Urban-rural coordinationSDG11.aUrbanization rateThe urbanization rate is a direct reflection of the distribution of the population between urban and rural areas [52].
Table 4. Landscape pattern indicators.
ClassificationIndex NameDescribeUnit
Density indexPDpatch density/100 hm2
Area indicatorLPIThe proportion of the largest patch to the landscape area%
MESHThe ratio of the sum of squares of patch areas in the landscape to the total landscape areahm2
AREA_AMWeighted size of plaque areahm2
Shape indexSHAPE_MNAverage shape index of plaques/
LSILandscape Shape Index/
Aggregation and dispersion indexAIConnectivity between patches of each landscape type%
Other indicatorsSPLITSeparation degree of distribution of different patch numbers in a certain landscape/
DIVISIONThe degree of fragmentation of landscape segmentation/
Table 5. Examples of park boundaries and gates (red dots).
TypeNameArea/hm2Park Boundaries and Gates
Comprehensive ParkDaming Lake Park103.97Applsci 15 09239 i001
Community ParkTangye Park7.63Applsci 15 09239 i002
Specialized ParkJinan Zoo56.29Applsci 15 09239 i003
PlaygroundQuan Cheng
Impression Garden
0.28Applsci 15 09239 i004
Table 6. Weight of evaluation indicators for urban sustainable development.
IndicatorsSDG11.1SDG11.2SDG11.3SDG11.4SDG11.5SDG11.6SDG11.a
Weight0.090.150.280.160.090.070.16
Table 7. Weight of evaluation indicators for the quantities of PGS.
IndicatorsWeight
Count0.17
Area0.35
Per capita PGS location entropy0.33
Per capita PGS service location entropy0.16
Disclaimer/Publisher’s Note: The statements, opinions and data contained in all publications are solely those of the individual author(s) and contributor(s) and not of MDPI and/or the editor(s). MDPI and/or the editor(s) disclaim responsibility for any injury to people or property resulting from any ideas, methods, instructions or products referred to in the content.