Article

Space–Bandwidth Product Extension for Holographic Displays Through Cascaded Wavefront Modulation

1
School of Optical-Electrical and Computer Engineering, Engineering Research Center of Optical Instrument and System, Ministry of Education and Shanghai Key Laboratory of Modern Optics System, University of Shanghai for Science and Technology, Shanghai 200093, China
2
Engineering Research Center of Optical Instrument and System, Ministry of Education and Shanghai Key Laboratory of Modern Optical System, College of Communication and Art Design, University of Shanghai for Science and Technology, No. 516 Jungong Road, Shanghai 200093, China
*
Author to whom correspondence should be addressed.
Appl. Sci. 2025, 15(17), 9237; https://doi.org/10.3390/app15179237
Submission received: 25 July 2025 / Revised: 19 August 2025 / Accepted: 20 August 2025 / Published: 22 August 2025

Abstract

The immersive experience of holographic displays is fundamentally limited by their space–bandwidth product (SBP), which imposes an inherent trade-off between the field of view (FOV) and eyebox size. This paper proposes a method to extend the SBP by employing cascaded modulation with a dynamic spatial light modulator (SLM) and a passive high-resolution binary random phase mask (BRPM). We find that the key to unlocking this extension of SBP lies in a sophisticated algorithmic optimization, grounded in a physically accurate model of the system. We identify and correct the Nyquist undersampling problem caused by high-frequency scattering in standard diffraction models. Based on this physically accurate model, we employ a gradient descent optimization framework to achieve efficient, end-to-end solving for complex light fields. Simulation and experimental results demonstrate that our method achieves an approximately 16-fold SBP extension (4-fold FOV) while delivering significantly superior reconstructed image quality compared to the traditional Gerchberg–Saxton (GS) algorithm. Furthermore, this study quantitatively reveals the system’s extreme sensitivity to sub-pixel level alignment accuracy, providing critical guidance for the engineering and implementation of our proposed method.

1. Introduction

Holographic display technology, through its precise manipulation of light wavefronts, can reconstruct photorealistic three-dimensional (3D) light fields in space [1,2,3]. This capability distinguishes it from all conventional two-dimensional display technologies and enables it to resolve the vergence-accommodation conflict (VAC) inherent in the human visual system [4]. Consequently, it is widely regarded as the ultimate display solution for the next generation of virtual reality (VR) and augmented reality (AR). In a digital holographic system, the core performance is dictated by its space–bandwidth product (SBP), a parameter that directly governs the intrinsic trade-off between the field of view (FOV) and the eye-box size [5]. However, in systems centered around a spatial light modulator (SLM) [6], the SBP is fundamentally limited by the number of pixels on the SLM [7,8,9]. According to the grating equation, the FOV is inversely proportional to the pixel pitch of the SLM [10]. For immersive virtual reality/augmented reality (VR/AR) devices, a desired field of view (FOV) is at least 120°, with an eyebox size larger than 10 mm × 10 mm. Mainstream SLMs, such as liquid-crystal-on-silicon (LCoS) devices, are still constrained to a small viewing angle due to their large pixel pitch and limited resolution [8,9]. Conversely, when we try to enlarge the FOV by demagnifying the SLM into small pixel pitch, the reduction of effective SLM screen size further restricts the viewing pupil area, i.e., the eyebox. This “SBP bottleneck” has become the primary technical barrier to achieving immersive experiences with a large FOV without compromising other metrics.
To break through the SBP bottleneck, researchers have explored various avenues. For instance, strategies that directly expand the SBP by physically tiling or time-multiplexing SLMs have been proposed [11,12,13,14,15,16,17,18]. However, these methods generally require complex, costly, and bulky optical systems, making them ill-suited for the stringent demands of near-eye displays. An alternative approach involves using active metasurfaces, composed of artificial nanorods made from phase-change materials, for wavefront manipulation. Yet, this method requires further optimization to achieve stable system driving and pixelation [19,20,21]. Against this backdrop, extending the effective SBP by augmenting an existing SLM with a passive optical element has emerged as a highly attractive and cost-effective technical path.
Following this line of thought, researchers have attempted to enhance the viewing angle of holograms using non-pixelated diffusers with completely unknown phase values [22,23,24]. The advantages of this method include the ability to increase the viewing angle to match the diffusion angle of the diffuser and the elimination of the zero-order diffraction even for on-axis holograms. However, because the phase transmission characteristics of the diffuser are unknown and non-pixelated, calculating the corresponding hologram often requires additional system calibration combined with feedback-based algorithms from optical wavefront shaping [25,26,27], leading to a significant increase in computation time compared to traditional methods. Another method for enhancing the viewing angle employs a “super-resolution phase mask,” which features a random phase profile similar to a diffuser but has a pixelated structure with a known phase value for each pixel [28,29,30]. One merit of this approach is that the viewing angle can be arbitrarily controlled by adjusting the pixel size. Another advantage is that its phase-modulating structure enables the reconstruction of high-brightness holograms.
However, all previous studies based on static masks have suffered from an overlooked and fundamental disconnect: the physical extension of the hardware and the optimization capability of the computational holography algorithm were not truly synergistic. Although the system physically achieves a larger information capacity (space–bandwidth product, SBP), existing iterative optimization algorithms, such as the Gerchberg–Saxton (GS) algorithm (mainly used for phase retrieval from intensity information) [31] and the Iterative Fourier Transform Algorithm (IFTA) (which generates phase-only holograms through repeated transformations between two planes) [32], cannot effectively handle complex optical systems that incorporate a fixed phase mask. This leads to the reconstructed image being overwhelmed by severe scattering noise [30]. The deeper problem is that previous numerical models failed to accurately describe the high-frequency scattering characteristics introduced by the static mask, causing the optimization algorithm to rely on a distorted and erroneous physical model during iteration—searching for a solution on a flawed “map” from the very beginning. Consequently, while the system possessed greater information capacity, it has always lacked an effective algorithm to accurately “write” the target information into this expanded channel.
To fill this gap, this paper proposes an SBP extension framework that deeply integrates physically accurate modeling with advanced algorithmic optimization. Our core contribution is twofold. First, at the modeling level, we establish a physically accurate propagation model for the cascaded modulation implemented by the overlap of dynamic spatial light modulator (SLM) and a passive high-resolution binary random phase mask (BRPM). This model provides a correct gradient flow for the optimization process and enables the SBP extension of the holographic display system. Second, at the algorithmic level, we move beyond traditional methods and adopt a modern optimization framework based on gradient descent [33]. This optimization method, widely used in the field of deep learning, has proven to be exceptionally effective in solving complex, non-convex inverse problems in optics [34]. The framework seamlessly integrates the complex physical process, including the fixed BRPM, into an end-to-end differentiable model. This enables an efficient search within a precisely described broader solution space to optimally encode the target information into the extended SBP, thereby suppressing noise and enhancing fidelity at their source. Comprehensive numerical simulations and optical experiments have verified the superiority of our approach in extending FOV and improving reconstruction quality, while also revealing key engineering challenges, such as alignment precision, paving the way for the practical application of this technology.

2. Principle and Method

2.1. SBP Extension Principle Based on a Static Mask

The space–bandwidth product (SBP) of a conventional holographic display system is defined as the product of the system’s dimensions in the spatial domain and its bandwidth in the frequency domain, given by S B P = X Y · ( 4 B x B y ) . Here, X = N x Δ x and Y = N y Δ y represent the physically effective area of the spatial light modulator (SLM), which is determined by its pixel count ( N x , N y ) and pixel pitch ( Δ x , Δ y ). The terms B x = s i n θ x / λ , B y = s i n θ y / λ are the single-sided bandwidths of the spatial frequency, whose upper limits are determined by the maximum diffraction angle of the SLM ( θ m a x ) and the wavelength of the illumination light ( λ ). According to the Nyquist sampling theorem, to avoid aliasing between diffraction orders, the maximum diffraction angle is strictly constrained by the pixel pitch [35]:
θ x _ m a x = sin 1 λ 2 Δ x , θ y _ m a x = sin 1 λ 2 Δ y
By substituting Equation (1) into the bandwidth definition and then combining it with the SBP definition, the theoretical limit of the SBP for a conventional holographic display system can be derived as follows:
S B P s l m N x Δ x N y Δ y 4 s i n θ x _ max λ s i n θ y _ max λ = N x N y
Equation (2) reveals a fundamental limitation: the SBP of a conventional holographic system is entirely determined by the total pixel count of the SLM, i.e., SBP_ S B P s l m N x N y . This fundamental constraint creates an inherent trade-off between the field of view (FOV) and the resolution or eyebox size, as illustrated in Figure 1a.
To overcome this limitation, we propose adding a pre-customized binary random phase mask (BRPM) after the SLM, as shown in Figure 1b. The BRPM is a binary (0 or π) phase map that is randomly generated by a computer and fabricated onto a physical component using photolithography. The fabrication process consists of two main stages. First, a master mold (stamp) is created by etching the desired pattern onto a substrate using laser beam lithography. Subsequently, this mold is imprinted onto a resin layer coated on a glass substrate, faithfully replicating the phase pattern onto the resin. The resulting BRPM has two key characteristics. Firstly, it is a known, static, pure phase element that remains unchanged throughout the optimization and experimental processes. Secondly, it offers high spatial resolution, with a feature size significantly smaller than the pixel pitch of a spatial light modulator (SLM). We have fully integrated these properties into our design framework. Since the refractive index of the resin has wavelength dependency (i.e., it changes with wavelength), a high-speed SLM must be utilized to realize a colorization scheme via time-multiplexing technology. Specifically, the red, green, and blue (RGB) light sources can be turned on in a time-divided manner, while the corresponding phase holograms, independently optimized for each color of light, are synchronously loaded onto the SLM. Considering that the BRPM introduces different phase delays for different wavelengths, we can use the formula ϕ r / g / b = 2 π / λ n r / g / b 1 h for the conversion, where λ is the wavelength, n r / g / b is the refractive index of the resin at the corresponding wavelength, and h is the etching depth of the resin. Additionally, the principle shown in Figure 1b is based on a transmissive SLM design. For a reflective SLM, it can be made equivalent to a transmissive one by adding a beam splitter (BS) after it, in conjunction with a 4f system. The specific implementation is detailed in the Experimental Setup Section.
In this configuration, the SLM modulates a uniform incident beam with a phase-only hologram ϕ C G H x , y , and its output wavefront immediately passes through the BRPM. The final output field of the system, U o u t x , y , is as follows:
U o u t x , y = A 0 e x p j ϕ C G H x , y e x p j ϕ B R P M x , y
where A 0 is the amplitude of the uniform incident light, and ϕ B R P M x , y is the known, fixed phase distribution of the BRPM.
We chose a binary phase (0 and π) because it is easy to fabricate while simultaneously providing high diffraction efficiency. Its phase distribution is spatially pseudo-random to ensure that the scattered angular spectrum covers a wide angular range uniformly, avoiding the appearance of specific diffraction orders. In this study, the pixel size of the BRPM is set to 1/4 of the SLM pixel pitch, which can theoretically expand the system’s angular spectrum by approximately four times.
The core physical mechanism of this architecture is that multiplication in the spatial domain corresponds to convolution in the frequency (angular spectrum) domain. Due to its high-frequency structure, the BRPM itself has an extremely wide angular spectrum. When the narrow angular spectrum of the SLM’s output wavefront is convolved with the wide angular spectrum of the BRPM, the total output angular spectrum of the system is significantly broadened. This allows the wavefront energy carrying the target information, generated by the SLM, to be “redirected” by the BRPM into an angular range far exceeding the SLM’s own diffraction limit, thus effectively extending the system’s SBP without altering the SLM itself.

2.2. Analysis of Undersampling in High-Frequency Diffraction Calculation

To efficiently utilize the extended SBP, a numerical model that accurately describes the propagation process from U o u t x , y to the final reconstructed image U i m g u , v must be established. We use the single-Fast-Fourier-Transform (FFT) implementation of the Fresnel diffraction for numerical simulation [35]. For an image plane at a distance z, the complex amplitude of the reconstructed light field can be expressed as follows:
U i m g u , v = C e x p j π λ z u 2 + v 2 F U o u t x , y e x p j π λ z x 2 + y 2
where C is a complex constant factor, and F · denotes the Fourier transform.
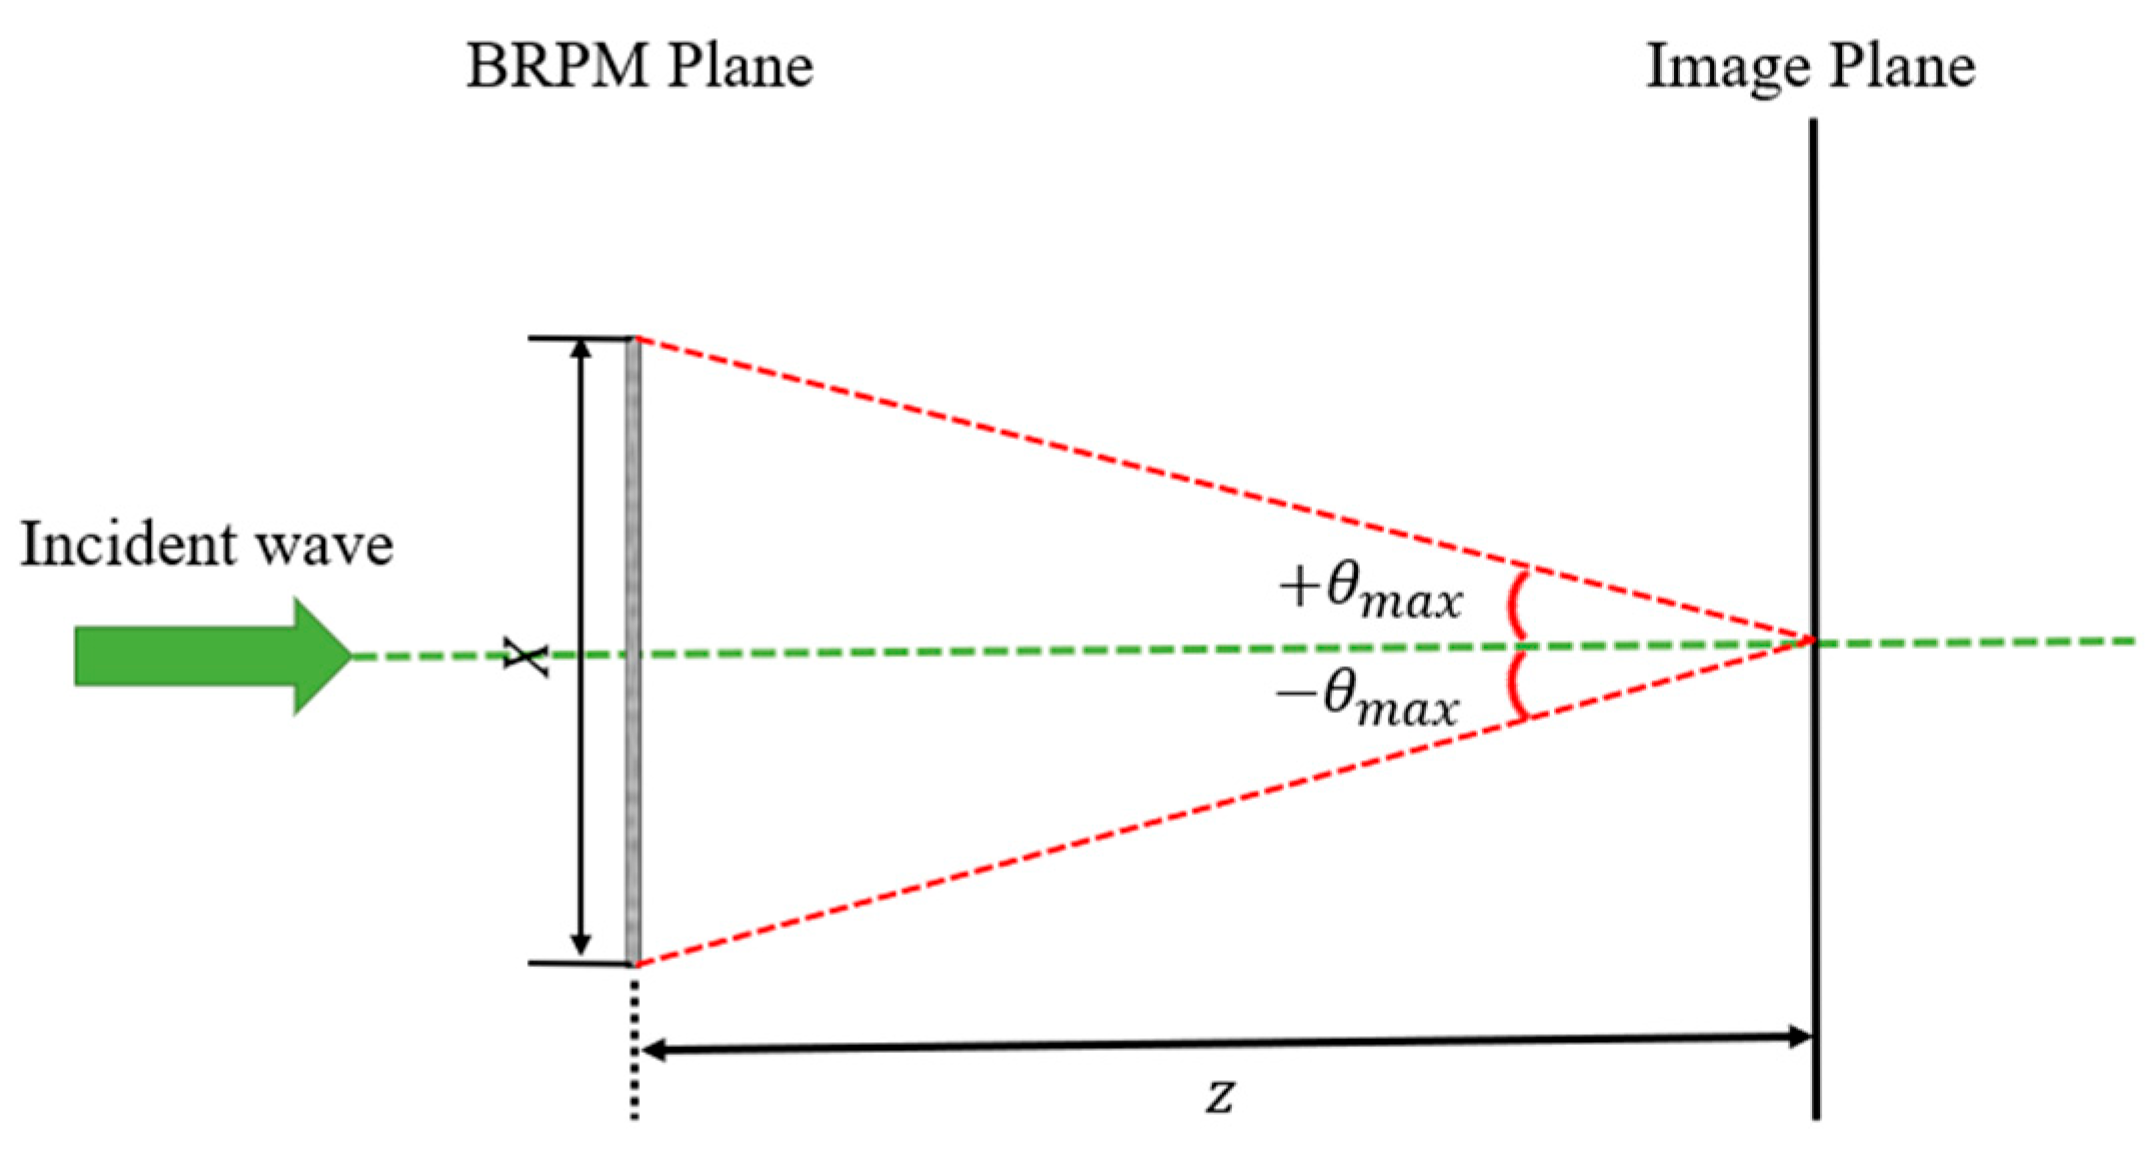
However, a critical and often overlooked issue arises during the numerical computation of Equation (3): the sampling rate. According to the Nyquist-Shannon sampling theorem, to losslessly record the intensity of the reconstructed light field, U i m g 2 , the sampling interval Δ u at the image plane must satisfy Δ u 1 / 2 f m a x , where f m a x is the highest spatial frequency of the field intensity. As shown in Figure 2, this highest frequency is formed by the interference of light rays from the two outermost points ± X / 2 of the BRPM plane, and its value is approximately as follows [36]:
f m a x X λ z
where X is the physical size of the BRPM. Therefore, the required Nyquist sampling interval at the image plane is as follows:
Δ u N y q u i s t = 1 2 f m a x = λ z 2 X
However, when using an FFT-based algorithm for the numerical calculation of Equation (3), the sampling interval at the image plane, Δ u F F T , is determined by the inherent properties of the FFT:
Δ u F F T = λ z N x Δ x = λ z X
where N x is the number of sampling points of the BRPM in the x-direction, and Δ x is the sampling interval (BRPM pixel pitch).
By comparing Equations (5) and (6), we discover a critical problem:
Δ u F F T = 2 Δ u N y q u i s t
This means that the standard FFT diffraction model is inherently undersampled, with a sampling rate of only half the Nyquist rate. This model fails to capture the high-frequency details in the reconstructed field, particularly the fine speckle noise generated by scattering from the BRPM. When this flawed model is used in iterative optimization, the algorithm cannot “see” and effectively suppresses this high-frequency noise, leading to significant discrepancies between simulation results and physical experiments.
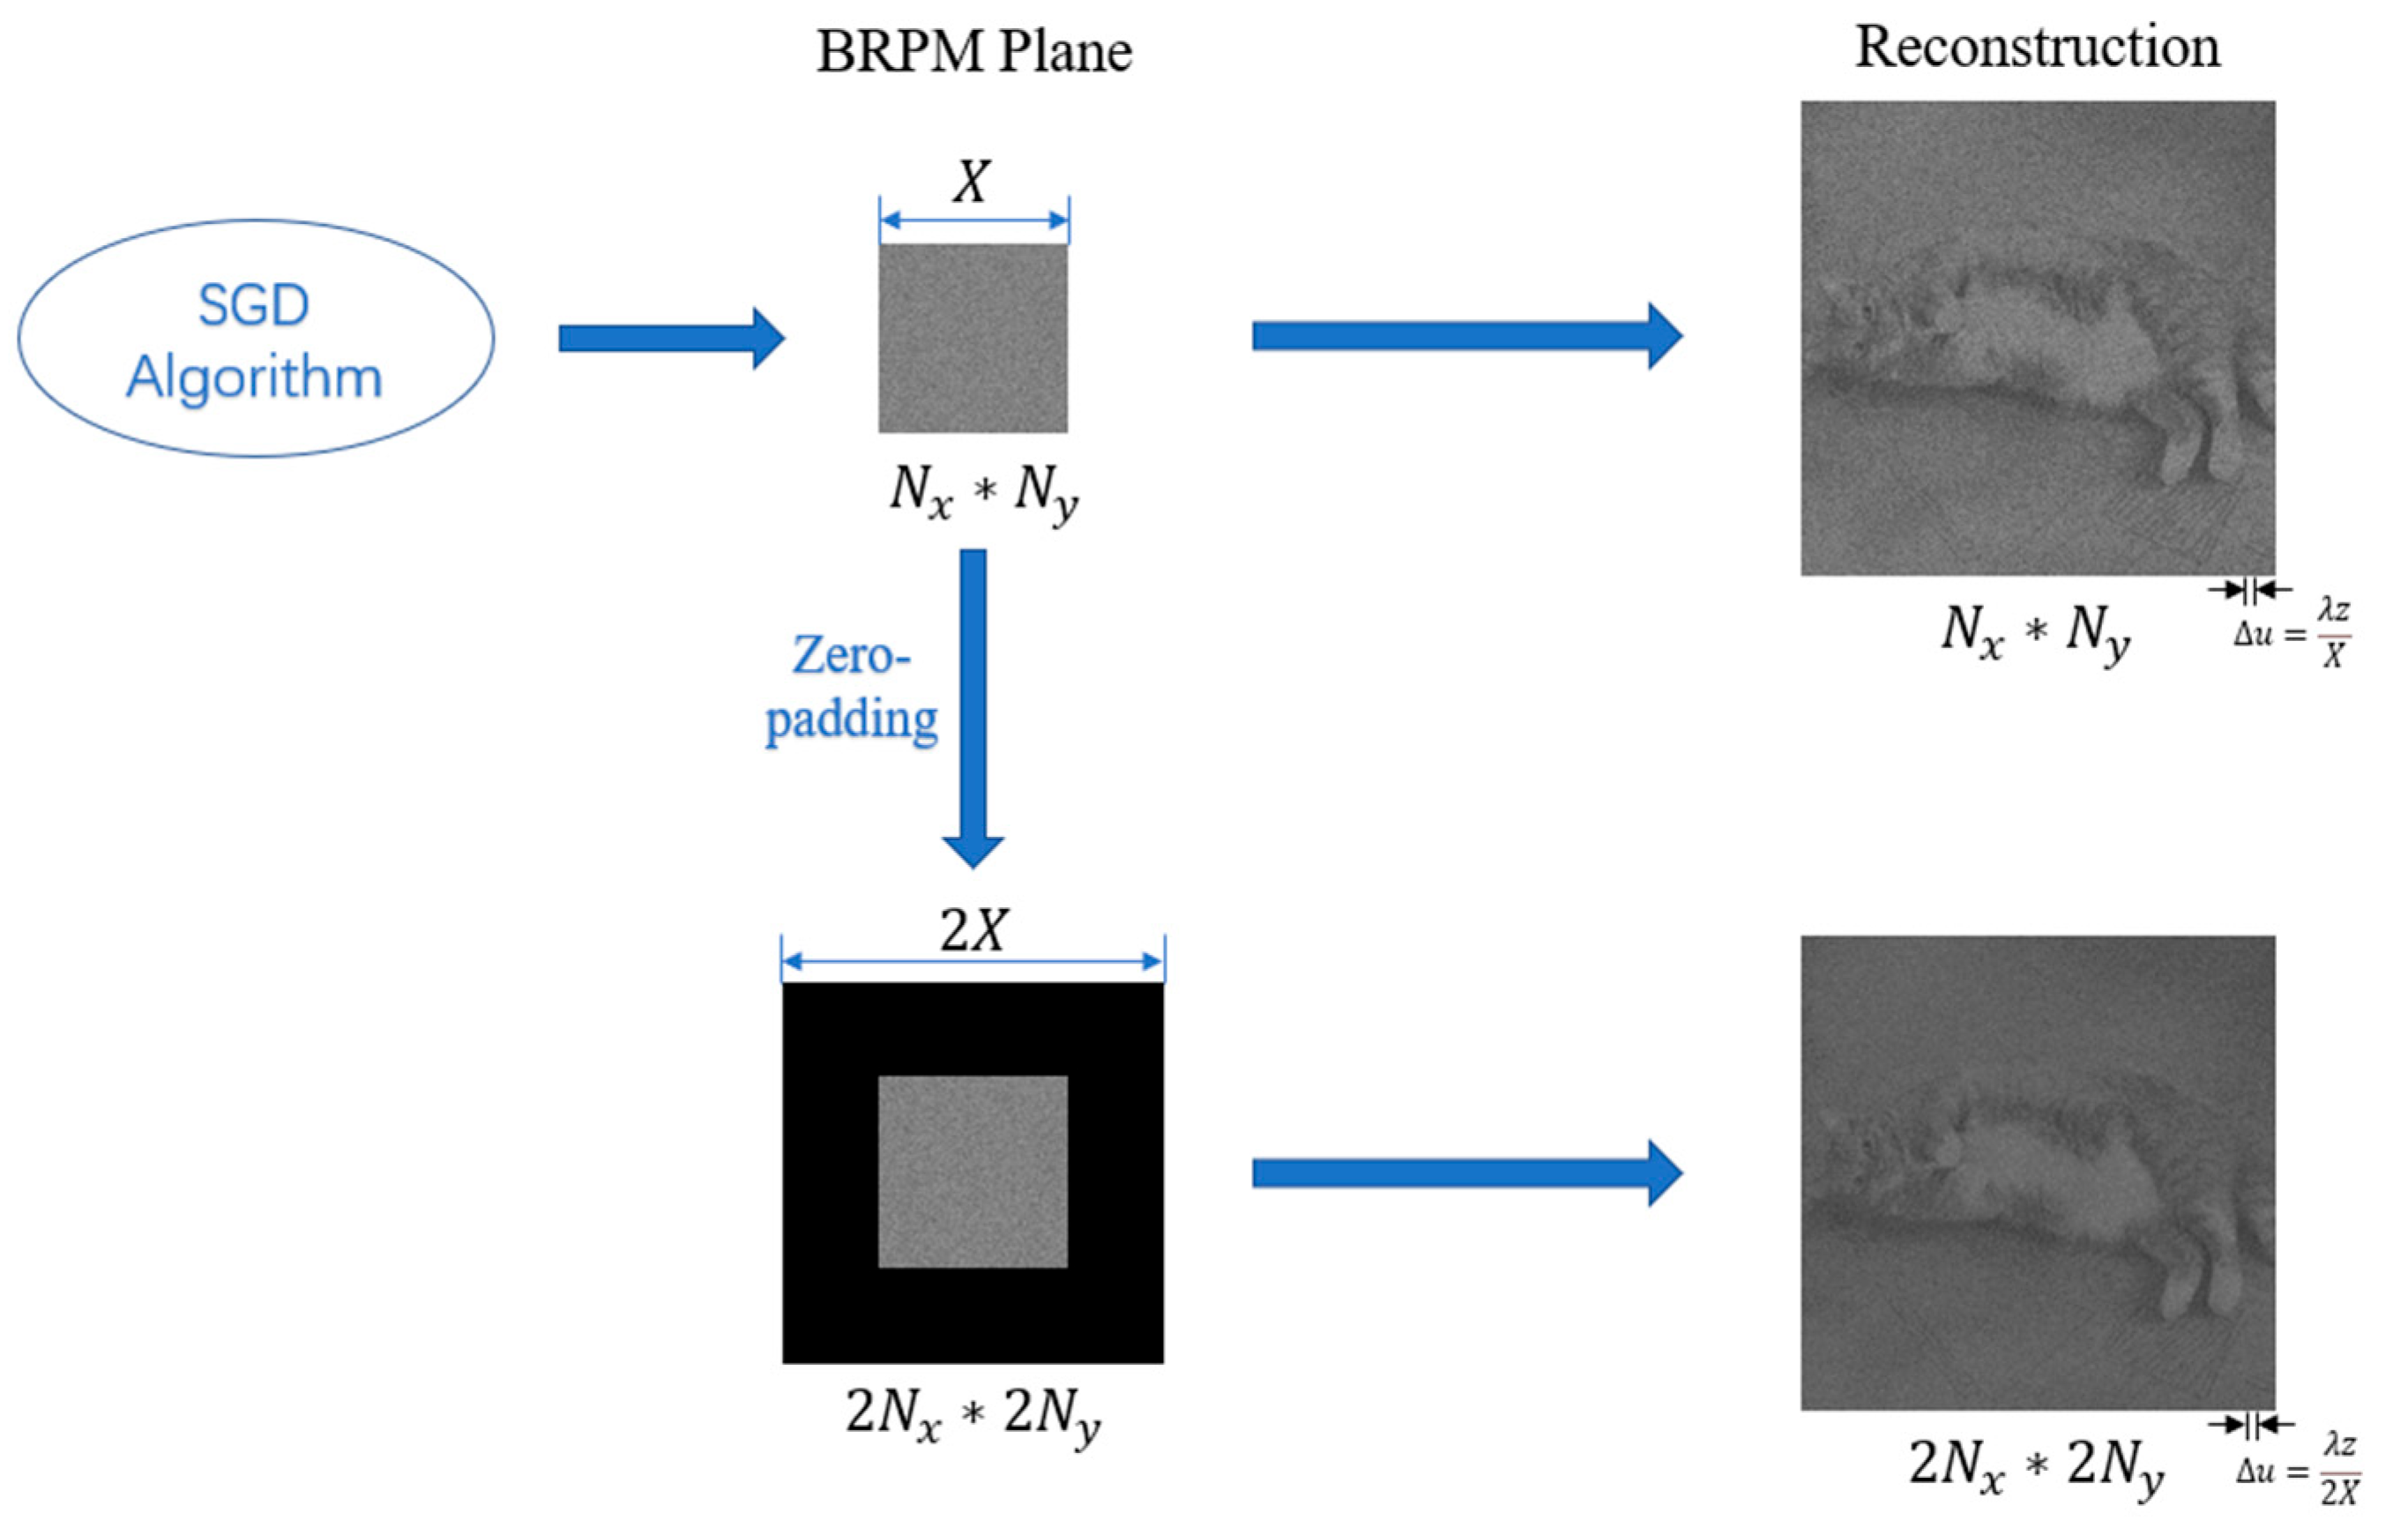
To solve this problem, we employ a zero-padding strategy to adjust the sampling interval. As shown in Figure 3, before performing the FFT, we embed the N x × N y of U o u t into the center of a 2 N x × 2 N y zero matrix. Although the physical size X and pixel pitch Δ x of the BRPM remain unchanged, the size of the computational grid is extended to 2 X . According to the sampling properties of the FFT, the new sampling interval Δ u n e w becomes the following:
Δ u n e w = λ z 2 X = Δ u N y q u i s t
With zero-padding correction, our numerical model can be optimized on a properly sampled computational grid. This enables the effective description and suppression of high-frequency speckle, thereby ensuring the physical fidelity of the simulation results. Although zero-padding by a factor greater than two can further increase the sampling density of the diffraction field, it neither improves the physical resolution nor introduces new information. Instead, it significantly increases the computational overhead. Therefore, two-fold (2x) zero-padding represents a standard and efficient strategy that balances computational accuracy and efficiency while guaranteeing aliasing-free results.

2.3. Hologram Optimization Based on Gradient Descent

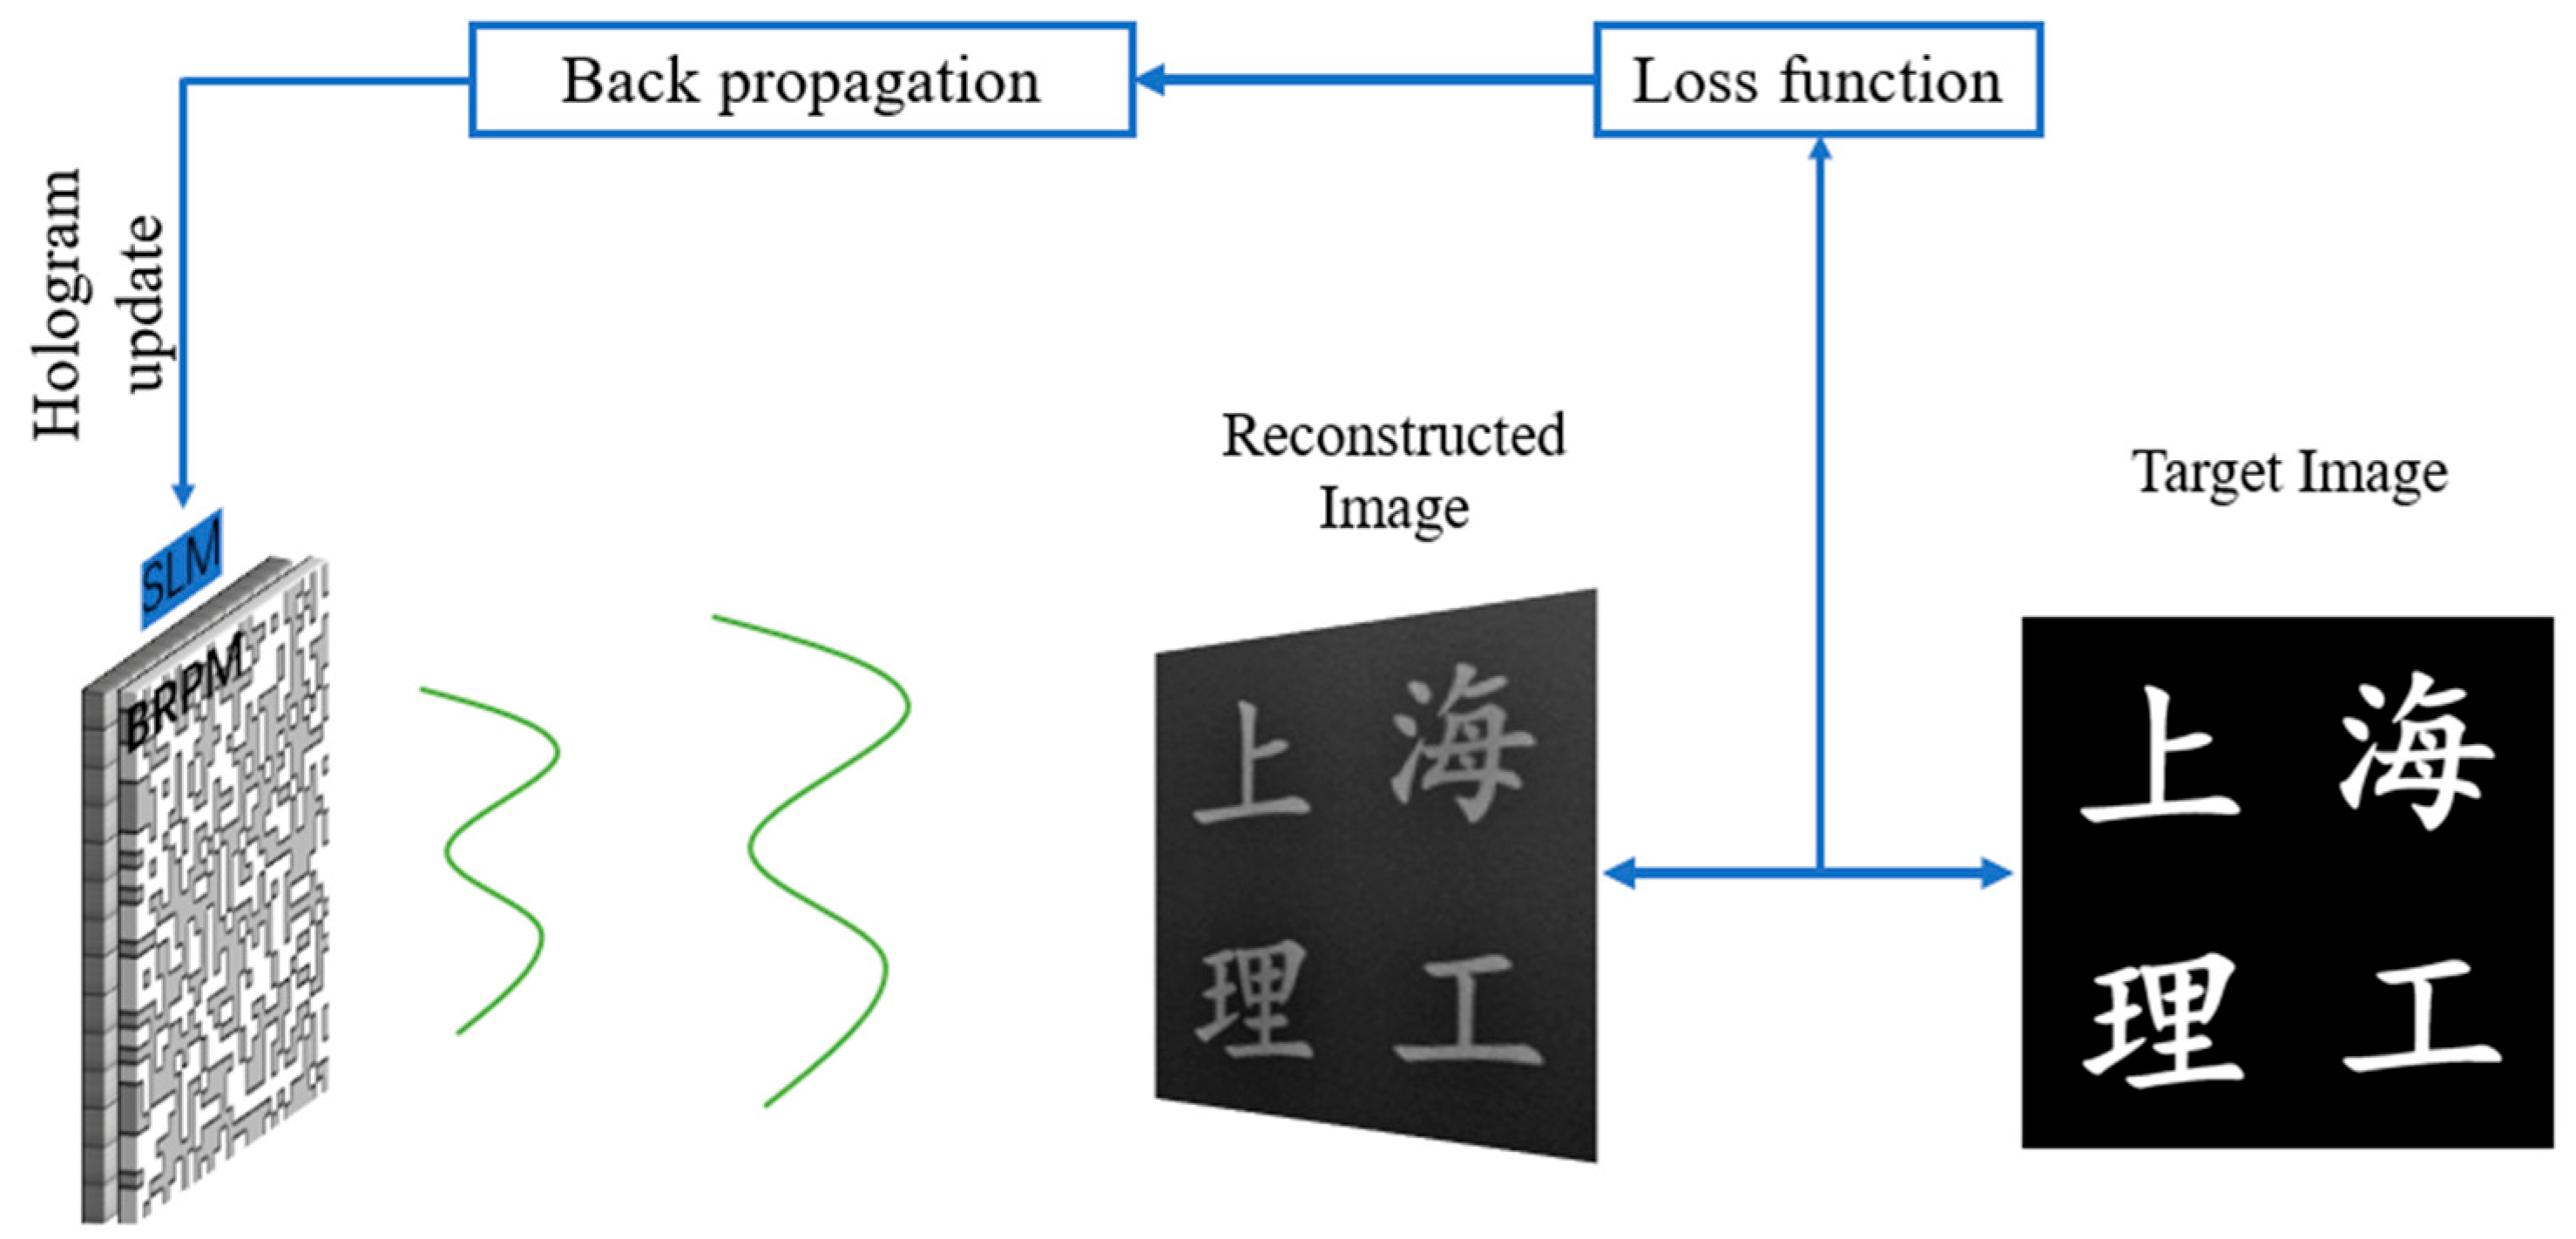
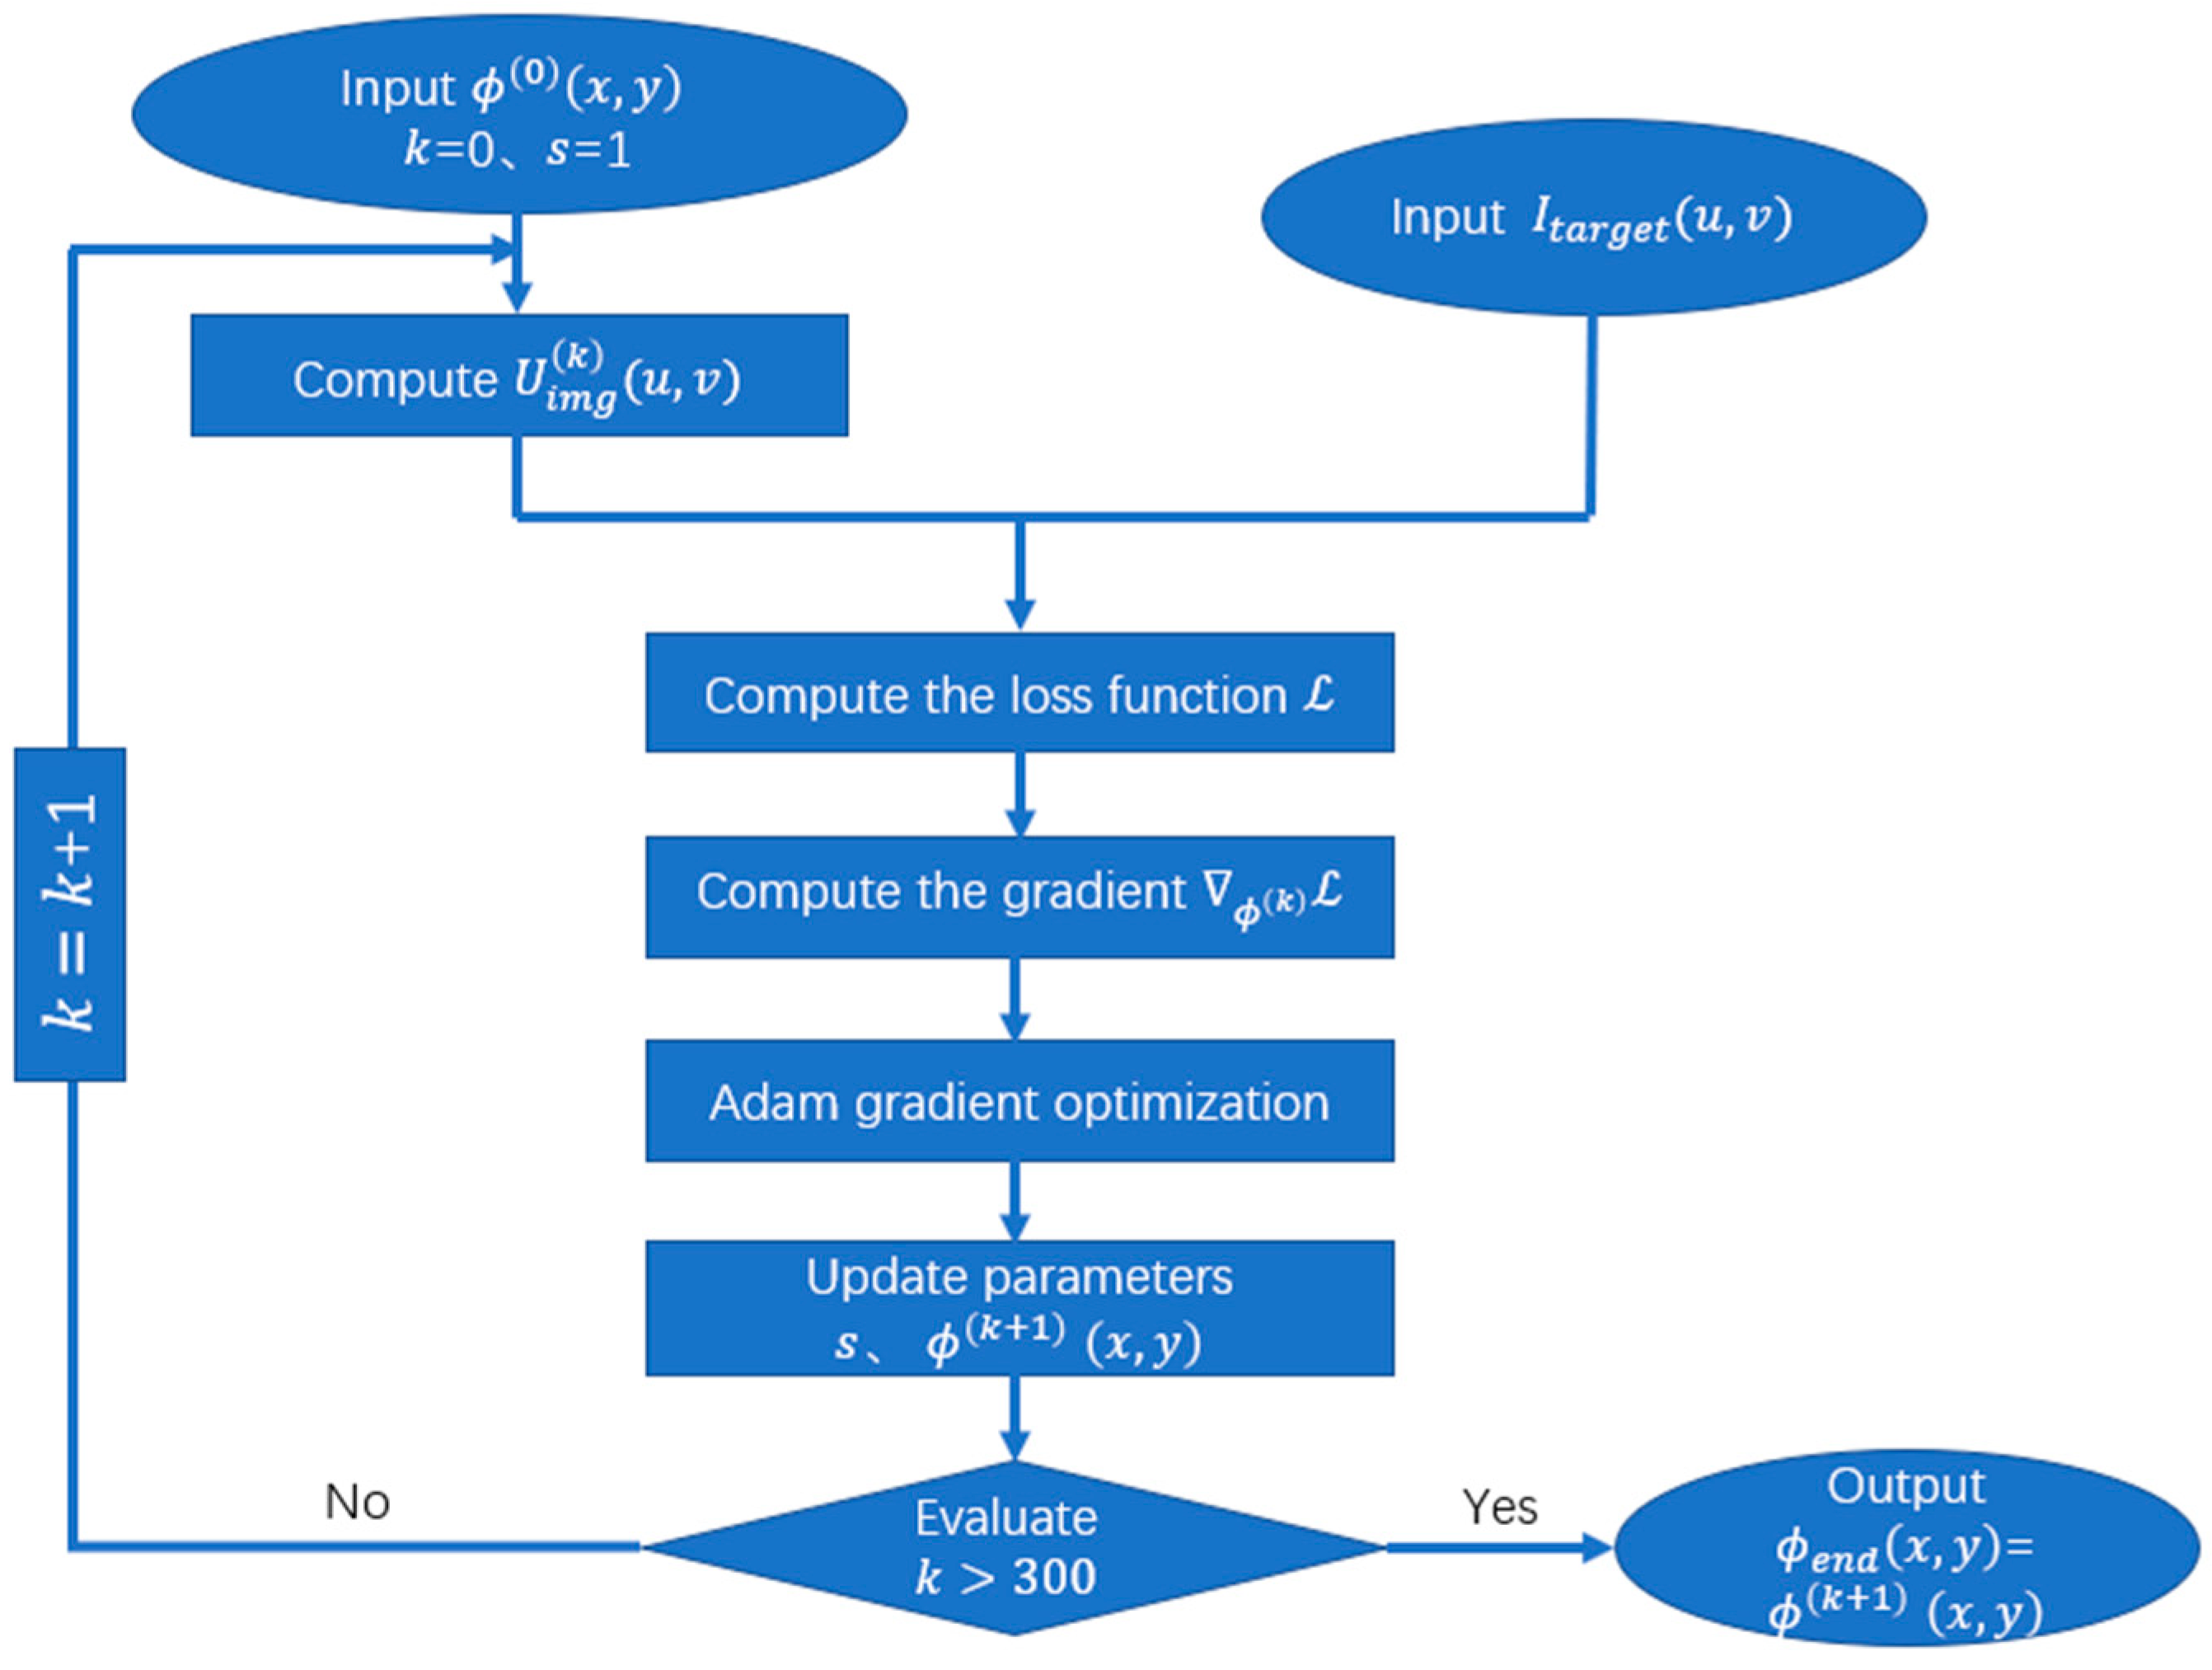
Based on the physically accurate model described above, we have designed a modern optimization framework based on automatic differentiation and gradient descent to generate high-quality phase-only holograms, ϕ C G H . Compared to the traditional GS algorithm [30], this framework can flexibly integrate complex physical models and achieve efficient convergence using advanced optimizers. Figure 4 illustrates the iterative optimization method for generating the phase-only CGH in our holographic display system. A detailed flowchart of the corresponding algorithm is provided in Figure 5. First, we initialize a random phase ϕ 0 x , y uniformly distributed in the range π , π . In each iteration, this phase, along with the incident light field and the fixed BRPM phase, generates the output field U o u t k x , y . Next, U o u t k x , y is zero-padded and undergoes numerical diffraction propagation to obtain the complex amplitude of the reconstructed field, U i m g k u , v . This entire forward propagation process can be concisely represented by an operator P r o p z :
U i m g k u , v = P r o p z ϕ k x , y
where P r o p z encapsulates the phase modulation, BRPM modulation, zero-padding, and Fresnel propagation.
We compare the intensity of the reconstructed field, U i m g k u , v 2 , with the target image intensity,   I t a r g e t u , v , and seek the optimal phase by minimizing the Mean Squared Error (MSE) loss function L :
minimize ϕ , s L s U img   ( u , v ) 2 , I target   ( u , v )
where s is a learnable scaling factor used to compensate for the global brightness difference between the reconstructed image and the target image. Its optimal value can be solved analytically in each iteration to accelerate convergence.
We utilize the automatic differentiation feature provided by deep learning frameworks (e.g., PyTorch) [37] to efficiently compute the gradient of the loss function L with respect to each pixel phase ϕ k on the SLM, ϕ k L . Then, we use the Adaptive Moment Estimation (Adam) [38] optimizer to update the phase according to the gradient:
ϕ k + 1 = ϕ k η · Adam ϕ k L
where η is the learning rate. The Adam optimizer combines momentum and adaptive learning rate adjustments, leading to faster and more stable convergence. To further enhance performance, we incorporated a learning rate scheduling strategy. This strategy dynamically adjusts the learning rate during training: specifically, the learning rate is multiplied by a decay factor if the loss function fails to show significant improvement over a set number of epochs. This automatic reduction in the learning rate upon stagnation allows the model to perform a more refined search in the solution space, leading to finer optimization. This process is repeated until convergence, and the final optimized phase-only hologram ϕ e n d x , y is output. This co-optimization framework, by combining a precise physical model with an efficient optimization engine, ensures that the generated hologram can maximally utilize the SBP extended by the BRPM, thereby achieving holographic reconstruction in a wide field of view.

3. Results and Analysis

3.1. Evaluation Metrics and Performance Evaluation

To quantitatively evaluate the performance of the proposed method, we used the Peak Signal-to-Noise Ratio (PSNR) and the Structural Similarity Index (SSIM) as quality metrics for the holographic images. PSNR measures pixel-level fidelity, while SSIM is better at reflecting human perception of image structure. The Structural Similarity Index (SSIM) is defined as follows:
SSIM = 2 μ t μ r + c 1 2 σ t , r + c 2 μ t 2 + μ r 2 + c 1 σ t 2 + σ r 2 + c 2
where μ t and μ r are the mean gray levels of the target and reconstructed images, respectively; σ t 2 and σ r 2 are their respective variances; and σ t , r is their covariance. The terms c 1 and c 2 are positive constants used to prevent the denominator from being zero.
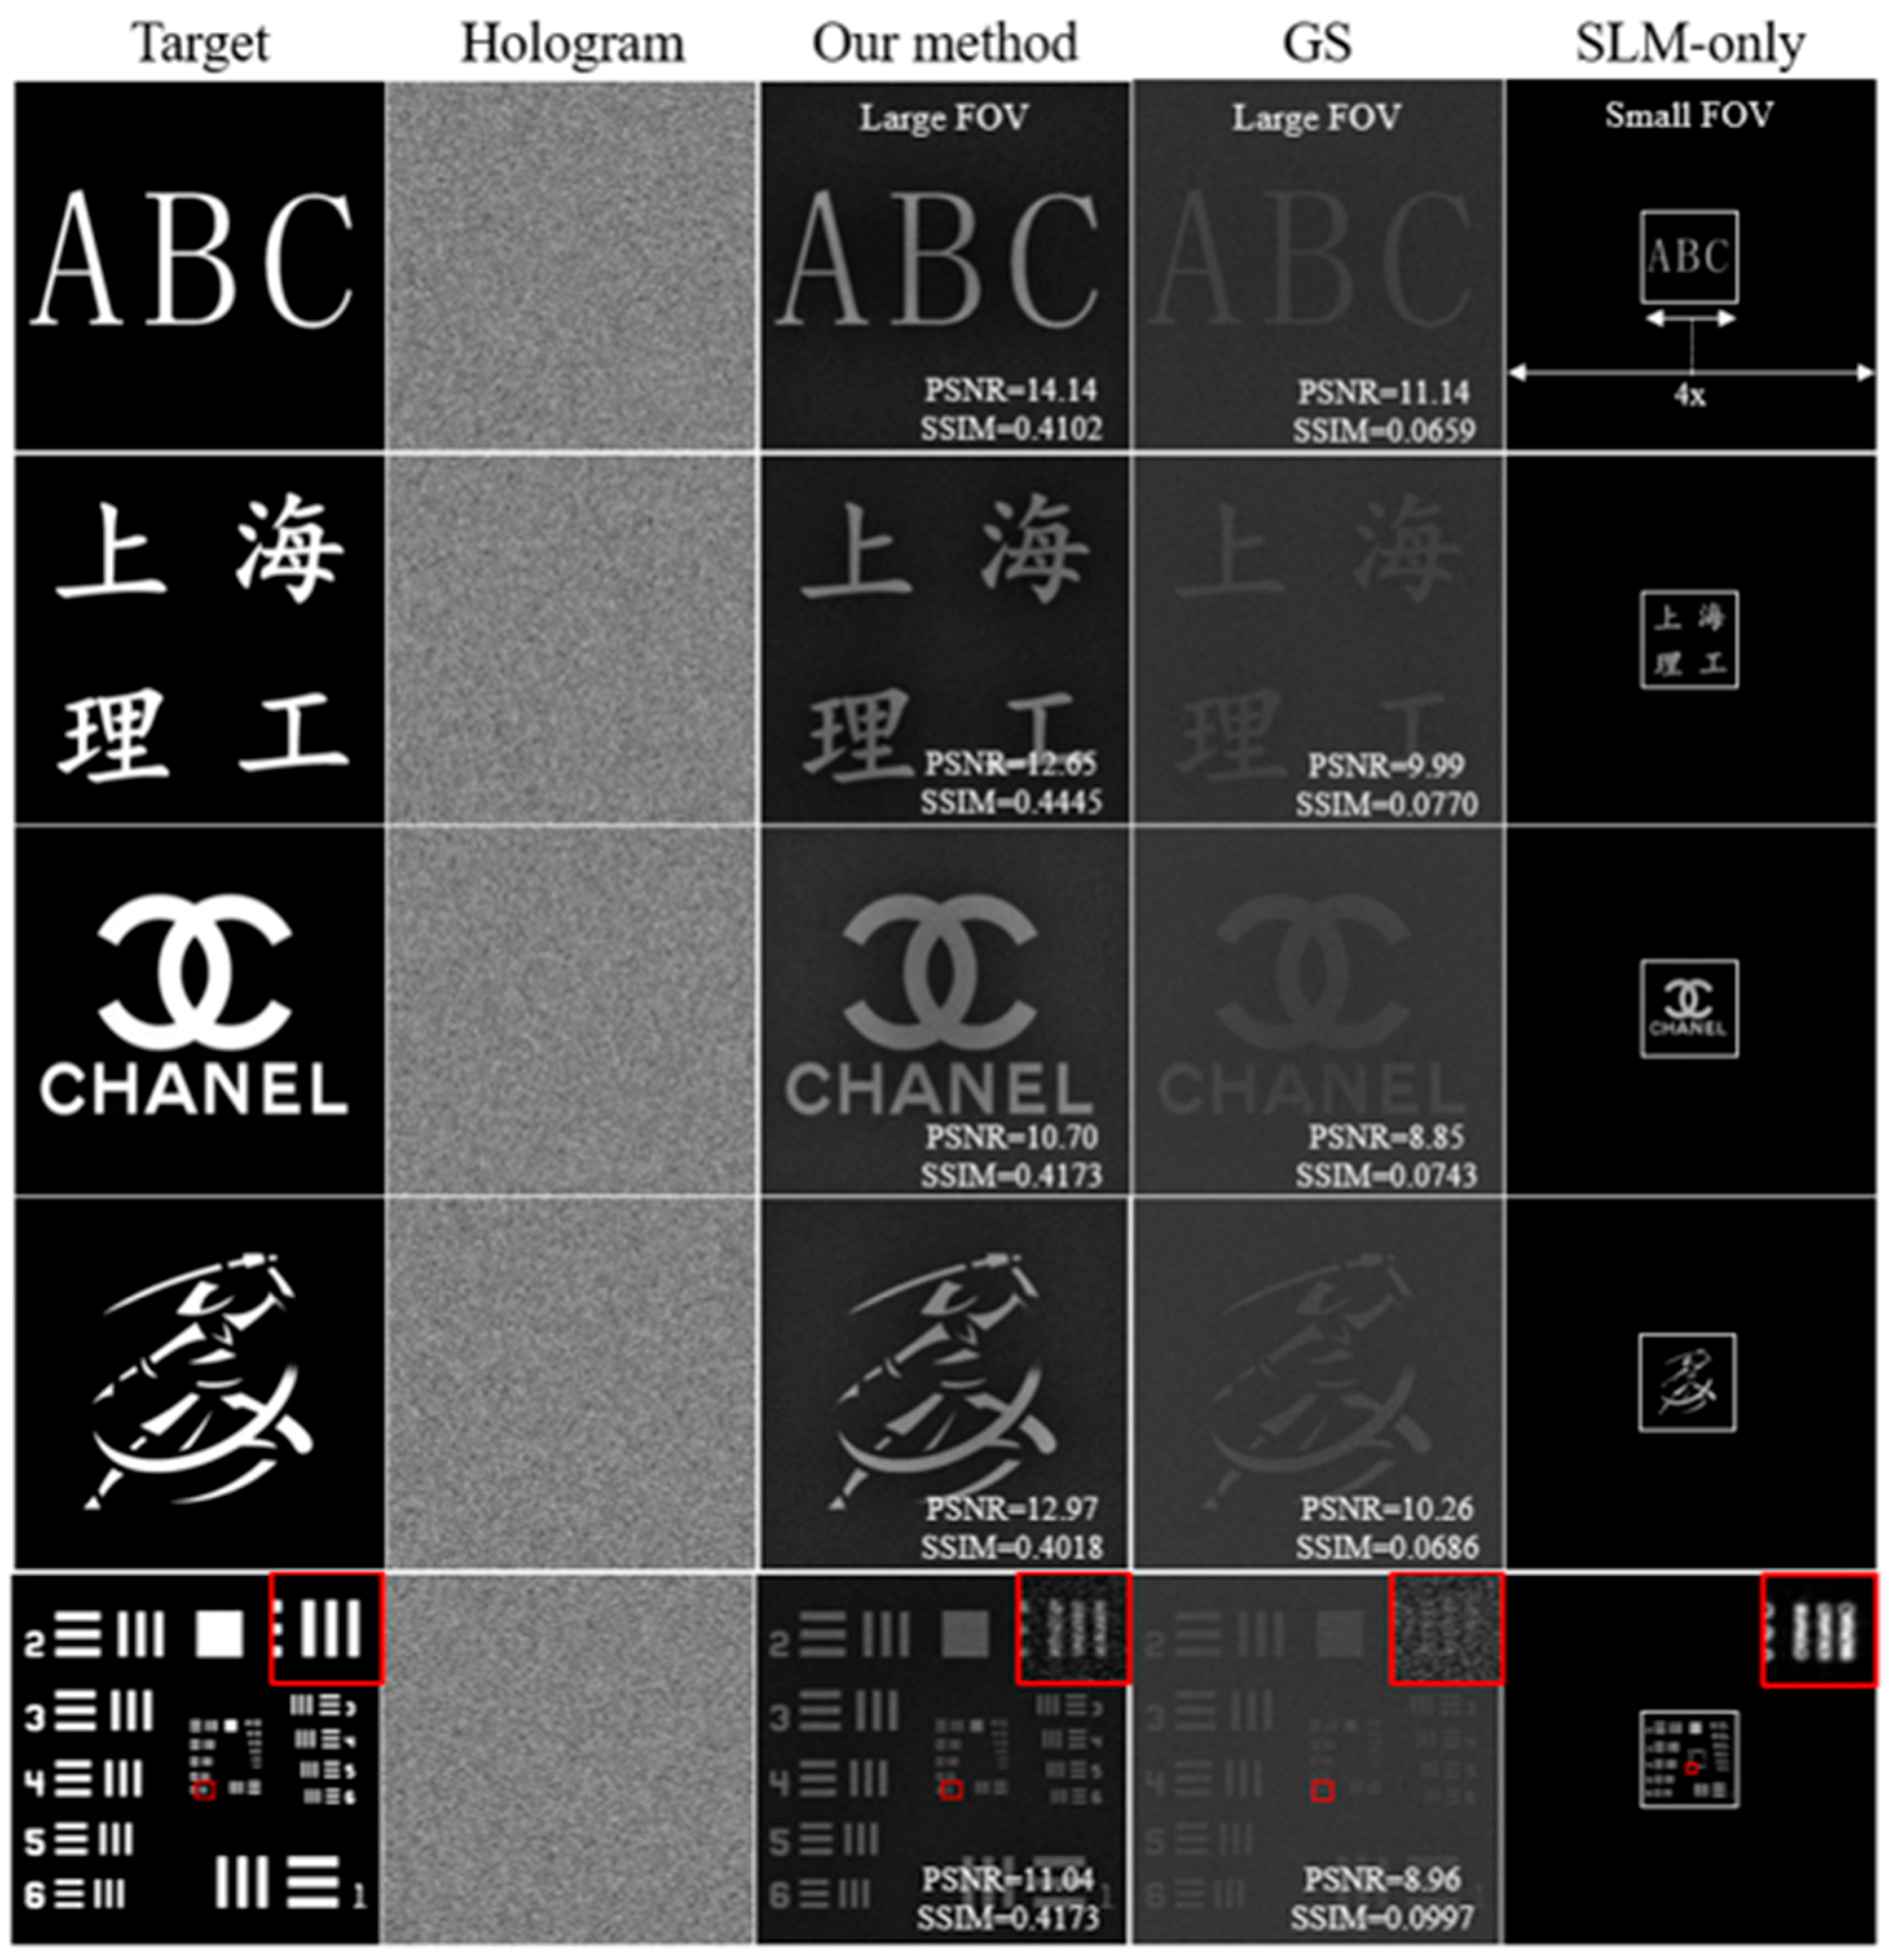
In our numerical simulations, the illumination wavelength was set to λ = 520   n m , the SLM resolution was 540 × 540 pixels, and the pixel pitch was 12.8 µm. The attached BRPM had a resolution of 2160 × 2160, with a feature pixel pitch of 3.2 µm. The propagation distance between the BRPM plane and the reconstruction plane was z = 30 cm. All computer-generated holograms (CGHs) were generated using the optimization framework described in Section 2.3, with 300 iterations. To systematically evaluate the performance of our method, we designed a series of comparative experiments. As shown in Figure 6, we compared the holographic reconstruction results obtained based on the following three different schemes:
Method A (This work): SLM + BRPM, using our proposed gradient descent optimization framework based on the sampling-corrected model.
Method B (Traditional algorithm): SLM + BRPM but using the widely-used Gerchberg–Saxton (GS) algorithm for optimization [30].
Method C (Baseline system): Using only the SLM (no BRPM), with the gradient descent algorithm for optimization.
The visual results in Figure 6 provide a clear comparison. First, compared to the baseline Method C (5th column), both Method A (3rd column) and Method B (4th column), which incorporate the BRPM, successfully and significantly expanded the physical size of the reconstructed image. This visually demonstrates that the field of view (FOV) was expanded by approximately 4 times in both horizontal and vertical directions, equivalent to an effective SBP enhancement of about 16 times. This strongly confirms the effectiveness of the BRPM in physically extending the system’s SBP.
However, under the same large FOV condition, the reconstruction quality shows a vast difference. The reconstructed image from Scheme B (conventional GS) is filled with severe speckle noise, and the image details are blurry and unclear. This strong speckle noise is the direct reason for the significant reduction in object brightness observed in the fourth column of Figure 6. In contrast, the reconstructed image from Method A (this work) has a clean background, high contrast, and achieves a qualitative leap in visual quality. The quantitative metrics confirm this observation: for the “ABC” image, our method’s PSNR (14.14 dB) and SSIM (0.4102) are far superior to the GS algorithm’s (PSNR = 11.14 dB, SSIM = 0.0659). Furthermore, to further highlight the necessity of the advanced optimization algorithm, we have also provided a magnified view of the resolution test chart from the fifth row of Figure 6 (see the inset in the red box).
The GS algorithm, which relies on alternating constraints between two Fourier-conjugate planes, cannot effectively handle the fixed, highly complex spatial phase modulation introduced by the BRPM. In contrast, our gradient descent-based framework, by building an end-to-end differentiable physical model, can treat the BRPM as an integral part of the system for co-optimization, thereby finding high-quality solutions in a high-dimensional, non-convex solution space. This proves that the key to efficiently utilizing the extended SBP lies in an advanced optimization algorithm that fully incorporates an accurate physical model of the underlying hardware architecture.

3.2. Experimental Setup and Results Analysis

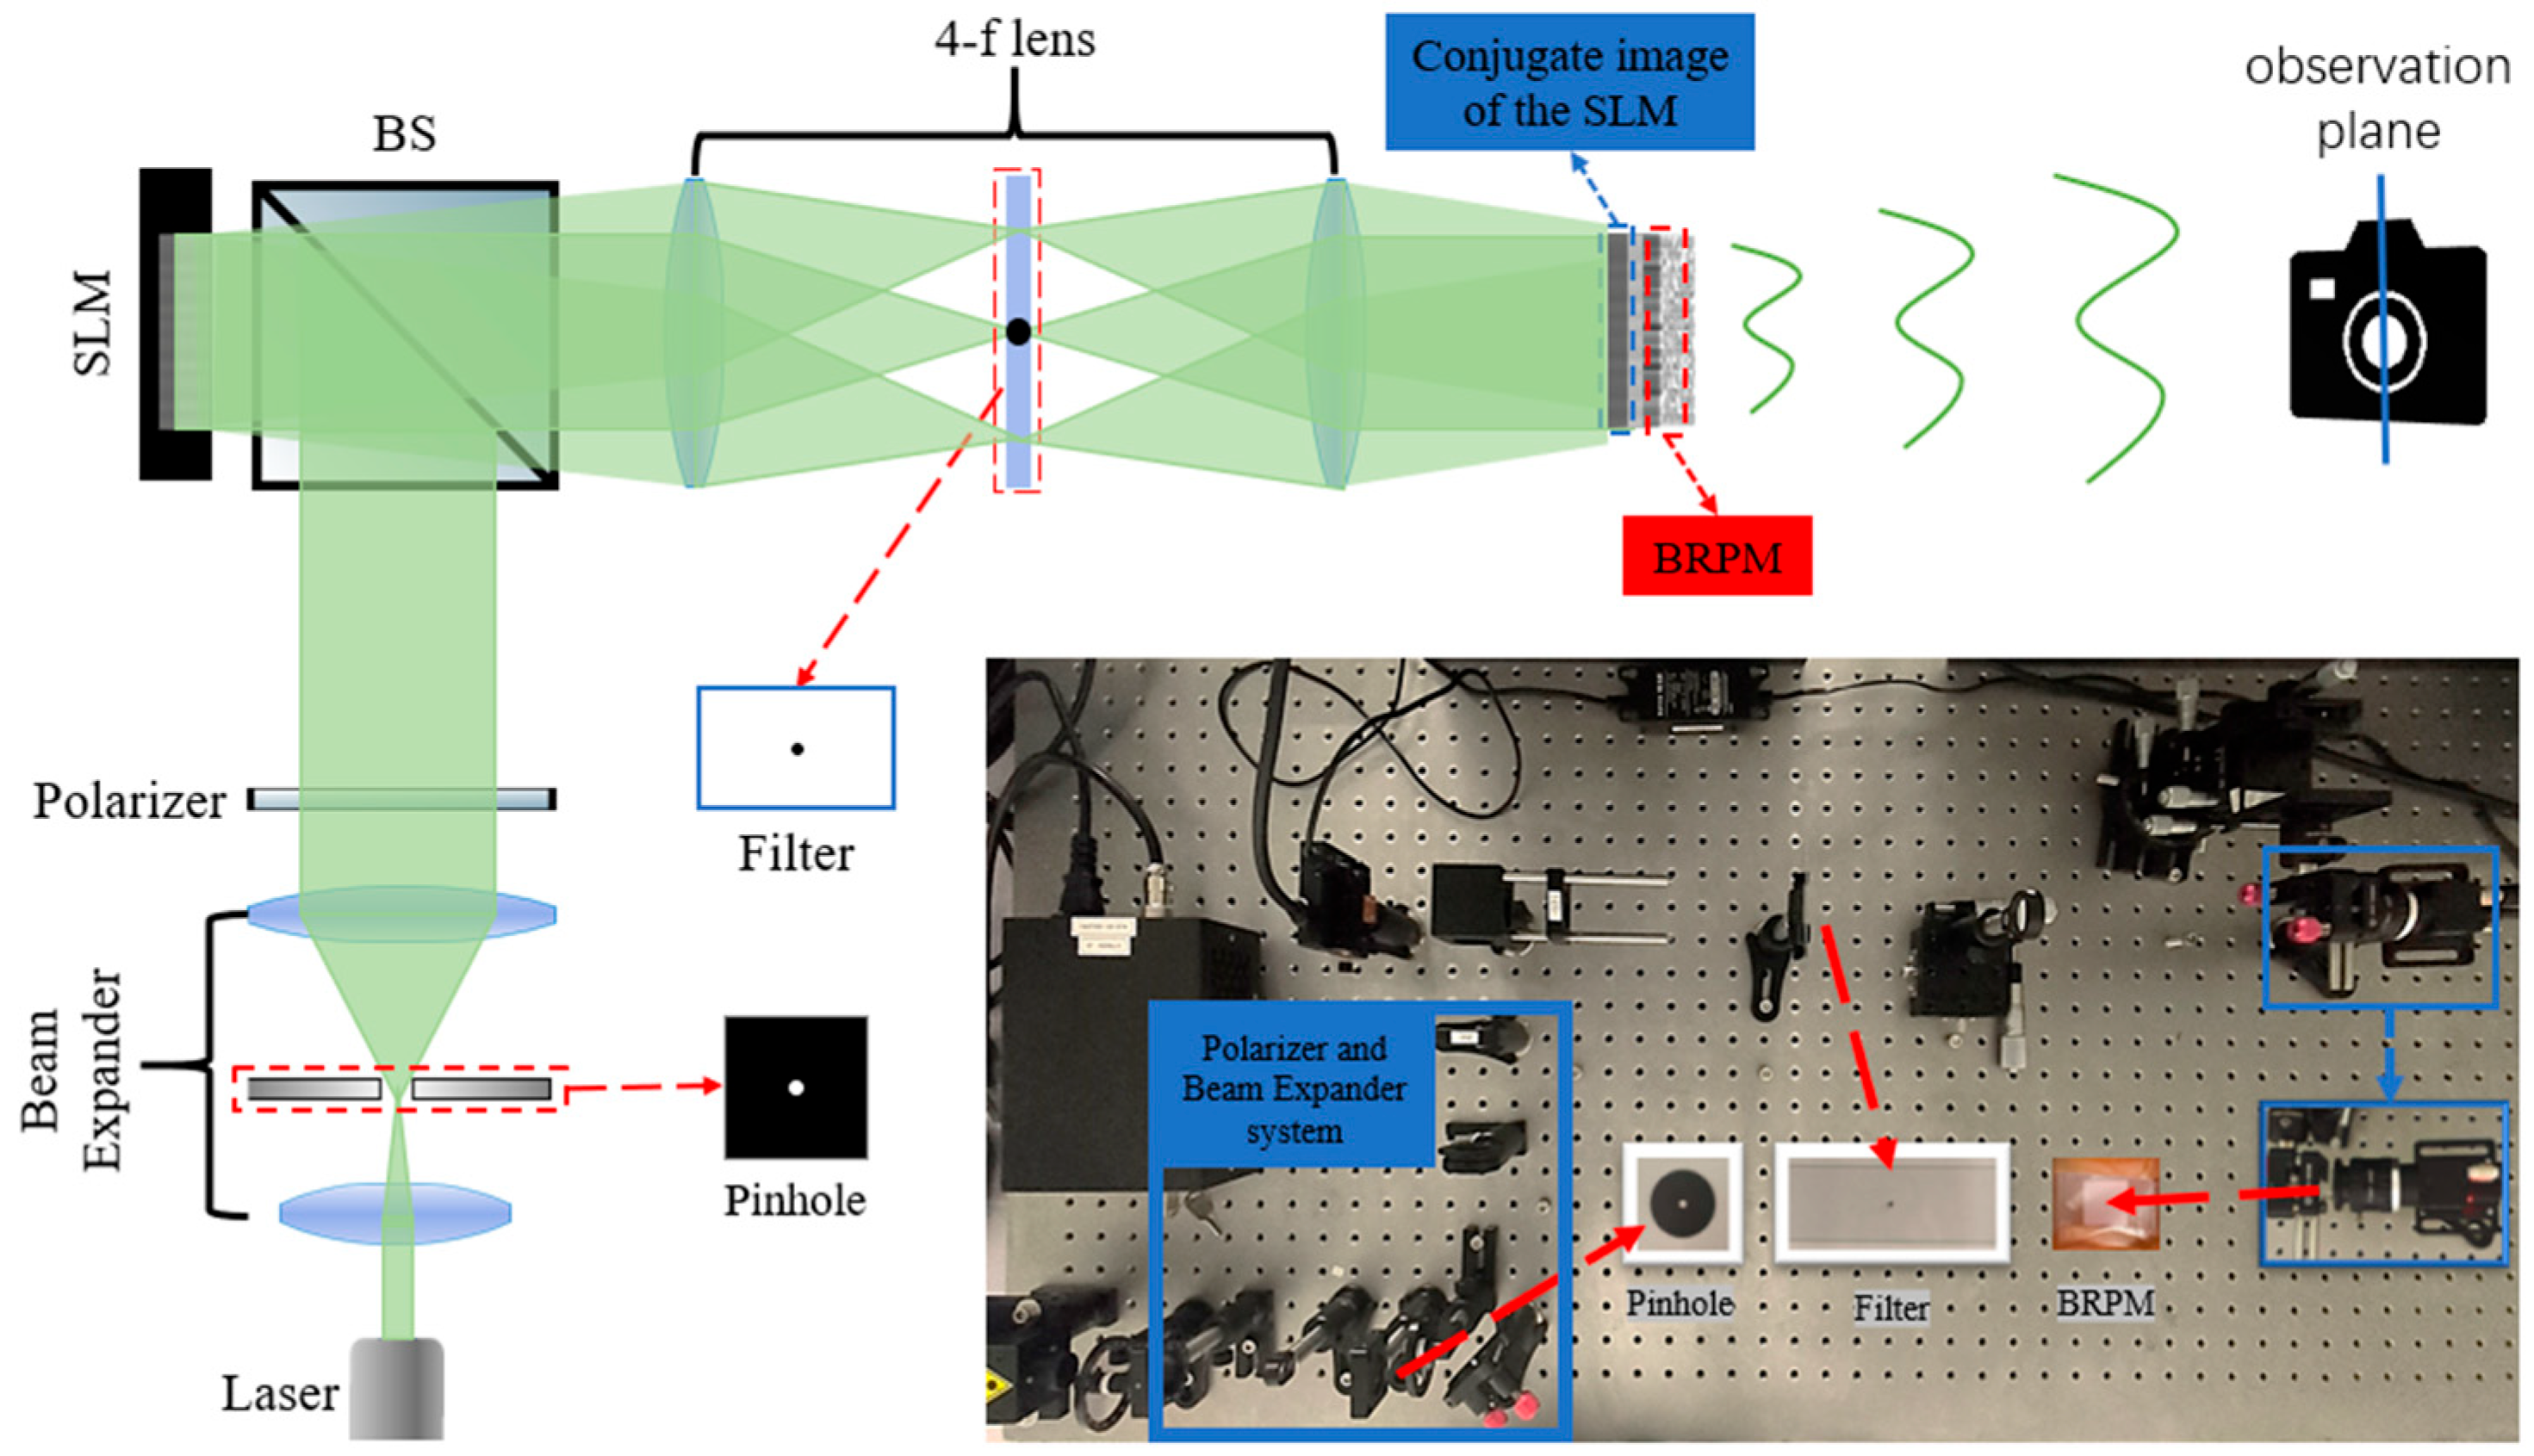
The optical experiment setup is shown in Figure 7. The system consists of a 520 nm laser, a beam shaping system, a reflective phase-only liquid-crystal-on-silicon spatial light modulator (LCoS-SLM, UPOLabs, Shanghai, China, 1920 × 1080 resolution, 6.4 µm pixel pitch), a 4f imaging system composed of two f = 150 mm lenses and a filter for blocking the zero-order spot; a binary random phase mask (BRPM) fabricated via photolithography with a precisely known surface pattern; and a CCD camera. To match the simulation parameters, we up-sampled the generated 540 × 540 resolution CGH to 1080 × 1080 by 2 × 2-pixel duplication and loaded it onto the central area of the SLM to ensure the physical size of the effective modulation area was consistent with the simulation. The BRPM was mounted on a six-axis precision translation stage to achieve precise alignment between the SLM image and the BRPM. It is worth noting that in our theoretical modeling and optimization process, we make an idealized assumption that the SLM possesses perfect diffraction efficiency, capable of modulating all light energy into the target diffraction order. Consequently, the theoretical model itself does not account for the zero-th diffraction order (0th diffraction order) as a component. Ultimately, the imaging system forms a virtual image 30 cm in front of the BRPM. The system’s exit pupil plane coincides with the BRPM plane, providing an ideal observation position for the viewer. In practical observation, a detector (such as a camera sensor or the human eye) is placed at a short distance behind the BRPM, which does not affect the viewing experience.
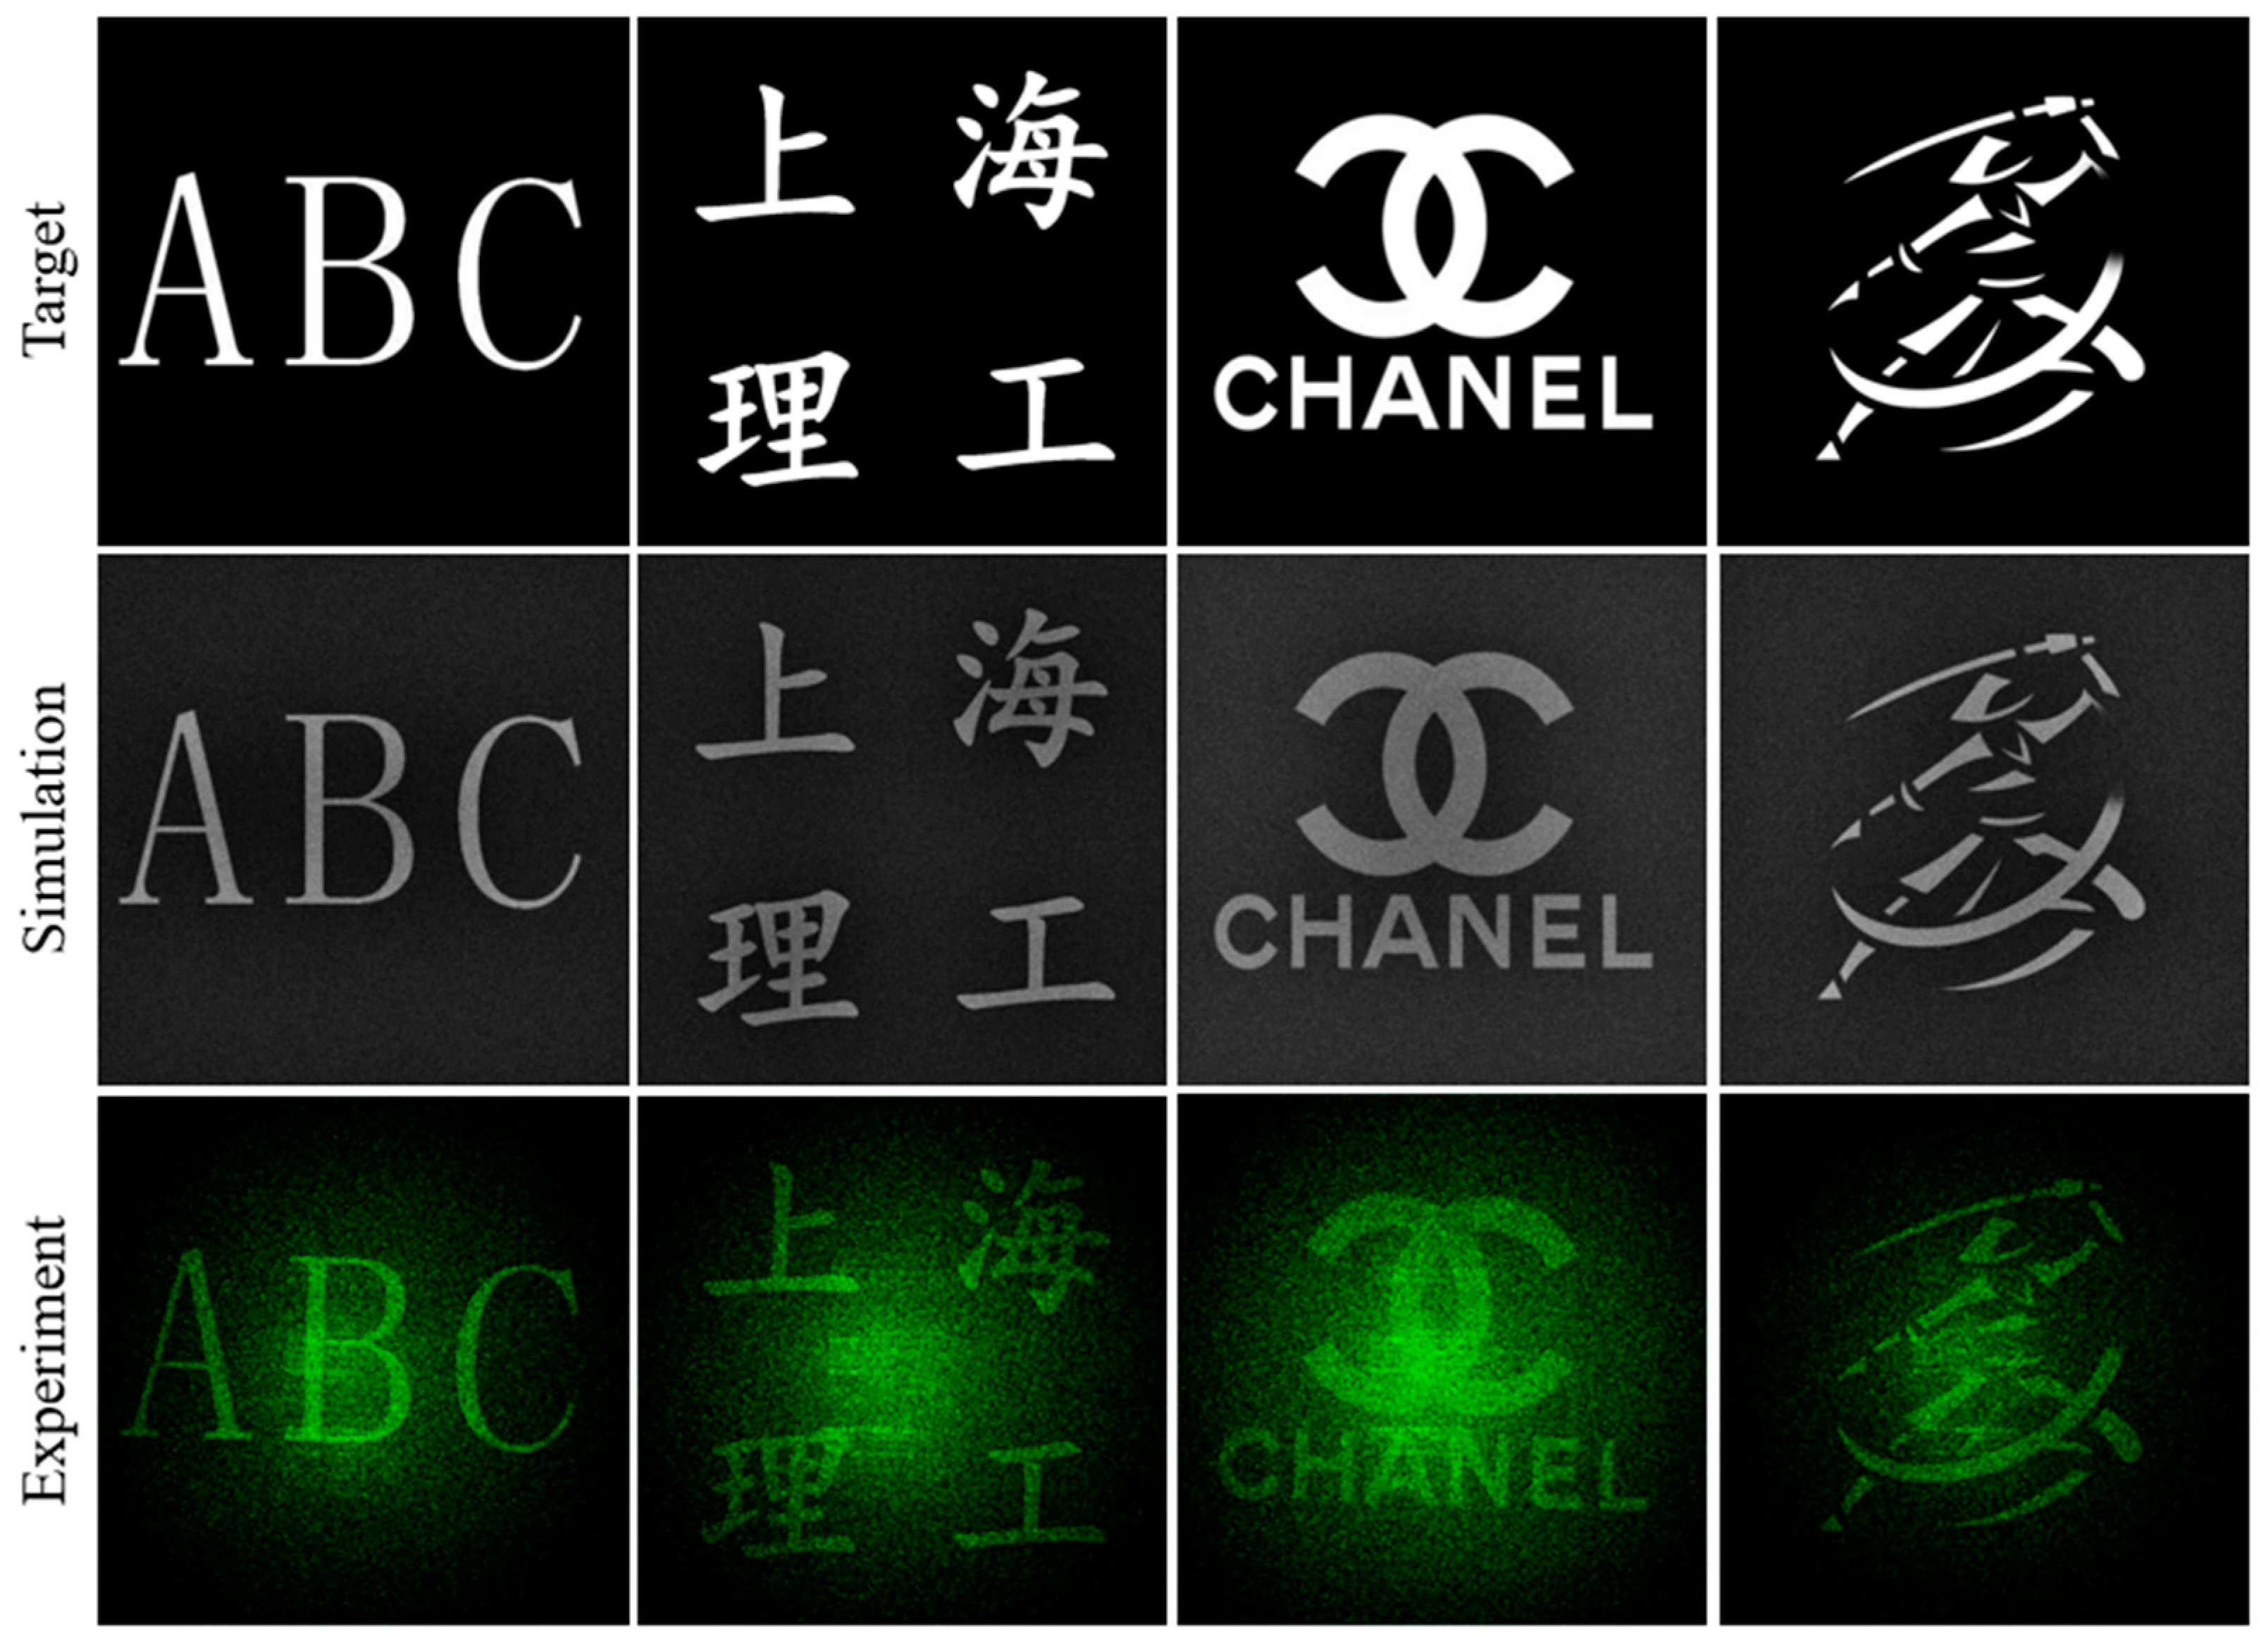
To validate the feasibility of our proposed method, we conducted optical experiments using the experimental setup illustrated in Figure 7. The results are shown in Figure 8. Comparing the captured results from the optical experiment (third row) with the corresponding numerical simulations (second row), the experiment successfully reconstructed the target images, and their main contours are clear and distinguishable, which strongly validates the physical feasibility of our scheme. At the same time, the experimental images have gaps in clarity and contrast compared to the simulations. This discrepancy is common in complex coherent optical systems and usually stems from imperfections in the alignment of optical components in experiment setup. For example, the physical blocking of the zero-th-order light in the experimental setup (using a spatial filter) cannot be 100% perfect. Consequently, a small amount of scattered light or incompletely blocked zero-th-order stray light still enters the imaging system, which affects the contrast of the final image. Furthermore, we validated the system’s multi-plane imaging capability. To this end, we employed a direct multi-plane optimization strategy: the left half of the target image was defined on the foreground focal plane, and the right half on the background focal plane. A single SLM phase was then directly optimized using the gradient descent method to simultaneously meet the reconstruction requirements for both depth planes. As shown in Figure 9, the system successfully reconstructed the left half of the target image sharply at the foreground focal plane, while its right half was simultaneously reconstructed at the background focal plane. This result visually confirms the effectiveness of our method for multi-focal plane display applications.
We hypothesize that the physical alignment accuracy between the SLM and the BRPM may have a significant impact on system performance, leading to the noticeable discrepancy between the simulation and experimental results. To quantitatively analyze this effect, we conducted a simulation to specifically investigate the impact of minor translational misalignment of the BRPM on the reconstruction quality, as shown in Figure 10, where the coordinates above each image indicate the horizontal (rightward) and vertical (downward) displacement of the BRPM relative to the SLM. The simulation results reveal that after a shift of just one BRPM sub-pixel (3.2 µm) (Figure 10b), the image quality drops noticeably. When the offset reaches 3 BRPM pixels (9.6 µm) (Figure 10f), the image structure is almost completely destroyed, and the SSIM value plummets from an ideal 0.4102 to 0.0534. It is worth noting that SSIM is far more sensitive to structural errors than PSNR, more accurately reflecting the degradation in visual quality caused by alignment errors.
This analysis not only reasonably explains the gap between the experiment and simulation but, more importantly, reveals a key engineering challenge and future research direction. It demonstrates that sub-pixel level alignment accuracy is a prerequisite for unlocking the full potential of this type of SBP extension technology. This finding provides clear guidance for the engineering implementation of the technology: future systems must integrate a high-precision, online automatic alignment feedback loop.

3.3. Alignment of the SLM Conjugate Image and the BRPM

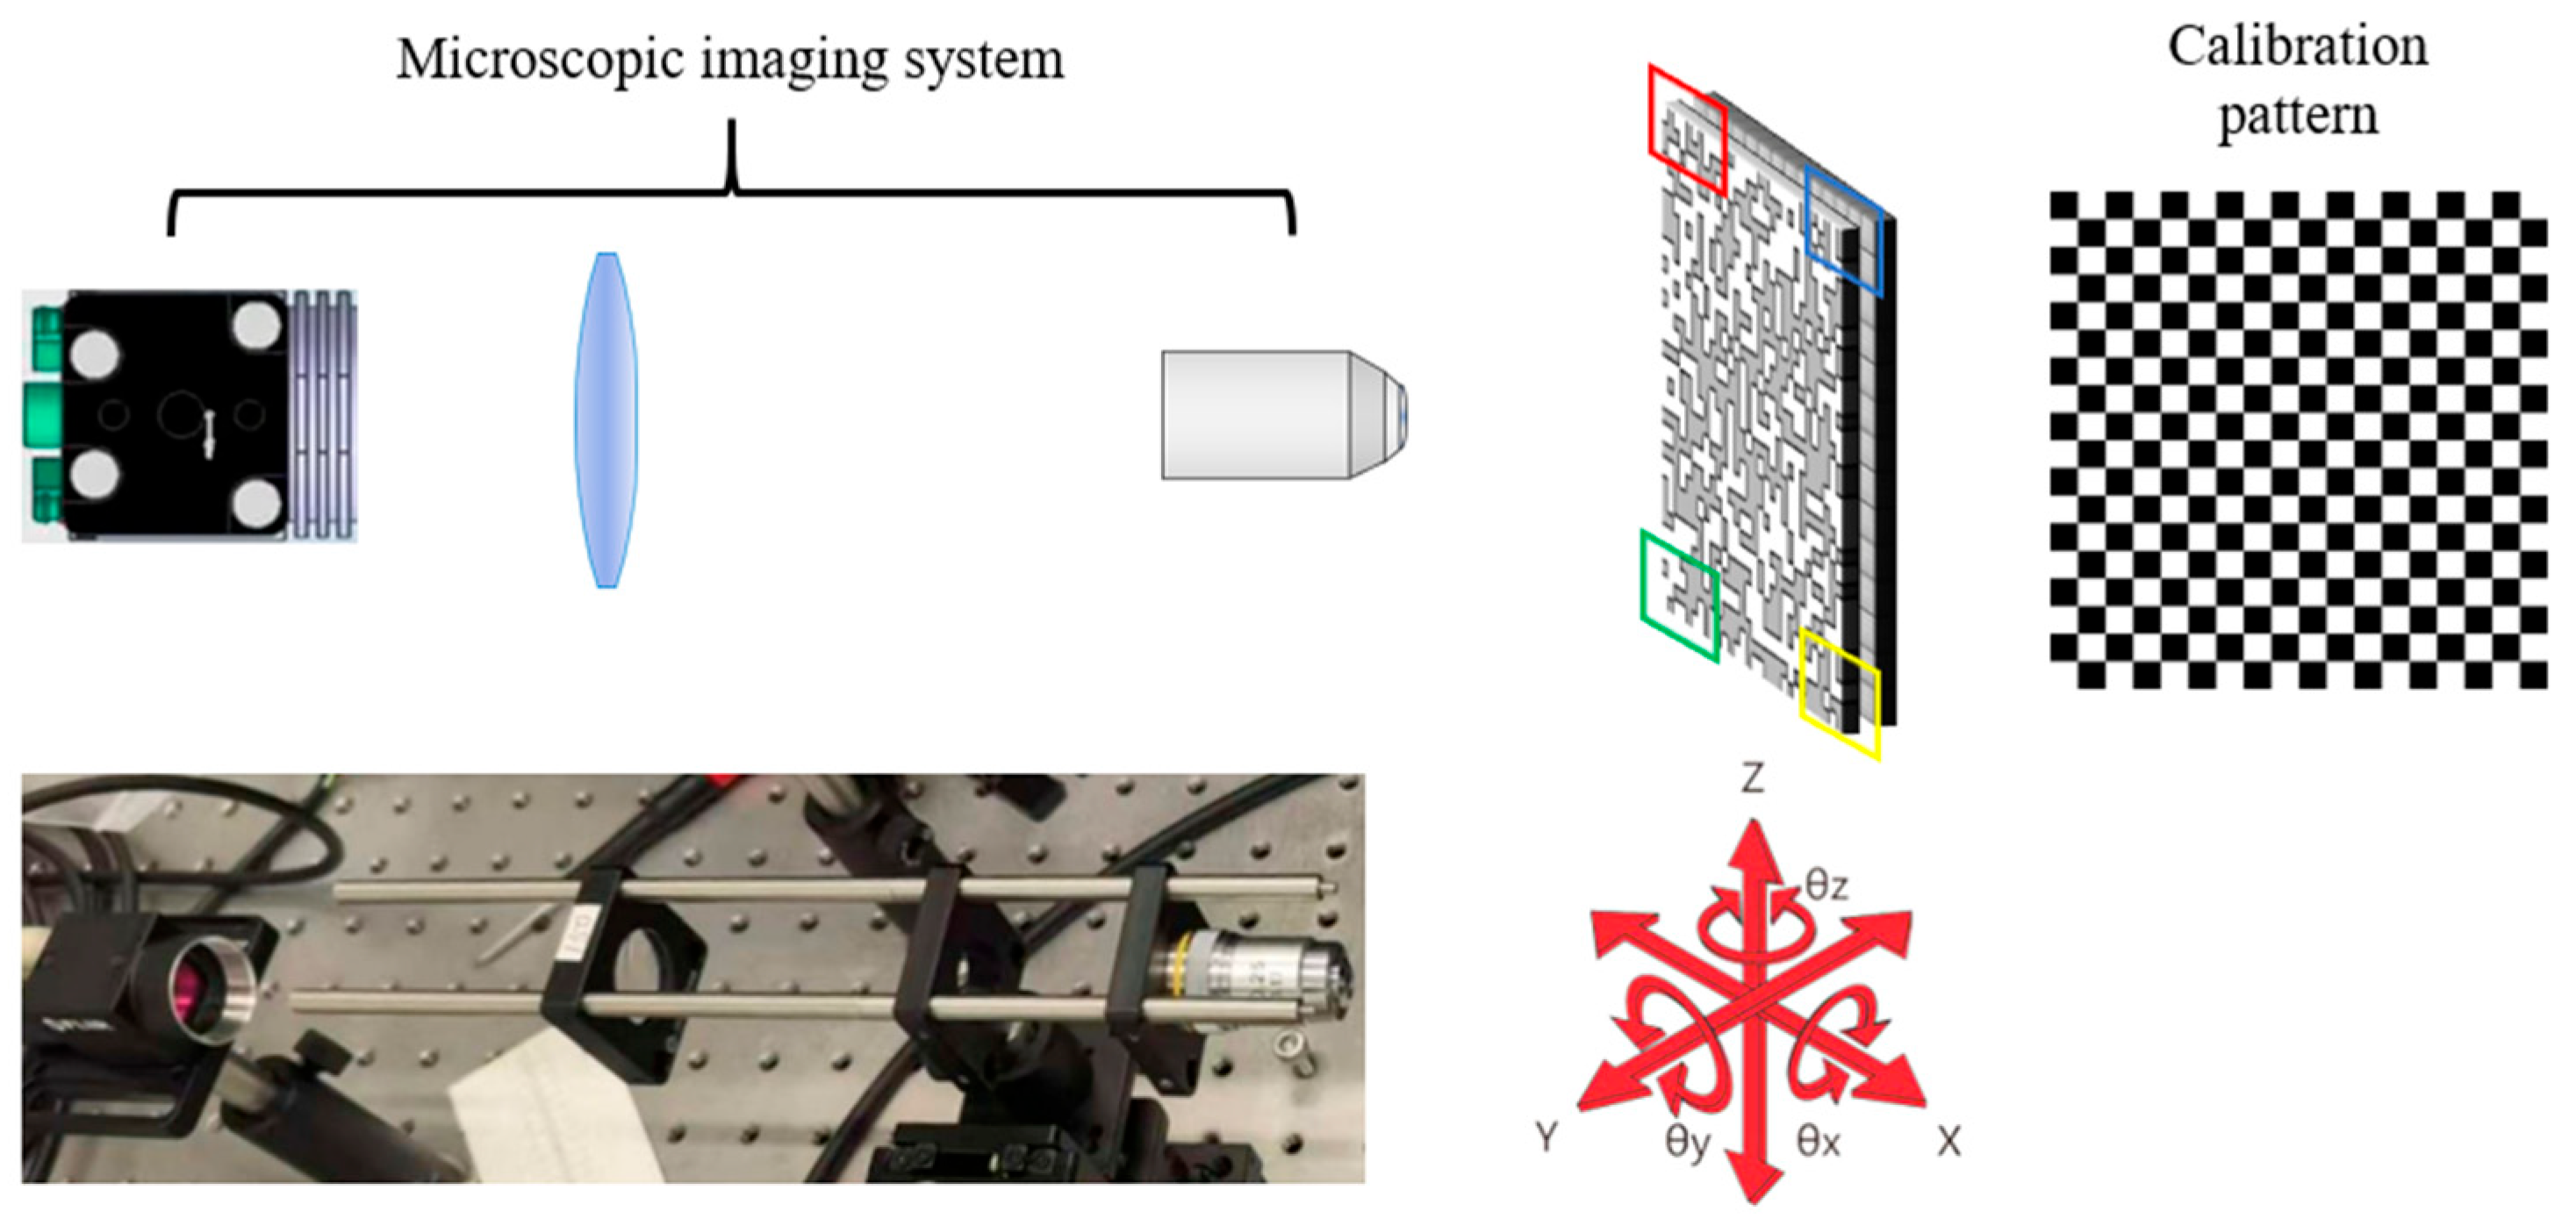
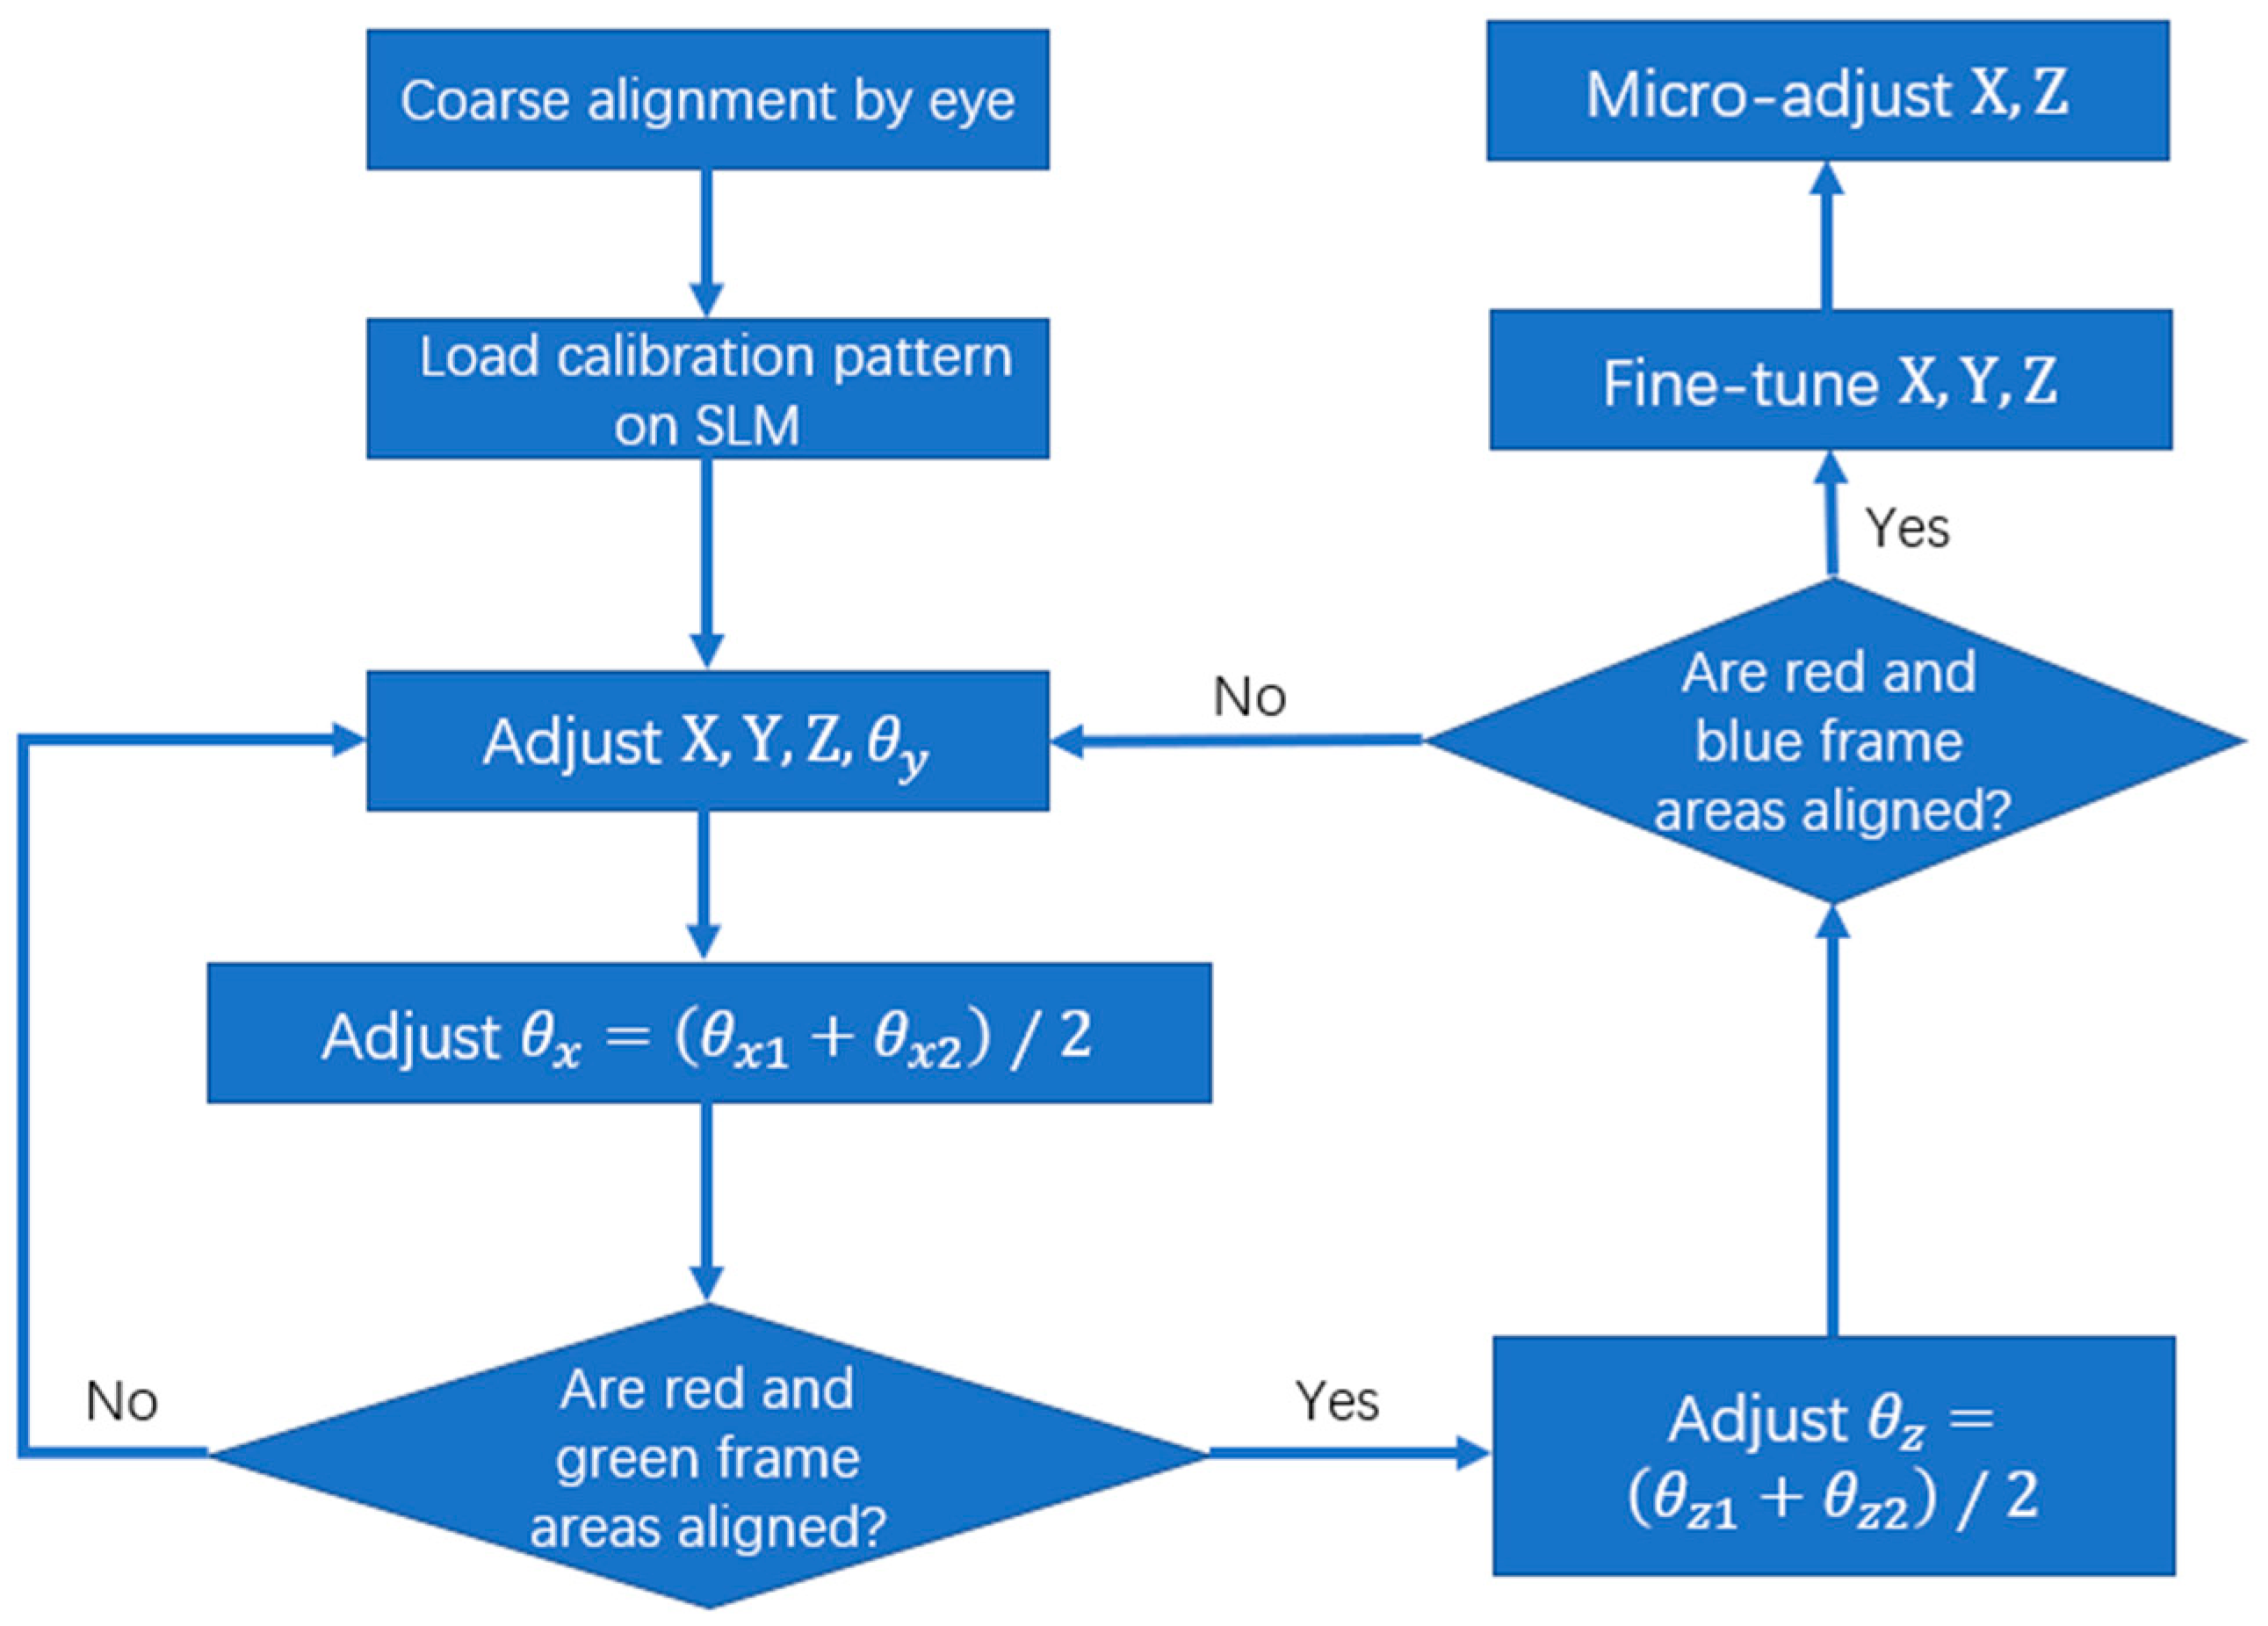
The system alignment process in this study is mainly divided into three stages: preliminary alignment, precise calibration, and fine-tuning optimization. The alignment apparatus and the corresponding flowchart are shown in Figure 11 and Figure 12, respectively. The preliminary alignment stage is conducted during the initial construction of the experimental platform. It involves roughly aligning the SLM’s conjugate image with the BRPM by visual inspection. Due to the lack of a precise measurement mechanism, this stage introduces considerable alignment error and therefore serves only for the coarse setup of the platform, not as a basis for final calibration.
Following the preliminary positioning, the precise calibration stage is initiated. This stage utilizes a pre-set calibration pattern, a microscopic imaging system, and the bisection method to perform high-precision adjustments on the six-axis stage (i.e., three translational and three rotational degrees of freedom). As the calibration of the rotational angles θ x , θ y , θ z is more challenging than that of the translational displacements X , Y , Z , angular adjustments are prioritized. Among the angles, changes in the yaw angle θ y (rotation around the Y-axis) are more easily observed within the field of view, as our system’s primary observation plane is the XZ plane. Therefore, we first calibrate θ y . This is done by loading a calibration pattern onto the SLM, focusing the microscopic system on the top-left corner of the SLM’s conjugate image (the red-boxed region in Figure 11), and adjusting the X , Y , Z translations to make the top-left corner of the BRPM spatially coincide with that of the conjugate image. The angle θ y is then adjusted to align their edge orientations. Afterward, while maintaining this alignment, the pitch angle θ x and the roll angle θ z are sequentially adjusted. For θ x calibration, for instance, we record the angle θ x 1 for the red-boxed region, then move the focus to the bottom-left corner (green-boxed region in Figure 11), adjust θ x for clear overlap, and record this new angle as θ x 2 . The average of these two angles is taken as the new setpoint, and the procedure is repeated until both regions are in focus. The process for θ z is analogous, using the top-right corner (blue-boxed region) to achieve focus alignment with the red-boxed region. Once angular calibration is complete, the X , Y , Z positions are fine-tuned for accurate coincidence across the entire field of view. Throughout this process, the microscope remains focused on the SLM’s conjugate image plane to ensure reliable assessment. The final calibration is verified by inspecting the alignment at the four corners; if significant deviation exists, the process is repeated until satisfactory precision is achieved. In our alignment system, based on the simulation analysis in Section 3.2 and the high-precision six-axis translation stage we used, we set the positioning tolerance to within ±1 micrometer. This is a significantly stricter requirement compared to conventional display systems without field-of-view expansion, for which the positioning tolerance can be relaxed to the millimeter level.
After completing the precise calibration, a final fine-tuning optimization is necessary to address potential residual deviations caused by factors such as optical aberrations and imperfections in the optical path setup. Based on the error analysis in Section 3.2 and related studies [30], even minute translational errors can significantly affect the intensity and quality of the reconstructed image. Accordingly, while keeping all angular parameters fixed, meticulous adjustments are made only to the translational positions along the X and Z-axes. This is accomplished by loading the computer-generated holograms (CGHs) produced by our proposed optimization algorithm and observing the imaging results in real time. The X and Z-parameters are then fine-tuned until the optimal reconstruction quality and image sharpness are obtained.
Despite our exhaustive procedure, the manual alignment method remains inherently labor-intensive and time-consuming. Moreover, its ultimate precision and repeatability are critically reliant on the operator’s expertise. The very thoroughness of our calibration protocol serves to underscore the intricacy of the alignment challenge. Any residual micro-errors stemming from these factors are a likely contributor to the observed discrepancy between our simulated and experimental results. To surmount these limitations, algorithmic calibration presents a promising avenue for a solution. For example, Kuo et al. utilized a learnable warp function based on the Thin-Plate Spline (TPS) model in their dual-SLM system [39]. This approach, by incorporating a differentiable coordinate transformation into the computational model, enables the automatic, end-to-end learning and compensation of complex non-linear misalignments between the two modulators, facilitating sub-pixel digital alignment. We intend to integrate these advanced digital calibration techniques into our system in future work. This will enable a faster, more robust, and higher-precision automatic alignment, ultimately boosting the overall system performance.

4. Conclusions

In conclusion, this paper has proposed and experimentally validated a novel framework centered on the deep integration of physically accurate modeling and advanced algorithmic optimization to extend the SBP of holographic near-eye displays. By applying this framework to a cascaded modulation architecture using an SLM and a BRPM, we achieved a four-fold extension of the field of view. We develop a physically accurate and differentiable propagation model for this cascaded system. This model provides a correct gradient flow for the optimization process and offers crucial support for achieving the SBP extension of the holographic display system. Based on this propagation model and combined with a modern gradient descent algorithm, our model-driven optimization framework achieves high-fidelity, low-speckle holographic reconstruction over a wide FOV, far surpassing traditional GS algorithms. Furthermore, our quantitative analysis of the system’s extreme sensitivity to alignment provides critical insights for its future engineering. Our research provides an effective pathway for developing large-FOV holographic displays.

Author Contributions

Conceptualization, S.Z. (Shenao Zhang) and W.L.; methodology, S.Z. (Shenao Zhang) and W.L.; software, S.Z. (Shenao Zhang); validation, S.Z. (Shenao Zhang), W.L. and B.D.; formal analysis, Q.W., S.Z. (Songlin Zhuang) and D.Z.; investigation, S.Z. (Shenao Zhang); resources, C.C.; data curation, D.Z.; writing—original draft preparation, S.Z. (Shenao Zhang) and W.L.; writing—review and editing, Q.W.; visualization, B.D.; supervision, C.C.; project administration, C.C.; funding acquisition, S.Z. (Songlin Zhuang) and D.Z. All authors have read and agreed to the published version of the manuscript.

Funding

This research was funded by the Science and Technology Commission of Shanghai Municipality, grant number 24511106500; the National Natural Science Foundation of China, grant number 62075040; the National Key R&D Program of China, grant number 2021YFF0701100; the Youth Innovation Promotion Association of CAS, grant number 2022232; and the Open Research Project of the Key Laboratory of Light-Interaction Service Technology, Ministry of Culture and Tourism.

Institutional Review Board Statement

Not applicable.

Informed Consent Statement

Not applicable.

Data Availability Statement

The data presented in this study are available on request from the corresponding author.

Conflicts of Interest

The authors declare no conflicts of interest.

Abbreviations

The following abbreviations are used in this manuscript:
SBPspace–bandwidth product
FOVfield of view
SLMspatial light modulator
BRPMbinary random phase mask
3Dthree-dimensional
VACvergence-accommodation conflict
VRvirtual reality
ARaugmented reality
LCoSLiquid-Crystal-on-Silicon
GSGerchberg–Saxton
IFTAIterative Fourier Transform Algorithm
PSNRPeak Signal-to-Noise Ratio
SSIMStructural Similarity Index
CGHscomputer-generated holograms

References

  1. Wakunami, K.; Hsieh, P.Y.; Oi, R.; Senoh, T.; Sasaki, H.; Ichihashi, Y.; Okui, M.; Huang, Y.; Yamamoto, K. Projection-type see-through holographic three-dimensional display. Nat. Commun. 2016, 7, 12954. [Google Scholar] [CrossRef]
  2. Shi, L.; Li, B.; Kim, C.; Kellnhofer, P.; Matusik, W. Towards real-time photorealistic 3D holography with deep neural networks. Nature 2021, 591, 234–239. [Google Scholar] [CrossRef]
  3. Itoh, Y.; Langlotz, T.; Sutton, J.; Plopski, A. Towards indistinguishable augmented reality: A survey on optical see-through head-mounted displays. ACM Comput. Surv. 2021, 54, 1–36. [Google Scholar] [CrossRef]
  4. Hoffman, D.M.; Girshick, A.R.; Akeley, K.; Banks, M.S. Vergence–accommodation conflicts hinder visual performance and cause visual fatigue. J. Vis. 2008, 8, 33. [Google Scholar] [CrossRef]
  5. Dorrah, A.H.; Bordoloi, P.; de Angelis, V.S.; de Sarro, J.O.; Ambrosio, L.A.; Zamboni-Rached, M.; Capasso, F. Light sheets for continuous-depth holography and three-dimensional volumetric displays. Nat. Photonics 2023, 17, 427–434. [Google Scholar] [CrossRef]
  6. Schnars, U.; Jüptner, W.P.O. Digital recording and numerical reconstruction of holograms. Meas. Sci. Technol. 2002, 13, R85. [Google Scholar] [CrossRef]
  7. Moser, S.; Ritsch-Marte, M.; Thalhammer, G. Model-based compensation of pixel crosstalk in liquid crystal spatial light modulators. Opt. Express 2019, 27, 25046–25063. [Google Scholar] [CrossRef]
  8. Chen, H.M.P.; Yang, J.P.; Yen, H.T.; Hsu, Z.N.; Huang, Y.; Wu, S.T. Pursuing high quality phase-only liquid crystal on silicon (LCoS) devices. Appl. Sci. 2018, 8, 2323. [Google Scholar] [CrossRef]
  9. Lazarev, G.; Chen, P.J.; Strauss, J.; Fontaine, N.; Forbes, A. Beyond the display: Phase-only liquid crystal on silicon devices and their applications in photonics. Opt. Express 2019, 27, 16206–16249. [Google Scholar] [CrossRef] [PubMed]
  10. Haist, T.; Osten, W. Holography using pixelated spatial light modulators—Part 1: Theory and basic considerations. J. Micro/Nanolith. MEMS MOEMS 2015, 14, 041310. [Google Scholar] [CrossRef]
  11. Maeno, K.; Fukaya, N.; Nishikawa, O.; Sato, K.; Honda, T. Electro-holographic display using 15 mega pixels LCD. In Proceedings of the Electronic Imaging: Science and Technology, San Jose, CA, USA, 28 January–2 February 1996; pp. 15–23. [Google Scholar]
  12. Hahn, J.; Kim, H.; Lim, Y.; Park, G.; Lee, B. Wide viewing angle dynamic holographic stereogram with a curved array of spatial light modulators. Opt. Express 2008, 16, 12372–12386. [Google Scholar] [CrossRef]
  13. Yaraş, F.; Kang, H.; Onural, L. Circular holographic video display system. Opt. Express 2011, 19, 9147–9156. [Google Scholar] [CrossRef]
  14. Sasaki, H.; Yamamoto, K.; Wakunami, K.; Ichihashi, Y.; Oi, R.; Senoh, T. Large size three-dimensional video by electronic holography using multiple spatial light modulators. Sci. Rep. 2014, 4, 6177. [Google Scholar] [CrossRef] [PubMed]
  15. Mishina, T.; Okano, F.; Yuyama, I. Time-alternating method based on single-sideband holography with half-zone-plate processing for the enlargement of viewing zones. Appl. Opt. 1999, 38, 3703–3713. [Google Scholar] [CrossRef]
  16. Liu, Y.Z.; Pang, X.N.; Jiang, S.; Dong, J.W. Viewing-angle enlargement in holographic augmented reality using time division and spatial tiling. Opt. Express 2013, 21, 12068–12076. [Google Scholar] [CrossRef]
  17. Sando, Y.; Barada, D.; Yatagai, T. Holographic 3D display observable for multiple simultaneous viewers from all horizontal directions by using a time division method. Opt. Lett. 2014, 39, 5555–5557. [Google Scholar] [CrossRef] [PubMed]
  18. Sando, Y.; Barada, D.; Yatagai, T. Full-color holographic 3D display with horizontal full viewing zone by spatiotemporal-division multiplexing. Appl. Opt. 2018, 57, 7622–7626. [Google Scholar] [CrossRef]
  19. Choi, C.; Kim, S.J.; Yun, J.G.; Sung, J.; Lee, S.Y.; Lee, B. Deflection angle switching with a metasurface based on phase-change nanorods. Chin. Opt. Lett. 2018, 16, 050009. [Google Scholar] [CrossRef]
  20. Choi, C.; Lee, S.Y.; Mun, S.E.; Lee, G.Y.; Sung, J.; Yun, H.; Yang, J.H.; Kim, H.O.; Hwang, C.Y.; Lee, B. Metasurface with nanostructured Ge2Sb2Te5 as a platform for broadband-operating wavefront switch. Adv. Opt. Mater. 2019, 7, 1900171. [Google Scholar] [CrossRef]
  21. Wang, D.; Li, Y.L.; Zheng, X.R.; Ji, R.N.; Xie, X.; Song, K.; Lin, F.C.; Li, N.; Jiang, Z.; Liu, C.; et al. Decimeter-depth and polarization addressable color 3D meta-holography. Nat. Commun. 2024, 15, 8242. [Google Scholar] [CrossRef]
  22. Yu, H.; Lee, K.; Park, J.; Park, Y. Ultrahigh-definition dynamic 3D holographic display by active control of volume speckle fields. Nat. Photonics 2017, 11, 186–192. [Google Scholar] [CrossRef]
  23. Baek, Y.S.; Lee, K.R.; Park, Y.K. High-resolution holographic microscopy exploiting speckle-correlation scattering matrix. Phys. Rev. Appl. 2018, 10, 024053. [Google Scholar] [CrossRef]
  24. Park, J.; Lee, K.R.; Park, Y.K. Ultrathin wide-angle large-area digital 3D holographic display using a non-periodic photon sieve. Nat. Commun. 2019, 10, 1304. [Google Scholar] [CrossRef] [PubMed]
  25. Vellekoop, I.M.; Mosk, A.P. Focusing coherent light through opaque strongly scattering media. Opt. Lett. 2007, 32, 2309–2311. [Google Scholar] [CrossRef] [PubMed]
  26. Vellekoop, I.M.; Lagendijk, A.; Mosk, A.P. Exploiting disorder for perfect focusing. Nat. Photonics 2010, 4, 320–322. [Google Scholar] [CrossRef]
  27. Mosk, A.P.; Lagendijk, A.; Lerosey, G.; Fink, M. Controlling waves in space and time for imaging and focusing in complex media. Nat. Photonics 2012, 6, 283–292. [Google Scholar] [CrossRef]
  28. Buckley, E.; Cable, A.; Lawrence, N.; Wilkinson, T. Viewing angle enhancement for two- and three-dimensional holographic displays with random superresolution phase masks. Appl. Opt. 2006, 45, 7334–7341. [Google Scholar] [CrossRef]
  29. Tsang, P.W.M.; Poon, T.C.; Zhou, C.; Cheung, K.W.K. Binary mask programmable hologram. Opt. Express 2012, 20, 26480–26485. [Google Scholar] [CrossRef]
  30. Choi, W.Y.; Lee, C.J.; Kim, B.S.; Oh, K.J.; Hong, K.; Choo, H.G.; Park, J.; Lee, S.Y. Numerical analysis on a viewing angle enhancement of a digital hologram by attaching a pixelated random phase mask. Appl. Opt. 2021, 60, A54–A61. [Google Scholar] [CrossRef]
  31. Gerchberg, R.W.; Saxton, W.O. A practical algorithm for the determination of phase from image and diffraction plane pictures. SPIE Milest. Ser. MS 1994, 94, 646. [Google Scholar]
  32. Wyrowski, F.; Bryngdahl, O. Iterative Fourier-transform algorithm applied to computer holography. J. Opt. Soc. Am. A 1988, 5, 1058–1065. [Google Scholar] [CrossRef]
  33. Sui, X.; He, Z.; Chu, D.; Cao, L. Non-convex optimization for inverse problem solving in computer-generated holography. Light Sci. Appl. 2024, 13, 158. [Google Scholar] [CrossRef] [PubMed]
  34. Goodfellow, I.; Bengio, Y.; Courville, A. Deep Learning; MIT Press: Cambridge, MA, USA, 2016. [Google Scholar]
  35. Goodman, J.W. Introduction to Fourier Optics; Roberts and Company Publishers: Greenwood Village, CO, USA, 2005. [Google Scholar]
  36. Schnars, U.; Falldorf, C.; Watson, J.; Jüptner, W. Digital Holography and Wavefront Sensing; Springer: Dordrecht, The Netherlands, 2015; pp. 1–226. [Google Scholar]
  37. Available online: https://github.com/pytorch/pytorch (accessed on 10 May 2024).
  38. Kinga, D.; Adam, J.B. A method for stochastic optimization. arXiv 2014, arXiv:1412.6980. [Google Scholar] [CrossRef]
  39. Kuo, G.; Schiffers, F.; Lanman, D.; Cossairt, O.; Matsuda, N. Multisource holography. ACM Trans. Graph. 2023, 42, 1–14. [Google Scholar] [CrossRef]
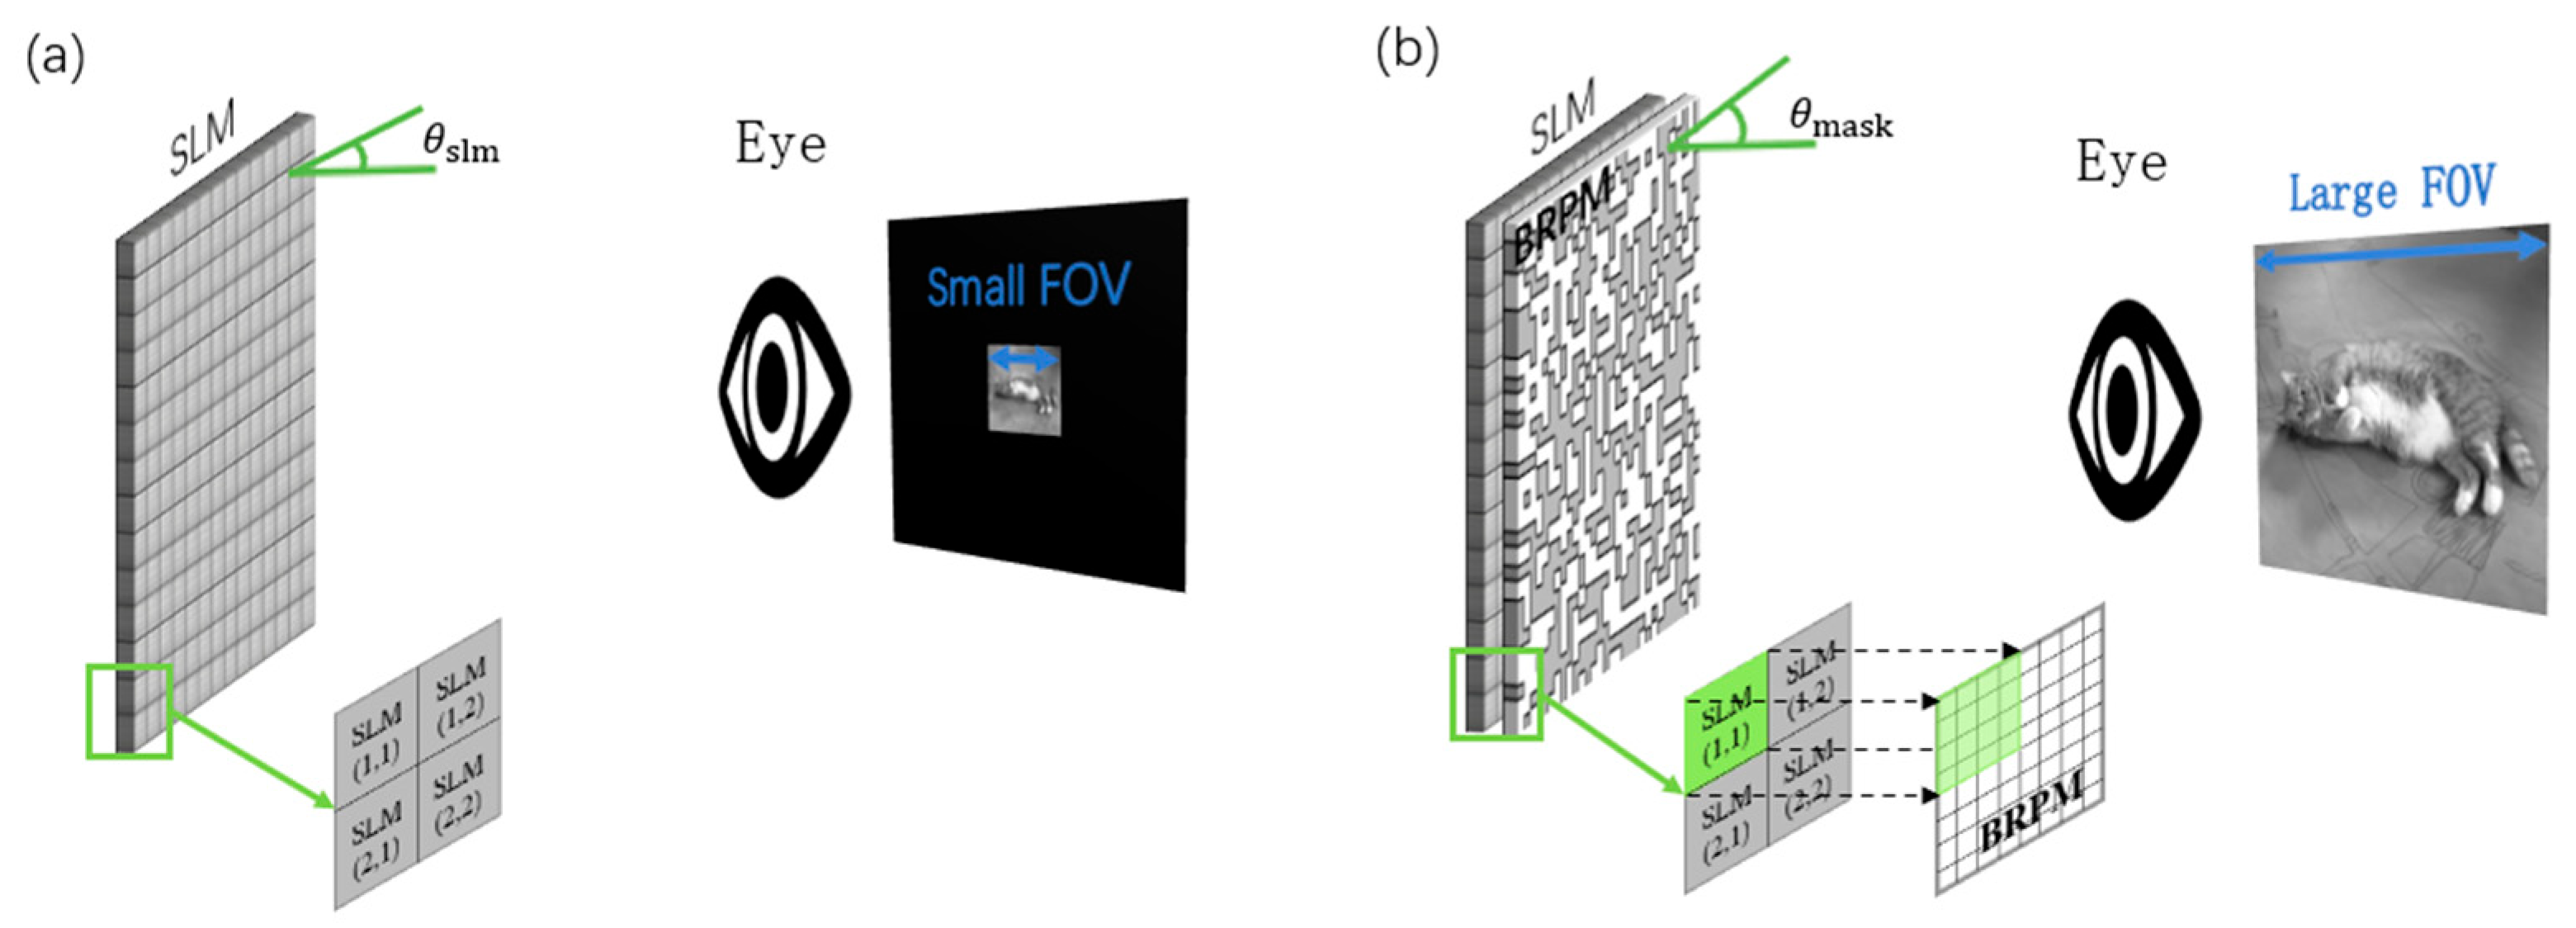
Figure 1. Schematic diagram of SBP extension for holographic displays. (a) Conventional holographic display; (b) Holographic display with an attached BRPM.
Applsci 15 09237 g001
Figure 2. Schematic of the maximum spatial frequency in the reconstructed light intensity distribution.
Applsci 15 09237 g002
Figure 3. Schematic diagram illustrating the use of zero-padding on the hologram plane to reduce the sampling interval in the reconstruction plane.
Applsci 15 09237 g003
Figure 4. Schematic of the iterative optimization method for phase-only CGHs in a holographic display system.
Applsci 15 09237 g004
Figure 5. Flowchart of the iterative optimization algorithm.
Applsci 15 09237 g005
Figure 6. Simulation results. First column: target images. Second column: CGHs generated by our iterative optimization method. Third column: simulated reconstructions from our method. Fourth column: simulated reconstructions using the traditional GS algorithm with the BRPM. Fifth column: simulated reconstructions using the gradient descent algorithm without the BRPM. The inset in the red box shows a magnified view of the resolution test chart.
Applsci 15 09237 g006
Figure 7. The optical experiment platform. The red dashed arrow indicates the optical path.
Applsci 15 09237 g007
Figure 8. Optical simulation and experimental results of our method. First row: target images. Second row: simulated reconstructions from our method. Third row: experimental results from our method.
Applsci 15 09237 g008
Figure 9. Validation of the multi-plane imaging capability. (a) Simulated (top row) and experimental (bottom row) results for the first target image. The columns demonstrate selective focusing on the foreground (left half) and the background (right half), respectively. (b) Results for a second target image, similarly showing sharp focus on the designated foreground and background planes in both simulation and experiment.
Applsci 15 09237 g009
Figure 10. Simulation of the effects of misalignment between the BRPM and the SLM. The coordinates above each image indicate the horizontal (rightward) and vertical (downward) displacement of the BRPM relative to the SLM. (a) Result with (0 µm, 0 µm) misalignment. (b) Result with (3.2 µm, 0 µm) misalignment. (c) Result with (3.2 µm, 3.2 µm) misalignment. (d) Result with (6.4 µm, 0 µm) misalignment. (e) Result with (3.2 µm, 6.4 µm) misalignment. (f) Result with (9.6 µm, 0 µm) misalignment.
Applsci 15 09237 g010
Figure 11. Apparatus for the precise alignment of the SLM conjugate image and the BRPM.
Applsci 15 09237 g011
Figure 12. Flowchart for the precise alignment of the SLM’s conjugate image with the BRPM.
Applsci 15 09237 g012
Disclaimer/Publisher’s Note: The statements, opinions and data contained in all publications are solely those of the individual author(s) and contributor(s) and not of MDPI and/or the editor(s). MDPI and/or the editor(s) disclaim responsibility for any injury to people or property resulting from any ideas, methods, instructions or products referred to in the content.