Article

Predicting Attachment Class Using Coherence Graphs: Insights from EEG Studies on the Secretary Problem

Department of Industrial Engineering and Management, Ariel University, Ariel 4070000, Israel
*
Author to whom correspondence should be addressed.
Appl. Sci. 2025, 15(16), 9009; https://doi.org/10.3390/app15169009
Submission received: 22 June 2025 / Revised: 12 August 2025 / Accepted: 14 August 2025 / Published: 15 August 2025
(This article belongs to the Special Issue Brain Functional Connectivity: Prediction, Dynamics, and Modeling)

Abstract

Attachment styles, rooted in Bowlby’s Attachment Theory, significantly influence our romantic relationships, workplace behavior, and decision-making processes. Traditional methods like self-report questionnaires often have biases, so we aimed to develop a predictive model using objective physiological data. In our study, participants engaged in the Secretary problem, a sequential decision-making task, while their brain activity was recorded with a 16-electrode EEG device. We transformed this data into coherence graphs and used Node2Vec and PCA to convert these graphs into feature vectors. These vectors were then used to train a machine learning model, XGBoost, to predict attachment styles. Using participant-level nested 5-fold cross-validation, our first model achieved 80% accuracy for Secure and 88% for Fearful-avoidant styles but had difficulty distinguishing between Avoidant and Anxious styles. Analysis of the first three principal components showed these two groups overlapped in coherence space, explaining the confusion. To address this, we created a second model that categorized participants as Secure, Insecure, or Extremely Insecure, improving the overall accuracy to about 92%. Together, the results highlight (i) large-scale EEG connectivity as a viable biomarker of attachment, and (ii) the empirical similarity between Anxious and Avoidant profiles when measured electrophysiologically. This method shows promise in using EEG data and machine learning to understand attachment styles. Our findings suggest that future research should include larger and more diverse samples to refine these models. If validated in multi-site cohorts, such graph-based EEG markers could guide personalised interventions by objectively assessing attachment-related vulnerabilities. This study demonstrates the potential for using EEG data to classify attachment styles, which could have important implications for both research and therapeutic practices.

1. Introduction

The main idea behind Bowlby’s Attachment Theory is that people vary in forming emotional bonds with others [1]. Typically, the social and behavioral sciences identified four types of attachment styles: secure, anxious, avoidant, and fearful-avoidant styles. The primary distinction in attachment styles is between secure and insecure attachment. Securely attached individuals exhibit mutual trust, support, emotional stability during conflicts, and the ability to set healthy boundaries. Insecure attachment styles are broadly categorized into anxious and avoidant types. Anxiously attached individuals fear abandonment, need constant validation, and rely heavily on their partner for self-worth. Avoidantly attached individuals shun intimacy and vulnerability, struggle with commitment, and tend to be guarded and emotionally distant. Some people display both high anxiety and high avoidance, known as fearful-avoidant (or disorganized) attachment. These individuals have a strong fear of rejection, difficulty trusting and depending on partners, and low self-esteem.
Attachment style is typically formed in the early childhood years of zero to three; it is now well known that it affects not only our adult romantic relationships [2] but also our behavior in the work environment and strategic decision-making in general [3,4,5]. For example [6], it was shown that attachment style is related to adolescents’ autonomy in decision-making. Another study [7] shows that career decision-making of final-year high school students was correlated to the student attachment style. Finally, ref. [8] showed that the students’ attachment styles significantly predict decision self-esteem, decision-making styles, and personality traits.
Today, self-report questionnaires and narratives are two primary methods for measuring adult attachment style [9]. Various self-report questionnaires exist, each with unique attributes; some classify individuals into one of the four attachment styles, while others assess the degree to which attachment dimensions (anxiety or avoidance) are present [10]. For instance, the ECR-R (Experiences in Close Relationships—Revisited) questionnaire [11] includes 36 items. It is a reliable and valid self-report tool that quantifies the anxiety and avoidance dimensions on a scale from 1 to 7.
While self-report questionnaires and narratives are valuable for measuring adult attachment styles, they come with biases and limitations. These methods depend on individuals’ self-awareness and honesty, which can lead to inaccuracies. Due to these shortcomings, there is increasing interest in finding objective physiological measures that provide more reliable and unbiased data. Exploring psychophysiological responses, such as EEG signals, offers a promising way to develop predictive models that classify attachment styles accurately without relying on self-reported information.
This shift towards objective measures is supported by advancements in understanding the psychophysiological aspects of attachment styles.
Studies have examined cardiovascular activity, galvanic skin response, and adrenocortical output to explore how attachment style influences physiological regulation, especially under stress [9]. These findings suggest that attachment is not only a psychological construct but also expressed through measurable biological responses [12]. More recently, EEG research has provided valuable insights into how attachment patterns affect brain function. For example, Verbeke et al. [13] showed that individuals with anxious attachment display heightened alpha, beta, and theta power in social situations, indicating increased cortical arousal. Sloan et al. [14] linked attachment anxiety to atypical alpha activity during sleep, suggesting a persistent state of physiological vigilance. Rognoni et al. [15] associated adult attachment styles with frontal EEG asymmetry, a marker often tied to emotional regulation strategies [9]. Zuckerman et al. [16] further demonstrated that attachment style modulates early and late ERP components during emotionally relevant decision-making tasks, particularly under conditions of cognitive conflict. Together, these studies show that attachment-related differences are reflected in neural activity across a range of contexts. However, most of this research has focused on average group-level comparisons rather than on building predictive models that classify attachment style at the individual level. Addressing this gap could lead to more precise tools for both research and clinical use.
Although previous studies have explored the connection between attachment and physiological responses, one important area remains underexplored: using objective physiological data to predict attachment styles at the individual level. As noted in a recent study on attachment and depression, there is a growing need to move beyond self-report questionnaires, which are vulnerable to bias, and to include physiological markers as a more objective alternative [12]. Most research continues to depend on self-report tools, which can be influenced by memory limitations or the desire to present oneself favorably. Physiological measures such as EEG provide a more direct way to observe how attachment tendencies are reflected in brain activity. EEG data can be analyzed using a range of methods, including time- and frequency-based approaches, as well as more advanced techniques like wavelet transforms, principal component analysis (PCA), and independent component analysis (ICA).
Several recent studies demonstrate their potential in emotion and attachment-related contexts. For example, a two-step PCA–ICA pipeline was successfully used to isolate EEG components associated with social acceptance and rejection in adolescent romantic couples, reflecting both spatial and temporal aspects of emotional processing [17]. In patients with depression, Morlet wavelet transformation revealed elevated gamma activity in response to attachment-related stimuli, especially among those with higher emotional reactivity [18]. In the stress domain, PCA, ICA, and wavelet-based DCT were used in EEG-based stress detection from the DEAP dataset, showing that these preprocessing methods contribute meaningfully to emotional state classification [19]. Similarly, EEG responses to music-based attention modulation were clarified using ICA and wavelet transforms, which revealed differences in alpha and beta band activity depending on stimulus type [20]. These findings highlight the versatility of such techniques in detecting neural patterns associated with psychological states. Even so, this approach remains underused in attachment research compared to its growing application in other domains of psychophysiology.
In our previous studies, we explored the Secretary Problem by analyzing neurophysiological data, focusing on changes in Theta and Beta band power and Event-Related Potentials (ERPs) to understand shifts in cognitive load during sequential decision-making [21,22]. These investigations provided a detailed look at how mental resources vary during decision-making. The Secretary Problem is an ideal test-bed for attachment research because it forces an irrevocable, high-stakes choice: once an offer is rejected, it cannot be revisited. This “no-return” rule elevates both cognitive demand (continuous rule-updating) and situational anxiety over missing the optimum [23]. Attachment theory predicts divergent reactions: anxious profiles typically hyper-monitor loss and show heightened arousal, whereas avoidant profiles down-regulate threat and invest less cognitive effort [24]. EEG work confirms that anxious individuals display stronger fronto-parietal coherence under stress, whereas avoidant individuals show weaker long-range coupling [25]. Analyzing such coherence graphs links our paradigm to broader personality-neuroscience research that relates graph metrics to individual traits [26]. Thus, the Secretary Task simultaneously taxes cognition and triggers attachment-relevant affect, offering a theoretically grounded context for distinguishing attachment styles. The current study, however, broadens this scope by combining the Secretary Problem with attachment theory, aiming to predict attachment styles using coherence graphs derived from EEG data. This study addresses the current research gap by integrating the Secretary Problem with attachment theory to predict attachment styles using coherence graphs from EEG data. By developing a new predictive model, we can observe how brain regions interact during decision-making tasks. Coherence graphs help identify patterns in brain activity, which can then be linked to attachment styles, offering a more objective assessment based on physiological data. This approach could deepen our understanding of how attachment styles influence decision-making, directly connecting psychological traits with brain activity.
To explore these connections further, we utilize the node2vec algorithm as part of our analytical approach, which brings several benefits [27]. Node2vec creates continuous feature representations for nodes in a graph by simulating random walks, which helps capture both local and global structural information. Understanding the complex relationships within EEG coherence data is important. Traditional methods for analyzing EEG data often depend on predefined features, which might miss the deeper connections within the data. In contrast, node2vec explores the graph through random walks, allowing it to capture both local neighborhoods and broader structural patterns.
This dual ability is especially useful for EEG coherence graphs, where the relationships between electrodes can show complex patterns at various scales. Node2vec’s flexibility lets us adjust the random walks to favor either breadth-first or depth-first search strategies, tailoring the process to capture the most relevant patterns in our EEG data. Additionally, the algorithm is efficient and scalable, making it suitable for handling the large and detailed coherence graphs derived from EEG data. By embedding the graph into a continuous vector space, node2vec maintains the essential relationships between nodes, resulting in more informative and distinctive features for our machine learning models. This innovative method allows us to build a more accurate predictive model, advancing the field of attachment style classification based on objective physiological data [27,28].
To implement this approach, we collected EEG data from participants while they engaged in a sequential decision-making task. Specifically, participants played an instance of the Secretary problem [29] while the electrical brain signals on their scalp were recorded using a 16-electrodes EEG device. The EEG data was used to construct a coherence graph (e.g., [30,31]) describing the relationship between the electrodes. The coherence graph was transformed into a feature vector using a virtual node embedding technique and the Node2vec algorithm [27,32]. The feature vectors were input into the XGBoost [33] decision-learning tree algorithm to construct a predictive model.
Our results show great success in predicting secure and fearful-avoidant attachment styles. The secure cluster was correctly predicted with around 80% accuracy, and the fearful-avoidant group was correctly predicted with around 88% accuracy. However, the two other attachment clusters, anxious and avoidant, were harder to predict, and the model could not differentiate them. Some of the anxious individuals were classified as avoidants and the other way around. Next, we constructed a second model to classify three clusters: Secure, Insecure, and Extreme Insecure, and we were able to achieve an improved correct classification of around 92%. Further research is needed to understand why and utilize more data or other techniques to construct more robust models.

2. Methods

The study consisted of two primary phases. First, a questionnaire was conducted to determine the participants’ attachment styles, and then an EEG study was conducted to record brain patterns. The experiment received approval from the institution’s Institutional Review Board (IRB) committee, and all participants signed a formal agreement form before participating.

2.1. First Phase—ECR-R Questionnaire

In the first phase of the experiments, we asked 96 participants, fourth-year senior engineering students (average age of 24.25 with σ = 2.0673), to fill out an ECR-R questionnaire (with 36 items). In each item in the ECR-R questionnaire, one must determine how much she agrees or disagrees with the presented statement on a scale from 1 to 7. A value of 1 means “Strongly disagree”, and 7 means “Strongly agree”. The questionnaire items include questions such as: “I’m afraid that I will lose my partner’s love”, “I prefer not to show my partner how I feel deep down”, and “I am very comfortable being close to romantic partners”.
The ECR-R questionnaire outputs two values as numbers from 1 to 7. One value is the quantified degree of anxiety, and the other is the quantified degree of avoidance. When these two values are low, the person is said to have a secure attachment style. When these two values are high, the person is said to have a fearful-avoidant attachment style. When one of these values is high, and the other is low, this person is said to have an anxious or avoidance attachment based on the higher values of these two. Next, we employed the k-means clustering algorithm (with k = 4) to classify the samples into the four clusters of attachment styles [34]. Figure 1 depicts the results of the k-means algorithm. It is worth noting that the sizes of the different clusters were very similar to the common percentages available in the psychological literature. Most studies on different populations show that roughly 50% of the population exhibits a secure attachment style, around 20% exhibit an anxious and avoidant attachment style, and around 10% have a fearful avoidant attachment style [3,35].
Following the initial assessment of attachment style using the ECR-R questionnaire, a subset of participants was invited to take part in the EEG-based decision-making experiment described below. The following Section 2.2 and Section 2.3 provide full details on participant distribution and experimental design, while Section 2.4 outlines the EEG data acquisition and preprocessing procedures.

2.2. Second Phase—EEG Recording in the Secretary Game

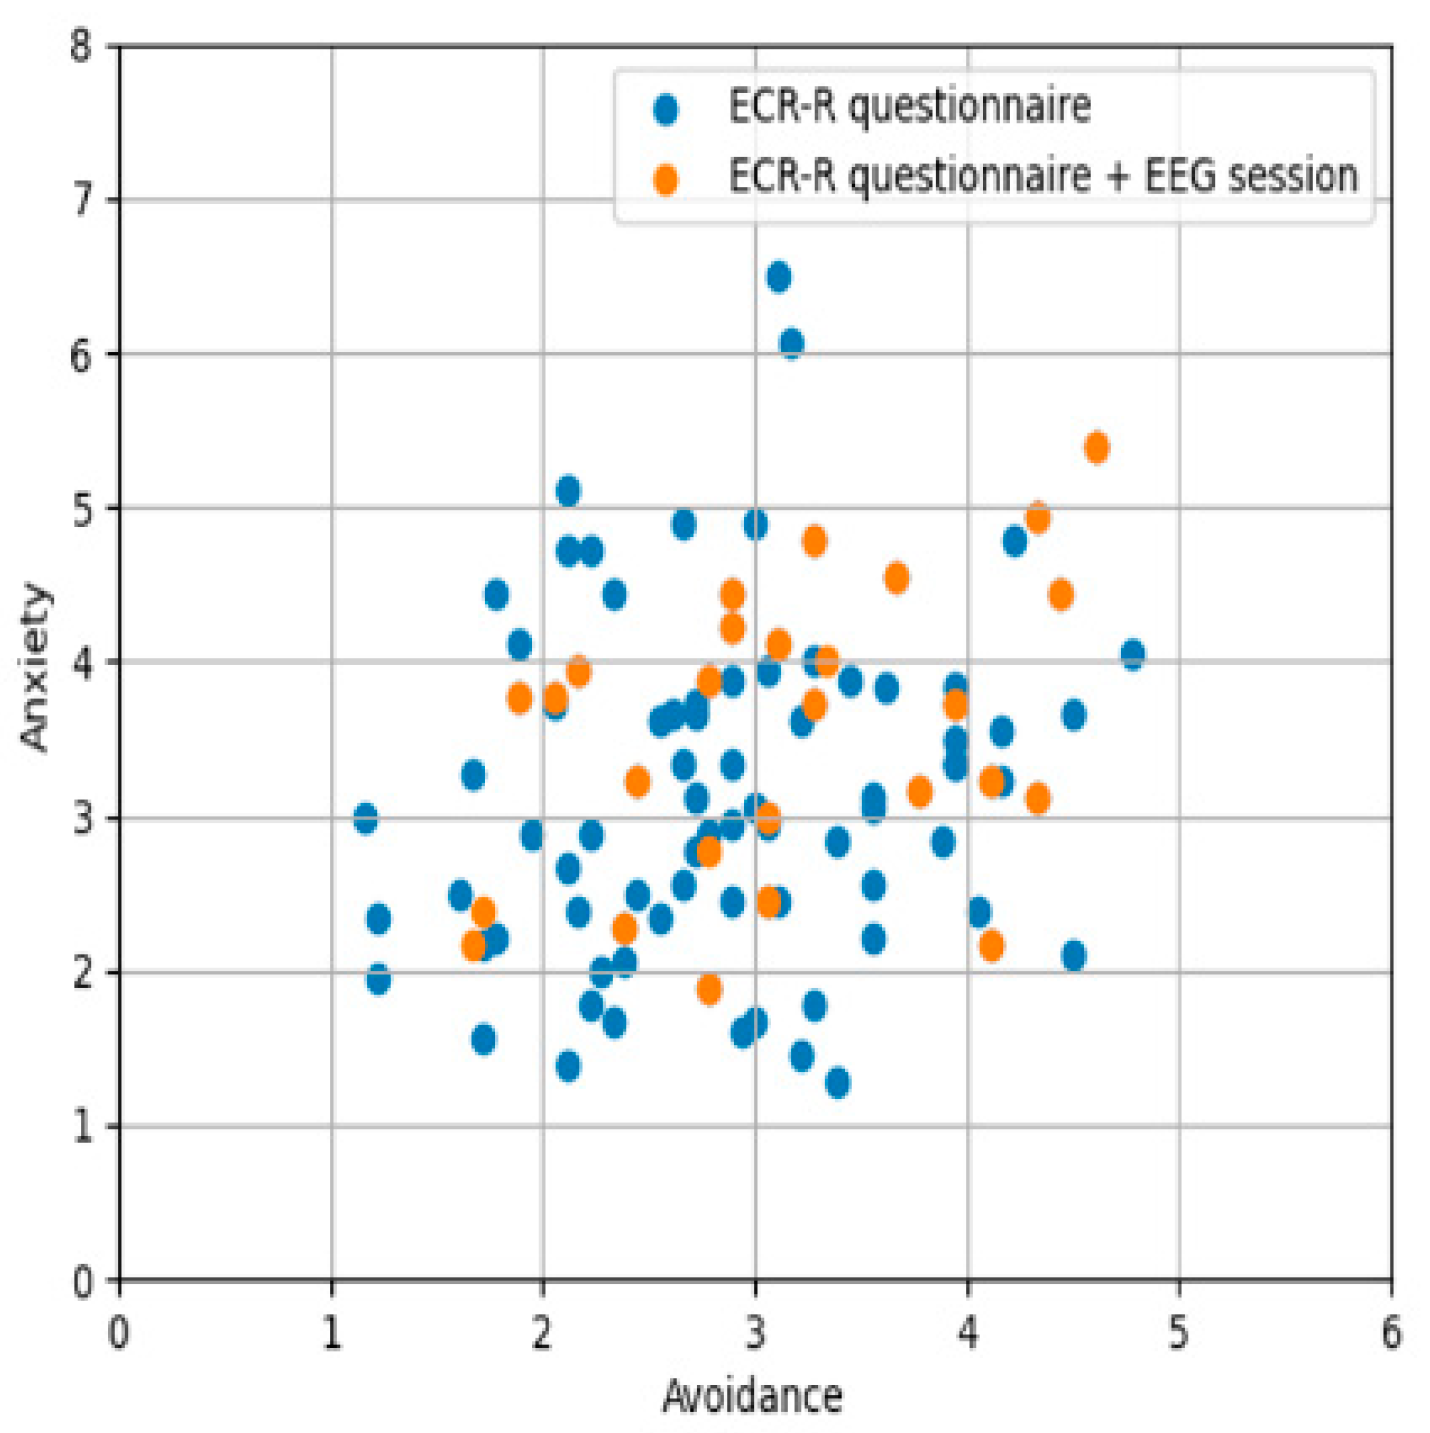
In the second phase of the experiment, we issued invitations to participate in the EEG laboratory part. Each session was one hour long, and participants were paid for their efforts. We employed a proportional allocation method to ensure a representative distribution across attachment clusters. The secure group consisted of six participants; nine were anxiously attached, seven were avoidants, and five participants had a fearful avoidant attachment. Figure 2 shows the 27 individuals who participated in the EEG recording part of the experiment. The blue dots represent participants who completed only the ECR-R questionnaire, while the orange dots represent those who participated in both the ECR-R questionnaire and the EEG session. This scatter plot maps the participants based on their levels of Anxiety and Avoidance, which are key dimensions in attachment theory. From the figure, it is clear that the participants in the EEG session (orange dots) provide a relatively uniform sample compared to the broader population (blue dots) surveyed in the initial stage. This consistency ensures that the EEG sample accurately reflects the broader attachment style distribution observed in the larger group.
While the scatter plot does not display distinct clusters for each attachment style, it demonstrates the continuous nature of Anxiety and Avoidance. Individuals are distributed across a range of values for both dimensions, showing variability in how these traits are expressed. This distribution supports the idea that Avoidant and Anxious attachment styles can coexist within individuals, as no clear boundaries separate these traits. Instead, individuals may exhibit varying levels of both Anxiety and Avoidance, rather than fitting neatly into discrete categories. This visual representation underscores the complexity and variability of attachment styles, highlighting the importance of using detailed methods like EEG coherence graphs (see Section 3 below) to gain deeper insights into the underlying neurophysiological mechanisms of attachment behaviors.
In the second phase, participants engaged in six blocks of the secretary problem task, each consisting of 20 monetary offers. These offers, represented as sums of money displayed on-screen, required participants to accept (pressing the ‘Y’ key) or reject (pressing the ‘N’ key) each one. Simulating the role of apartment sellers, participants knew they could neither see future offers nor revisit past ones. The primary objective was to select the highest offer in each block to maximize potential earnings, where their actual monetary compensation for participating in the experiment was a function of their success in the Secretary game. It is important to note that if a participant did not choose any offer within a block, it was considered as if they had accepted the last offer. The stream of offers and the experimental setting are adapted from the study conducted by Hsiao and Kemp [37]. However, we increased the original bids tenfold in blocks 2, 4, and 6 of our experiments to see if this increased value changes one’s decision-making process, either behaviorally or in his brain patterns as recorded by the EEG.
Crucially, each of the six blocks generated an independent EEG coherence graph, so that the 27 participants contributed a total of 27 × 6 = 162 graph-level observations. These 162 feature vectors form the input dataset for our machine-learning pipeline, allowing the model to learn from multiple decision episodes per participant and thereby reducing the risk that idiosyncratic traits of any single individual drive the results.

2.3. Experiment Procedure

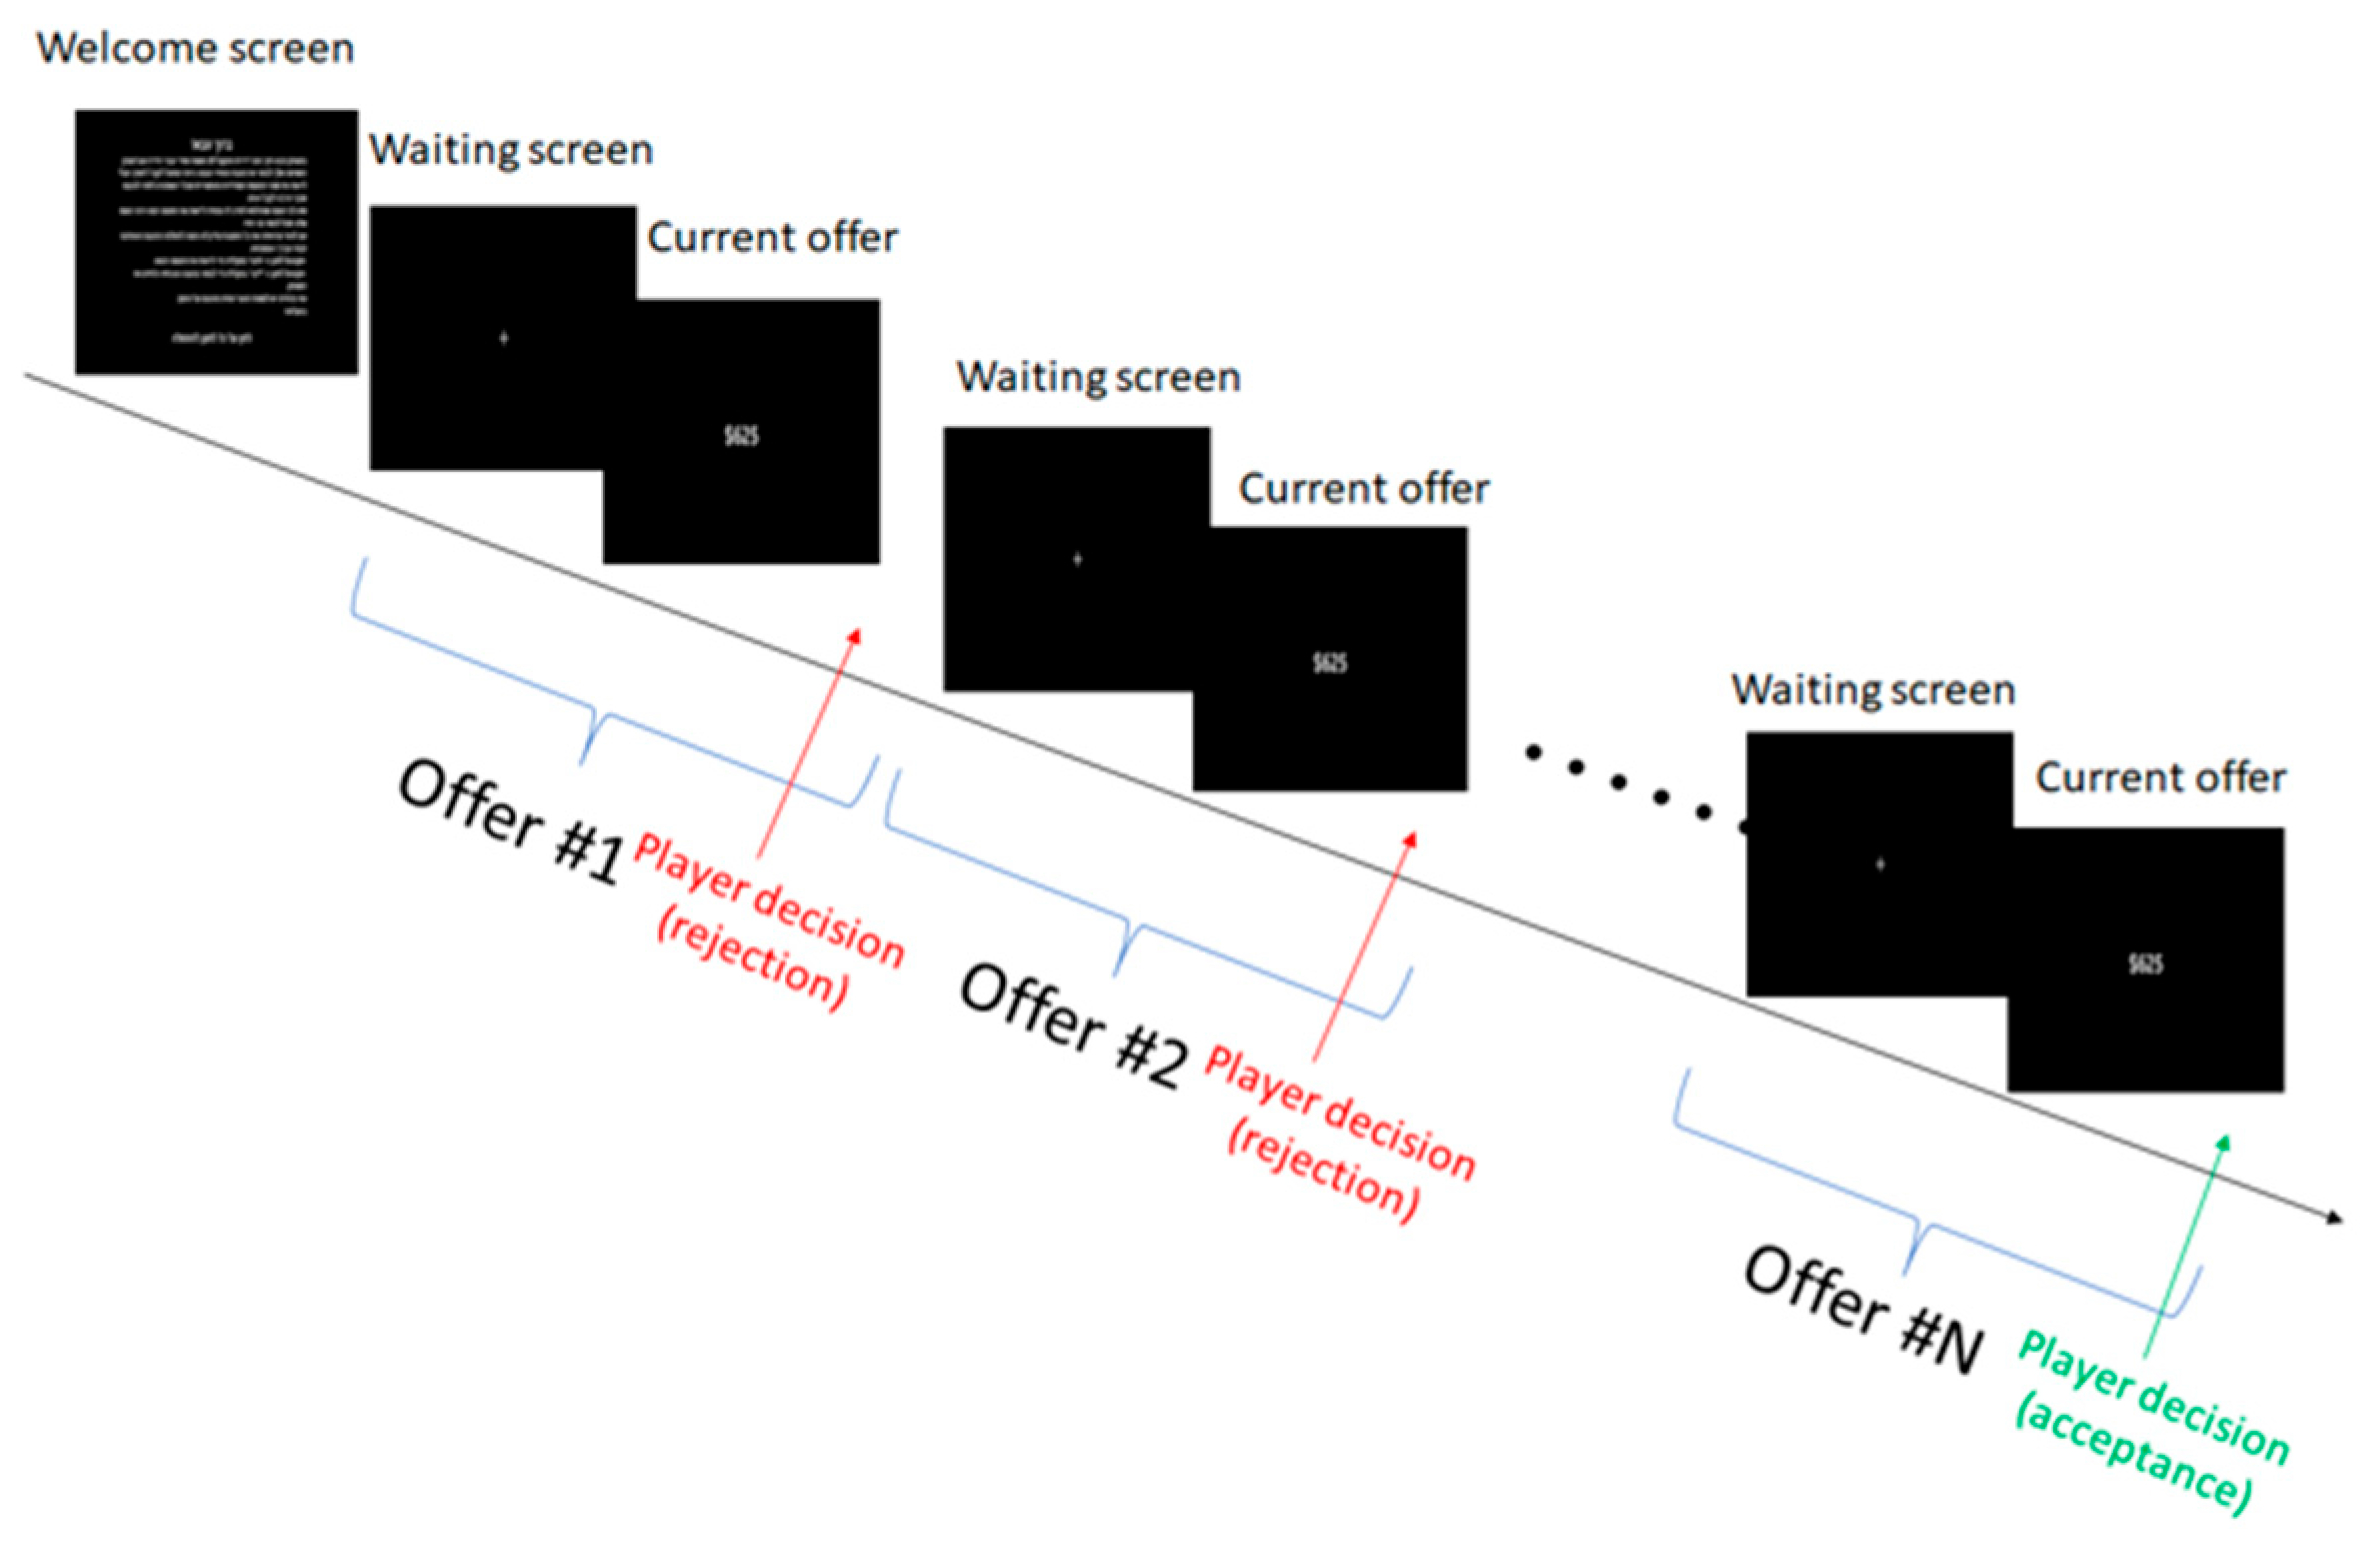
As stated above, each participant played six blocks of the secretary problem. Figure 3 depicts graphically the construction of a single game block. The participant first sees a welcome screen with some instructions on the upcoming task. Next, a waiting screen is displayed for a randomized duration of 200 to 500 milliseconds. The offer screen follows with a single amount of money in the center of the screen. This screen will remain active (without time restrictions) until a decision is made by the participant (either accept or reject). If the offer was rejected and the session had not yet concluded, the procedure reverted to the waiting screen, maintaining the decision-making cycle.
Before beginning data collection, participants underwent a thorough briefing and were equipped with an EEG cap. Two training sessions were conducted to ensure they were comfortable with the task and the experimental environment. These sessions, held without EEG recording, were important for familiarizing participants with the task.
EEG signals were recorded using a 16-channel active EEG amplifier (e.g., USBAMP by g.tec, Schiedlberg, Austria) operating at a sampling rate of 512 Hz, following the 10–20 international system for electrode placement. The electrode impedance was kept below 5 Kohm, monitored through OpenVibe software (version 3.6.0). For data preprocessing, we applied a 1–30 Hz FIR bandpass filter and used Independent Component Analysis (ICA) to separate neural signals from artifacts. The EEGLAB software’s (version 2023.1) algorithm, described by Delorme and Makeig (2004) [38] facilitated this process. We identified and eliminated artifacts such as eye movements, blinks, muscle activity from facial and neck regions, and electrical noise from the environment. Specifically, a notch FIR filter was used to remove the 50 Hz line noise often introduced by power lines.

2.4. Data Processing and Analysis

In our analysis, we focused on a fixed 2-s “decision-making” window for each round of the secretary game. This window spans from 1 s before the participant’s decision (pressing “Y” or “N”) to 1 s after the decision. Each participant completed 6 game blocks (rounds), yielding a total of 162 decision-window epochs (27 participants × 6 blocks). Because each game round could end at a different offer (out of 20 possible offers) depending on when the participant made their final decision, the length of each block (and the exact timing of the decision within it) varied across trials.
The end-to-end pipeline comprises five stages:
  • Compute coherence between EEG channels and construct a 16 × 16 brain network (coherence graph) for each epoch.
  • Add a virtual central node to the coherence graph and apply the node2vec algorithm to embed the graph into a feature vector representation [27].
  • Reduce the dimensionality of the resulting feature vectors using Principal Component Analysis (PCA) to retain the most important features [39].
  • Use the resulting features as input to train an XGBoost ensemble decision-tree classification model to predict attachment class [33].
  • Evaluate the model using nested 5-fold cross-validation at the participant level to tune hyperparameters and assess performance while preventing overfitting.

2.4.1. EEG Coherence

In signal processing, coherence is a statistical measure of the relationship between two signals. It is defined for two signals x(t) and y(t) by the formula:
C x y f =   G x y ( f ) 2 G x x f G y y ( f )
where G x y ( f ) is the cross-spectral density between x and y, and G x x f and G y y ( f ) are the auto-spectral densities of x(t) and y(t), respectively. The cross-spectral density can be calculated as G x y f = X ( f ) Y * ( f ) , where X ( f ) and Y * ( f ) are the Fourier transforms of x(t) and the complex conjugate of y(t). Coherence has been used to efficiently quantify cortical connectivity in EEG signals [40]. EEG coherence indicates the level of synchronization between two brain regions of the same person or the similarity of brain activity in the same region between two different people [40,41]. There is a direct relationship between the coherence index and brain synchronization: a higher coherence value signifies stronger synchronization. Moreover, synchronization in specific EEG frequency bands (e.g., alpha, theta, beta) has been linked to different cognitive processes [42].
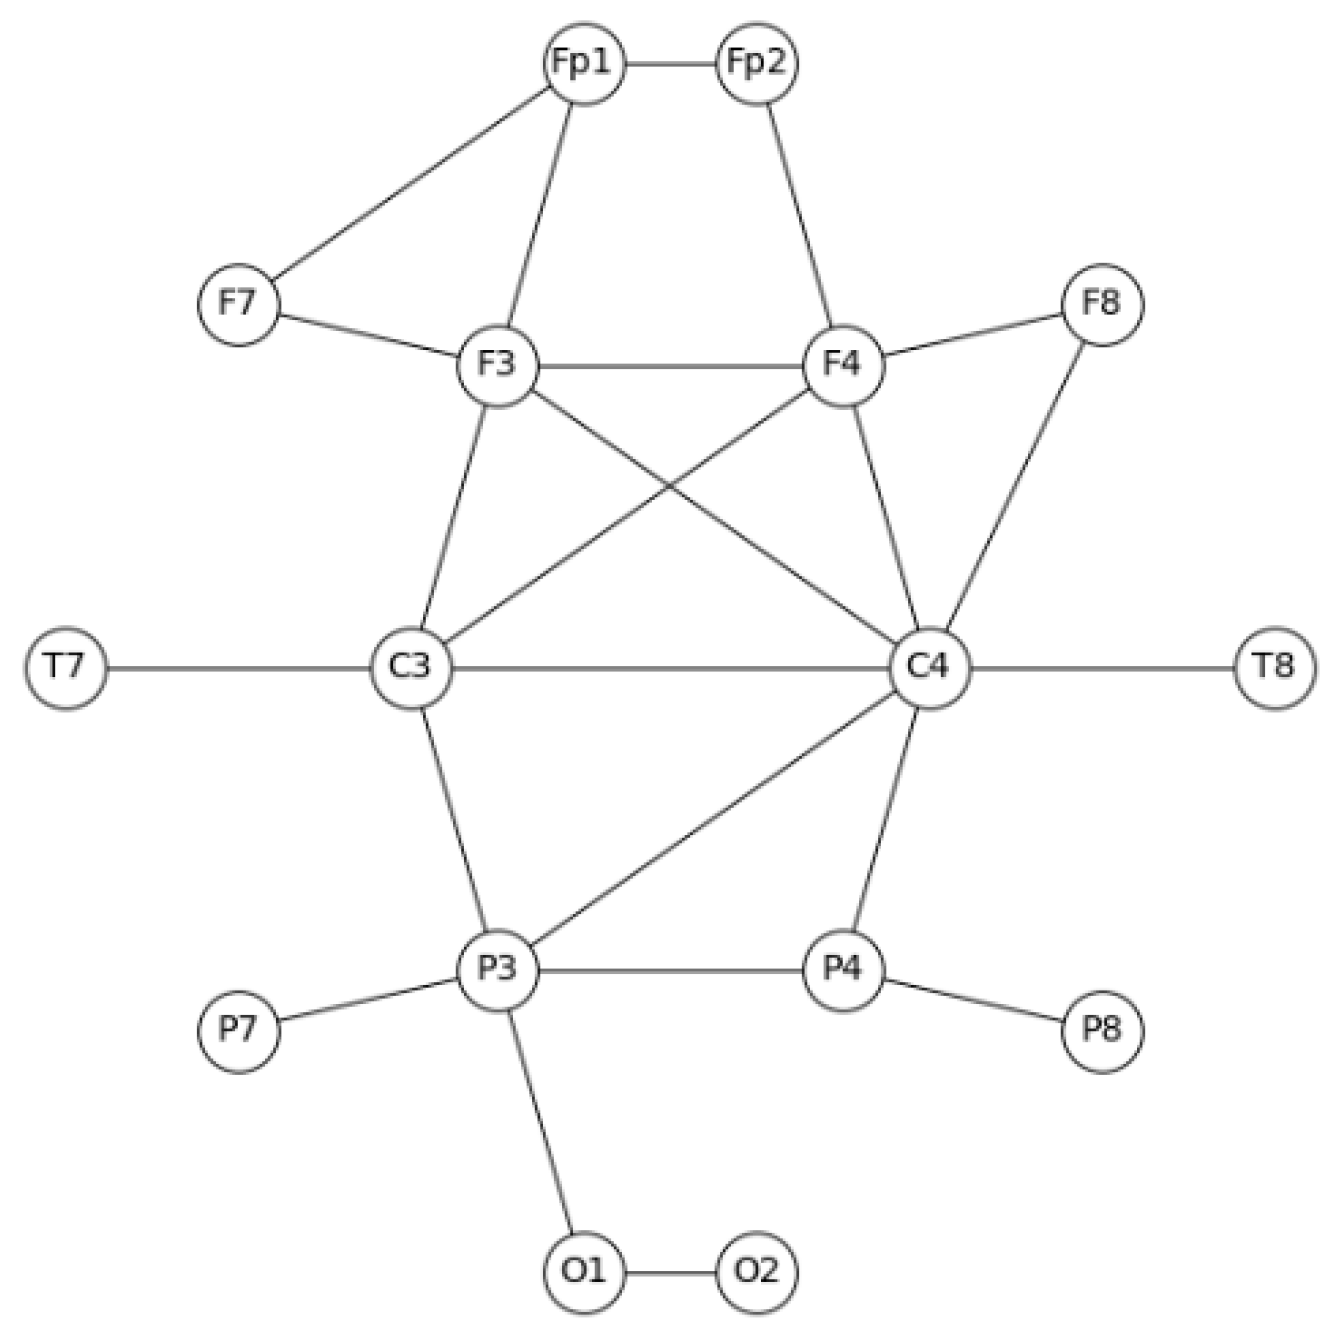
The coherence value ranges from −1 to 1 (0 = no correlation, analogous to a correlation coefficient). For each 2-s decision epoch (1 s before to 1 s after the key-press), we constructed a 16 × 16 coherence graph: nodes are EEG electrodes; edge weights are the corresponding coherence values. Figure 4 shows an example graph in which edges are displayed only when |coherence| > 0.5. Nodes follow the 10–20 system.
We chose the absolute-coherence threshold of 0.5 for three practical reasons: (i) values below ≈ 0.4 are often indistinguishable from noise in short EEG epochs [43]; (ii) a 0.5 cut-off yields a sparse yet fully connected graph, which stabilizes node2vec random-walk statistics and prevents the embedding from over-fitting small, noisy edge weights; and (iii) in a pilot sweep (θ = 0.3–0.7) the downstream XGBoost accuracy peaked near θ = 0.5, indicating that this level balances information retention with model generalizability in our limited sample.
While we used a fixed threshold of 0.5 to binarize the coherence matrices, this choice followed an informal evaluation of values ranging from 0.3 to 0.7 in increments of 0.1. We found that 0.5 offered the most stable and interpretable network properties. However, we recognize that using a static threshold has limitations. Such fixed values can introduce arbitrary cutoffs that may distort the underlying network topology, especially in graphs that are sparse or include a relatively small number of nodes. Although this method is simple, commonly used in studies with similarly sized graphs, and easy to interpret, it does not rest on a formal theoretical foundation. That said, comparative analyses have shown that the fixed threshold method performs robustly across a range of thresholds and yields similar classification power to weighted approaches in distinguishing clinical populations, such as in Alzheimer’s disease [44]. Recent studies have also proposed more rigorous alternatives, such as percolation-based thresholding, which adaptively select thresholds that preserve meaningful topological features across different graph densities. These methods help maintain both global connectivity and local specificity (e.g., [45,46,47]). Looking ahead, future work should consider using such data-driven strategies to more accurately capture the fine-grained modular and functional organization of brain networks, particularly when studying conditions where weaker or local connections are disrupted.

2.4.2. Transforming the Coherence Graph into a Feature Vector

To convert each 16 × 16 coherence graph into a fixed-length vector, we first added a virtual hub node that connects to every electrode with unit-weight edges, following the virtual-node embedding scheme of [32]. This hub keeps the graph connected even after thresholding (|coherence| > 0.5), propagates global context, and stabilizes random-walk statistics—an important consideration with a limited participant pool.
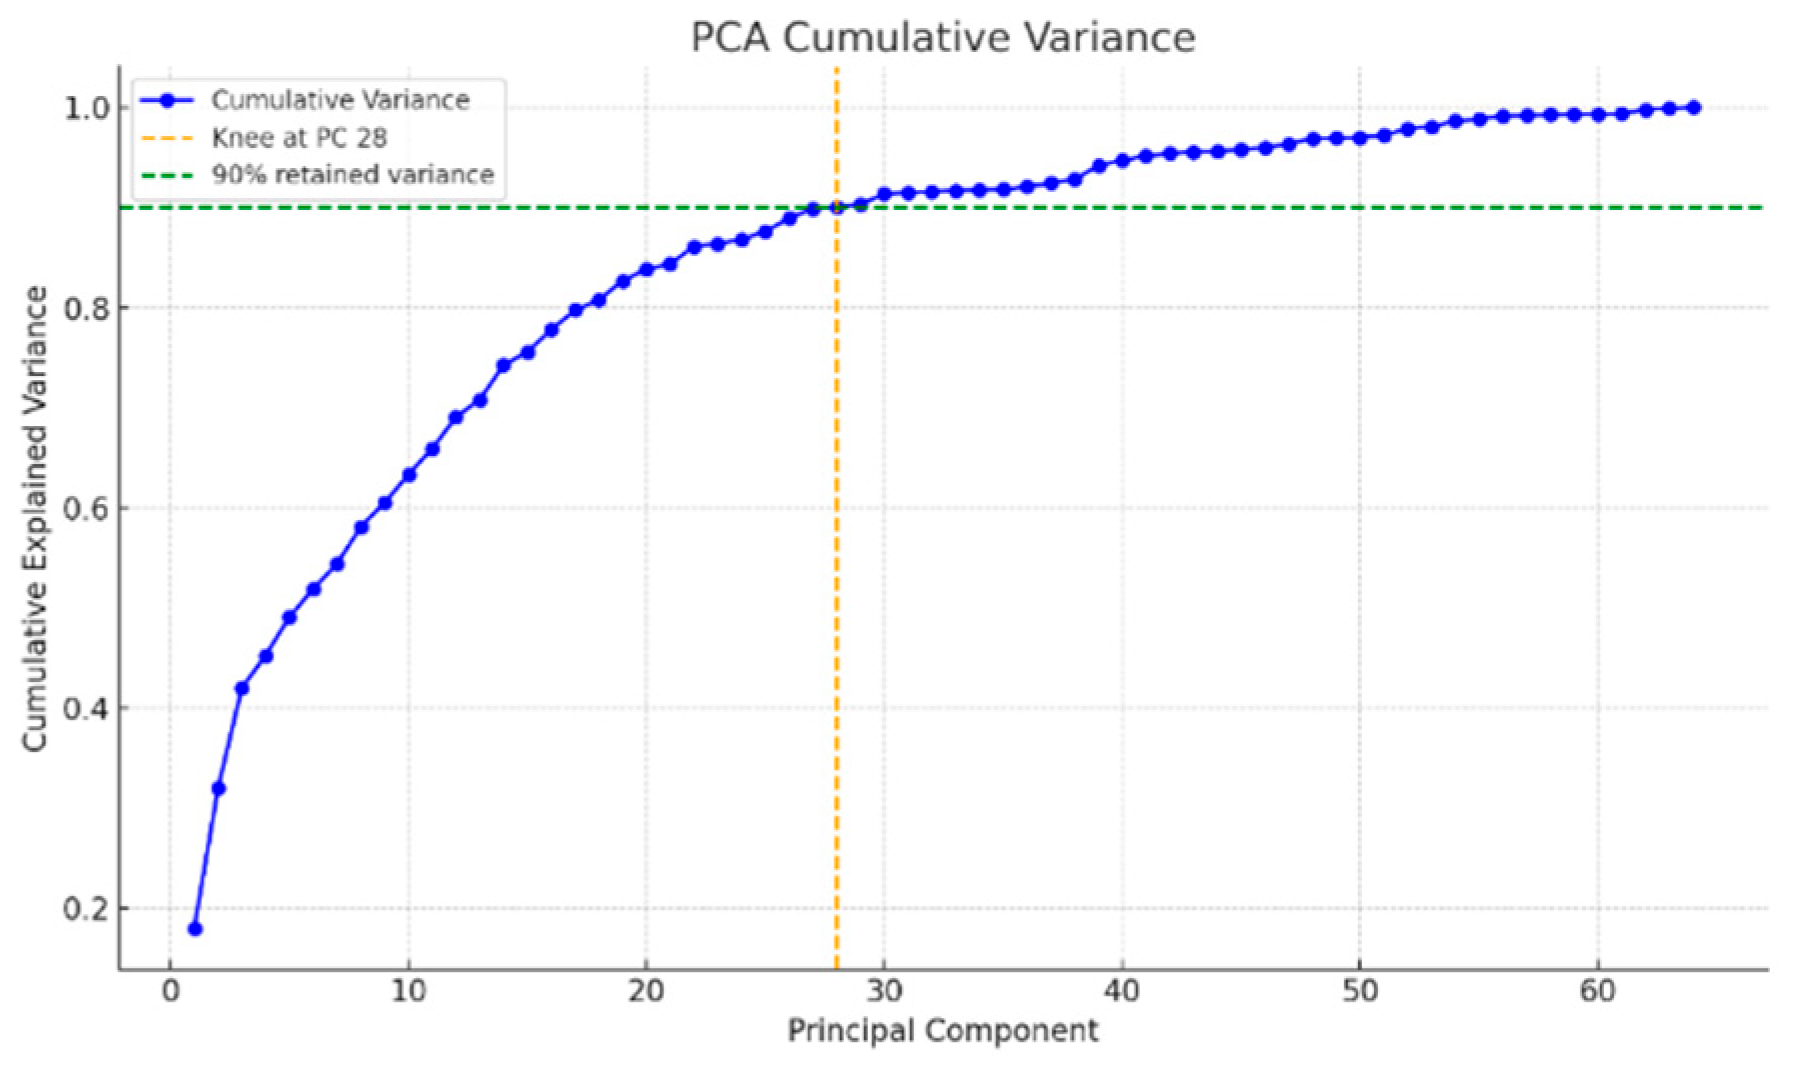
We then embedded the augmented graph using the node2vec algorithm [27]. Guided walks of length 10 (256 walks per node) were generated with hyper-parameters p = 0.5 (local bias) and q = 2 (global bias), values selected in the inner fold of the nested cross-validation (2.4.4). The embedding dimension was set to 64, capturing both fine-scale synchrony and broader network topology mediated by the virtual node (Figure 5). Although 64 dimensions are modest, pilot tests showed that removing noisy or redundant axes improved generalizability. We therefore applied Principal Component Analysis [39] to the 64-D embeddings.
The scree eigenvalue graph (Figure 6) shows a clear knee at component 28; beyond this point, each additional component contributes less than 2% of the cumulative variance. Keeping the first 28 components preserves ≈ 90% of the variance while reducing the risk of overfitting. These 28-element feature vectors are used as input to the XGBoost classifier in Section 2.4.3.

2.4.3. Classification Model (XGBoost)

We employed XGBoost [33] to build an ensemble of gradient-boosted decision trees, chosen for its strong regularization [33,48] and documented success on high-dimensional biomedical data [49,50,51,52]. Built-in L1/L2 penalties limit overfitting [53]; tree pruning, parallelized training, and sparse-aware splits further enhance performance [54].

2.4.4. Model Training and Validation

To obtain an unbiased performance estimate we used nested 5-fold cross-validation at the participant level. This protocol is widely recommended for small-sample neuroimaging studies [55] and guards against optimistic bias [56].
  • Outer loop: In each of five folds, data from ~5–6 participants were held out as the external test set; the remaining participants formed the training set.
  • Inner loop: A second 5-fold split on the training participants tuned XGBoost hyperparameters (learning rate, tree depth, subsample ratio.
Because all six epochs from any participant reside wholly in either the training or the test set, person-level data leakage is eliminated. Testing on each unseen group in turn forces the model to generalize to new individuals—crucial with only 27 subjects. Final metrics are averaged across the five outer folds.
In addition to the XGBoost classifier described above, we also tested support vector machines (SVM) with both linear and non-linear kernels, as well as multivariate linear regression models. These alternative classifiers consistently yielded substantially lower classification performance and were therefore excluded from the final analysis.

3. Results

We can see in Figure 6 a graphical representation of the first three principal components that maintain 42% of the variance.
Figure 7 illustrates the first three principal components, capturing 42% of the variance in our data. This graph shows the distribution of the four attachment styles—Secure, Avoidant, Anxiously Attached, and Fearful Avoidant—across these components. Each point represents an individual’s feature vector reduced to three dimensions, making it easier to see how well our model distinguishes between the different attachment styles. Notably, the Secure group (blue) forms a distinct cluster, reflecting the high accuracy of our model in predicting this style. The Fearful Avoidant group (yellow) also clusters together, indicating our model’s success in identifying this style. However, the Anxiously Attached (green) and Avoidant (red) groups overlap more, demonstrating the model’s challenges in distinguishing between these two attachment styles.
This visualization underscores the value of using principal component analysis to simplify the complexity of EEG coherence data. By focusing on the most significant components, we can more easily identify patterns and relationships within the data. The graph highlights the effectiveness of our approach in capturing the underlying structure of EEG data and points to areas where further refinement is needed, particularly in differentiating between the Anxiously Attached and Avoidant styles.
Table 1 presents the classification results. The model accurately identified Secure and Fearful-avoidant categories with around 80% and 88% accuracy, respectively. However, it found it more challenging to differentiate Avoidant and Anxious categories, with accuracy between 57% and 65%. The most frequent misclassifications were between these two categories: 11 Avoidant instances were incorrectly classified as Anxious, and 16 Anxious instances were classified as Avoidant. Figure 7, which plots the first three principal components, reinforces this point: Avoidant and Anxious observations form a single, largely inseparable cluster in the EEG-coherence space, whereas Secure and Fearful-avoidant remain distinct.
The difficulty in distinguishing between the Avoidant and Anxious categories may stem from how these attachment styles are divided. The ECR-R questionnaire scores between 1 and 7 for avoidance and anxiety. The k-means algorithm then sets thresholds to define attachment styles. For instance, someone with an anxiety score of 3.25 might be classified as Secure, while someone with a score of 3.75 might be classified as Anxious. This arbitrary separation creates challenges for the classification algorithm. Additionally, Avoidant and Anxious categories rely mainly on one dimension—either avoidance or anxiety—whereas Secure and Fearful-avoidant categories consider both dimensions. This likely contributes to the model’s higher accuracy for these latter categories. In light of the overlap observed here—and in keeping with prior work showing that Anxious and Avoidant participants share a similar position on the R_attachment continuum [36]—we judged it methodologically prudent to treat them as a single Insecure category in the present analysis, while still reporting the original four-class results for full transparency.
To further investigate, we developed a new classification model focusing on Secure, Insecure, and Extremely Insecure attachments. Secure attachments exhibit low anxiety and low avoidance, Extremely Insecure attachments show high anxiety and high avoidance, and Insecure attachments have high anxiety or high avoidance, but not both. We trained a new XGBoost model on the same data and parameters to classify these three categories. We grouped the Avoidant and Anxious categories into one Insecure category due to the significant overlap and difficulty in distinguishing between them. Both categories exhibit high emotional dysregulation, manifesting as either high anxiety or high avoidance [57].
We chose to classify Avoidant and Anxious as “Insecure” rather than “Extreme Insecure” because, while both show high emotional dysregulation, they are characterized by high scores in only one dimension (either anxiety or avoidance). “Extreme Insecure” includes those with high scores in both dimensions, making the “Insecure” category more appropriate for those with significant distress in one area.
As shown in Table 2, the new model achieved around 88% overall accuracy, with approximately 93% accuracy for the Insecure group. Our EEG coherence graph technique effectively classified individuals with insecure attachment styles. These results suggest two potential improvements: using a larger dataset and employing a regression model. Our current dataset included 27 participants, with 6 in the Secure category, 7 in Avoidant, 9 in Anxious, and 5 in Fearful-avoidant. A larger, more balanced dataset could improve learning. Alternatively, a regression model predicting exact ECR-R scores for avoidance and anxiety might provide more precise classifications than the traditional four-category approach.

4. Discussion

Attachment style is a key psychological construct that shapes behavior in relationships, work, and other life domains [58,59,60]. In this study, we set out to classify participants’ attachment styles using EEG data recorded during a sequential decision-making task: the secretary problem. Twenty-seven participants, representing the four main attachment categories, completed six task sessions each while EEG data were collected. These signals were segmented into 2-s windows and transformed into coherence graphs representing connectivity across EEG channels. Using Node2Vec, we embedded each graph into a 64-dimensional feature space, then applied Principal Component Analysis (PCA) to reduce these to 28 key components. These features served as input for an XGBoost classifier aimed at predicting attachment style. We also note that alternative models such as SVM and multivariate regression were tested but yielded lower accuracy, supporting our choice of classifier for the main analysis.
The model classified Secure and Fearful-avoidant attachment styles with high accuracy (80% and 88%, respectively), but was less accurate for Anxious and Avoidant styles (57–65%). It reliably identified individuals with either low (Secure) or high (Fearful-avoidant) levels of both anxiety and avoidance. However, it struggled with cases where anxiety and avoidance were asymmetrical, with one being high and the other low. This aligns with prior work noting significant behavioral and emotional overlap between Anxious and Avoidant styles [61]. Both reflect underlying insecurity, though their coping strategies differ markedly.
To address this, we combined Anxious and Avoidant types into a single Insecure category, which improved model accuracy to around 92%. This consolidation is consistent with findings that anxiety and avoidance often co-exist and may reflect a shared emotional core. While Anxious individuals typically seek proximity and reassurance, Avoidant individuals distance themselves emotionally, yet both responses stem from relational insecurity [24,62,63]. This conceptual shift supports growing evidence that attachment should be viewed dimensionally rather than categorically.
Our results also challenge the validity of self-report questionnaires that impose rigid classifications. The fluidity reflected in our EEG-based model suggests that attachment behaviors lie along a continuum. For example, taxometric analyses have shown that anxiety and avoidance vary along continuous gradients [64]. Research using both categorical and dimensional approaches have further demonstrated that insecure attachment patterns often overlap in ways that defy binary labeling [24,65].
Node2Vec generates graph embeddings by simulating biased random walks, which allows it to capture both local and global connectivity patterns across the network [27]. In our context, this property is useful for modeling EEG coherence graphs that may include both short-range synchrony and longer-range inter-regional interactions. We tuned key node2vec parameters, including walk length, number of walks, and return/in-out biases, to better reflect the topology of our small-scale graphs. In addition, we introduced a virtual hub node to preserve full connectivity and prevent walk fragmentation. This strategy is consistent with recent findings showing that embeddings, even in small graphs, can recover informative structural patterns when appropriately configured [66,67,68]. PCA then filtered these representations to retain the most informative features. This contributed to the model’s success in identifying Secure and Fearful-avoidant profiles [69].
Recent studies have demonstrated the effectiveness of graph-based and embedding techniques in brain network research. For example, vector embeddings have been used to map structure-function relationships in connectomes [70], EEG coherence networks have been shown to exhibit modular structure amenable to graph analysis [71], and graph-theoretical features derived from EEG connectivity have been applied to classification tasks involving clinical populations [72].
Despite our model’s success, several limitations remain. The small sample of 27 participants may not fully represent the diversity of attachment styles in the broader population. Although each participant contributed six Secretary Problem rounds (162 coherence graphs in total), external validity is still limited by the number of distinct individuals. The imbalance in participant numbers across attachment styles may also have affected performance, particularly for the Avoidant and Anxious categories, because class sizes were unequal. We mitigated some small sample bias by using participant-level nested 5-fold cross-validation, which prevents data leakage between training and testing. Nevertheless, the results should still be interpreted with caution given the modest cohort. Another limitation is the reliance on discrete attachment groups, which may oversimplify the continuous nature of attachment-related anxiety and avoidance. In addition, although we applied symmetric 1-s pre/post response windows and excluded frequencies above 30 Hz to reduce muscle-related artifacts, we acknowledge that beta-band activity may still partially reflect motor processes. Since all participants performed the same brief button press across all trials, any residual motor contamination is expected to be uniformly distributed and unlikely to bias the results across conditions. Nevertheless, this remains a potential limitation of our approach and should be examined more thoroughly in future studies, for example by varying analysis windows or isolating motor components. Finally, our use of a fixed |coherence| > 0.5 threshold, while empirically justified in short epoch EEG studies, imposes a binary view of functional connectivity and could restrict the model’s sensitivity to subtler network variations.
Our study used the Secretary Problem task to probe how attachment styles shape sequential decision-making. Future research should recruit substantially larger and more evenly balanced cohorts, ideally through multi-site sampling, where two or more independent laboratories or clinics collect data using a harmonized protocol. Such multi-site designs expand the participant pool, broaden the range of demographics and equipment settings represented, and reduce the risk that findings are influenced by site-specific factors [73,74]. Because attachment-related anxiety and avoidance lie on continuous dimensions, upcoming models should move beyond discrete classes and adopt dimensional or multi-label regression that directly predicts each participant’s anxiety and avoidance scores [75,76]. Methodologically, recording high-density EEG (64–128 channels) and applying source localization methods, such as sLORETA or beamforming, can provide finer neuroanatomical precision [77,78], enabling researchers to map coherence patterns to specific cortical generators. Expanding the paradigm to additional real-life decision contexts will further clarify how attachment influences behavior across situations. Finally, integrating objective physiological measures (e.g., EEG-based coherence graphs) with traditional questionnaires may yield hybrid tools that improve the assessment of attachment and inform personalized therapeutic interventions.
Several key takeaways emerged from our work. First, modeling EEG signals as coherence graphs for classification models is feasible. While EEG data collection can be costly and time-consuming, our research showed that even a small dataset could be effective. Second, our findings suggest that graph embedding methods like Node2Vec may help reveal latent topological patterns that contribute to classification. While these embeddings operate in a space that limits direct interpretability, their utility is reflected in the model’s ability to generalize across participants. This generalization was evaluated using participant-level nested cross-validation, where all data from held-out individuals were excluded from training. The classifier’s success in predicting unseen participants’ attachment styles suggests that the embedding captures transferable features of brain connectivity. Future studies could complement this approach with ablation analyses or interpretable, handcrafted features to further clarify the contribution of specific graph components. Third, while Secure and Fearful-avoidant styles were accurately classified, distinguishing between Anxious and Avoidant styles remains challenging due to their overlapping characteristics.
Another important design choice was our use of EEG coherence to construct functional connectivity graphs. Coherence was selected because it captures the statistical coupling between signals from different brain regions, offering a measure of large-scale neural coordination that aligns with our network-level hypothesis. Unlike raw EEG or PCA-reduced time series data, which emphasize variance within individual electrodes, coherence preserves inter-regional relationships that are central to understanding distributed processing. While future work could benchmark raw EEG features, we selected coherence because it supports graph-theoretical modeling and reflects biologically grounded inter-regional connectivity. It has been widely used to study functional brain networks, especially when large-scale coordination is central to the cognitive process [79].
In conclusion, EEG coherence graphs and machine learning can classify attachment styles effectively. By addressing the fluidity within insecure attachment categories [64] and using advanced graph embedding techniques, we can develop better models for understanding human behavior. Even though EEG data collection is complex and resource-intensive, our research suggests that coherence graphs can reveal valuable patterns even in small datasets. Using techniques like Node2Vec and XGBoost helped us classify Secure and Fearful-avoidant styles accurately, though it was challenging to distinguish between Anxious and Avoidant styles due to their overlapping characteristics. XGBoost enhanced the model’s generalizability, particularly by handling variation across EEG signals through its built-in regularization mechanisms [80]. Nonetheless, the model’s difficulties with Anxious and Avoidant cases underscore the complexity of classifying individuals with overlapping emotional and behavioral traits [81].
Although recent large-sample EEG studies have applied deep CNN or graph neural architectures successfully when thousands of trials are available [82,83], the present dataset with 162 coherence graphs from 27 participants favors a lighter pipeline. Node2Vec embeddings coupled with XGBoost strike a practical balance between model capacity and sample size in this context. This method provided detailed insights into the neurophysiological patterns of different attachment behaviors. However, since node2vec is commonly applied to larger graphs, we acknowledge that using this technique on a 16-node network, as in our case, presents certain limitations. Small graphs restrict the diversity of random walk paths and reduce the expressiveness of the resulting embeddings. To address this, we tuned key parameters, including the number and length of walks, as well as the return and in-out biases, to capture as much structural information as possible within the network’s limited topology. We also introduced a virtual hub node to maintain full connectivity and prevent walk fragmentation. This design aligns with recent findings that highlight the importance of walk modeling precision, particularly when sampling space is constrained [84].
Despite its common application in larger graphs, our results indicate that, even in small graphs, node2vec can extract informative structural patterns when parameters are tuned to the graph’s scale. Importantly, our goal was not to identify ‘hubs’, but to preserve and extract broader patterns of functional connectivity. This approach is supported by interpretability frameworks showing that embeddings, even in small graphs, can capture meaningful subgraph structures [Towards Interpretation of Node Embeddings]. In addition, the use of standardized pipelines for evaluating graph construction methods helps ensure reproducibility and methodological rigor in low-resolution settings [85]. Finally, meaningful structural recovery remains feasible even in small or noisy graphs when combined with appropriate constraints and preprocessing [86].
We emphasize that this is a proof-of-concept, demonstrating node2vec’s complementary value alongside traditional graph metrics. We plan to explore alternative approaches in the future, such as spectral methods, simpler graph statistics, or CNNs, particularly in settings where higher node counts or more granular data are available. Future studies should explore attachment behaviors in varied contexts and incorporate broader and more diverse samples to extend the reach and validity of these methods.

Author Contributions

Conceptualization, D.M., I.L. and I.Z.; Methodology, D.M., I.L. and I.Z.; Software, D.M.; Validation, D.M., I.L. and I.Z.; Formal analysis, D.M., I.L. and I.Z.; Investigation, D.M., I.L. and I.Z.; Data curation, D.M., I.L. and I.Z.; Writing—original draft, D.M., I.L. and I.Z.; Writing—review & editing, D.M., I.L. and I.Z.; Visualization, D.M. All authors have read and agreed to the published version of the manuscript.

Funding

This research received no external funding.

Institutional Review Board Statement

The experimental protocols used in this work were evaluated and approved by the Ethics Committee of Ariel University (confirmation number: AU-ENG-IZ-20220404, 4 April 2022). Permission to perform the electrophysiological recordings in the experiment was granted for the period from 4 February 2022, to 4 February 2023. All methods were carried out in accordance with relevant guidelines and regulations.

Informed Consent Statement

Written informed consent was obtained from all subjects and/or their legal guardian(s) involved in the study. It is important to note that no minors were involved in this study.

Data Availability Statement

All the experimental data, which include the players’ electrophysiological recordings and the corresponding secretary problem game logs, are stored on the servers of Ariel University. The data can be obtained by request from The IRB member, Chen Hajaj (chenha@ariel.ac.il) or from one of the authors (Dor Mizrahi—dor.mizrahi1@msmail.ariel.ac.il, Ilan Laufer—ilanl@ariel.ac.il, Inon Zuckerman—inonzu@ariel.ac.il).

Conflicts of Interest

The authors declare no conflict of interest.

References

  1. Bretherton, I. Attachment theory: Retrospect and prospect. Monogr. Soc. Res. Child Dev. 1985, 50, 3–35. [Google Scholar] [CrossRef]
  2. Hazan, C.; Shaver, P. Romantic love conceptualized as an attachment process. J. Personal. Soc. Psychol. 1987, 52, 511. [Google Scholar] [CrossRef]
  3. Fearon, R.P.; Roisman, G.I. Attachment theory: Progress and future directions. Curr. Opin. Psychol. 2017, 15, 131–136. [Google Scholar] [CrossRef]
  4. Mikulincer, M.; Shaver, P.R. Applications of attachment theory and research: The blossoming of relationship science. In Applications of Social Psychology; Routledge: Abingdon, UK, 2020; pp. 187–206. [Google Scholar]
  5. Sutton, T.E. Review of attachment theory: Familial predictors, continuity and change, and intrapersonal and relational outcomes. Marriage Fam. Rev. 2019, 55, 1–22. [Google Scholar] [CrossRef]
  6. Van Petegem, S.; Beyers, W.; Brenning, K.; Vansteenkiste, M. Exploring the association between insecure attachment styles and adolescent autonomy in family decision making: A differentiated approach. J. Youth Adolesc. 2013, 42, 1837–1846. [Google Scholar] [CrossRef]
  7. Bolat, N.; Odacı, H. High school final year students’ career decision-making self-efficacy, attachment styles and gender role orientations. Curr. Psychol. 2017, 36, 252–259. [Google Scholar] [CrossRef]
  8. Deniz, M. An investigation of decision making styles and the five-factor personality traits with respect to attachment styles. Educ. Sci. Theory Pract. 2011, 11, 105–113. [Google Scholar]
  9. Gander, M.; Buchheim, A. Attachment classification, psychophysiology and frontal EEG asymmetry across the lifespan: A review. Front. Hum. Neurosci. 2015, 9, 79. [Google Scholar] [CrossRef]
  10. Ravitz, P.; Maunder, R.; Hunter, J.; Sthankiya, B.; Lancee, W. Adult attachment measures: A 25-year review. J. Psychosom. Res. 2010, 69, 419–432. [Google Scholar] [CrossRef]
  11. Sibley, C.G.; Fischer, R.; Liu, J.H. Reliability and validity of the revised experiences in close relationships (ECR-R) self-report measure of adult romantic attachment. Personal. Soc. Psychol. Bull. 2005, 31, 1524–1536. [Google Scholar] [CrossRef]
  12. Cho, Y.J.; Ryu, J.S.; Seok, J.-H.; Kim, E.; Oh, J.; Kim, B.-H. Machine Learning Prediction of Attachment Type From Bio-Psychological Factors in Patients With Depression. Psychiatry Investig. 2025, 22, 412. [Google Scholar] [CrossRef]
  13. Verbeke, W.J.M.I.; Pozharliev, R.; Strien, J.W.V.; Belschak, F.; Bagozzi, R.P. “I am resting but rest less well with you.” The moderating effect of anxious attachment style on alpha power during EEG resting state in a social context. Front. Hum. Neurosci. 2014, 8, 486. [Google Scholar] [CrossRef]
  14. Sloan, E.P.; Maunder, R.G.; Hunter, J.J.; Moldofsky, H. Insecure attachment is associated with the α-EEG anomaly during sleep. Biopsychosoc. Med. 2007, 1, 20. [Google Scholar] [CrossRef]
  15. Rognoni, E.; Galati, D.; Costa, T.; Crini, M. Relationship between adult attachment patterns, emotional experience and EEG frontal asymmetry. Personal. Individ. Differ. 2008, 44, 909–920. [Google Scholar] [CrossRef]
  16. Zuckerman, I.; Mizrahi, D.; Laufer, I. Attachment style, emotional feedback, and neural processing: Investigating the influence of attachment on the P200 and P400 components of event-related potentials. Front. Hum. Neurosci. 2023, 17, 1249978. [Google Scholar] [CrossRef]
  17. Kuo, C.-C.; Ha, T.; Ebbert, A.M.; Tucker, D.M.; Dishion, T.J. Dynamic Responses in Brain Networks to Social Feedback: A Dual EEG Acquisition Study in Adolescent Couples. Front. Comput. Neurosci. 2017, 11, 46. [Google Scholar] [CrossRef]
  18. Labek, K.; Karch, S.; Taubner, S.; Kessler, H.; Kächele, H.; Cierpka, M.; Roth, G.; Chrobok, A.; Pogarell, O.; Buchheim, A. EPA-1756-EEG activity in the gamma band and late positive potential (LPP) during processing attachment-related stimuli. Eur. Psychiatry 2014, 29, 1. [Google Scholar] [CrossRef]
  19. Dhake, D.; Angal, Y. A Comparative Analysis of EEG-based Stress Detection Utilizing Machine Learning and Deep Learning Classifiers with a Critical Literature Review. Int. J. Recent Innov. Trends Comput. Commun. 2023, 11, 61–73. [Google Scholar] [CrossRef]
  20. Xu, Y.; Xu, X.; Deng, L. EEG research based on the influence of different music effects. J. Phys. Conf. Ser. 2020, 1631, 012147. [Google Scholar] [CrossRef]
  21. Mizrahi, D.; Zuckerman, I.; Laufer, I. Exploring Cognitive Load in the Secretary Problem Using EEG Signals. In Proceedings of the Intelligent Systems Conference, Amsterdam, The Netherlands, 5–6 September 2024; Springer Nature: Cham, Switzerland, 2024; pp. 664–674. [Google Scholar]
  22. Mizrahi, D.; Laufer, I.; Zuckerman, I. Neurophysiological insights into sequential decision-making: Exploring the secretary problem through ERPs and TBR dynamics. BMC Psychol. 2024, 12, 245. [Google Scholar] [CrossRef]
  23. Seale, D.A.; Rapoport, A. Sequential decision making with relative ranks: An experimental investigation of the “secretary problem”. Organ. Behav. Hum. Decis. Process. 1997, 69, 221–236. [Google Scholar] [CrossRef]
  24. Mikulincer, M.; Shaver, P.R. Attachment in Adulthood: Structure, Dynamics, and Change; Guilford Publications: New York, NY, USA, 2010. [Google Scholar]
  25. Vrtička, P.; Andersson, F.; Grandjean, D.; Sander, D.; Vuilleumier, P. Individual attachment style modulates human amygdala and striatum activation during social appraisal. PLoS ONE 2008, 3, e2868. [Google Scholar] [CrossRef]
  26. Finn, E.S.; Shen, X.; Scheinost, D.; Rosenberg, M.D.; Huang, J.; Chun, M.M.; Papademetris, X.; Constable, R.T. Functional connectome fingerprinting: Identifying individuals using patterns of brain connectivity. Nat. Neurosci. 2015, 18, 1664–1671. [Google Scholar] [CrossRef]
  27. Grover, A.; Leskovec, J. node2vec: Scalable feature learning for networks. In Proceedings of the 22nd ACM SIGKDD International Conference on Knowledge Discovery and Data Mining, San Francisco, CA, USA, 13–17 August 2016. [Google Scholar]
  28. Li, S.; Zaidi, N.A.; Du, M.; Zhou, Z.; Zhang, H.; Li, G. Property graph representation learning for node classification. Knowl. Inf. Syst. 2024, 66, 237–265. [Google Scholar] [CrossRef]
  29. Freeman, P.R. The secretary problem and its extensions: A review. Int. Stat. Rev. Int. Stat. 1983, 51, 189–206. [Google Scholar] [CrossRef]
  30. Quiroz, G.; Espinoza-Valdez, A.; Salido-Ruiz, R.A.; Mercado, L. Coherence analysis of EEG in locomotion using graphs. Rev. Mex. Ing. Biomédica 2017, 38, 235–246. [Google Scholar] [CrossRef]
  31. Zuckerman, I.; Mizrahi, D.; Laufer, I. EEG Pattern Classification of Picking and Coordination Using Anonymous Random Walks. Algorithms 2022, 15, 114. [Google Scholar] [CrossRef]
  32. Li, Y.; Tarlow, D.; Brockschmidt, M.; Zemel, R. Gated Graph Sequence Neural Networks. In Proceedings of the International Conference on Learning Representations, San Juan, Puerto Rico, 2–4 May 2016. [Google Scholar]
  33. Chen, T.; Guestrin, C. Xgboost: A scalable tree boosting system. In Proceedings of the 22nd ACM SIGKDD International Conference on Knowledge Discovery and Data Mining, San Francisco, CA, USA, 13–17 August 2016; pp. 785–794. [Google Scholar]
  34. Xu, R.; Wunsch, D. Survey of clustering algorithms. IEEE Trans. Neural Netw. 2005, 16, 645–678. [Google Scholar] [CrossRef]
  35. Waters, E.; Merrick, S.; Treboux, D.; Crowell, J.; Albersheim, L. Attachment security in infancy and early adulthood: A twenty-year longitudinal study. Child Dev. 2000, 71, 684–689. [Google Scholar] [CrossRef]
  36. Laufer, I.; Mizrahi, D.; Zuckerman, I. Enhancing EEG-Based Attachment Style Prediction: Unveiling the Impact of Feature Domains. Front. Psychol. 2024, 15, 1326791. [Google Scholar] [CrossRef]
  37. Hsiao, Y.-C.; Kemp, S. The effect of incentive structure on search in the secretary problem. Judgm. Decis. Mak. 2020, 15, 182–192. [Google Scholar] [CrossRef]
  38. Delorme, A.; Makeig, S. EEGLAB: An open source toolbox for analysis of single-trial EEG dynamics including independent component analysis. J. Neurosci. Methods 2004, 134, 9–21. [Google Scholar] [CrossRef]
  39. Jolliffe, I.T.; Cadima, J. Principal component analysis: A review and recent developments. Philos. Trans. R. Soc. A Math. Phys. Eng. Sci. 2016, 374, 20150202. [Google Scholar] [CrossRef] [PubMed]
  40. Murias, M.; Webb, S.J.; Greenson, J.; Dawson, G. Resting state cortical connectivity reflected in EEG coherence in individuals with autism. Biol. Psychiatry 2007, 62, 270–273. [Google Scholar] [CrossRef]
  41. Basharpoor, S.; Heidar, F.; Molavi, P. EEG coherence in theta, alpha, and beta bands in frontal regions and executive functions. Appl. Neuropsychol. Adult 2021, 28, 310–317. [Google Scholar] [CrossRef]
  42. Rippon, G.; Brock, J.; Brown, C.; Boucher, J. Disordered connectivity in the autistic brain: Challenges for the ‘new psychophysiology’. Int. J. Psychophysiol. 2007, 63, 164–172. [Google Scholar] [CrossRef]
  43. Bocci, T.; Moretto, C.; Tognazzi, S.; Briscese, L.; Naraci, M.; Leocani, L.; Mosca, F.; Ferrari, M.; Sartucci, F. How does a surgeon’s brain buzz? An EEG coherence study on the interaction between humans and robot. Behav. Brain Funct. 2013, 9, 14. [Google Scholar] [CrossRef]
  44. Ahmadi, H.; Fatemizadeh, E.; Nasrabadi, A.M. A comparative study of the effect of weighted or binary functional brain networks in fMRI data analysis. Front. Biomed. Technol. 2020, 7. [Google Scholar] [CrossRef]
  45. Nicolini, C.; Bordier, C.; Bifone, A. Community detection in weighted brain connectivity networks beyond the resolution limit. Neuroimage 2017, 146, 28–39. [Google Scholar] [CrossRef]
  46. Bardella, G.; Pani, P.; Brunamonti, E.; Giarrocco, F.; Ferraina, S. The small scale functional topology of movement control: Hierarchical organization of local activity anticipates movement generation in the premotor cortex of primates. Neuroimage 2020, 207, 116354. [Google Scholar] [CrossRef]
  47. Bardella, G.; Giuffrida, V.; Giarrocco, F.; Brunamonti, E.; Pani, P.; Ferraina, S. Response inhibition in premotor cortex corresponds to a complex reshuffle of the mesoscopic information network. Netw. Neurosci. 2024, 8, 597–622. [Google Scholar] [CrossRef]
  48. Wang, F.; Tian, Y.-C.; Zhang, X.; Hu, F. An ensemble of Xgboost models for detecting disorders of consciousness in brain injuries through EEG connectivity. Expert Syst. Appl. 2022, 198, 116778. [Google Scholar] [CrossRef]
  49. Elgart, M.; Lyons, G.; Romero-Brufau, S.; Kurniansyah, N.; Brody, J.A.; Guo, X.; Lin, H.J.; Raffield, L.; Gao, Y.; Chen, H.; et al. Non-linear machine learning models incorporating SNPs and PRS improve polygenic prediction in diverse human populations. Commun. Biol. 2022, 5, 256. [Google Scholar] [CrossRef]
  50. Tiwari, A.; Chaturvedi, A. A multiclass EEG signal classification model using spatial feature extraction and XGBoost algorithm. In Proceedings of the IEEE/RSJ International Conference on Intelligent Robots and Systems (IROS), Macau, China, 4–8 November 2019. [Google Scholar]
  51. Deng, X.; Li, M.; Deng, S.; Wang, L. Hybrid gene selection approach using XGBoost and multi-objective genetic algorithm for cancer classification. Med. Biol. Eng. Comput. 2022, 60, 663–681. [Google Scholar] [CrossRef]
  52. Lundberg, S.M.; Erion, G.; Chen, H.; DeGrave, A.; Prutkin, J.M.; Nair, B.; Katz, R.; Himmelfarb, J.; Bansal, N.; Lee, S.-I. Explainable AI for trees: From local explanations to global understanding. arXiv 2019, arXiv:1905.04610. [Google Scholar] [CrossRef]
  53. Zhai, W.; Wang, Y. Lasso Ridge based XGBoost and Deep_LSTM Help Tennis Players Perform better. arXiv 2024, arXiv:2405.07030. [Google Scholar] [CrossRef]
  54. Mitchell, R.; Frank, E. Accelerating the XGBoost algorithm using GPU computing. PeerJ Comput. Sci. 2017, 3, e127. [Google Scholar] [CrossRef]
  55. Varma, S.; Simon, R. Bias in error estimation when using cross-validation for model selection. BMC Bioinform. 2006, 7, 91. [Google Scholar] [CrossRef]
  56. Cawley, G.C.; Talbot, N.L. On over-fitting in model selection and subsequent selection bias in performance evaluation. J. Mach. Learn. Res. 2010, 11, 2079–2107. [Google Scholar]
  57. Bartholomew, K.; Horowitz, L.M. Attachment styles among young adults: A test of a four-category model. J. Personal. Soc. Psychol. 1991, 61, 226. [Google Scholar] [CrossRef] [PubMed]
  58. Sweet, J. The Association Between Attachment Style and Decision Making Style. Honors Thesis, Union College, Schenectady, NY, USA, 2021. [Google Scholar]
  59. Blalock, D.V.; Franzese, A.T.; Machell, K.A.; Strauman, T.J. Attachment style and self-regulation: How our patterns in relationships reflect broader motivational styles. Personal. Individ. Differ. 2015, 87, 90–98. [Google Scholar] [CrossRef]
  60. Harms, P.D. Adult attachment styles in the workplace. Hum. Resour. Manag. Rev. 2011, 21, 285–296. [Google Scholar] [CrossRef]
  61. Mikulincer, M.; Orbach, I. Attachment styles and repressive defensiveness: The accessibility and architecture of affective memories. J. Personal. Soc. Psychol. 1995, 68, 917. [Google Scholar] [CrossRef]
  62. Fraley, R.C.; Waller, N.G.; Brennan, K.A. An item response theory analysis of self-report measures of adult attachment. J. Personal. Soc. Psychol. 2000, 78, 350. [Google Scholar] [CrossRef]
  63. Brennan, K.A.; Clark, C.L.; Shaver, P.R. Self-report measurement of adult attachment: An integrative overview. Attach. Theory Close Relatsh. 1998, 46, 70–100. [Google Scholar]
  64. Fraley, R.C.; Hudson, N.W.; Heffernan, M.E.; Segal, N. Are adult attachment styles categorical or dimensional? A taxometric analysis of general and relationship-specific attachment orientations. J. Personal. Soc. Psychol. 2015, 109, 354. [Google Scholar] [CrossRef]
  65. Levy, K.N.; Blatt, S.J.; Shaver, P.R. Attachment styles and parental representations. J. Personal. Soc. Psychol. 1998, 74, 407. [Google Scholar] [CrossRef]
  66. Hacker, C.; Rieck, B. On the surprising behaviour of node2vec. arXiv 2022, arXiv:2206.08252. [Google Scholar] [CrossRef]
  67. Dalmia, A.; Gupta, M. Towards interpretation of node embeddings. In Proceedings of the Companion Proceedings of the The Web Conference 2018, Lyon, France, 23–27 April 2018; pp. 945–952.
  68. Knežević, D.; Babić, J.; Savić, M.; Radovanović, M. Evaluation of LID-aware graph embedding methods for node clustering. In Proceedings of the International Conference on Similarity Search and Applications, Bologna, Italy, 5–7 October 2022; Springer International Publishing: Cham, Switzerland, 2022; pp. 222–233. [Google Scholar]
  69. Gan, A.; Gong, A.; Ding, P.; Yuan, X.; Chen, M.; Fu, Y.; Cheng, Y. Computer-aided diagnosis of schizophrenia based on node2vec and Transformer. J. Neurosci. Methods 2023, 389, 109824. [Google Scholar] [CrossRef]
  70. Rosenthal, G.; Váša, F.; Griffa, A.; Hagmann, P.; Amico, E.; Goñi, J.; Avidan, G.; Sporns, O. Mapping higher-order relations between brain structure and function with embedded vector representations of connectomes. Nat. Commun. 2018, 9, 2178. [Google Scholar] [CrossRef]
  71. Cattai, T.; Caporali, C.; Corsi, M.-C.; Colonnese, S. Introducing the modularity graph: An application to brain functional networks. In Proceedings of the 2024 32nd European Signal Processing Conference (EUSIPCO), Lyon, France, 26–30 August 2024; IEEE: New York, NY, USA, 2024; pp. 1611–1615. [Google Scholar]
  72. Kim, J.-G.; Kim, H.; Hwang, J.; Kang, S.H.; Lee, C.-N.; Woo, J.; Kim, C.; Han, K.; Kim, J.B.; Park, K.-W. Differentiating amnestic from non-amnestic mild cognitive impairment subtypes using graph theoretical measures of electroencephalography. Sci. Rep. 2022, 12, 6219. [Google Scholar] [CrossRef]
  73. Paap, K.R.; Anders-Jefferson, R.T.; Balakrishnan, N.; Majoubi, J.B. The many foibles of Likert scales challenge claims that self-report measures of self-control are better than performance-based measures. Behav. Res. Methods 2024, 56, 908–933. [Google Scholar] [CrossRef]
  74. McBride, C.; Atkinson, L.; Quilty, L.C.; Bagby, R.M. Attachment as moderator of treatment outcome in major depression: A randomized control trial of interpersonal psychotherapy versus cognitive behavior therapy. J. Consult. Clin. Psychol. 2006, 74, 1041. [Google Scholar] [CrossRef]
  75. Fraley, R.C.; Waller, N.G. Adult attachment patterns: A test of the typological model. In Attachment Theory and Close Relationships; The Guilford Press: New York, NY, USA, 1998; pp. 77–114. [Google Scholar]
  76. Gillath, O.; Karantzas, G. Attachment security priming: A systematic review. Curr. Opin. Psychol. 2019, 25, 86–98. [Google Scholar] [CrossRef]
  77. Pascual-Marqui, R.D. Standardized low-resolution brain electromagnetic tomography (sLORETA): Technical details. Methods Find. Exp. Clin. Pharmacol. 2002, 24, 5–12. [Google Scholar]
  78. Van Veen, B.; van Drongelen, W.; Yuchtman, M.; Suzuki, A. Localization of brain electrical activity via linearly constrained minimum variance spatial filtering. IEEE Trans. Biomed. Eng. 1997, 44, 867–880. [Google Scholar] [CrossRef]
  79. Decker, S.; Fillmore, P.T.; Roberts, A. Coherence: The measurement and application of brain connectivity. NeuroRegulation 2017, 4, 3. [Google Scholar] [CrossRef]
  80. Suresh, G.V.; Reddy, S. Uncertain data analysis with regularized XGBoost. Webology 2022, 19, 3722–3740. [Google Scholar] [CrossRef]
  81. Dark-Freudeman, A.; Pond, R.S.J.; Paschall, R.E.; Greskovich, L. Attachment style in adulthood: Attachment style moderates the impact of social support on depressive symptoms. J. Soc. Pers. Relatsh. 2020, 37, 2871–2889. [Google Scholar] [CrossRef]
  82. Rasool, A.; Aslam, S.; Xu, Y.; Wang, Y.; Pan, Y.; Chen, W. Deep neurocomputational fusion for ASD diagnosis using multi-domain EEG analysis. Neurocomputing 2025, 641, 130353. [Google Scholar] [CrossRef]
  83. Bunterngchit, C.; Wang, J.; Su, J.; Wang, Y.; Liu, S.; Hou, Z.-G. Temporal attention fusion network with custom loss function for EEG–fNIRS classification. J. Neural Eng. 2024, 21, 066016. [Google Scholar] [CrossRef]
  84. Liu, R.; Hirn, M.; Krishnan, A. Accurately modeling biased random walks on weighted networks using node2vec+. Bioinformatics 2023, 39, btad047. [Google Scholar] [CrossRef]
  85. Zhao, W.; Zhou, D.; Qiu, X.; Jiang, W. A pipeline for fair comparison of graph neural networks in node classification tasks. arXiv 2020, arXiv:2012.10619. [Google Scholar] [CrossRef]
  86. Zhang, Y.; Tang, M. Exact recovery of community structures using DeepWalk and node2vec. arXiv 2021, arXiv:2101.07354. [Google Scholar]
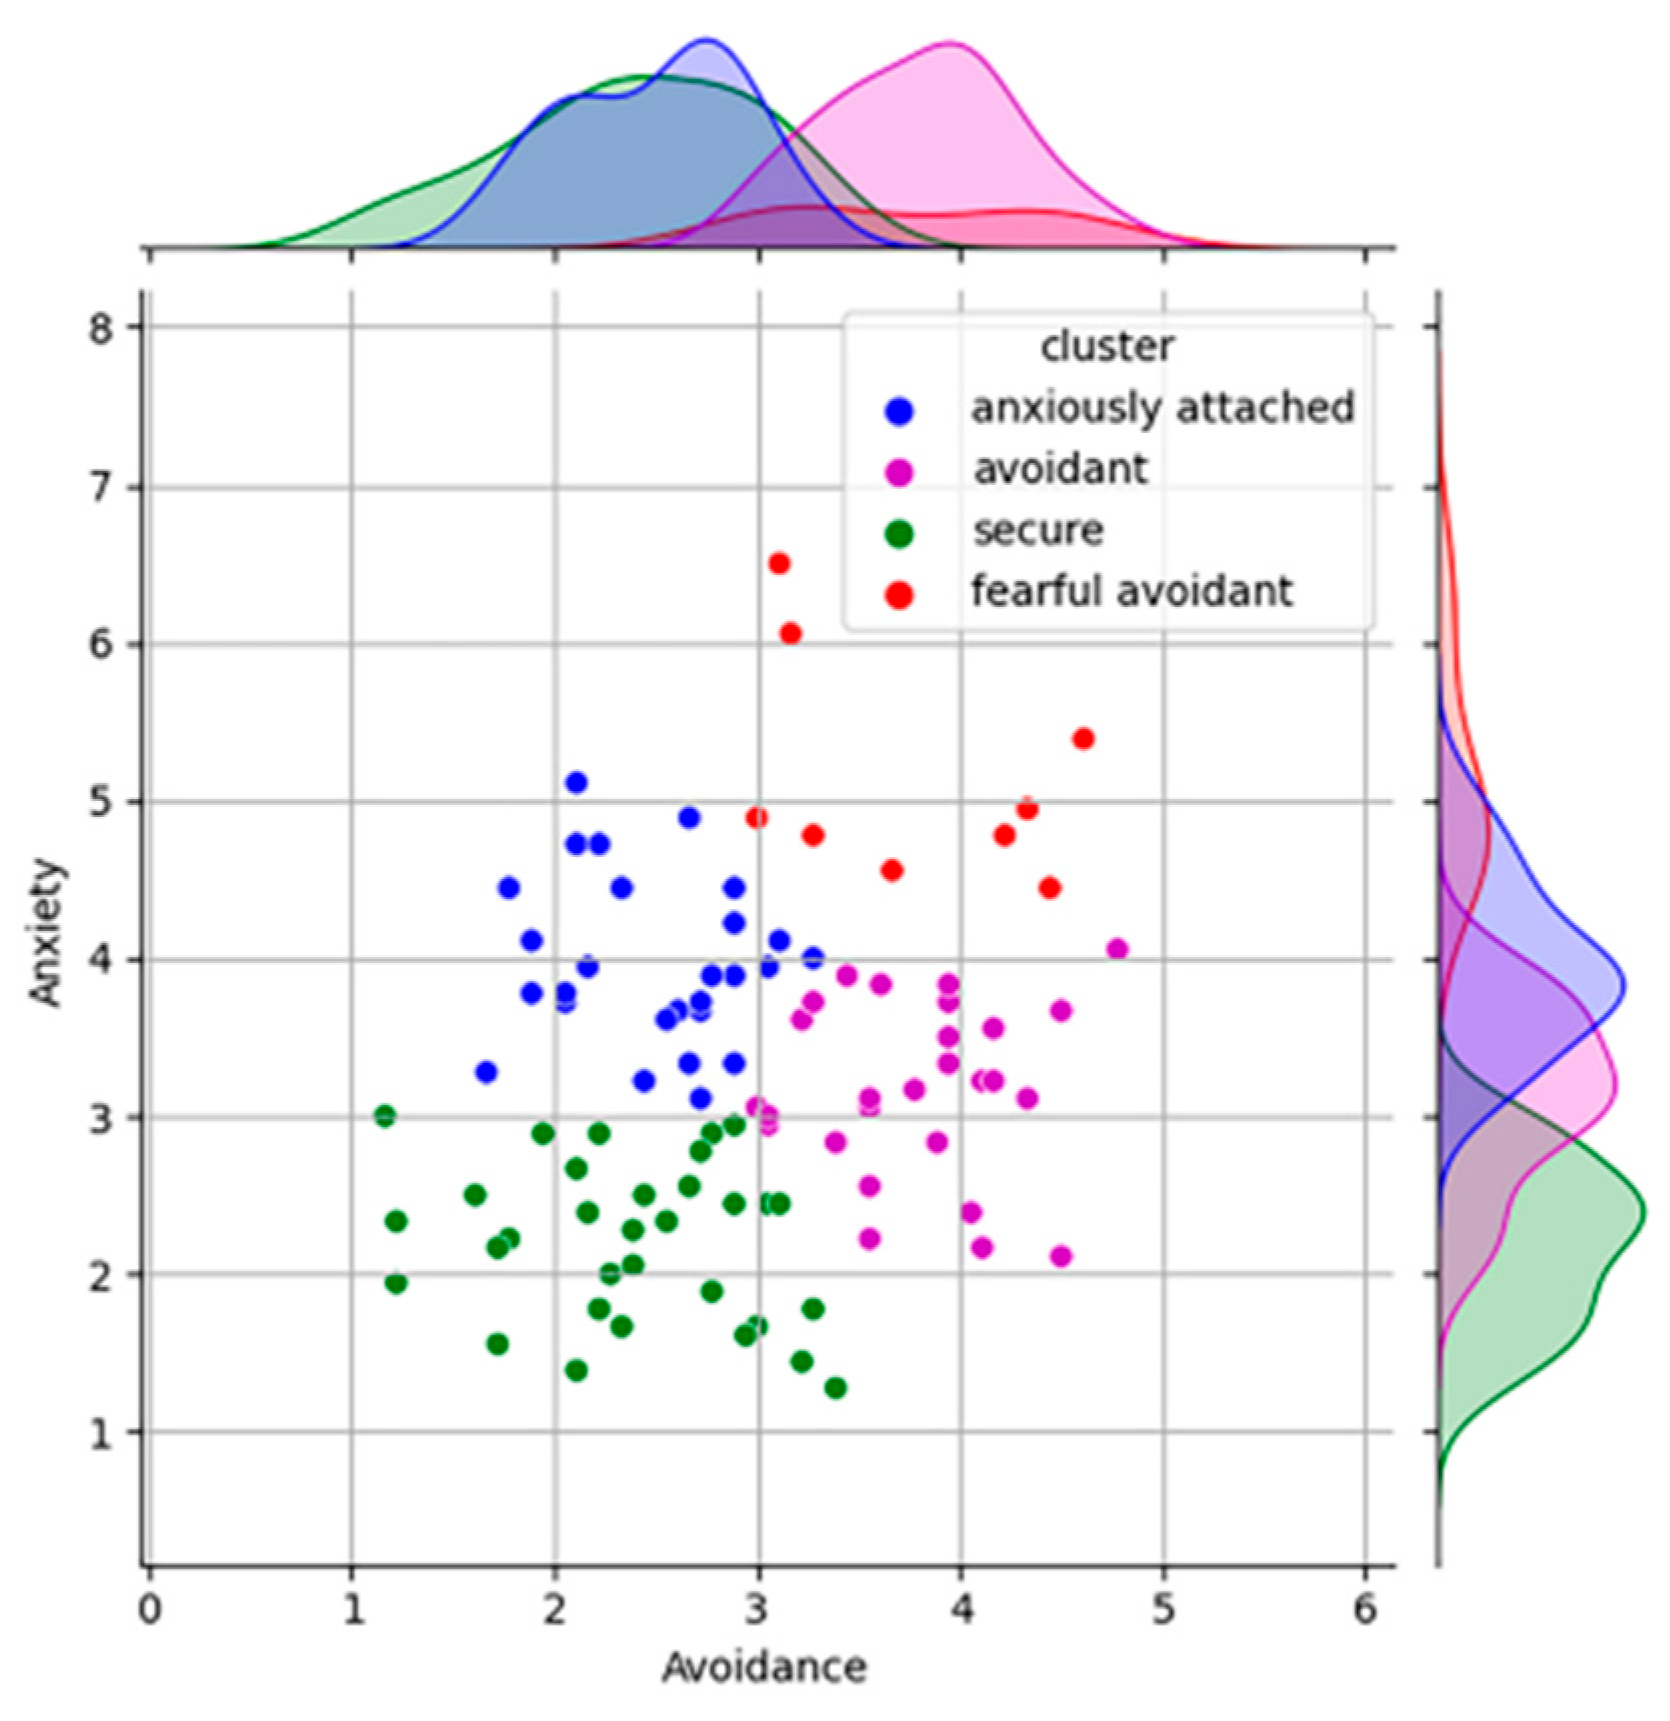
Figure 1. Grouped attachment outcomes based on the ECR-R questionnaire [36].
Applsci 15 09009 g001
Figure 2. The sample of individuals who participated in the 2nd stage of the experiment, the EEG session.
Applsci 15 09009 g002
Figure 3. The structure of one secretary game block.
Applsci 15 09009 g003
Figure 4. Example coherence graph for one 2-s decision epoch (edges discretized on a 0.5 threshold).
Applsci 15 09009 g004
Figure 5. Coherence graph with virtual hub node (red dashed edges) prior to node2vec embedding.
Applsci 15 09009 g005
Figure 6. PCA scree plot for the 64-D node2vec embeddings.
Applsci 15 09009 g006
Figure 7. Graphic representation of the first three Principal components.
Applsci 15 09009 g007
Table 1. Results of 4-class classification.
Predicted
SecureAvoidantAnxiousFearful AvoidantRecall
RealSecure2934080.55%
Avoidant22811153.70%
Anxious51631257.41%
Fearful avoidant0212288.00%
Precision80.55%57.14%65.95%88.00%Accuracy
68%
Table 2. Classification results on 3 attachment classes.
Predicted
SecureInsecureExtreme InsecureRecall
RealSecure324088.88%
Insecure589292.71%
Extreme Insecure032288.00%
Precision86.49%92.71%91.66%Accuracy
88.27%
Disclaimer/Publisher’s Note: The statements, opinions and data contained in all publications are solely those of the individual author(s) and contributor(s) and not of MDPI and/or the editor(s). MDPI and/or the editor(s) disclaim responsibility for any injury to people or property resulting from any ideas, methods, instructions or products referred to in the content.