Article

Measuring the Circularity of Bio-Based Fertilizers: Applying the BIORADAR Product Circularity Monitoring Framework

by
Hasler Iglesias
1,2,*,
Ana Paredes Ortiz
1,
Ángeles Pereira
3,
David Fernández-Gutiérrez
1 and
Andrés J. Lara-Guillén
1,*
1
Centro Tecnológico de la Energía y el Medio Ambiente (CETENMA), 30353 Cartagena, Spain
2
Facultade de Ciencias Económicas e Empresariais, Universidade de Santiago de Compostela, 15782 Santiago de Compostela, Spain
3
Grupo ICEDE, Departamento de Economía Aplicada, Universidade de Santiago de Compostela, 15782 Santiago de Compostela, Spain
*
Authors to whom correspondence should be addressed.
Appl. Sci. 2025, 15(14), 7701; https://doi.org/10.3390/app15147701
Submission received: 27 May 2025 / Revised: 4 July 2025 / Accepted: 7 July 2025 / Published: 9 July 2025
(This article belongs to the Special Issue Waste Valorization, Green Technologies and Circular Economy)

Abstract

Featured Application

A product circularity monitoring framework designed for bio-based fertilizers is applied to five products, being proposed as a managerial tool within product management and eco-design processes of eco-innovative firms.

Abstract

The transition to the circular economy (CE) is one of the EU’s current strategic policies to improve its competitiveness and sustainability. While the EU has developed a framework for monitoring overall progress toward the CE, there are gaps in monitoring specific priority sectors, such as the bioeconomy. In order to support industry and policymakers in this sector, this paper presents the application of the BIORADAR’s product circularity monitoring framework to five bio-based fertilizers. The framework is composed of two publicly available indicators: the circular index and the circularity indicator of nutrient; and two new indicator proposals: the biodegradable content and the nutrient slow-release index. Making use of life cycle inventories and supplementary data from the scientific literature, these four indicators were calculated for algae biomass, compost, feather meal, spent mushroom substrate, and wood vinegar. The framework proved to be useful for measuring the circularity at the product level for bio-based fertilizers, especially shedding light on the virgin non-renewable materials consumption, waste generation, biodegradability, nutrient recovery process efficiency, and nutrient release speed. It constitutes the first approach to measuring circularity tailored to bio-based fertilizer. By incorporating it into eco-design, innovation, and managerial decision-making processes, key stakeholders can rely on guiding metrics to support their transition toward higher circularity levels.

1. Introduction

The very same chemicals that helped overcome famine, malnutrition, and food insecurity in vast regions of our planet may now be contributing to large-scale environmental degradation. Synthetic fertilizers were an agricultural game changer, but they have come with a price: 5% of global greenhouse gas emissions are attributable to their production and use, and the nutrient runoff from them poses significant environmental risks [1].
Amid the global quest toward a more sustainable way of conducting human activities, two concepts have emerged as potential solutions to that predicament: the bioeconomy and the circular economy.
The bioeconomy has been defined by the European Commission as a model that “encompasses the production of renewable biological resources and their conversion into food, feed, bio-based products and bioenergy” [2]. Likewise, they have also defined the circular economy (CE) as a model “where the value of products, materials and resources is maintained in the economy for as long as possible, and the generation of waste minimized” [3].
In relation to these two concepts emerges a third one: the circular bioeconomy (CBE). Although discrepancies among the scientific community have arisen regarding the intertwining of these three ideas [4], an integrating definition for the CBE has been proposed by Stegmann et al. [4]:
the circular bioeconomy focuses on the sustainable, resource-efficient valorization of biomass in integrated, multi-output production chains (e.g., biorefineries) while also making use of residues and wastes and optimizing the value of biomass over time via cascading (…).
Taking the CBE as an overarching concept, it has become a framework within which solutions for the challenge of sustainable fertilization can be explored, specifically considering the production of bio-based fertilizers from waste flows. Not only does it contribute to sustainability challenges but also to the EU’s competitiveness endeavors. A testament to this is the mentions of the Draghi report [5] about circularity as part of the second priority of his proposal for the competitiveness of Europe. Draghi affirms that Europe needs to capture the “industrial opportunities presented by the green transition” by, among others, “leveraging the opportunities from circularity”. The Competitiveness Compass for the EU [3] also sets a business case for clean production that revolves around circularity, in which “the EU needs to develop lead markets and policies to reward early movers”. And more recently, the EU’s Clean Industrial Deal [6] is putting CE at the forefront of the monumental shift toward competitiveness and decarbonization.
The European bioeconomy generated a turnover of 2.2 EUR trillion in 2014, having increased by nearly 140 EUR billion between 2008 and 2014 [7]. Likewise, the EU’s circular market has been projected to grow by 223% between 2022 and 2030 (from EUR 31 billion to 100 billion), creating around 500,000 new jobs [8]. To untap this potential, the European Commission has set the goal of approving a Circular Economy Act, expected to create a “single market for waste, secondary and reusable materials” by the end of 2026 [3].
At the epicenter of the EU’s circular bioeconomy momentum are bio-based fertilizers. In fact, agriculture accounted for 51% of the total bioeconomy labor force in Europe in 2014 and experienced a 17% increase in turnover between 2008 and 2014 [7]. It is also in the EU’s interests to reduce the dependency on foreign suppliers of agricultural commodities. This can be achieved by lowering fertilizer imports and improving self-sufficiency through the CBE of bio-based fertilizers [9].
Specifically regarding bio-based fertilizers, nitrogen and phosphorus recovery from sewage sludge, agricultural, and food waste has been identified as a key lever for CE [10]. This is due not only to their contribution to reducing material losses and leakages but also to their role as soil improvers, helping to restore and maintain degraded soils, as noted by Breure et al. [11]. These authors also highlighted that land is a key provider of environmental services, such as provisioning of both mineral and bio-based resources. Therefore, the role of bio-based fertilizers in the CE is twofold: nutrient recovery and soil stewardship.
From a market perspective, there are high expectations for sustained growth in the bio-based fertilizer sector. This is mainly driven by the rising demand for “bio” products, which continues to stimulate the need for suitable fertilizers; the increasing cost of extracting mineral fertilizing agents (e.g., phosphate rock); and the potential to combine bio-based fertilizer production with energy recovery [12].
Nevertheless, to ensure an appropriate and successful transition to the CBE in the bio-based fertilizers sector, as in any managerial transition, measuring key variables is paramount. The setting of such targets for the EU and for priority sectors must be supported by an appropriate system of indicators. They are necessary to measure progress in achieving such targets and the impacts of measures implemented to promote them. Rotmans et al. [13] have indeed referred to the monitoring of dynamics within a transition as ‘essential’. They have included economic, ecological, and social indicators in the monitoring tools necessary to that end. But so far, most of the available research on CE has focused on the macro (e.g., countries and regions) and meso (e.g., economic sectors and industrial parks) levels, overlooking the micro level (e.g., firms and products) [14]. This means that product-level transition to CE lacks metrics to better gauge progress and setbacks.
The difficulty of measuring product-level circularity is even greater when talking about the bio-based sector. Circularity is commonly taken for granted as, by definition, bio-based products pertain to the biological cycle of the CE, as conceptualized by the Ellen MacArthur Foundation [15]. Furthermore, Skene and Oarga-Mulec [16] have identified significant issues arising when accounting for biological nutrients—such as those contained in bio-based fertilizers—with the concepts of resilience, regeneration, and restoration. Thus, the evolution toward reaching higher circularity levels within bio-based industries is hindered by the lack of effective metrics and monitoring tools.
In an effort to guide what needs to be measured regarding CBE, Vural Gursel et al. [17] identified six CE principles: (1) reduce reliance on fossil resources, (2) use resources efficiently, (3) valorize waste and residues, (4) regenerate, (5) recirculate, and (6) extend the high-quality use of biomass. They also set nine measurement requirements: (1) share of renewable resources, (2) resource use efficiency, (3) degree of regeneration, (4) degree of recirculation, (5) utility, (6) risk of accumulation of hazardous substances, (7) effect on environmental protection, (8) effect on economic viability, and (9) effect on social equity.
Within the EU’s Horizon Europe R&D program, the BIORADAR project is developing a digital tool to monitor the sustainability and circularity of bio-based products. A part of its innovation is the building of a circularity monitoring framework that puts the spotlight on often-overlooked circularity aspects within the bio-based fertilizer, textile, and packaging industries. It considers several of the CE principles and measurement requirements identified by Vural Gursel et al.
The BIORADAR project identified that there have not been many advancements in measuring circularity at the product level in bio-based sectors. In fact, a systematic literature review [18] identified 11 indicators applied to bio-based products, without sector differentiation. Another systematic literature review conducted within BIORADAR identified 29 indicators that were specifically applied to bio-based fertilizers, textile and packaging materials; however, 26 of them were indicators designed for general purposes and not specifically for bio-based applications. The three indicators that indeed were designed for the bio-based industry focused on waste management systems that produce fertilizers, mostly focusing on nutrient recovery and overlooking other relevant CE items. These results confirm previous research highlighting shortcomings in the circularity indicator appropriateness for biological cycles [19,20].
Therefore, the main research gap to be addressed is the limited capacity of existing circular economy monitoring tools to capture the specificities of the biological cycle—particularly when assessing the circularity of bio-based products. This gap highlights one of the most pressing challenges in operationalizing the circular economy concept: moving from a macro-level perspective, where several indicators are already available, to product-level assessments, where bio-based products are still evaluated using tools originally developed for conventional materials from the technical cycle. As a result, critical aspects of bio-based circularity remain overlooked.
To address the mentioned gap, this manuscript aims to put forward the BIORADAR product circularity monitoring framework as a managerial tool envisioned to foster the industrial transition toward a more sustainable and circular economy, specifically within the bio-based fertilizer sector.
Given the lack of bio-based-specific measurement tools to guide the circular transition within bio-based industries, the results and conclusions of the study present a validated way to measure CBE-relevant aspects of the bio-fertilizer industry, thereby bridging the identified knowledge gap and contributing to the ongoing quest and debate.
Through this study, the BIORADAR product circularity monitoring framework was demonstrated to be applicable to bio-based fertilizers, and its results proved to supply relevant insights on virgin non-renewable material consumption, waste generation, biodegradability, nutrient recovery efficiency, and nutrient release speed.

2. Materials and Methods

The BIORADAR product circularity monitoring framework was developed following a systematic literature review that allowed us to map out the available CE indicators applicable to bio-based fertilizers. Out of the 29 indicators identified in that review, a screening methodology was followed [21], leading to the selection of one general-purpose indicator: the Circular Index, following the CirculAbility model [22], and one fertilizer-specific indicator: the circularity indicator of nutrient [23]. The indicator screening methodology followed is illustrated in Figure 1.
As illustrated in Figure 1, the selection of indicators began with an initial tagging stage, where different characteristics of each indicator were classified. This allowed for the exclusion of indicators that directly incorporated environmental, social, or economic life cycle assessment (LCA) results. This decision was made to avoid double counting, given that the BIORADAR framework already integrates life cycle sustainability assessment (LCSA) indicators covering those three dimensions.
The final step involved evaluating whether the indicators addressed six key concepts: material sourcing, renewable energy use, waste handling, recovery, recycling, and lifetime. Based on this evaluation, a final set of existing indicators was identified. The full screening methodology, including the scoring criteria and process, is detailed in Cámara et al. [21].
The methodology for the two literature-sourced indicators can be found in their respective original sources [22,23]. However, certain adaptations had to be made to apply them to bio-based fertilizers since some gaps were identified. Such adaptations are described in Section 2.2.
Additionally, two new indicators were proposed to integrate the BIORADAR product circularity monitoring framework: the biodegradable/compostable content (for general purposes) and the nutrient slow-release index (specific for bio-based fertilizers), whose specific methodologies were described in a BIORADAR project report [24].
That calculation methodology was applied to a set of bio-based fertilizers that were identified through a screening process [25]: algae biomass, compost, feather meal, and wood vinegar. The group of studied fertilizers was complemented with spent mushroom substrate, on grounds of data availability for the nutrient slow-release index (NSRI).
The four selected indicators were then applied to the five targeted products.

2.1. Data Sourcing from Life Cycle Inventories and Complementary Materials

Relevant data was sourced from available life cycle inventories (LCIs) with a cradle-to-gate scope [26,27,28,29,30,31,32,33,34,35,36,37,38,39,40,41]. Because of the data diversity, different cases or scenarios were calculated for each product: four for algae biomass, six for compost, three for feather meal, three for spent mushroom substrate, and four for wood vinegar. Thus, data were obtained for a total of 20 different product systems. Table 1 details the specific LCI datapoints harnessed for the calculation of the circularity indicators for each product system.
The different scenarios for which data was available are described in Table 2, with a brief description of the system and the source from which the data was sourced.
The LCIs of compost, feather meal, and spent mushroom substrate include a Data Quality Rating (DQR), assessed using the “pedigree matrix” developed by Weidema and Wesnæs [43]. This methodology assigns a score ranging from 1 (highest quality) to 5 (lowest quality), based on a rubric that evaluates five criteria: reliability, completeness, temporal correlation, geographical correlation, and further technological correlation.
The resulting DQR scores for these three products are as follows: compost, 2.27; feather meal, 2.22; and spent mushroom substrate, 2.02 [44]. According to the Product Environmental Footprint (PEF) method [45], these values reflect data quality levels ranging between “good” and “very good”.
Regarding the data quality of the LCIs for algae biomass, Brassard et al. [29,30] reported an inventory consisting of 29 flows, of which 59% were classified as having “good” quality and 41% as “acceptable”. By simplifying the assessment and assigning a score of 3 to “good” and 4 to “acceptable”, a weighted average results in a DQR of 3.41. The data obtained from confidential industry sources did not include a formal DQR; however, its quality is considered high, as it is based on primary measurements conducted directly at industrial facilities.
Concerning the wood vinegar data, neither of the two sources [36,37] reported a formal DQR. However, both highlighted that data were obtained from industrial facilities (primary data) and from the Ecoinvent ® LCA database. Based on this information, the data quality of these LCIs can be considered comparable to that of the other datasets included in this study.
Overall, the quality and representativeness of the underlying data sources are deemed consistent with established scientific and industrial practice in sustainability assessments.

2.2. Methodology Adaptations for the Circular Index (CirculAbility Model)

As mentioned previously, for the Circular Index to be fit to be applied to bio-based products, certain adaptations had to be made. These modifications are described in the following sections.

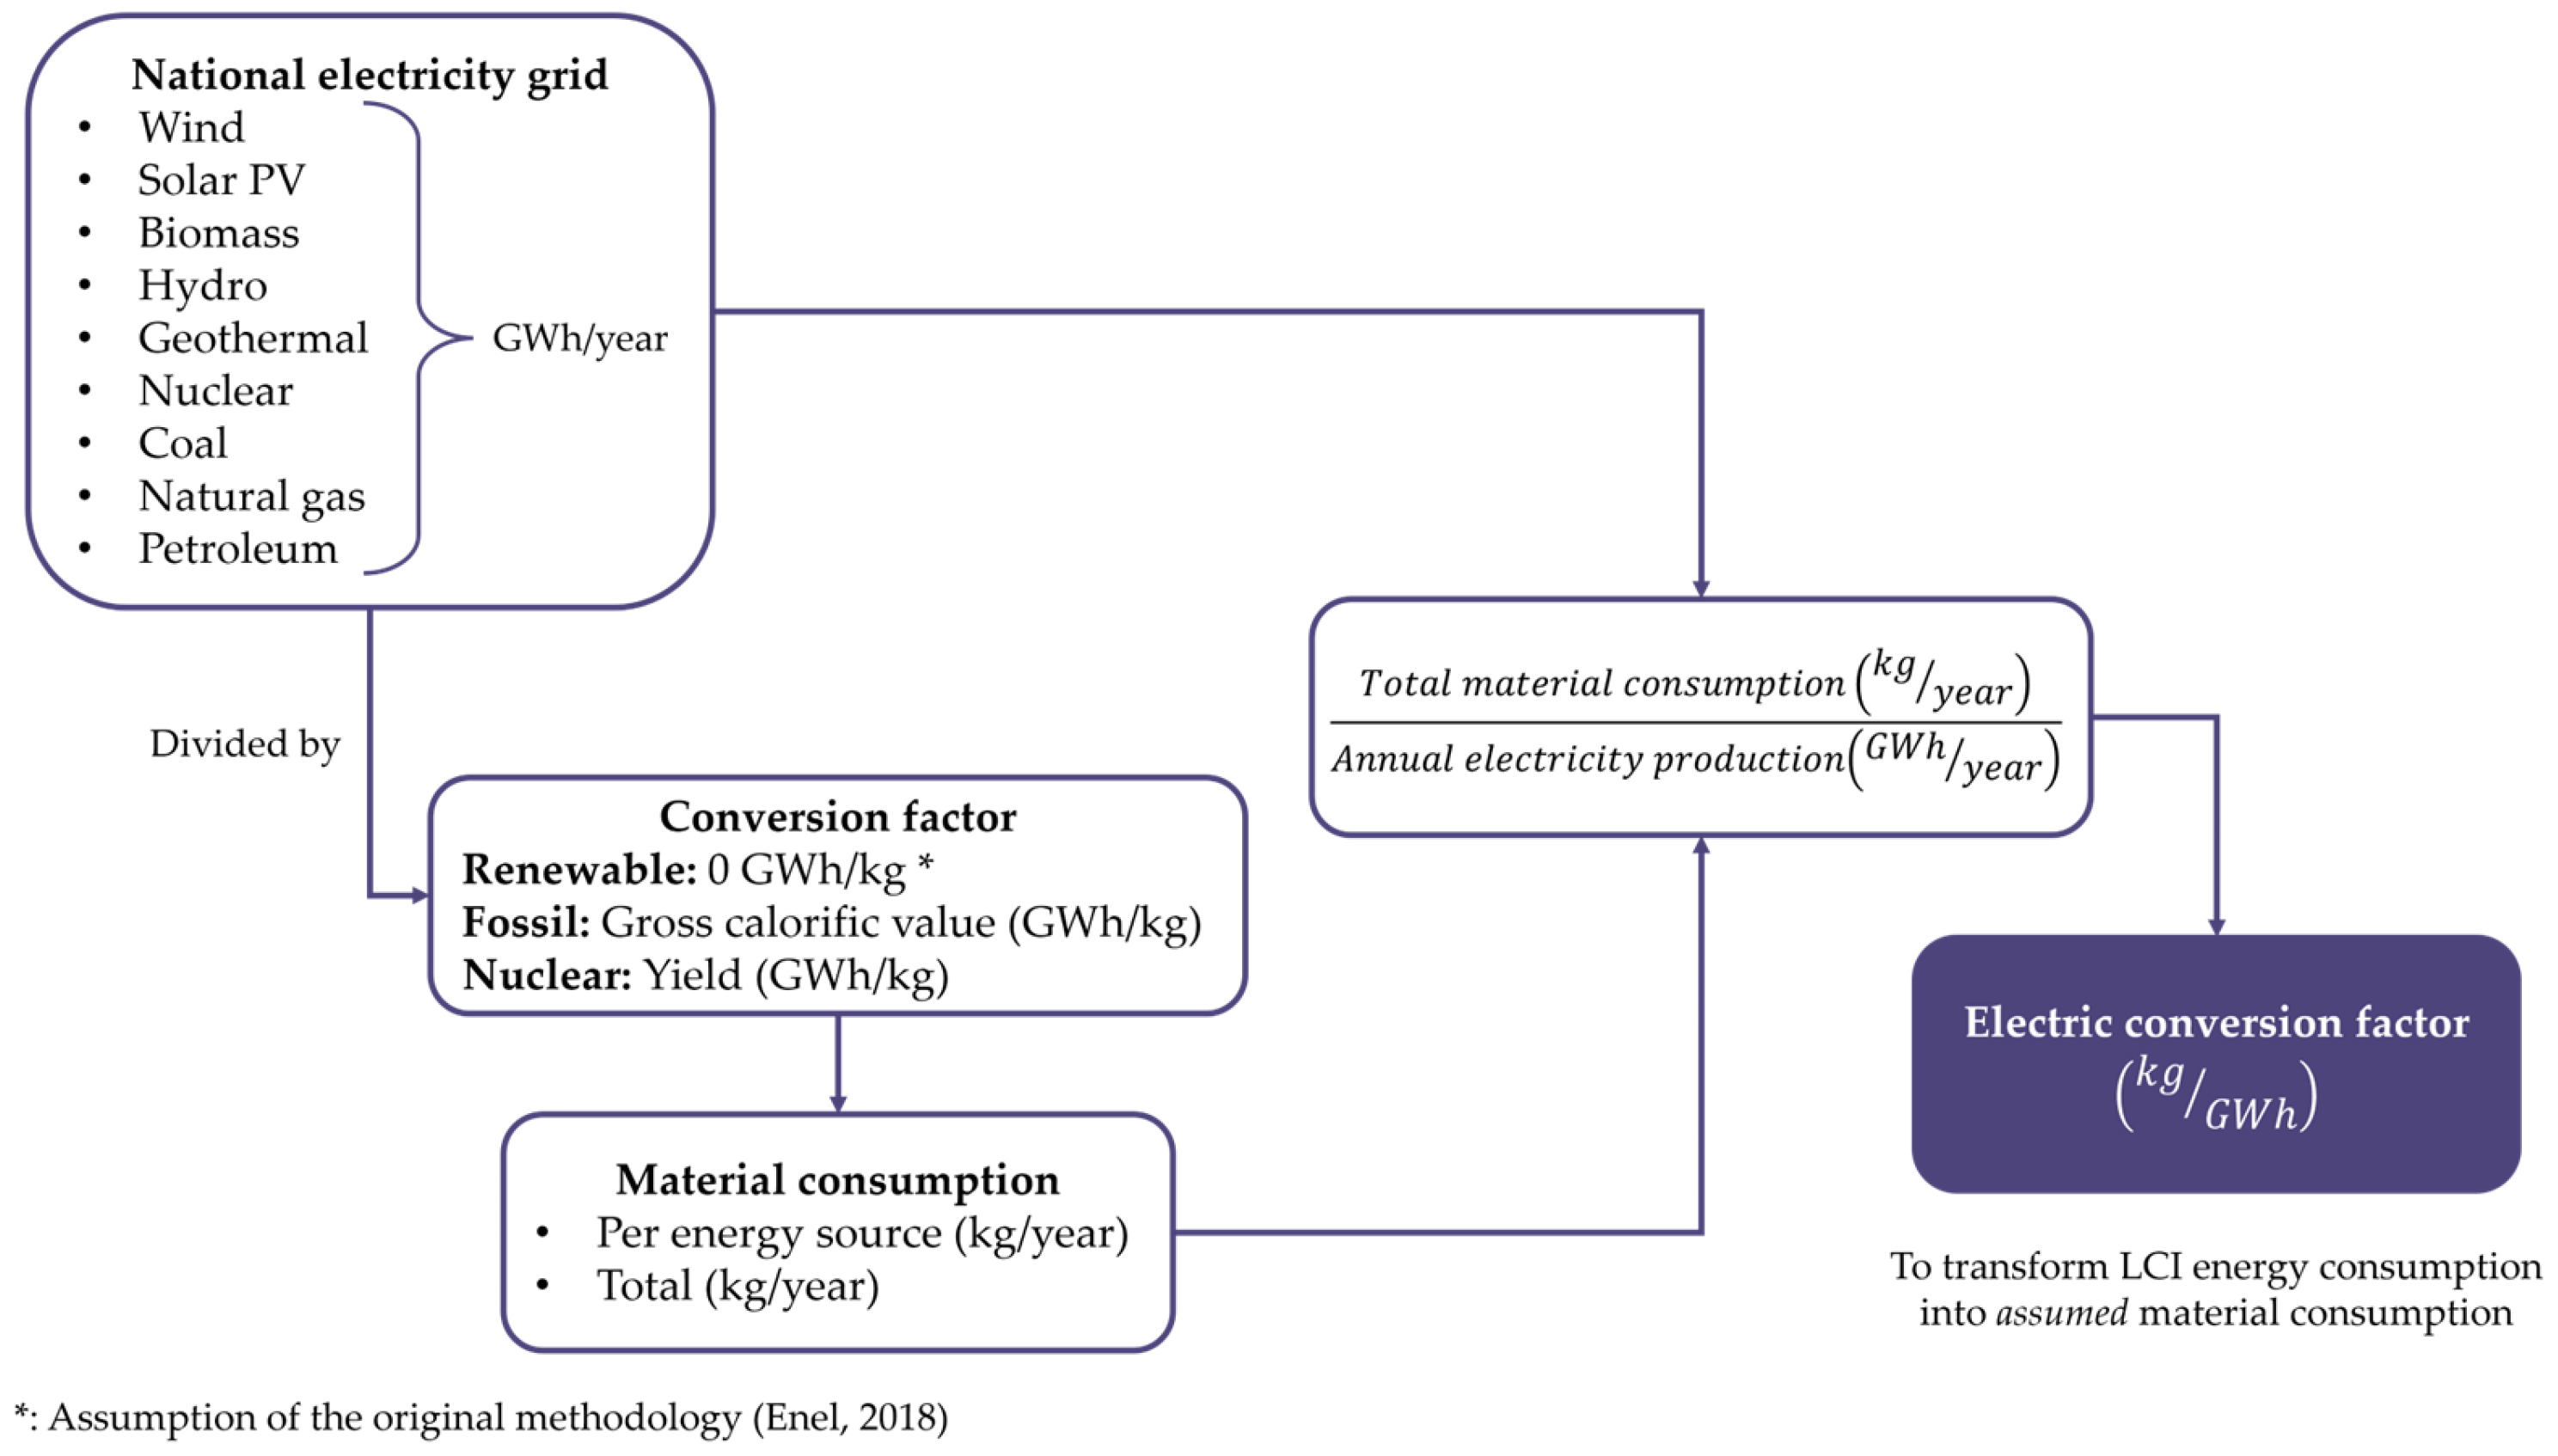
2.2.1. Energy Material Equivalents

Energy consumption values have to be converted into material equivalents, as mentioned in Table 1. The methodology to do so was developed by Enel [22] and is briefly explained below.
The energy-to-material conversion is based on three main assumptions:
  • The material equivalent of a given amount of energy represents the amount of resources consumed to produce it.
  • For calculation purposes, material consumption from non-renewable energy sources is not considered. While these sources do involve material use during the construction of infrastructure and technology, it is assumed that, strictly speaking, their material consumption during the electricity generation phase is negligible. Therefore, their material equivalent is set to zero.
  • Thermal and nuclear energy material equivalents are obtained through the gross calorific value (GCV) for fossil fuels and the uranium yield for nuclear.
By following these assumptions, an electric conversion factor (ECF) can be obtained and used to convert any electricity consumption into a material equivalent, following the relevant national electricity mix.
To obtain the ECF, the national electricity production of a given year has to be disaggregated into the specific energy sources (e.g., wind, solar PV, biomass, hydro, geothermal, nuclear, coal, natural gas, petroleum, other fuels, etc.). Each one of these items consists of a value in energy units (GWh, for instance). Then, the GCV and yields presented in Table 3 are used to obtain an assumed amount of material needed to produce such electricity.
The annual electricity production per source can thus be divided by the values contained in Table 3, resulting in material amounts. The next step is to divide the total material needs by the total annual electricity production—including those from renewable sources—which results in the ECF, in mass/energy units (e.g., kg/GWh). Figure 2 illustrates the calculation process.
Finally, the electricity consumptions reported in the LCI are multiplied by the ECF, resulting in the corresponding material equivalent in mass units (e.g., kg).

2.2.2. Useful Lifetime of the Products

One of the key components of the Circular Index is the one referring to the useful lifetime of the product, which accounts for lifetime extension, sharing, and business-as-usual scenarios, and the business-as-usual case. However, since the products under study are single-use ones, all the lifetime-related parameters were set to one, as can be seen in the Supplementary Material.
This decision excludes from the assessment any use-stage circularity aspect, which aligns with the use scheme of fertilizers (applying them on agricultural soil and not requiring any additional actions). The lifetime dimension is addressed by the NSRI, which incorporates the prolongation of nutrient availability into the framework.

2.3. Methodology for the Biodegradable Content Indicator

The biodegradable content indicator (BC) is a simple mass ratio intended to convey how much of the product mass is able to biodegrade, in accordance with the following formula:
B C = B m T m ,
where Bm stands for the mass of biodegradable materials ultimately contained in the final product (kg) and Tm′ for the total mass of the product (kg).

2.4. Methodology for the Nutrient Slow-Release Index

The calculation of the nutrient slow-release index (NSRI) consists of applying Equation (2), which aims to represent a higher level of circularity when the bio-based fertilizer releases the target nutrient more slowly than the selected mineral baseline:
N S R I = 1 m i n N R C n b i o N R C n
where minNRCn stands for the soil nutrient relative content n days after the application of mineral fertilizer, and bioNRCn for the soil nutrient relative content n days after the application of bio-based fertilizer.
In order to calculate the NSRI, specific data was required. The only dataset available was the one published by Niedzinski et al. [42]. Thus, the calculation of the NSRI was limited to the products contained in it, namely turkey manure and spent mushroom substrate.
From the side of mineral fertilizers, against which the bio-based are compared, data for three commercial products was available, as can be seen in Table 4.
Based on this data availability, the NSRI was subsequently calculated only for turkey manure and spent mushroom substrate, using for the comparison the average value of soil relative nutrient content for the three available mineral fertilizers, namely 0.092.

2.5. Data Uncertainty Management

Given that the calculation of indicators requires significant data processing, appropriately managing the uncertainty associated with each datapoint is essential. The specific uncertainties for each variable are detailed in the Supplementary Material (Table S4). Data sourced from LCIs were assigned an uncertainty of 10%, based on the dataset developer’s guidelines and the scientific literature on LCA data uncertainty characterization [50,51]. For the NSRI, uncertainty was set at 3%, corresponding to the analytical method used to determine soil nutrient relative content [52,53].
For all intermediate calculations and final indicator results, error propagation methods for multi-variable functions were applied, following standard procedures [54,55]. The corresponding equations are provided in the Supplementary Material (Equations (S1)–(S10)).
To assess the uncertainty levels obtained, the scale proposed by the GHG protocol [56] was adopted (Table 5). This decision was made considering the interdependencies between GHG and LCA datasets, as well as their shared use in overall environmental sustainability assessments. Therefore, the uncertainty ranges applicable to GHG calculations were deemed appropriate for evaluating the data accuracy of the indicator results and their underlying datasets.

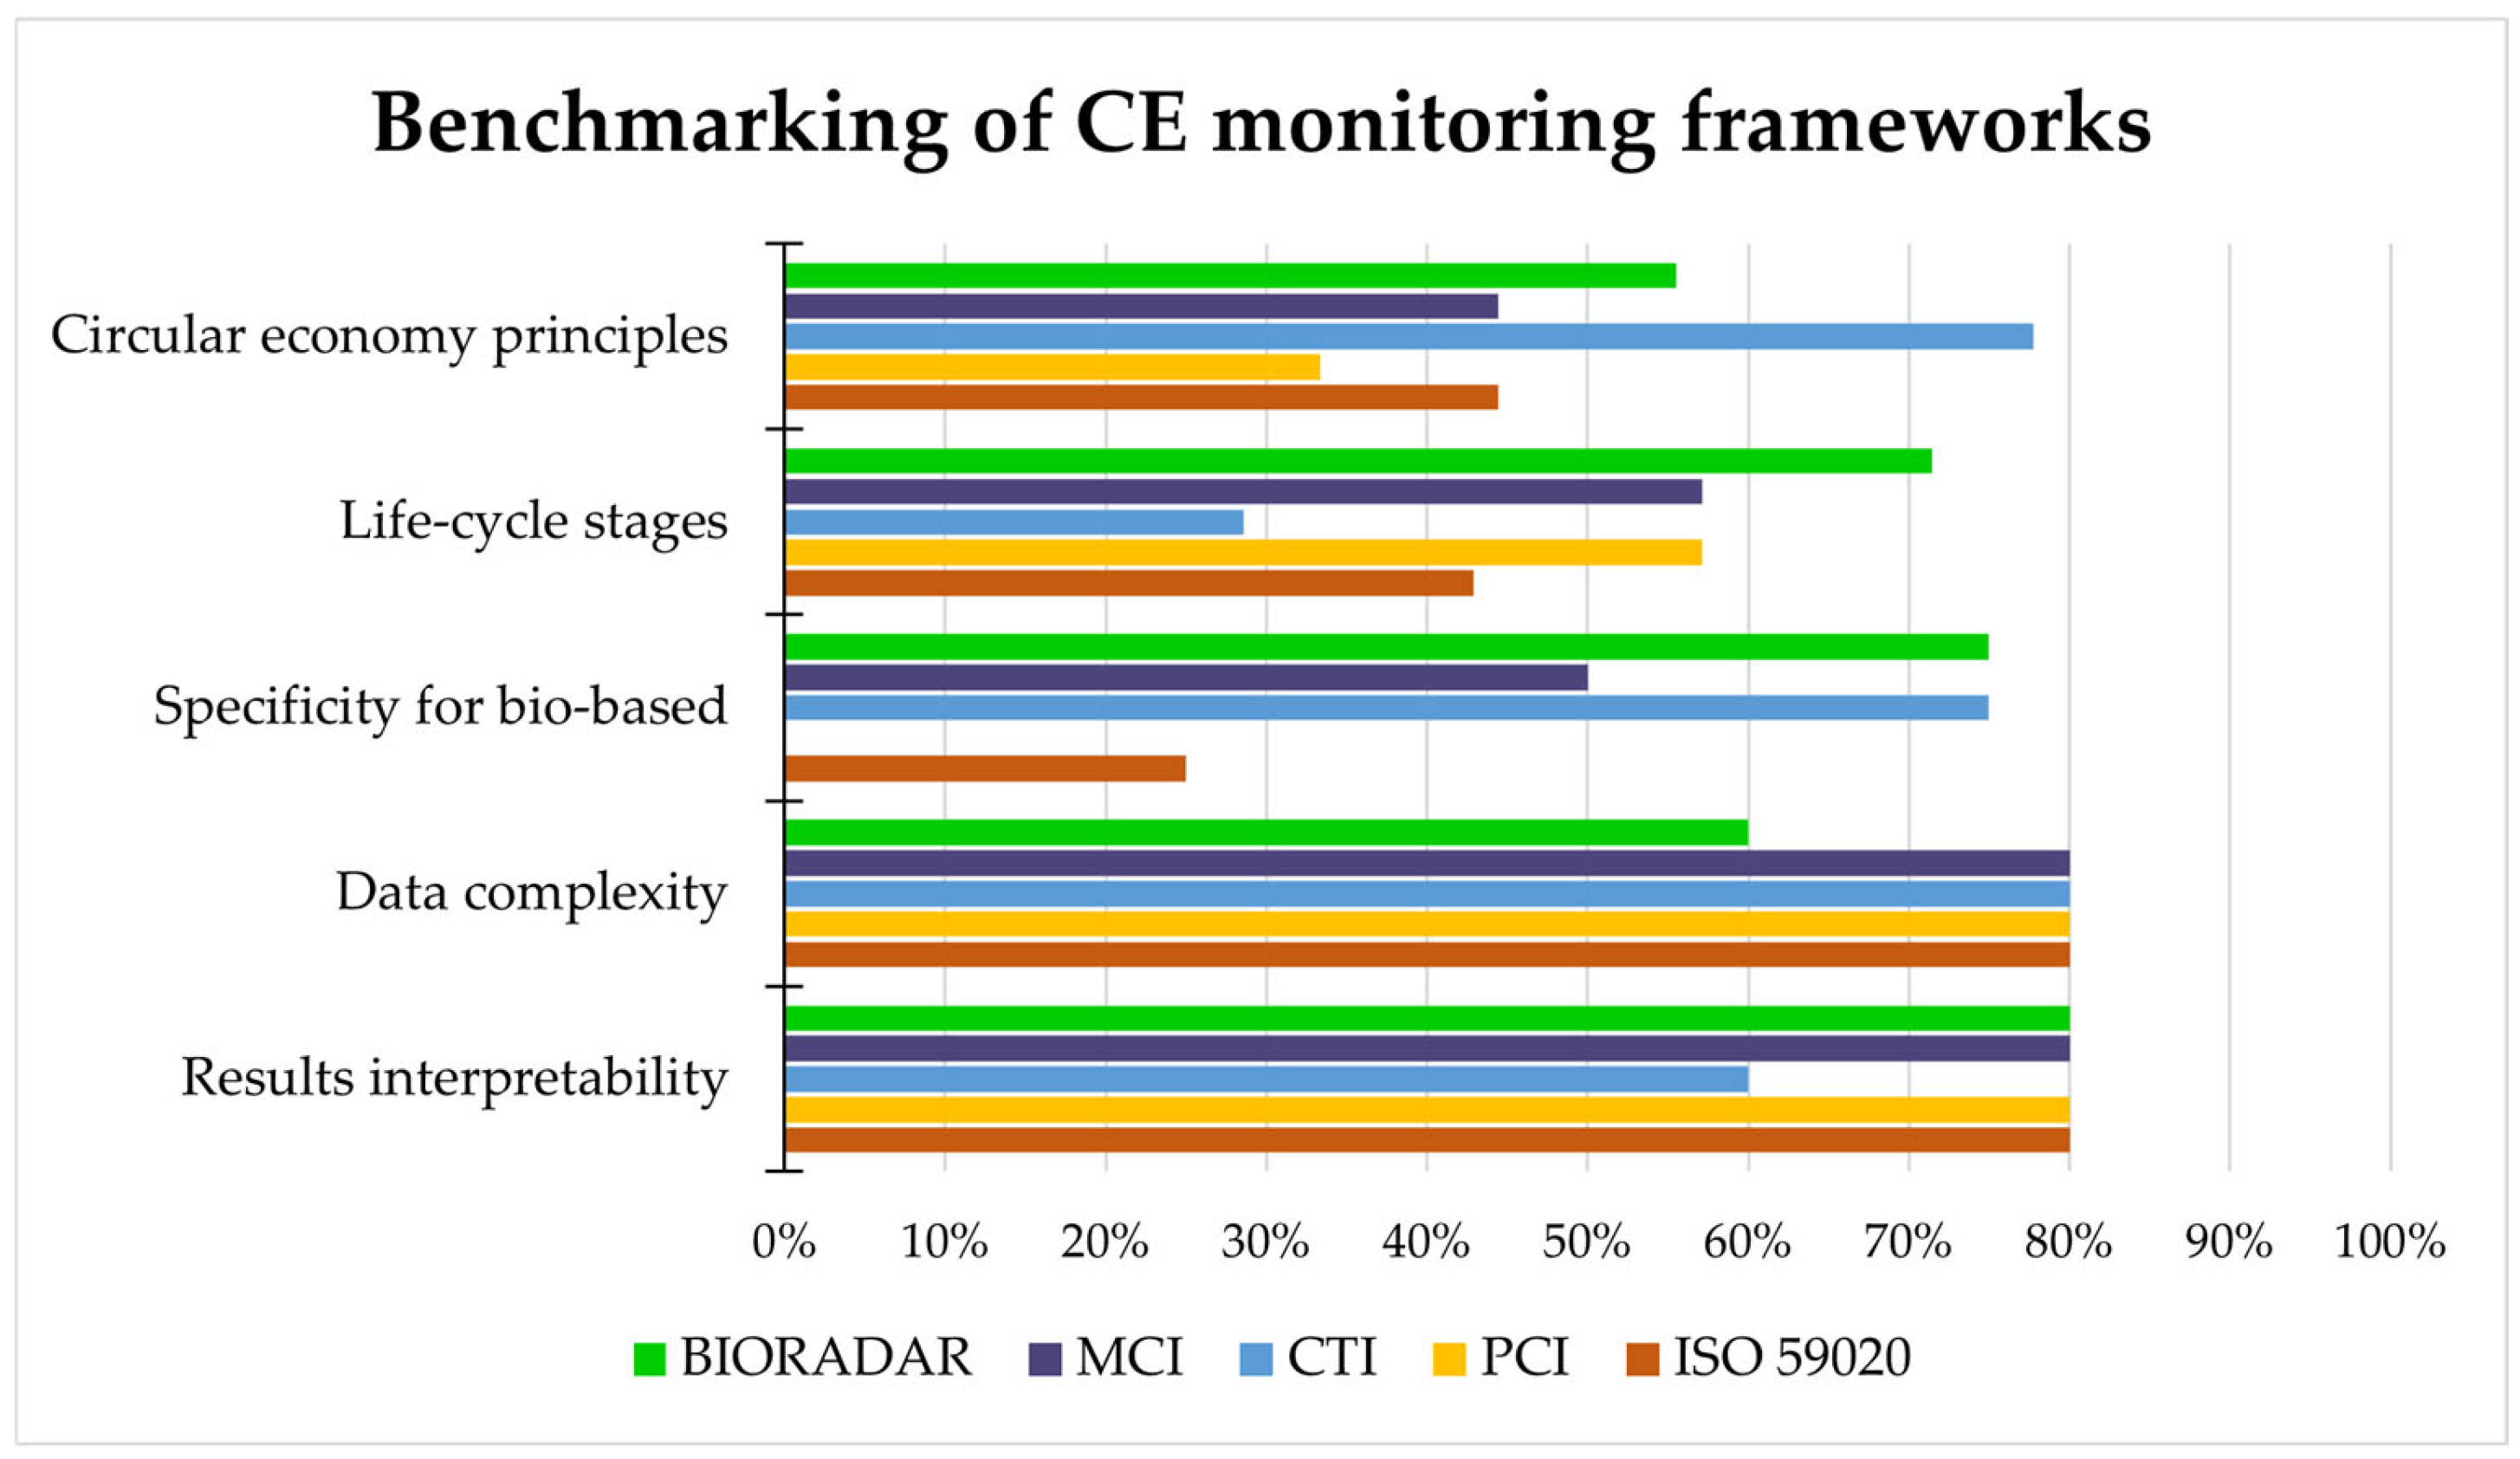
2.6. Benchmarking the Framework with Other CE Assessment Tools or Standards

To highlight the added value of the framework, a critical assessment was carried out by comparing its features with those of other widely used tools: the Ellen MacArthur Foundation’s Material Circularity Indicator (MCI) [57], the World Business Council for Sustainable Development’s Circular Transition Indicators (CTI) [58], the Product Circularity Indicator (PCI) [59], and the ISO 59020:2024 Circular Economy Standards [19,60].
The comparison was based on the following criteria:
  • Consideration of circular economy principles, as defined by Vural Gursel et al. [17], namely, reducing reliance on fossil resources, using resources efficiently, valorizing waste and residues, and regenerating, recirculating, and extending the high quality of biomass. Vural Gursel et al. identified nine specific metrics aligned with these six principles. Accordingly, each framework was evaluated based on how many of these nine metrics it incorporates.
  • Coverage of life-cycle stages, as defined in the standard EN 15804 [61], considering 7 life-cycle stages: from product stage (A1–A3), use stage (B1), end-of-life (C3–C4), and benefits and loads beyond the system boundary, including reuse, recovery, and/or recycling potentials (D).
  • Specificity for bio-based systems (i.e., consideration of biodegradability, renewable material use, cascading utilization, and carbon storage potential).
  • Data complexity, following a 1–5 scale detailed in the Supplementary Material (Table S5).
  • Results interpretability, following a 1–5 scale detailed in the Supplementary Material (Table S5).

3. Results and Discussion

Having collected the data from the relevant LCI and complementary sources and conducted the calculation of the indicators with the previously described methodology, a set of four indicators was obtained for each of the targeted products and scenarios. The results presented below account for the average results of each of the target products. The disaggregated results per scenario can be accessed in the Supplementary Material.

3.1. Circular Index

Overall circular index (CI) results tend to be high (>0.85) for the assessed bio-based fertilizers, as can be seen in Figure 3. All the values are relatively high, which conveys that overall, the targeted bio-based fertilizers attain a high circularity level. The uncertainty calculated is below 1.00% for all the cases, representing a high data accuracy, according to the GHG protocol’s data accuracy rating. However, any determinant conclusion should always be based on a specific comparison between relevant scenarios.
The results obtained for the CI allow to rank the assessed products by “circularity” levels. For this indicator and under the sector constraints, “circularity” is linked to two ratios: (1) virgin non-renewable inputs to total inputs and (2) waste to total outputs. Let us analyze how these two factors influenced the results of each of the five targeted products:
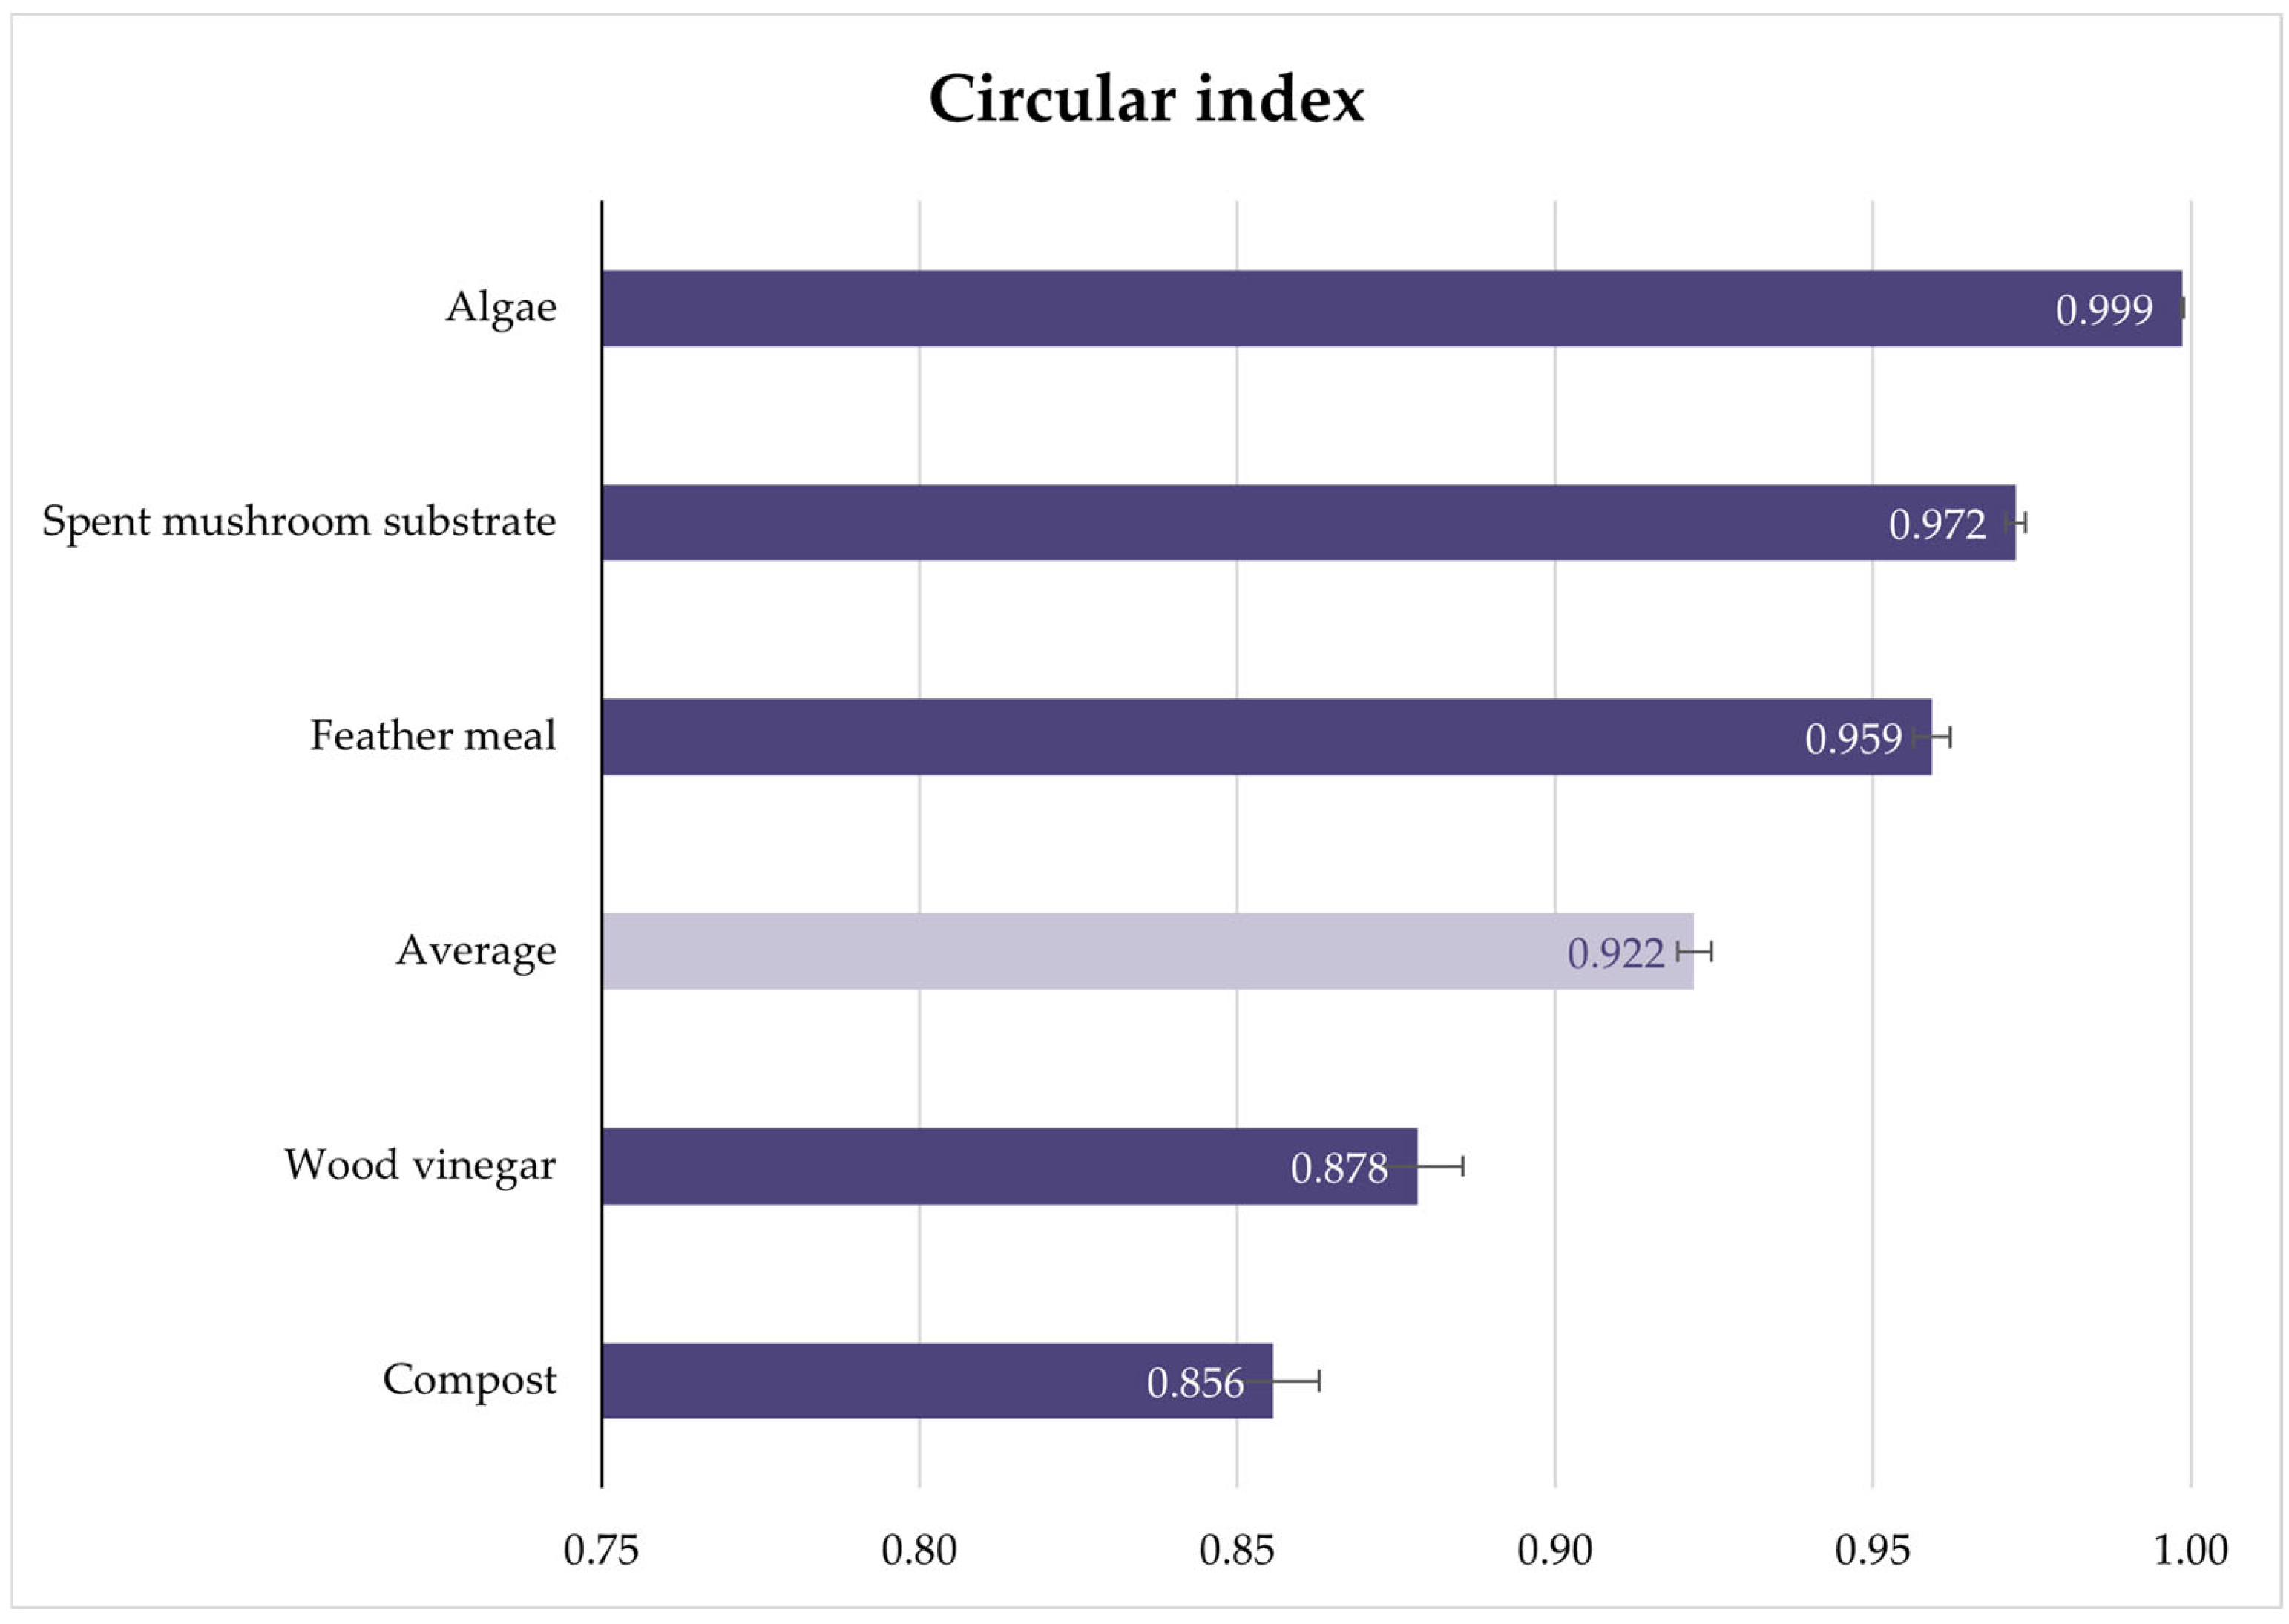
  • Algae scored the highest CI result by having low virgin non-renewable consumptions (<0.1% of total inputs) and no waste generation.
  • Spent mushroom substrate, for its part, also has low virgin non-renewable consumption (<5% of total inputs) and low waste generation (<2% of total outputs).
  • Feather meal, at the third position, has low virgin non-renewable consumption (<9% of total inputs) and no waste generation.
  • Wood vinegar, being below the average, although having low waste generation (<1.6% of total outputs), has a non-negligible consumption of virgin non-renewable materials (23.4% of total inputs), caused mostly by ethylene consumption during the condensation stage.
  • Compost owes its position at the bottom of the ranking to the non-negligible waste generation (28.4% of total outputs), which reduces its CI, although it has a low consumption of virgin non-renewable materials (<0.09% of total inputs).
In all cases, the energy consumption had little influence on the main results, not altering the trend imposed by the material consumption and waste.
Through the calculation process, including the methodological adaptations described in Section 2.2, it became evident that the original CI has limitations when directly applied to bio-based fertilizers. One of these is the consideration of product lifetime, which, unlike in other types of products, cannot be meaningfully assessed for fertilizers, as they are applied only once to the soil. This finding, in turn, led to the development of the nutrient slow-release index (c.f. Section 3.4).
The results, in turn, highlight three CBE aspects of bio-based products: virgin non-renewable material consumption, waste generation, and energy consumption (although the latter having little effect on the indicator result). These findings partly confirm the assertion that bio-based products tend to have a higher level of circularity when compared to non-bio-based ones [62,63].

3.2. Biodegradable Content

Regarding the BC, the variation among products is smaller. This is logical, as all the products are bio-based, meaning that their main components are biodegradable. The high BC scores of all the products are presented in Figure 4.
While in other sectors, such as packaging or textiles, biodegradability must comply with strict standards and regulations to be validated, fertilizers are, by definition, integrated into the soil upon application, becoming part of the so-called humus material.
The relatively low score obtained by the spent mushroom substrate—although not being significantly different from the others—is caused by the use of gypsum and lime in its manufacturing process. Although being non-persistent and soil-assimilable, gypsum and lime are not considered biodegradable stricto sensu, as they are inorganic molecules that are not disintegrated by the action of microorganisms. The BC indicator allows us to identify such material consumptions, prompting us to evaluate alternatives to substitute them with biodegradable materials.
The lowering of the compost score is due to the use of iron hydroxide (Fe(OH)3) as a hydrogen sulfide (H2S) inhibitor during anaerobic digestion, which is afterwards not removed.
Nonetheless, given the uncertainty level of BC results (between 3.16% and 8.17%) and their overlapping, no significant differences can be established among the products under study. The comparisons presented above are based on the known characteristics of the manufacturing processes, which are indeed reflected in the results, despite falling within the margin of uncertainty. Uncertainty levels, however, convey good and high data accuracy, according to the scale presented in Table 5.
The BC results helped to shed light on the biodegradability of materials, emphasizing that even in the manufacturing of bio-based products, certain non-biodegradable inputs may still be required. However, four key limitations must be acknowledged:
i.
Unlike the CI, the BC indicator does not function as a standalone metric; rather, its value lies in complementing other frameworks by highlighting aspects that may otherwise go unnoticed.
ii.
The degree of uncertainty associated with BC calculations may hinder businesses from identifying clear pathways for improvement or innovation.
iii.
Material substitution is not always straightforward (e.g., substituting gypsum, lime, or Fe(OH)3 by bio-based inputs), which points to the existence of a potential “circularity ceiling”—a limit beyond which improving BC becomes increasingly complex or unfeasible.
iv.
Operationalizing the concept of biodegradability can be challenging: in some sectors, such as packaging, it may require formal certification (e.g., EN 13432 [64]), while in others—such as fertilizers—it raises questions regarding materials like gypsum or lime, which are soil-assimilable but not biodegradable stricto sensu.
Despite these challenges, the BC indicator provides important insights into material flows and degradation pathways, reinforcing the need for nuanced, context-specific assessments of circularity in bio-based value chains. Its contribution goes beyond the mere calculation of an index, as it encourages critical questioning and research during the data sourcing phase, which may reveal opportunities for improvement.

3.3. Circularity Indicator of Nutrient

Figure 5 presents the CIN results, which exhibit a wide range of values. This indicator conveys how efficient the fertilizer manufacturing process is in maintaining the target nutrient in the final product. Uncertainty levels for this indicator ranged from 5.56% to 11.60%, indicating a good/high data accuracy, following the GHG protocol’s data accuracy rating (Table 5).
The results cover the nature of the manufacturing process:
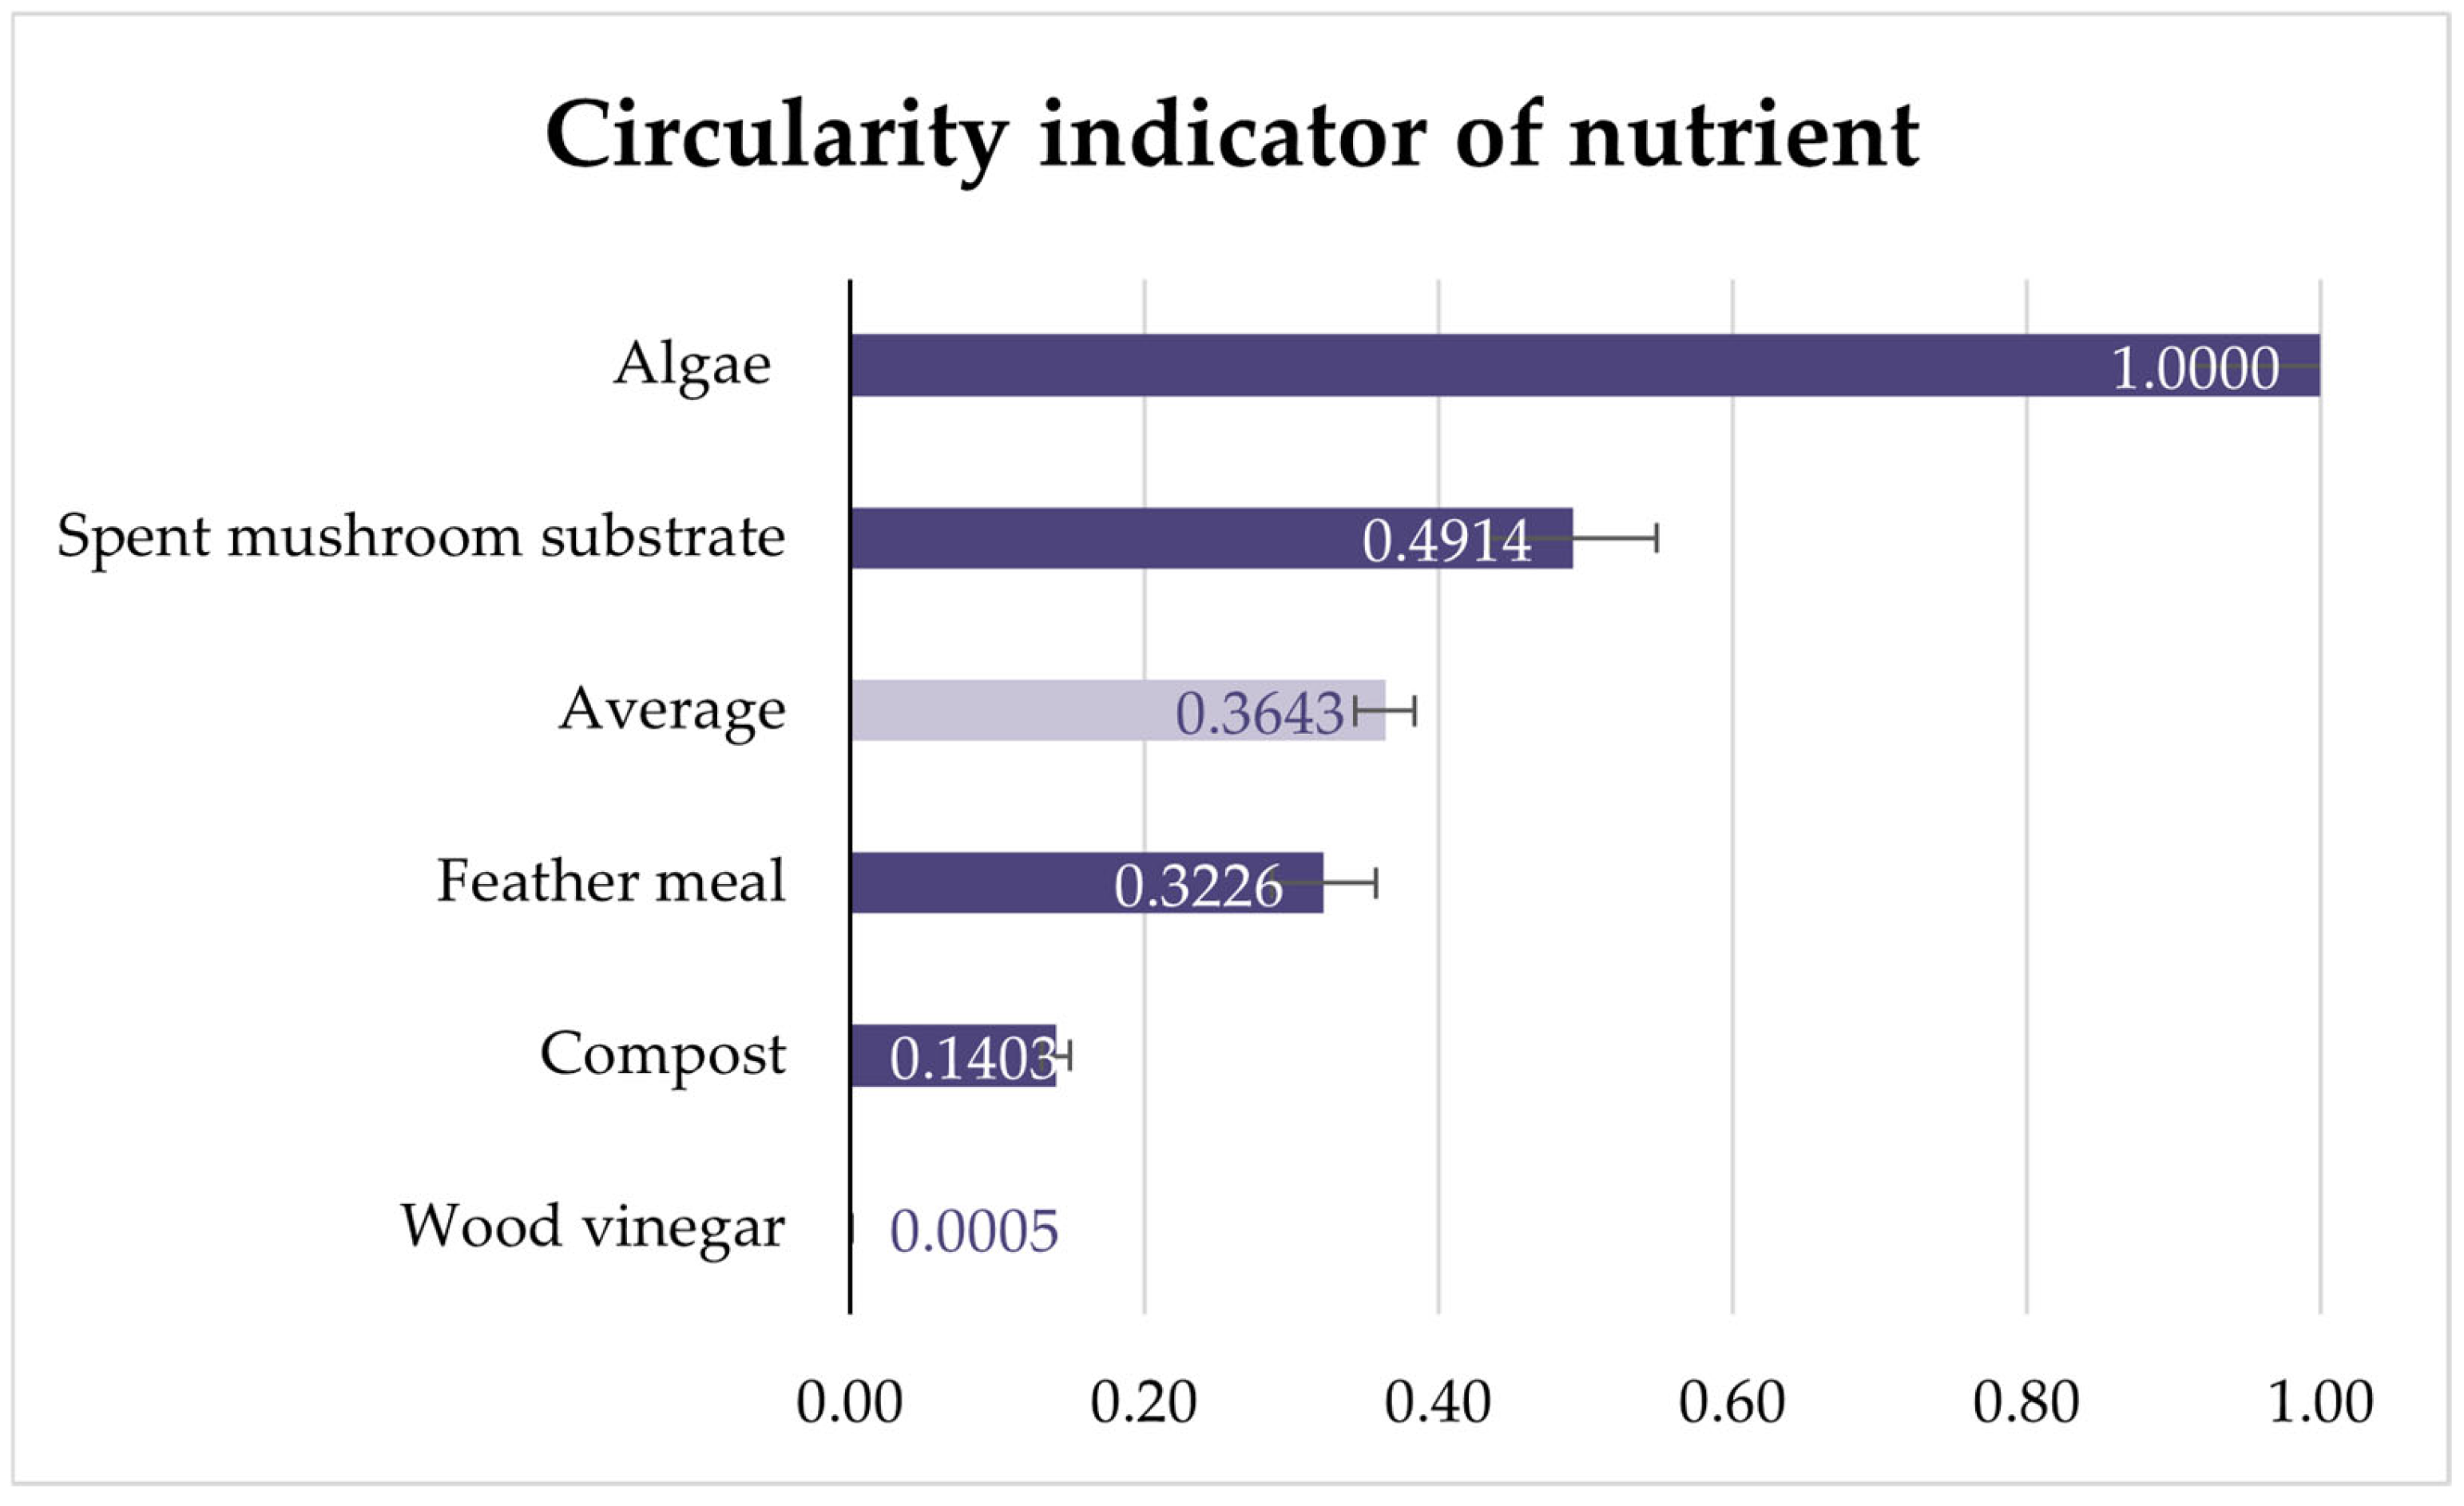
  • Algae biomass only undergoes drying before being applied to soil; therefore, all the nutrients contained in the plants are maintained in the dried product.
  • Spent mushroom substrate has a noticeably reduced CIN due to its manufacturing process, which includes two composting stages and the growing of mushrooms. Part of the nutrients contained in the inflowing waste streams are absorbed by the mushrooms during the cultivation stage, and others are eliminated during composting.
  • Something similar can be observed in the case of feather meal, whose manufacturing process includes a hydrolysis stage, in which the constituent molecules are broken down.
  • In the case of compost, the bio-based product undergoes an anaerobic digestion followed by a composting stage. Both together reduce the nutrients contained in the raw waste streams.
  • Finally, the wood vinegar manufacturing process is the least effective one of all the assessed bio-based products. This is because most of the nutrients contained in the wood biomass ultimately remain in the biochar, which is the solid phase of the waste treatment process. The nutrients in wood vinegar are a minimal part that is emitted in combustion gases and then condensed to obtain the product. Therefore, the function of wood vinegar is more accurately regarded as that of a pesticide and biostimulant rather than a fertilizer stricto sensu.
The CIN results help identify the most efficient nutrient recovery processes among the five assessed. Although some processes are inevitable (such as growing mushrooms and composting the spent mushroom substrate) and its selection is raw-material dependent (for instance, algae not needing additional treatment beyond drying), having it measured could help industry and policy agents prioritize technologies and waste treatments.
It is worth noting that, unlike “conventional” products, the ones studied here originate from the valorization of waste streams. If these waste streams did not exist, there would be no reason to produce such fertilizers. Some bio-based fertilizers also depend on other primary processes; for example, increasing the production of spent mushroom substrate would make little sense without a corresponding demand for mushrooms. Therefore, the assessment should not be based on the logic of “selecting the go-to product”, but rather on evaluating the treatment processes available for a specific waste stream and identifying the most circular option.
In any case, recovering valuable compounds from waste streams is, by definition, a CBE practice, one that also aligns with the EU’s waste hierarchy [65]. Thus, the very production of bio-based fertilizers is preferable to the disposal of residues under the prevailing business-as-usual logic.
The CIN is fundamentally an efficiency indicator that enables businesses to make better-informed decisions. However, it demands robust quality control and stability practices, which may not be widely established within the bioeconomy sector. For example, an accurate characterization of the feedstock is essential for calculating the CIN. Due to the variability of biowaste streams and limited technical capacity to analyze them, relevant datapoints may be unavailable for a significant number of manufacturers. Another function of this indicator is the fostering of measurement and quality control activities among firms engaged in the CBE.

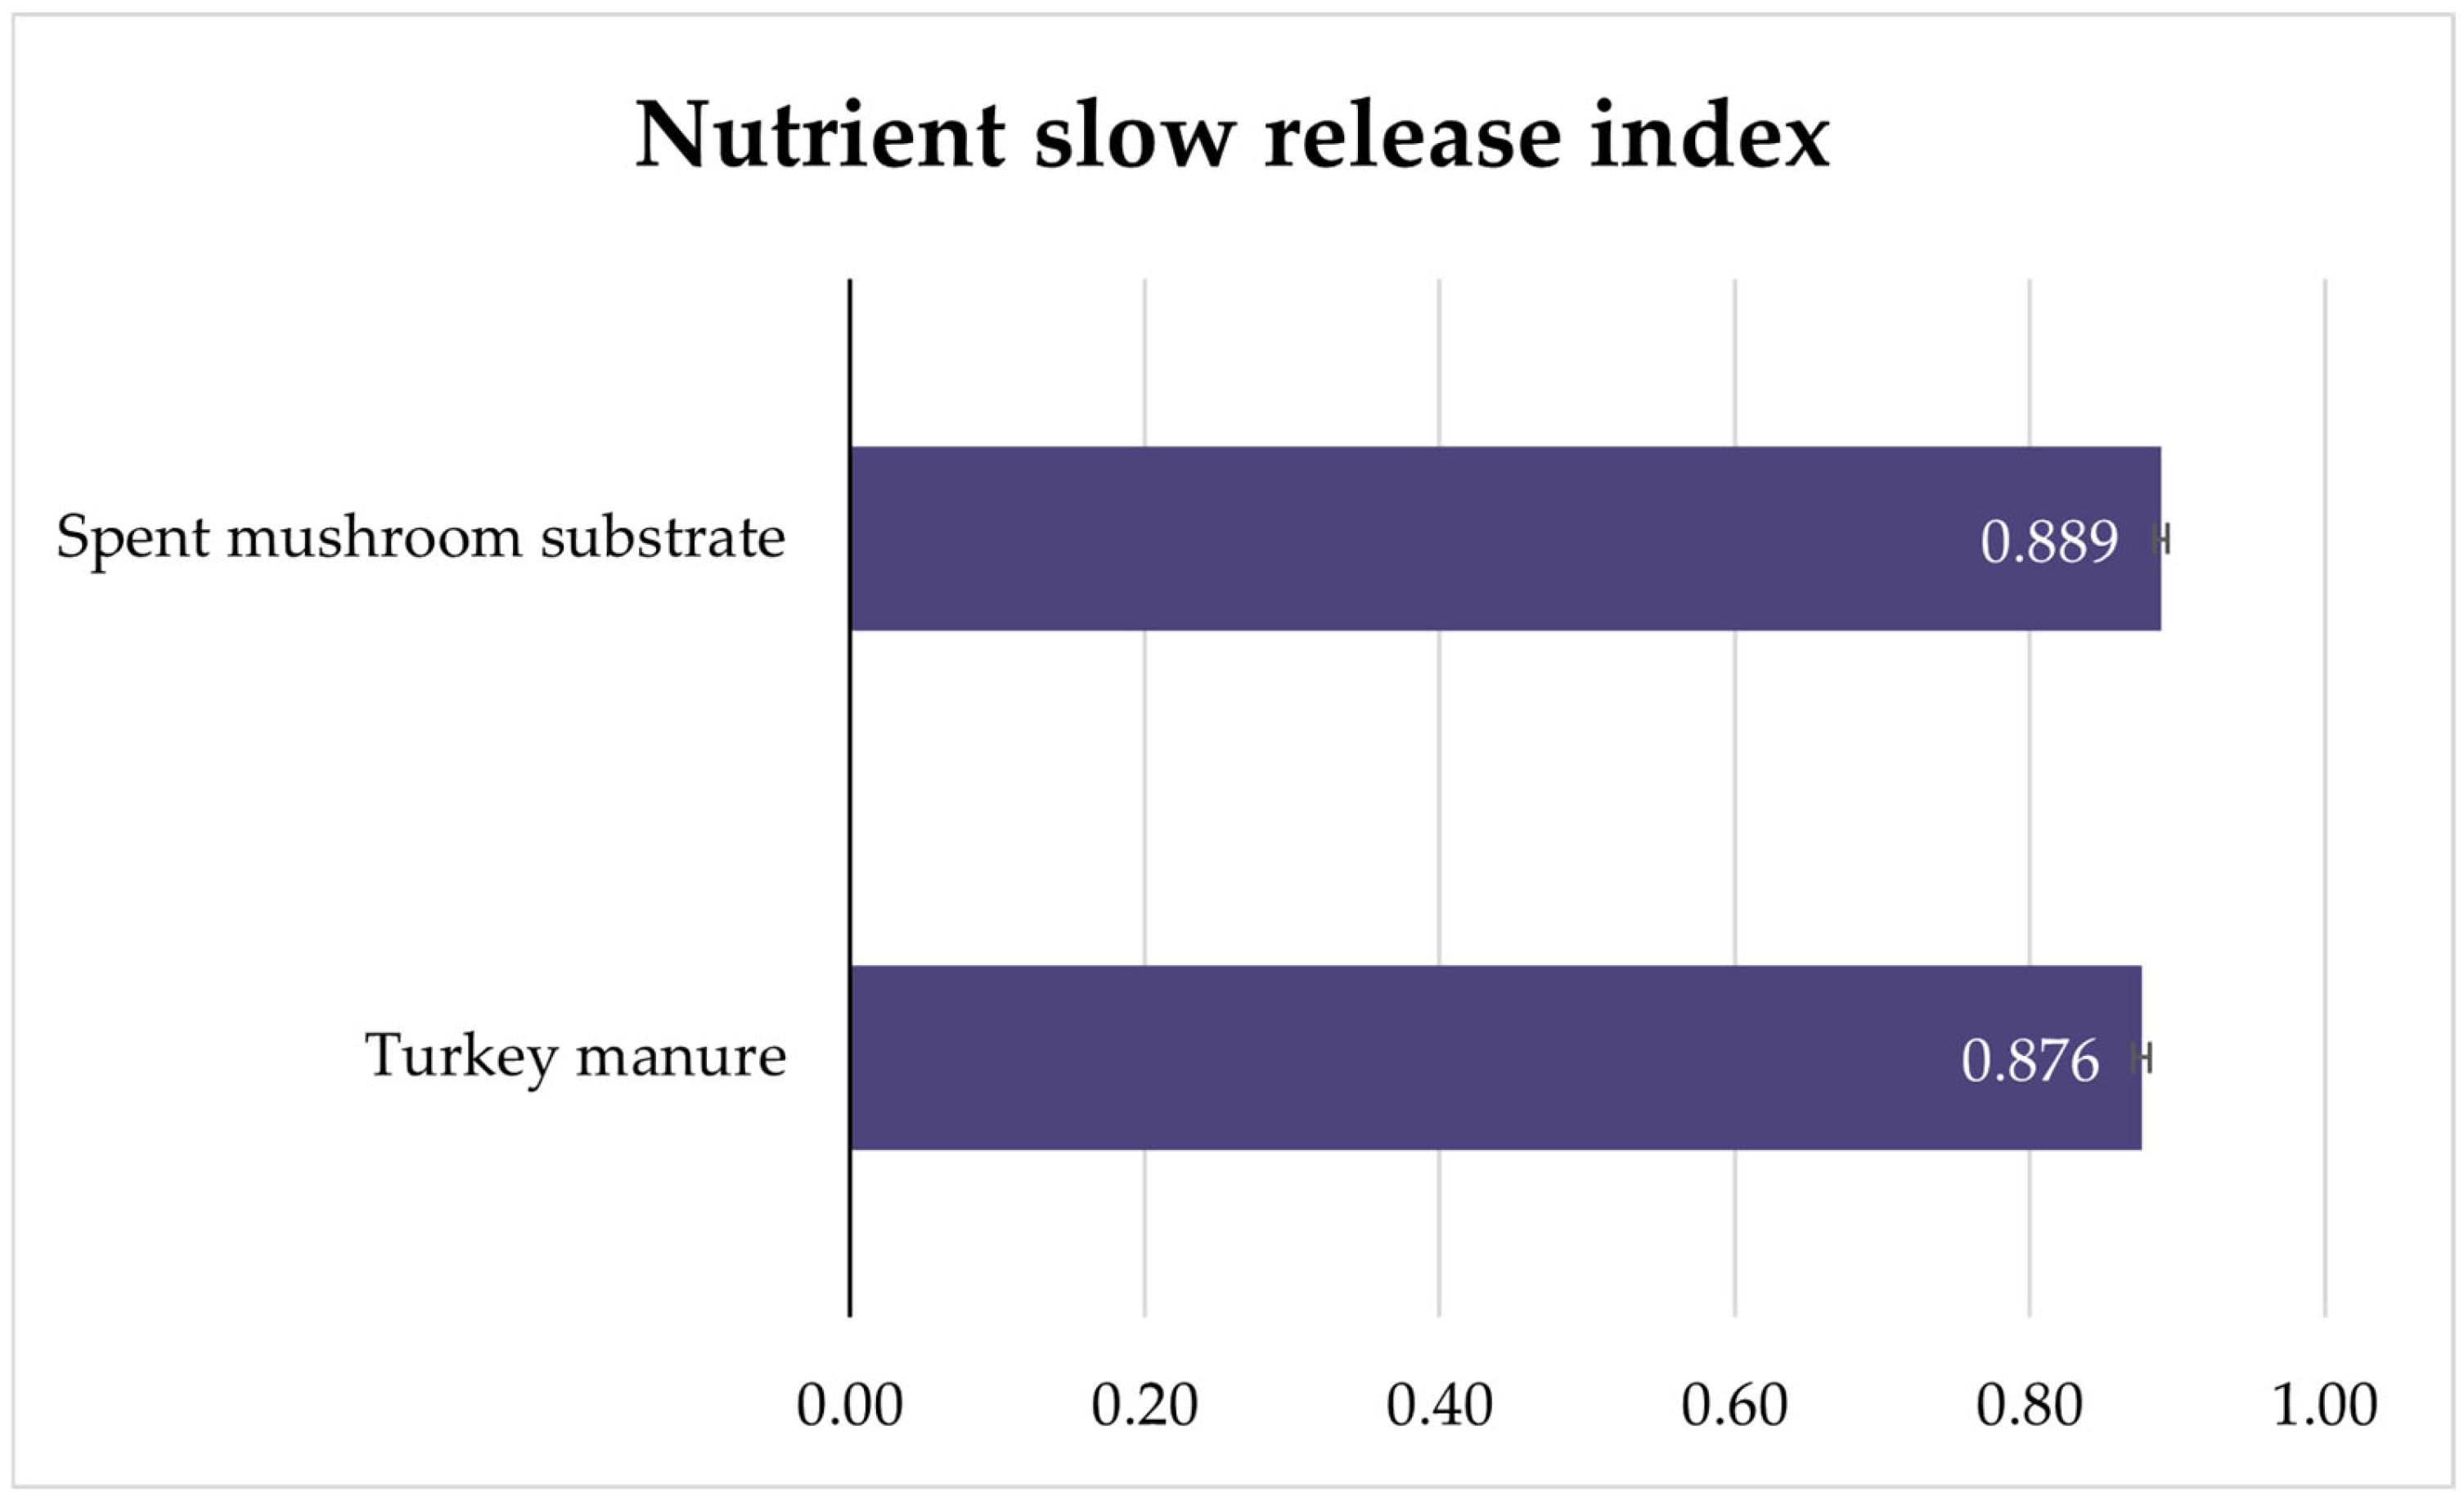
3.4. Nutrient Slow-Release Index

The scarcity of the NSRI data limited the calculation of this indicator only to two fertilizers (Figure 6). For this indicator, the uncertainty ranges are particularly narrow (i.e., 0.53% and 0.60%), which directly reflects the low uncertainty (3%) associated with the original data source. This uncertainty level characterizes the results as having high data accuracy, according to the GHG protocol’s rating (Table 5).
The results of NSRI allow us to assert that both spent mushroom substrate and turkey manure have significantly longer release times compared to the mineral options. This is a logical outcome, consistent with the values presented in Table 4. For instance, it can be seen that 35 days after the application of turkey manure, 74% of the nutrient remains available, whereas only 1% remains when U-PSf is used. It is also aligned with the scientific findings indicating that one of the main advantages of bio-based fertilizers is precisely the prolonged time in which nutrients are released, limiting nutrient loss and leaching [66,67].
This prolonged nutrient release behavior can be linked to the circular economy in several aspects, including the following:
  • Reduced leaching implies reduced eutrophication risk, contributing to a good stewardship of the environment.
  • Reducing nutrient loss promotes a better use of resources, reducing extraction needs.
  • Prolonging nutrient release also prolongs the time between fertilizer applications, in a certain way extending the “useful lifetime” of the applied products and reducing overall fertilizing product consumption and its associated costs.
The NSRI complemented the other indicators by incorporating the time-related characteristics of bio-based fertilizers into the assessment. However, this was not without limitations, as the necessary data for the five target products were not available during the course of the research.
With the available data, no relevant difference was identified between the two bio-based fertilizers, but the inclusion of the NSRI within CBE assessments may contribute to enlarging the available database and its use for managerial purposes.
It is important to note that the NSRI represents a first approximation to incorporating the concept of nutrient release speed as a feature of the circular economy. This indicator does so in a straightforward manner, acknowledging that many other variables influence nutrient behavior in soil (e.g., soil microbiomes, moisture dynamics, etc.). More comprehensive frameworks to monitor these dynamics have been proposed by Antwi et al. [68], Gong et al. [69], and Ding et al. [70], offering in-depth soil science approaches that provide a more accurate representation of reality.
Soil dynamics are particularly complex to model, requiring extensive mathematical and analytical operation, as well as dedicated data collection tools and laboratory analyses. Moreover, each soil–climate setting may respond differently to the same fertilizer, meaning that calculations for a specific location may not be representative of others.
This creates a dilemma between achieving high accuracy through a complex indicator—which may be perceived as burdensome by businesses—and having a straightforward indicator that guides general business strategy but acknowledges it does not capture all soil nuances. Currently, tensions are emerging in the European Union between businesses and regulators due to the approval of strict corporate reporting requirements (i.e., the Corporate Sustainability Reporting Directive (CSRD) and the Corporate Sustainability Due Diligence Directive (CSDDD)), which are now in the process of being simplified by an Omnibus package. In this context, a framework intended for business use should aim to reduce complexity to enhance accessibility.
The NSRI contributes by integrating the consideration of nutrient release speed into circular economy management practices. To date, studies on the circular nutrient economy (CNE) have focused primarily on nutrient recycling and nutrient flow analyses, addressing these as “nutrient circularity” and “closing the nutrient loop” [71,72]. Therefore, incorporating durability or lifetime extension within the fertilizer sector is a relatively novel approach, although it is common in sectors such as electronics or textiles.
As an initial approach, the NSRI has its limitations. Perhaps the most significant is the lack of consistent and interoperable data on soil nutrient dynamics resulting from bio-based fertilization. Another limitation lies in its inherent simplification. Nonetheless, this simplicity can also be viewed as an advantage, facilitating its integration into corporate management and serving as an entry point for the development of more precise and comprehensive schemes.

3.5. Product Circularity Dashboard

Having applied the BIORADAR product circularity monitoring framework to five bio-based fertilizers, and after discussing the results, strengths, and limitations of each of the indicators, it is possible to summarize the results in a product circularity dashboard, as shown in Figure 7.
The product circularity dashboard provides a comprehensive overview of the circularity performance of the studied products across the four indicators. This visual tool allows for the classification of the bio-based fertilizers into the following three groups:
(1)
Those exhibiting a higher level of circularity based on the three indicators with available data—algae biomass and spent mushroom substrate.
(2)
Those with an intermediate level—feather meal and compost.
(3)
The product with the lowest circularity score—wood vinegar—primarily due to its performance in the NSRI indicator.
The most significant differences among the products can be observed in the CIN. While all products originate from bio-based materials and require minimal—or no—non-renewable inputs, what truly differentiates them is the efficiency of their manufacturing processes in terms of nutrient recovery. According to the CIN results, algae biomass retains all its nutrients, as none are separated during processing. In contrast, spent mushroom substrate undergoes two composting phases and mushroom cultivation, which result in the loss of approximately half of the original nutrient content. Feather meal is subjected to extensive hydrolysis and chemical transformations, while compost involves multiple pretreatment steps, including anaerobic digestion, prior to the final composting stage. In this context, the CIN effectively reflects the core circular economy principle of “doing more with less”.
This article demonstrates how the BIORADAR product circularity monitoring framework enables the evaluation of multiple dimensions of circularity. Its streamlined structure—aligned with recent developments in CE indicators, such as those proposed by Lokesh et al. [73]—makes it suitable for business adoption without imposing excessive burdens related to data collection and processing.
This study represents the first validation of this specific set of indicators for bio-based fertilizers, applied to 20 scenarios across five distinct bio-based fertilizers. It opens avenues for further research, particularly in validating the framework with a broader range of bio-based fertilizers, exploring data from various sources, and testing its applicability within the operational context of fertilizer-producing companies.

3.6. Benchmark Against Other CE Assessment Tools

To better position the BIORADAR product circularity monitoring framework within the broader landscape of CE indicators, a qualitative benchmarking exercise was carried out based on the criteria outlined in Section 2.5. The specific scores assigned to each framework in the evaluated criteria are provided in the Supplementary Material (Table S5).
The overall benchmarking results are presented in Figure 8. It is worth noting that the MCI and the PCI are individual indicators rather than frameworks. Nevertheless, they were included in the benchmark due to their widespread adoption and relatively high level of comprehensiveness. The BIORADAR framework stands out in terms of life-cycle stage coverage, specificity for bio-based products, and interpretability of results. The CTI obtained the second-highest score, primarily due to its alignment with circular economy principles and its consideration of bio-based product characteristics, despite not being designed specifically for them.
The benchmarking exercise reveals that the various circularity assessment frameworks emphasize different aspects of circularity and address them at varying levels of depth. These differences are linked to the underlying intentions of each framework’s developers, as well as the conceptual approaches they adopted.
All the evaluated frameworks were designed for business and managerial applications, which explains their high scores in terms of result interpretability and manageable data complexity. As a result, the main competitive differences among the frameworks are concentrated in their technical dimensions.
The BIORADAR framework stands out due to its incorporation of the regeneration dimension and the explicit inclusion of the use phase—particularly through the assessment of nutrient return to soil following fertilizer application.
It is also worth noting that the CTI performed well, partly due to its inclusion of aspects such as hazardous substances, environmental protection, and economic viability, as detailed in the Supplementary Material (Table S5).

3.7. Guiding Circular Strategies: Design, Certification, and Policy

The framework applied in this study is intended to foster circular product management at the firm level. Some companies have already introduced certain practices to manage their circular practices and leverage the communication thereof.
When a company decisively undertakes efforts to make its products and services more sustainable and circular, it can be exposed to the market failure of asymmetric information: customers may not know or understand what the company has achieved and why it represents an advantage.
There, certifications and labels appear as a solution to overcome the asymmetric information problem. Through certifications and labels, the companies can effectively convey to their customers and stakeholders that they have engaged in significant efforts for increasing circularity and reducing environmental impacts, and such efforts have been verified by a third party.
At the time of writing, the only seal specifically dedicated to the circular economy is Cradle to Cradle, although no bio-based fertilizer has yet obtained this certification. Other seals focus on various aspects, such as Italy’s CIC quality seal for compost [74,75], the UK’s biofertilizer certification scheme [76], the USA’s USDA Certified Biobased Product label [77], and over 230 technical standards (ISO, EN, and UNI) mapped by BIORADAR [78]. However, none of these specifically emphasize the circularity of bio-based fertilizers.
A recent addition to the circular economy standardization landscape is ISO 59020 [60], along with a series of forthcoming documents being developed by the ISO’s technical committee ISO/TC 323 “Circular Economy”. The BIORADAR product circularity monitoring framework, together with this manuscript, offers significant insights and validation of circular bioeconomy indicators applicable to the fertilizer sector. This work lays the ground for further development and the integration of such metrics into standardized norms and certifications.
The same holds true from the perspective of eco-design. As discussed above for each of the four indicators, all enable companies to identify opportunities to advance their circularity levels. Consequently, the monitoring framework can serve as a compass for making strategic and eco-design decisions regarding manufacturing processes, suppliers, and waste management, ultimately leading to higher circularity.
Similarly, policymaking processes can leverage the results of the monitoring framework to identify patterns and opportunities when it is widely applied. Such actions may include subsidy schemes, target setting, and incorporation into sustainable finance criteria, such as the EU taxonomy [79].

4. Conclusions

As a result of the application of the BIORADAR’s product circularity monitoring framework, its usability has been verified. Despite the limitations, the four-indicator framework applied to fertilizers allows us to set out a first approach to bio-based product CBE monitoring. This opens the door to including such CBE assessments within product management processes within industry or policymaking managerial settings.
The framework has, however, some limitations that need further development. A couple of examples of this are the circular index’s variables, which were not possible to include in the assessment for bio-based fertilizers (such as the conventional product lifetime variable), and the reduced data availability for nutrient release timeframes.
This manuscript presents a novel approach to further anchor the circular economy within bio-based industries by placing the spotlight on products. To the best of the authors’ knowledge, this is the first publication to validate a circularity indicator framework specifically tailored for bio-based fertilizers. As such, the BIORADAR product circularity framework contributes to shifting the conventional perception that all bio-based products are inherently circular and opens avenues for continuous improvement.
The primary function of the framework is to provide decision-makers with a systematic scheme to assess their products and to support informed eco-design and innovation decisions. Additionally, the framework can inform public policy processes by guiding target setting and identifying areas in need of further research and investment.
Moreover, the limitations identified throughout the study highlight the need for further research in several areas: expanding datasets on soil relative nutrient content to include a wider range of bio- and fossil-based fertilizers, soil types, and climate conditions; finding an appropriate balance between modeling complex soil dynamics and health metrics while keeping the framework simple and practical for businesses; applying the framework to other sectors; and exploring how circular business models may influence the results of each indicator. This opens the possibility of enhancing circularity not only through changes in manufacturing and material flows but also through shifts in stakeholder behavior.

Supplementary Materials

The following supporting information can be downloaded at https://www.mdpi.com/article/10.3390/app15147701/s1: Table S1: Disaggregation of relevant datapoints for the calculation of the indicators of the BIORADAR’s product circularity monitoring framework. Table S2: Anonymized life cycle inventory from which data for microalgae from wastewater with CO2 and polyelectrolyte addition was sourced. Table S3: Anonymized life cycle inventory from which data for microalgae from biowaste was sourced. Table S4: Uncertainties associated with the indicator calculations. Table S5: Benchmarking of the BIORADAR circularity monitoring framework against other CE frameworks, and Equations (S1)–(S10) with the formulas for calculating the propagation of uncertainty.

Author Contributions

Conceptualization, H.I., D.F.-G. and A.J.L.-G.; formal analysis, H.I.; investigation, H.I. and A.P.O.; methodology, H.I. and A.P.O.; project administration, D.F.-G. and A.J.L.-G.; supervision, Á.P., D.F.-G. and A.J.L.-G.; visualization, H.I.; writing—original draft, H.I.; writing—review and editing, Á.P., D.F.-G. and A.J.L.-G. All authors have read and agreed to the published version of the manuscript.

Funding

This research has received funding from the Circular Bio-based Europe Joint Undertaking (CBE JU) under the European Union’s Horizon Europe research and innovation program under grant agreement No. 101112457 (Monitoring system of the environmental and social sustainability and circularity of industrial bio-based systems). The content of this publication reflects only the author’s view, and the CBE JU and the European Commission are not responsible for any use that may be made of the information it contains.

Institutional Review Board Statement

Not applicable.

Informed Consent Statement

Not applicable.

Data Availability Statement

The original contributions presented in this study are included in the article/Supplementary Material. Further inquiries can be directed at the corresponding authors.

Acknowledgments

The authors wish to acknowledge the members of the BIORADAR project, whose contributions have supported the overarching research framework in which this manuscript is embedded: Yaghma BV, Hochschule für angewandte Wissenschaften Hamburg, Iris Technology Solutions SL, Next Technology Tecnotessile RL, Kneia SL, and UNI—Ente Italiano di Normazione.

Conflicts of Interest

The authors declare no conflicts of interest. The funders had no role in the design of the study; in the collection, analyses, or interpretation of data; in the writing of the manuscript; or in the decision to publish the results.

Abbreviations

The following abbreviations are used in this manuscript:
BCBiodegradable content
CBECircular bioeconomy
CECircular economy
CICircular index
CINCircular indicator of nutrient
ECFElectric conversion factor
EUEuropean Union
GCVGross calorific value
LCALife cycle assessment
LCILife cycle inventory
LCSALife cycle sustainability assessment
MWHCSoil maximum water holding capacity
NCGNon-condensable gases
NSRINutrient slow-release index
PVPhotovoltaic

Glossary

Non-renewablenature of a material whose extraction from the environment occurs at a greater rate than its regeneration (e.g., oil, gas, gypsum, lime, etc.). Within the scope of this manuscript, it also describes an intermediate product coming from raw non-renewable materials (e.g., synthetic chemicals).
Recycledstate of a material or substance that, after one or several uses, undergoes a transformation process either to be reintroduced in a productive process or to a new use stage (e.g., regenerated water, chipped wood, etc.).
Recycled energya form of energy that, being contained in an energy carrier (e.g., steam), undergoes a conversion into a different form of energy (e.g., electricity).
Renewablenature of a material whose natural replenishment rate is greater than that of its consumption or extraction (e.g., water, atmospheric nitrogen and carbon dioxide, plants and vegetables, etc.).
Reusedstate of a material or substance that, after at least one use, is directly reincorporated in a productive process or to a different use stage, without undergoing any transformation that modifies its characteristics (e.g., waste streams such as feathers, wheat straw, wood biomass, manure, food waste, etc.).
Reused/Recovered energyenergy embedded in materials that is recovered through valorization processes (e.g., electricity production through burning biogas obtained from the anaerobic digestion of organic waste).
Virgincharacteristic of a material that has not been used previously, regardless of it being renewable or non-renewable.

References

  1. Johnson, K. Strenghtening Sustainability in the Fertilizer Industry; International Financial Corporation: Washington, DC, USA, 2023. [Google Scholar]
  2. European Commission. Directorate General for Research and Innovation. In Innovating for Sustainable Growth: A Bioeconomy for Europe; LU Publications Office: Luxembourg, 2012. [Google Scholar]
  3. European Commission. Communication from the Commission to the European Parliament, the European Council, the Council, the European Economic and Social Committee and the Committee of Regions: A Competitiveness Compass for the EU; European Commission: Brussels, Belgium, 2025. [Google Scholar]
  4. Stegmann, P.; Londo, M.; Junginger, M. The circular bioeconomy: Its elements and role in European bioeconomy clusters. Resources. Conserv. Recycl. X 2020, 6, 100029. [Google Scholar] [CrossRef]
  5. Draghi, M. A Competitiveness Strategy for Europe; European Commission: Brussels, Belgium, 2024. [Google Scholar]
  6. European Commission. Communication from the Commission to the European Parliament, the Council, the European Economic and Social Committee and the Committee of the Regions: The Clean Industrial Deal: A Joint Roadmap for Competitiveness and Decarbonization; European Commission: Brussels, Belgium, 2025. [Google Scholar]
  7. Ronzon, T.; Piotrowski, S.; M’Barek, R.; Carus, M. A systematic approach to understanding and quantifying the EU’s bioeconomy. Bio Based Appl. Econ. 2017, 6, 1–17. [Google Scholar] [CrossRef]
  8. The World Bank. Squaring the Circle: Policies from Europe’s Circular Economy Transition; The World Bank: Washington, DC, USA, 2022. [Google Scholar]
  9. Fernández-Gutiérrez, D.; Argüelles, A.; Castejón Martínez, G.; Soriano Disla, J.M.; Lara-Guillén, A.J. Unlocking New Value from Urban Biowaste: LCA of the VALUEWASTE Biobased Products. Sustainability 2022, 14, 14962. [Google Scholar] [CrossRef]
  10. Chojnacka, K.; Moustakas, K.; Witek-Krowiak, A. Bio-based fertilizers: A practical approach towards circular economy. Bioresour. Technol. 2020, 295, 122223. [Google Scholar] [CrossRef]
  11. Breure, A.M.; Lijzen, J.P.A.; Maring, L. Soil and land management in a circular economy. Sci. Total Environ. 2018, 622–623, 1125–1130. [Google Scholar] [CrossRef]
  12. Smol, M.; Marcinek, P.; Andrunik, M.; Szołdrowska, D. Report on Drivers and Barriers Regarding the Replacement of Conventional Fertilisers by Bio-Based Fertilisers (BBFs) for All Stakeholders in the Value Chain; LEX4BIO Project; European Commission: Brussels, Belgium, 2023. [Google Scholar]
  13. Rotmans, J.; Loorbach, D.; Kemp, R. Transition Management: Origin, Evolution, Critique; Erasmus Research Institute of Management: Berlin, Germany, 2007. [Google Scholar]
  14. Howard, M.; Hopkinson, P.; Miemczyk, J. The regenerative supply chain: A framework for developing circular economy indicators. Int. J. Prod. Res. 2019, 57, 7300–7318. [Google Scholar] [CrossRef]
  15. Ellen MacArthur Foundation. Towards a Circular Economy: Business Rationale for an Accelerated Transition; Ellen MacArthur Foundation: Isle of Wight, UK, 2013. [Google Scholar]
  16. Skene, K.R.; Oarga-Mulec, A. The Circular Economy: The Butterfly Diagram, Systems Theory and the Economic Pluriverse. J. Circ. Econ. 2024, 2, 1–25. [Google Scholar] [CrossRef]
  17. Vural Gursel, I.; Elbersen, B.; Meesters, K.P.H.; Van Leeuwen, M. Defining Circular Economy Principles for Biobased Products. Sustainability 2022, 14, 12780. [Google Scholar] [CrossRef]
  18. Vural Gursel, I.; Elbersen, B.; Meesters, K.P.H. Monitoring circular biobased economy—Systematic review of circularity indicators at the micro level. Resour. Conserv. Recycl. 2023, 197, 107104. [Google Scholar] [CrossRef]
  19. Toivanen, I. Application of Circularity Indicators to Bio-Based Products—Testing the New ISO 59020 Framework on Product Level in a Case Study; Aalto University: Espoo, Finland, 2024. [Google Scholar]
  20. Navare, K.; Muys, B.; Vrancken, K.C.; Van Acker, K. Circular economy monitoring—How to make it apt for biological cycles? Resources. Conserv. Recycl. 2021, 170, 105563. [Google Scholar] [CrossRef]
  21. Cámara, M.; Iglesias, H.; Paredes, A. D2.1 Report on Identification of Circularity Indicators Methodologies for Industrial Bio-Based Systems; BIORADAR; Biorefine Cluster of European: Ghent, Belgium, 2024. [Google Scholar]
  22. Enel. Circulability Model. Methodological Approach; Enel: Rome, Italy, 2018. [Google Scholar]
  23. Cobo, S.; Levis, J.W.; Dominguez-Ramos, A.; Irabien, A. Economics of Enhancing Nutrient Circularity in an Organic Waste Valorization System. Enviromn. Sci. Technol. 2019, 53, 6123–6132. [Google Scholar] [CrossRef] [PubMed]
  24. Iglesias, H.; Paredes Ortiz, A. D2.2. Report on Evaluation of Existing/New Metrics on Circularity for Industrial Bio-Based Systems and Propositions of New Indicators; BIORADAR; Biorefine Cluster Of European: Ghent, Belgium, 2025. [Google Scholar]
  25. Blasco-Lavilla, N.; Fernández-Gutiérrez, D. D1.1. Report on Identification of Bio Industrial Bio-Based Value Systems for Project Analysis; BIORADAR; Biorefine Cluster Of European: Ghent, Belgium, 2023. [Google Scholar]
  26. DREVEN. Life Cycle Inventories of Feather Meal Produced and Used as Circular Fertiliser in Three European Regions; Zenodo: Geneve, Switzerland, 2025. [Google Scholar] [CrossRef]
  27. CETENMA. Life Cycle Inventories of Compost Produced and Used as Circular Fertiliser in Three European Regions; Zenodo: Geneve, Switzerland, 2025. [Google Scholar] [CrossRef]
  28. CETENMA. Life Cycle Inventories of Spent Mushroom Substrate Produced and Used as Circular Fertiliser in Three European Regions; Zenodo: Geneve, Switzerland, 2024. [Google Scholar] [CrossRef]
  29. Brassard, P.; Godbout, S.; Palacios, J.H.; Le Roux, É.; Alvarez-Chavez, B.J.; Raghavan, V.; Hamelin, L. Bio-based products from woody biomass pyrolysis for a sustainable bioeconomy. In Proceedings of the 27th European Biomass Conference (EUBCE)-Setting the Course for a Biobased Economy, Lisbon, Portugal, 27–30 May 2019; pp. 1234–1240. [Google Scholar]
  30. Brassard, P.; Godbout, S.; Hamelin, L. Framework for consequential life cycle assessment of pyrolysis biorefineries: A case study for the conversion of primary forestry residues. Renew. Sustain. Energy Rev. 2021, 138, 110549. [Google Scholar] [CrossRef]
  31. Pérez Riesgo, L. Valorización de Residuos Biomásicos de Poda Forestal en Energía y Medio Ambiente. Master’s Thesis, Universidad de Oviedo, Asturias, Spain, 2016. [Google Scholar]
  32. Gholizadeh, M.; Hu, X.; Liu, Q. A mini review of the specialties of the bio-oils produced from pyrolysis of 20 different biomasses. Renew. Sustain. Energy Rev. 2019, 114, 109313. [Google Scholar] [CrossRef]
  33. Amutio, M.; Lopez, G.; Alvarez, J.; Olazar, M.; Bilbao, J. Fast pyrolysis of eucalyptus waste in a conical spouted bed reactor. Bioresour. Technol. 2015, 194, 225–232. [Google Scholar] [CrossRef]
  34. Velázquez Martí, B.; Gaibor-Chávez, J.; Franco Rodríguez, J.E.; López Cortés, I. Biomass Identification from Proximate Analysis: Characterization of Residual Vegetable Materials in Andean Areas. Agronomy 2023, 13, 2347. [Google Scholar] [CrossRef]
  35. Theapparat, Y.; Chandumpai, A.; Faroongsarng, D. Physicochemistry and Utilization of Wood Vinegar from Carbonization of Tropical Biomass Waste. In Tropical Forests—New Edition; Sudarshana, P., Nageswara-Rao, M., Soneji, J.R., Eds.; InTech: Rijeka, Croatia, 2018. [Google Scholar] [CrossRef]
  36. Castro, J.S.; Ferreira, J.; Magalhães, I.B.; Jesus Junior, M.M.; Marangon, B.B.; Pereira, A.S.A.P.; Lorentz, J.F.; Gama, R.C.N.; Rodrigues, F.A.; Calijuri, M.L. Life cycle assessment and techno-economic analysis for biofuel and biofertilizer recovery as by-products from microalgae. Renew. Sustain. Energy Rev. 2023, 187, 113781. [Google Scholar] [CrossRef]
  37. Arashiro, L.T.; Montero, N.; Ferrer, I.; Acién, F.G.; Gómez, C.; Garfí, M. Life cycle assessment of high rate algal ponds for wastewater treatment and resource recovery. Sci. Total Environ. 2018, 622, 1118–1130. [Google Scholar] [CrossRef]
  38. Hasler, K. Environmental Impact of Mineral Fertilizers: Possible Improvements Through the Adoption of Eco-Innovations; Wageningen University: Wageningen, The Netherlands, 2017. [Google Scholar] [CrossRef]
  39. Fitriyanto, N.A.; Ramadhanti, Y.; Rismiyati Rusyadi, I.; Pertiwiningrum, A.; Prasetyo, R.; Erwanto, Y. Production of poultry feather hydrolysate using HCl and NaOH as a growth medium substrate for indigenous strains. In Proceedings of the IOP Conference Series: Earth and Environmental Science, Banda Aceh, Indonesia, 13–14 October 2021; IOP Publishing: Bristol, England, 2022; Volume 951, p. 012064. [Google Scholar] [CrossRef]
  40. Vavrova, K.; Wimmerova, L.; Knapek, J.; Weger, J.; Keken, Z.; Kastanek, F.; Solcova, O. Waste Feathers Processing to Liquid Fertilizers for Sustainable Agriculture—LCA, Economic Evaluation, and Case Study. Processes 2022, 10, 2478. [Google Scholar] [CrossRef]
  41. Sobucki, L.; Ramos, R.F.; Gubiani, E.; Brunetto, G.; Kaiser, D.R.; Daroit, D.J. Feather hydrolysate as a promising nitrogen-rich fertilizer for greenhouse lettuce cultivation. Int. J. Recycl. Org. Waste Agric. 2019, 8, 493–499. [Google Scholar] [CrossRef]
  42. Niedziński, T.; Sierra, M.J.; Łabętowicz, J.; Noras, K.; Cabrales, C.; Millán, R. Release of Nitrogen from Granulate Mineral and Organic Fertilizers and Its Effect on Selected Chemical Parameters of Soil. Agronomy 2021, 11, 1981. [Google Scholar] [CrossRef]
  43. Weidema, B.P.; Wesnæs, M.S. Data quality management for life cycle inventories—An example of using data quality indicators. J. Clean. Prod. 1996, 4, 167–174. [Google Scholar] [CrossRef]
  44. CETAQUA. D2.1 Report on Data Collection; FER-PLAY: Santiago de Compostela, Spain, 2024. [Google Scholar]
  45. Zampori, L.; Pant, R. Suggestions for Updating the Product Environmental Footprint (PEF) Method; European Commission, Ed.; Publications Office: Luxembourg, 2019. [Google Scholar] [CrossRef]
  46. Eurostat. Coal (Solid Fossil Fuels and Manufactured Gases) Annual Questionnaire; Eurostat: Luxembourg, 2014. [Google Scholar]
  47. The Engineering Toolbox. Gases—Gross and Net Heat Values 2003. Available online: https://www.engineeringtoolbox.com/gross-net-heating-values-d_420.html (accessed on 6 November 2024).
  48. Foro Nuclear. ¿Cuánta energía en kWh se Extrae de un kg de Uranio y qué Rendimiento tiene cada kilo? Available online: https://www.foronuclear.org/descubre-la-energia-nuclear/preguntas-y-respuestas/sobre-combustible-nuclear/cuanta-energia-en-kwh-se-extrae-de-un-kilo-de-uranio-y-que-rendimiento-tiene-cada-kilo/ (accessed on 6 November 2024).
  49. The Engineering Toolbox. Fossil vs. Alternative Fuels-Energy Content 2008. Available online: https://www.engineeringtoolbox.com/fossil-fuels-energy-content-d_1298.html (accessed on 6 November 2024).
  50. Qin, Y. Characterizing Uncertainties in Life Cycle Assessment; University of California: Berkeley, CA, USA, 2019. [Google Scholar]
  51. Kupfer, T.; Baitz, M.; Colodel, C.M.; Kokborg, M.; Schöll, S.; Rudolf, M.; Thellier, L.; Gonzalez, M.; Schuller, O.; Hengstler, J.; et al. GaBi Database & Modelling Principles 2012; PE International AG: Leinfelden, Germany, 2012. [Google Scholar]
  52. Lopez Choque, M.A.; Lopez Mamani, M.A.; Yujra Ticona, E. Evaluación de los parámetros de calidad para la determinación de nitrógeno total en suelos. RIIARn 2023, 10, 37–43. [Google Scholar] [CrossRef]
  53. Vano, H.K.; Jiménez, Y.; de Núñez, M.G. Estimación de la incertidumbre de la medición para la determinación de proteínas en alimentos por el método de Kjeldahl. Rev. Ing. UC 2011, 18, 28–37. [Google Scholar]
  54. Hughes, I.; Hase, T.P.A. Measurements and Their Uncertainties: A Practical Guide to Modern Error Analysis; Oxford University Press: Oxford, UK, 2010. [Google Scholar]
  55. Fantner, G. A Brief Introduction to Error Analysis and Propagation. 2013. Available online: https://www.epfl.ch/labs/lben/wp-content/uploads/2018/07/Error-Propagation_2013.pdf (accessed on 24 June 2025).
  56. GHG Protocol. GHG Protocol Guidance on Uncertainty Assessment in GHG Inventories and Calculating Statistical Parameter Uncertainty. 2023. Available online: https://ghgprotocol.org/sites/default/files/2023-03/ghg-uncertainty.pdf (accessed on 2 July 2025).
  57. Ellen MacArthur Foundation. Material Circularity Indicator (MCI). Ellen MacArthur Foundation 2015. Available online: https://www.ellenmacarthurfoundation.org/material-circularity-indicator (accessed on 27 June 2025).
  58. World Business Council for Sustainable Development. Circular Transition Indicators v4.0. World Business Council for Sustainable Development 2023. Available online: https://www.wbcsd.org/resources/circular-transition-indicators-v4/ (accessed on 27 June 2025).
  59. Bracquené, E.; Dewulf, W.; Duflou, J.R. Measuring the performance of more circular complex product supply chains. Resource. Conserv. Recycl. 2020, 154, 104608. [Google Scholar] [CrossRef]
  60. ISO 59020:2024; Circular Economy—Measuring and Assessing Circularity Performance. International Standardization Organization (ISO): Geneva, Switzerland, 2024.
  61. UNE-EN 15804:2012; Sustainability of construction works. Environmental product declarations. Core rules for the product category of construction products. Asociación Española de Normalización (UNE): Madrid, Spain, 2021.
  62. Priya, A.K.; Alagumalai, A.; Balaji, D.; Song, H. Bio-based agricultural products: A sustainable alternative to agrochemicals for promoting a circular economy. RSC Sustain. 2023, 1, 746–762. [Google Scholar] [CrossRef]
  63. Muñoz, M.P.; Serra, A.; Rogozinski, A. Cómo la bioeconomía circular es una solución integral para cuidar la casa en común. Rev. Fe Y Lib. 2021, 4, 141–170. [Google Scholar] [CrossRef]
  64. EN 13432:2001; Requirements for Packaging Recoverable Through Composting and Biodegradation—Test Scheme and Evaluation Criteria for the Final Acceptance of Packaging. European Committee for Standardization: Brussels, Belgium, 2001.
  65. European Commission. Waste Framework Directive n.d. Available online: https://environment.ec.europa.eu/topics/waste-and-recycling/waste-framework-directive_en (accessed on 6 May 2025).
  66. Rafique, M.I.; Al-Wabel, M.I.; Al-Farraj, A.S.F.; Ahmad, M.; Aouak, T.; Al-Swadi, H.A.; Mousa, M.A. Incorporation of biochar and semi-interpenetrating biopolymer to synthesize new slow release fertilizers and their impact on soil moisture and nutrients availability. Sci. Rep. 2025, 15, 9563. [Google Scholar] [CrossRef]
  67. Daza, M.C.; Díaz, J.; Aguirre, E.; Urrutia, N. Efecto de abonos de liberación lenta en la lixiviación de nitratos y nutrición nitrogenada en estevia. Rev. Colomb. Cienc. Hortic. 2015, 9, 112. [Google Scholar] [CrossRef]
  68. Antwi, R.A.; Chappell, C.; Twumasi, Y.A.; Anning, D.K.; Oppong, J.; Annan, J.B.; Ahoma, G.; Atayi, J.; Ferchaud, V. Fertility and management strategies of soils in rural and urban forest ecosystems: A review of selected rural and urban forests in Ghana and USA. Geol. Ecol. Landsc. 2024, 1–12. [Google Scholar] [CrossRef]
  69. Gong, H.; Yin, Y.; Chen, Z.; Zhang, Q.; Tian, X.; Wang, Z.; Wang, Y.; Cui, Z. A dynamic optimization of soil phosphorus status approach could reduce phosphorus fertilizer use by half in China. Nat. Commun. 2025, 16, 976. [Google Scholar] [CrossRef]
  70. Ding, X.-H.; Luo, B.; Zhou, H.-T.; Chen, Y.-H. Generalized solutions for advection–dispersion transport equations subject to time- and space-dependent internal and boundary sources. Comput. Geotech. 2025, 178, 106944. [Google Scholar] [CrossRef]
  71. Harder, R.; Giampietro, M.; Smukler, S. Towards a circular nutrient economy. A novel way to analyze the circularity of nutrient flows in food systems. Resources. Conserv. Recycl. 2021, 172, 105693. [Google Scholar] [CrossRef]
  72. Valve, H.; Ekholm, P.; Luostarinen, S. 27. The circular nutrient economy: Needs and potentials of nutrient recycling. In Handbook of the Circular Economy; Brandão, M., Lazarevic, D., Finnveden, G., Eds.; Edward Elgar Publishing: Cheltenham, UK, 2020; p. 358. [Google Scholar]
  73. Lokesh, K.; Matharu, A.S.; Kookos, I.K.; Ladakis, D.; Koutinas, A.; Morone, P.; Clark, J. Hybridised sustainability metrics for use in life cycle assessment of bio-based products: Resource efficiency and circularity. Green. Chem. 2020, 22, 803–813. [Google Scholar] [CrossRef]
  74. Confalonieri, A.; Campagnol, J.; Brambilla, V.; Centemero, M. Twelve years of quality assurance system on compost in Italy. Procedia Environmental Science. Eng. Manag. 2016, 3, 33–39. [Google Scholar]
  75. Centemero, M.; Zanardi, W. The Voluntary Certification Processes About the Compost and the Compostable Products in Italy. In Compost and Digestate: Sustainability, Benefits, Impacts for the Environment and for Plant Production, Proceedings of the International Congress CODIS 2008, Solothurn, Switzerland, 27–29 February 2008. [Google Scholar]
  76. Renewable Energy Assurance Ltd. Biofertiliser Certification Scheme. Biofertiliser Certification Scheme. 2025. Available online: https://www.biofertiliser.org.uk/ (accessed on 1 July 2025).
  77. United States Department of Agriculture. Voluntary Labeling Initiative n.d. Available online: https://www.biopreferred.gov/BioPreferred/faces/pages/AboutLabel.xhtml (accessed on 1 July 2025).
  78. BIORADAR. A Dynamic Database of Standards for the Bioeconomy. BIORADAR 2025. Available online: https://www.bioradar.org/bioeconomy-standards-database (accessed on 1 July 2025).
  79. Regulation (EU) 2020/852 of the European Parliament and of the Council of 18 June 2020 on the Establishment of a Framework to Facilitate Sustainable Investment, and Amending Regulation (EU) 2019/2088; Official Journal of European Union: Luxembourg, 2020.
Figure 1. Indicator screening methodology followed by Cámara et al. [21].
Applsci 15 07701 g001
Figure 2. Calculation process of the electric conversion factor used for obtaining the CI. Adapted from Enel [22].
Applsci 15 07701 g002
Figure 3. Results for circular index for the five bio-based products and their average.
Applsci 15 07701 g003
Figure 4. Results for biodegradable content for the five bio-based products and their average.
Applsci 15 07701 g004
Figure 5. Results for circularity indicator of nutrient for the five bio-based products and their average.
Applsci 15 07701 g005
Figure 6. Comparison of the spent mushroom substrate and turkey manure based on the nutrient slow-release index.
Applsci 15 07701 g006
Figure 7. Product circularity dashboard. N/A: Not available.
Applsci 15 07701 g007
Figure 8. Benchmarking of the BIORADAR circularity monitoring framework and other CE assessment tools.
Applsci 15 07701 g008
Table 1. Datapoints sourced from life cycle inventories to be used within the circular economy indicator calculations.
IndicatorDatapointData Source
Circular IndexRCni: Amount of recycled material entering as input to the system (kg).LCI: Material inputs coming from waste streams that were subjected to some type of intermediate transformation (e.g., woodchips, treated wastewater, etc.).
RUi: Amount of reused material entering as input to the system (kg).LCI: Material inputs from waste streams that enter the production system directly, without undergoing any additional processing (e.g., wood residues, raw feathers, manure, wheat straw, organic waste, etc.).
RES: Amount of materials coming from renewable sources (kg).LCI: Material inputs coming directly from virgin renewable sources (e.g., water, atmospheric nitrogen, mycelium, etc.).
V: Amount of virgin materials coming from non-renewable sources (kg).LCI: Material inputs, including raw non-renewable materials, as well as chemicals and synthetic substances (e.g., H2O2, NaOH, Fe(OH)3, gypsum, lime, peat, etc.).
RCno: Amount of materials sent to recycling coming from the manufacturing process (kg).LCI: Material outputs directed to recycling facilities after the manufacturing process (e.g., ferrous metals, wastewater, etc.).
Ruo: Amount of materials reused coming from the manufacturing process (kg).LCI: Material outputs, by-products, or waste streams that can be directly used in another system without undergoing any additional processing (e.g., biochar, biocrude oil, etc.).
O: Mass of the final product (kg) (reference unit).LCI: Reference flow, linked to the functional unit.
Wo: Amount of material sent to landfill or incineration after the production process of the target product (kg).LCI: Material outputs directed to final waste disposal facilities (i.e., landfill or incineration).
RES_Ener: Energy coming from renewable sources consumed in the production process of the product, converted to material equivalent (kg).LCI: Energy inputs, specifically coming from renewable sources, or allocated according to the country-specific energy matrix. The energy consumption (kWh) obtained from the LCI is subsequently converted to material equivalent as detailed below.
RUi_Ener: Recovered energy consumed in the production process of the product, converted to material equivalent (kg).LCI: Energy inputs derived from the embedded energy in materials, for example, through processes like anaerobic digestion or incineration. The LCI provides the energy consumption data (in kWh), which can then be converted into material equivalents.
V_Ener: Energy coming from non-renewable sources consumed in the production process of the product, converted to material equivalent (kg).LCI: Energy inputs, specifically coming from non-renewable sources, or allocated according to the country-specific energy matrix. The energy consumption (kWh) obtained from the LCI is subsequently converted to material equivalent.
RCi_Ener: Recycled energy consumed in the production process of the product, converted to material equivalent (kg).LCI: Energy inputs in the form of electricity generated from other energy carriers (e.g., from thermal energy stored in steam). In this case as well, the LCI provides electricity consumption data (in kWh), which is converted into material equivalent.
Biodegradable contentBm: Mass of biodegradable materials contained in the final product (kg).LCI: Product characteristics and/or component-wise mass balance, considering only materials whose biodegradability complies with relevant regulations.
Tm: Total mass of the product (equivalent to “O” in Circular Index”) (kg).LCI: Reference flow, linked to the functional unit.
Circularity indicator of nutrientWi: Amount of target nutrient (N, P, or K) in the key raw material of the fertilizer production process (kg).LCI: Raw material characteristics and/or component-wise mass balance.
Rijk: Amount of target nutrient (N, P, or K) that enters the transformation process (kg).LCI: Component-wise mass balance, accounting for losses occurring during pre-treatments.
η: Efficiency of the nutrient recovery process (%).LCI: Product characteristics and/or component-wise mass balance, specifically by accounting for the amount of target nutrient contained in the final product and that entering the transformation process.
Nutrient slow-release indexRCsynthetic: Relative content of nitrogen in soil after X days of application of synthetic fertilizer (%).Soil relative nutrient content, reported by Niedzinski et al. [42].
RCbio-based: Relative content of nitrogen in soil after X days of application of bio-based fertilizer (%).Soil relative nutrient content, reported by Niedzinski et al. [42].
X: Number of days after the application of the fertilizer (days).Linked to the characteristics of the study. For this assessment, the timeframe of 35 days was selected.
Table 2. Characterization of the different scenarios considered for the calculation of the circularity indicators.
ProductScenarioSystem DescriptionSource
Algae biomass1Microalgae from wastewater with CO2 injection[36]
2Microalgae from wastewater with CO2 injection and polyelectrolyte additionConfidential industry data. Anonymized life cycle inventory is available in the Supplementary Material (Table S2).
3Microalgae from wastewater with organic flocculant[37]
4Microalgae from biowasteConfidential industry data. Anonymized life cycle inventory is available in the Supplementary Material (Table S3).
Compost1Food and green waste anaerobic digestion and composting in Mediterranean Europe, with grid electricity[27]
2Food and green waste anaerobic digestion and composting in Mediterranean Europe, with in situ electricity production from biogas
3Food and green waste anaerobic digestion and composting in central Europe, with grid electricity
4Food and green waste anaerobic digestion and composting in central Europe, with in situ electricity production from biogas
5Food and green waste anaerobic digestion and composting in northern Europe, with grid electricity
6Food and green waste anaerobic digestion and composting in northern Europe, with in situ electricity production from biogas
Feather meal1Feather meal production, from unspecified poultry[26]
2Feather meal production, from goose feathers[26,38,39,40]
3Feather meal production, from chicken layer feathers[26,38,39,41]
Wood vinegar1Wood vinegar from unspecified wood biomass. Wood dust used to produce heat. Co-products (NCG, biocrude oil and biochar) are outputs[29,30]
2Wood vinegar from unspecified wood biomass. Wood dust disposed of as waste. Co-products (NCG, biocrude oil and biochar) are outputs
3Wood vinegar from unspecified wood biomass. Wood dust, NCG and biocrude oil are used to produce heat. Biochar and surplus biocrude oil are outputs
4Wood vinegar from unspecified wood biomass. Wood dust disposed of as waste. NCG and biocrude oil are used to produce heat. Biochar and surplus biocrude oil are outputs
Spent mushroom substrate1Spent mushroom substrate from agaricus bisporus, produced in Mediterranean Europe[28]
2Spent mushroom substrate from agaricus bisporus, produced in central Europe
3Spent mushroom substrate from agaricus bisporus, produced in northern Europe
NCG: Non-condensable gases.
Table 3. Gross calorific values and yield values used for obtaining the electric conversion factor for a specific country’s electricity mix.
Energy VectorGCV/Yield (GWh/kg)Source
Coal6.67 × 10−6[46]
Natural gas1.54 × 10−5[47]
Uranium0.43[48]
Petroleum naphtha1.34 × 10−5[49]
Heavy fuel oil1.16 × 10−5[49]
Table 4. Nutrient relative content after 35 days for five types of fertilizers, and total N content of each product.
TypeFertilizerSoil Relative Nutrient Content
(N)
AverageFertilizer Total N
Content (%)
30% MWHC60% MWHC
Bio-basedTurkey manure0.7980.6810.73953.86
Spent mushroom substrate0.8570.8020.82952.52
MineralUreaPhos (U-PSc)0.0200.0140.017020.81
UreaPhos (U-PSf)0.0120.0110.011520.89
Di-ammonium phosphate (DAP)0.2820.2130.247518.67
MWHC: soil maximum water holding capacity. Source: [42].
Table 5. Data accuracy rating and corresponding intervals used in the GHG protocol and adopted for this study.
Data AccuracyInterval as Percent of Mean Value
High±5%
Good±15%
Fair±30%
PoorMore than 30%
Source: [56].
Disclaimer/Publisher’s Note: The statements, opinions and data contained in all publications are solely those of the individual author(s) and contributor(s) and not of MDPI and/or the editor(s). MDPI and/or the editor(s) disclaim responsibility for any injury to people or property resulting from any ideas, methods, instructions or products referred to in the content.

