Article

Plant-Based Biosorbents for Copper(II) Removal: A Comparative Study of Biomass and Essential Oil Residues

Institute of General and Inorganic Chemistry, Bulgarian Academy of Sciences, 1113 Sofia, Bulgaria
*
Author to whom correspondence should be addressed.
Appl. Sci. 2025, 15(14), 7695; https://doi.org/10.3390/app15147695
Submission received: 9 June 2025 / Revised: 30 June 2025 / Accepted: 7 July 2025 / Published: 9 July 2025
(This article belongs to the Special Issue Advanced Adsorbents for Wastewater Treatment)

Abstract

The present study compared the adsorption properties of two plant materials and the waste products after their essential oil extraction for removing Cu(II) ions from contaminated water. Methods like SEM, XRD, nitrogen adsorption, DTA, TGA, FTIR, and XPS were used for characterization of the materials. All materials showed similar porosity and structure, favoring Cu(II) biosorption. The effects of contact time, pH, temperature, sample amount, and initial metal concentration on Cu(II) removal were examined. Optimal pH was 4, with equilibrium reached in less than 10 min. Temperature and sample amount do not significantly influence the biosorption. The experimental data were fitted to the Langmuir, Freundlich, and Dubinin–Radushkevich isotherm models, and maximum adsorption capacities were calculated. The four plant materials proved to be effective biosorbents for removing copper ions from contaminated water. Desorption experiments using 1 M HNO3 and 0.1 M EDTA showed 100% recovery. The reusability of the most effective biosorbent was confirmed through four adsorption/desorption cycles with EDTA. This material was also used to study the possibilities of purifying a real sample of contaminated water.

1. Introduction

Due to its advantageous climate and natural landscape, Bulgaria is a suitable location for the growth of many medicinal plants, including Melissa officinalis L. (lemon balm) and Lavandula angustifolia L. (lavender). Both plants belong to the Lamiaceae family. Lemon balm is native to Central Asia and Europe [1], while lavender originates from the Mediterranean region, as well as southwestern and southern Europe, including Spain, France, Italy, Croatia, etc. [2]. In Bulgaria, wild lemon balm can be found throughout many parts of the country, although it has also become a popular cultivated crop more recently [3,4]. Our country is among the leading producers of lavender and its essential oils [2,5].
Lemon balm and Lavandula species serve a variety of purposes—e.g., in the food, pharmaceutical, perfumery, and cosmetics industries, as well as in aroma- and herbal therapy and even as natural insect repellents [2,4,5,6,7].
Since ancient times, essential oils from medicinal plants have been widely used in various sectors, including medicine, wellness, beauty, and food industries [5,8]. Lemon balm and lavender essential oils are used against numerous health problems and for boosting mood and immunity [4,5,7,9].
Both lemon balm and lavender essential oils, with yields ranging from 0.01–0.47% to 0.5–9.62%, respectively, have been widely studied for their chemical composition [3,4,8]. As demand for medicinal and aromatic plants rises, so do environmental challenges linked to improper waste management. Inadequate disposal practices increase public health risks, especially for communities near open dumpsites, due to issues like spontaneous fires, toxic emissions, and diseases [10].
Standard physicochemical methods for removing metal ions from aqueous solutions have a number of disadvantages, which necessitates the search for more effective alternative methods. One of these methods is biosorption, which uses biomaterials for purification and is considered an effective, innovative, reliable, economically advantageous, and environmentally friendly method for purifying aqueous solutions from toxic metals [11].
Recently, essential oil plants have gained interest as biosorbents due to their active phytocomponents, which can bind metals [12]. Using renewable or waste materials for biosorption can be more economical than conventional cleaning methods. Essential oil production generates substantial waste, prompting studies on the biosorption potential of these residual plant materials. However, no studies have yet explored the use of lemon balm distillation waste for toxic ion removal. Lavender waste has been used for dye removal [13], while immobilized distillation wastes from Mentha arvensis L. and Mentha spicata L. have proven effective in removing metals like Cu(II), Zn(II), and Pb(II) [14,15]. Rose petal distillation waste has also been used for Cu(II) and Cr(III) removal [16]. Additionally, Nasir et al. [17] examined chemically modified rose distillation sludge for adsorption of Pb(II) and Zn(II).
Heavy metal contamination in the environment is a significant global issue due to the toxicity and long-lasting presence of these elements [12]. Copper is one of the most prevalent pollutants, often found in surface and groundwater, as well as in industrial wastewater. While copper is essential for human health, high levels can be extremely harmful, making it necessary to remove it from polluted water sources. Actually, copper is one of the most toxic metals for aquatic organisms, significantly more toxic than for mammals [18].
In the present study, two plant species, Melissa officinalis L. and Lavandula angustifolia L., denoted as MO and LA, and their waste materials remaining after essential oil extraction, denoted as M and L, respectively, were tested as biosorbents for copper(II) ions. Adsorption experiments were conducted to assess the effects of pH, contact time, initial ion concentration, sorbent amount, and temperature. The materials were characterized using various instrumental techniques such as scanning electron microscopy (SEM), X-ray diffraction (XRD), nitrogen adsorption, differential thermal analysis (DTA), and thermogravimetry (TGA), and the adsorption mechanism was studied using kinetic and adsorption models through both linear and nonlinear approaches, as well as by means of Fourier-transform infrared spectroscopy (FTIR) and X-ray photoelectron spectroscopy (XPS). Experiments with real contaminated water were conducted with the material that demonstrated the highest adsorption capacity. Desorption experiments and reusability were also performed.

2. Materials and Methods

The commercially available materials of MO and LA and the plants after essential oils extraction (M and L), delivered from the “Essential Oils and Herbs” distillery, Zhelyo Voivoda village, Sliven district, Bulgaria, were washed several times with distilled water to remove surface-adhered and water-soluble particles and dried at 60 °C in an electric oven for 48 h. Thus, prepared materials were milled in an electric grinder to a size of particles below 200 μm. No other physical or chemical treatment was performed. After adsorption of copper ions, the plant materials are denoted as MOS, MS, LAS, and LS, respectively.
The surface morphology of the biomaterials was observed by SEM on a Tescan instrument model SEM/FIB Lyra I XMU (Brno, Czech Republic).
The porous structure of the studied materials was investigated by low-temperature (–196 °C) nitrogen adsorption using a Quantachrome Nova 1200 apparatus (Boynton Beach, FL, USA) according to Ivanova et al. [12].
X-ray diffraction (XRD) patterns were obtained on a D8 Advance System from Bruker Inc. (Mannheim, Germany) using Cu Kα radiation at 40 kV and 40 mA by the wavelength of 1.5404 nm.
Moisture and ignition losses were measured by differential thermal analysis (DTA) and thermogravimetric analysis (TGA) as described by Kaur et al. [19].
For elucidation of the adsorption mechanism, FTIR and XPS investigations were carried out by means of Nicolet Avatar 360 and ESCALAB MKII spectrometers, both from Thermo Fisher Scientific (Waltham, MA, USA). Measurements were performed as reported in Ivanova et al. [20].

Adsorption Studies

The adsorption of copper ions onto the investigated materials was studied by means of the batch method. A 0.2 g sample was mixed with 20 mL of an aqueous solution of Cu(II) ions, shaken at room temperature (20 °C), and then filtered through a Millipore filter (0.2 μm). Element concentrations were determined on a SOLAAR-M5 AA flame AAS spectrometer (Thermo Fisher Scientific, USA) by the Cu-resonance line of 324.8 nm.
The equation:
Qe = (C0 − Ce) × V/m
was used for calculation of the adsorbed Cu2+ amount, where C0 = initial concentration (mg L−1), Ce = equilibrium concentration (mg L−1), m = mass of adsorbent (g), and V = solution volume (L).
The effects of the initial Cu2+ concentration and contact time were studied at pH 4.0 (pH-meter model pH 211, Hanna Instruments, Vöhringen, Germany). The effect of the medium acidity on Cu2+ removal efficiency was investigated over the pH range 1.8–5.0 with a concentration of 200 mg L−1, while the effect of the initial metal ion concentration on the adsorption capacity was investigated with Cu2+ concentrations in the range of 50–500 mg L−1.
Three eluents were used for performing the desorption experiments in the present investigation as follows: 0.1 M HNO3, 1 M HNO3, and 0.1 M EDTA. Preadsorbed MO (0.1 g) was added to 10 mL of the above-mentioned eluents and stirred for 24 h. The eluents were then filtered and tested for desorbed copper.
Analytical-grade reagents and deionized water were used in the present study. The working solutions of Cu2+ ions were prepared by stepwise dilution of a stock standard solution (Titrisol® Merck, Darmstadt, Germany).
All adsorption experiments were replicated, and the average results were used in data analyses.

3. Results and Discussion

3.1. Sample Characterization

3.1.1. XRD Analysis

XRD patterns for the four analyzed biomaterials (Figure 1) exhibit characteristics typical of cellulosic materials. A common feature of all the patterns is the presence of an amorphous phase, observable within the 15°–25° 2θ range, which corresponds to lignin, hemicellulose, and cellulose components [21,22,23]. Additionally, peaks attributed to the crystalline structure of cellulose 1a are detected [24,25,26].

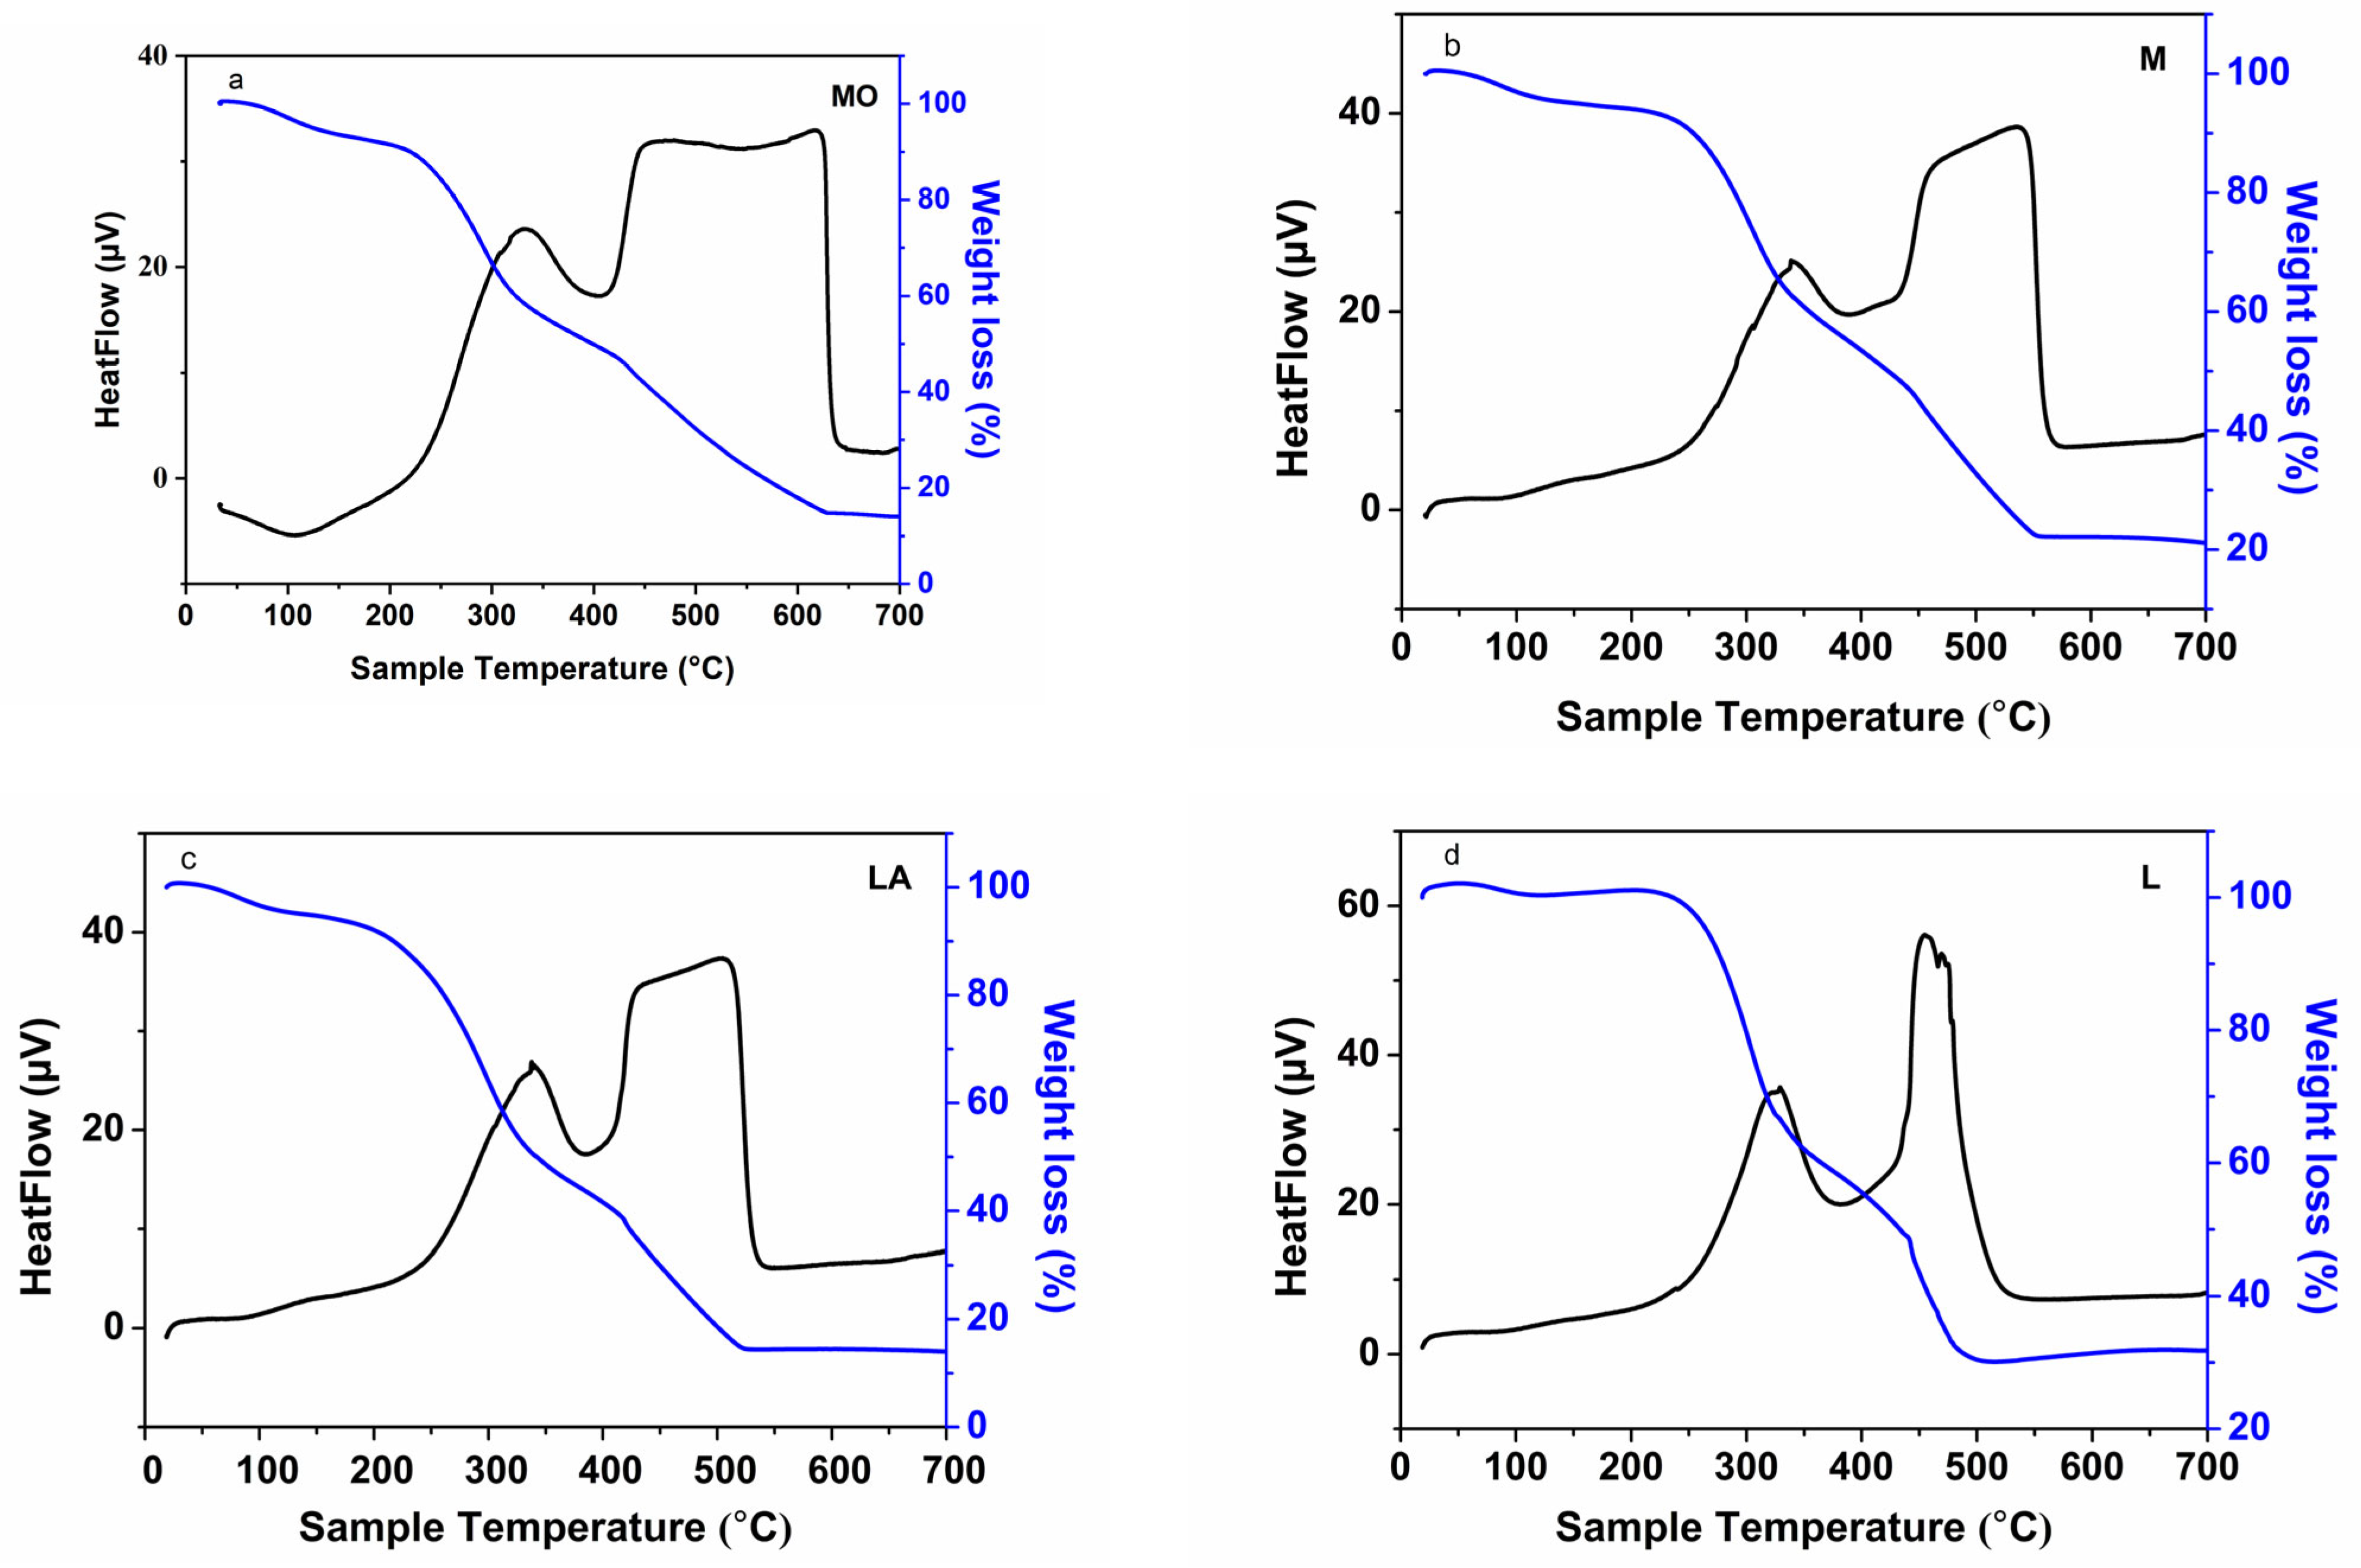
3.1.2. TG/DTA Analysis

The thermal behavior of MO, M, LA, and L was recorded from room temperature up to 700 °C at a heating rate of 10 °C/min in air. The obtained graphs for the four investigated materials are similar, which proves analogous behavior under heating, probably due to their similar chemical composition. All investigated materials contain mainly hemicelluloses, cellulose, and lignin. At the end of the pyrolysis process, solid carbon-containing residues are obtained. The TG/DTA graphs are presented in Figure 2.
As previously reported [12], the first region of the DTA curve (20 to 100 °C), related to the elimination of moisture and adsorbed water, is not clearly distinguished because the samples were initially dried at 60 °C in an oven for 48 h.
Three clearly defined regions are observed by higher temperatures, as follows:
The region from 100 °C to 200 °C is connected with the evaporation of compounds of high volatility. The slope to the next region (between 200 °C and 400 °C) can be assigned to the thermal decomposition of hemicelluloses, cellulose, and some lignin fractions. The first two regions are almost identical for all investigated materials. Above 400 °C, the peaks for the samples based on the raw plant materials (MO and LA) are broader as compared with those for the waste products (M and L), which are narrower. Anyway, the results confirm those obtained from the XRD analysis.
The TG curve, which is related to the change in mass with the change in temperature, shows losses of over 80% of the weight when heating up to 700 °C.

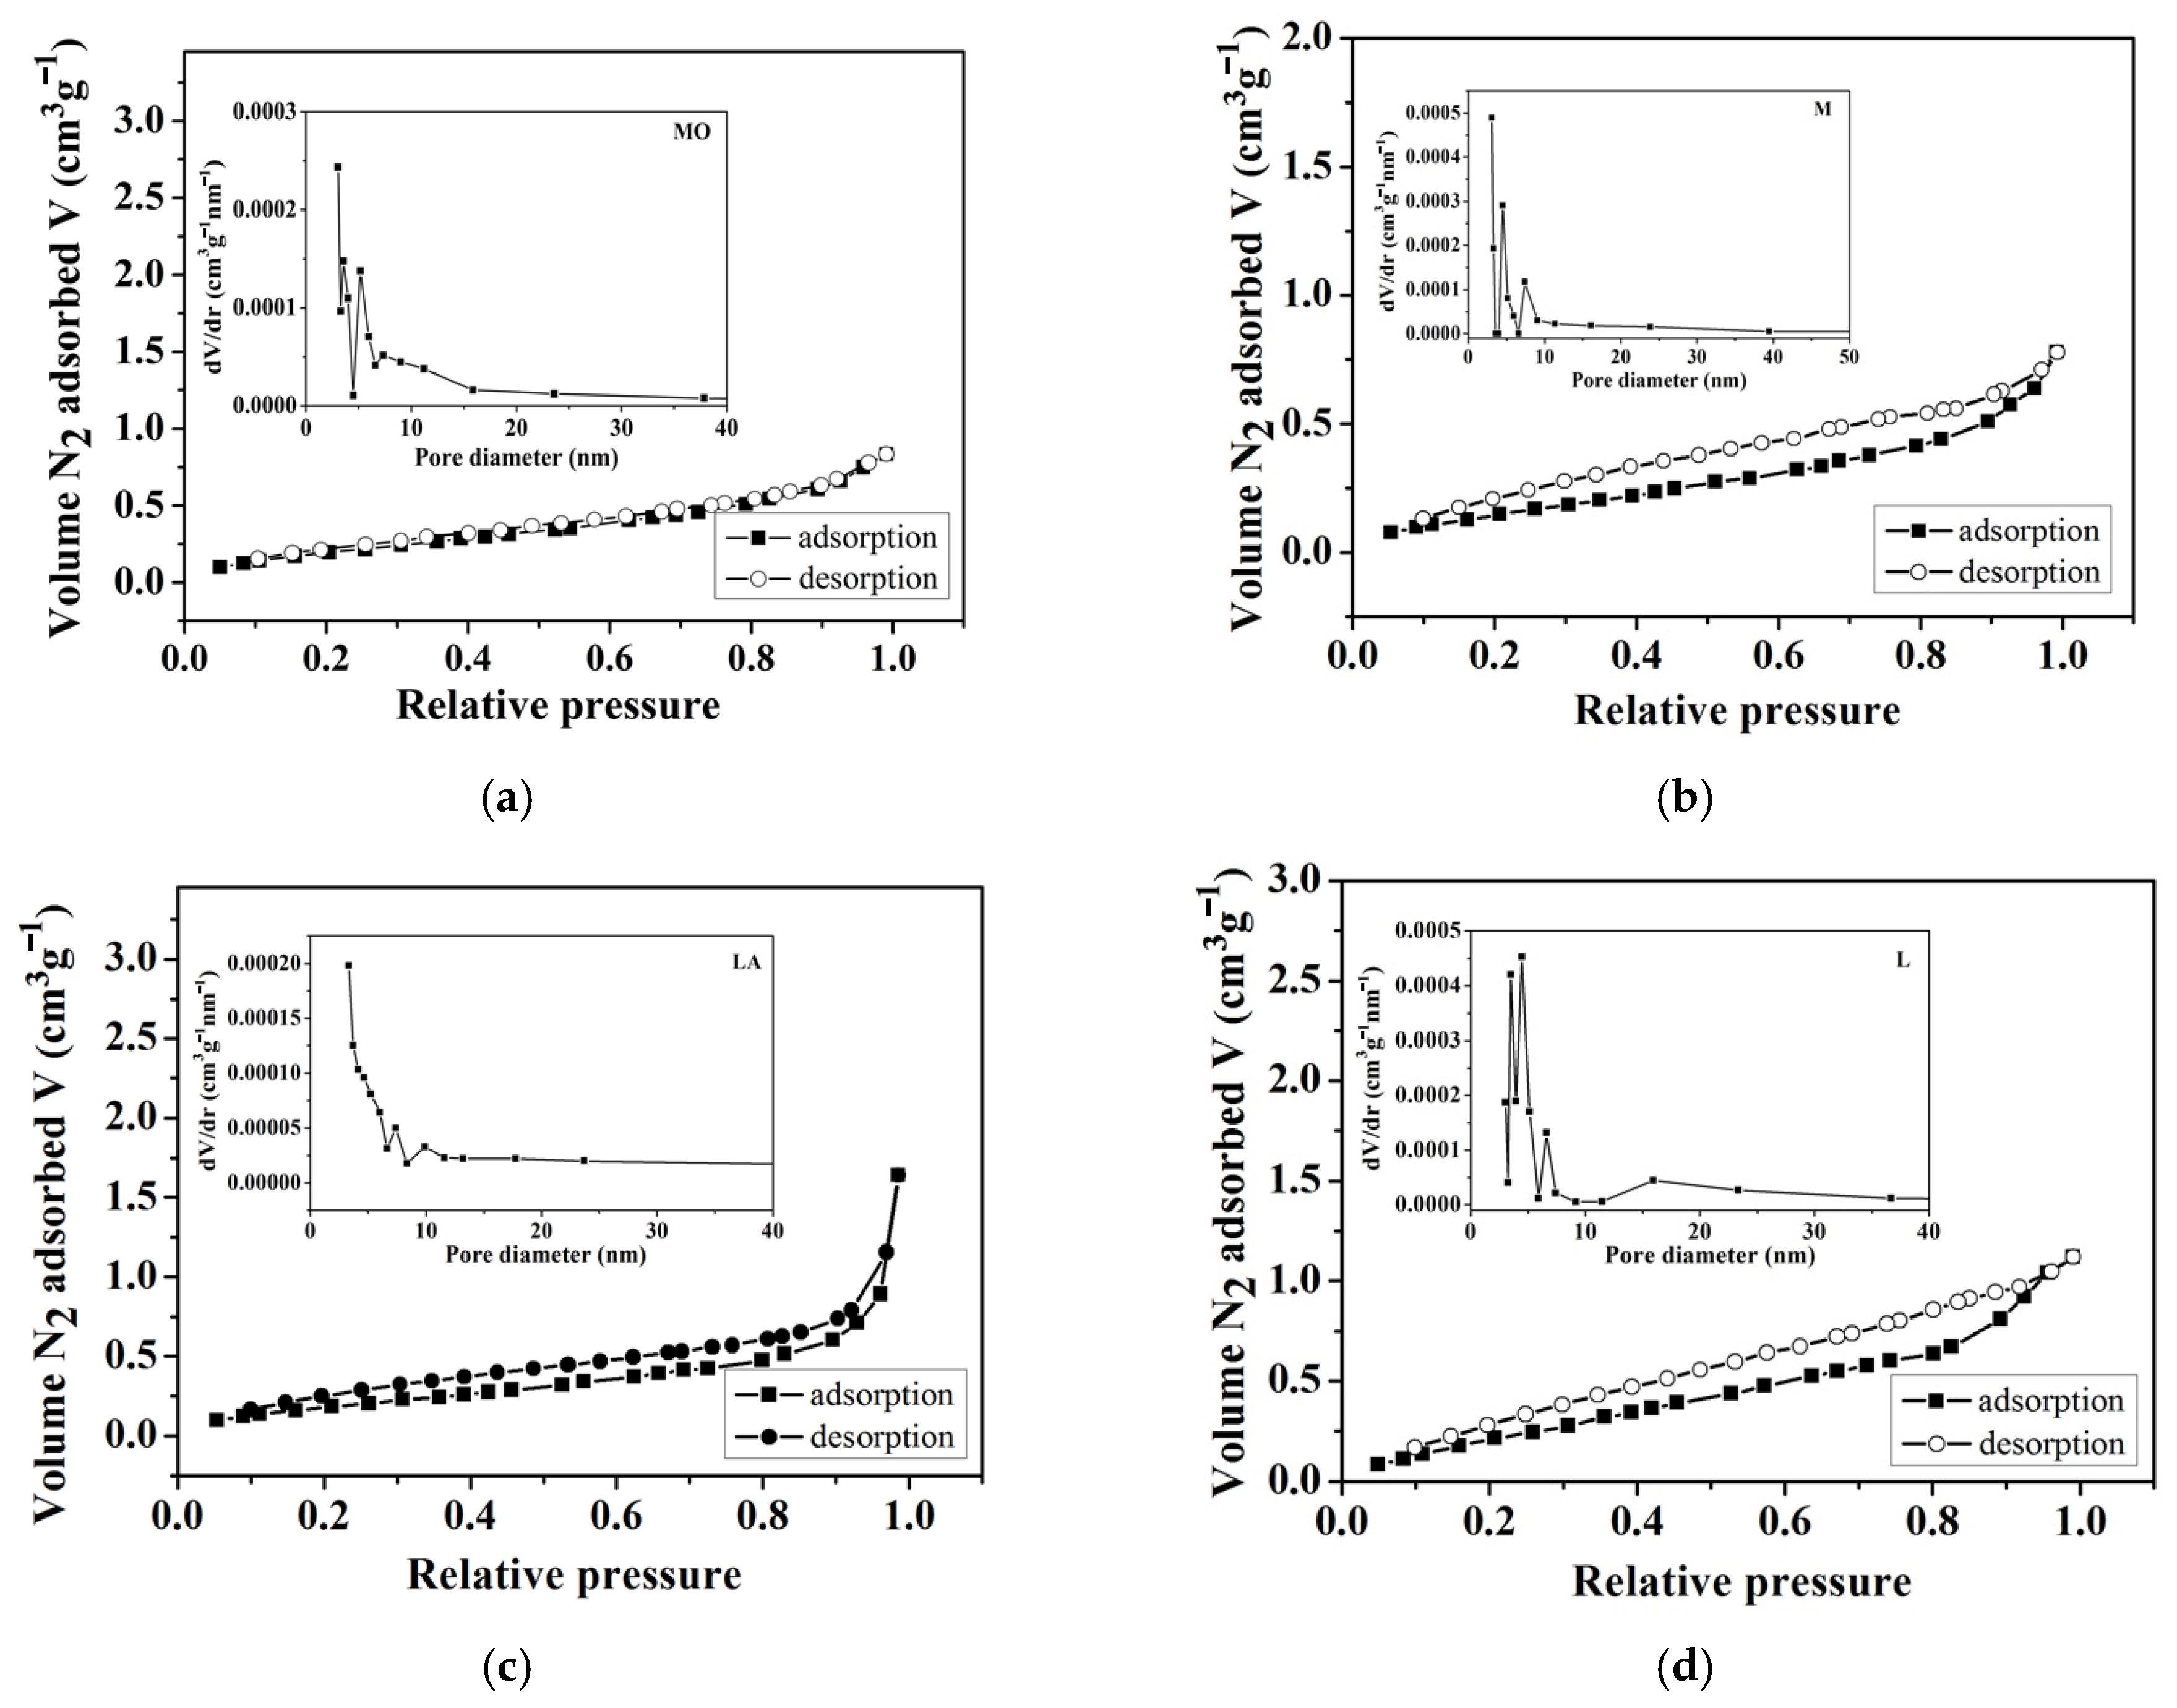
3.1.3. Texture Parameters
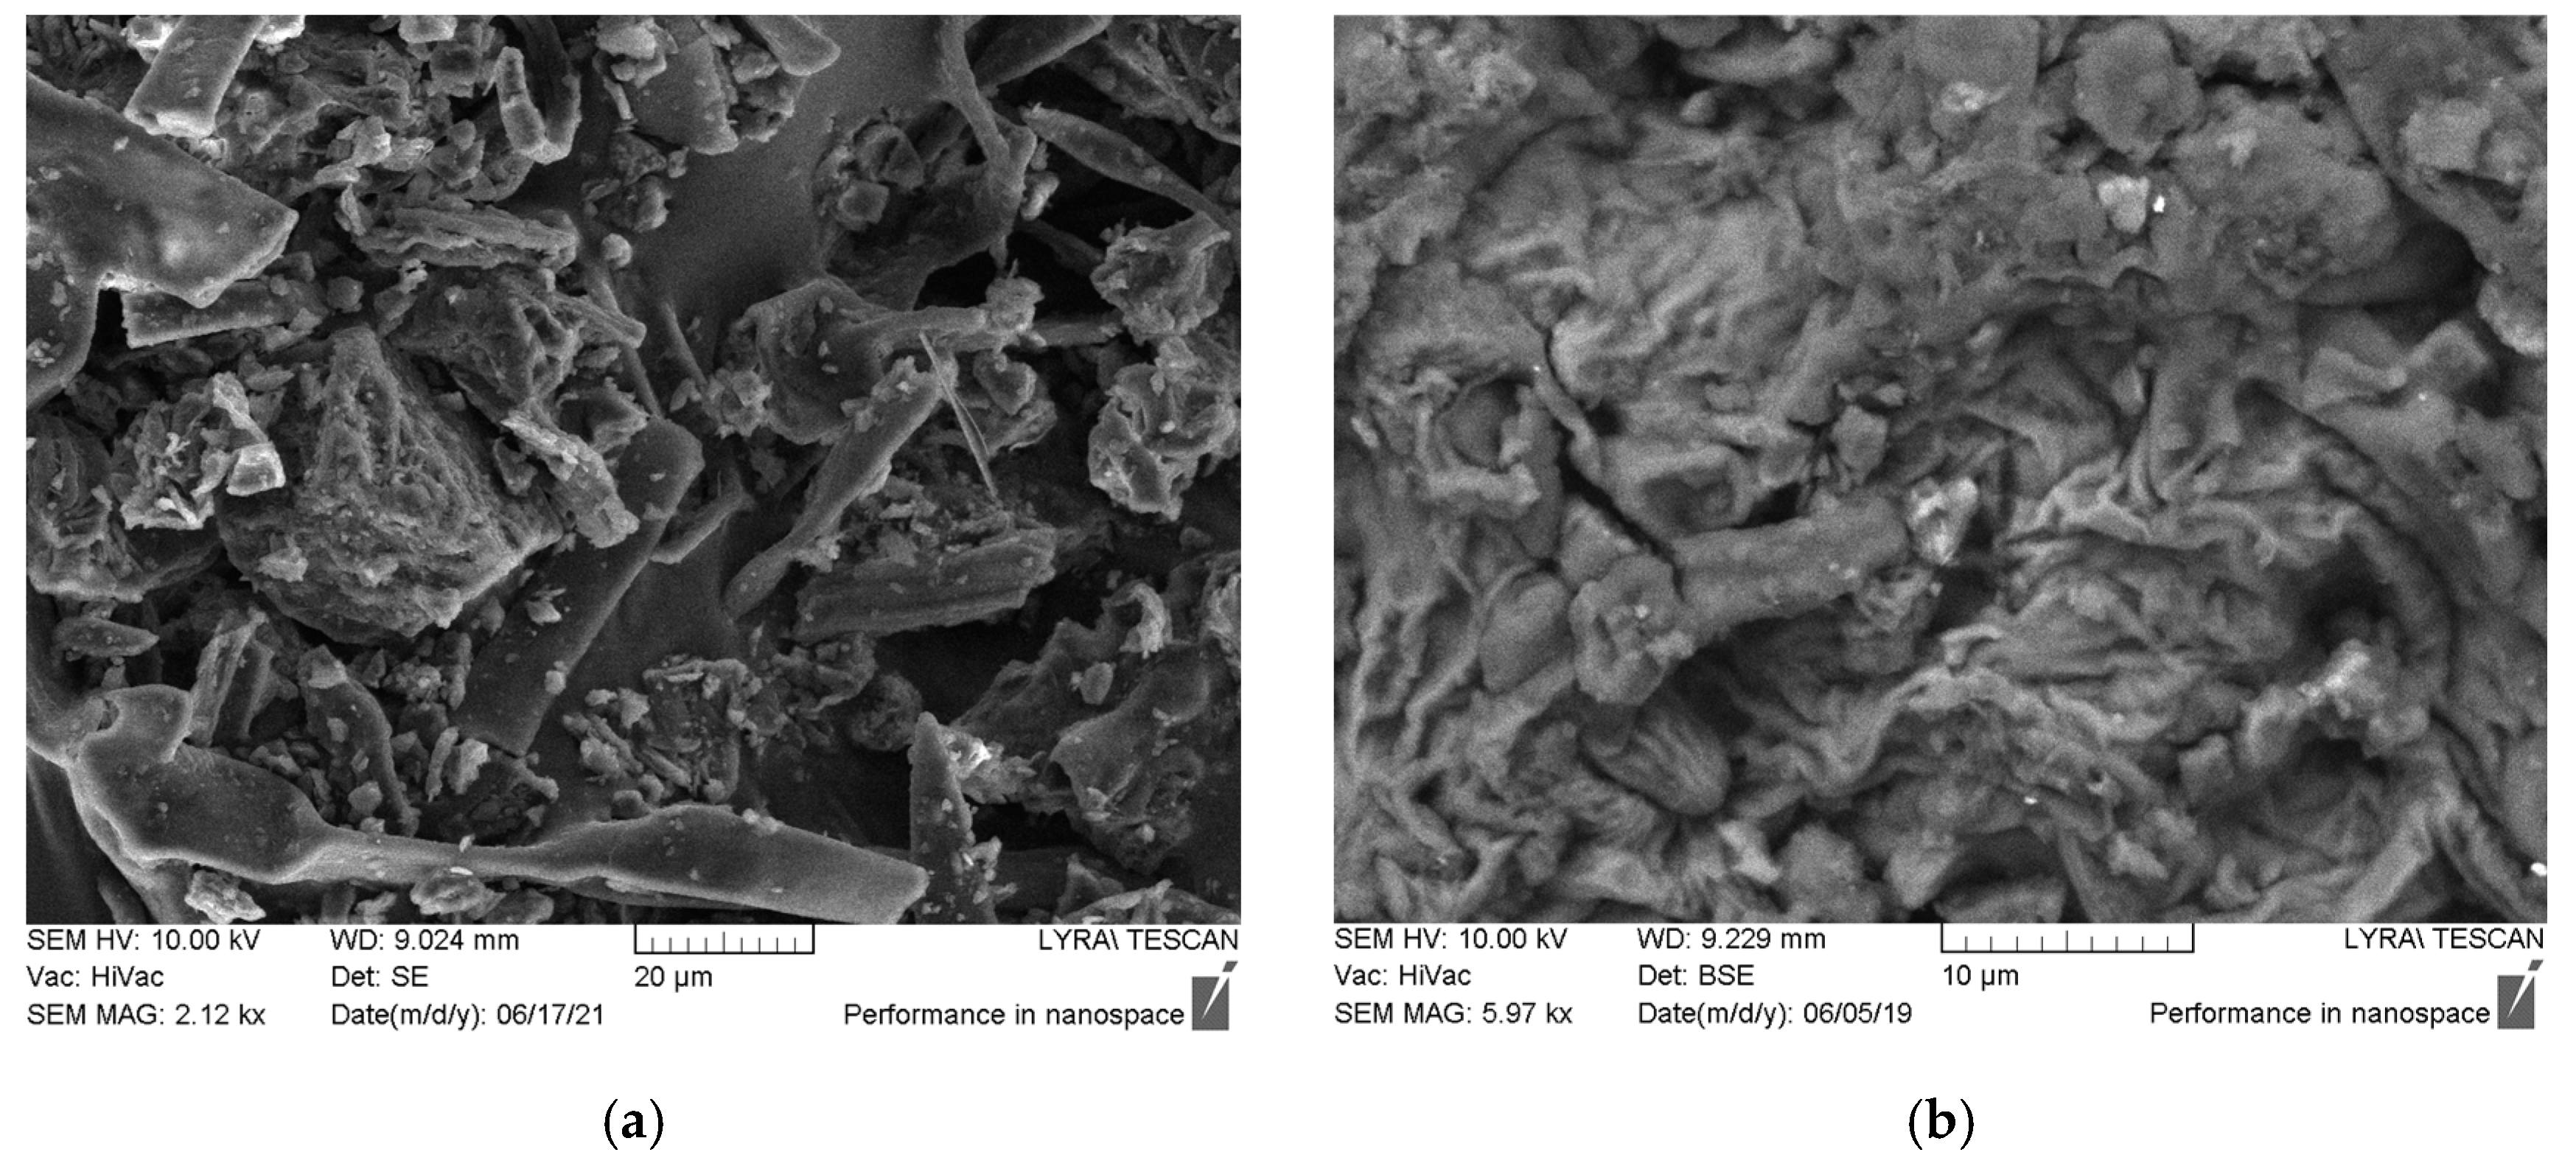
The nitrogen adsorption–desorption isotherms and pore size distribution of the four sorbents exhibit features that more closely align with Type II isotherms, according to IUPAC classification (see Figure 3). Although the materials are mesoporous, the isotherms do not display the capillary condensation characteristic of Type IV. Instead, the observed gradual increase and lack of a pronounced plateau suggest multilayer adsorption typical of Type II behavior. The hysteresis loops (H3 type) suggest slit-like pores or plate-like particle aggregates [27]. The computed textural properties of the examined biosorbents are outlined in Table 1. Despite slight variations in the value, the biosorbents generally exhibit relatively low surface areas and pore volumes. The average pore diameters differ across the biosorbents, but all suggest a mesoporous structure.
The pH of biosorbents is another critical factor influencing adsorption. The studied biosorbents have pH values ranging from 5.8 to 6.3 (see Table 1). This near-neutral pH range makes the biosorbents suitable for use in environments where extreme pH conditions might otherwise limit their effectiveness.

3.1.4. SEM Analysis

Scanning electron microscopy (SEM) is a valuable tool for identifying active adsorption sites on biosorbent surfaces. In this study, SEM analysis was conducted to examine the shape and structural properties of the biosorbents LA and L, with images shown in Figure 4. The biosorbents displayed a porous, heterogeneous structure with a variety of well-defined pores of different sizes, which is advantageous for metal ion adsorption [28]. Macropores predominated, acting as transport channels that facilitate rapid adsorption kinetics by allowing adsorbate molecules to reach active centers efficiently. However, macropores are not the primary contributors to adsorption capacity.

3.2. Adsorption Studies
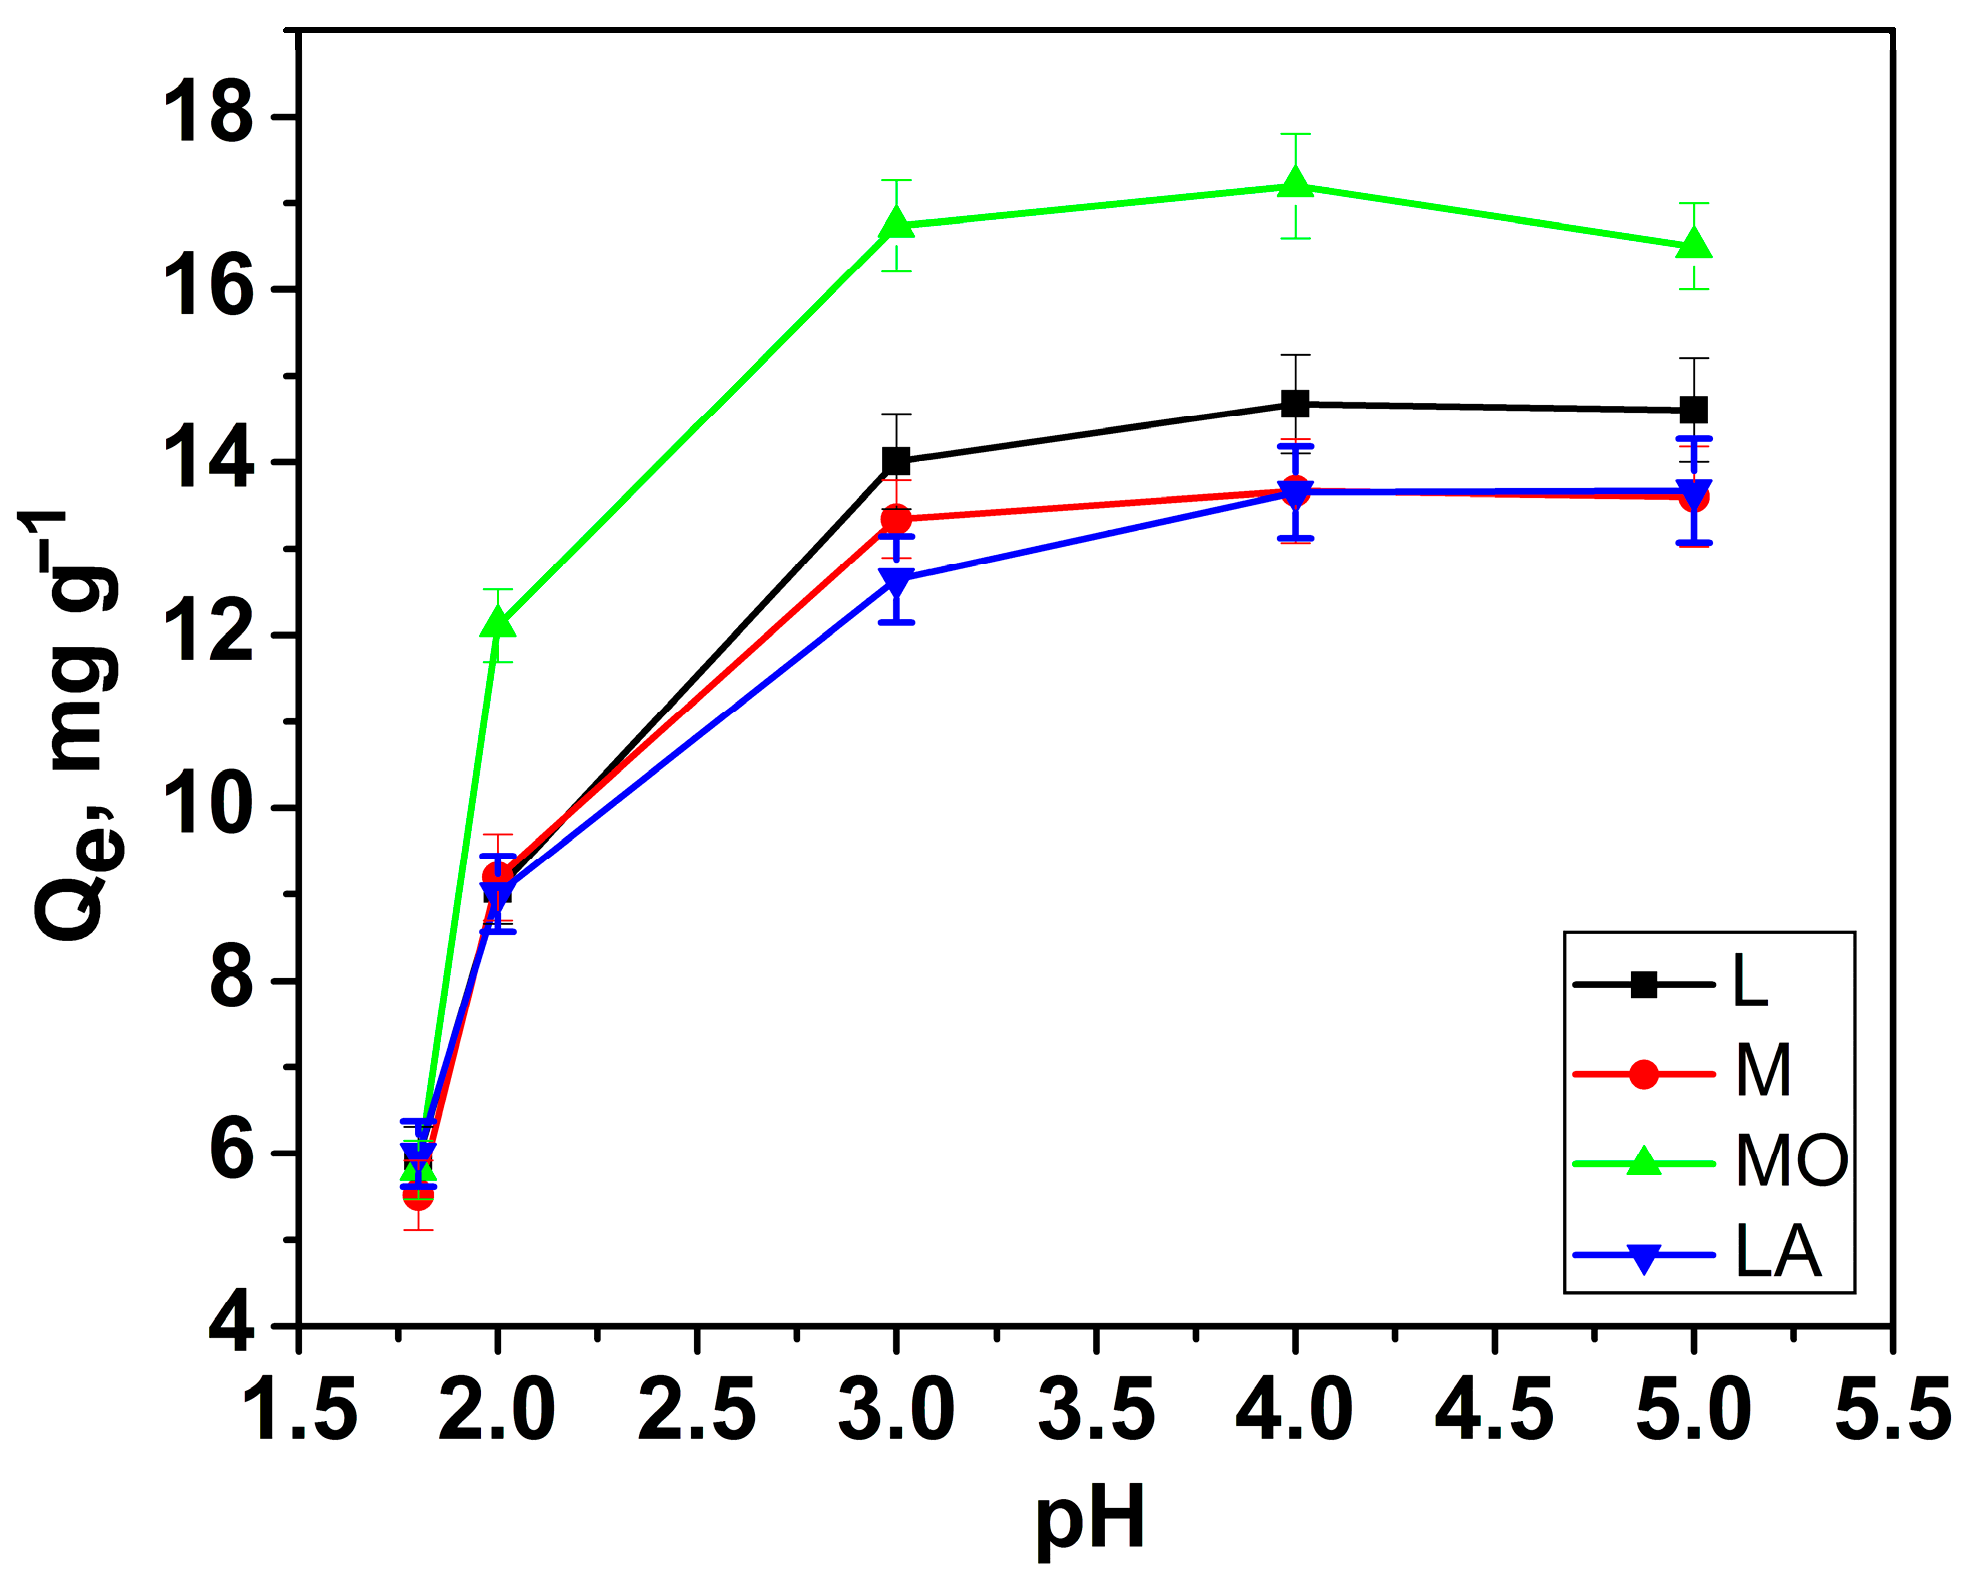
3.2.1. Effect of pH

The acidity of the environment is a critical parameter in the biosorption process. It influences the chemical state of the active centers of the biosorbent, the form and concentration of metal ions in the solution, the surface charge of the biosorbent, and the tendency to form complexes [29,30]. The effect of initial pH on copper(II) ion adsorption was studied for the four plant materials over a pH range of 1.8–5.0 at a copper(II) ion concentration of 200 mg L−1 (see Figure 5). For all samples, adsorption increased with pH, reaching a maximum around pH 4.0. Beyond this point, adsorption remains constant or even decreases slightly for the investigated materials. This decline is attributed to the formation of dissolved hydroxyl complexes of copper ions, which prevent further binding to the biosorbent’s active sites. These findings are consistent with previous studies on copper biosorption [28,31,32].
In a strongly acidic environment, the reduced adsorption of copper ions is due to competition with protons, which dominate the solution and interact with the biosorbent’s active sites. At low pH, the biosorbent surface is saturated with H+ ions, creating a repulsive force that hinders Cu(II) ions from approaching. As the pH increases, the concentration of H+ ions decreases, and the surface charge of the biosorbents becomes more negative, facilitating Cu(II) ion adsorption. Furthermore, the degree of deprotonation of functional groups, such as carboxyl groups, increases, enhancing their ability to bind metal ions [33,34,35].
At low pH, carboxyl groups remain undissociated and cannot bind copper ions, though they may participate in complexation reactions [36,37]. As pH rises, the deprotonation of active centers improves, promoting attraction and coordination bond formation with copper ions, thereby increasing the biosorption rate. These observations suggest that copper ion binding to the surface of the four biosorbents primarily occurs through an ion-exchange mechanism [28,32]. All further experiments were conducted at a pH of 4.

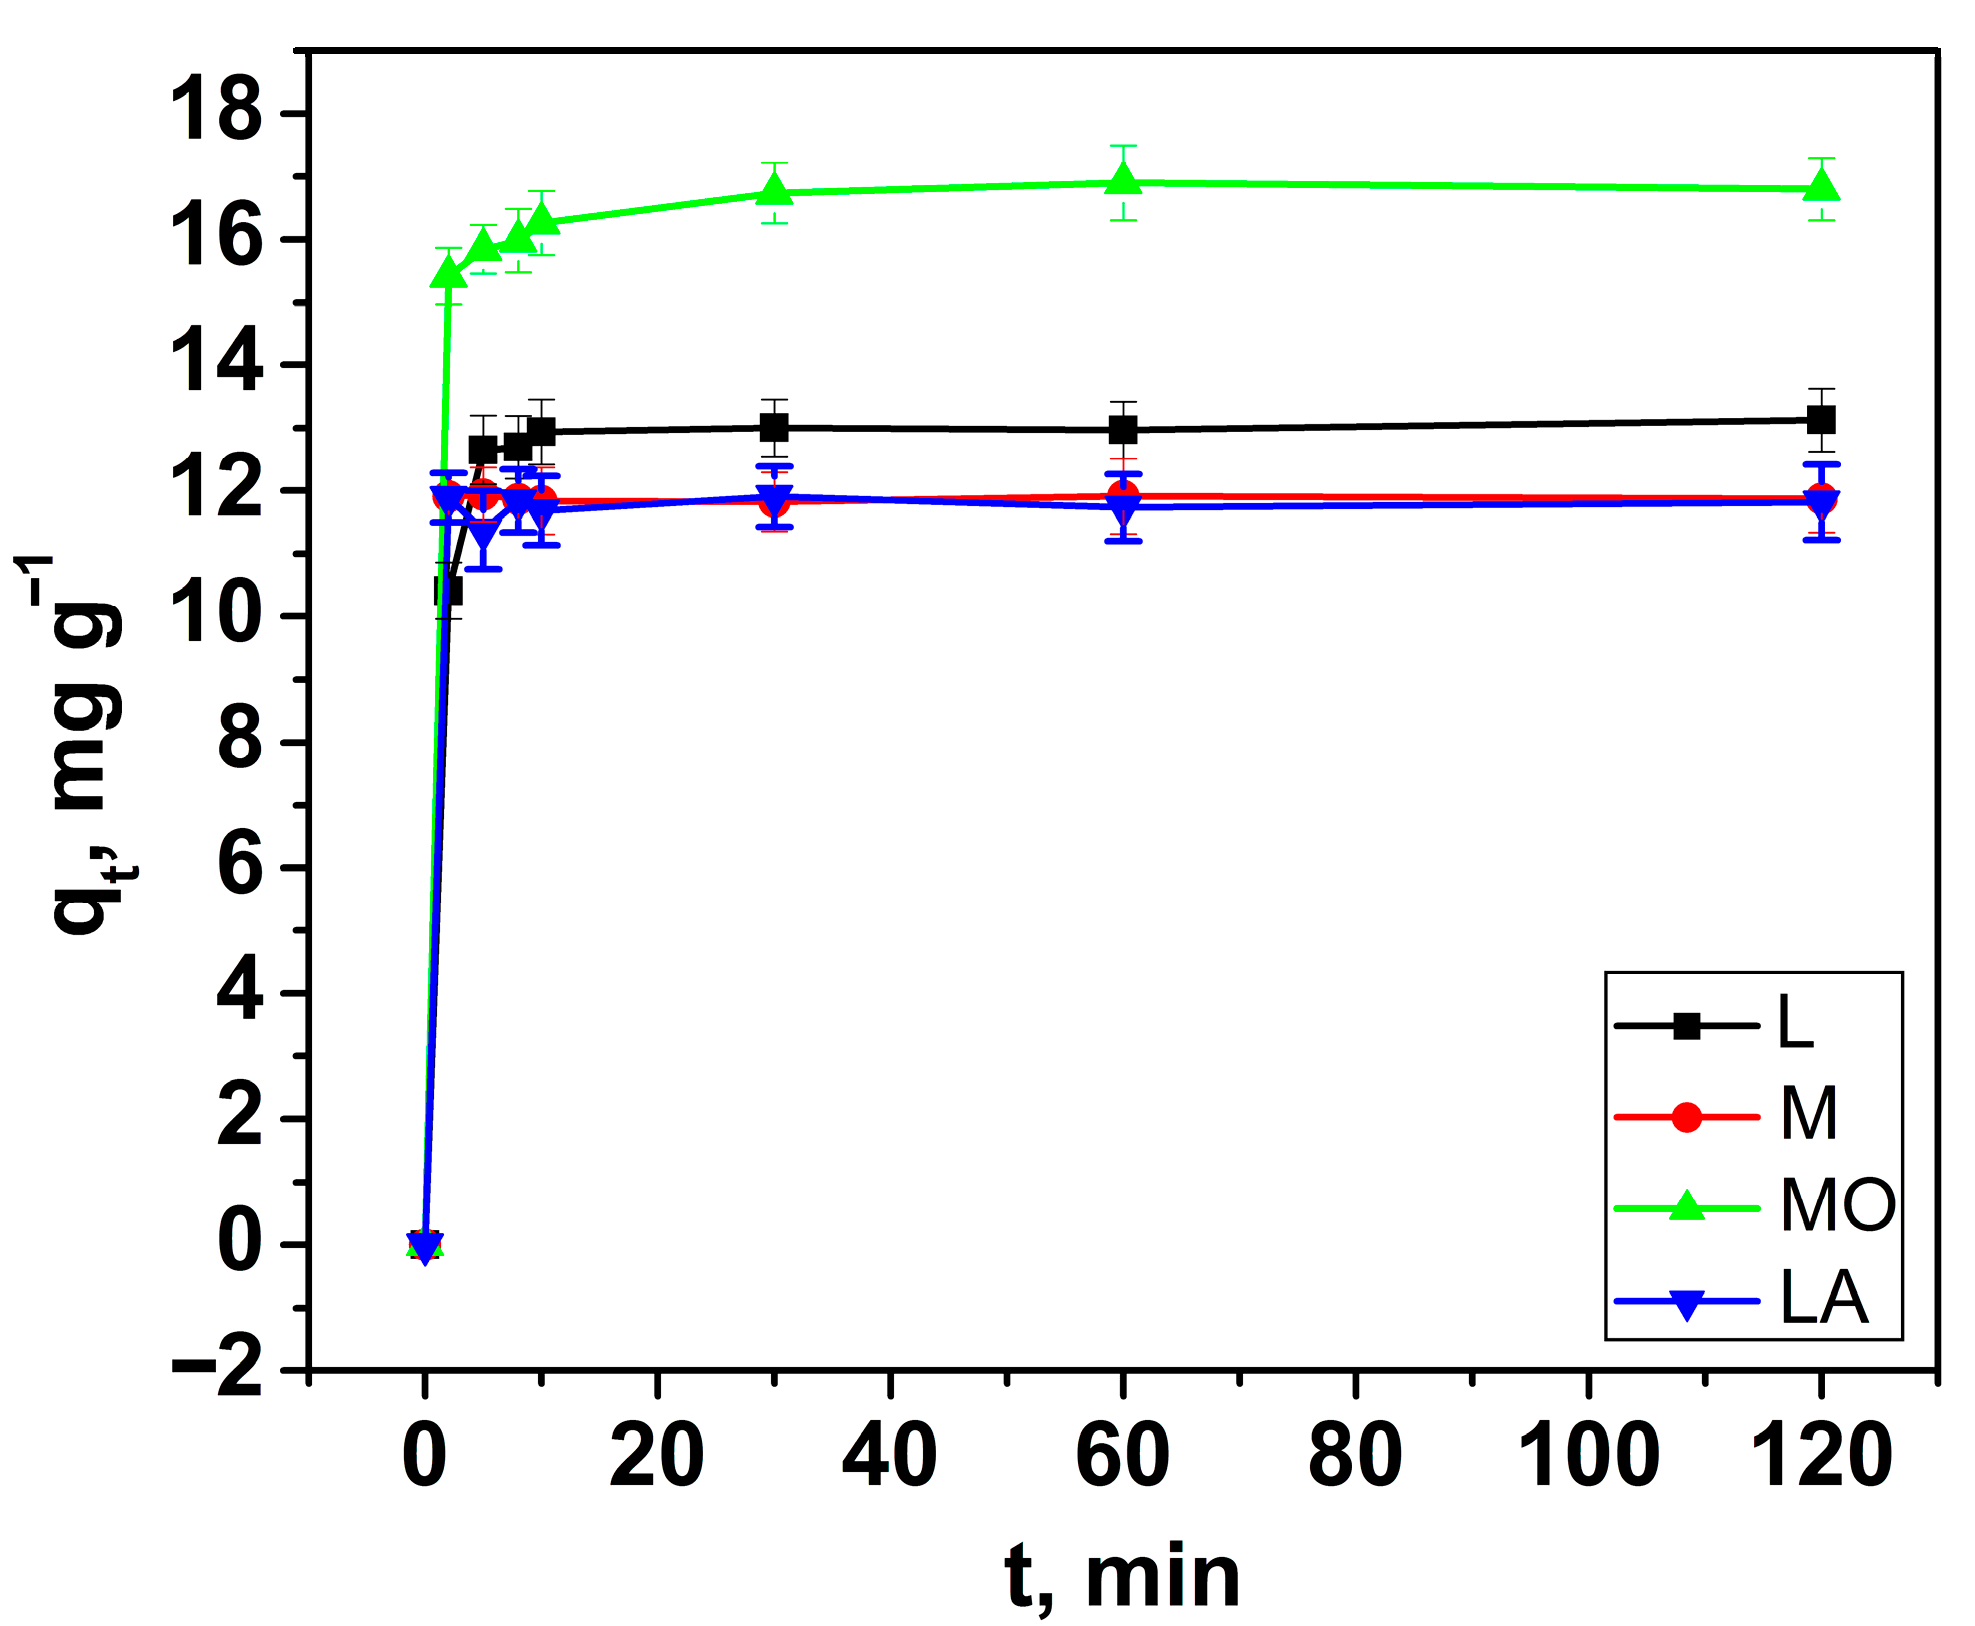
3.2.2. Effect of Contact Time

The time needed for the system (adsorbent + adsorbate) to reach equilibrium is a key factor that must be assessed. The effect of contact time on the adsorption of copper(II) ions for all biomaterials was examined over a range from 2 min to 2 h at an initial concentration of 200 mg L−1, under the optimal pH of 4.0 (Figure 6).
All investigated materials exhibit excellent affinity towards Cu(II) ions in aqueous media. For MO, equilibrium was reached within ten minutes. The adsorption process is notably faster for LA, M, and L, where adsorption equilibrium was achieved within the first two minutes, highlighting the strong affinity of those plant materials towards Cu(II) ions in aqueous solutions and their highly efficient adsorption rate.
Three kinetic models were applied as follows: pseudo-first-order, pseudo-second-order, and the Weber-Morris diffusion model, described in detail in Vassileva et al. [38]. The kinetic parameters were applied solely to MO. For the other sorbents, due to the very fast adsorption, this approach is not applicable. The calculated parameters are presented in Table 2. A comparison of the pseudo-first-order and pseudo-second-order kinetic models shows that the adsorption of Cu(II) ions onto MO fits better with the pseudo-second-order model. The findings imply that chemisorption is likely the rate-limiting step in the adsorption process for the Cu(II)-MO system.
Analysis using the intraparticle diffusion model indicates that the adsorption process involves multiple stages, as evidenced by two distinct linear regions in the kinetic plot. The initial phase exhibited a fast rate (Kid1 = 0.449), while the subsequent phase proceeded at a significantly slower rate (Kid2 = 0.009). This difference is likely due to the initial phase corresponding to the diffusion of copper ions onto the MO surface, whereas the latter phase is associated with intraparticle diffusion. Nonetheless, neither of these two linear phases intersects the origin, suggesting that although intraparticle diffusion played a role in the adsorption process, it was not the sole rate-limiting factor.

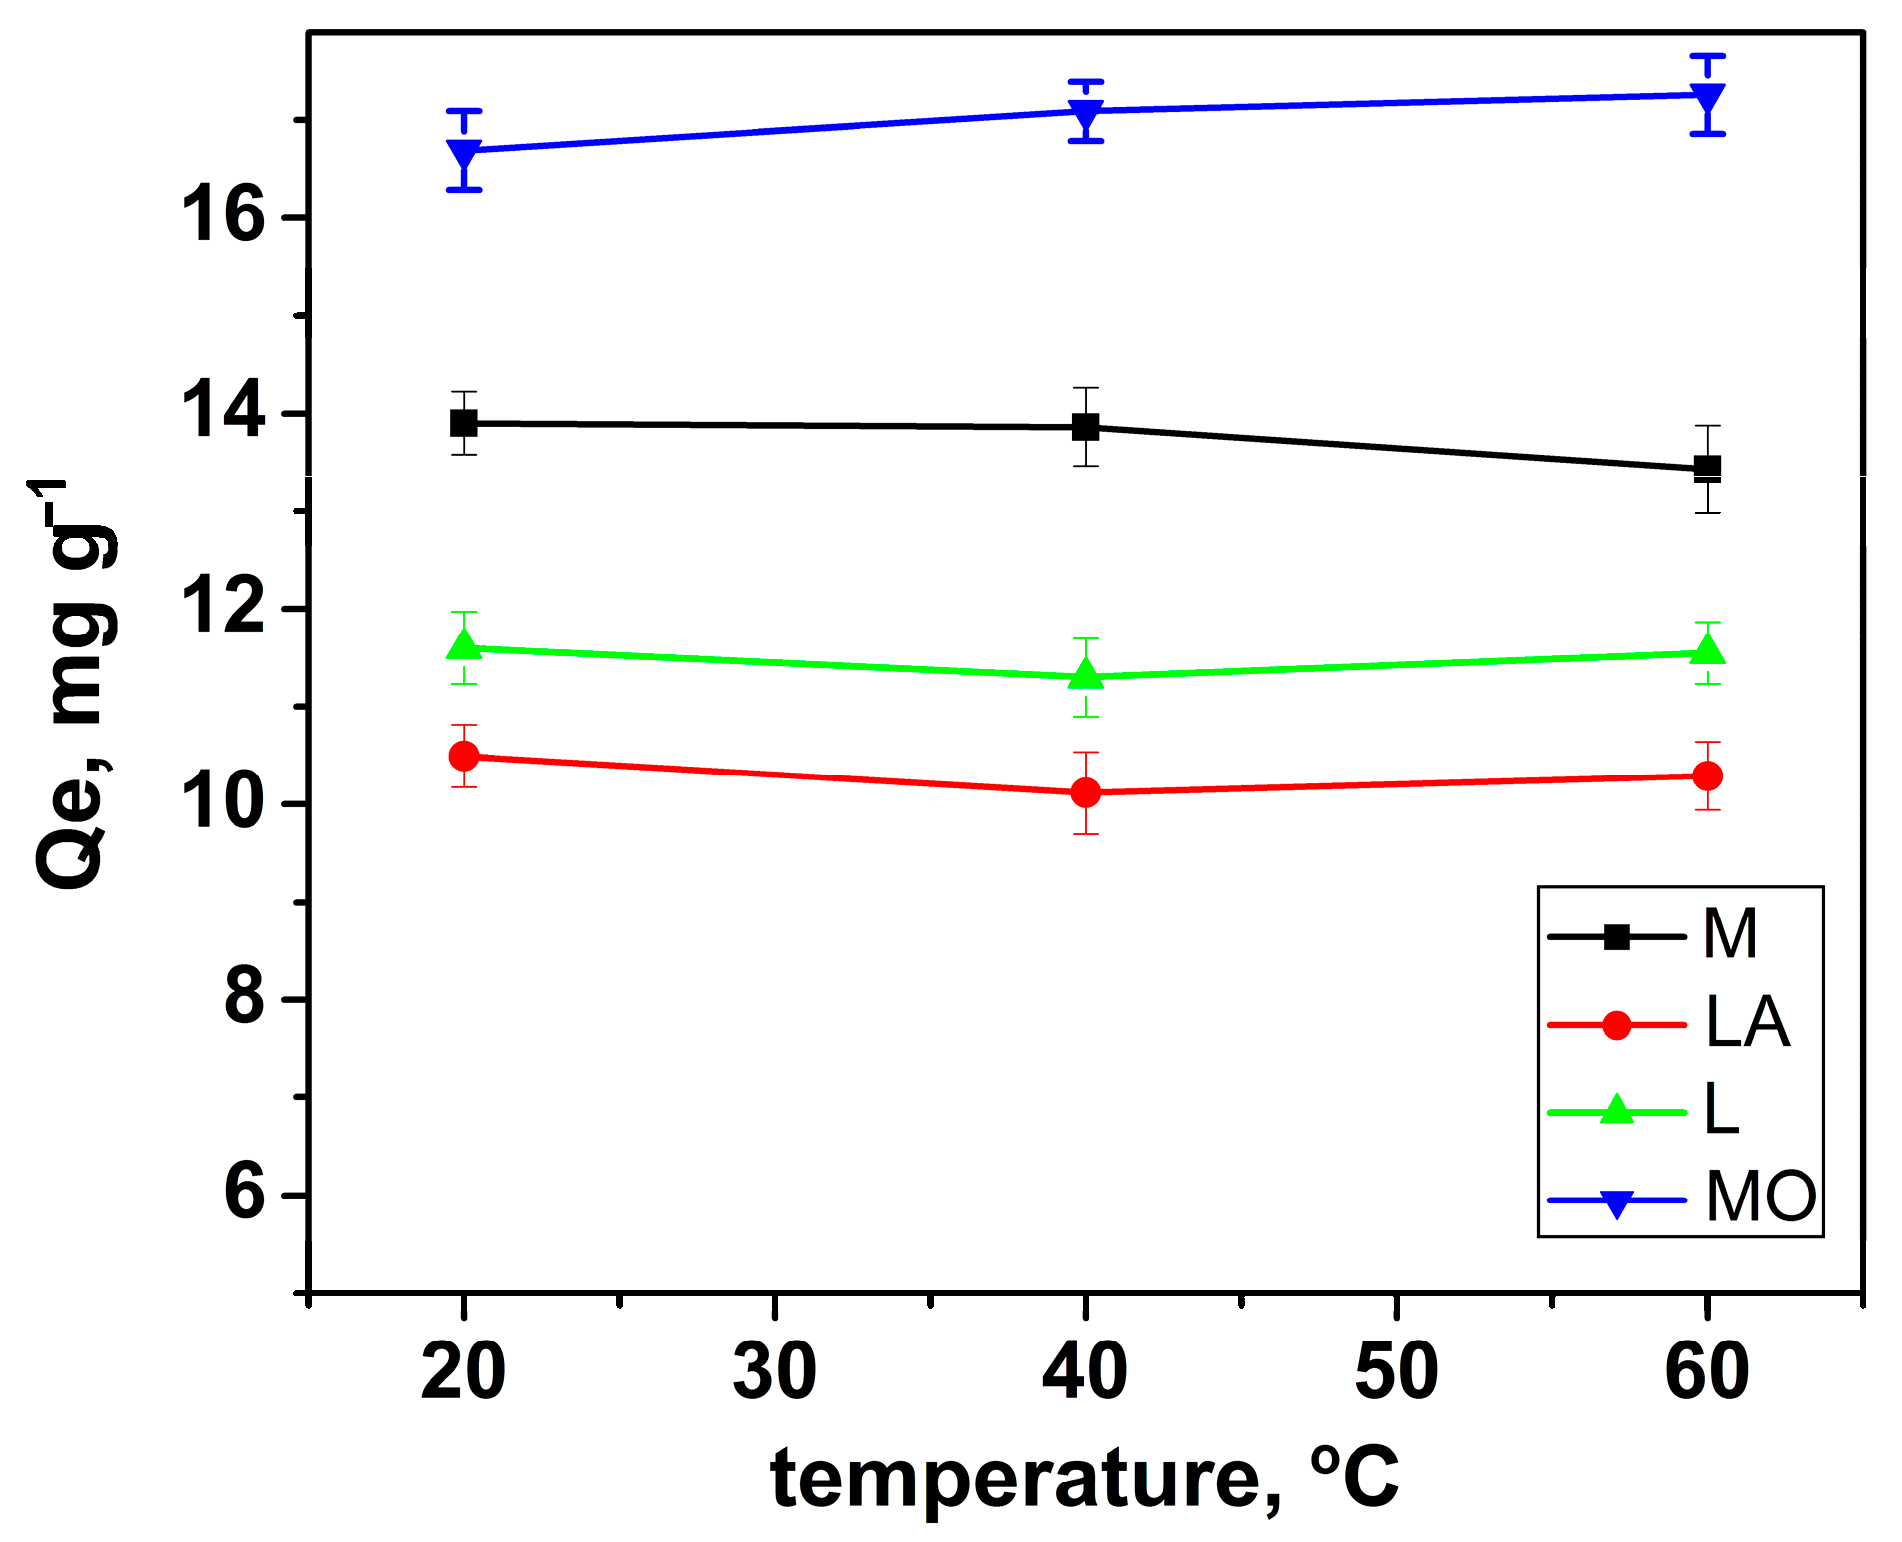
3.2.3. Effect of Temperature and Thermodynamic Studies

Temperature typically affects adsorption capacity and efficiency. In this study, the effect of temperature on Cu2+ adsorption was evaluated in the range of 293–333 K using solutions with an initial metal ion concentration of 200 mg L−1 at pH 4 (Figure 7). The results showed that the adsorbed amount increased with increasing temperature for the biosorbents MO and M, indicating that the adsorption process is endothermic in nature. This behavior suggests that higher temperatures enhance the interaction between Cu2+ ions and the sorbent surface. In contrast, a slight decrease in Qe was observed for LA and L as the temperature increased, which implies that the adsorption is exothermic, and elevated temperatures may reduce adsorption efficiency for these materials.
For liquid-phase adsorption, the distribution coefficient (Kd) is expressed as the ratio of the equilibrium concentration of adsorbate on the adsorbent to its equilibrium concentration in solution, as given by
Kd = Qe/Ce
where Qe (mg L−1) is the amount of adsorbate adsorbed per unit volume of solution at equilibrium, and Ce (mg L−1) is the equilibrium concentration in solution.
The thermodynamic parameters for adsorption, such as Gibbs free energy (ΔG0), enthalpy (ΔH0), and entropy (ΔS0), were determined using the van’t Hoff equation:
ln(Kd) = ΔS0/R − ΔH0/RT
where R is the universal gas constant (J·mol−1·K−1) and T is the absolute temperature in Kelvin. A plot of ln(Kd) versus 1/T allows estimation of ΔH0 and ΔS0 from the slope and intercept, respectively. The standard Gibbs free energy change is calculated using
ΔG0 = −RT ln(Kd)
The calculated thermodynamic parameters are summarized in Table 3.
The positive ΔH0 values for MO and M confirm that the adsorption process is endothermic, meaning it is enhanced at higher temperatures. Conversely, negative ΔH0 values for LA and L indicate exothermic adsorption, which slightly decreases with increasing temperature. Additionally, the relatively low magnitudes of ΔH0 (all <20 kJ/mol) suggest that the adsorption mechanism is likely physisorption. The negative values of ΔG0 across all biosorbents and temperatures confirm that Cu2+ adsorption is spontaneous and thermodynamically favorable. These values range between −0.68 and −4.78 kJ/mol, which falls well within the expected range for physisorption (0 to −20 kJ/mol). The positive entropy changes for MO and M indicate an increase in randomness at the solid-liquid interface during adsorption, possibly due to the release of solvated water molecules. In contrast, negative ΔS0 values for LA and L suggest a slight ordering of the system, possibly due to specific interactions or structuring of adsorbed ions on the surface.

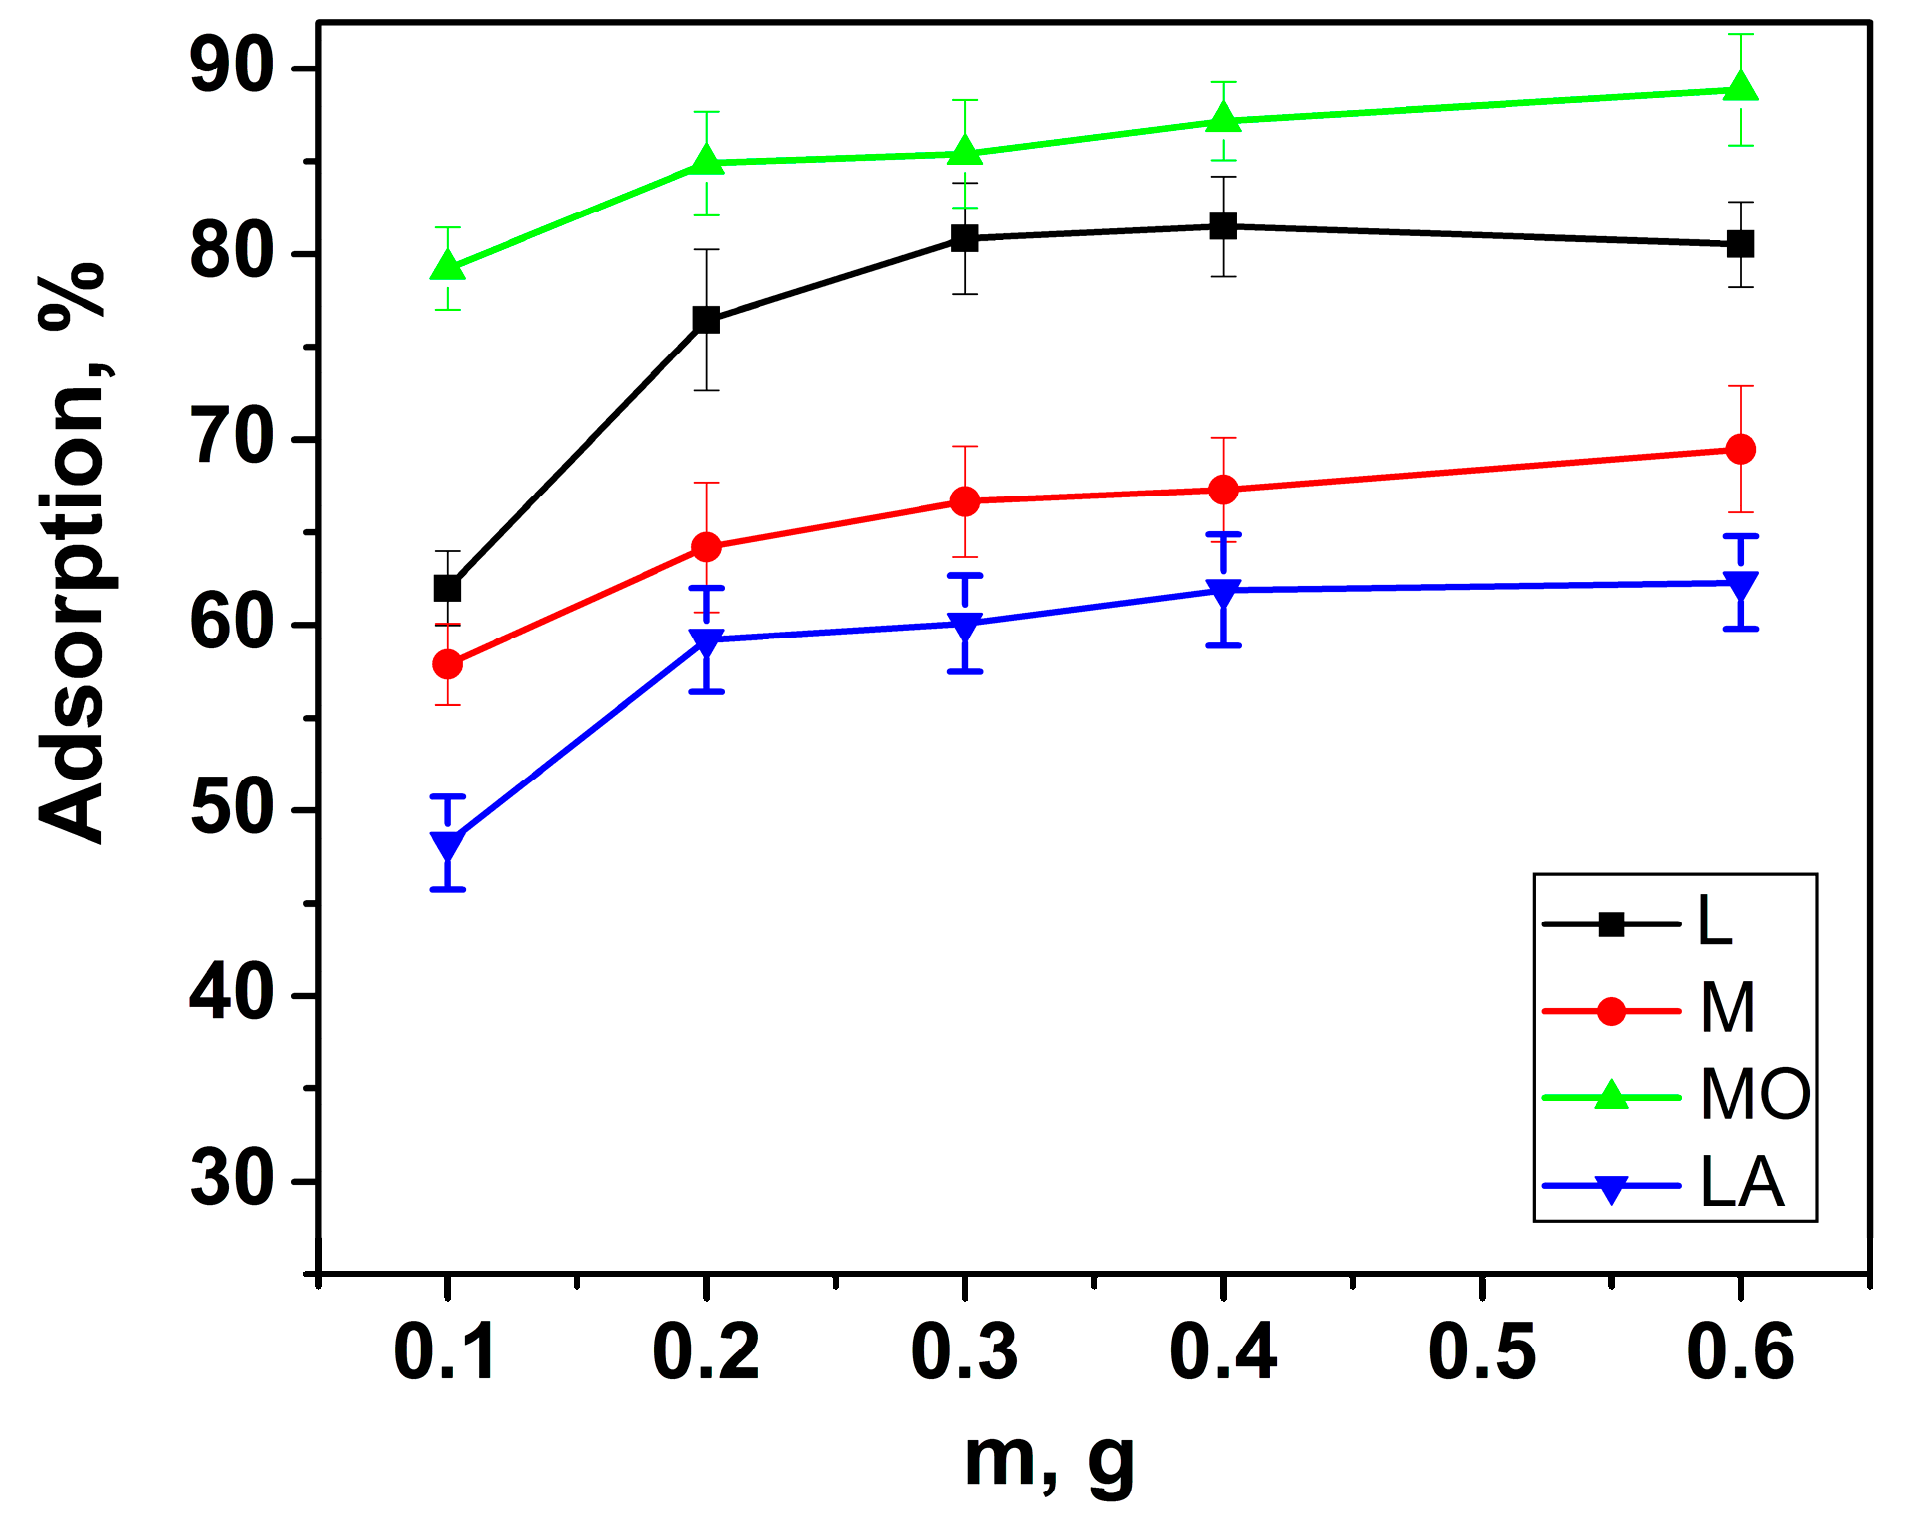
3.2.4. Effect of Sorbent Amount

The amount of biosorbent directly influences the number of active sites available on its surface for interaction with metal ions. The adsorption of copper ions by the four selected materials was investigated at five different biosorbent quantities, ranging from 0.1 to 0.6 g (Figure 8), using a solution with an initial concentration of 200 mg L−1 at an optimal pH of 4. The results showed that in the range of 0.2 to 0.6 g, the percentage of adsorption remained nearly constant. This observation aligns with the findings of Jawad et al. [39], who reported that such a trend arises due to the agglomeration of sorbent particles, leading to a reduction in accessible active sites. Based on these results, an optimum biosorbent amount of 0.2 g was selected, corresponding to a biosorbent concentration of 10 mg L−1.

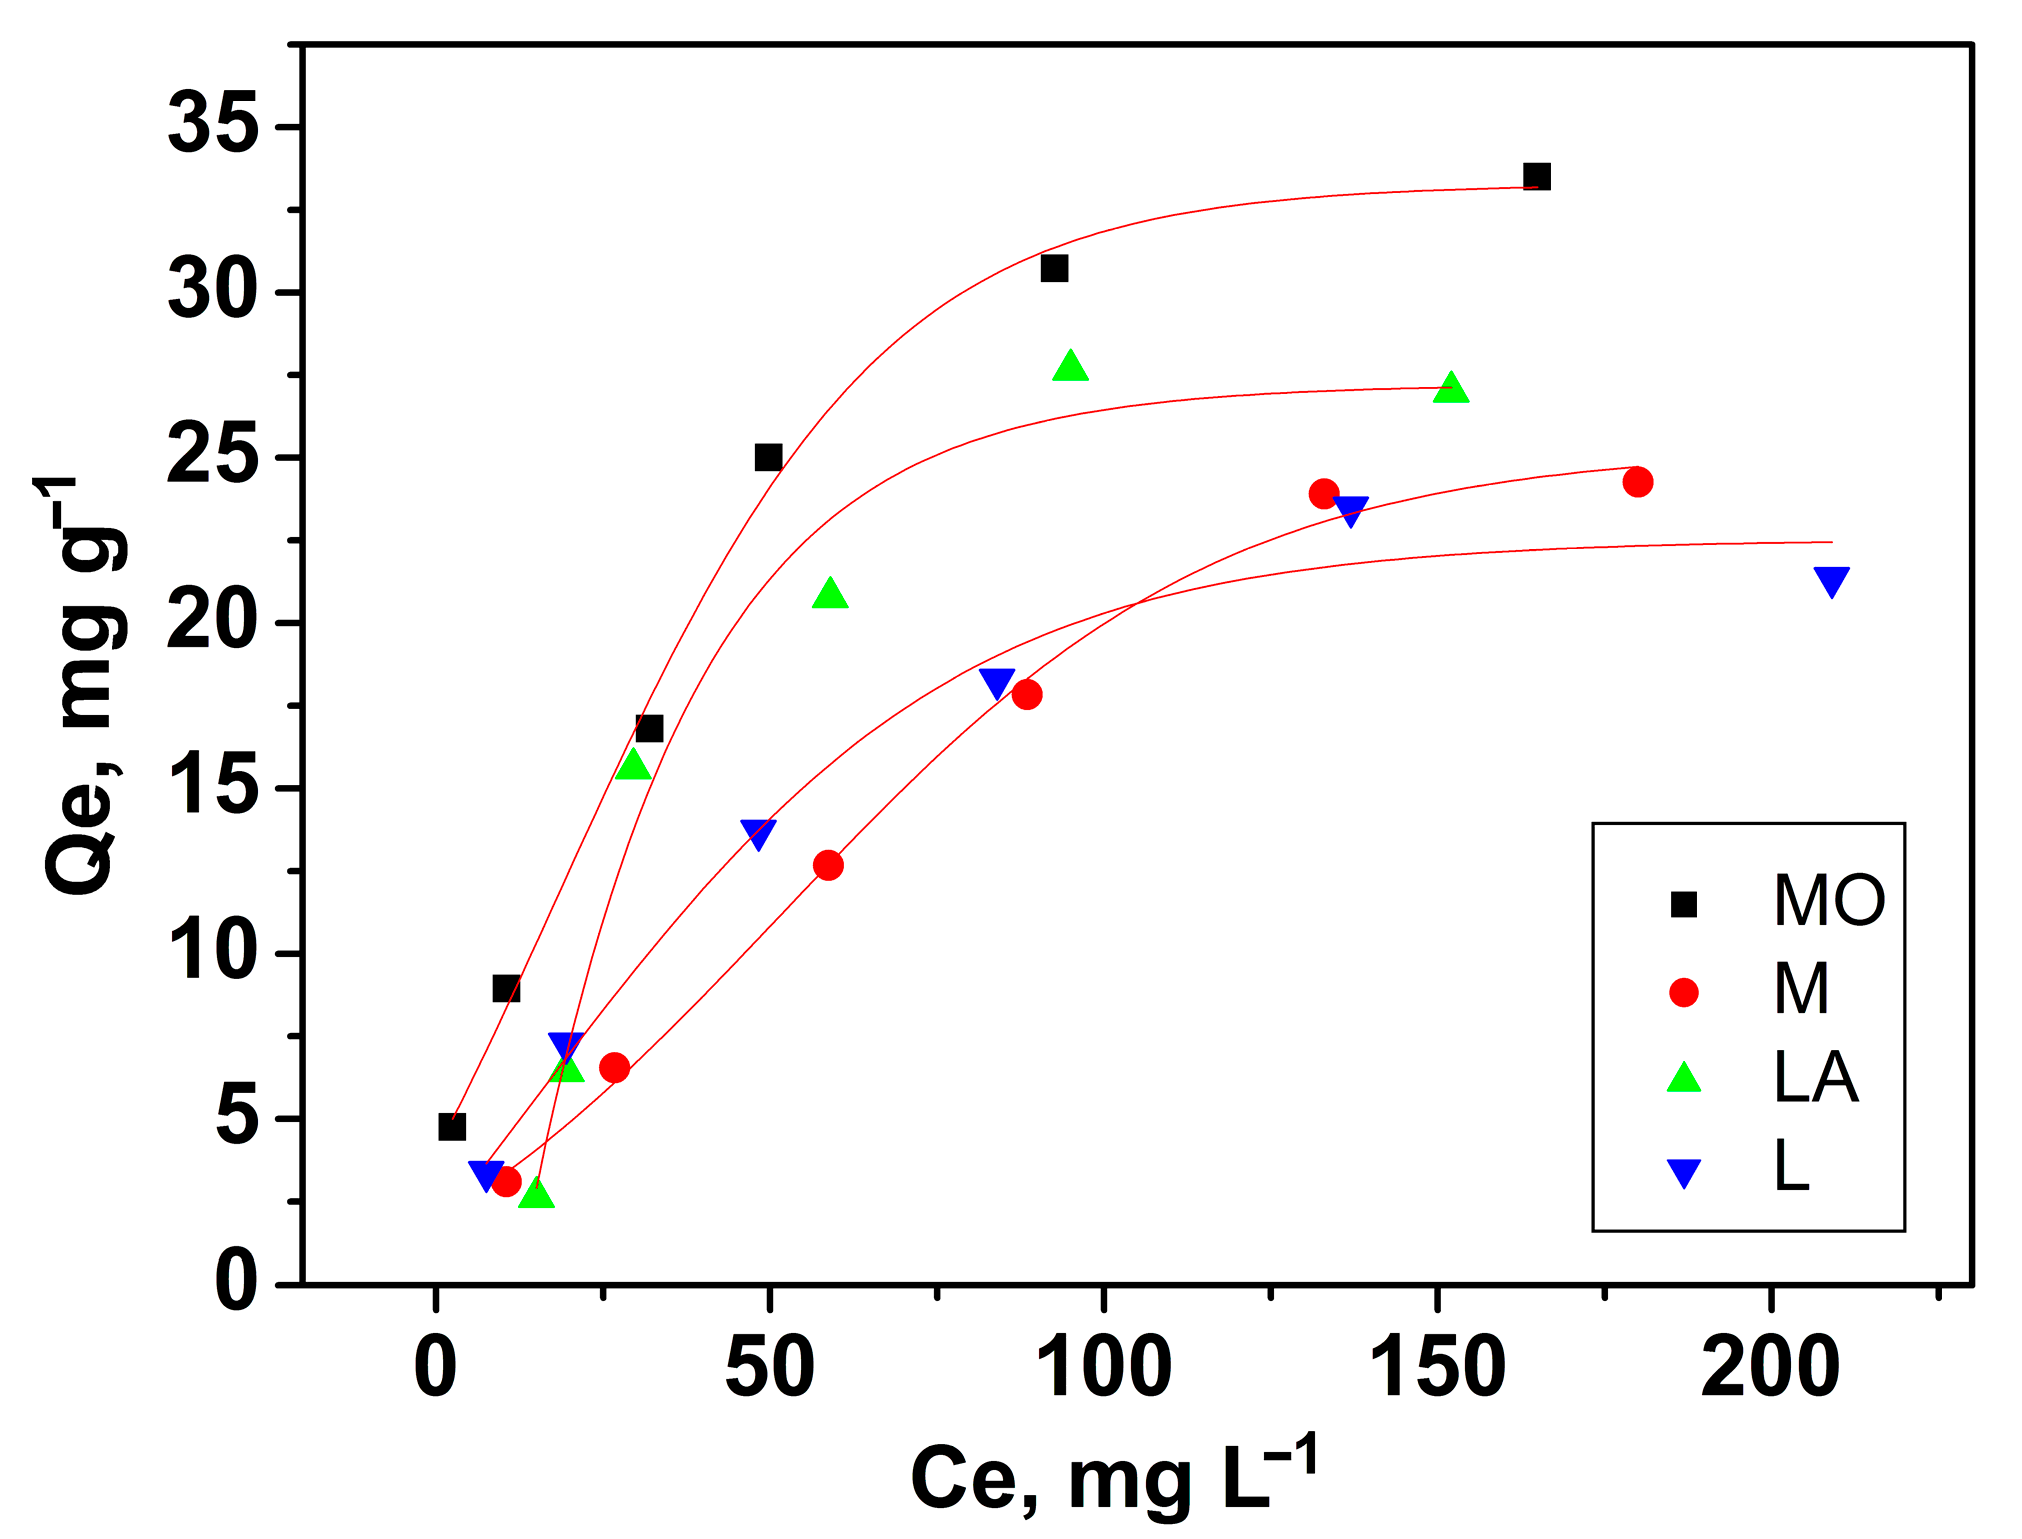
3.2.5. Effect of Initial Concentration

The influence of the initial copper ion concentration on adsorption amounts was evaluated using initial metal ion concentrations ranging from 50 to 500 mg L−1 at a pH of 4.0 (Figure 9). Results indicated that capacity increased within this concentration range. To better understand the adsorption mechanism, various isotherm models were applied to interpret the equilibrium experimental data. Specifically, three linear isotherm models—Langmuir; Freundlich; and Dubinin–Radushkevich—were employed to analyze the experimental results. The specified models, whose equations are formulated based on different principles, are described in Vassileva et al. [40]. Additionally, the chi-square (χ2) test values for each model were calculated.
The Langmuir isotherm assumes a monolayer adsorption on a surface with a finite number of identical sites. It is best suited for processes where adsorption occurs uniformly on the adsorbent surface with no interaction between adsorbed molecules. The Freundlich isotherm is an empirical model that describes adsorption on heterogeneous surfaces with a non-uniform distribution of adsorption heat. The Dubinin–Radushkevich isotherm is used to describe adsorption on porous materials and accounts for the potential energy in the pores. It is particularly useful for distinguishing between physical and chemical adsorption processes, as it provides information about the adsorption mechanism.
To evaluate the agreement between the experimental data and the predictions from the applied models, the chi-square (χ2) test was used as a statistical criterion to determine the suitability of each model for the adsorption process under study. A lower χ2 value indicates a better fit of the experimental data to the corresponding model. The χ2 value is calculated using the formula
χ2 = Σ((Qe,cal − Qe)2/Qe,cal),
where Qe,cal represents the adsorbed amount (mg g−1) predicted by the model, and Qe is the adsorbed amount (mg g−1) obtained experimentally [41].
The isotherm constants, correlation coefficients, and χ2 values for the three models are presented in Table 4. Based on the analysis, the Langmuir model was identified as the most suitable for describing the adsorption process of biomaterials MO, M, and L, indicating homogeneous surfaces, no interactions among adsorbed metal ions, and monolayer copper ion uptake. In contrast, for material LA, the Dubinin–Radushkevich model provided the best fit, suggesting adsorption occurs on heterogeneous surfaces, likely involving pore filling and varying energy sites (see Figure 10).
The highest adsorption capacity for copper ions was observed for the MO material, likely due to its high number of adsorption sites or active functional groups. In contrast, the plant wastes of M and L exhibited 20–30% lower adsorption capacities than the original plant materials, indicating that essential oils contribute to the adsorption process through their functional groups. Despite this reduction, the waste materials still demonstrated good adsorption capacities, confirming their potential as effective biosorbents for copper ions.
In this study, the maximum adsorption capacities for copper ions ranged from 28.08 to 59.95 mg g−1. These values are comparable to those reported in the literature, confirming the suitability of all tested materials for copper removal from aqueous solutions.
It should also be noted that the calculated adsorption energies for the four biomaterials ranged from 0.074 to 0.166 kJ/mol (Table 4). These results suggest that physisorption is probably the dominant mechanism for copper ion adsorption.

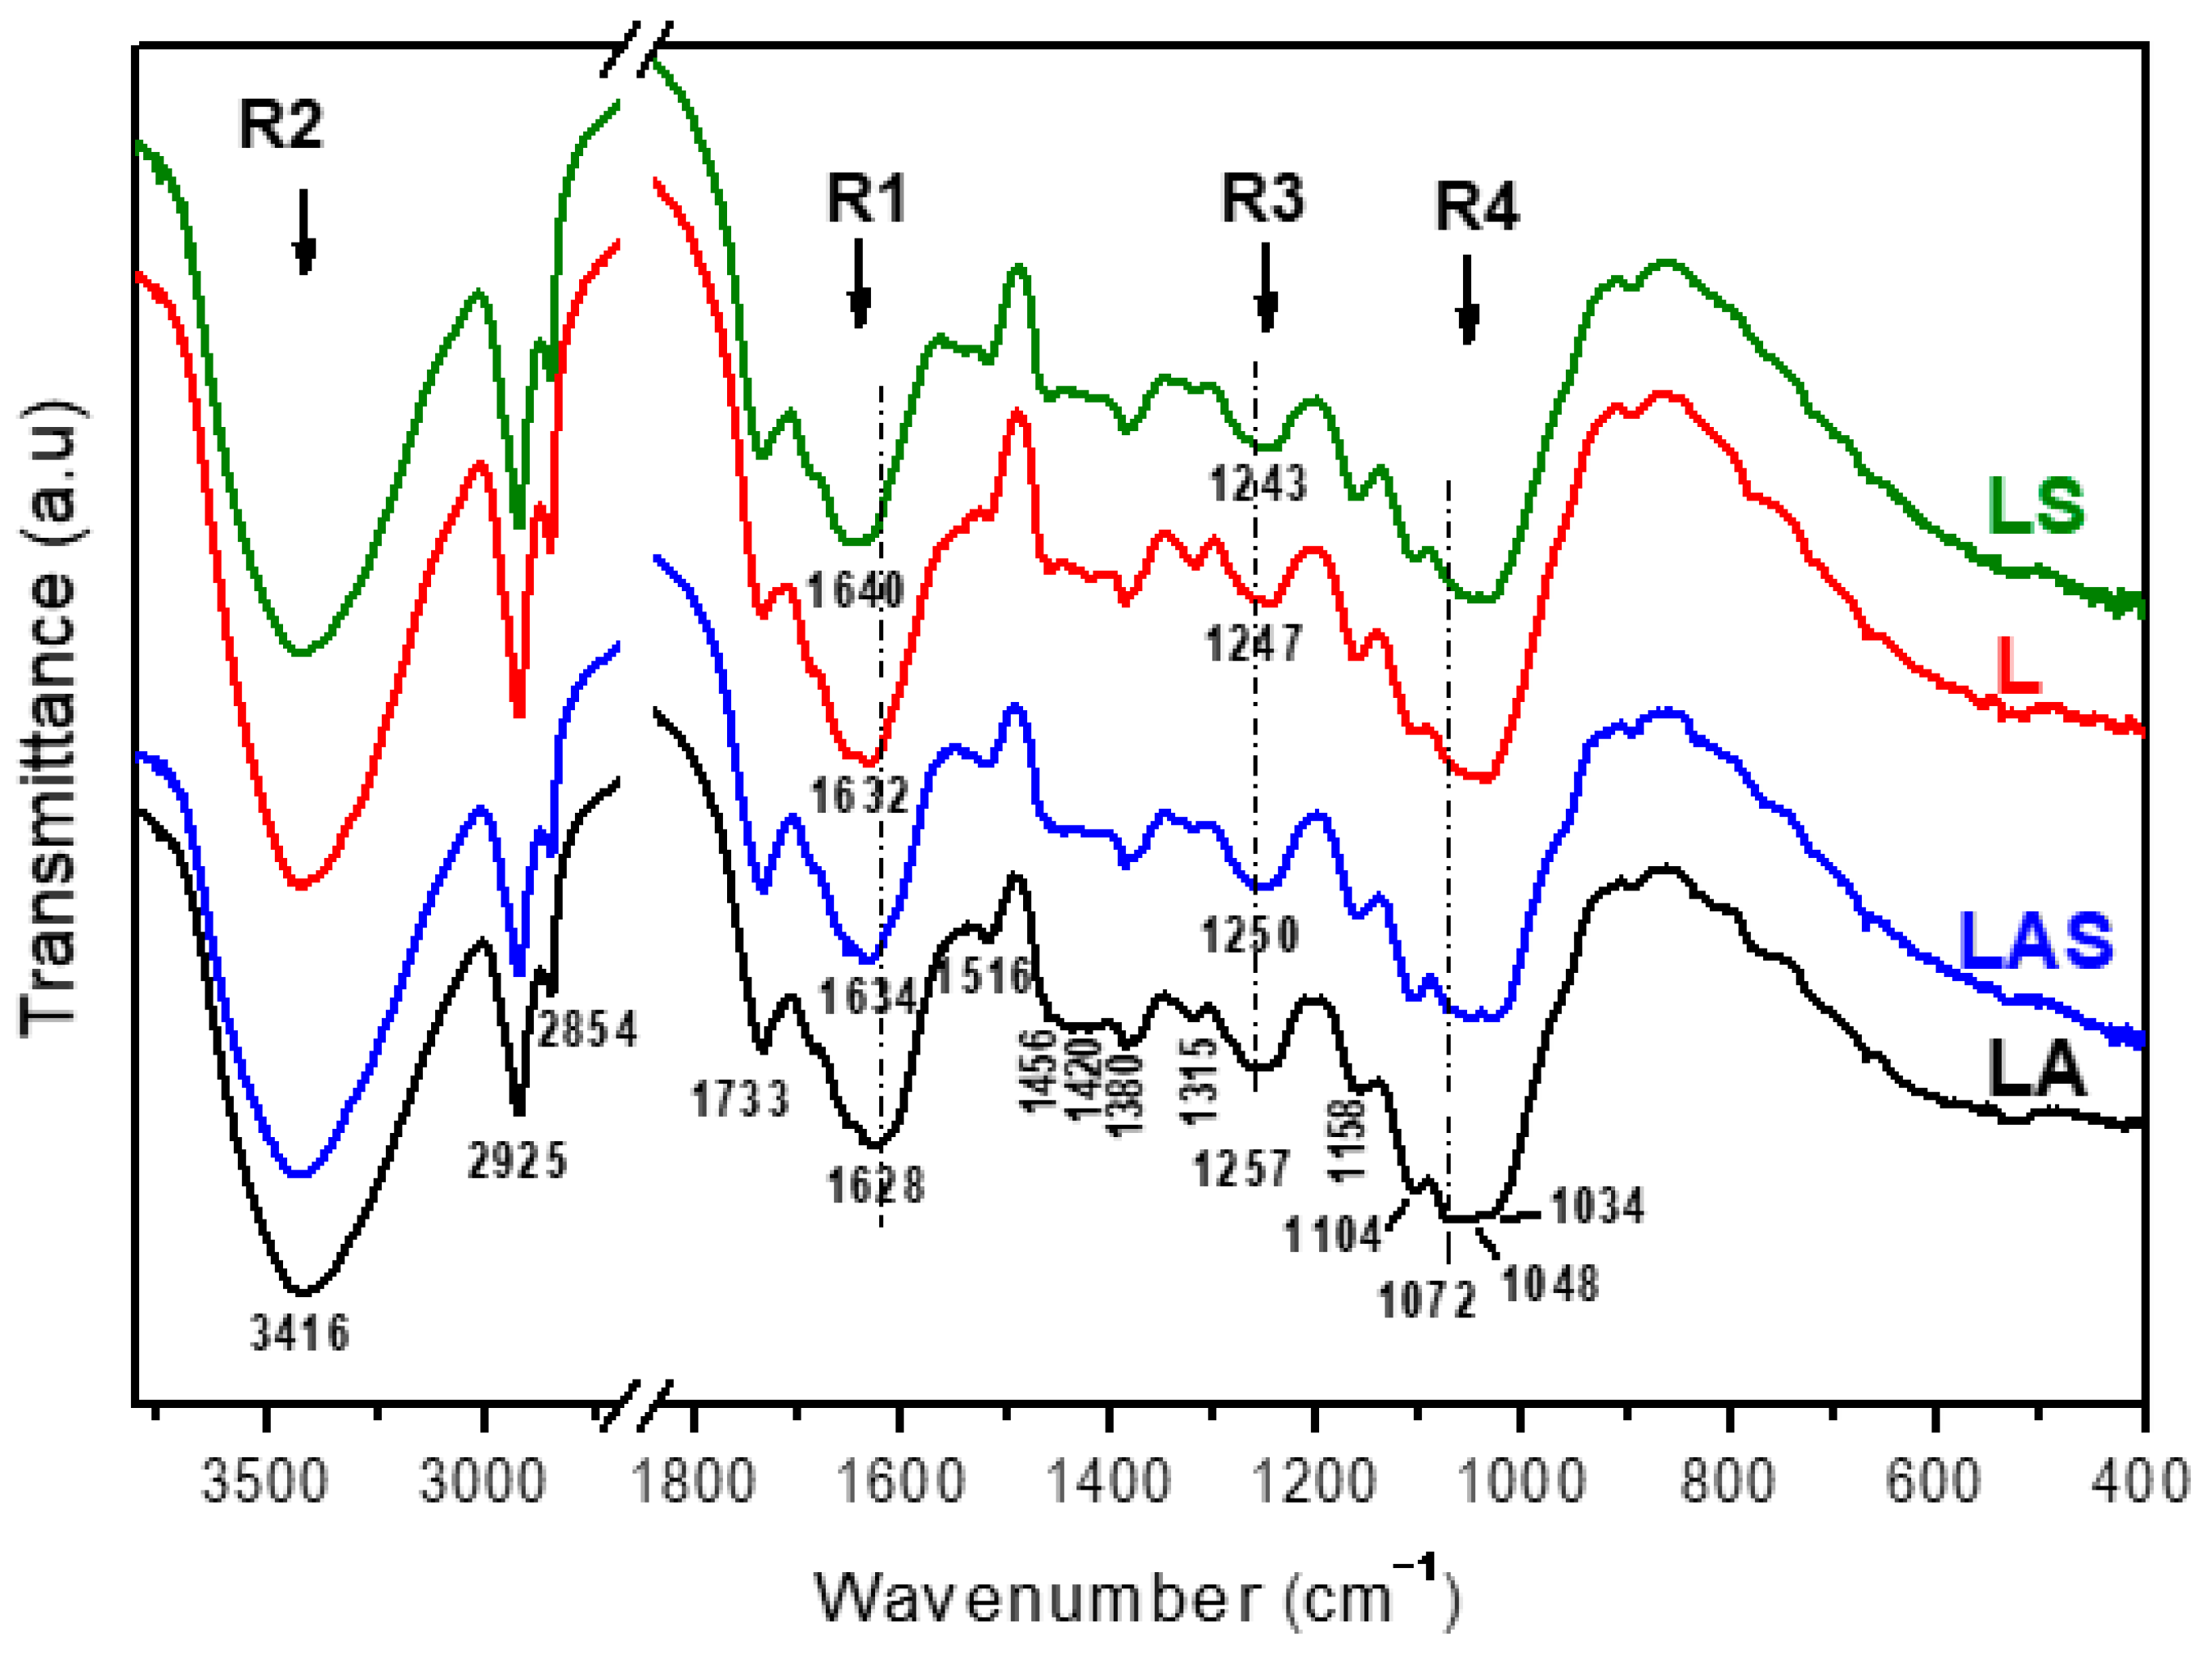
3.2.6. FTIR Analysis
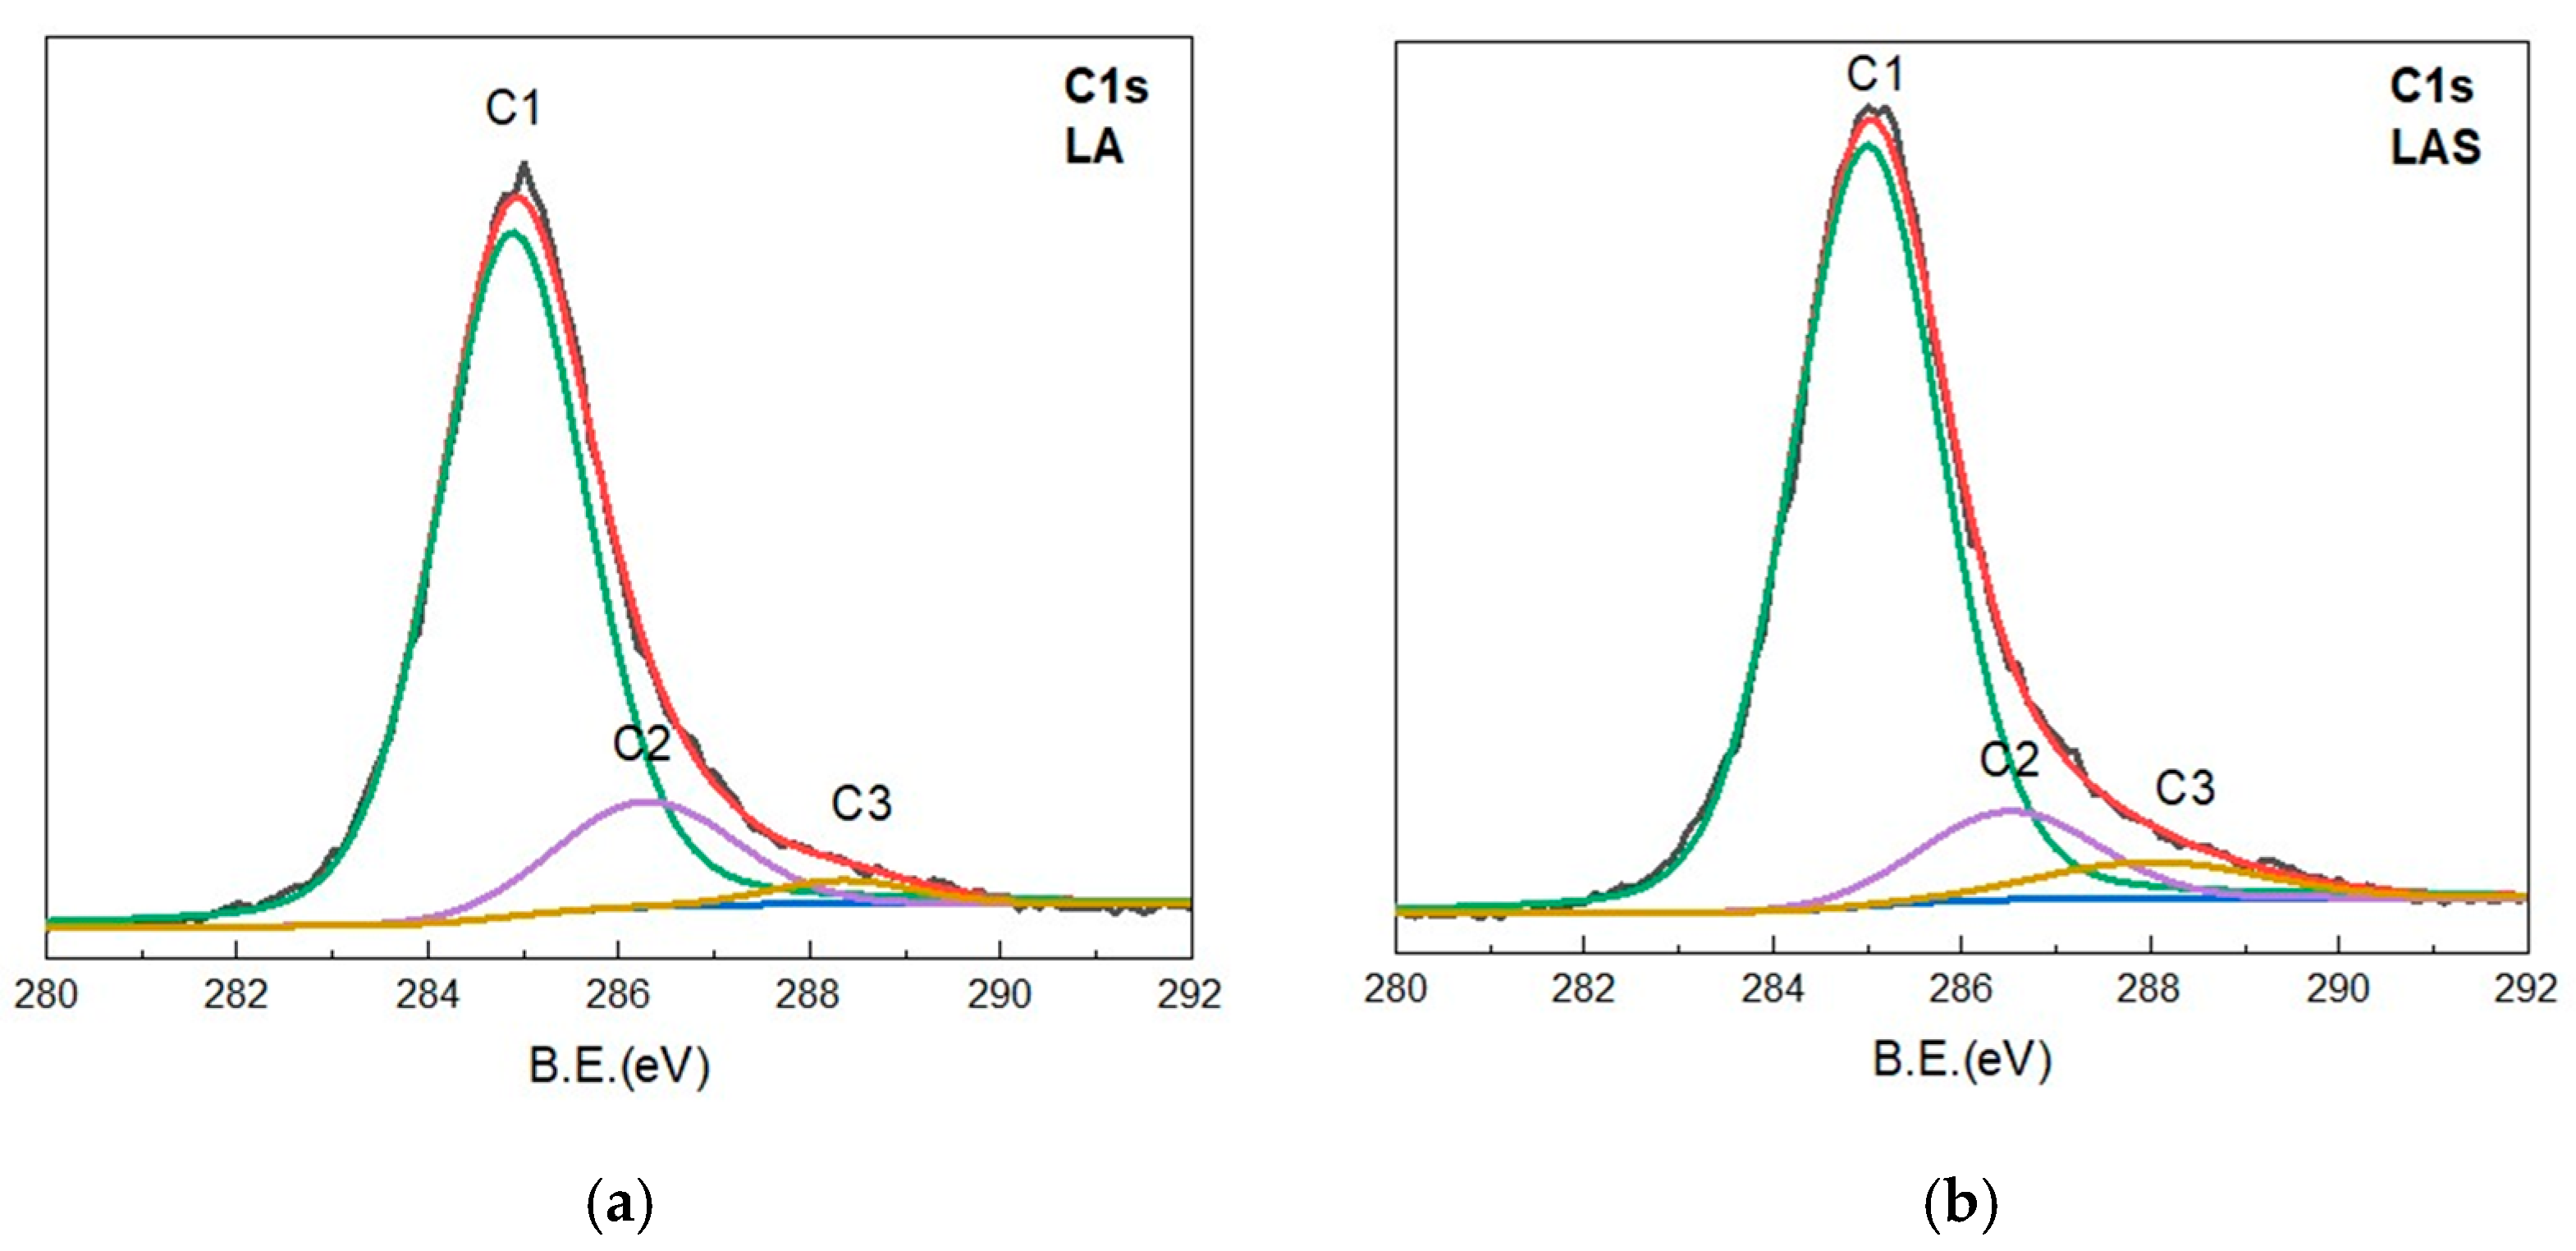
To identify functional groups responsible for the adsorption activity, FTIR spectra of the two plants and their waste products were analyzed before and after Cu sorption (Figure 11 and Figure 12). The spectra of LA and MO are similar, showing broad IR bands due to overlapping a huge number of bands associated with the vibrations of the various structural units building the rich multicomponent composition of the plants. Despite this similarity, differences in band positions and intensities reflect compositional variation. Our previous work on Anethum graveolens L. provides detailed insights into such spectra, closely resembling those of MO and LA [20]. For this study, the focus is on the functional groups involved in Cu sorption.
The IR spectra confirm the presence of oxygen-containing functional groups such as (i) Hydroxyl groups from different phenolic and aliphatic structures (~3400 cm−1); (ii) Carboxylic groups, esters, and ketones (e.g., bands at 1733 cm−1, 1630 cm−1, and 1520 cm−1); and (iii) Functional groups associated with aromatic and aliphatic esters and ethers, as well as phenolic OH groups and alcoholic C-OH groups—bands between 1320 and 1020 cm−1. Notably, essential oil extraction causes minimal spectral changes in waste materials (MS and LS), leaving functional groups intact for Cu ion interaction (Figure 11 and Figure 12). This can be expected considering the small amount of the essential oils present.
Some spectral changes occur in marked regions (R1–R4) after Cu sorption (Figure 11 and Figure 12). Bands around 1628 cm−1 (R1) and 1260 cm−1 (R3) shift slightly (between 4 and 10 cm−1), while intensity changes are observed around 1075 cm−1 (R4). Moreover, only in the case of MOS, two additional spectral features can be observed: A decrease in intensity for the bands at 1410 cm−1 (R2) and 1048 cm−1 in the R4 range (Figure 11). This suggests that in MO, more functional groups, including alcoholic, ether, and ester groups, interact with Cu(II) ions. These interactions likely explain the higher adsorption activity of MO compared to LA (e.g., 100% for MO vs. 68% for LA).
It can be seen that carboxylate, phenolic, alcoholic, ether, and ester groups contribute to Cu2+ biosorption on MO and LA and their wastes. MOs higher adsorption correlates with its broader spectral changes, while waste materials retain sufficient functional groups for effective sorption (80% for MS and 70% for LS).

3.2.7. XPS—Analysis

With surface-sensitive techniques such as XPS, it is useful to examine the carbon XPS spectra of various materials to determine the type and relative amount of chemical groups at their surfaces. In most organic XPS spectra, we would expect to find four functional groups, and the presence of more of one relative to another would be evidence of a chemical change at the surface.
The surfaces of the studied biomaterials were analyzed both before and after adsorption of Cu(II) ions. Evidence for these modifications is apparent from changes observed in the C1s photoelectron spectra. To gain insight into the concentration of functional groups present before and after Cu adsorption, a curve-fitting procedure was performed on the C1s peak for each material under investigation. The results of this fitting procedure revealed the following:
  • The major C1 peak, located at approximately ~285 eV, corresponds to the C–C bond.
  • The second C2 peak, observed at ~286.5 eV, is associated with the C–OH, C–O–C, or C–N bonds.
  • The C3 peak, situated at ~288.0 eV, corresponds to the O–C=O bond (Figure 13 for the samples LA and LAS as representative for all plant materials).
These peaks can be attributed to C atoms in the forms of C–C, C–O (alcoholic or ether), C–O–C (ether), and O–C=O (carboxylate groups or ester groups), respectively.
The quantitative findings are summarized in Table 5. The amount of alcoholic, ether, carboxylate, and ester groups changed after copper adsorption, indicating their involvement in the Cu(II) adsorption process. These findings suggest the formation of surface complexes.
The results from Table 6 confirm the presence of copper on the studied plant materials after the adsorption.
In summary, the findings are consistent with IR analysis, confirming the involvement of hydroxyl, carboxylate, ether, and ester groups in the adsorption of copper(II) ions onto the biosorbent surfaces. Similar group participation has been reported by other researchers for copper biosorption on plant materials and bacteria [42,43,44]. The biosorption of copper ions on the studied plant materials is a complex process, likely involving a combination of surface complexation, electrostatic attraction, and ion exchange.

3.2.8. Experiments with Real Contaminated Water

Industrial effluents typically contain a variety of metal ions and other pollutants. To implement the biosorption process in practical applications and better understand ion competition, increasing investigations are conducted on multicomponent systems. However, most studies utilize synthetic solutions, which do not fully represent real environmental conditions where effluents contain diverse pollutants, including organic compounds that interact with each other [29,45,46].
In this study, the sorbent MO, which demonstrated the highest adsorption capacity, was employed to explore the potential for purifying actual polluted water from the Gelev Chuchur area near the Asarel-Medet mining enterprise in Bulgaria. This area serves as the collection point for drainage water from the Asarel mine. Quantitative multielement TXRF analysis revealed that the water sample contains the following elements: Ca (219 mg L−1), Cu (184 mg L−1), Mn (22.3 mg L−1), K (21.6 mg L−1), Zn (5.1 mg L−1), Fe (3.8 mg L−1), and Ni (1 mg L−1). Notably, the copper concentration exceeds the maximum permissible limits by several times. Additionally, the measured pH was 3, indicating high acidity.
The results showing the degree of purification after the first, second, and third adsorption cycles are presented in Figure 14. Three cycles of adsorption were performed, revealing a purification efficiency of 40.3% after the first cycle, 74.7% after the second, and 90.3% after the third cycle (cumulative adsorption percentage). This indicates that using the plant material for three consecutive cycles can achieve near-complete purification of Cu(II)-contaminated water from the studied source.
For comparison, the adsorption efficiency of Cu(II) ions in a model solution containing only Cu(II) ions at a concentration of 200 mg L−1 and the same pH was 84% after the first cycle—approximately double the efficiency observed with the real sample. This difference highlights the impact of other ions present in the polluted water. These ions also compete for adsorption sites on the sorbent surface, reducing the overall adsorption capacity for Cu(II) ions.

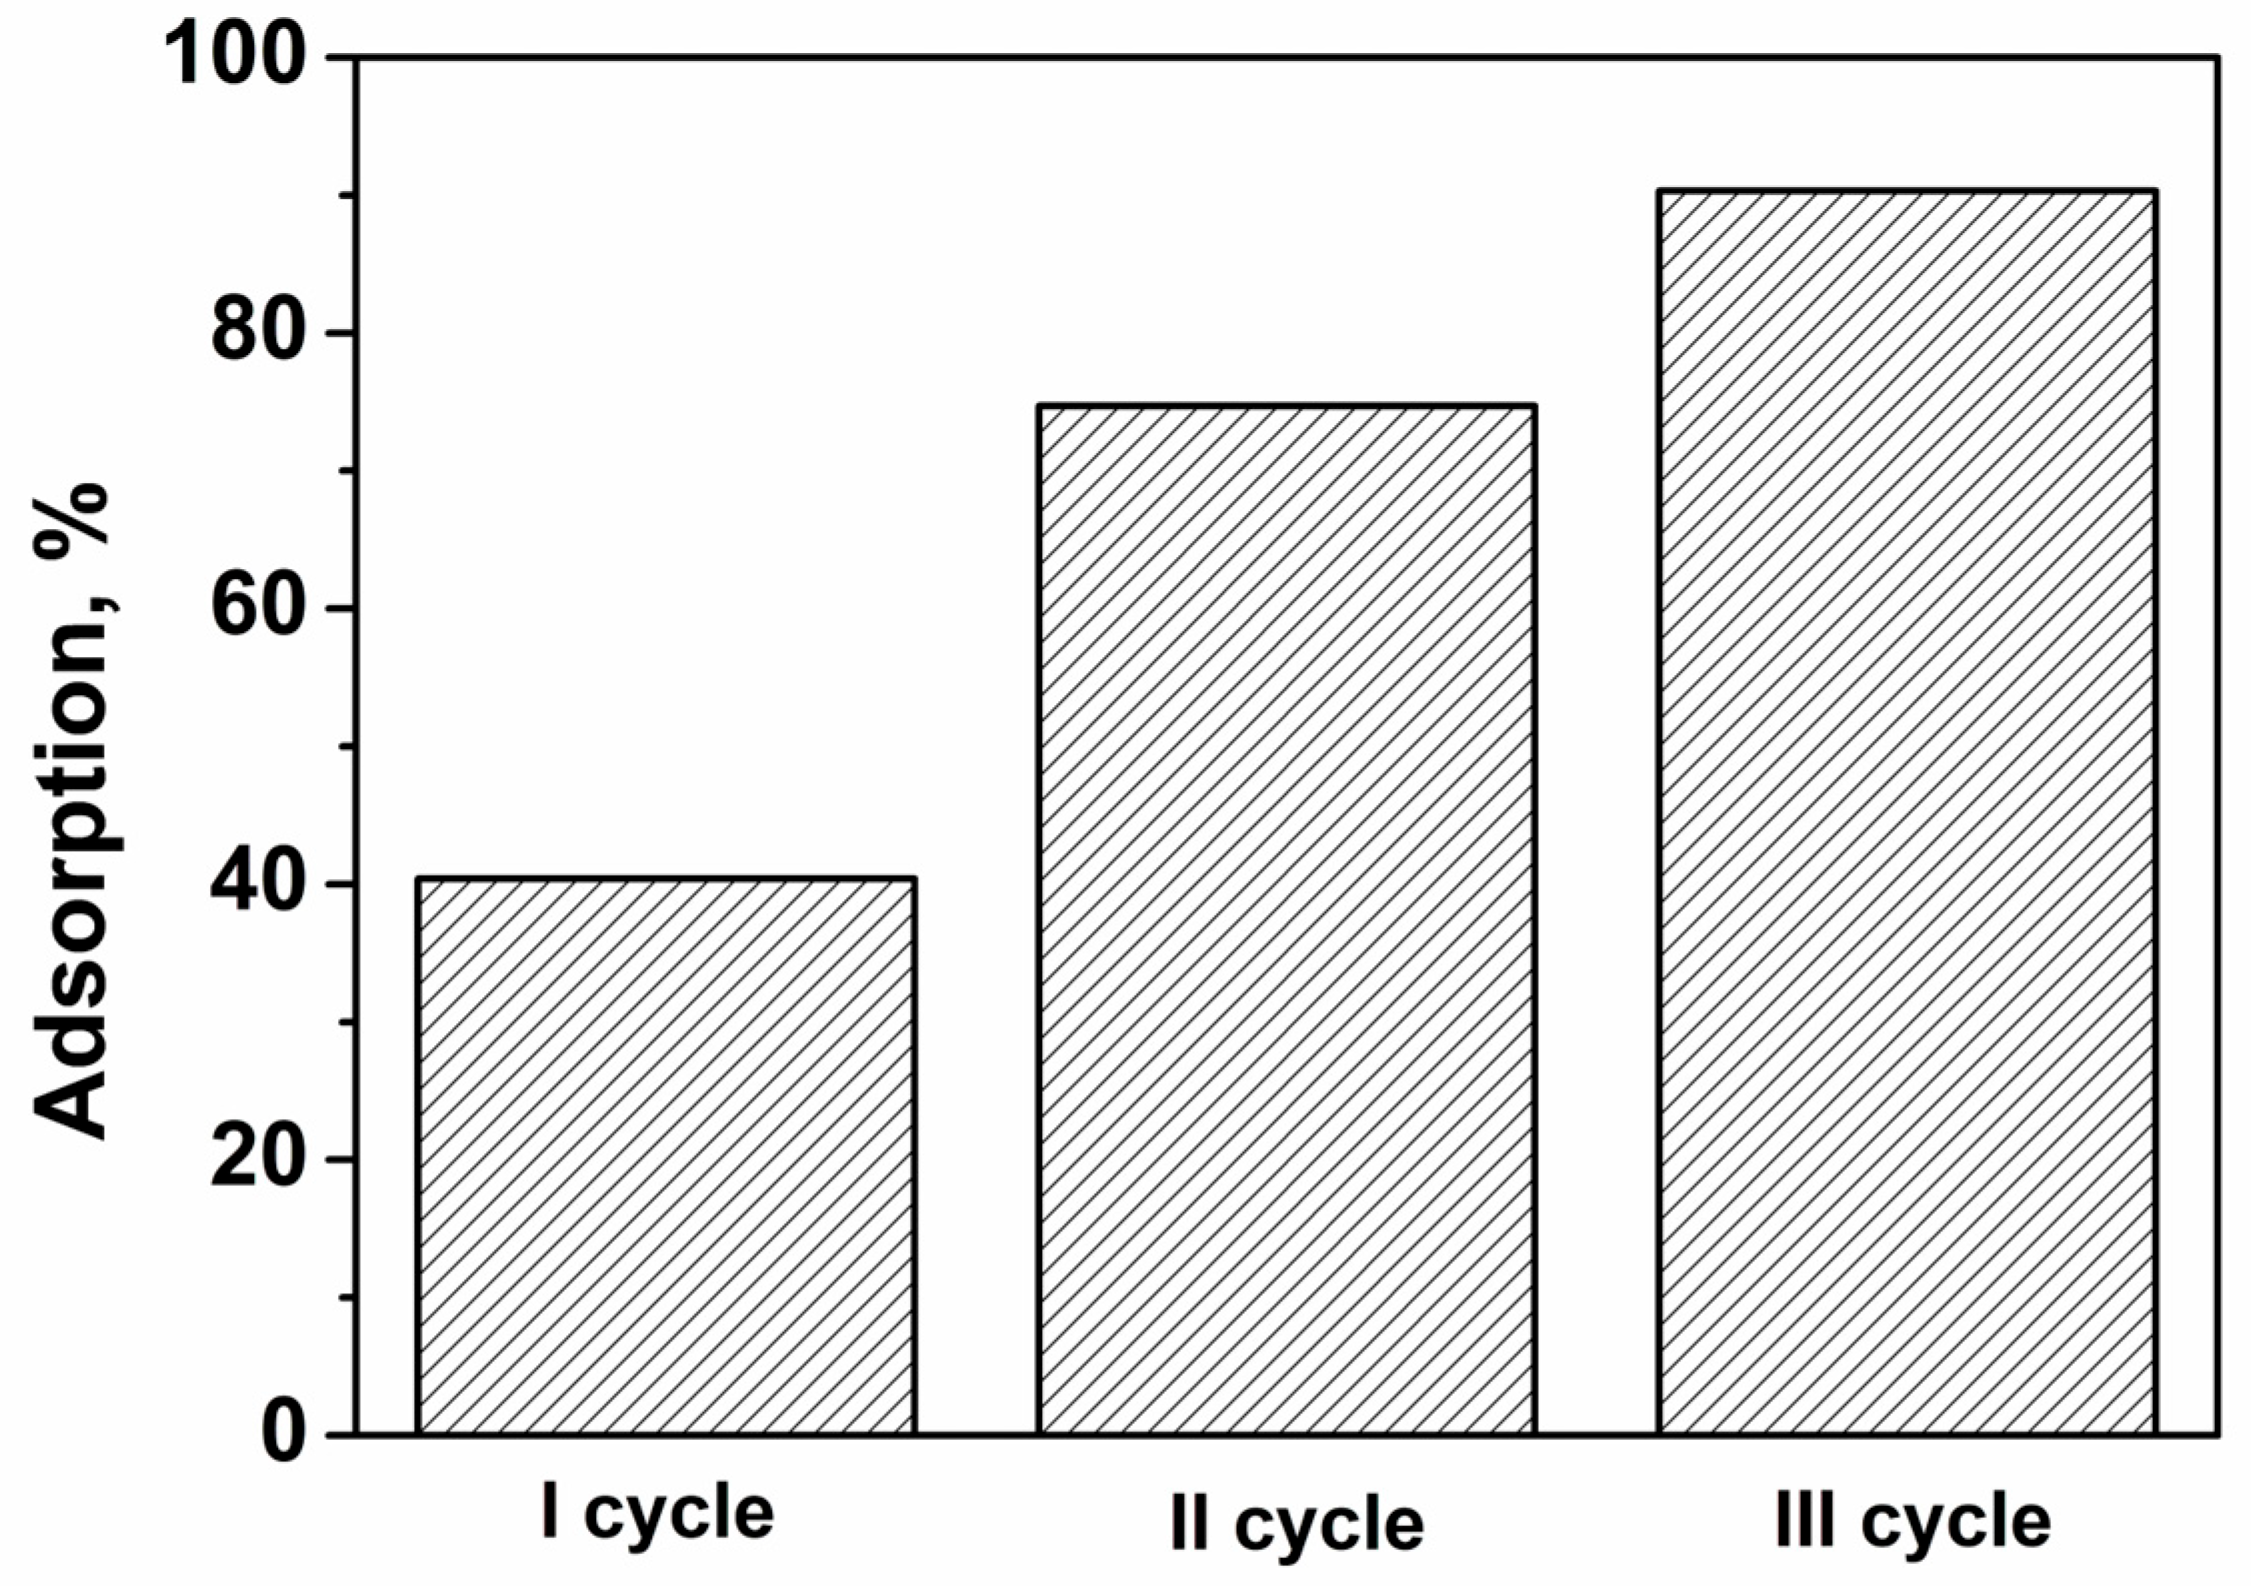
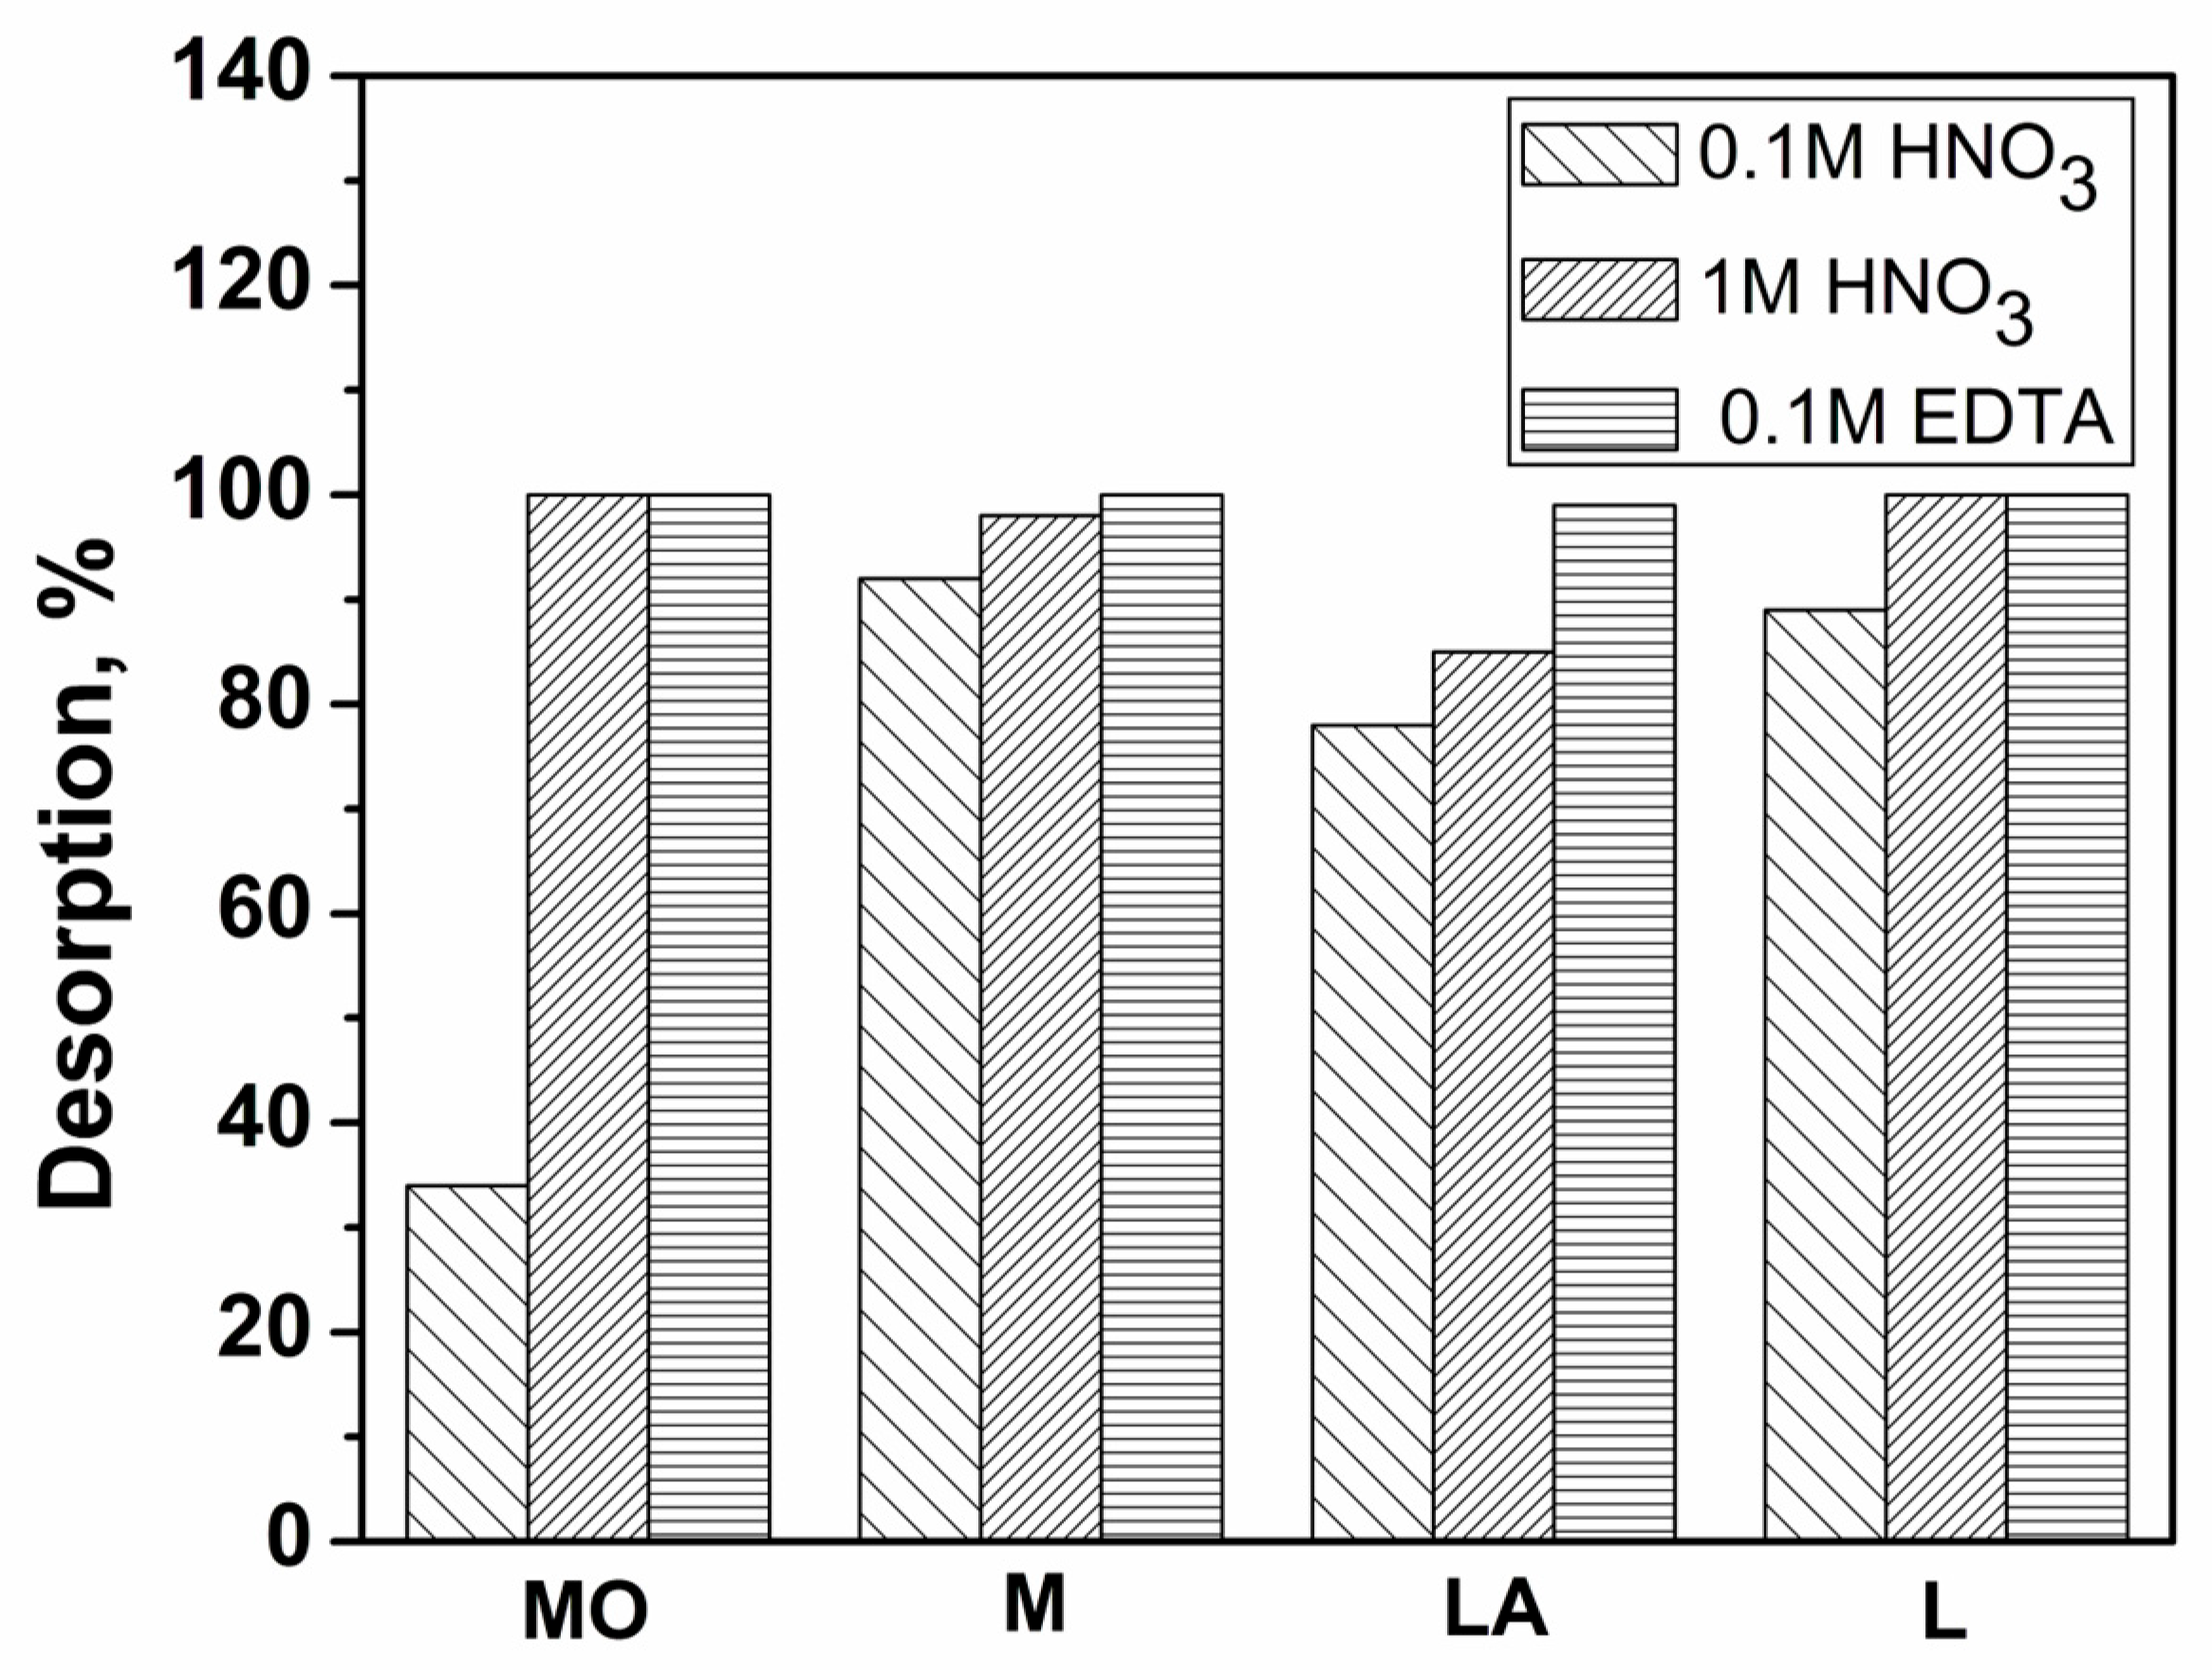
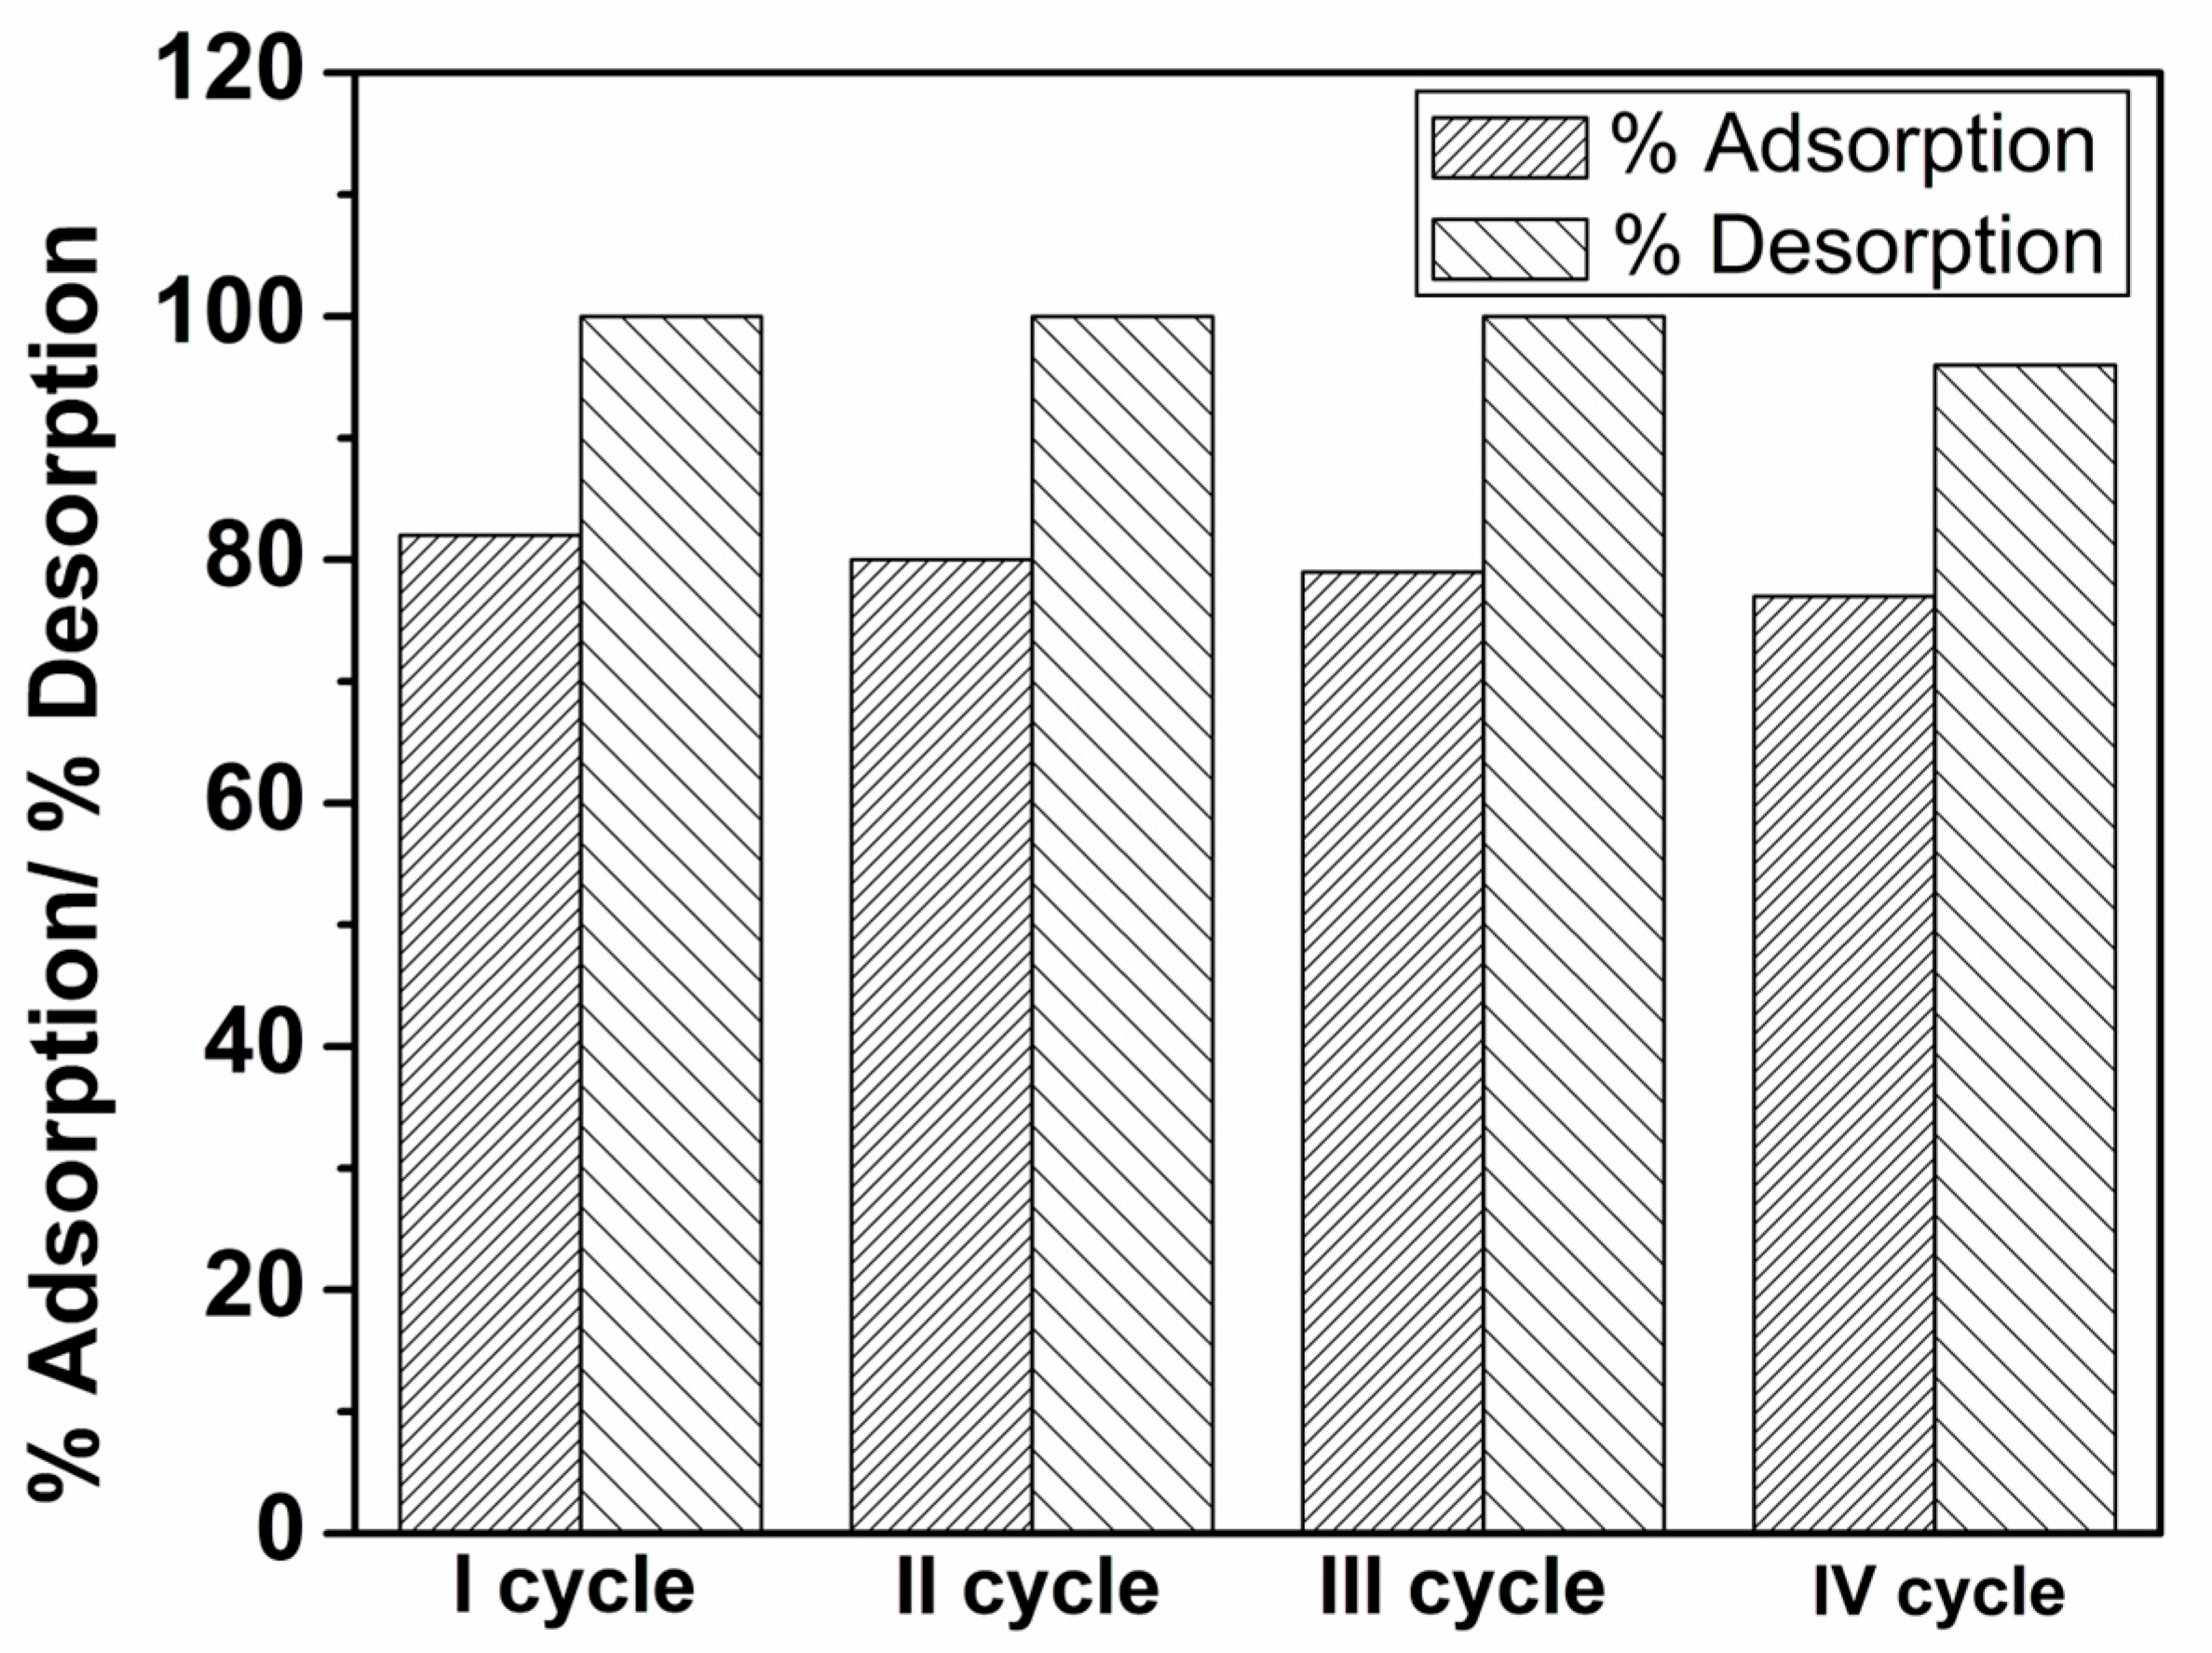
3.2.9. Desorption Experiments and Reusability

Desorption studies have been performed to evaluate the regeneration potential of the selected biosorbents. Since acids are reported in the literature as the best eluents for desorption compared to other alternatives, a non-destructive method using nitric acid (0.1 M HNO3 and 1 M HNO3) and EDTA (0.1 M) was employed to conduct the desorption experiments for the four selected sorbents. The results of this study are presented in Figure 15. It was found that all three desorbing agents can successfully regenerate the biosorbents M, LA, and L. However, for the plant material MO, 0.1 M HNO3 is not an effective eluent, achieving only 34% desorption efficiency. This indicates that copper ions are more strongly bound to the functional groups of MO compared to the other sorbents, necessitating a higher acid concentration (1 M HNO3) to achieve efficient desorption (100%).
The desorption behavior confirms that the adsorption of copper ions involves reversible interactions, including ion exchange and coordination, with the functional groups of the four biosorbents. This reversibility allows plant-based biosorbents to be efficiently regenerated and reused, enhancing their practicality and cost-effectiveness. From a practical and ecological perspective, EDTA is the preferred eluent. It is effective across all biosorbents while reducing the need for highly acidic conditions, making it a more environmentally friendly and less corrosive option for sorbent regeneration.
In this regard, retaining the adsorption capacity of the sorbents after multiple cycles is particularly important. The following Figure 16 presents the results of four adsorption-desorption cycles using 0.1 M EDTA for the MO biosorbent as representative. The adsorption capacity of MO decreases only slightly, from 82% in the first cycle to 77% in the fourth cycle. Meanwhile, the desorption capacity remains high, with 100% desorption efficiency for the first three cycles and 96% for the fourth cycle. This demonstrates that when 0.1 M EDTA is used as the elution agent, the MO biosorbent can be effectively reused at least four times for the adsorption of copper(II) ions.
These findings demonstrate that the studied plant-based materials are promising biosorbents due to their reversible adsorption mechanism, which is highly advantageous for applications in water purification and heavy metal recovery.

4. Conclusions

The adsorption properties of four plant materials—Melissa officinalis L. (MO); Lavandula angustifolia L. (LA); and their respective waste materials (M and L)—towards Cu(II) ions were compared. The samples were characterized using SEM, XRD, BET, FTIR, and DTA/TGA. The optimal pH for adsorption was around four, with equilibrium reached within two minutes for LA, M, and L, and ten minutes for MO. Temperature and sample amount had negligible influence. Adsorption mechanisms were evaluated using Langmuir, Freundlich, and Dubinin–Radushkevich isotherm models, with non-linear chi-square (χ2) tests confirming Langmuir’s suitability for MO, M, and L, while LA aligned better with the Dubinin–Radushkevich model. The maximum adsorption capacities were found to be 59.95 mg g−1 (MO), 47.66 mg g−1 (M), 40.52 mg g−1 (LA), and 28.08 mg g−1 (L), indicating that all materials have potential as effective sorbents for copper(II) ions. Functional groups such as carboxyl, phenol, alcohol, ether, and ester played a key role in the biosorption process. The highest adsorption capacity of MO correlated with more pronounced spectral variations. The waste materials retained sufficient active sites for effective sorption, achieving 80% for M and 70% for L as compared with the initial plant materials MO and LA, respectively. The thermodynamic analysis confirmed that Cu2+ adsorption onto MO and M is an endothermic and spontaneous physisorption process, while for LA and L it is exothermic, with all biosorbents showing negative ΔG0 values indicative of favorable and spontaneous adsorption.
Desorption experiments with 1 M HNO3 and 0.1 M EDTA demonstrated 100% recovery. MO was further tested for real wastewater purification, proving its reusability over four adsorption-desorption cycles with EDTA.
Given adsorption’s focus on innovative biosorption processes and sustainable applications, we believe our study will contribute to the future use of waste residues for environmental remediation.

Author Contributions

Conceptualization, L.I., P.V. and A.D.; methodology, L.I., P.V. and A.D.; software, L.I.; validation, P.V. and A.D.; formal analysis, L.I., P.V., A.D., V.K. and I.A.; investigation, L.I., P.V., A.D., V.K. and I.A.; resources, L.I.; data curation, L.I., V.K. and I.A.; writing—original draft preparation, L.I., P.V., A.D. and V.K.; writing—review and editing, P.V. and A.D.; visualization, L.I., V.K. and I.A.; supervision, P.V. and A.D. All authors have read and agreed to the published version of the manuscript.

Funding

The research received no external funding.

Institutional Review Board Statement

Not applicable.

Informed Consent Statement

Not applicable.

Data Availability Statement

The original contributions presented in this study are included in the article. Further inquiries can be directed to the corresponding author.

Acknowledgments

The authors express a special thanks to the “Essential Oils and Herbs” distillery in Zhelyo Voivoda village, Sliven district, for kindly providing us the plant samples after essential oil extraction. This work was supported by the European Regional Development Fund under the “Research, Innovation and Digitization for Smart Transformation” program 2021–2027 under the Project BG16RFPR002-1.014-0006 “National Center of Excellence Mechatronics and Clean Technologies”; National Scientific Infrastructure “Energy Storage and Hydrogen Energy” (ESHER), funded by the Ministry of Education and Science, contract No. DO1-349/13.12.2023. Research equipment of distributed research infrastructure INFRAMAT (part of the Bulgarian National Roadmap for Research Infrastructures) supported by the Bulgarian Ministry of Education and Science was used in this investigation.

Conflicts of Interest

The authors declare no conflicts of interest.

References

  1. Alizadeh Behbahani, B.; Shahidi, F. Melissa officinalis Essential Oil: Chemical Compositions, Antioxidant Potential, Total Phenolic Content and Antimicrobial Activity. Nutr. Food Sci. Res. 2019, 6, 17–25. [Google Scholar] [CrossRef]
  2. Lakušic, B.; Lakušic, D.; Ristic, M.; Marčetic, M.; Slavkovska, V. Seasonal Variations in the Composition of the Essential Oils of Lavandula angustifolia (Lamiaceae). Nat. Prod. Commun. 2014, 9, 859–862. [Google Scholar] [CrossRef] [PubMed]
  3. Radulescu, M.; Jianu, C.; Lukinich-Gruia, A.T.; Mioc, M.; Mioc, A.; Şoica, C.; Stana, L.G. Chemical Composition, In Vitro and In Silico Antioxidant Potential of Melissa officinalis subsp. officinalis Essential Oil. Antioxidants 2021, 10, 1081. [Google Scholar] [CrossRef] [PubMed]
  4. Çelebi, Ö.; Fidan, H.; Iliev, I.; Petkova, N.; Dincheva, I.; Gandova, V.; Stankov, S.; Stoyanova, A. Chemical composition, biological activities, and surface tension properties of Melissa officinalis L. essential oil. Turk. J. Agric. For. 2023, 47, 67–78. [Google Scholar] [CrossRef]
  5. Kıvrak, Ş. Essential oil composition and antioxidant activities of eight cultivars of Lavender and Lavandin from western Anatolia. Ind. Crops Prod. 2018, 117, 88–96. [Google Scholar] [CrossRef]
  6. Aprotosoaie, A.C.; Gille, E.; Trifan, A.; Luca, V.S.; Miron, A. Essential oils of Lavandula genus: A systematic review of their chemistry. Phytochem. Rev. 2017, 16, 761–799. [Google Scholar] [CrossRef]
  7. Garzoli, S.; Turchetti, G.; Giacomello, P.; Tiezzi, A.; Laghezza Masci, V.; Ovidi, E. Liquid and Vapour Phase of Lavandin (Lavandula × intermedia) Essential Oil: Chemical Composition and Antimicrobial Activity. Molecules 2019, 24, 2701. [Google Scholar] [CrossRef]
  8. Ye, R.; Tian, K.; Hu, H.; Li, P.; Tian, X. Extraction process optimization of essential oil from Mellissa officinalis L. using a new ultrasound-microwave hybrid-assisted Clevenger hydrodistillation. Ind. Crops Prod. 2023, 203, 117165. [Google Scholar] [CrossRef]
  9. Souihi, M.; Amri, I.; Souissi, A.; Hosni, K.; Ben Brahim, N.; Annabi, M. Essential oil and fatty acid composition of Melissa officinalis L. Prog. Nutr. 2020, 22, 253–258. [Google Scholar] [CrossRef]
  10. Marcelino, S.; Gaspar, P.D.; Paço, A. Sustainable Waste Management in the Production of Medicinal and Aromatic Plants—A Systematic Review. Sustainability 2023, 15, 13333. [Google Scholar] [CrossRef]
  11. Arabian, S.; Ziarati, P.; Sawicka, B. Waste Herbal and Black Tea as a Novel Adsorbent for Detoxification of Pharmaceutical Effluent. J. Med. Discov. 2020, 5, 1–15. [Google Scholar] [CrossRef]
  12. Ivanova, L.P.; Detcheva, A.K.; Vassileva, P.S. Characterization of Two Bulgarian Herbs for Use as Biosorbents for Copper(II). Anal. Lett. 2019, 52, 2650–2662. [Google Scholar] [CrossRef]
  13. Tanasa, A.; Puitel, A.C.; Zaharia, C.; Suteu, D. Sorption of reactive dyes from aqueous media using the lavender waste as biosorbent. Desalin Water Treat. 2021, 236, 348–358. [Google Scholar] [CrossRef]
  14. Hanif, A.; Bhatti, H.N.; Hanif, M.A. Removal and recovery of Cu(II) and Zn(II) using immobilized Mentha arvensis distillation waste biomass. Ecol. Eng. 2009, 35, 1427–1434. [Google Scholar] [CrossRef]
  15. Riaz, B.; Ansari, T.M.; Hanif, M.A.; Riaz, S.; Khan, M.A.; Riaz, M.; Jilani, M.I. Utilization of Extensively Available Environmental Waste Mentha spicata for Uptake of Pb(II) from Aqueous Solutions. Asian J. Chem. 2013, 25, 4551–4555. [Google Scholar] [CrossRef]
  16. Iftikhar, A.R.; Bhatti, H.N.; Hanif, M.A.; Nadeem, R. Kinetic and thermodynamic aspects of Cu(II) and Cr(III) removal from aqueous solutions using rose waste biomass. J. Hazard. Mater. 2009, 161, 941–947. [Google Scholar] [CrossRef]
  17. Nasir, M.H.; Nadeem, R.; Akhtar, K.; Hanif, M.A.; Khalid, A.M. Efficacy of modified distillation sludge of rose (Rosa centifolia) petals for lead(II) and zinc(II) removal from aqueous solutions. J. Hazard. Mater. 2007, 147, 1006–1014. [Google Scholar] [CrossRef]
  18. Cuppett, J.D.; Duncan, S.E.; Dietrich, A.M. Evaluation of copper speciation and water quality factors that affect aqueous copper tasting response. Chem. Senses 2006, 31, 689–697. [Google Scholar] [CrossRef]
  19. Kaur, A.; Khanna, A.; Aleksandrov, L.I. Structural, thermal, optical and photo-luminescent properties of barium tellurite glasses doped with rare-earth ions. J. Non-Cryst. Solids 2017, 476, 67–74. [Google Scholar] [CrossRef]
  20. Ivanova, L.P.; Koleva, V.G.; Vassileva, P.S.; Avramova, I.A.; Detcheva, A.K. Study on the adsorption mechanism of copper (II) ions onto Anethum graveolens L. Comptes Rendus Académie Bulg. Sci. 2021, 74, 1305–1313. [Google Scholar] [CrossRef]
  21. Ciolacu, D.; Ciolacu, F.; Popa, V.I. Amorphous cellulose—Structure and characterization. Cellul. Chem. Technol. 2011, 45, 13–21. [Google Scholar]
  22. Hongzhang, C. Biotechnology of Lignocellulose: Theory and Pratice; Springer: London, UK, 2014. [Google Scholar]
  23. Yuvaraja, G.; Krishnaiah, N.; Subbaiah, M.V.; Krishnaiah, A. Biosorption of Pb(II) from aqueous solution by Solanum melongena leaf powder as a low-cost biosorbent prepared from agricultural waste. Colloids Surf. B Biointerfaces 2014, 114, 75–81. [Google Scholar] [CrossRef]
  24. Park, S.; Baker, J.O.; Himmel, M.E.; Parilla, P.A.; Johnson, D.K. Cellulose crystallinity index: Measurement techniques and their impact on interpreting cellulase performance. Biotechnol. Biofuels 2010, 3, 10. [Google Scholar] [CrossRef]
  25. Mutungi, C.; Passauer, L.; Onyango, C.; Jaros, D.; Rohm, H. Debranched cassava starch crystallinity determination by Raman spectroscopy: Correlation of features in Raman spectra with X-ray diffraction and 13C CP/MAS NMR spectroscopy. Carbohydr. Polym. 2012, 87, 598–606. [Google Scholar] [CrossRef]
  26. Araújo, C.S.T.; Almeida, I.L.S.; Rezende, H.C.; Marcionilio, S.M.L.O.; Leon, J.J.L.; de Matos, T.N. Elucidation of mechanism involved in adsorption of Pb(II) onto lobeira fruit (Solanum lycocarpum) using Langmuir, Freundlich and Temkin isotherms. Microchem. J. 2018, 137, 348–354. [Google Scholar] [CrossRef]
  27. Moawed, E.A.; Eissa, M.S.; Al-Tantawy, S.A. Application of polyurethane foam/zinc oxide nanocomposite for antibacterial activity, detection, and removal of basic dyes from wastewater. Int. J. Environ. Sci. Technol. 2023, 20, 7767–7774. [Google Scholar] [CrossRef]
  28. Lee, S.-Y.; Choi, H.-J. Persimmon leaf bio-waste for adsorptive removal of heavy metals from aqueous solution. J. Environ. Manag. 2018, 209, 382–392. [Google Scholar] [CrossRef]
  29. Redha, A.A. Removal of heavy metals from aqueous media by biosorption. Arab. J. Basic Appl. Sci. 2020, 27, 183–193. [Google Scholar] [CrossRef]
  30. Akpomie, K.G.; Conradie, J. Banana peel as a biosorbent for the decontamination of water pollutants. A review. Environ. Chem. Lett. 2020, 18, 1085–1112. [Google Scholar] [CrossRef]
  31. Ali, S.; La Nafie, N.; Taba, P. Biosorption of Cu (II) Metal Ions By Dragon Fruit Skin (Hylocereus polyrhizus). J. Akta Kim. Indones. 2018, 11, 21–31. [Google Scholar] [CrossRef]
  32. Todorciuc, T.; Bulgariu, L.; Popa, V.I. Adsorption of Cu(II) from aqueous solution on wheat straw lignin: Equilibrium and kinetic studies. Cellul. Chem. Technol. 2015, 49, 439–447. [Google Scholar]
  33. Krstić, V.; Urošević, T.; Pešovski, B. A review on adsorbents for treatment of water and wastewaters containing copper ions. Chem. Eng. Sci. 2018, 192, 273–287. [Google Scholar] [CrossRef]
  34. Shuhaimen, M.S.; Abdulah, E.N.; Salim, R.M.; Samah, M.A.A.; Omar, M.N.; Ahmad, M.N. Adsorption study on the removal of copper ions from aqueous solution using sodium hydroxide-modified Carica papaya peels. Malays. J. Anal. Sci. 2019, 23, 926–937. [Google Scholar] [CrossRef]
  35. Anastopoulos, I.; Robalds, A.; Tran, H.N.; Mitrogiannis, D.; Giannakoudakis, D.A.; Hosseini-Bandegharaei, A.; Dotto, G.L. Removal of heavy metals by leaves-derived biosorbents. Environ. Chem. Lett. 2018, 17, 755–766. [Google Scholar] [CrossRef]
  36. Chubar, N.; Carvalho, J.R.; Correia, M.J.N. Cork biomass as biosorbent for Cu(II), Zn(II) and Ni(II). Colloids Surf. A 2004, 230, 57–65. [Google Scholar] [CrossRef]
  37. Vassileva, P.S.; Detcheva, A.K.; Ivanova, L.P.; Evtimova, S.K. Biosorption of Cd2+ ions using Mentha spicata L. and Ruta graveolens L. Comptes Rendus Académie Bulg. Sci. 2017, 70, 497–504. [Google Scholar]
  38. Vassileva, P.; Detcheva, A.; Uzunov, I.; Uzunova, S. Removal of Metal Ions from Aqueous Solutions Using Pyrolyzed Rice Husks: Adsorption Kinetics and Equilibria. Chem. Eng. Commun. 2013, 200, 1578. [Google Scholar] [CrossRef]
  39. Jawad, A.H.; Rashid, R.A.; Ishak, M.A.M.; Ismail, K. Adsorptive removal of meth-ylene blue by chemically treated cellulosic waste banana (Musa sapientum) peels. J. Taibah Univ. Sci. 2018, 12, 809–819. [Google Scholar] [CrossRef]
  40. Vassileva, P.S.; Ivanova, L.P.; Detcheva, A.K. Adsorption studies of a material based on the medicinal plant yarrow for the removal of Cu2+ ions from aqueous solutions. Bulg. Chem. Commun. 2022, 54, 019–024. [Google Scholar]
  41. Gentscheva, G.; Vassileva, P.; Marinkov, N.; Tzvetkova, C.; Kovacheva, D. Investi-gation of the possibility for removal of hexavalent chromium using manganese ferrite na-noparticles. Comptes Rendus Académie Bulg. Sci. 2020, 73, 1229–1238. [Google Scholar] [CrossRef]
  42. Zheng, J.-C.; Feng, H.-M.; Lam, M.H.-W.; Lam, P.K.-S.; Ding, Y.-W.; Yu, H.-Q. Re-moval of Cu(II) in aqueous media by biosorption using water hyacinth roots as a bio-sorbent material. J. Hazard. Mater. 2009, 171, 780–785. [Google Scholar] [CrossRef] [PubMed]
  43. Vázquez, G.; Calvo, M.; Sonia Freire, M.; Gonzalez-Alvarez, J.; Antorrena, G. Chestnut shell as heavy metal adsorbent: Optimization study of lead, copper and zinc cat-ions removal. J. Hazard. Mater. 2009, 172, 1402–1414. [Google Scholar] [CrossRef] [PubMed]
  44. Zhang, H.; Hu, X.; Lu, H. Ni(II) and Cu(II) removal from aqueous solution by a heavy metal-resistance bacterium: Kinetic, isotherm and mechanism studies. Water Sci. Technol. 2017, 76, 859–868. [Google Scholar] [CrossRef] [PubMed]
  45. Nguyen, T.A.H.; Ngo, H.H.; Guo, W.S.; Zhang, J.; Liang, S.; Yue, Q.Y.; Li, Q.; Ngu-yen, T.V. Applicability of agricultural waste and by-products for adsorptive removal of heavy metals from wastewater. Bioresour. Technol. 2013, 148, 574–585. [Google Scholar] [CrossRef]
  46. Jain, C.K.; Malik, D.S.; Yadav, A.K. Applicability of plant based biosorbents in the removal of heavy metals: A review. Environ. Process 2016, 3, 495–523. [Google Scholar] [CrossRef]
Figure 1. XRD curves of plant materials MO, M, LA, and L.
Applsci 15 07695 g001
Figure 2. TG/DTA curves of plant materials MO (a), M (b), LA (c), and L (d).
Applsci 15 07695 g002
Figure 3. Adsorption-desorption isotherms and pore size distribution of MO (a) and M (b), LA (c) and L (d).
Applsci 15 07695 g003
Figure 4. SEM images of the surface of LA (a) and L (b) at 10 or 20.00 kV and SE detector.
Applsci 15 07695 g004
Figure 5. Influence of pH on the amount of adsorbed Cu(II) ions onto MO, M, LA, and L.
Applsci 15 07695 g005
Figure 6. Influence of contact time on the amount of adsorbed Cu(II) ions onto MO, M, LA, and L.
Applsci 15 07695 g006
Figure 7. Influence of the temperature on the amount of adsorbed Cu(II) ions onto M, LA, L, and MO.
Applsci 15 07695 g007
Figure 8. Effect of sorbent amount on the percent adsorption of copper ions at the surface of L, M, MO, and LA.
Applsci 15 07695 g008
Figure 9. Influence of initial concentration on the adsorption of copper ions at the surface of MO, M, LA, and L.
Applsci 15 07695 g009
Figure 10. Adsorption isotherms towards Cu(II) ions for LA.
Applsci 15 07695 g010
Figure 11. FTIR spectra of MO and waste material M and after Cu(II) sorption: MOS and MS, respectively. In the spectra of M, MOS, and MS. Only the bands with frequency changes in comparison with M are explicitly indicated with the corresponding numbers. The dash-dot lines note the bands that undergo a change in both frequency and intensity.
Applsci 15 07695 g011
Figure 12. FTIR spectra of LA and waste material L and after Cu(II) sorption: LAS and LS, respectively. In the spectra of L, LAS, and LS, only the bands with frequency changes in comparison with LA are explicitly indicated with the corresponding numbers. The dash-dot lines note the bands that undergo a change in both frequency and intensity.
Applsci 15 07695 g012
Figure 13. C1s photoelectron spectra/binding energies (B.E.) of LA (a) and LAS (b).
Applsci 15 07695 g013
Figure 14. Degree of purification of contaminated water (in %) with the aid of plant material MO after I, II, and III cycles.
Applsci 15 07695 g014
Figure 15. Desorption (in %) of adsorbed copper ions onto four plant materials using eluents 0.1 M HNO3, 1 M HNO3, and 0.1 M EDTA.
Applsci 15 07695 g015
Figure 16. Results from four cycles of adsorption-desorption with eluent 0.1 M EDTA using biosorbent MO.
Applsci 15 07695 g016
Table 1. Texture characteristics and pH of water leachates for potential sorbents MO, M, LA, and L.
BiosorbentBET Surface Area
m2 g−1
Pore Volume cm3 g−1Average Pore
Diameter, nm
pH
MO0.80.00165.8
M0.60.00186.0
LA0.80.003145.8
L1.00.00266.3
Table 2. Kinetic parameters for the adsorption of Cu(II) ions onto MO.
Biosor- bentPseudo-First-Order ModelPseudo-Second-Order ModelIntraparticle Diffusion Model
Qe (mg g−1)k1 (min−1)r2Qe (mg g−1)k2 (g mg−1 min−1)r2kid (mg g−1 min−1/2)C (mg g−1)r2
MO1.500.0120.935313.551.7200.99990.449
0.009
14.79
16.73
0.9531
0.8213
Table 3. Values of ΔG0, ΔH0, and ΔS0 at different temperatures for biosorbents MO, LA, M, and L.
BiosorbentΔH0 (kJ/mol)ΔS0 (J/mol·K)ΔG0 293 K (kJ/mol)ΔG0 313 K (kJ/mol)ΔG0 333 K (kJ/mol)
MO4.2527.18−3.70−4.32−4.78
LA−0.96−0.55−0.85−0.68−0.84
M4.8019.53−0.89−1.40−1.66
L−4.75−5.49−3.03−3.22−2.82
Table 4. Constants for the isotherms of Langmuir, Freundlich, and Dubinin–Radushkevich for the adsorption of Cu(II) ions onto four biomaterials and calculated values for χ2.
BiosorbentLangmuir ParametersFreundlich ParametersDubinin–Radushkevich
Parameters
Q0
(mg g−1)
K1 (L mg−1)r2χ2kF
(mg1−nLn g−1)
n
(L mg−1)
r2χ2Qm(o)
(mg g−1)
E (kJ mol−1)r2χ2
MO59.950.0310.97090.00511.081.580.95250.307427.420.1460.79700.0362
M47.660.0060.93520.00630.541.310.98550.011217.040.1170.71390.1216
LA40.520.0160.84690.02520.441.120.73440.080927.600.0740.99220.0052
L28.080.0200.96460.00741.211.710.93900.029816.990.1660.76130.0798
Table 5. Calculated relative amounts of carbon functional groups present on the surface of MO and MOS, M and MS, LA and LAS, and L and LS.
SorbentC1
C-C, %
C2
C-O-C, C-OH, C-N, %
C3
O-C=O, %
O1
C=O, %
O2
C-O, %
MO87.110.52.434.665.4
MOS 84.210.85.062.337.7
M84.39.95.863.336.7
MS81.612.36.146.753.3
LA83.613.92.548.251.8
LAS83.910.65.551.348.7
L87.98.93.261.438.6
LS84.410.94.761.738.3
% from total carbon and oxygen.
Table 6. Percent content of C, O, N и, and Cu (in atom %) for investigated plant materials.
SorbentC, at.%O, at.%N, at.%Cu, at.%
MO79.2117.932.86-
MOS83.2414.591.660.51
M79.4618.352.20-
MS78.4019.351.760.49
LA84.7113.142.15-
LAS83.8014.471.420.31
L86.7211.731.54-
LS81.3515.702.460.49
Disclaimer/Publisher’s Note: The statements, opinions and data contained in all publications are solely those of the individual author(s) and contributor(s) and not of MDPI and/or the editor(s). MDPI and/or the editor(s) disclaim responsibility for any injury to people or property resulting from any ideas, methods, instructions or products referred to in the content.

