Article

Optimization Design Method of Pipe-Insulating Joints Based on Surrogate Model and Genetic Algorithm

by
Chen Guo
1,
Zheng Yang
1,*,
Jianbo Dong
1,
Yanchao Yue
1,
Linjun Tian
2 and
Ping Ma
1
1
School of Human Settlements and Civil Engineering, Xi’an Jiaotong University, Xi’an 710048, China
2
Xi’an Pump & Valve Plant Co., Ltd., Xi’an 710048, China
*
Author to whom correspondence should be addressed.
Appl. Sci. 2025, 15(13), 7601; https://doi.org/10.3390/app15137601
Submission received: 19 May 2025 / Revised: 3 July 2025 / Accepted: 5 July 2025 / Published: 7 July 2025

Abstract

Pipe-insulating joints are common cathodic protection devices in long-distance oil and gas pipeline infrastructures. To ensure safety, they are often designed too conservatively, resulting in large dimensions, high self-weight, and substantial costs. This study analyzed an insulating joint under the most unfavorable conditions to identify the component of the maximum stress in the insulating joint, which is the right flange. Then, using parameterized finite element calculations, five independent dimensions of the right flange were combined and arranged to obtain a dataset of the right flange dimensions and their maximum stress. Subsequently, four different fitting algorithms were trained with this dataset, and the ridge regression algorithm, which showed the best predictive performance, was used to establish a surrogate model for calculating the maximum stress of the right flange. Finally, the surrogate model was combined with a genetic algorithm to determine the optimal design dimensions of the right flange. This study also provides examples verifying the accuracy and reliability of the surrogate model and genetic algorithm. In these examples, the maximum stress under the design dimensions given by the optimization algorithm has a maximum error of 8.98% and an average error of 4.63% compared to the preset maximum stress target, while the stress predicted by the surrogate model has a maximum error of 9.65% and an average error of 5.33% compared to the actual stress. This improves the computational efficiency of the optimization algorithm by establishing a surrogate model, which can be used to optimize the dimensions of insulation joints.

1. Introduction

Resources such as petroleum and natural gas play an essential role in the development of modern society [1,2], with the annual demand for these energy sources escalating globally [3,4]. Pipeline transportation emerges as a critical method for enhancing the efficiency of energy conveyance, accounting for the transportation of 99% of natural gas and 70% of petroleum on land through pipelines [5]. Therefore, ensuring the operational safety of pipelines is an essential component of energy infrastructure construction in human society. Given the extensive lengths of pipelines laid and the complex and variable surrounding environments, various stray currents are often present, which are a primary cause of pipeline corrosion and leakage [6]. Many pipeline corrosion prevention methods have been developed to counteract the corrosive effects of these stray currents [7]. These include the use of corrosion-resistant materials for pipeline construction [8,9], the application of protective coatings designed to resist corrosion [10,11], and the implementation of cathode protection [12,13]. The cathodic protection system is a commonly used and highly effective anti-corrosion measure in long-distance oil and gas pipelines. Insulated joints are an important part of the cathodic protection system for oil and gas pipelines [14] and are now widely used in long-distance oil pipelines.
Insulation joints are the successors of insulating flanges and serve as connection devices that isolate pipeline sections with cathodic protection from those without. Insulation joints are typically installed at the outlet of the protected pipeline, at both ends of large crossings, in sections affected by stray currents, and at the connection points between the protected pipeline and other primary or branch pipelines that should not be subjected to cathodic protection. The installation of insulated joints is shown in Figure 1. The insulation joint primarily consists of a short pipe, fixing sleeve, right flange, insulating filler, sealing ring, and left flange, as shown in Figure 2.
During the operation of pipelines, insulating joints are subjected to axial forces and bending moments primarily due to the flow of liquids within the pipeline and the deformation of the surrounding soil [15,16,17]. Therefore, insulating joints are not only required to possess excellent insulating and sealing properties but also to meet strength requirements. Composed of multiple components, insulating joints are prone to excessive stress at the edges where the parts intersect. Due to the numerous relevant dimensions of pipe joint components and the interdependence of these dimensions, rather than their independence [18], the optimization of insulating joints is also relatively difficult. However, many scholars have still proposed some methods for the optimization of pipe joints, including the stress analysis of various parts of the pipe joint, mechanical analysis under different types of loads, and optimization design combined with optimization algorithms [19,20,21,22]. Since the insulating joint is a new type of structure, research on this structure is still limited both domestically and internationally. The above-mentioned studies are mainly focused on traditional flanged or welded pipe joints, and most of them employ traditional finite element analysis methods for optimization, which makes it difficult to obtain the global optimal solution [18,20,23]. Currently, flange connections are widely used for pipes, and there is relatively little research on the new type of insulating joint discussed in this paper. Moreover, there are no mature design methods or design standards available, leading to relatively conservative designs for insulating joints. The few existing design methods are mostly based on empirical formulas [24,25,26]. To prevent stress concentrations from exceeding the allowable limits, the dimensions of insulating joints are often designed to be larger, resulting in high self-weight and substantial costs. Therefore, optimization research is necessary for the design of cross-sectional dimensions for insulation joints, aiming to minimize self-weight and reduce costs while ensuring that the insulation joints meet stress requirements.
A genetic algorithm is a stochastic optimization algorithm based on Darwin’s theory of evolution, which seeks to find the optimal solution to a problem by simulating the processes of selection, crossover, and mutation in nature [27]. Genetic algorithms begin by establishing a set of potential solutions, known as a population, and then assessing the quality of each individual based on a fitness function. This process selects individuals with higher fitness for genetic recombination and mutation, generating a new generation. Over multiple generations, the individuals within the population gradually evolve towards the optimal solution of the problem. The fitness function is a critical factor influencing the optimization performance of a genetic algorithm. The fitness function represents the relationship between the optimized parameters and the optimization objectives. In the context of this study, this relationship corresponds to the connection between the dimensions of the insulation joint and the maximum stress. However, this relationship involves stress concentration, and the impact of each dimension of the insulation joint on maximum stress is not necessarily independent; there is a coupling between the various parameters. Obtaining an analytical solution through physical and mathematical theories and constructing a fitness function is challenging.
Finite element analysis is a powerful problem-solving tool in modern engineering, which can be utilized for numerical computation to determine the stress in insulation joints [28,29]. This method can be integrated with genetic algorithms, employing finite element calculations as the fitness function within the genetic algorithm and subsequently optimizing the problem [30,31]. This method can yield satisfactory results when the model is simple and the number of calculation points is sufficient. However, when the model is complex and involves numerous characteristics, a large number of data points are required to ensure optimal results. Each iteration implies that the finite element program must also perform a calculation, leading to a significant increase in computational time and costs. The hyperparameters of the optimization algorithm are also an essential factor affecting the performance of the optimization, and each adjustment of the hyperparameters necessitates corresponding calculations from the finite element program, making the optimization process exceptionally tedious. Moreover, implementing the integration of optimization algorithms and finite elements through programming demands a high level of expertise from designers in mechanics, mathematics, and computer languages, which currently hinders its routine use and promotion.
Machine learning can leverage vast data samples to identify the relationship between features and targets, thereby generating models suitable for solving problems. In recent years, it has been widely applied across various fields, such as civil engineering, mechanical engineering, and materials science [32,33,34]. Therefore, a surrogate model can be constructed using machine learning to replace the finite element calculation process [35] and evaluate the optimization algorithm in place of the fitness function [36]. Constructing a surrogate model using machine learning requires a large number of learning samples to train the algorithm, ensuring the accuracy of the surrogate model. Parametric finite element calculations are a rapid means of obtaining many learning samples, and they are characterized by low computational cost, speed, and the ability to simulate the coupling effects of multiple parameters [36,37].
The following is an outline of this paper: A typical insulation joint is analyzed to determine its optimization parameters and objectives in Section 1. In Section 2, finite element analysis is utilized to perform a cross-combination of the optimization parameters, and parameterized finite element calculations are employed to derive the control objectives for each parameter combination. A training set with the optimization parameters and objectives is established, machine learning algorithms are compared, and the most accurate algorithm is selected as the surrogate model. Section 3 uses the surrogate model as the fitness function to employ genetic algorithms in seeking the optimal design parameters for the insulation joint.

2. Methods

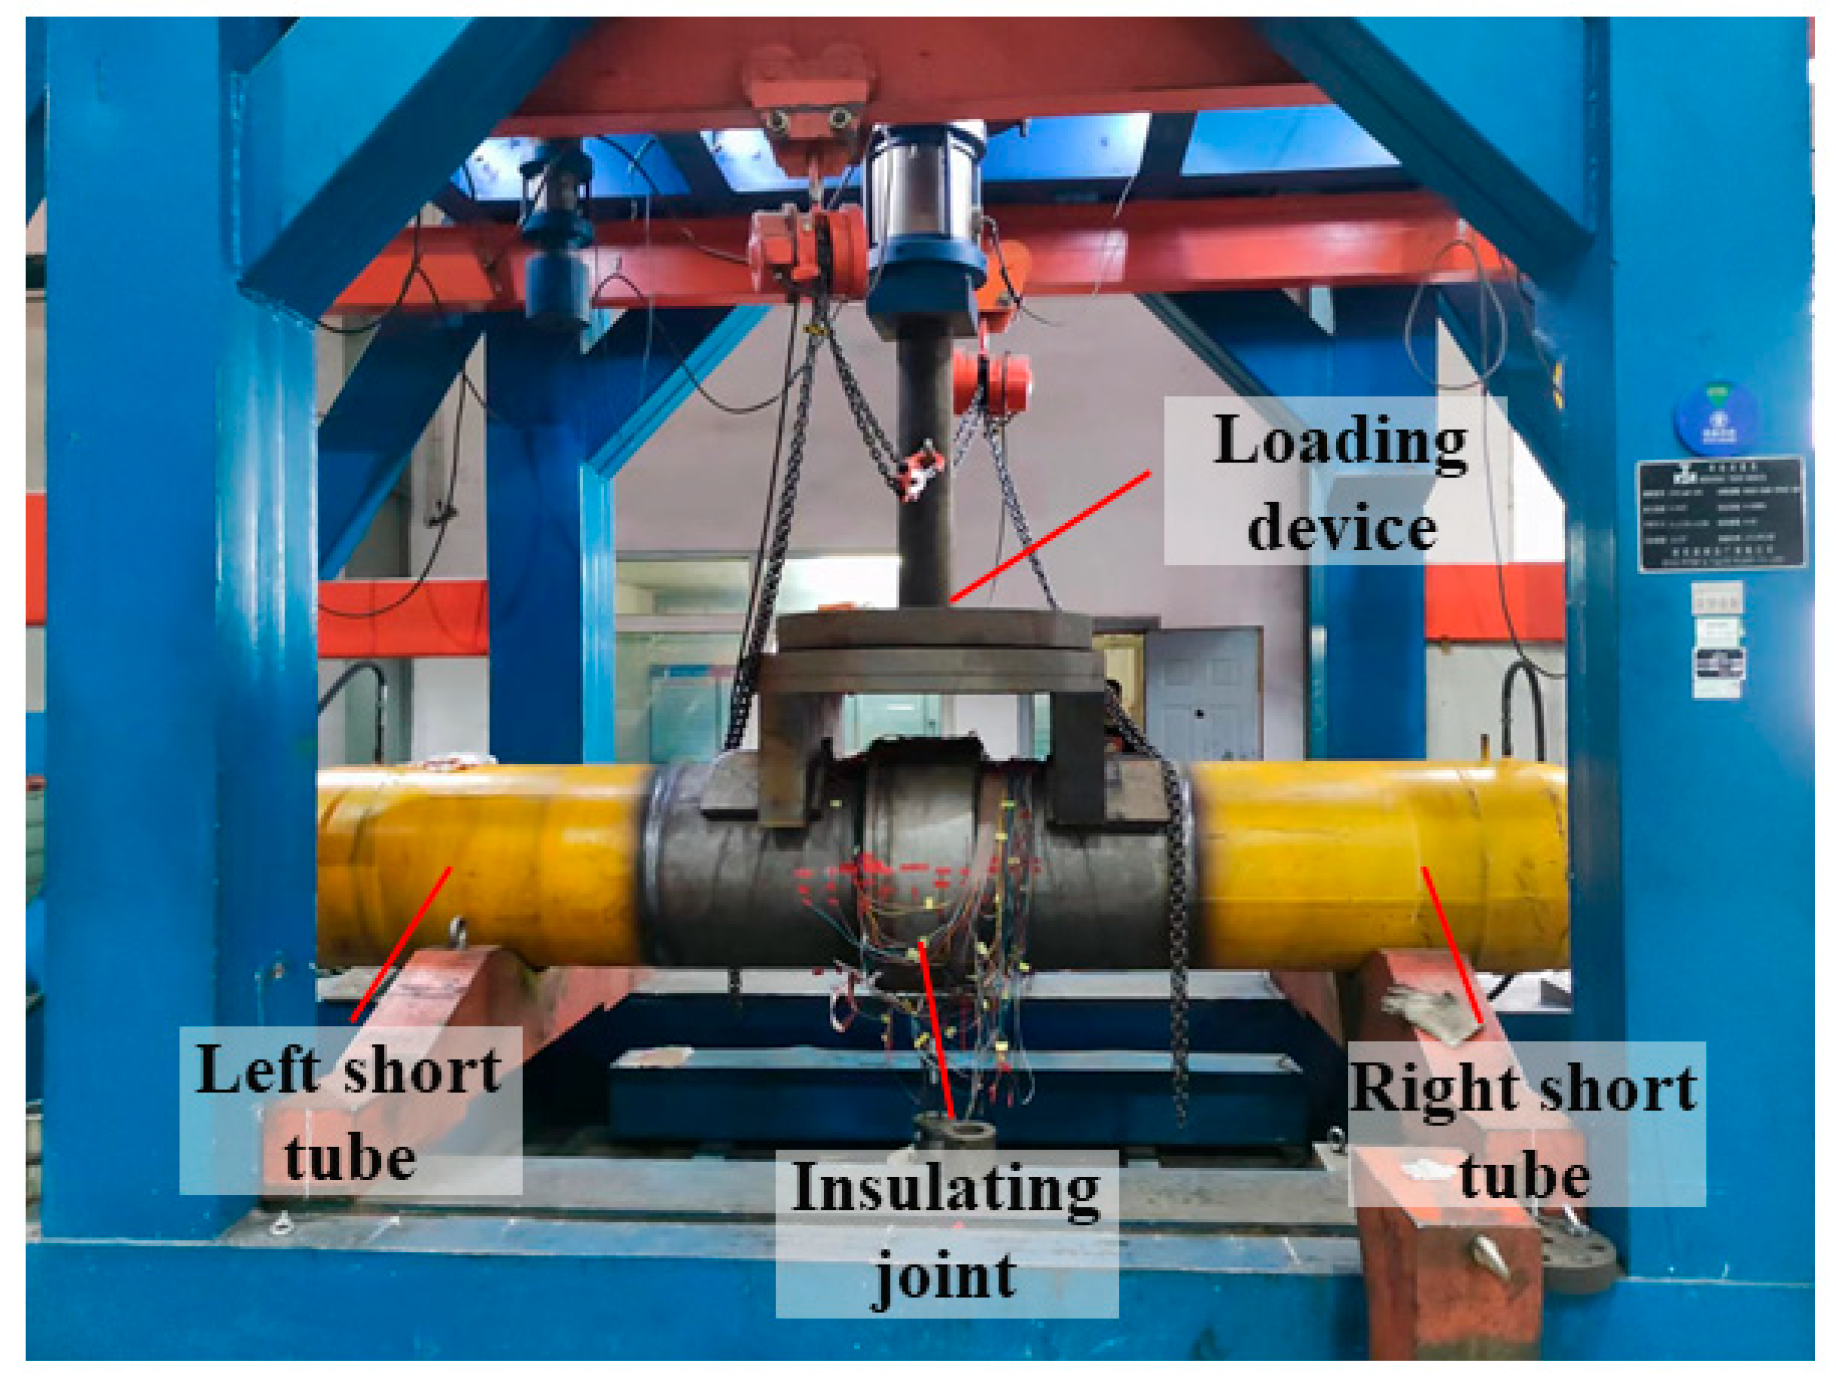
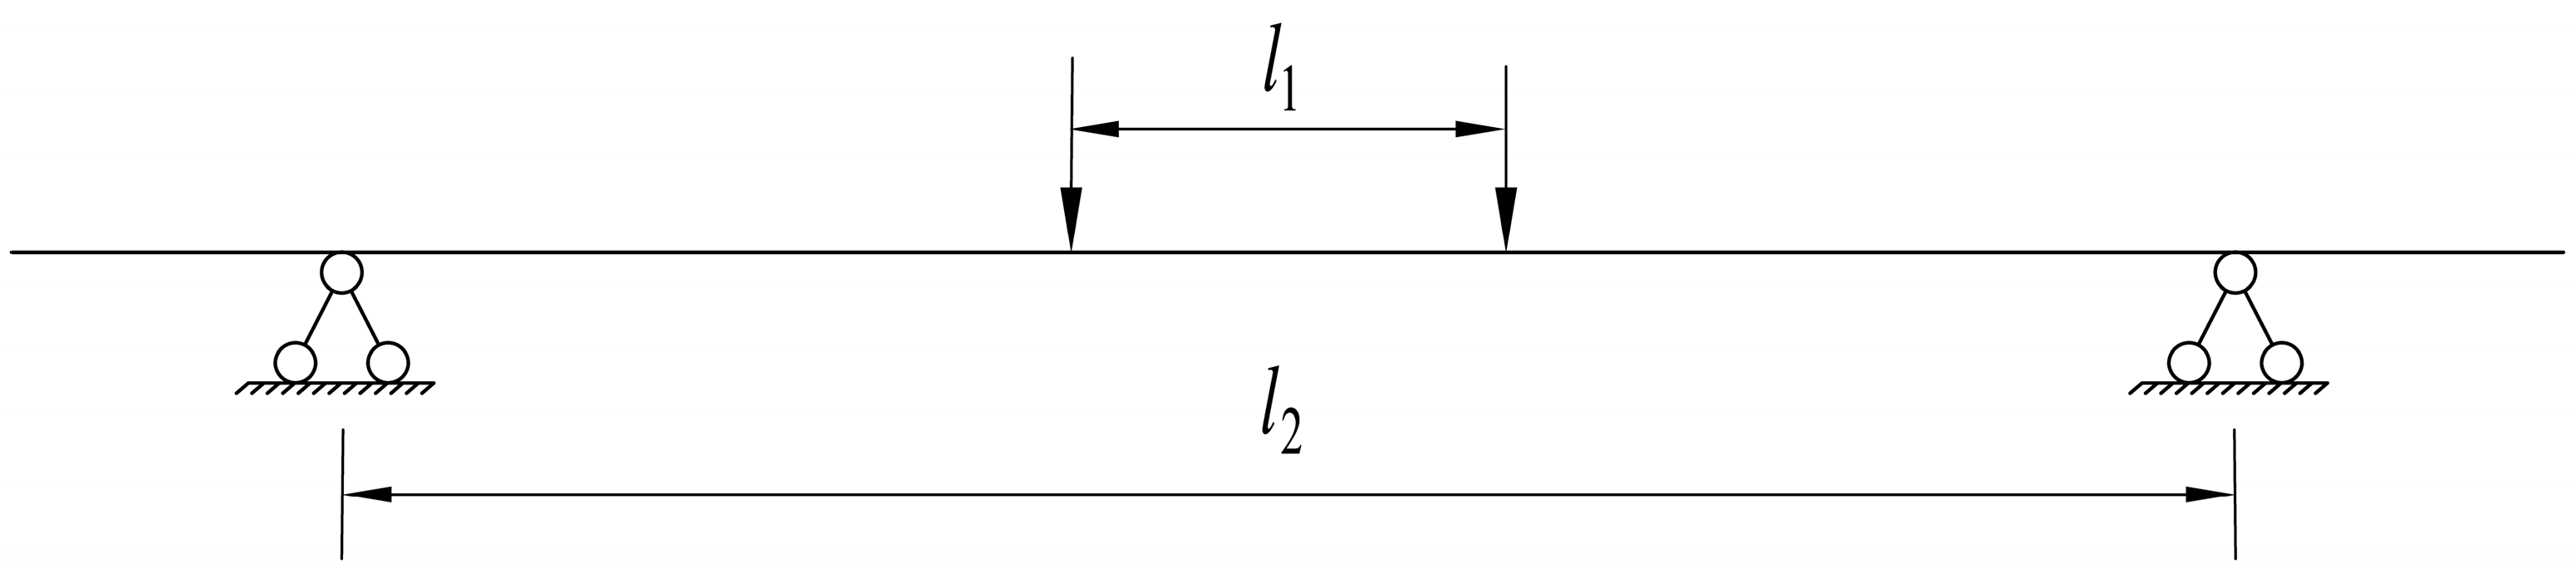
2.1. Finite Element Model for Insulating Joint

The most adverse load considered for insulating joints is the bending moment caused by earthquakes or foundation deformation. When designing insulating joints, it is required that the failure of the insulating joint occurs later than the failure of the connected pipeline. Therefore, the most adverse load for the insulating joint is the bending moment transmitted at the time of failure of the adjacent pipeline. Before leaving the factory, insulated joints are subjected to a four-point bend test, as shown in Figure 3. Hence, this paper investigates the optimization of stress in insulating joints based on this test condition. It should be noted that the stress referred to in this study is the von Mises stress, which will hereinafter be simply referred to as stress [38].
This study takes the DN1400 insulating joint as an example to investigate the stress distribution pattern of a cross-section under bending tests. The detailed dimensions of the DN1400 insulated joints are in Appendix A. The insulating filler in the insulating joint is made of an epoxy glass laminated plate, the sealing ring is made of fluoroelastomers, and the remaining components are made of steel. The epoxy glass laminate is modeled using an orthotropic linear elastic model, and the fluoroelastomer is modeled using a two-parameter Mooney–Rivlin constitutive model with parameters set to C10 = 8.5 and C01 = 6.1. The steel is modeled using a bilinear isotropic hardening model, with the model’s equation shown in Equation (1):
σ = E ε , ε ε s σ s + E 1 ε ε S , ε > ε s
where σ represents the material stress; ε represents the material strain; E represents the material elastic modulus, taken as 2.06 × 10⁵ N/mm2; εs represents the material strain at the yield point; E1 represents the material hardening modulus, taken as 1.45 × 10⁵ N/mm2; σs represents the yield stress, taken as 485 MPa. The specific parameters are shown in Table 1.
All connections between steel components in the insulating joint are made by welding; hence, the contact relationships are defined as bonded connections. The contact relationships between other materials are characterized by friction. The coefficient of friction is 0.25 between steel and rubber, 0.45 between rubber and epoxy resin, and 0.3 between epoxy resin and steel [39,40].
Before the bending test, the insulating joint is equipped with corresponding short pipes welded on its left and right sides. The pipes are then supported on the bottom surface and loaded on the top. The schematic diagram of the loading mechanics is shown in Figure 4. The finite element model of the insulating joint bending test is shown in Figure 5.
The load is a vertically downward distributed force, equivalently transformed into two equal concentrated forces, P, acting at the center of the loading surface. The magnitude of the load is such that it brings the edge material of the left and right short pipes to the yield point. The horizontal distance, l2, between the two bottom supports, A and B, is 7.8 m, and the horizontal distance, l1, between the two loading surfaces, C and D, is 1.63 m. The load P can be calculated using Equations (2)–(4):
M = l 2 l 1 2 P
σ max = M W
W = π D 3 1 d D 4 32
where σmax represents the yield strength of the material in the left and right short pipes, taken as 485 MPa; M is the critical bending moment required to reach the yield point at the edge section of the short pipe; W is the bending section modulus for the annular section, calculated according to Equation (4), where d is the inner diameter of the short pipe, with the size of the short pipe used in this paper being 1370 mm; D is the outer diameter of the short pipe, with the size used in this paper being 1422 mm. The final calculated magnitude of the load P is 4992.3 kN applied uniformly to the loading surface.
The stress in the insulating joint under the bending test is depicted in Figure 6, with stress units in MPa. To enhance the visibility of the stress results, a symmetrical plane parallel to the XY plane in Figure 5 is sectioned through the insulating joint for display.
Figure 6 shows that, except for some stress concentration areas, the stress in other parts of the insulation joint is much lower than the yield strength of the material, which has ample optimization space. Under the bending test, the maximum stress occurs at the lower part of the insulating joint, specifically at the tensile edge. The exact location is at the chamfered area of the right flange, where the maximum stress reaches 488.76 MPa, slightly exceeding the yield strength (485 MPa) of the flange material. So, the maximum stress at the right flange is considered the optimization control objective for the entire insulating joint.

2.2. Surrogate Model

2.2.1. Construction of the Training Dataset

From the analysis in Section 1, it is evident that the maximum stress in the insulating joint under the most adverse conditions occurs at the right flange on the lower edge of the insulating pipe. Moreover, the dimensions of the insulating joint are primarily determined by the right flange, with the dimensions of other components being correlated with it. Consequently, when the maximum stress in the right flange is optimized, it can be determined that the stress in the entire insulating joint is also optimized. Based on the optimized dimensions of the right flange, the design dimensions of the whole insulating joint’s cross-section can be established. Based on the loading conditions of the right flange, it can be equivalently modeled, as shown in Figure 7, for calculations. The moment load can be equivalently transformed into tensile and compressive stresses on the transverse section. Given that the connected pipes to the right flange are thin-walled structures, the variation of tensile and compressive stresses due to the moment in the y-direction, as depicted in Figure 5, can be neglected, simplifying the forces on the thin wall to a uniformly distributed load P′. To account for the most adverse condition, the magnitude of the uniformly distributed load is taken as the yield strength of the pipe material. In this study, the DN1400 insulating joint has an external pipe thickness of 26 mm, with a yield strength of 485 MPa. Therefore, the load P′ is calculated as (26 mm × 485 MPa)/tB1. The boundary conditions for the right flange primarily consider the interactions in the y-direction. The interface between the right flange and the insulating filler on the right side is predominantly subject to mutual compression with negligible relative displacement. Thus, it is simplified to a fixed boundary condition. On the left side of the right flange, where it contacts the sealing ring, since this is on the tensile side of the insulating joint, there is no interaction other than possible compression between the two; therefore, the left boundary condition is set as a compression-only support.
The independently optimizable dimensional parameters for the right flange are bB1, bB2, tB1, tB2, and rB1, as shown in Figure 8. The optimization objective is to minimize the weight of the insulating joint while ensuring that the maximum stress does not exceed the material’s stress limit. Given that the current design parameters for the insulating joint are overly conservative, the optimized parameters are expected to be less than the current design values. The closer the data range in the training dataset is to the final optimized design values, the more likely it is to yield the optimal solution, and the more accurate the prediction of the optimal solution will be. Therefore, the value ranges for bB1, bB2, and tB2 are set to be 40% to 120% of the current design values. Since the right side of the right flange needs to be welded to the pipe, its dimension tB1 must not be smaller than the thickness of the pipe. Considering the common pipe thicknesses connected to DN1400, its value is taken as 70% to 110% of the current design value. Based on design experience, the larger the chamfer dimension rB1, the smaller the stress concentration effect, so its value ranges from 70% to 250% of the current design value. Each dimensional parameter is uniformly sampled with five values within its range, and the final parameters are shown in Table 2.
In order to consider the coupling effect of different parameters on the maximum stress, the parameters in Table 2 were cross-combined to generate the final 55 = 3125 sets of size combinations.
These combinations were simulated separately, and the corresponding right flange cross-sectional areas and maximum stresses were extracted. Each set of dimensions and their corresponding cross-sectional areas and maximum stresses is a set of training data, resulting in 3125 training sets.

2.2.2. Surrogate Model Evaluation Methods

The essential function of a surrogate model is to fit the relationship between independent and dependent variables with different algorithms adept at solving different types of problems. Therefore, the algorithm for establishing a surrogate model can be flexibly selected based on the target problem. Since current research on insulation joint optimization is relatively limited, the relationship between its dimensions and maximum stress was not well understood prior to this study. Therefore, it was necessary to select algorithms based on different principles and applicable types to maximize the potential for addressing the fitting problem of insulation joints. In this study, the algorithm that best predicts the maximum stress of the right flange among four commonly used fitting algorithms is chosen to build the surrogate model. The four algorithms are ridge regression, decision tree (DT), k-nearest neighbor (KNN), and gradient boosting decision tree (GBDT). Among them, ridge regression is suitable for regression problems and performs better in handling linear relationships. Both GBDT and DT can be applied to regression and classification tasks, effectively addressing nonlinear problems. However, their final performance heavily depends on hyperparameter tuning. KNN is capable of handling both regression and classification tasks and is suitable for various data types, but it suffers from slow computational speed and generally poor performance in high-dimensional problems.
Before inputting the algorithm for training, the dataset must be randomly shuffled and then divided, with 80% of the data reserved for the training set and the remaining data for the test set. An additional random test dataset was created in this study to investigate and validate the generalization capability of the fitting algorithms. For the random test dataset, the dimensions of the right flange, except for tB1, which is taken according to the upper and lower limits of Table 2, are varied by ±20% from the upper and lower limits of Table 2. Random values within this range were then combined using a random function to generate the dataset, with the specific value ranges shown in Table 3. A random test dataset was established by correlating the size combinations with their corresponding maximum stress, comprising 100 sample points.
Before utilizing the training dataset to train the algorithm, it is necessary to perform standard normalization on the data, which can accelerate the model’s convergence and prevent gradient explosion. The method employed in this paper is the StandardScaler standard normalization algorithm, which aligns the input and output data with a standard normal distribution. Subsequently, a denormalization process is applied to the output data to revert it to the actual predicted values. The formula for standard normalization is shown in Equation (5):
x * = x μ σ
where x is the original data for a dimension, x* is the normalized data, µ is the mean of the data in the same dimension, and σ is the standard deviation of the data in the same dimension.
To validate the performance of various algorithms, this study employs mean absolute error (MAE), root mean square error (RMSE), and the coefficient of determination (R2) to assess the predictive outcomes of the algorithms. MAE represents the average error between the predicted and actual values, while RMSE indicates the magnitude of their differences; the lower these metrics, the better the model’s predictive performance. R2 reflects the degree of correlation between the dependent and independent variables; the closer this value is to 1, the higher the correlation between the variables and the better the fit. The calculation formulas for these three metrics are presented in Equations (6)–(8) [41]:
R 2 = 1 j = 1 n ( y j y ^ j ) j = 1 n ( y j y ¯ ) 2
MAE = 1 n j = 1 n y j y ^ j
RMSE = 1 n j = 1 n ( y j y ^ j ) 2
where n is the sample size, yj is the actual value of the sample, y ^ j is the sample predicted value, and y ¯ is the sample mean.

2.3. Mathematical Formulation of Optimization Problems

For the optimization problem targeting the right flange, the objectives primarily encompass two aspects: self-weight and maximum stress. The requirement is to minimize the weight of the right flange while ensuring that the maximum stress meets the specified requirements. Therefore, the mathematical formulation of the optimization problem for the maximum stress of the right flange is shown in Equation (9):
f i n d X = b B 1 ,   b B 2 ,   t B 1 ,   t B 2 ,   r B 1 min M = M ( X ) g 1 = σ ( X ) σ max 0 X L X X U
where X is the design variable, i.e., the dimension of the right flange. M is the total weight of the right flange. M is a function of X, which can be obtained using simple geometric formulas. g1 is a limiting condition. σ is the maximum stress of the right flange, the value of which is also related to the size of X. σmax is the limit of the stress value. XL and XU are the upper and lower bounds of the design variable, respectively. Equation (9) is for finding the right flange design dimension X that minimizes the structure’s weight when the maximum stress is less than σmax and the value of X ranges within XLXXU. The limiting condition g can be adjusted according to the actual optimization problem, such as the stress limit value, displacement limit value, and so on.

3. Results

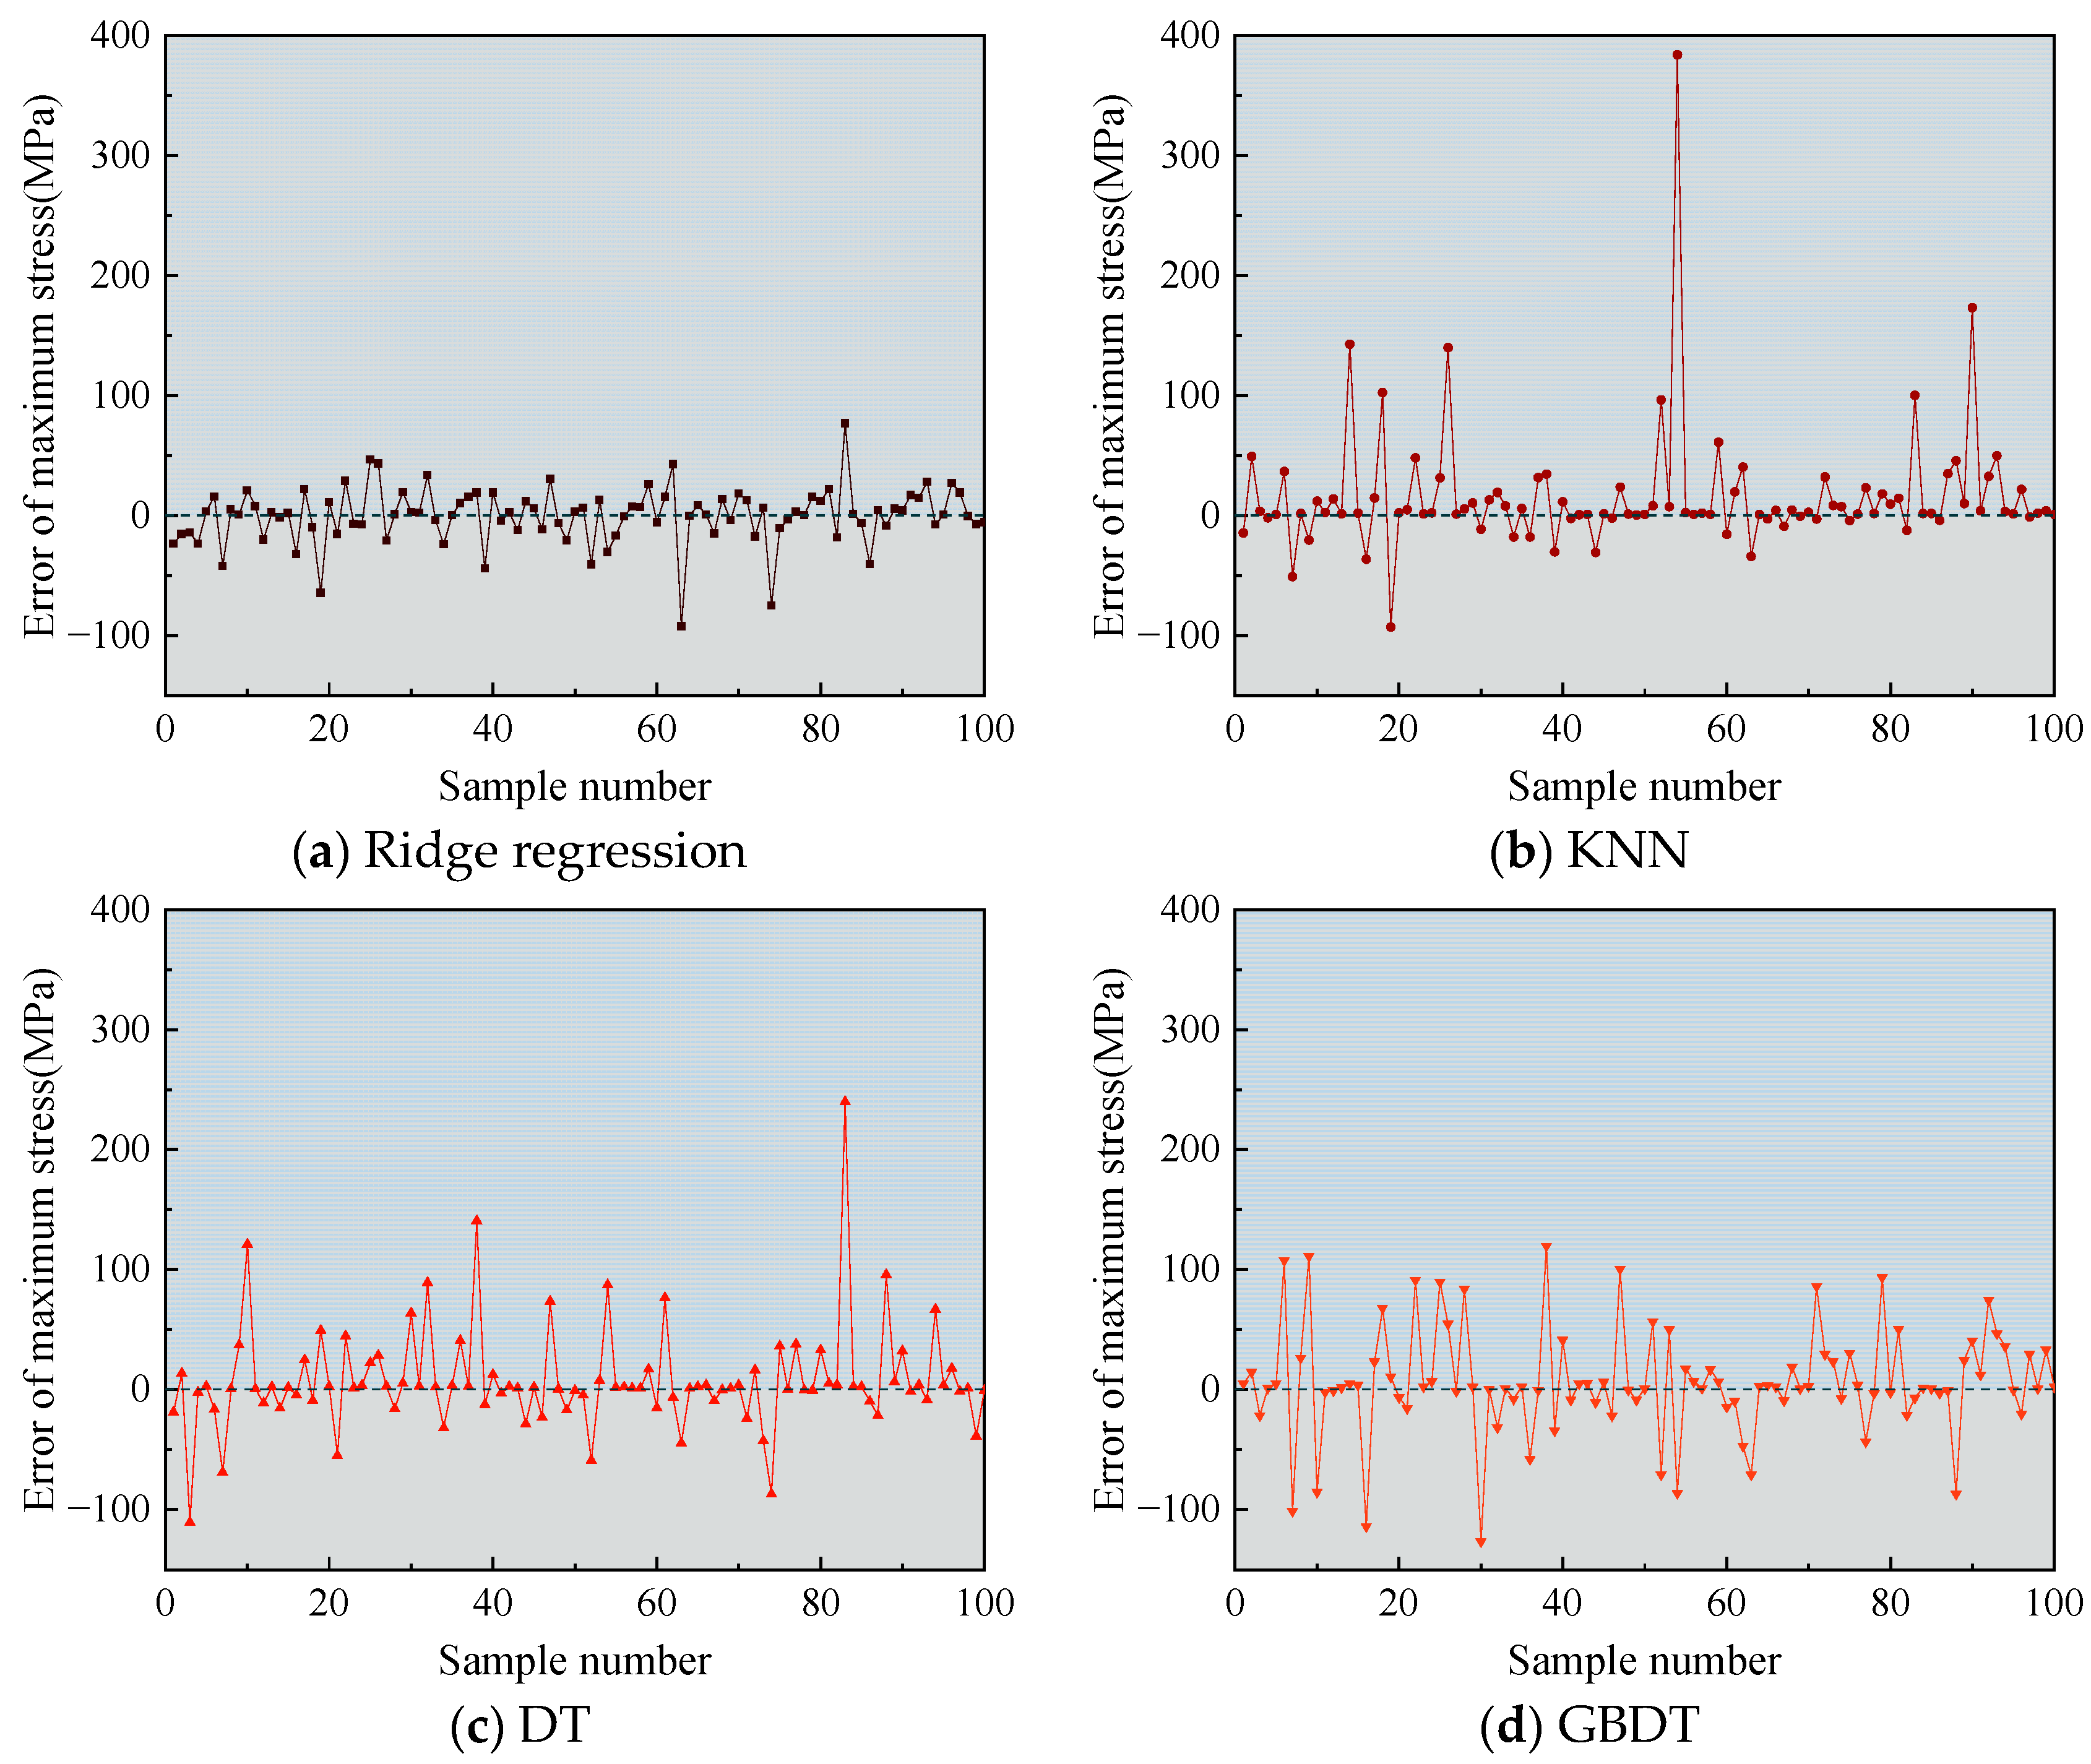
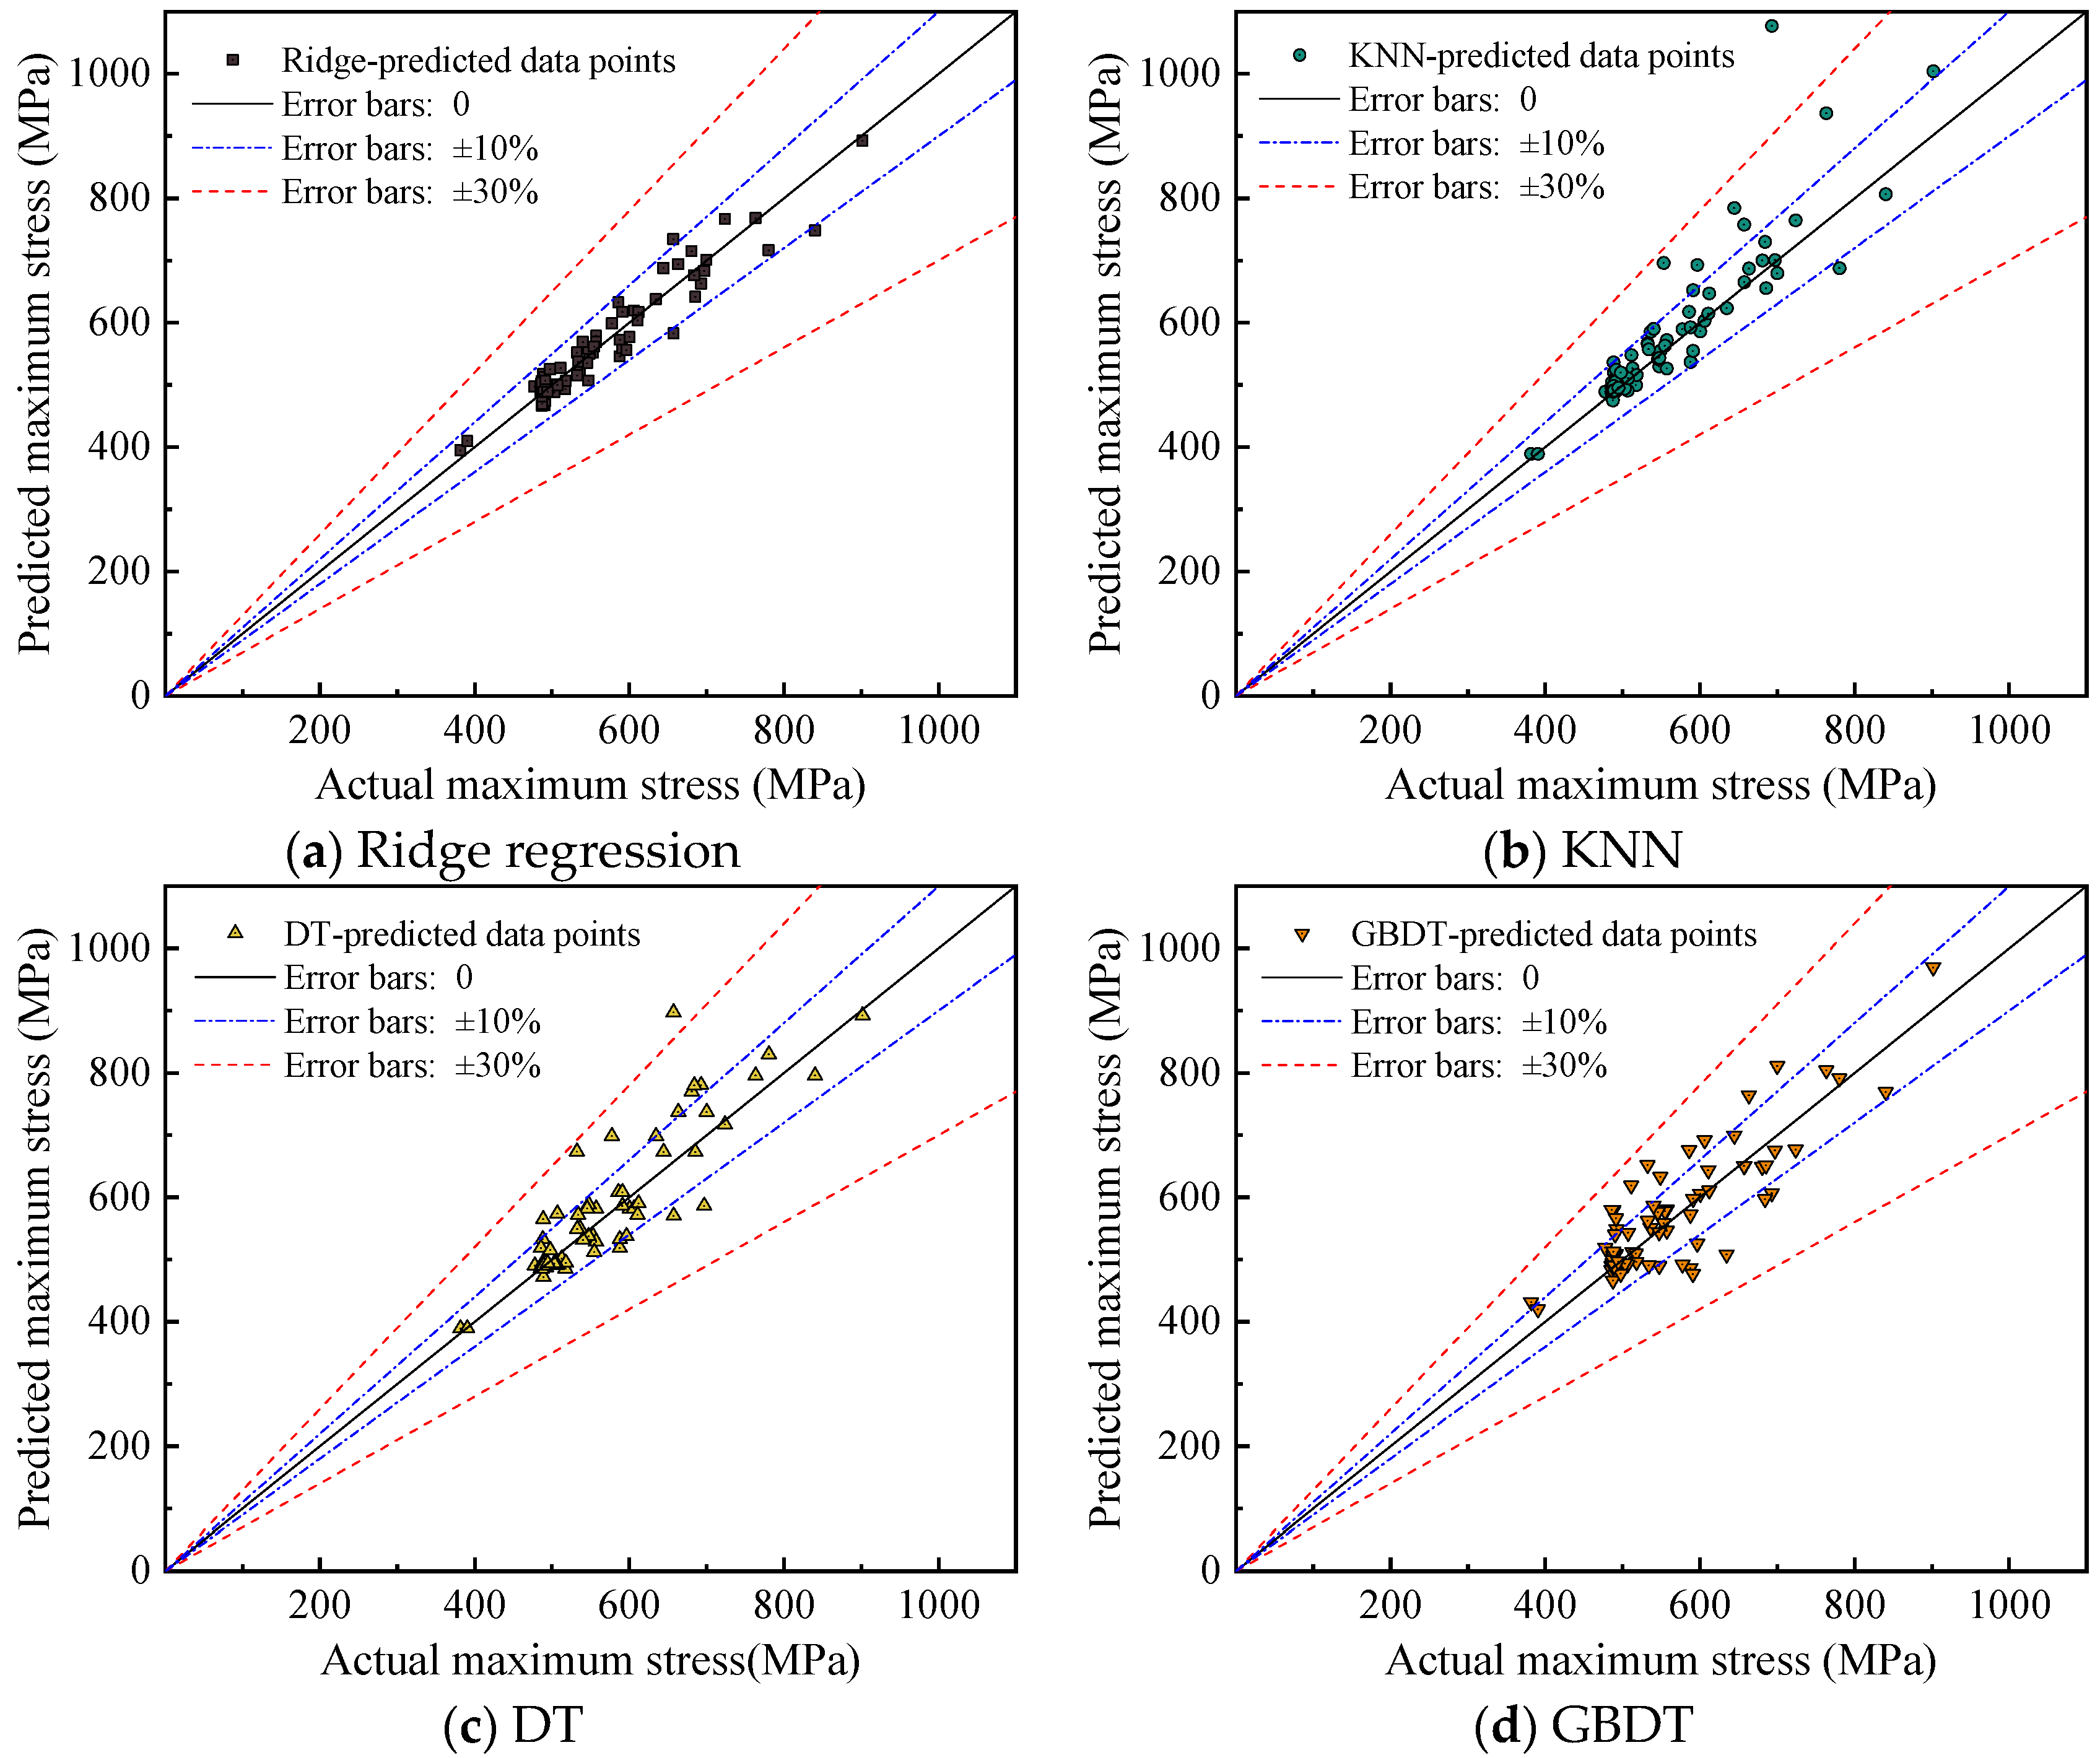
3.1. Surrogate Model Evaluation Results

The selection of hyperparameters is a crucial factor influencing the performance of an algorithm. This study determines the hyperparameters using the GridSearchCV function, which encompasses grid search and cross-validation. This involves sequentially adjusting parameters within a specified range, training the learner with the adjusted parameters, and evaluating each combination with cross-validation to identify the parameter set that yields the highest accuracy on the validation set [42]. During the cross-validation process, the data is divided into several subsets, with each subset serving as both training and validation data. Therefore, there is no need to specifically reserve a separate validation set. Utilizing GridSearchCV to determine the hyperparameters of four algorithms, the primary parameters for each algorithm are identified as follows. The hyperparameter α is set to 1 for the ridge regression, and the polynomial degree is 6. For the KNN, the hyperparameter K is designated as 6 without considering distance weighting. Regarding the DT, variance is adopted as the criterion for node splitting, with a maximum depth of 8 for the decision tree. For the GBDT, the maximum depth is 32, the maximum number of leaves is 64, and the learning rate is 0.2.
The MAE, RMSE, and R2 values for each algorithm on the training and test sets are presented in Table 4, while those for the random test set are shown in Table 5. The absolute and relative errors of different algorithms on the random test set are shown in Figure 9 and Figure 10, respectively. The absolute stress error equals the predicted stress minus the actual stress, and the relative stress error equals the absolute stress error divided by the actual stress. In Figure 10, data points that lie on the zero-error line indicate that the predicted values are equal to the actual values; the farther away a point is from the zero-error bars, the greater the error in the predicted values.
As can be seen from Table 4, for the training set, the R2 values for ridge regression, DT, and GBDT algorithms are all greater than 0.99, and the maximum MAE and RMSE are 19.704 and 38.563, respectively. This indicates that these three algorithms fit the training set well and can accurately identify the relationship between input features and the target in the training data. For the test set, the predictive performance of all four algorithms has declined to some extent. However, aside from the KNN algorithm, the other three algorithms still demonstrate excellent predictive performance on the test set. The R2 values are more significant than 0.98. The KNN algorithm performed the worst in both the training and test sets, with an R2 of only 0.679 in the test set and MAE and RMSE of 77.789 and 286.975, respectively.
For the random test set, the predictive performance of the three algorithms, excluding ridge regression, has significantly deteriorated, as shown in Table 5. The R2 values of KNN, DT, and GBDT algorithms are all less than 0.8, with a maximum of only 0.751. The MAE and RMSE of these three algorithms are also about 1.5~2.5 times that of the ridge regression algorithm. Figure 9 and Figure 10 indicate that the KNN, GBDT, and DT algorithms have a poor fit to the data. Compared to ridge regression, they not only have greater errors but also exhibit a more significant number of outlier points, suggesting unstable predictive performance. It should be noted that the RMSE values of random test sets are generally lower than those of the test set, even when their R2 values are inferior. Although RMSE indicates the precision of data fitting, it is particularly sensitive to outliers. The test set contains 625 datasets, while the random test set only has 100 datasets, so it is more likely to have points with large errors. Therefore, a comprehensive evaluation incorporating R2, RMSE, and MAE metrics is essential. The model generated by the ridge regression algorithm still demonstrates strong predictive power for the random test set, with both minor prediction errors and stable performance, lacking outlier points and keeping the overall error within 10%. In summary, the ridge regression algorithm has good predictive and generalization capabilities for the maximum stress of the insulating joint’s right flange. Therefore, this study employs the ridge regression algorithm to construct a surrogate model for calculating the maximum stress in the right flange.

3.2. Surrogate Model–Genetic Algorithm Optimization Results

To optimize the dimensions of the right flange, the surrogate model established in Section 2 is utilized as the fitness function in a genetic algorithm. Different optimization targets are set to find the optimal dimensions to verify the capability of the genetic algorithm in solving optimization problems of varying degrees. The current design’s maximum material yield strength of the right flange, σmax = 485 MPa, is taken as the reference for optimization targets. The optimization target range for the right flange is set between 0.7σmax and 1.2σmax, with intervals of 0.1σmax. The main hyperparameters of the genetic algorithm are as follows: The initial population size is 300, the maximum number of iterations is 3000, and the mutation probability is 0.001. The upper and lower bounds for the optimization parameters are the same as those of the training dataset from the surrogate model, as shown in Table 6. The optimized design dimensions of the right flange by the genetic algorithm with different optimization targets are shown in Table 7.
As seen from Table 7, the dimension bB2 of the right flange consistently adopts its lower limit value regardless of the stress limit, indicating that bB2 has minimal effectiveness in reducing the maximum stress of the right flange. When the stress is less than 485 MPa, a notable increasing trend is observed in bB1, tB1, tB2, and rB1; this shows that these dimensions have a role in reducing the maximum stress in the right flange. Among all the dimensional parameters, rB1 strongly correlates with the maximum stress, with its optimal value increasing as the stress limit decreases. This indicates that the chamfer radius has a significant impact on improving the stress concentration in the right flange. The optimal dimensions exhibit strong nonlinearity with the optimized stress objective. Specifically, as the stress limit varies, the optimal dimensions undergo an abrupt change near a particular limit, which corresponds to a stress limit of 485 MPa in this study.
The optimized right flange dimensions are simulated and analyzed using finite elements, with the loading and boundary conditions identical to those described in Section 2.1. The stress of the right flange under different optimization targets is shown in Figure 11.
As can be observed from Figure 11, the stress concentration of the right flange primarily occurs at two locations, namely, the upper and lower edges of the chamfer. Moreover, the position of the maximum stress gradually shifts upward with an increase in the stress limit. When the optimization target is set to σ ≤ 0.9σmax, the maximum stress is located at the lower edge of the chamfer. When the optimization target is within the range of σmaxσ ≤ 1.2σmax, the maximum stress is located at the upper edge of the chamfer.
Target stress, optimized maximum stress, and right flange cross-sectional area are counted as shown in Table 8. The surrogate model predicted stress is the stress calculated by the surrogate model established in Section 2 for the optimized dimensions. The actual maximum stress is the maximum stress calculated by the finite element software. The cross-sectional area S is equivalent to the self-weight, with a smaller cross-sectional area indicating a lower self-weight, where S0 represents the cross-sectional area of the right flange in the initial design dimensions, which is 28,214 mm2.
As shown in Table 8, the genetic algorithm established in this paper, based on a surrogate model, can provide suitable design parameters for the right flange with a relatively high degree of accuracy according to the optimization targets. The maximum stress obtained from finite element analysis based on the optimized dimensional parameters has a maximum relative error of 8.98% and an average error of 4.63% compared to the optimization target. Furthermore, the maximum stress of the right flange predicted by the surrogate model based on the optimized dimensions has a maximum error of 5.33% compared to finite element calculations. When the optimization target for the maximum stress of the right flange is set to the current design material’s yield strength of 485 MPa, the dimensions derived from the optimization algorithm in this study result in a 64.89% reduction in cross-sectional area compared to the existing design, significantly reducing the manufacturing cost and self-weight of the insulating joint. The results for the optimization targets of σ ≤ 1.1σmax and σ ≤ 1.2σmax indicate that when the material strength exceeds 485 MPa, despite an increase in the material stress limit, the change in the optimized cross-sectional area is minimal. This suggests that the effect of using high-strength materials to reduce the self-weight and cost of the right flange is far less significant than that achieved by optimizing the cross-sectional dimensions. Conversely, when the optimization target is below 0.9σmax, the cross-sectional dimensions of the right flange remain larger than the current design even after optimization with the genetic algorithm. Therefore, the material currently used in the design is considered reasonably appropriate. Still, the cross-sectional dimensions can be optimized using the algorithm presented in this study, and the dimensions of the right flange can be optimized by the algorithm in this study.

4. Conclusions

This study established a surrogate model for calculating the maximum stress of the right flange of the insulation joint through parameterized finite element results. Based on this surrogate model and combined with the genetic algorithm, the dimensions of the right flange of the insulating joint were optimized. The main conclusions are as follows:
(1)
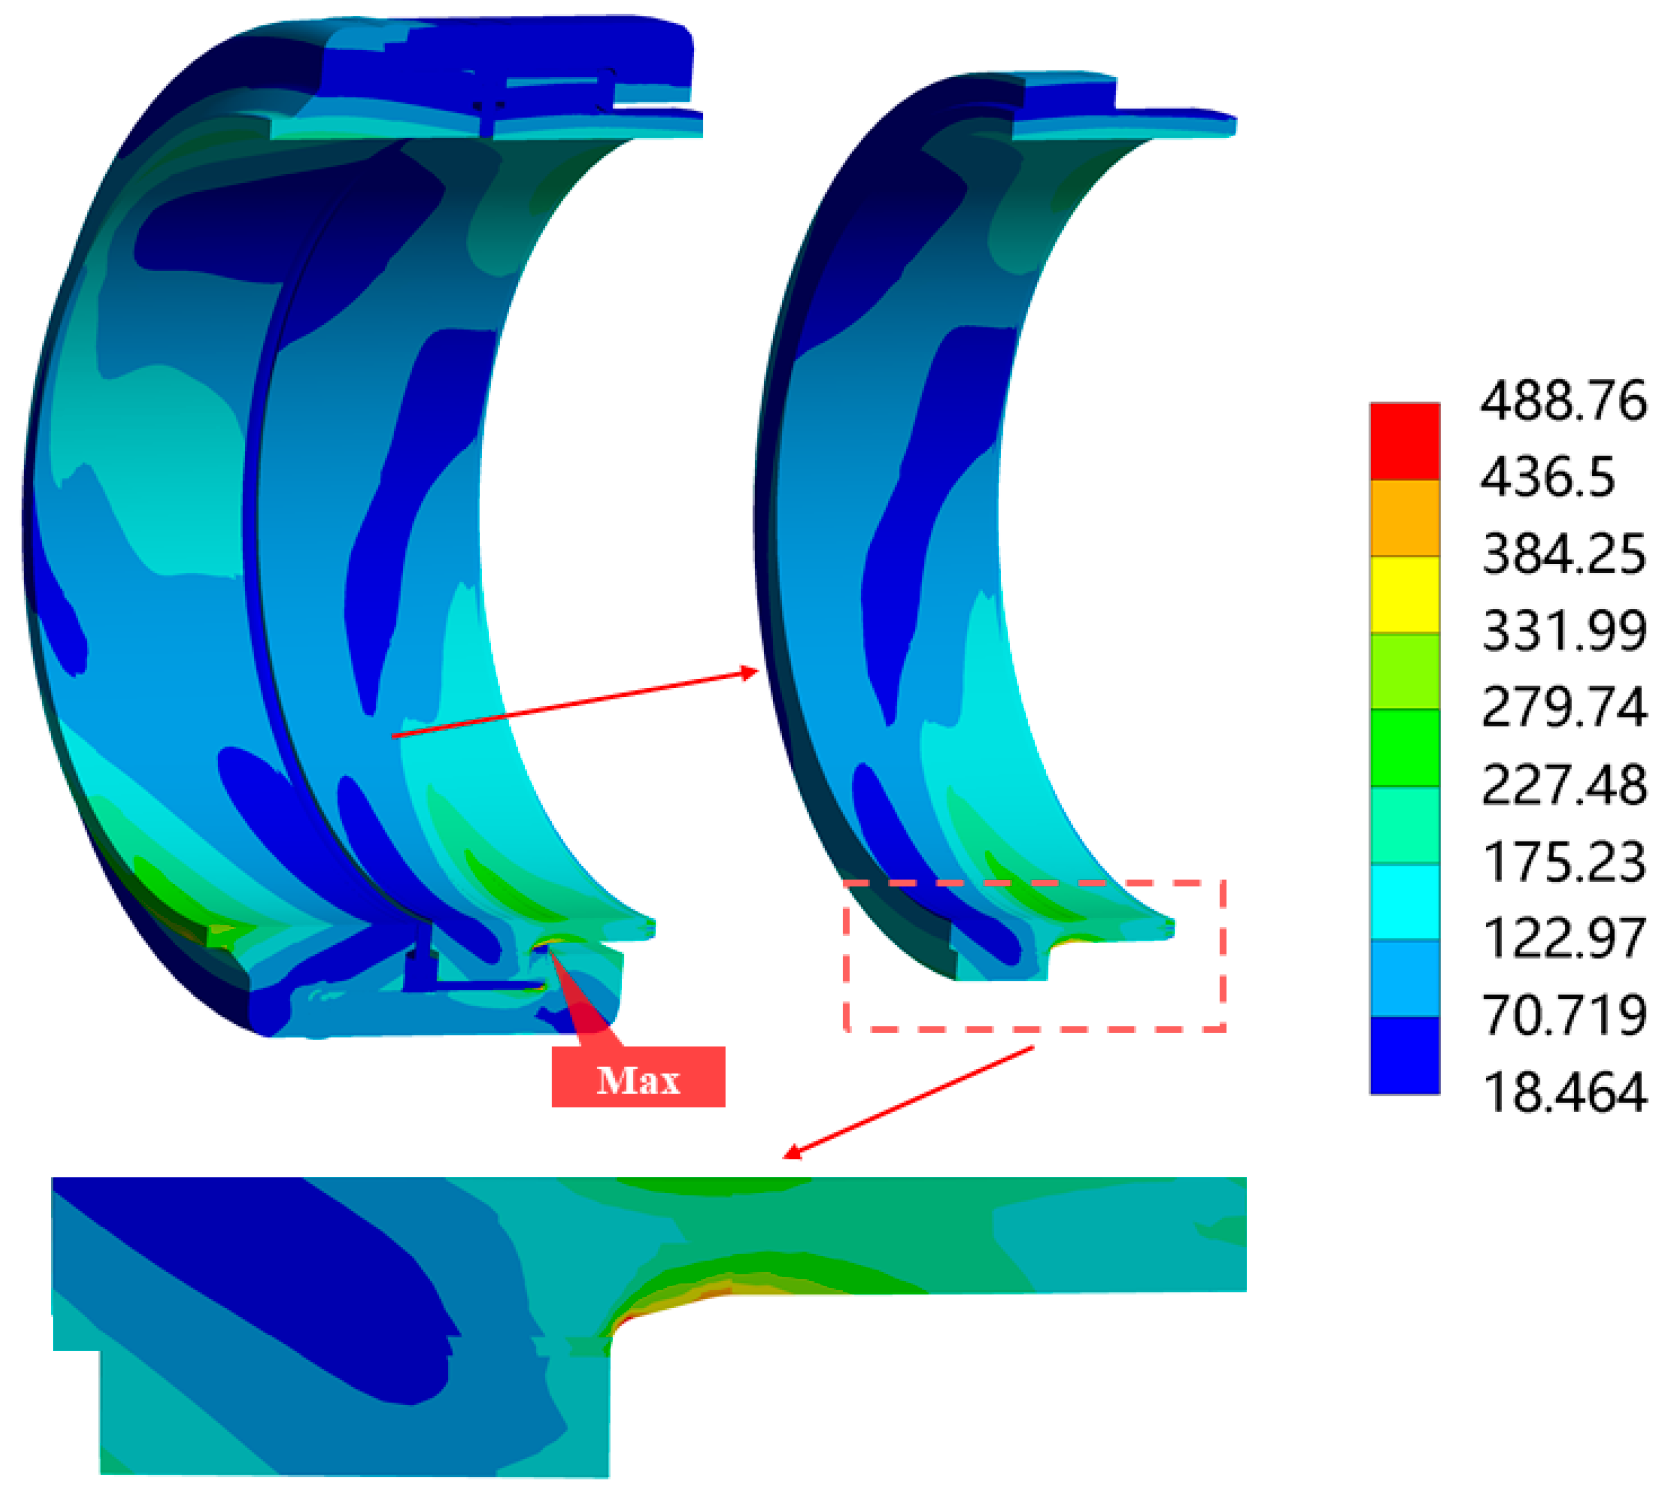
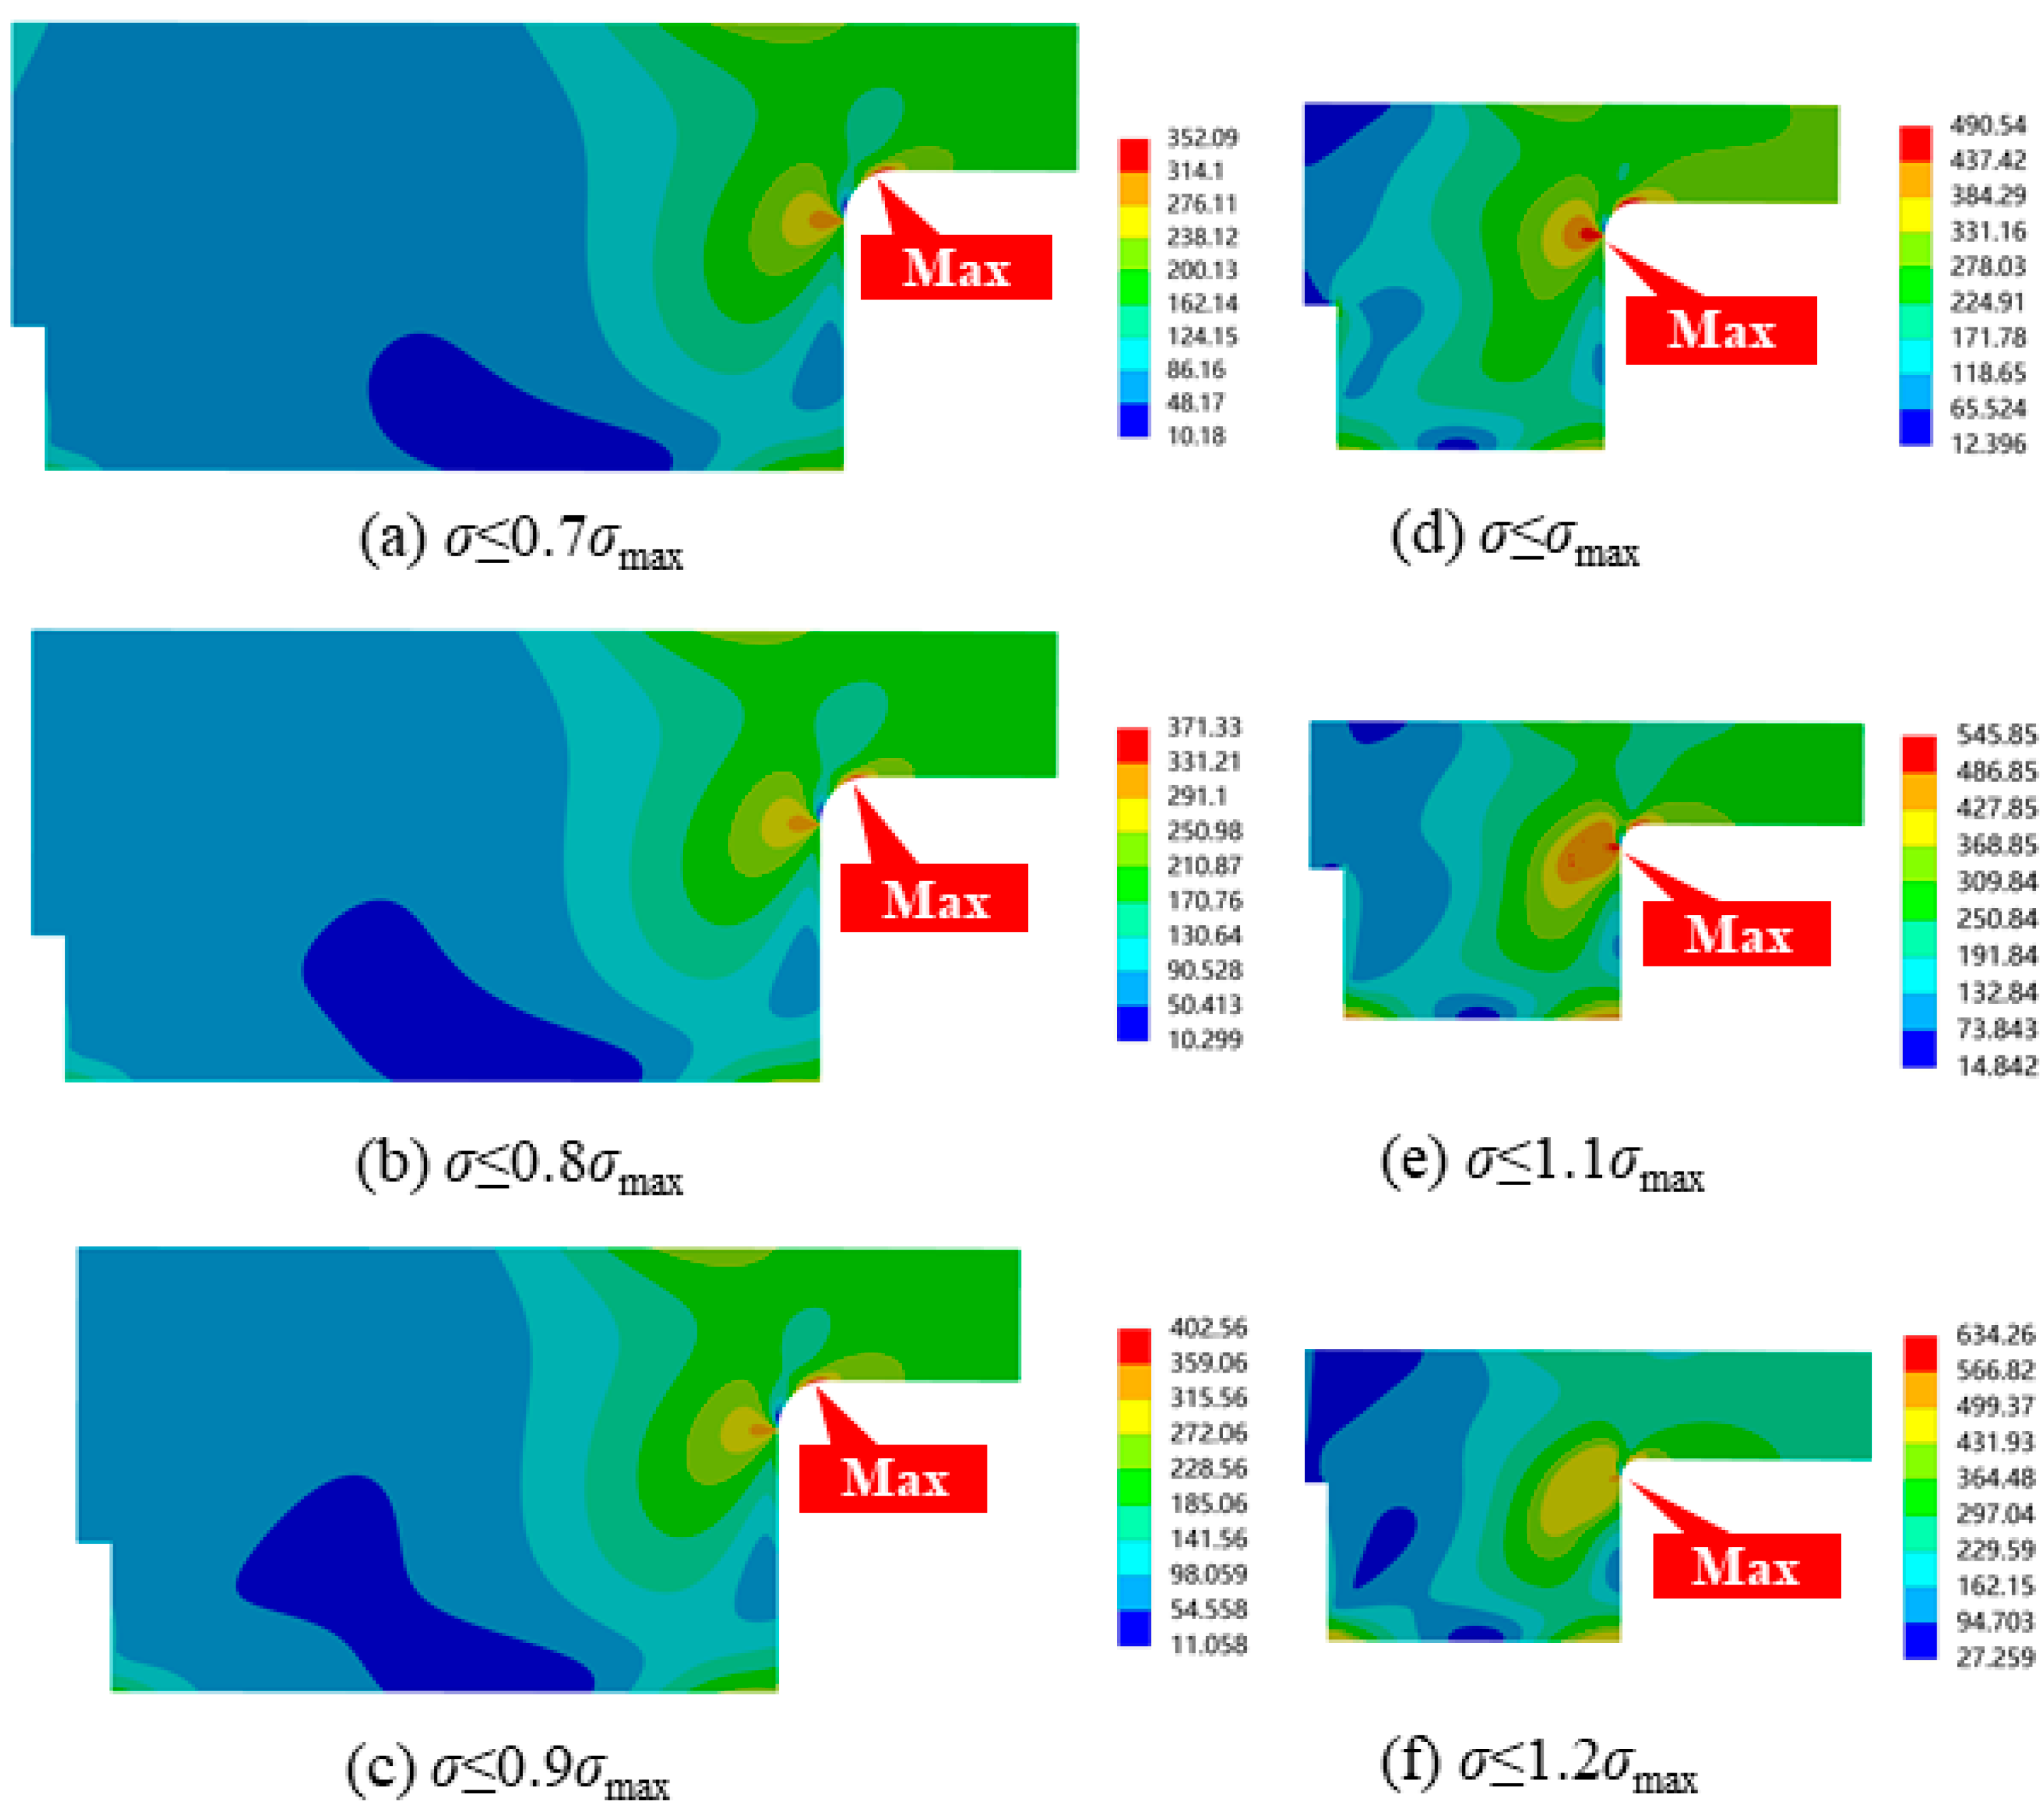
The overall finite element analysis of the insulated joints before optimization reveals that the maximum stress in the joint, under the most adverse condition of four-point bending, is located at the right flange. The overall average stress of the insulating joint is relatively low, indicating a significant space for optimization.
(2)
Based on the parametric computational results of the right flange dimensions, a surrogate model for calculating the maximum stress of the right flange can be constructed. The one established using the ridge regression algorithm demonstrated the best predictive performance, with an R2 value of 0.928 for the random test set and relative errors all below 10%.
(3)
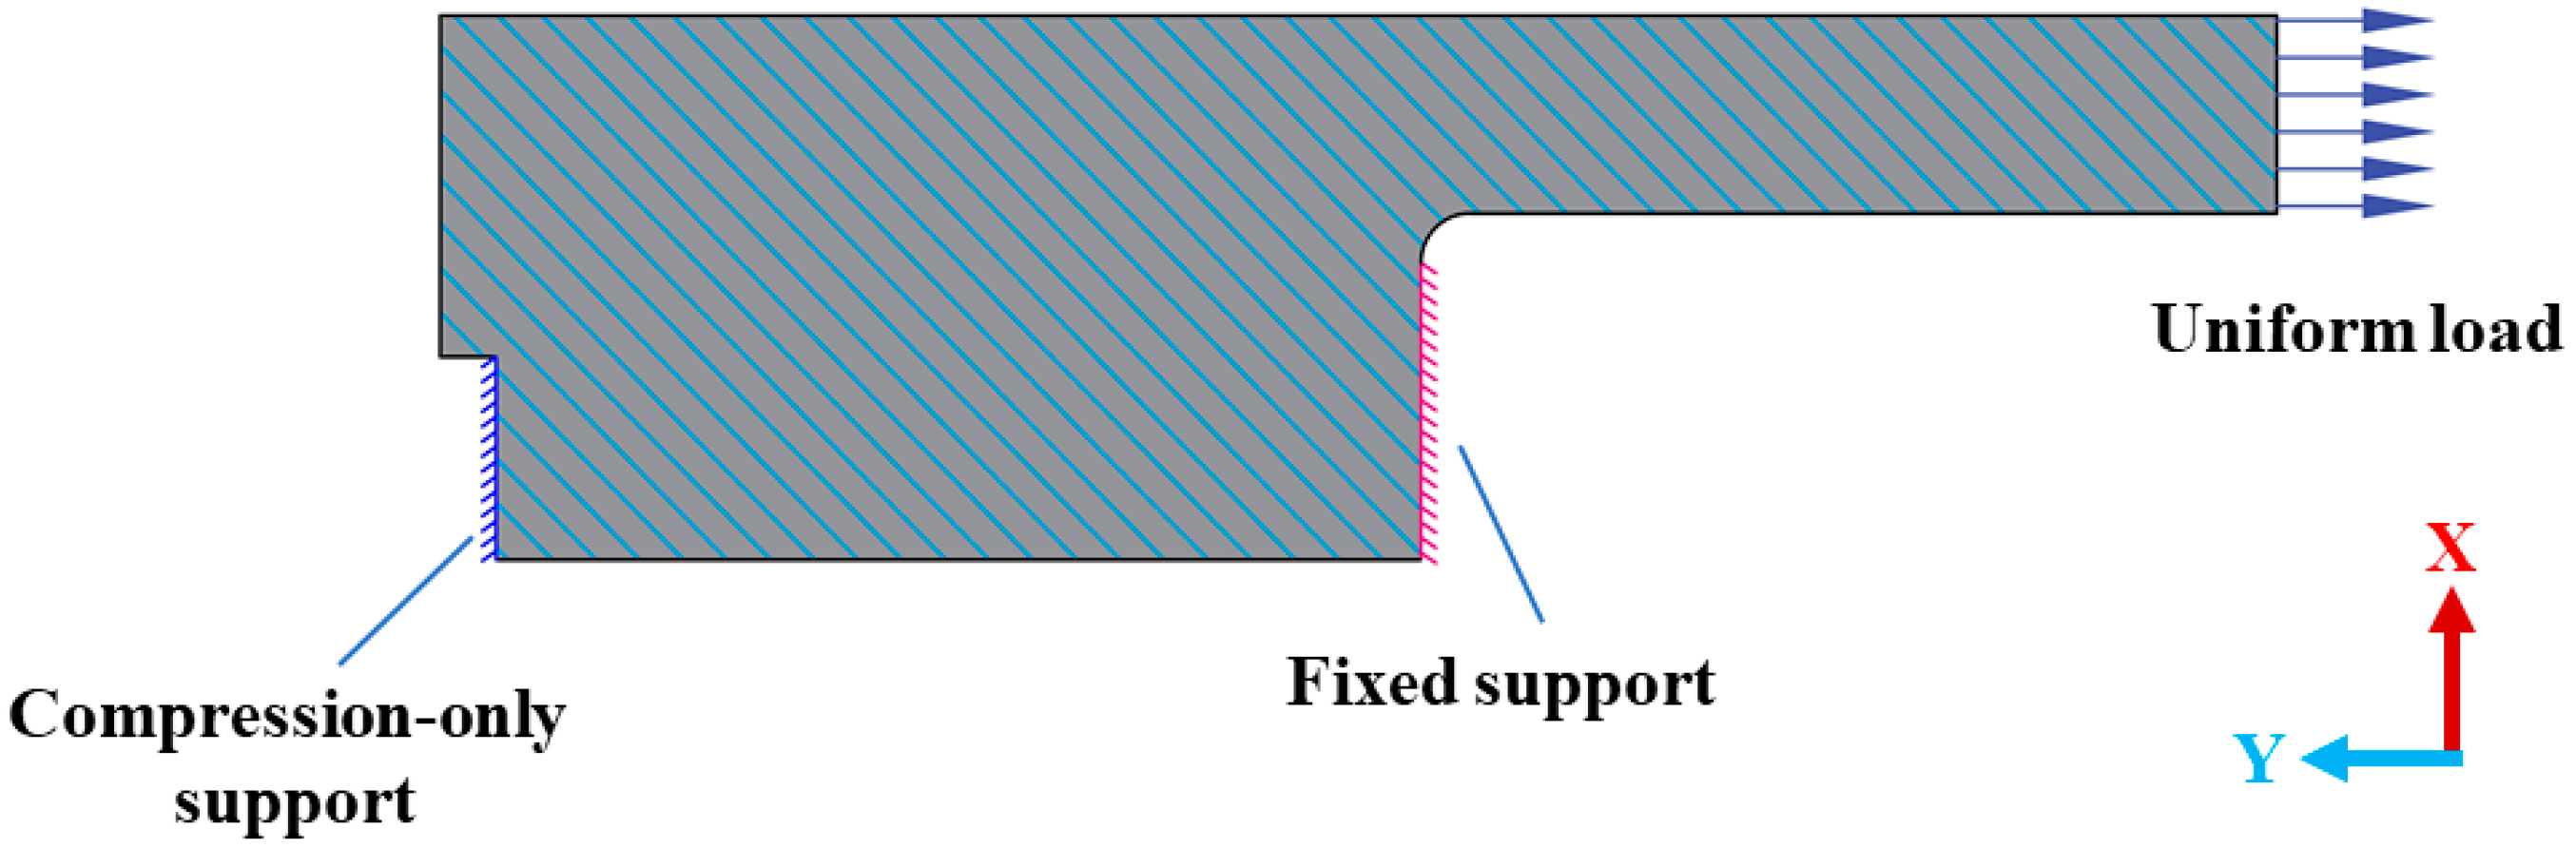
The optimization algorithm established by integrating the surrogate model with genetic algorithms can optimize the dimensions of the right flange under various optimization objectives, demonstrating exact optimization performance. Among all the dimensional parameters, rB1 exhibits a strong correlation with the maximum stress, with its optimal value increasing as the stress limit decreases, indicating that the chamfer radius has a greater influence on improving the stress concentration effect in the right flange. The maximum stress obtained from the finite element analysis based on the optimized dimension parameters for the right flange has a maximum relative error of 8.98% and an average relative error of 4.63% compared to the optimization target. Based on the optimized dimensions, the predicted maximum stress of the right flange by the surrogate model has a maximum relative error of 9.65% and an average relative error of 5.33% compared to finite element calculations. Compared to improving material strength, optimizing cross-sectional dimensions is more efficient for stress optimization of the right flange.
The variety of insulating joint models is extensive, and this study focuses solely on the DN1400 model as the optimization target, which does not have strong universality. Therefore, the next step is to establish training sets for other models to enhance the universality of the surrogate model for different types of insulating joints. Particle swarm optimization (PSO) and ant colony optimization (ACO) are common optimization algorithms. Future research can compare different optimization algorithms to identify the best one, further improving the optimization results for the dimensions of the insulating joint.

Author Contributions

Conceptualization, C.G., Z.Y., Y.Y., L.T. and P.M.; Methodology, Y.Y.; Software, C.G. and J.D.; Formal analysis, J.D.; Writing—original draft, C.G., J.D. and L.T.; Writing—review & editing, C.G. and Y.Y.; Supervision, Z.Y. and P.M.; Funding acquisition, Z.Y. All authors have read and agreed to the published version of the manuscript.

Funding

This research was funded by Provincial Key Research and Development Program of Shaanxi (2022GXLH-01-27).

Institutional Review Board Statement

Not applicable.

Informed Consent Statement

Not applicable.

Data Availability Statement

The raw data supporting the conclusions of this article will be made available by the authors on request.

Acknowledgments

The authors gratefully acknowledge the support provided by the Provincial Key Research and Development Program of Shaanxi (2022GXLH-01-27).

Conflicts of Interest

Author Linjun Tian was employed by the company Xi’an Pump & Valve Plant Co., Ltd. The remaining authors declare that the research was conducted in the absence of any commercial or financial relationships that could be construed as a potential conflict of interest.

Appendix A

The specific dimensions of the DN1400 insulated joint are shown in Figure A1, Figure A2, Figure A3, Figure A4, Figure A5 and Figure A6.
Figure A1. Insulating joint’s inner and outer diameter.
Applsci 15 07601 g0a1
Figure A2. Left flange.
Applsci 15 07601 g0a2
Figure A3. Right flange.
Applsci 15 07601 g0a3
Figure A4. Fixing sleeve.
Applsci 15 07601 g0a4
Figure A5. Sealing ring.
Applsci 15 07601 g0a5
Figure A6. Insulating filler.
Applsci 15 07601 g0a6

References

  1. Liao, Q.; Liang, Y.; Tu, R.; Huang, L.; Zheng, J.; Wang, G.; Zhang, H. Innovations of carbon-neutral petroleum pipeline: A review. Energy Rep. 2022, 8, 13114–13128. [Google Scholar] [CrossRef]
  2. Bariha, N.; Mishra, I.M.; Srivastava, V.C. Hazard analysis of failure of natural gas and petroleum gas pipelines. J. Loss Prev. Process Ind. 2016, 40, 217–226. [Google Scholar] [CrossRef]
  3. Shalaeva, D.S.; Kukartseva, O.I.; Tynchenko, V.S.; Kukartsev, V.V.; Aponasenko, S.V.; Stepanova, E.V. Analysis of the development of global energy production and consumption by fuel type in various regions of the world. IOP Conf. Ser. Mater. Sci. Eng. 2020, 952, 012025. [Google Scholar] [CrossRef]
  4. Chen, S.-Y.; Zhang, Q.; Mclellan, B.; Zhang, T.-T. Review on the petroleum market in China: History, challenges and prospects. Pet. Sci. 2020, 17, 1779–1794. [Google Scholar] [CrossRef]
  5. Wu, T.; Jiang, N.; Zhou, C.; Luo, X.; Sun, J. Evaluate of anti-explosion for high-pressure gas steel pipeline subjected to ground explosion. J. Constr. Steel Res. 2021, 177, 106429. [Google Scholar] [CrossRef]
  6. Cui, G.; Li, Z.-L.; Yang, C.; Wang, M. The influence of DC stray current on pipeline corrosion. Pet. Sci. 2016, 13, 135–145. [Google Scholar] [CrossRef]
  7. Farh, H.M.H.; Ben Seghier, M.E.A.; Zayed, T. A comprehensive review of corrosion protection and control techniques for metallic pipelines. Eng. Fail. Anal. 2023, 143, 106885. [Google Scholar] [CrossRef]
  8. Li, J.; Sun, C.; Roostaei, M.; Mahmoudi, M.; Fattahpour, V.; Zeng, H.; Luo, J.-L. Corrosion Failure and Control of Carbon Steel and Anti-Corrosion Performance Evaluation of Candidate Materials in Thermal Applications. In Proceedings of the SPE Thermal Well Integrity and Design Symposium, Banff, AB, Canada, 19–21 November 2019; p. D011S003R004. [Google Scholar] [CrossRef]
  9. Jiang, G.; Hu, D.; Ji, C.; Song, Y. The Research of Corrosion Mechanism and Protection Measure of Waterflood Pipes. In Proceedings of the ICPTT 2009: Advances and Experiences with Pipelines and Trenchless Technology for Water, Sewer, Gas, and Oil Applications, Shanghai, China, 18–21 October 2009; pp. 508–520. [Google Scholar] [CrossRef]
  10. Camitz, G. Water mains and distribution pipes in soil—External corrosion and protection methods. Water Supply 2001, 1, 97–105. [Google Scholar] [CrossRef]
  11. King, F.; Cheng, Y.; Gray, L.; Drader, B.; Sutherby, R. Field Assessment of FBE-Coated Pipelines and the Implications for Stress Corrosion Cracking. In Proceedings of the 4th International Pipeline Conference, Parts A and B, Calgary, AB, Canada, 29 September–3 October 2002; pp. 1619–1628. [Google Scholar] [CrossRef]
  12. Yang, Z.; Cui, G.; Li, Z.; Liu, J. Study on the interference between parallel pipelines and optimized operation for the cathodic protection systems. Anti-Corros. Methods Mater. 2019, 66, 195–202. [Google Scholar] [CrossRef]
  13. Ahmed, S.; Orth, V.; Foley, M.; Kottas, K.; Teodoriu, C. Designing in-house cathodic protection system to assess the long-term integrity of natural gas pipelines. J. Nat. Gas Sci. Eng. 2021, 94, 104116. [Google Scholar] [CrossRef]
  14. Wang, G.F.; Deng, B.; Zhang, H.B.; Yang, F.P.; Zhang, L.; Ren, G.Q. Failure Analysis of Leakage for Insulating Joint at Natural Gas Pipeline. J. Fail. Anal. Prev. 2022, 22, 292–297. [Google Scholar] [CrossRef]
  15. Vorster, T.E.; Klar, A.; Soga, K.; Mair, R.J. Estimating the Effects of Tunneling on Existing Pipelines. J. Geotech. Geoenviron. Eng. 2005, 131, 1399–1410. [Google Scholar] [CrossRef]
  16. Sahu, M.K.; Chattopadhyay, J.; Dutta, B.K. Fracture studies of straight pipes subjected to internal pressure and bending moment. Int. J. Press. Vessels Pip. 2015, 134, 56–71. [Google Scholar] [CrossRef]
  17. Hobbs, R.E. Pipeline buckling caused by axial loads. J. Constr. Steel Res. 1981, 1, 2–10. [Google Scholar] [CrossRef]
  18. Ma, B.; Zhu, Y.; Jin, F.; Ding, Q.; Guo, X. A lightweight optimal design model for bolted flange joints without gaskets considering its sealing performance. Proc. Inst. Mech. Eng. Part E J. Process Mech. Eng. 2018, 232, 234–255. [Google Scholar] [CrossRef]
  19. Hosseinzadeh, R.; Cheraghi, N.; Taheri, F. An Engineering Approach for Design and Analysis of Metallic Pipe Joints Under Torsion by the Finite Element Method. J. Strain Anal. Eng. Des. 2006, 41, 443–452. [Google Scholar] [CrossRef]
  20. Couchaux, M.; Hjiaj, M.; Ryan, I.; Bureau, A. Bolted circular flange connections under static bending moment and axial force. J. Constr. Steel Res. 2019, 157, 314–336. [Google Scholar] [CrossRef]
  21. Ma, C.; Duan, Y.; Huang, K.; Mo, Q.; Chen, Q.; Fu, T. Research on the Mechanical Properties and Structural Optimization of Pipe String Joint under Deep Well Fracturing Operation. Processes 2024, 12, 835. [Google Scholar] [CrossRef]
  22. Dai, K.; Du, H.; Luo, Y.; Han, R.; Li, J. Stress Distribution Prediction of Circular Hollow Section Tube in Flexible High-Neck Flange Joints Based on the Hybrid Machine Learning Model. Materials 2023, 16, 6815. [Google Scholar] [CrossRef]
  23. Collini, L.; Giglio, M.; Garziera, R. Thermomechanical stress analysis of dissimilar welded joints in pipe supports: Structural assessment and design optimization. Eng. Fail. Anal. 2012, 26, 31–49. [Google Scholar] [CrossRef]
  24. Bahadori, A. Oil and Gas Pipelines and Piping Systems: Design, Construction, Management, and Inspection; Gulf Professional Publishing: Houston, TX, USA, 2016; ISBN 978-0-12-803841-3. [Google Scholar]
  25. Bai, Q.; Bai, Y. Subsea Pipeline Design, Analysis, and Installation; Gulf Professional Publishing: Houston, TX, USA, 2014; ISBN 978-0-12-386889-3. [Google Scholar]
  26. SY/T 0516-2008; Technical Code for Insulating Joint and Insulating Flange. Southwest Company, China Petroleum Engineering Co., Ltd.: Chengdu, China, 2008.
  27. Holland, J.H. Adaptation in Natural and Artificial Systems: An Introductory Analysis with Applications to Biology, Control, and Artificial Intelligence; MIT Press: Cambridge, MA, USA, 1992; ISBN 978-0-262-58111-0. [Google Scholar]
  28. Rao, S.S. The Finite Element Method in Engineering; Elsevier: Amsterdam, The Netherlands, 2010; ISBN 978-0-08-095204-8. [Google Scholar]
  29. Pepper, D.W.; Heinrich, J.C. The Finite Element Method: Basic Concepts and Applications; Taylor & Francis: Abingdon, UK, 2005; ISBN 978-0-203-94235-2. [Google Scholar]
  30. Liu, X.; Qin, J.; Zhao, K.; Featherston, C.A.; Kennedy, D.; Jing, Y.; Yang, G. Design optimization of laminated composite structures using artificial neural network and genetic algorithm. Compos. Struct. 2023, 305, 116500. [Google Scholar] [CrossRef]
  31. Xia, X.; Wu, D.; Yang, F.; Hu, M.; Ma, L.; Li, M.; Dong, X.; Duan, Z. Early underground pipeline collapse detection and optimization based on water hammer vibration signal. Int. J. Press. Vessels Pip. 2023, 206, 105045. [Google Scholar] [CrossRef]
  32. Jordan, M.I.; Mitchell, T.M. Machine learning: Trends, perspectives, and prospects. Science 2015, 349, 255–260. [Google Scholar] [CrossRef] [PubMed]
  33. Pan, H.; Peng, J.; Geng, X.; Gao, M.; Miao, X. Prediction of mechanical properties for typical pressure vessel steels by small punch test combined with machine learning. Int. J. Press. Vessels Pip. 2023, 206, 105060. [Google Scholar] [CrossRef]
  34. Nguyen-Sy, T.; Wakim, J.; To, Q.-D.; Vu, M.-N.; Nguyen, T.-D.; Nguyen, T.-T. Predicting the compressive strength of concrete from its compositions and age using the extreme gradient boosting method. Constr. Build. Mater. 2020, 260, 119757. [Google Scholar] [CrossRef]
  35. Kudela, J.; Matousek, R. Recent advances and applications of surrogate models for finite element method computations: A review. Soft Comput. 2022, 26, 13709–13733. [Google Scholar] [CrossRef]
  36. Zhou, Q.; Wu, J.; Xue, T.; Jin, P. A two-stage adaptive multi-fidelity surrogate model-assisted multi-objective genetic algorithm for computationally expensive problems. Eng. Comput. 2021, 37, 623–639. [Google Scholar] [CrossRef]
  37. Miao, Z.; Margetts, L.; Vasileiou, A.N.; Yin, H. Surrogate model development using simulation data to predict weld residual stress: A case study based on the NeT-TG1 benchmark. Int. J. Press. Vessels Pip. 2023, 206, 105014. [Google Scholar] [CrossRef]
  38. Tu, S.; Ren, X.; He, J.; Zhang, Z. Stress–strain curves of metallic materials and post-necking strain hardening characterization: A review. Fatigue Fract. Eng. Mater. Struct. 2020, 43, 3–19. [Google Scholar] [CrossRef]
  39. Schön, J. Coefficient of friction for aluminum in contact with a carbon fiber epoxy composite. Tribol. Int. 2004, 37, 395–404. [Google Scholar] [CrossRef]
  40. GB/T 37358-2019; Friction Pendulum Isolation Bearings for Buildings. Ministry of Housing and Urban-Rural Development of the People’s Republic of China: Beijing, China, 2019.
  41. Naseri Nasab, M.; Jahangir, H.; Hasani, H.; Majidi, M.-H.; Khorashadizadeh, S. Estimating the punching shear capacities of concrete slabs reinforced by steel and FRP rebars with ANN-Based GUI toolbox. Structures 2023, 50, 1204–1221. [Google Scholar] [CrossRef]
  42. Alhakeem, Z.M.; Jebur, Y.M.; Henedy, S.N.; Imran, H.; Bernardo, L.F.A.; Hussein, H.M. Prediction of Ecofriendly Concrete Compressive Strength Using Gradient Boosting Regression Tree Combined with GridSearchCV Hyperparameter-Optimization Techniques. Materials 2022, 15, 7432. [Google Scholar] [CrossRef]
Figure 1. Installation of the insulating joint.
Applsci 15 07601 g001
Figure 2. Insulating joint.
Applsci 15 07601 g002
Figure 3. Insulating joint bending test.
Applsci 15 07601 g003
Figure 4. Mechanical loading sketch of the bending test for the insulating joint.
Applsci 15 07601 g004
Figure 5. Finite element model for the bending test of the insulating joint.
Applsci 15 07601 g005
Figure 6. Stresses in the bending conditions of insulating joints.
Applsci 15 07601 g006
Figure 7. Right flange force model.
Applsci 15 07601 g007
Figure 8. Dimensions of the right flange.
Applsci 15 07601 g008
Figure 9. Absolute stress error.
Applsci 15 07601 g009
Figure 10. Relative stress error.
Applsci 15 07601 g010
Figure 11. Stress of the right flange under different optimization targets.
Applsci 15 07601 g011
Table 1. Material properties.
MaterialsDensity
(kg/m3)
Elastic Modulus
(MPa)
Poisson’s Ratio
Steel7850206,0000.3
Epoxy Glass Laminated PlateVertical Direction200045,0000.4
Horizontal Direction10,0000.3
Table 2. Range of values for each dimension of the right flange.
No.bB1
(mm)
bB2
(mm)
tB1
(mm)
tB2
(mm)
rB1
(mm)
17666.428285
211499.6324210
3152132.8365615
4
(current design values)
190166407020
5228199.2448425
Table 3. Range of values for each dimension r in the randomized test set.
Dimension TypebB1bB2tB1tB2rB1
Range of values
(mm)
60.8~273.653.1~23928~4422.4~328.34~30
Table 4. Prediction performance of different algorithms on training and test sets.
Algorithm TypeMAERMSER2
Training SetTest SetTraining SetTest SetTraining SetTest Set
Ridge regression19.70422.88238.56360.1150.9930.981
KNN57.26177.789175.502286.9750.8300.679
DT14.48219.99325.73038.7580.9960.991
GBDT2.76623.4025.82455.8640.9990.985
Table 5. Prediction performance of different algorithms on random test sets.
Evaluation IndicatorsRidge RegressionKNNDTGBDT
MAE16.52624.41224.31229.653
RMSE23.71954.04044.09745.647
R20.9280.6270.7510.733
Table 6. Range of values for the optimized size of the genetic algorithm.
Dimension TypebB1bB2tB1tB2rB1
Range of values
(mm)
76~22866.4~199.228~4428~845~25
Table 7. Optimized dimensions of the right flange for different targets.
Optimized Targets
(MPa)
Optimized Dimensions
(mm)
bB1bB2tB1tB2rB1
σ ≤ 0.7σmax = 339.522866.441.88414.4
σ ≤ 0.8σmax = 388212.366.440.98413.3
σ ≤ 0.9σmax = 436.5183.366.436.38413.7
σσmax = 4857666.42870.49.2
σ ≤ 1.1σmax = 533.57666.428536.3
σ ≤ 1.2σmax = 5827666.82847.55
Table 8. Relative error of stresses.
Optimization Targets
(MPa)
Stresses Calculated by Finite Element (MPa)Relative Error in Genetic Algorithm Optimization (%)Stresses Calculated by the Surrogate Model
(MPa)
Relative Error in Surrogate Model (%)Cross-Sectional Area
(mm2)
Optimization Rate
(%)
σσf|σfσ|/σσr|σrσf|/σfS(SS0)/S0
σ ≤ 0.7σmax = 339.5352.093.71336.415.7732,802−16.25
σ ≤ 0.8σmax = 388371.334.30387.224.2830,538−8.23
σ ≤ 0.9σmax = 436.5402.567.78432.257.3725,6619.06
σσmax = 485490.541.14482.511.64990664.89
σ ≤ 1.1σmax = 533.5545.851.93527.953.28845170.05
σ ≤ 1.2σmax = 582634.268.98573.079.65794271.85
Disclaimer/Publisher’s Note: The statements, opinions and data contained in all publications are solely those of the individual author(s) and contributor(s) and not of MDPI and/or the editor(s). MDPI and/or the editor(s) disclaim responsibility for any injury to people or property resulting from any ideas, methods, instructions or products referred to in the content.

