Article

Modeling Sustainable Development of Transport Logistics Under Climate Change, Ecosystem Dynamics, and Digitalization

by
Ilona Jacyna-Gołda
1,
Nadiia Shmygol
1,*,
Lyazzat Sembiyeva
2,*,
Olena Cherniavska
3,4,5,
Aruzhan Burtebayeva
2,
Assiya Uskenbayeva
2 and
Mariusz Salwin
1
1
Faculty of Mechanical and Industrial Engineering, Warsaw University of Technology, 00-661 Warsaw, Poland
2
Department of State Audit, Faculty of Economics, L.N. Gumilyov Eurasian National University, Astana 010008, Kazakhstan
3
Swiss Centre of Excellence in Digital Transformation and Ecosystem Leadership, 8049 Zurich, Switzerland
4
Open International University of Human Development “Ukraine”, 23 Lvivs’ka Street, 04071 Kyiv, Ukraine
5
Digital Society Initiative, University of Zurich (UZH), DSI Rämistrasse 69, 8001 Zürich, Switzerland
*
Authors to whom correspondence should be addressed.
Appl. Sci. 2025, 15(13), 7593; https://doi.org/10.3390/app15137593
Submission received: 22 May 2025 / Revised: 23 June 2025 / Accepted: 30 June 2025 / Published: 7 July 2025
(This article belongs to the Section Transportation and Future Mobility)

Abstract

This article examines the modeling of sustainable development in transport logistics, focusing on the impact of climate factors, changing weather conditions, and digitalization processes. The study analyzes the complex influence of adverse weather phenomena, such as fog, rain, snow, extreme temperatures, and strong winds, whose frequency and intensity are increasing due to climate change, on the efficiency, safety, and reliability of transport systems across all modes except pipelines. Special attention is paid to the integration of weather-resilient sensor technologies, including LiDAR, thermal imaging, and advanced monitoring systems, to strengthen infrastructure resilience and ensure uninterrupted transport operations under environmental stress. The methodological framework combines comparative analytical methods with economic–mathematical modeling, particularly Leontief’s input–output model, to evaluate the mutual influence between the transport sector and sustainable economic growth within an interconnected ecosystem of economic and technological factors. The findings confirm that data-driven management strategies, the digital transformation of logistics, and the strengthening of centralized hubs contribute significantly to increasing the resilience and flexibility of transport systems, mitigating the negative economic impacts of climate risks, and promoting long-term sustainable development. Practical recommendations are proposed to optimize freight flows, adapt infrastructure to changing weather risks, and support the integration of innovative digital technologies as part of an evolving ecosystem.

1. Introduction

1.1. Motivation and Objectives of the Study

Challenges in the transport industry worsen the logistics of material flow, which can lead to crises in various sectors of the economy. As material production is the foundation of economic development in any country, the significance of the transport industry in ensuring the smooth operation of agricultural enterprises, the mining and processing industries, construction, and energy is exceptional. During rapid economic growth, the limited capacity of transportation logistics can become a constraining factor.
Thus, identifying the quantitative relationships among these factors is highly relevant and represents a significant area of interest. In the context of sustainable development, transport logistics play a crucial role in balancing economic efficiency with environmental responsibility. Within this evolving ecosystem, the shift towards sustainable transport solutions is essential to minimize the carbon footprint, optimize resource use, and ensure long-term resilience in economic growth management. Green logistics, thoughtful infrastructure planning, and the integration of digital technologies are key priorities in modern transport management.
Data-driven management in sustainable transport logistics involves the use of digital platforms for monitoring transport and cargo flows. This can enable Route Optimization, which will lead to reduced mileage and, as a result, reduced CO2 emissions and fuel savings.
Therefore, analyzing sustainable transport logistics in Poland and Ukraine allows a deeper understanding of how these countries can align their logistics strategies with global sustainability goals [1,2]. Building a resilient logistics ecosystem also requires the integration of innovative tools such as BIM technology, which can facilitate cooperation among specialists working on construction projects, including architects, engineers, project managers, and transportation logisticians. Central communication hubs, the construction of which is proposed to develop transport infrastructure, can include airports, rail and bus stations, and hotel and restaurant infrastructures. Such hubs serve as nodes within the broader transport ecosystem, supporting connectivity and operational synergy.
The development of central communication hubs can increase freight and passenger transportation speeds, making the transportation system more efficient and attractive for businesses and investors. Building high-precision transportation network models is another important application of BIM technology in transportation logistics. This can be used to solve various infrastructure and transportation-planning tasks. For example, BIM can be used to forecast road and rail traffic loads, plan transportation routes, address transportation safety issues, and improve the efficiency of transportation companies.
This study conducts a comparative intergovernmental analysis of the dependence of economic development in Poland and Ukraine on the functioning of the transport sector to determine the prospects for their interaction based on interindustry connections.

1.2. The Role of Transport Infrastructure in Economic Development

The current state of the transport logistics system faces several challenges that can affect the efficient movement of material flows and cause crises in various economic sectors. It is worth paying attention to another aspect of the development of the domestic transport industry: its high dependence on the state, trends, and dynamics of Ukraine’s foreign trade [3].
In this case, the transport system directly influences the economic development of individual regions and the country [4]. Kotenko [5] and Mashkantseva [6] also delved more deeply into managing regional and sectoral development in this direction. They stressed that Ukraine’s national transport strategy should combine national and local needs with tools for implementation, including institutions, investment, regulatory policies, regulatory activities, and taxation. At the same time, Mashkantseva [6] emphasized the need to develop infrastructure for multimodal freight transportation. The exceptional roles of transport logistics tools and methods for optimizing these processes are the coordination and control of freight and information flows, the development of optimal routes, volumes of deliveries, and warehousing.
Thus, modern research emphasizes the high interdependence between the development of the country’s transport system and socio-economic growth. Moreover, the stimulating role of the transport industry is most evident in the conditions of an open-market economy and its orientation towards integration into the international trade system. However, the development of transport infrastructure requires the mutual coordination of national and regional development strategies and appropriate sources of financing, which has led to the following research direction. Investments and innovative development are the driving forces behind all qualitative economic changes and are dedicated to forming an effective model of innovative investment development in the transportation industry [5,6,7].
Effective mechanisms for implementing this strategy include improving the legal framework for strengthening public–private partnerships, continuing decentralization reform, and creating a competitive market for transport services [7]. The state should also actively finance the development of transport logistics infrastructure, demonopolize the railway transportation market, and promote private investment [8]. This would stimulate Ukrainian exports and contribute to the growth of domestic production. According to their statements, in the absence of sufficient investment volumes, the competitiveness of the transportation industry in Ukraine is at risk because the existing potential cannot meet the logistics needs of international cargo turnover and service infrastructure.
In addition, its current state, in terms of quality and efficiency, does not meet the requirements of the European integration course [9,10,11]. The European type is characterized by an extensive transport network with a high density of all types of transport and logistics infrastructure, where passenger transport is carried out mainly by rail and freight transport by road. The role of transport in the economic lives of these countries and the implementation of international trade are decisive.
The extensive railway and road networks in coastal shipping areas characterize the Asian type. At the same time, there has been a significant lack of main roads of domestic importance. Geographically, Ukraine is located between these parts of the world and is characterized by an insufficient development of road transport and the dominant position of rail transport at the same time. The lack of proper logistics infrastructure makes it impossible to develop intermodal freight transport at this stage [12,13,14,15].
When analyzing the role of transport logistics in Ukraine’s economic development, it is also important to consider several significant studies [16,17,18]. The key role of infrastructure in the border regions of Western Ukraine highlights its importance in supporting supply chains and facilitating integration with the EU, especially in times of war [19,20,21,22].
The integration of logistics flows between the two countries [23,24,25] emphasizes optimizing international trade and minimizing transport costs, particularly for Ukraine’s post-war recovery efforts. The goal was to integrate Ukraine into the global transport network by developing a robust transport and logistics system supported by advanced technology and coordinated business processes. Using the IMD methodology, which focuses on knowledge, technology, and future-readiness, this study emphasizes digital tools such as big data, blockchain, IoT, AI, and cloud computing as essential for enhancing competitiveness. Standardization is crucial for aligning logistics services, ensuring efficiency, and meeting modern demands for digital integration in the logistics and transport infrastructure. This highlights the direct connection between the transportation industry and the country’s economic development [26,27,28,29]. Research emphasizes the importance of transport and logistics infrastructure for restoring growth and notes that it is necessary but insufficient.
However, during research, the economic–mathematical apparatus is most often limited to a statistical analysis of the dynamics and structure of the studied phenomenon, which is a disadvantage.

2. Theoretical Framework and Methodology

2.1. Methodological Approaches to the Analysis of Transport Logistics and Ecosystem-Based Economic Development

The methodological basis was generalization based on analysis, synthesis, and quantitative statistical assessment. At the same time, the most significant scientific and practical interest is the presentation of the complex system under study in the form of economic and mathematical models. Such models permit assessing the current state of the phenomenon under study and modeling the consequences of management decisions or optimization under existing constraints. In particular, the economic and mathematical apparatus was used for the following tasks: modeling of innovative development of transport infrastructure, construction of network models and analysis of relevant graphs, freight transportation routes, and optimization of the location of warehouse infrastructure and retail facilities. A significant limitation of the specified models is the scope of their application at the individual enterprise or regional level.
At the same time, such models solve the local problems of optimizing the target parameters of a particular transport network. These are not related to the socioeconomic development of a given region. Pivtorak et al. [24] examined the impact of the COVID-19 pandemic on population mobility in the western regions of Ukraine, highlighting significant shifts in transportation flows and population movements caused by restrictions and changing preferences. The study emphasizes how mobility patterns have altered, with notable decreases in domestic and international migration and the redistribution of transportation flows.
However, evaluating the long-term effects of transportation logistics on economic expansion is essential for thoroughly assessing the influence of transportation logistics and architectural innovations on economic growth. This involves examining how transportation innovations impact supply chains and analyzing macroeconomic trends, including assessing the effect of logistics on GDP, trade turnover, and the structure of transportation services in the two countries under study. Following this, the issues of the current state, strategic analysis, and the management of the development of the transport industry in Poland were studied [4,12,15]. It was noted that this sector is strategically important for the Polish economy because it creates jobs, fills the state budget through high taxes on fuel, creates a significant share of gross domestic product, and is an important factor for export growth. However, the authors emphasized insufficient state support for the industry, which constantly causes financial and economic problems for enterprises, leading to mass bankruptcy.
Among the main constraining factors, it is necessary to name a high level of remuneration in Germany, which weakens the positions of Polish carriers, and the complex geopolitical situation in the East causing transport companies that carried out freight transport to Ukraine to change the profile of their activities, thus increasing competition in the domestic market.
Thus, high uncertainty in the geopolitical situation leads to a short planning horizon in the industry and insufficient investment volumes. Another aspect is the excessive regulation of road freight transport in EU countries and Poland [17]. A dilemma arises: on the one hand, the free market is an ideal but purely theoretical category; on the other hand, any state legal intervention and the strengthening of regulatory activity leads to a loss of efficiency in market mechanisms. Regulatory activities in the industry do not contribute to restoration and growth [18]. To identify potential sources of investment, the author justified the need to generalize and classify enterprises in the industry according to various criteria: capital of enterprises (Polish, foreign, mixed), size of enterprises by the number of employees and branches, and type of main activity (transport, forwarding, logistics).
This research direction continues to study the competitiveness of the Polish transport industry in the European market [6,9]. Referring to Eurostat statistics, they note that, in terms of freight transport volumes, Poland is among the top-five countries in the EU, indicating an aggressive marketing strategy for transport companies entering foreign markets. However, the issue of increasing efficiency through cost reduction remains relevant. Road freight transport is characterized by lower labor productivity compared to countries that joined the EU in 2004. This is because of the absence of large transport companies that can benefit from economies of scale. By contrast, small- and medium-sized carriers operate in Poland.
Stopka [3] considered selecting a logistics facility location as a multi-criterion decision-making (MCDM) problem, where external and internal factors influence the final decision. To address this issue, the study applied the Analytic Hierarchy Process (AHP) and the Technique for Order Preference by Similarity to the Ideal Solution (TOPSIS), based on criteria weights defined by the Saaty pairwise comparison method. Using these methods, the authors identify the most suitable logistics service center (LSC) location among eight candidate regions. The final ranking, informed by ten logistics experts with practical experience in facility placement, ensures objectivity and highlights how the outcome varies according to individual goals and preferences of decision-makers [21]. The modern Polish freight market was assessed as competitive, highly efficient and rapidly growing. Due to this, transport companies with foreign capital appear on the domestic market, which promotes international trade.
In particular, it was found that the time spent on transporting goods in most cases does not exceed 70% of the total time spent on transportation services. The application of SWOT analysis methods allowed the authors to conclude that the market for transport services in Poland remains attractive for entrepreneurial activity. On the other hand, instead of an innovative development of logistics infrastructure and economies of scale, the primary source of cost savings for Polish road haulers has long been driver wages. The increase in the minimum wage for this category of workers in Germany immediately reflected the internal problems of the Polish transport industry.
Kaczorek and Jacyna [23] make a significant and valuable contribution to the study of decision-making processes in transport design, emphasizing critically important criteria such as sustainable development and improving quality of life. The application of fuzzy logic for the strategic planning of transport projects serves as an innovative tool that allows for the consideration of complex and subjective factors, including social, environmental, and economic impacts. At the same time, the issue remains relevant regarding the evaluation of the impact of transport logistics and architectural innovations on the economic development of countries, particularly Ukraine and Poland, focusing on the role of logistics in sectors such as agriculture, industry, and trade, as well as the use of BIM technologies to enhance the efficiency and sustainability of transport infrastructure.
The analysis of recent research shows that the transport sector in Ukraine and Poland is characterized by certain problems determined by the corresponding socio-economic conditions of development and the external environment. However, in most cases, research has focused solely on this sector of the economy, ignoring its mutual influence on the country’s overall economic growth. Therefore, this direction represents a scientific interest and requires further research.
Further, deterministic factor analysis and the Leontief model were used to investigate the interaction between the country’s economic development and the functioning of the transportation industry. The analytical tools allowed for identifying factors influencing freight turnover and the transportation sector in Ukraine and Poland. The impact of military events, sanctions, and global changes in the energy market on Ukraine’s transit potential was highlighted [27]. The research indicated that the development of the processing industry stimulates the transportation sector in both countries.
A deterministic analysis of the case of Poland revealed that economic development and increased business activity contributed to the growth of freight transport. The country’s size fosters competition between railway and road transport. The analysis showed that, in Poland, economic sectors are more closely linked to transportation logistics than in Ukraine.
The study states that the logistics of material flows are the basis for the functioning of any economic system, both at the macroeconomic and sectoral levels and at the level of individual economic entities. The transport sector directly forms logistical chains in the agriculture, mining, and processing industries, as well as energy, construction, trade, and other economic activities. Logistic chains connect production systems and service intermediate consumption and ensure material flow delivery to end consumers.
In 2020, the share of transport services serving the production sector in Ukraine was 57.4%, whereas in Poland it was 65.1%. These services include the supply of energy resources, raw materials, materials, and semi-finished products through all modes of transport, including multimodal freight transportation using transshipment terminals and transport hubs, the storage of material resources and finished products using wholesale and retail warehousing systems, and transport services during production activities.
Accordingly, in Ukraine, 42.9% of the total volume of transport services was allocated to serving end consumers, considering both freight and passenger transportation, while, in Poland, it was 34.9%. This includes ensuring the functioning of the warehousing and distribution system through which finished products are delivered from producers to consumers.
Therefore, the economy’s competitiveness depends on the availability of necessary logistics infrastructure, transport capacity, and the efficiency of their use, as the cost of transport services directly affects the price of the final product. The speed and quality of transport services are significant reserves for increasing capital turnover and the overall level of return from its use. Subsequently, the transportation industry in the two countries’ economies was considered. A graphical comparison of the GDP structures of Ukraine and Poland by sector based on 2020 data is shown in Figure 1.
From Figure 1, it can be seen that there are both differences and similarities in the structure of gross domestic product (GDP) in Poland and Ukraine. Ukraine’s GDP share of the transportation industry was 7.2% in 2020, whereas it was 7.3% in Poland.
Minimal deviations in the GDP structure were also observed in the energy sector of both countries, at about 4%; trade 15.5–16.1%; financial and insurance activities 3.6–3.9%; professional, scientific, and technical activities 16.3–17.6%; and other activities 20.2–20.6%.
Primary structural shifts occurred in agriculture and mining, where the share of Ukraine’s GDP significantly outpaced Poland. Instead, the Polish economy concentrated more on the manufacturing and construction industries.
Therefore, although the main differences in the sectoral structures of the two countries were concentrated in the material production sectors, the transportation industry played an equally important role. One of the leading indicators of transportation logistics is freight turnover, which characterizes the volume of transportation work performed for the movement of goods and is measured in ton-kilometers.
Following the onset of the full-scale invasion, the State Statistics Service of Ukraine ceased the publication of a significant portion of official statistical data in open sources. This has considerably limited access to up-to-date and verifiable information on the country’s socio-economic and infrastructure indicators beyond 2020. Therefore, the reporting period selected for this study covers the years 2016 to 2020, as this represents the most recent time frame for which complete and comparable statistical data are available.
The national statistical services in Ukraine and Poland account for this indicator of land and pipeline transport, water, and aviation. Land transport consists of rail and road transportation. This indicator is the basis of the methodology for analyzing economic development’s dependence on the transport industry’s functioning, the stages of which and their methodological support are shown in Figure 2.
The proposed methodology consists of three stages based on corresponding methodological support. As shown below, Ukraine and Poland have different cargo turnover structures owing to their different transport modes. Therefore, in the first stage, it is advisable to analyze this indicator using deterministic factor analysis methods. Further, as noted during the analysis of literary sources, the transport industry’s mutual influence on the country’s overall economic growth, and vice versa, is ignored.
This study proposes using the Leontief inter-industry model to model the indicated dependencies. Existing interindustry relationships allow for a scenario analysis of mutual influence. The information support for the second stage of the methodology is the statistical tables “Input-output,” which are part of the system of national accounts of any country. The quantitative assessment of this interdependence and the development of relevant recommendations at the third stage of the methodology are proposed to be performed using elasticity coefficients.
The growing importance of a competitive transport and logistics system in the context of the digital transformation of the economy is due to increasingly complex logistics challenges and rapid technological progress [19,20,21,22]. Average mobility per capita in the EU increased from 2000 to 2019 (+0.6% per year). In 2019–2021, it fell by 18% due to COVID-19 but recovered by 8.6% in 2022. The share of transport in the economy averaged 9% in 2010 and 9.5% in 2022. The highest expenditure on transport (percent of GDP) in 2020 was in the Czech Republic (2.2%), Ukraine (2.11%), Poland (2.05%), and the United Kingdom (1.81%). In the aftermath of the COVID-19 pandemic, mobility across the European Union experienced a significant decline—falling by approximately 18% between 2019 and 2021—as a result of lockdowns, travel limitations, and broader economic disruption. By 2022, mobility showed signs of recovery, increasing by 8.6% as transport activity gradually resumed. The transport sector continues to play a key role in sustaining economic performance, contributing roughly 9% of EU GDP in 2010 and rising slightly to 9.5% by 2022. However, national transport expenditures differ across member states, reflecting variation in infrastructure priorities, investment capacity, and strategic relevance within European and global supply chains. Recent studies indicate that increased funding in transport is strongly aligned with broader policy targets such as carbon neutrality, the digitalization of mobility, and improved accessibility in underserved areas. At the same time, policymakers must address ongoing challenges, including urban congestion, environmental pressure, and unequal access to transport services [32].
The critical need for logistics centers that meet EU standards should strengthen Ukraine’s global competitiveness by improving the logistics infrastructure and providing a comprehensive strategic analysis of the country’s transport infrastructure [23,24,25,26]. It is important to highlight the sector’s growth while addressing its shortcomings compared with European benchmarks. Furthermore, it will be necessary to analyze the practical applications of the proposed methodology (Figure 2).

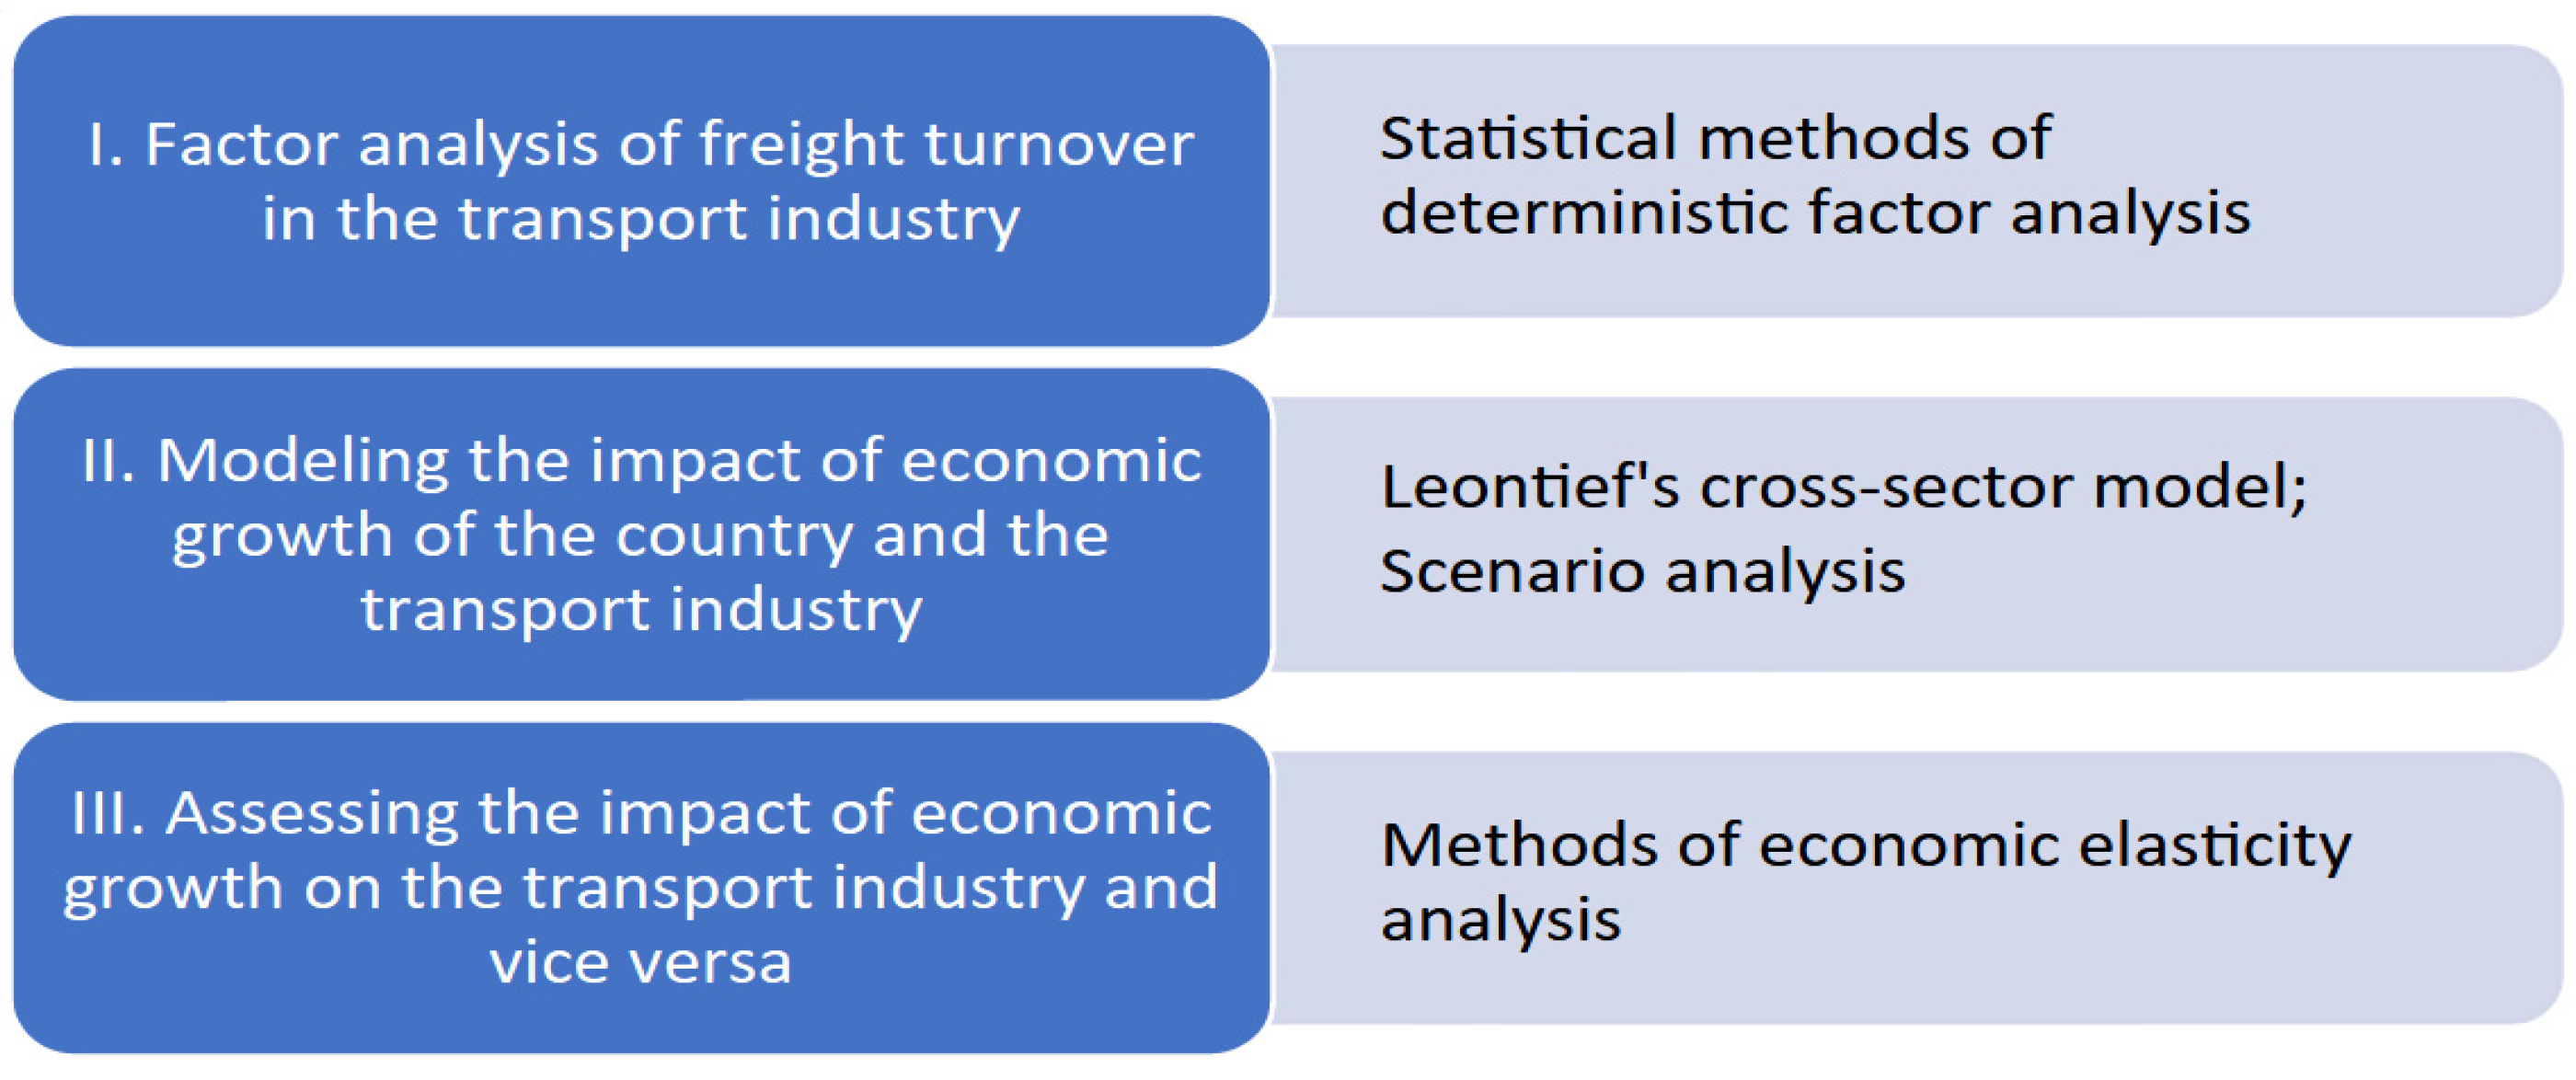
2.2. Research Methodology

The general dynamics and structure of transport use are considered to determine the basis for the study. Significant differences in the general dynamics and structure of use for various transport systems are possible for different countries. These fundamental differences arise due to differences in the density of logistics infrastructure and natural, climatic, and relief differences. However, to obtain indicators acceptable for comparison, it is necessary to follow the general research methodology.
This study uses a productivity metric, the following Factor Model (1), to conduct a qualitative analysis.
F t = i = 1 n F t i = i = 1 n T v i T d i = T v i = 1 n S w i T d i ,
where Ft, Fti represent the total volume of freight traffic and for the i-th mode of transport, billion tonne-kilometers; Tv, Tvi represent the total volume of freight transport and for the i-th mode of transport, thousand tons; Td, Tdi represent the average distance of freight transportation for all modes of transport and for the i-th mode of transport, thousand kilometers; Swi represents the specific weight of the i-th mode of transport in the total volume of freight transport, %; n represents the number of modes of transport.
The functionality of the components of Metric (1) are determined by Formulas (2)–(5).
Δ F t T v = Δ T v S w 0 T d 0
Δ F t S w = T v 1 Δ S w T d 0
Δ F t T d = T v 1 S w 1 Δ T d
Δ F t = Δ F t T v + Δ F t S w + Δ F t T d
Depending on the economic dynamics, in each specific time period, production and consumption indicators Xij, Fi, Xi will take on different values. However, since technological re-equipment in the scale of industries and the national economy occurs slowly due to the high inertia of investment processes, the Leontief model assumes the constancy of technological complexity in the medium-term perspective. For this purpose, based on the input data in Table 1, the coefficients of direct expenses are calculated using Formula (6).
a i j = X i j X j ,
where aij is the coefficient of direct costs of producing one unit of product of the i-th type of economic activity for the production of one unit of product of the j-th type of activity.
The calculated coefficients aij are used for the prospective planning of economic development, taking into account interindustry relations and using Equation (7) in matrix form.
X = AX + F X = I A 1 × F = BF ,
where V is the matrix of total costs, A is the matrix of direct cost coefficients, and I is the identity matrix.
Equation (7) considers the “Cost-Output” table by rows and allows for prospective calculations of the total output of product X, which satisfies the intermediate consumption of AX and scenario volumes of final demand F. The economic content of the matrix of total costs is a quantitative measure of the efficiency of social production, or the number of times that X exceeds F to cover intermediate costs. Then, we have Equation (8).
Δ X = B Δ F ,
where ΔF, ΔX are the absolute changes in the final demand vector F and total output vector X, respectively.
The application of the Leontief input–output model in this study allows for a scenario-based simulation of the mutual influence between the transport sector and other industries. It provides a structured framework for estimating how changes in final demand lead to corresponding adjustments in transport service volumes. In addition, the use of elasticity coefficients makes it possible to quantify the sensitivity of the transport sector to external economic shifts, supporting strategic planning and macroeconomic forecasting.
Furthermore, based on (4), a comparative analysis was conducted on the progress of the transport industry in Ukraine and Poland compared to other branches of the economy. To do this, elasticity coefficients KEL were used, which show the response of the target indicator to changes in factors—Equation (9).
К Е Л = Δ X Δ F × F X ,
Its components are the following indicators: Xij—the volume of production of the i-th type of economic activity consumed by the j-th type of activity; Fi, Xi—respectively, final demand and total output of the i-th type of activity; Vj, Xj—respectively, value-added and total output of the j-th type of activity.
Final demand comprises household expenditures, non-profit organizations, the government sector, investment expenditures as part of tangible and intangible assets, and net exports. Net exports, in turn, are the difference between exports and imports.
The total output Xi of any i-th type of activity is the sum of its components in the i-th row or j-th column, where i = j. A peculiarity of statistical practice in Poland, compared to Ukraine, is that, in the composition of final demand, the volume of international trade is determined only by exports. The balancing of the table with imports is performed by taking it into account as a row vector, along with value added.

3. Results

3.1. Results for Ukraine

The transport system of Ukraine has a number of infrastructure problems that are reflected in such indicators as capacity within the boundaries of important transport hubs, significant differences between the infrastructure provision of different territories, and the lack of consistency in the national transport complex. Table 1 presents data on freight turnover in Ukraine from 2016 to 2020 by transport type.
As shown in Table 1, there was a significant reduction in freight turnover in Ukraine from 364.2 billion km to 313.2 billion km, or 14.0%, from 2017 to 2020, indicating a general slowdown in business activity in the industry.
A deterministic factor analysis methodology should be used in the future to determine the causes of this phenomenon and the factors that lead to the negative dynamics of the target indicator. Railway freight transport accounted for the largest share in 2020 (56.1%), followed by pipeline transport (22.1%) and road transport (20.8%). Other types of transport accounted for approximately 1% of total transport.
The analytical model in (1) makes it possible to assess variations in the scale of transport operations Ft resulting from modifications in freight transportation volume Tv, as well as transformations in the distribution of freight transport Swi and the average distance of freight transportation Tdi. Let us examine the impact of these factors for Ukraine and Poland using the method of absolute differences. Based on the computations, the decline in cargo flow in Ukraine during 2017–2020 took place due to
Δ F t T v = + 13.6 b i l l i o n t k m ;
Δ F t S w = 43.0 b i l l i o n t k m ;
Δ F t T d = 21.6 b i l l i o n t k m ;
Δ F t = 51.0 b i l l i o n t k m .
The overall quantity of freight movement across all transportation modes in Ukraine rose from 1582.0 to 1640.9 thousand tons, marking a +3.7% increase. Consequently, the transport sector’s cargo turnover expanded by +13.6 billion ton-kilometers, reflecting a favorable tendency. Nevertheless, additional elements adversely affected the aggregate performance metric. Considering the industry’s specificity, the longest average distance of cargo transportation belongs to pipeline transport, which ranged from 700–900 km in different years; on railway transport, this indicator was 550–600 km, and, on road transport, it was 50–60 km. In recent years, two trends were observed in Ukraine.
Firstly, there were gradual structural shifts in the use of transport in favor of road transport, whose share in cargo transportation increased from 70.9% to 75.1%. At the same time, there was a proportional decrease in the role of railway and pipeline transport, which led to a decrease in the cargo turnover of the industry by ∆Ft_Sw = −43.0 billion ton-kilometers. Secondly, there has been a reduction in the average distance of transportation for all types of transport. As a result, in 2017–2020, it decreased from 230.2 km to 190.9 km. The corresponding changes in the performance indicator amounted to ∆Ft_Td = −21.6 billion tonne-kilometers.
Due to military actions within Ukraine, restrictions enforced against Russia, and transformations in the EU energy sector, Ukraine is swiftly losing its role as a transit hub for oil and gas. Over time, this will further lead to a decline in the significance of pipeline transportation. Conversely, rail freight has historically been linked to the operations of the metallurgical industry. In 2022, Ukraine lost many of these enterprises, the restoration of which is economically impractical because of their outdated technology, high energy usage, and significant environmental contamination. For this reason, the services of railway freight transportation will also continue to decline. Therefore, the main prospects for further development in this industry need to be associated with road transport.
Using Equations (8) and (9), scenarios of a 1% increase in final demand for each industry’s products were calculated, with a simultaneous assessment of the relevant shifts in expanding transport service volumes. Figure 3 shows the calculation results for Ukraine based on the 2020 data.
According to accepted statistical practice, the transport industry in Ukraine is presented in the “Expenditures-Output” tables in two types of economic activity: (1) transport and warehousing and (2) postal services. Based on this classification, relevant calculations have been made.
The growth of the processing industry is the key catalyst for the transport sector. A 1% increase in the former contributes to an expansion in transport and warehousing services by 0.43% and postal services by 0.12%. Therefore, if we compare the GDP structure with Poland, as shown in Figure 1, with attention to the significant lag of the Ukrainian processing industry, the transport industry will receive a significant stimulus with the resumption of economic growth. Agriculture, construction, trade, and other activities moderately influence growth. All other sectors of the economy depend much less on the transport industry.

3.2. Results for Poland

The transport system of Poland has shifted in different economic and political eras, which has affected the development of some types of transport, such as rail transport, which largely meets the requirements of modern development of the Polish economy. Table 2 provides data on freight turnover in Poland’s transport industry for the same period. Table 2 provides data on freight turnover in Poland’s transport industry for the same period.
In Poland, there were different changes in the volume and structure of freight turnover. Firstly, it increased from 385.7 to 474.6 billion tonne-kilometers by +23.0%. Secondly, the highest share of transport work in 2020 was carried out by road transport—83.4%, while railway accounted for only 10.8% and pipelines for 4.3%. The share of other transport types in the country’s freight turnover was only 1.5%.
In Poland, the corresponding calculations using the deterministic factor analysis methodology and data from 2016–2020 had the following results:
Δ F t T v = + 76.6 b i l l i o n t k m ;
Δ F t S w = 6.3 b i l l i o n t k m ;
Δ F t T d = + 18.5 b i l l i o n t k m ;
Δ F t = + 88.9 b i l l i o n t k m .
Similar to Ukraine, the total volume of freight transport (Tv) in Poland tended to increase from 1836.7 to 2201.3 thousand tons. However, the corresponding growth rates were much higher, reaching +19.9% during the indicated period. This factor proved to be the most significant in the growth of freight turnover by +76.6 billion tkm. Thus, economic development and increased business activity in Poland stimulated the development of the transport sector.
The country’s geographical dimensions resulted in different average distances for transporting goods by different modes of transport than in Ukraine: 370–410 km for pipelines, 220–240 km for railways, and 200–210 km for road transport. Compared to Ukraine, there is a significant difference in their use.
Due to the relatively short average distance of railway transport, there is no fundamental difference between them and road transport, whose share increased from 78.7% to 83.4% in 2015–2020. This factor of structural changes led to a reduction in the overall freight turnover by −6.3 billion tkm. On the other hand, an increase in the average distance by only +5.6 km to 215.6 km contributed to additional growth in freight turnover by +18.6%. Thus, the expansion of freight transportation logistics is closely tied to the fluctuations in trends in intermediate and final demand.
During the period from 2020 to 2023, freight turnover across various modes of transport in Poland continued to grow, although the rate of growth slowed. The overall increase amounted to +20.0 billion tonne-kilometers, including +10.5 billion tonne-kilometers due to the rise in freight volumes and +9.5 billion tonne-kilometers resulting from an increase in the average transportation distance. At the same time, the structure of transport modes remained stable throughout this period.
The above analysis of scientific studies has shown that weather conditions are one of the key external factors that can significantly affect the functioning and efficiency of transport systems. Their impact is so multifaceted that it covers almost all types of transport, except for pipeline transport. Adverse weather conditions can lead to a decrease in the speed of transport vehicles, an increase in the duration of delays and the number of road traffic accidents, infrastructure damage, and more. All these consequences can result in significant losses, the generalized classification of which, by weather conditions and types of transport, is presented in Table 3.
Thus, the generalization of the consequences of adverse weather conditions for the effective functioning of the transport industry can lead to the following:
-
A decrease in the capacity of transport networks due to factors that prevent their full operational utilization;
-
Economic losses caused by damage to cargo and transport infrastructure and the necessity of their restoration;
-
A deterioration in the safety of transport industry workers and passengers.
From the perspective of existing climate zones, Ukraine and Poland are located within the area of all the listed weather risks. Therefore, during the economic–mathematical modeling of the transport industry’s activities, these factors must be taken into account. Accordingly, the modeling period in this study is set as one year.
Investigating the correlation between a country’s economic expansion and the transportation industry requires an examination of well-established inter-industry linkages. As seen in Figure 1, Ukraine and Poland have different GDP values and total production structures. Each industry has its own needs for transport services, depending on the specifics of economic activity and technological development. Therefore, scenario modeling should consider these factors and the differences between Ukraine and Poland. For this purpose, in this study, we used the Leontief model [17] based on statistical tables of “Cost-Output” that are included in the system of national accounts [33].
Using Equations (8) and (9), scenarios of a 1% increase in final demand for each industry’s products were calculated, with a simultaneous assessment of the relevant shifts in expanding transport service volumes for Poland, as illustrated in Figure 4. The difference was that the transport industry breakdown considered ground and pipeline transport, water and air transport, and warehousing.
It should be noted that, in Poland, various sectors of the economy are much more closely related to transport logistics. The leader remains the manufacturing industry, where the elasticity coefficient is 0.5–0.6%. That is, every additional percentage of economic growth in the industry automatically increases the total demand for transportation by at least 0.5%. There is also a high dependence on trade and other types of activities.
On the other hand, elasticity coefficients are relative indicators, where the reference point is the current state of development of a particular industry. For example, in construction, the share of Ukraine’s GDP in 2020 was only 3.5%. Even taking into account the high dependence of the construction industry on transportation, in the conditions of pre-war economic development, this industry had no significant effect on the overall volume of transport services in the country.
However, the post-war rebuilding process will demand a significant increase in construction activities, depending on the region [34]. As a result, the pressure on Ukraine’s transportation sector will grow accordingly.
As for Poland, it was previously mentioned that boosting transport companies’ efficiency through scale economies and enhancing logistics is vital for the sector’s growth. The creation of central transport hubs integrating airports, rail and bus stations, and well-developed hotel and catering facilities is suggested. This should speed up and lower the cost of freight transport between Western and Eastern Europe. For planning, BIM technology should be applied to create a digital twin of the infrastructure. This will help to prevent construction mistakes, accelerate processes, and cut costs. Additionally, it will allow the integration of AI and smart systems like BMS into existing buildings [32,35]. It is recommended that this strategy be implemented across Poland by establishing a national network of interconnected high-speed rail lines linking the central hubs, thereby ensuring the more rapid and efficient transport of passengers and freight. Such a system would not only enhance domestic connectivity but also strengthen Poland’s integration into the broader European transport infrastructure, boosting its competitiveness and strategic relevance.
To reduce the negative impact of weather conditions on the functioning and efficiency of transport systems, the following measures should be applied:
  • Preventive measures:
    -
    Improvement of weather forecasting systems and timely communication of forecasts to transport services, companies, and passengers for appropriate planning and the implementation of precautionary measures;
    -
    Strengthening the resilience of transport infrastructure by using more durable construction materials, building drainage systems, reinforcing embankments, and applying other engineering solutions aimed at enhancing infrastructure resistance to extreme weather events;
    -
    Training personnel of transport services and companies in actions under extreme weather conditions;
  • Active protection measures, which include the implementation of modern traffic safety technologies such as systems for monitoring road surface conditions, vehicle movement control systems, and navigation systems;
  • Emergency response measures, which involve the preventive development and implementation of action plans in cases of hazardous weather conditions and the availability of specialized equipment for eliminating the consequences of natural disasters.
Thus, the practical significance of this study lies in the quantitative assessment of the mutually conditioned impact of a country’s economic growth on the development of the transport sector (and vice versa), the state stimulation of transport sector development, and the spread of the return effect throughout the economy. The strength of this effect may vary depending on the established structure of intersectoral linkages, as demonstrated by the examples of Ukraine and Poland. On the other hand, the developed methodology does not take into account the use of the transit potential of the transport sector, which could be the subject of future research.

4. Discussion

The causal factor analysis indicated that, in Ukraine during 2016–2020, the freight turnover of the transportation industry increased only marginally due to the total volume of cargo movement. Other elements negatively influenced the performance metric due to progressive structural adjustments in the utilization of transport in favor of automobiles and a decline in the average length of cargo transportation for all transport categories. As a consequence of the armed conflict in Ukraine, restrictions placed on Russia, and worldwide transformations in the EU energy market, Ukraine swiftly lost its transit role for oil and gas pipeline shipping. The disappearance of many enterprises within the metallurgical sector led to decreased railway cargo services. Thus, highway transport should be the primary avenue for the transportation field’s continued growth. It was established that the driving factor for the transport industry is expanding the manufacturing sector. Mild effects were noted in farming, infrastructure development, commerce, and other domains. Postconflict reconstruction will necessitate a dramatic surge in construction activity. Accordingly, the load on Ukraine’s transport sphere will proportionally expand. Thus, it is essential to implement proven European practices in transport logistics as soon as feasible.
A causative assessment has shown that economic growth in Poland and a rise in commercial operations have encouraged the expansion of the transportation sector and an upturn in freight shipping and turnover. Due to the nation’s territorial scale, Poland has no essential gap between rail and highway transport. It has been found that, in Poland, various sectors of the economy are much more closely related to transportation logistics than in Ukraine, especially the processing industry and trade. The issue of increasing the efficiency of transportation companies based on economies of scale and improving transportation logistics to the level of Western Europe remains relevant. It was proposed that central communication hubs at the airport, railway stations, and bus stations be designed, and hotel and restaurant infrastructure should be developed based on building information modeling (BIM) technology, following the German model.
The central communication hubs should be spread throughout Poland and connected by high-speed railway tracks, accelerating the transportation of goods and passenger traffic and providing more effective transportation logistics and architecture integration. BIM includes information technologies and processes that enable solving design, construction, and building operation tasks by creating digital prototypes. Ukraine and Poland can potentially use BIM technology in transportation logistics and architecture. However, this requires ensuring a high level of training for specialists and creating the appropriate infrastructure.
Ukraine and Poland demonstrate the most incredible sensitivity of changes in the transport sector to changes in the industry. Based on the results obtained, each of these countries needs a mechanism for adapting the transport infrastructure and means of providing logistics and other services in the field of servicing the economy with transport services. For this adaptation, not only can traditional logistics components be used but also new, digital tools, possibly using artificial intelligence to forecast the demand for transport services arising both in certain industries and in certain regions.
Components for forecasting the development vectors of logistics as a complex for servicing economic sectors will not only increase the efficiency of using vehicles but will also improve the performance indicators of clients who will use the updated logistics. The development of technologies for optimal modeling and synthesizing results based on pragmatic forecasts will allow a more systematic approach to the modernization of logistics infrastructure components, which will allow a more rational allocation of resources in the process of providing transport services to clients from all sectors of the economy.

5. Conclusions

The dependence of the country’s economic development on the functioning of the transport industry is revealed based on deterministic factor analysis and the Leontiev balance model. This is based on a comparative analysis of the assessment results in Ukraine and Poland and the use of BIM technologies that combine transport logistics with architecture and permit one to determine the prospects for inter-industry cooperation within an evolving economic and infrastructural ecosystem.
Thus, the applied value of this study lies in the numerical evaluation of the mutual influence of national economic expansion on the advancement of the transport sector and vice versa, as well as the government’s encouragement of the latter’s growth and the distribution of its return effects across the economy. The indicated impact may vary in intensity, depending on the established structure of inter-sectoral connections, as demonstrated by the cases of Ukraine and Poland. However, the proposed approach does not incorporate the utilization of the transport sector’s transit capacity, which could serve as a direction for further investigation.
Considering the obtained results, planning further research requires an analysis of how sensitive the transport sector is to changes not only in other economic sectors but also to its own level of involvement in each of these sectors. Since various economic sectors rely differently on the quality and intensity of logistics, direct anticipated changes alone will not completely capture the sensitivity level.
Taking into account the European integration focus of the Ukrainian economy, expanding the scope of the research to other countries in the European Union will allow us to study positive practices and identify more specific points of interaction between economic entities within the transport and infrastructure ecosystem of Ukraine and the countries of the European Union, in which progressive practices will be identified based on the results of more extensive research. The novelty of this study lies in the integration of deterministic factor analysis with inter-industry modeling to quantify the bidirectional dependencies between economic sectors and transport systems. These findings can serve as a foundation for evidence-based decision-making in infrastructure planning and post-crisis economic recovery strategies.

Author Contributions

Conceptualization, N.S., I.J.-G. and M.S.; methodology, L.S.; software, O.C.; validation, A.B. and A.U.; resources, N.S., I.J.-G. and L.S.; data curation, A.B.; writing—original draft preparation, N.S., I.J.-G. and M.S.; writing—review and editing, O.C.; visualization, N.S., I.J.-G. and L.S.; supervision, L.S.; project administration, N.S.; funding acquisition, A.B. All authors have read and agreed to the published version of the manuscript.

Funding

The article was prepared as part of the IRN project BR21882352, “Development of a new paradigm and concept for the development of state audit, recommendations for improving the quality assessment and management system, and effective use of national resources”.

Institutional Review Board Statement

Not applicable.

Informed Consent Statement

Not applicable.

Data Availability Statement

The data presented in this study are available upon request from the corresponding author.

Conflicts of Interest

The authors declare no conflicts of interest.

References

  1. Kotenko, S.; Ilchenko, S.; Kasianova, V.; Kens, A. Risk assessment of water transport enterprises by modeling direct and indirect threats. Econ. Ecol. Socium 2023, 7, 15–25. [Google Scholar] [CrossRef]
  2. Maliuta, L.; Rudan, V.; Balushevskyj, K. Problems and perspectives of the development of transport logistics in Ukraine under the conditions of marital state. Econ. Anal. 2023, 33, 153–164. [Google Scholar] [CrossRef]
  3. Stopka, O.; Droździel, P.; L’upták, V. Modeling the designs in terms of logistics service center placement: A Case study. Arch. Transp. 2022, 64, 59–71. [Google Scholar] [CrossRef]
  4. Kordel, Z. Regulation of the road transport market in Poland. Zesz. Nauk. Uniw. Gdańskiego. Ekon. Transp. Logist. 2016, 58, 243–254. [Google Scholar]
  5. Kozak, L.S.; Fedoruk, O.V. Features of formation of an effective model of innovative development of the transport and road complex of Ukraine. Econ. State 2020, 3, 53–60. [Google Scholar] [CrossRef]
  6. Koźlak, A. The structure of the road transport sector in Poland and an assessment of its economic results compared to EU countries. Stud. Work. Coll. Manag. Financ. 2019, 166, 59–75. [Google Scholar] [CrossRef]
  7. Liu, L.; Anwar, A.; Irmak, E.; Pelit, I. Asymmetric linkages between public-private partnership, environmental innovation, and transport emissions. Econ. Res.-Ekon. Istraž. 2022, 35, 6519–6540. [Google Scholar] [CrossRef]
  8. Kosova, T.; Smerichevskyi, S.; Yaroshevska, O.; Mykhalchenko, O.; Raicheva, L. Organizational, financial, and informational restructuring in the system of demonopolization of the transport complex of Ukraine in the conditions of the knowledge economy. In Lecture Notes on Data Engineering and Communications Technologies; Springer: Cham, Switzerland, 2024; Volume 195. [Google Scholar] [CrossRef]
  9. Lorenc, A. Competitiveness of Polish road transport on the European market. Econ. Issues Serv. 2018, 1, 77–87. [Google Scholar] [CrossRef]
  10. Mashkantseva, S.O. Development of the region’s transport industry in the system of multimodal transportation. Ukr. J. Appl. Econ. 2018, 3, 331–336. [Google Scholar]
  11. Prus, P.; Sikora, M. The impact of transport infrastructure on the sustainable development of the region—Case study. Agriculture 2021, 11, 279. [Google Scholar] [CrossRef]
  12. Ogórek, M.; Strycharska, D. Strategic analysis of a company in the transport sector. Gospod. Mater. Logist. 2019, 12, 39–46. [Google Scholar] [CrossRef]
  13. Allen, T.; Arkolakis, C. The welfare effects of transportation infrastructure improvements. Rev. Econ. Stud. 2022, 89, 2911–2957. [Google Scholar] [CrossRef]
  14. Tijan, E.; Jović, M.; Aksentijević, S.; Pucihar, A. Digital transformation in the maritime transport sector. Technol. Forecast. Soc. Change 2021, 170, 120879. [Google Scholar] [CrossRef]
  15. Przybylska, E. Potential sources of innovation in the TSL industry. Zesz. Nauk. Politech. Śląskiej Ser. Organ. Zarządzanie 2017, 101, 401–410. [Google Scholar] [CrossRef]
  16. Sezer, M.D.; Ada, E.; Kazancoglu, Y. Investigating the key drivers in the transition to sustainable hydrogen transportation fuel. Econ. Ecol. Socium 2024, 8, 16–26. [Google Scholar] [CrossRef]
  17. Dobos, I.; Tóth-Bozó, B. Ecological footprint calculation as a land demand: Based on the dynamic Leontief model. Period. Polytech. Soc. Manag. Sci. 2024, 32, 103–114. [Google Scholar] [CrossRef]
  18. Zavidna, L.; Makarenko, P.M.; Chepurda, G.; Lyzunova, O.; Shmygol, N. Strategy of innovative development as an element to activate innovative activities of companies. Acad. Strateg. Manag. J. 2019, 18, 1–6. [Google Scholar]
  19. Bazan, L.I.; Kucha, D. Competitiveness of transport and logistics system in the period of digital transformation of the economy. Control Syst. Comput. 2023, 2, 27. [Google Scholar] [CrossRef]
  20. Sadowski, A.; Wąsowska, K.; Nowak, I. Logistics development in European countries: The case of Poland. Eur. Res. Stud. J. 2020, 23, 500–514. [Google Scholar] [CrossRef]
  21. Koval, V.; Nencheva, I.; Metil, T.; Honcharova, I.; Valiavska, N. Assessment of marketing affects on innovation advancement in the transport cluster. E3S Web Conf. 2024, 558, 01023. [Google Scholar] [CrossRef]
  22. Kaczorek, M.; Jacyna, M. Fuzzy logic as a decision-making support tool in planning transport development. Arch. Transp. 2022, 61, 51–70. [Google Scholar] [CrossRef]
  23. Koval, V.; Shmygol, N.; Đurović, S.; Pavićević, Đ.; Honcharova, I. Analysis of Innovative Electromobility Development and the Advancement of Eco-Friendly Transport Infrastructure. Sustainability 2025, 17, 1010. [Google Scholar] [CrossRef]
  24. Pivtorak, H.; Zhuk, M.; Gits, I.; Galkin, A. Shifting the population mobility of the Ukraine western region on the strength of the COVID-19 pandemic. Arch. Transp. 2022, 62, 7–32. [Google Scholar] [CrossRef]
  25. Prytula, K.; Maksymenko, A.; Kalat, Y.; Kyryk, I.M. Development of the logistics and transport infrastructure of the border regions of Western Ukraine in the context of deepening integration with the European Union. Reg. Econ. 2023, 2, 60–71. [Google Scholar] [CrossRef]
  26. Shkurenko, O.; Savchenko, M. Strategy of development of logistic infrastructure of Ukraine in the conditions of European integration. SHS Web Conf. 2019, 67, 06046. [Google Scholar] [CrossRef]
  27. Khvedelidze, P.; Sokolov, A.; Klenin, O.; Hryshyna, L. Strategic Management of Sustainable Economic Development in Transport and Logistics Sector Companies. Econ. Ecol. Socium 2024, 8, 99–108. [Google Scholar] [CrossRef]
  28. Pradhan, R.P.; Arvin, M.B.; Nair, M. Urbanization, transportation infrastructure, ICT, and economic growth: A temporal causal analysis. Cities 2021, 115, 103213. [Google Scholar] [CrossRef]
  29. Jacyna-Gołda, I.; Shmygol, N.; Gavkalova, N.; Salwin, M. Sustainable development of intermodal freight transportation—Through the integration of logistics flows in Ukraine and Poland. Sustainability 2024, 16, 267. [Google Scholar] [CrossRef]
  30. Zimon, G. Analiza kosztów w przedsiębiorstwach transportu samochodowego. Zesz. Nauk. Uniw. Szczec. 2015, 873, 349–354. [Google Scholar] [CrossRef]
  31. Central Statistical Office. Annual National Accounts. 2020. Available online: https://stat.gov.pl/obszary-tematyczne/rachunki-narodowe/roczne-rachunki-narodowe/ (accessed on 29 June 2025).
  32. Nikolova-Alexieva, V.; Alexieva, I.; Valeva, K.; Petrova, M. Model of the Factors Affecting the Eco-Innovation Activity of Bulgarian Industrial Enterprises. Risks 2022, 10, 178. [Google Scholar] [CrossRef]
  33. State Statistics Service of Ukraine. National Accounts. 2020. Available online: https://www.ukrstat.gov.ua/operativ/menu/menu_u/nac_r.htm (accessed on 20 March 2025).
  34. Azimov, D.T.; Petrova, M. Determination of the efficiency of implementing blockchain technology into the logistics systems. Bus. Manag. 2022, 32, 52–67. [Google Scholar]
  35. Sałaciński, T.; Chrzanowski, J.; Chmielewski, T. Statistical Process Control Using Control Charts with Variable Parameters. Processes 2023, 11, 2744. [Google Scholar] [CrossRef]
Figure 1. Comparison of GDP structure by types of economic activity in Poland and Ukraine in 2020. Constructed by the authors based on [30,31].
Applsci 15 07593 g001
Figure 2. Methodology for analyzing economic development’s dependence on the transport industry’s functioning. Constructed by the authors.
Applsci 15 07593 g002
Figure 3. Sensitivity of Ukraine’s transport sector to changes in other industries (2020). Constructed by the authors based on [30,31].
Applsci 15 07593 g003
Figure 4. Elasticity of transport service volume growth in Poland by industry (2020). Constructed by the authors based on [30,31].
Applsci 15 07593 g004
Table 1. Freight turnover in Ukraine for different types of transport from 2016 to 2020.
Freight Turnover by Different Modes of Transport, Billion TkmYear
TotalOtherPipelineRoadRailway
344.24.294.458.0187.62016
364.24.6105.462.3191.92017
361.33.799.272.1186,32018
355.03.7104.565.0181,82019
313.23.169.365.2175,62020
Table 2. Freight turnover in Poland for different types of transport from 2016 to 2023.
Freight Turnover by Different Modes of Transport, Billion TkmYear
TotalOtherPipelineRoadRailway
385.79.322.2303.650.72016
434.910.521.1348.654.82017
467.28.721.3377.859.42018
477.17.919.4395.354.62019
474.67.420.4395.651.12020
494.620.612.3400.661.12023
Table 3. Generalized classification of transport industry losses due to severe weather conditions.
Weather ConditionsWater TransportAir TransportRail TransportRoad Transport
Snowfalls, blizzards, and iceIce conditions block navigation, increase transport time and fuel consumption, lead to ship stability issues.Ice accumulation degrades aerodynamics, increases weight, leads to loss of lift and controllability.Snowdrifts, icing of switch points and overhead lines cause railway delays and braking issues, and require snow removal.Increased braking distance, difficulty in vehicle control, and increased accident risk. Snowdrifts can block traffic, cause jams, and disrupt logistics chains.
Heavy rains and floodsFloods and droughts limit navigability, affecting inland water transport; crew issues on open decks.Lightning damage to electronics, strong winds and hail physically damage aircraft, aquaplaning on runways.Railway track washouts, embankment damage, track flooding making movement dangerous or impossible.Reduced visibility, aquaplaning risk, extended braking distance, decreased highway speed by 10–15%.
FogVisibility restrictions complicating navigation, increasing collision and grounding risks; port delays.Visibility restrictions complicating takeoff and landing, especially without modern navigation systems.Visibility restrictions complicating train operations and signal recognition, causing speed limitations.Visibility restrictions causing traffic accidents.
Strong windComplicated ship control, increased voyage time, cargo and equipment damage.Headwinds increase flight time and fuel consumption; crosswinds complicate takeoff and landing.Dangerous for empty wagons and high-speed trains; can cause derailments.Loss of control of large vehicles on open roads and bridges.
Extreme temperatures (heat and frost)High temps affect crew and equipment; low temps cause pipeline freezing, deck icing, hazardous work conditions.High temps reduce lift; low temps impact engines and hydraulics.High temps deform tracks; low temps cause metal brittleness, requiring speed restrictions or closures.High temps destroy asphalt, overheat engines; low temps cause starting and brake system issues.
Disclaimer/Publisher’s Note: The statements, opinions and data contained in all publications are solely those of the individual author(s) and contributor(s) and not of MDPI and/or the editor(s). MDPI and/or the editor(s) disclaim responsibility for any injury to people or property resulting from any ideas, methods, instructions or products referred to in the content.

