1. Introduction
Adenosine, also known as adenine nucleoside, is an endogenous nucleoside with significant physiological functions in human cells [
1]. It can directly enter myocardial tissue, where it is phosphorylated to form adenosine monophosphate (AMP), thereby contributing to myocardial energy metabolism [
2]. Clinically, adenosine is used in the treatment of coronary vascular disorders, myocardial infarction, arteriosclerosis, sequelae following stroke, primary hypertension, and angina pectoris [
3]. Additionally, adenosine serves as an important pharmaceutical intermediate for synthesizing various antiviral and antibacterial agents, including pharmacologically relevant derivatives, such as 8-chloroadenosine, puromycin, homocitrullinyladenosine, lysylaminoadenosine, S-methyladenosine, and vidarabine, as well as biologically important molecules, like cyclic adenosine monophosphate (cAMP) and adenosine triphosphate (ATP) [
4]. Due to its wide range of applications and substantial demand, adenosine offers broad prospects and significant development potential.
Microbial fermentation is the predominant method for adenosine production due to its advantages of low production cost, mild reaction conditions, and the wide availability of raw materials [
5]. Microbial strains commonly used for adenosine production include
Escherichia coli [
6],
Cordyceps cicadae [
7], and
Bacillus subtilis [
5,
8], the last of which is the most widely employed in adenosine biosynthesis.
Bacillus subtilis is a preferred strain in industrial fermentation owing to its well-characterized genetic profile and diverse modification strategies [
9]. During adenosine biosynthesis,
Bacillus subtilis converts glucose into 5-phosphoribose via the pentose phosphate pathway, followed by multiple enzymatic steps to synthesize adenosine. Moreover, glutamine and hypoxanthine exert reciprocal effects on adenosine synthesis, where elevated concentrations of one substrate enhance the biosynthesis of the other [
10,
11]. By combining molecular biology and bioinformatics approaches with clarified metabolic pathways, strain improvement strategies have enabled enhanced adenosine biosynthesis [
12]. As a result, yields from modified strains have significantly increased, reaching levels ranging from 14.39 g/L to 23.30 g/L [
8,
13], providing valuable microbial resources for industrial-scale adenosine production. However, engineering the strain for targeted adenosine production still remains challenging due to the complexity of its metabolic pathways.
To elucidate the key genes in the adenosine biosynthesis pathway, this study investigated a mutagenized Bacillus subtilis strain with enhanced adenosine production. Transcriptome sequencing analysis was performed on bacterial cells under varying adenosine yield conditions to identify genes associated with adenosine biosynthesis and validate the expression patterns of critical genes. This research provides genetic resources and a theoretical foundation for the targeted improvement of adenosine-producing microbial strains.
2. Materials and Methods
2.1. Strain Culture and Preparation
The
Bacillus subtilis Q40-2-37 strain is a high-yielding adenosine-producing strain that has previously been obtained through Atmospheric Room Temperature Plasma (ARTP) mutagenesis and whose mutation sites have been identified (
Supplementary Materials Table S1). Its parent strain (CGMCC NO.0733) is currently preserved at the Microbial Culture Collection Center of the Institute of Microbiology, Heilongjiang Academy of Sciences. Strains were purified through continuous streak plate isolation and microscopic examination under aseptic conditions, which prevent the occurrence of contamination issues in subsequent experiments.
The preserved strain was activated on Luria–Bertani (LB) solid medium. Subsequently, the strain was inoculated into a seed medium (1% glucose, 1% peptone, 1% yeast extract, 0.3% beef extract, 0.5% urea, 0.2% KCl, and 0.03% antifoam agent) for scale-up cultivation; the cultivation conditions were maintained at 30°C for 16 h with agitation at 220 rpm. Seed cultures grown to the logarithmic phase were subsequently transferred to a fermentation medium (7% glucose, 2.5% peptone, 0.3% KH
2PO
4, 0.1% MgSO
4·7H
2O, 0.5% urea, 0.2% KCl, 1.5% (NH
4)
2SO
4, 0.001% MnSO
4·H
2O, 0.015% thiamine, and 1.5% soybean cake hydrolysate). Fermentation was then conducted continuously at 30°C with 180 rpm agitation for 72 h at a 1% inoculation volume. We additionally established a treatment group designed to induce enhanced adenosine synthesis. In this treatment group, 15 g/L glutamine was pre-added to the fermentation medium; this was followed by supplementation with 10 g/L glutamine and 6 g/L hypoxanthine at 48 h of fermentation (optimal concentrations selected based on preliminary experimental results;
Figure S1). Samples obtained using this cultivation method were categorized as the treatment group, while the cultures without supplementation served as the control group.
2.2. Sample Preparation and Analysis for Transcriptome Sequencing
All cultured broth was centrifuged at 1700×
g for 5 min to separate the fermentation supernatant from the cell pellet. All solvents and samples were filtered through 0.22 μm filters before injection. Subsequently, the adenosine content in the fermentation broth was determined using the HPLC method [
14]. An Ultimate AQ-C18 column (250 mm × 4.6 mm i.d., 5 μm) from Welchmat (Shanghai, China) was used. The column temperature was maintained at 30 °C. All samples were separated using a mobile phase consisting of 0.4% phosphoric acid (A) and methanol (B). The linear gradient conditions were 90% A and 10% B for 25 min. The flow rate was set at 1.0 mL/min, and the injection volume was 20 μL. The detection wavelength was set at 257 nm. An adenosine standard was purchased from Sigma-Aldrich Co., Ltd., serial dilutions were prepared at concentrations ranging from 0.1 mg/L to 100 mg/L, and the adenosine yield was quantified by comparing chromatographic peak areas against the standard curve.
Cell pellets collected at 60 h of cultivation with three individual biological repeats for each group were flash-frozen in liquid nitrogen to prepare for transcriptome sequencing, which was performed by Magigene Co., Ltd. (Shenzhen, Guangdong Province, China) using an Illumina sequencing platform. Raw sequencing reads underwent quality control (QC), and adapter/low-quality sequences were filtered using Trimmomatic to obtain clean data [
15]. Ribosomal RNA-depleted sequencing reads were aligned to the reference
Bacillus subtilis 168 genome (RefSeq: GCF_000009045.1) using Bowtie 2 [
16].
Transcript quantification was performed using RNA-Seq by Expectation Maximization (RSEM) to obtain transcript-level read counts, followed by conversion to gene-level read counts with the R 4.3.0 software and the R package tximport [
17]. Gene expression levels were quantified using the TPM (transcripts per million) method [
18]. The formula for TPM is as follows:
Differential gene expression analysis was performed using DESeq2, with the basal medium-cultured sample as the control, to compare transcriptional abundance between the control and treatment groups [
19]. We considered segments with a fold change of ≥2 and a false discovery rate (FDR) of <0.05 in our comparison as significantly differentially expressed genes (DEGs).
DEGs were functionally annotated by mapping to Gene Ontology (GO) terms using WEGO (
http://wego.genomics.org.cn) [
20]. These terms were summarized and classified by their function and location. Then, GO terms that were significantly enriched compared with the background genome were verified through a hypergeometric test, and
p-values were calculated using the following formula:
where
N represents the number of all genes with GO annotations,
M is the total number of genes annotated to the specific GO terms, and
m is the number of DEGs in
M. The
p-value was FDR-corrected, and an FDR of ≤0.05 was used as the threshold [
21].
Kyoto Encyclopedia of Genes and Genomes (KEGG) pathway enrichment analysis was conducted using Cluster Profiler, quantifying DEGs enriched at different pathway levels [
22]. The method for calculating the
p-value was the same as that used in the GO analysis [
23]. Both GO and KEGG analyses covered the entire genome.
2.3. Analysis of Cell Concentration and Residual Sugar in Adenosine Biosynthesis
Fermentation broth samples from the treatment group were collected at 24 h, 48 h, and 72 h after fermentation to monitor cell concentration and residual sugar levels at different fermentation stages. Cell concentration was determined by measuring the absorbance at 600 nm (OD600). Residual sugar content was quantified using a glucose detection kit (Beyotime Biotechnology Co., Ltd., in Shanghai, China) based on the GOD-POD (glucose oxidase–peroxidase) method following the manufacturer’s instructions.
2.4. Analysis of Expression of Key Genes in Adenosine Biosynthesis
To elucidate the expression patterns of key genes involved in adenosine biosynthesis during different fermentation phases, the expression levels of selected differentially expressed genes (DEGs) were analyzed at 24 h, 48 h, and 60 h of fermentation. The selected time points were chosen because the fermentation endpoint was reached at 72 h, making it not meaningful to detect the expression levels of adenosine synthesis-related genes in the bacterial cells. Additionally, 20 g/L of adenosine was supplemented to the fermentation medium of the treatment group at 36 h of fermentation for another test. Gene expression levels at 48 h of fermentation were then examined to validate the impact of excessive adenosine accumulation on the expression of selected differentially expressed genes during critical periods. The relative expression levels of these genes across time points were determined using real-time quantitative PCR (qPCR) using the 2
−ΔΔCt method. Primer sequences are listed in
Table S2.
2.5. Statistical Analysis
All experiments, including fermentation tests, transcriptome analysis, and gene expression analysis, were independently conducted in triplicate. The results are presented as the mean ± standard deviation (SD). Statistical analyses, i.e., one-way analyses, were performed using SPSS Statistics 28. The significance levels in the analyses are denoted as * p < 0.05, ** p < 0.01, and *** p < 0.001.
3. Results
3.1. Fermentation Yield of Bacillus subtilis Q40-2-37 Under Different Culture Conditions
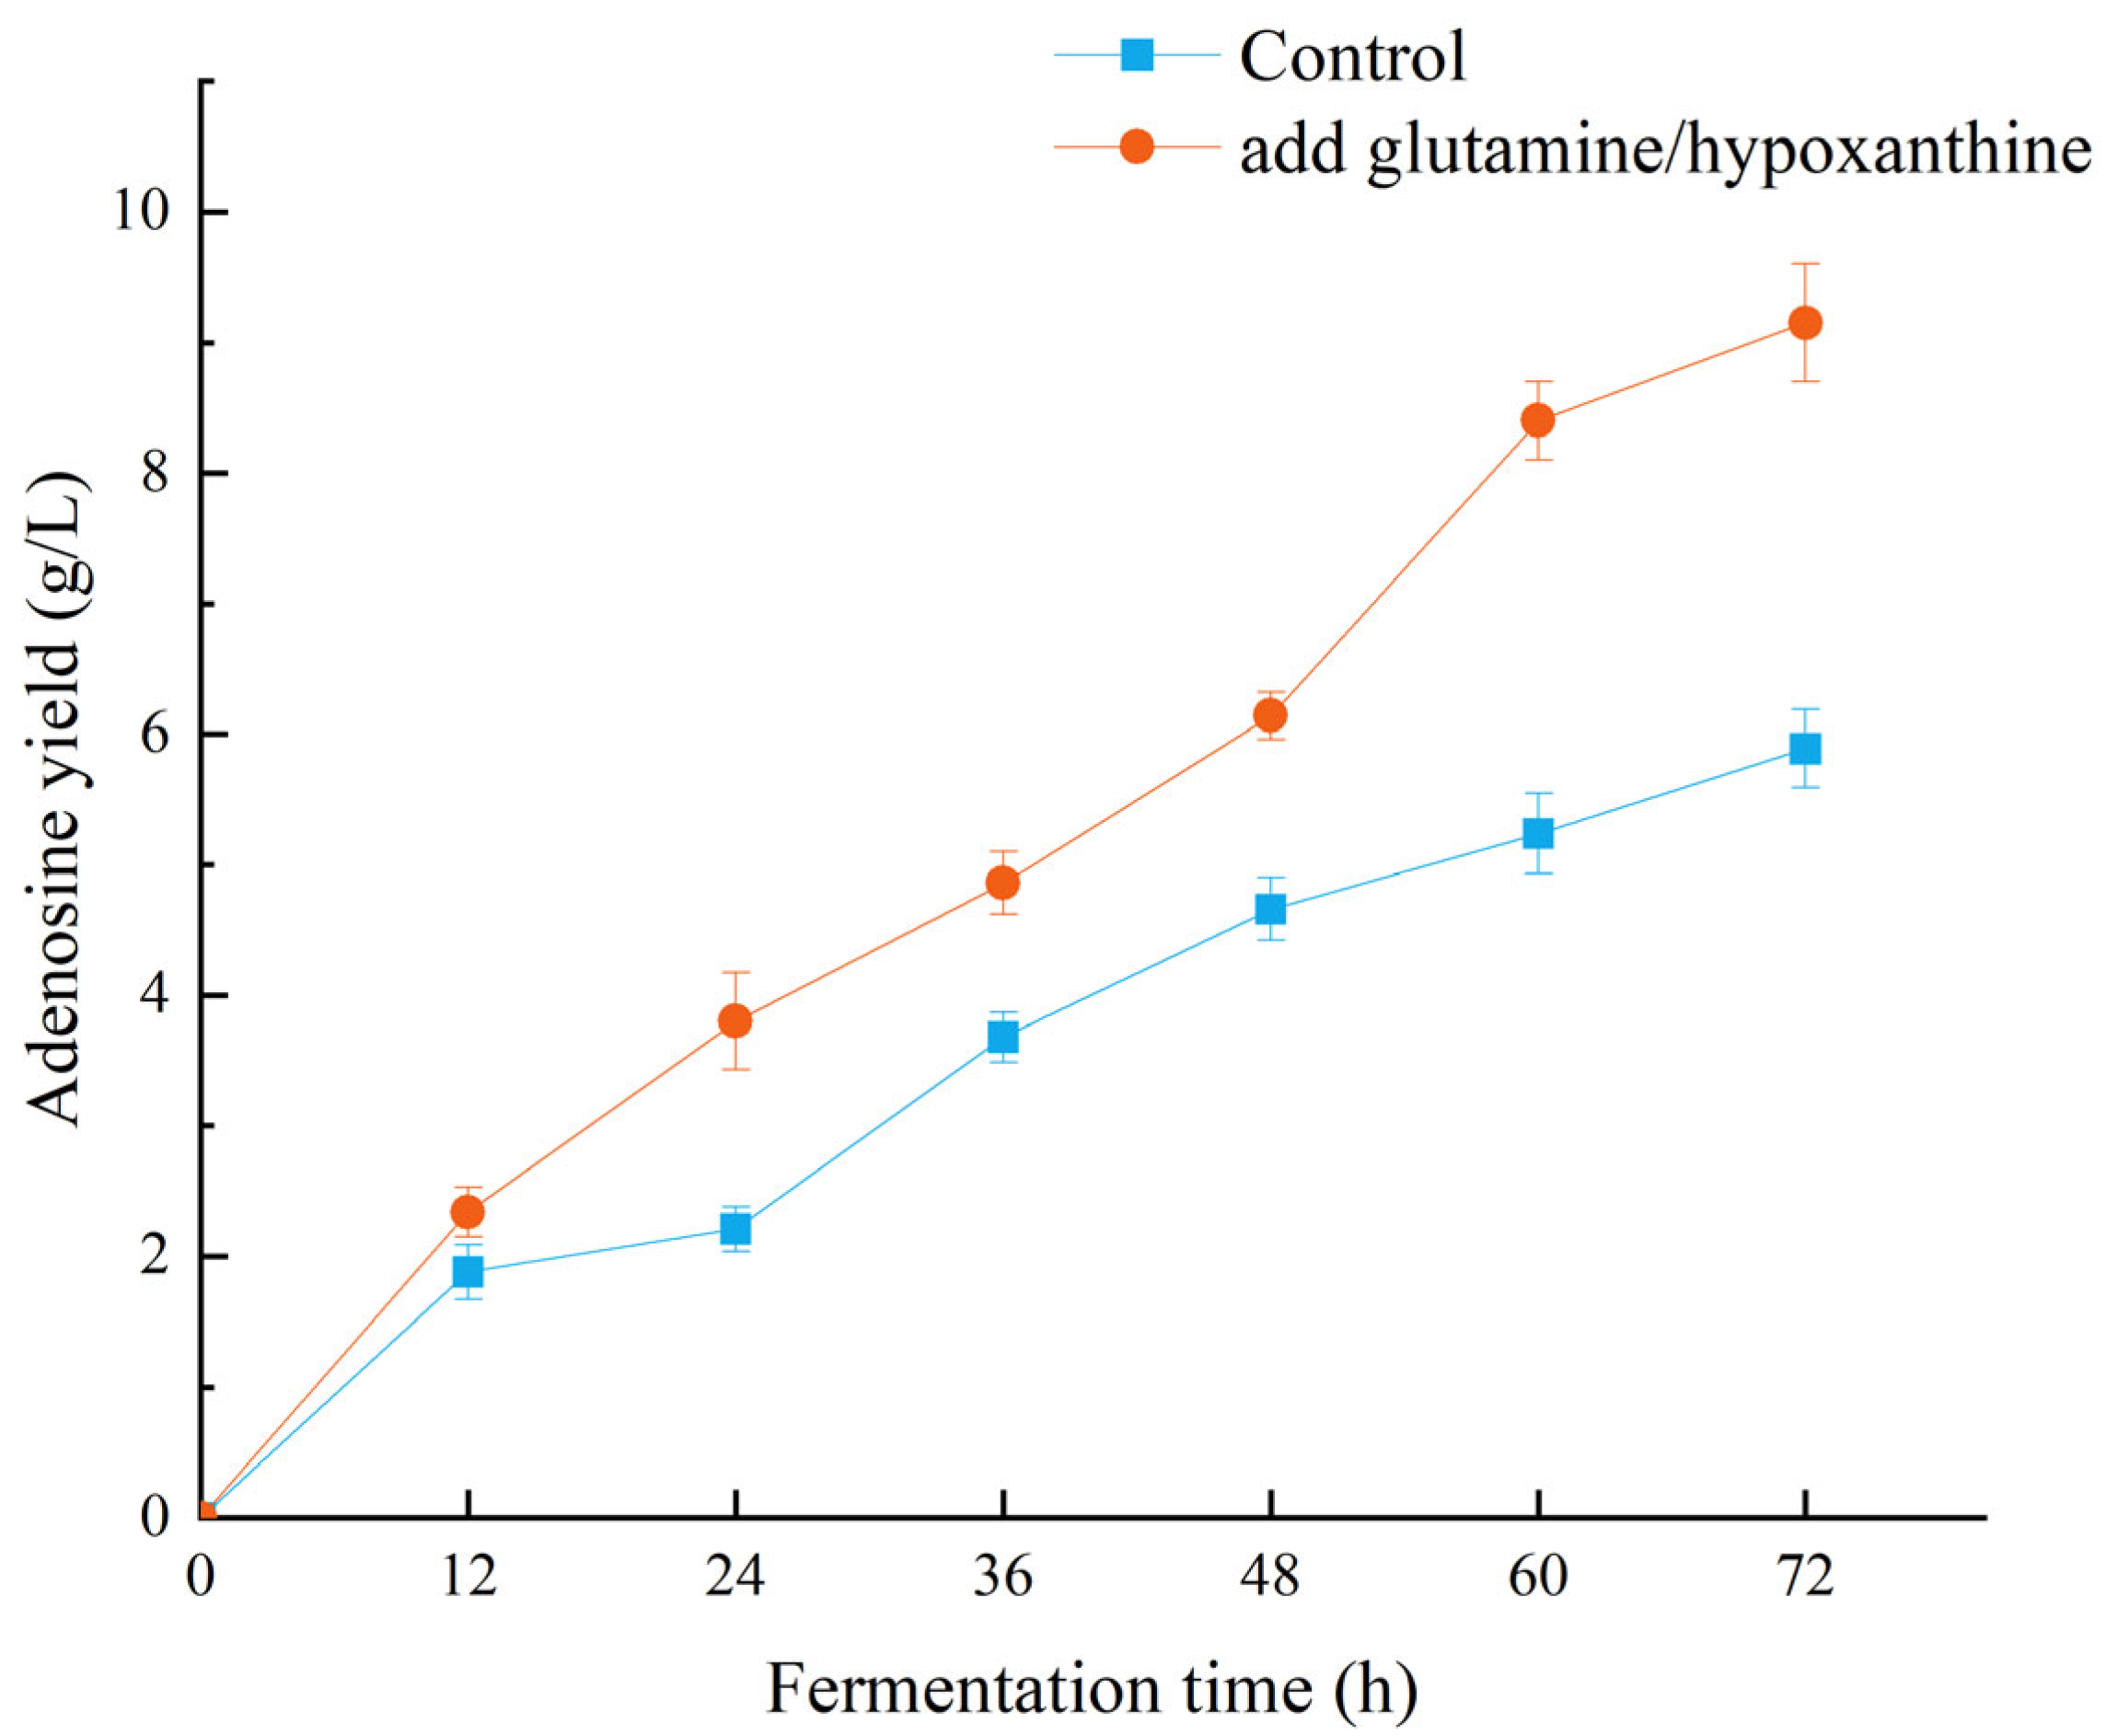
During preliminary preparations, we found that adding glutamine and hypoxanthine to the fermentation medium can effectively enhance adenosine yield in microbial strains. Although the addition of these compounds increases production costs, it enables clear differentiation of the strain’s adenosine biosynthesis and metabolism pathways. As shown in
Figure 1, the adenosine fermentation yield increased over time. In the treatment group, an initial supplementation of glutamine was added to the fermentation medium. The results demonstrated that adenosine production in the treatment group was significantly higher than that in the control group during the 24–48 h fermentation period. After the addition of extra glutamine and hypoxanthine at 48 h in the treatment group, the difference in adenosine production between the culture conditions became more pronounced, indicating that the supplementation of these compounds can effectively induce additional adenosine biosynthesis.
3.2. Differential Gene Screening Based on Transcriptome Sequencing
After the ribosomal sequences were removed, the data were aligned to the reference genome using Bowtie 2. As whole-genome sequencing of the experimental bacterial strain had not been previously performed,
Bacillus subtilis 168 was selected as the reference genome for comparative genomic analysis. The results showed 92.9% sequence identity between the control group and the
Bacillus subtilis 168 genome, while the experimental group exhibited 93.29% sequence identity with the
Bacillus subtilis 168 genome (
Table S3). These findings indicate a moderate degree of genomic divergence from the
Bacillus subtilis 168 reference genome, despite all sequenced strains belonging to the
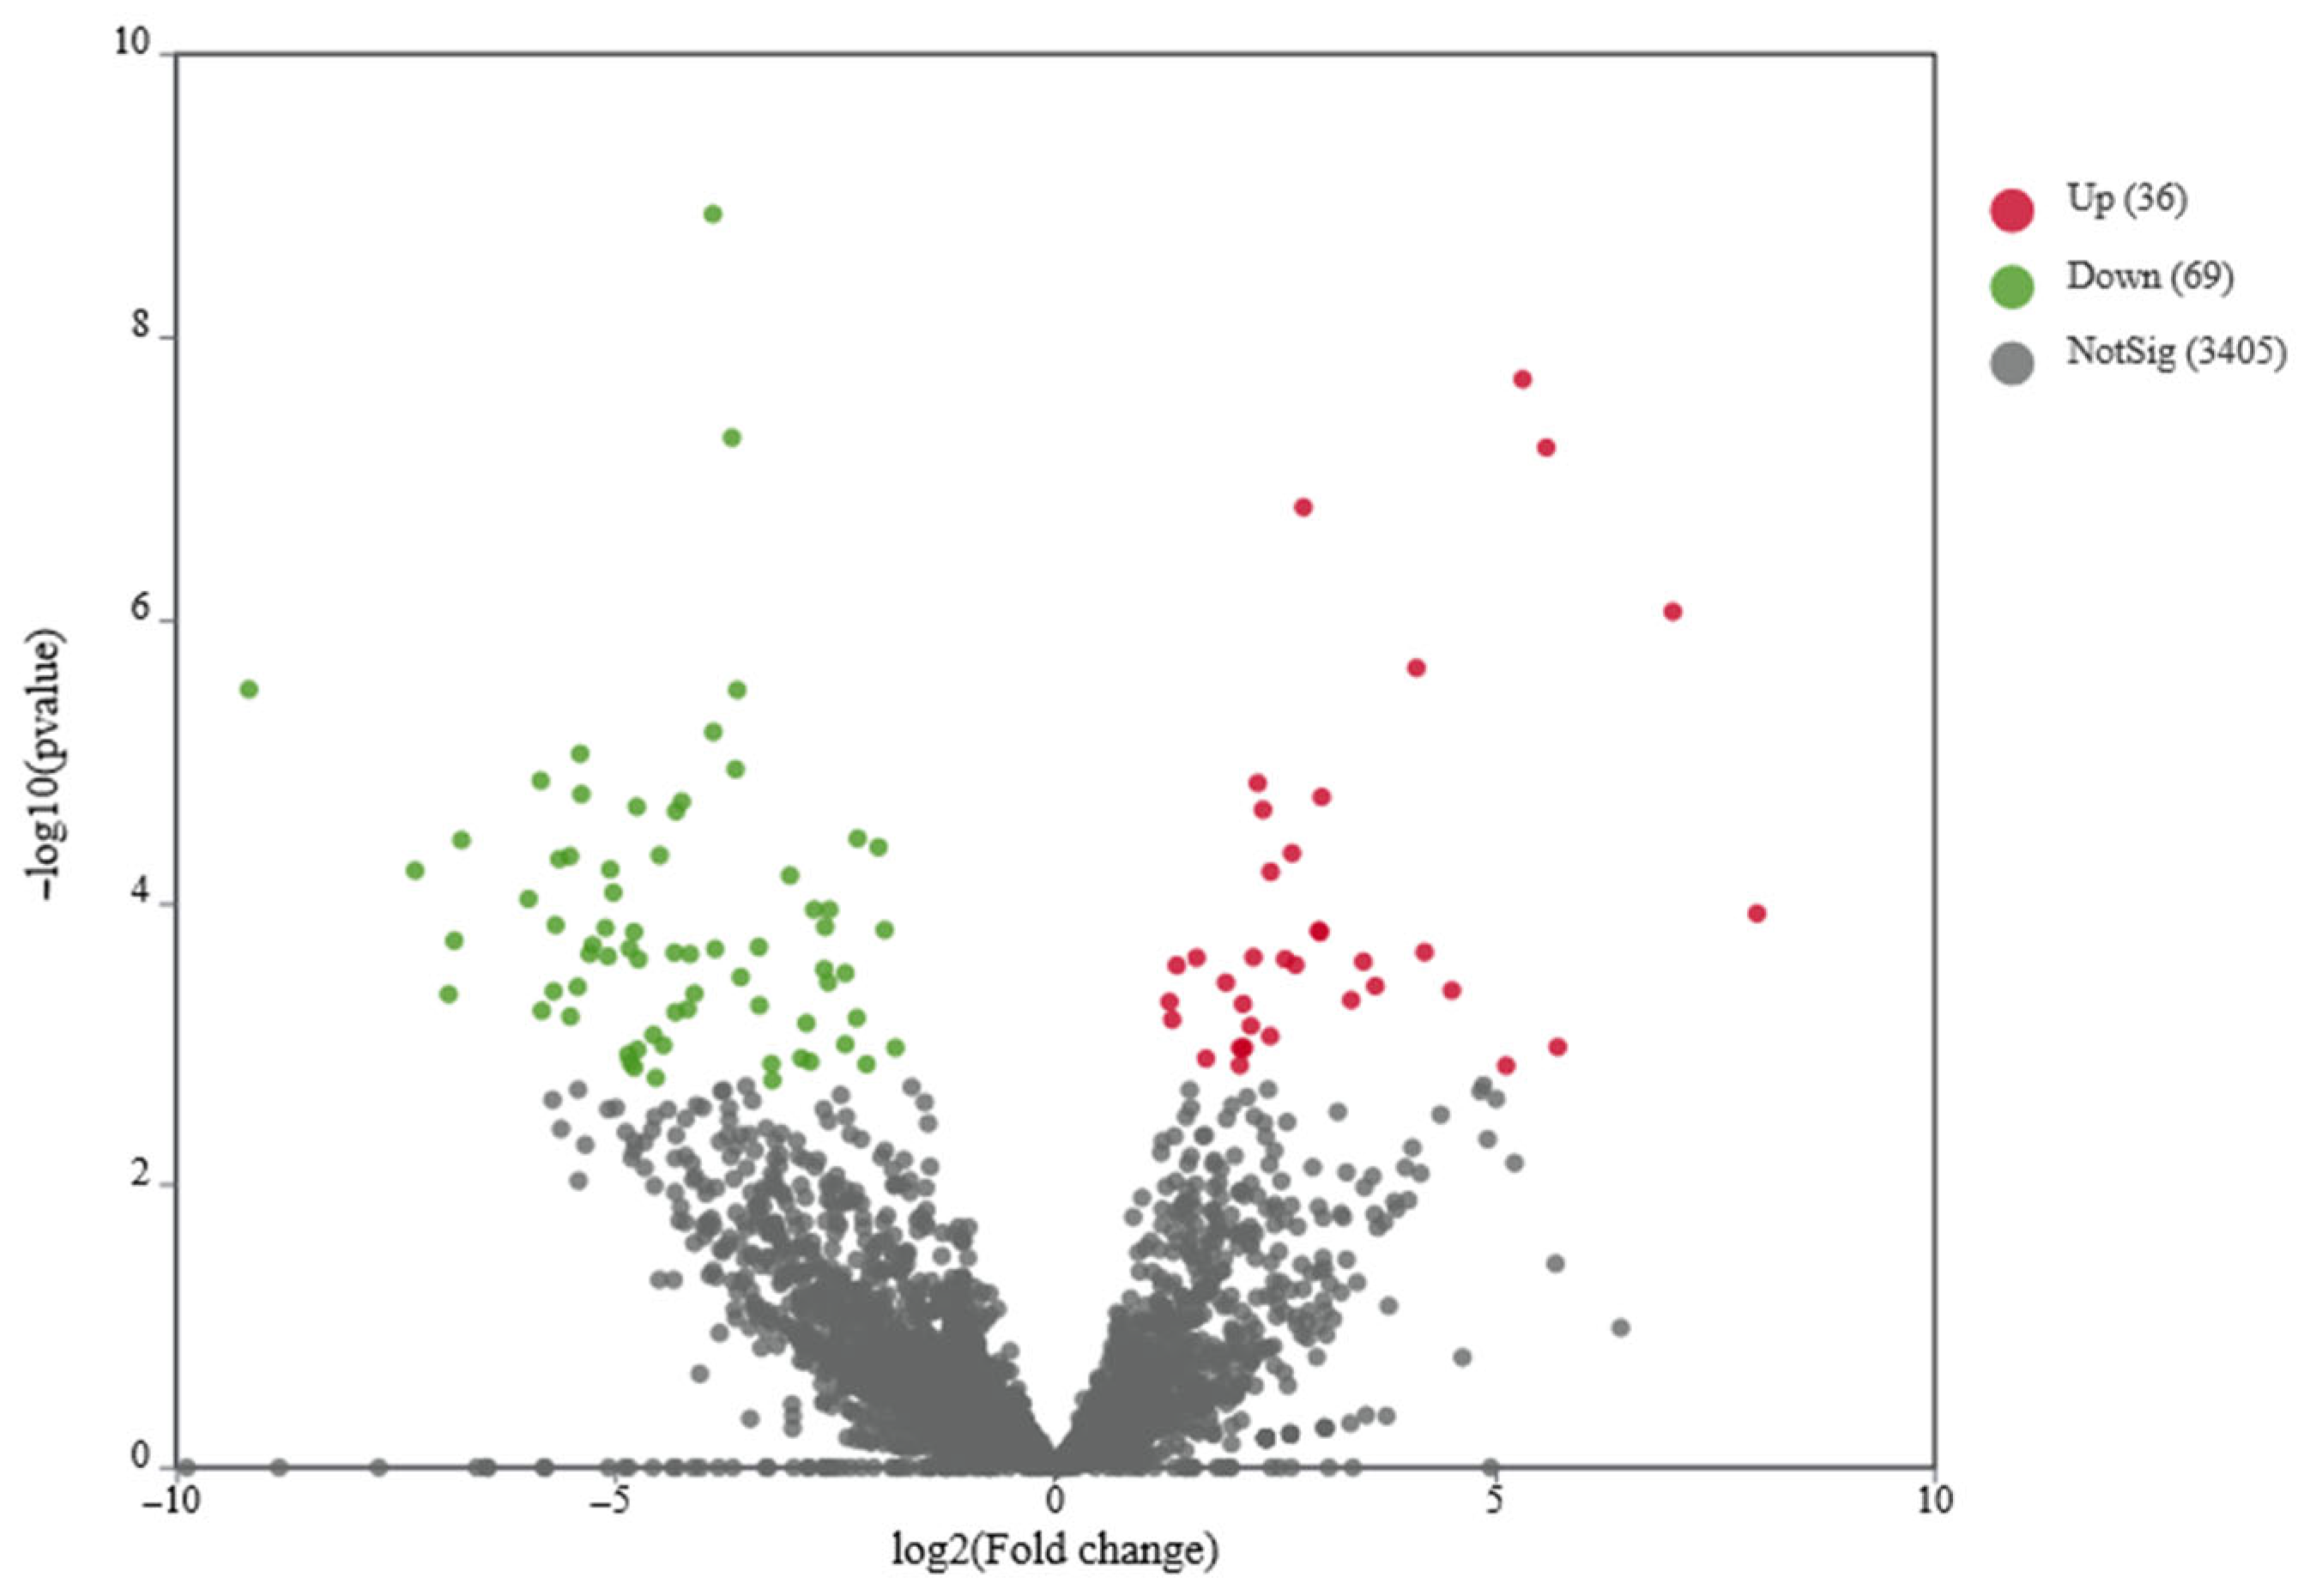
Bacillus subtilis species. Differential gene expression analysis was performed using DESeq2 software. The analysis identified 105 differentially expressed genes (DEGs), comprising 69 downregulated and 36 upregulated genes (
Figure 2,
Table S4). Transcriptome analysis suggested that the identified DEGs may be involved in adenosine biosynthesis or degradation pathways.
3.3. Functional Analysis of Differential Expression Genes
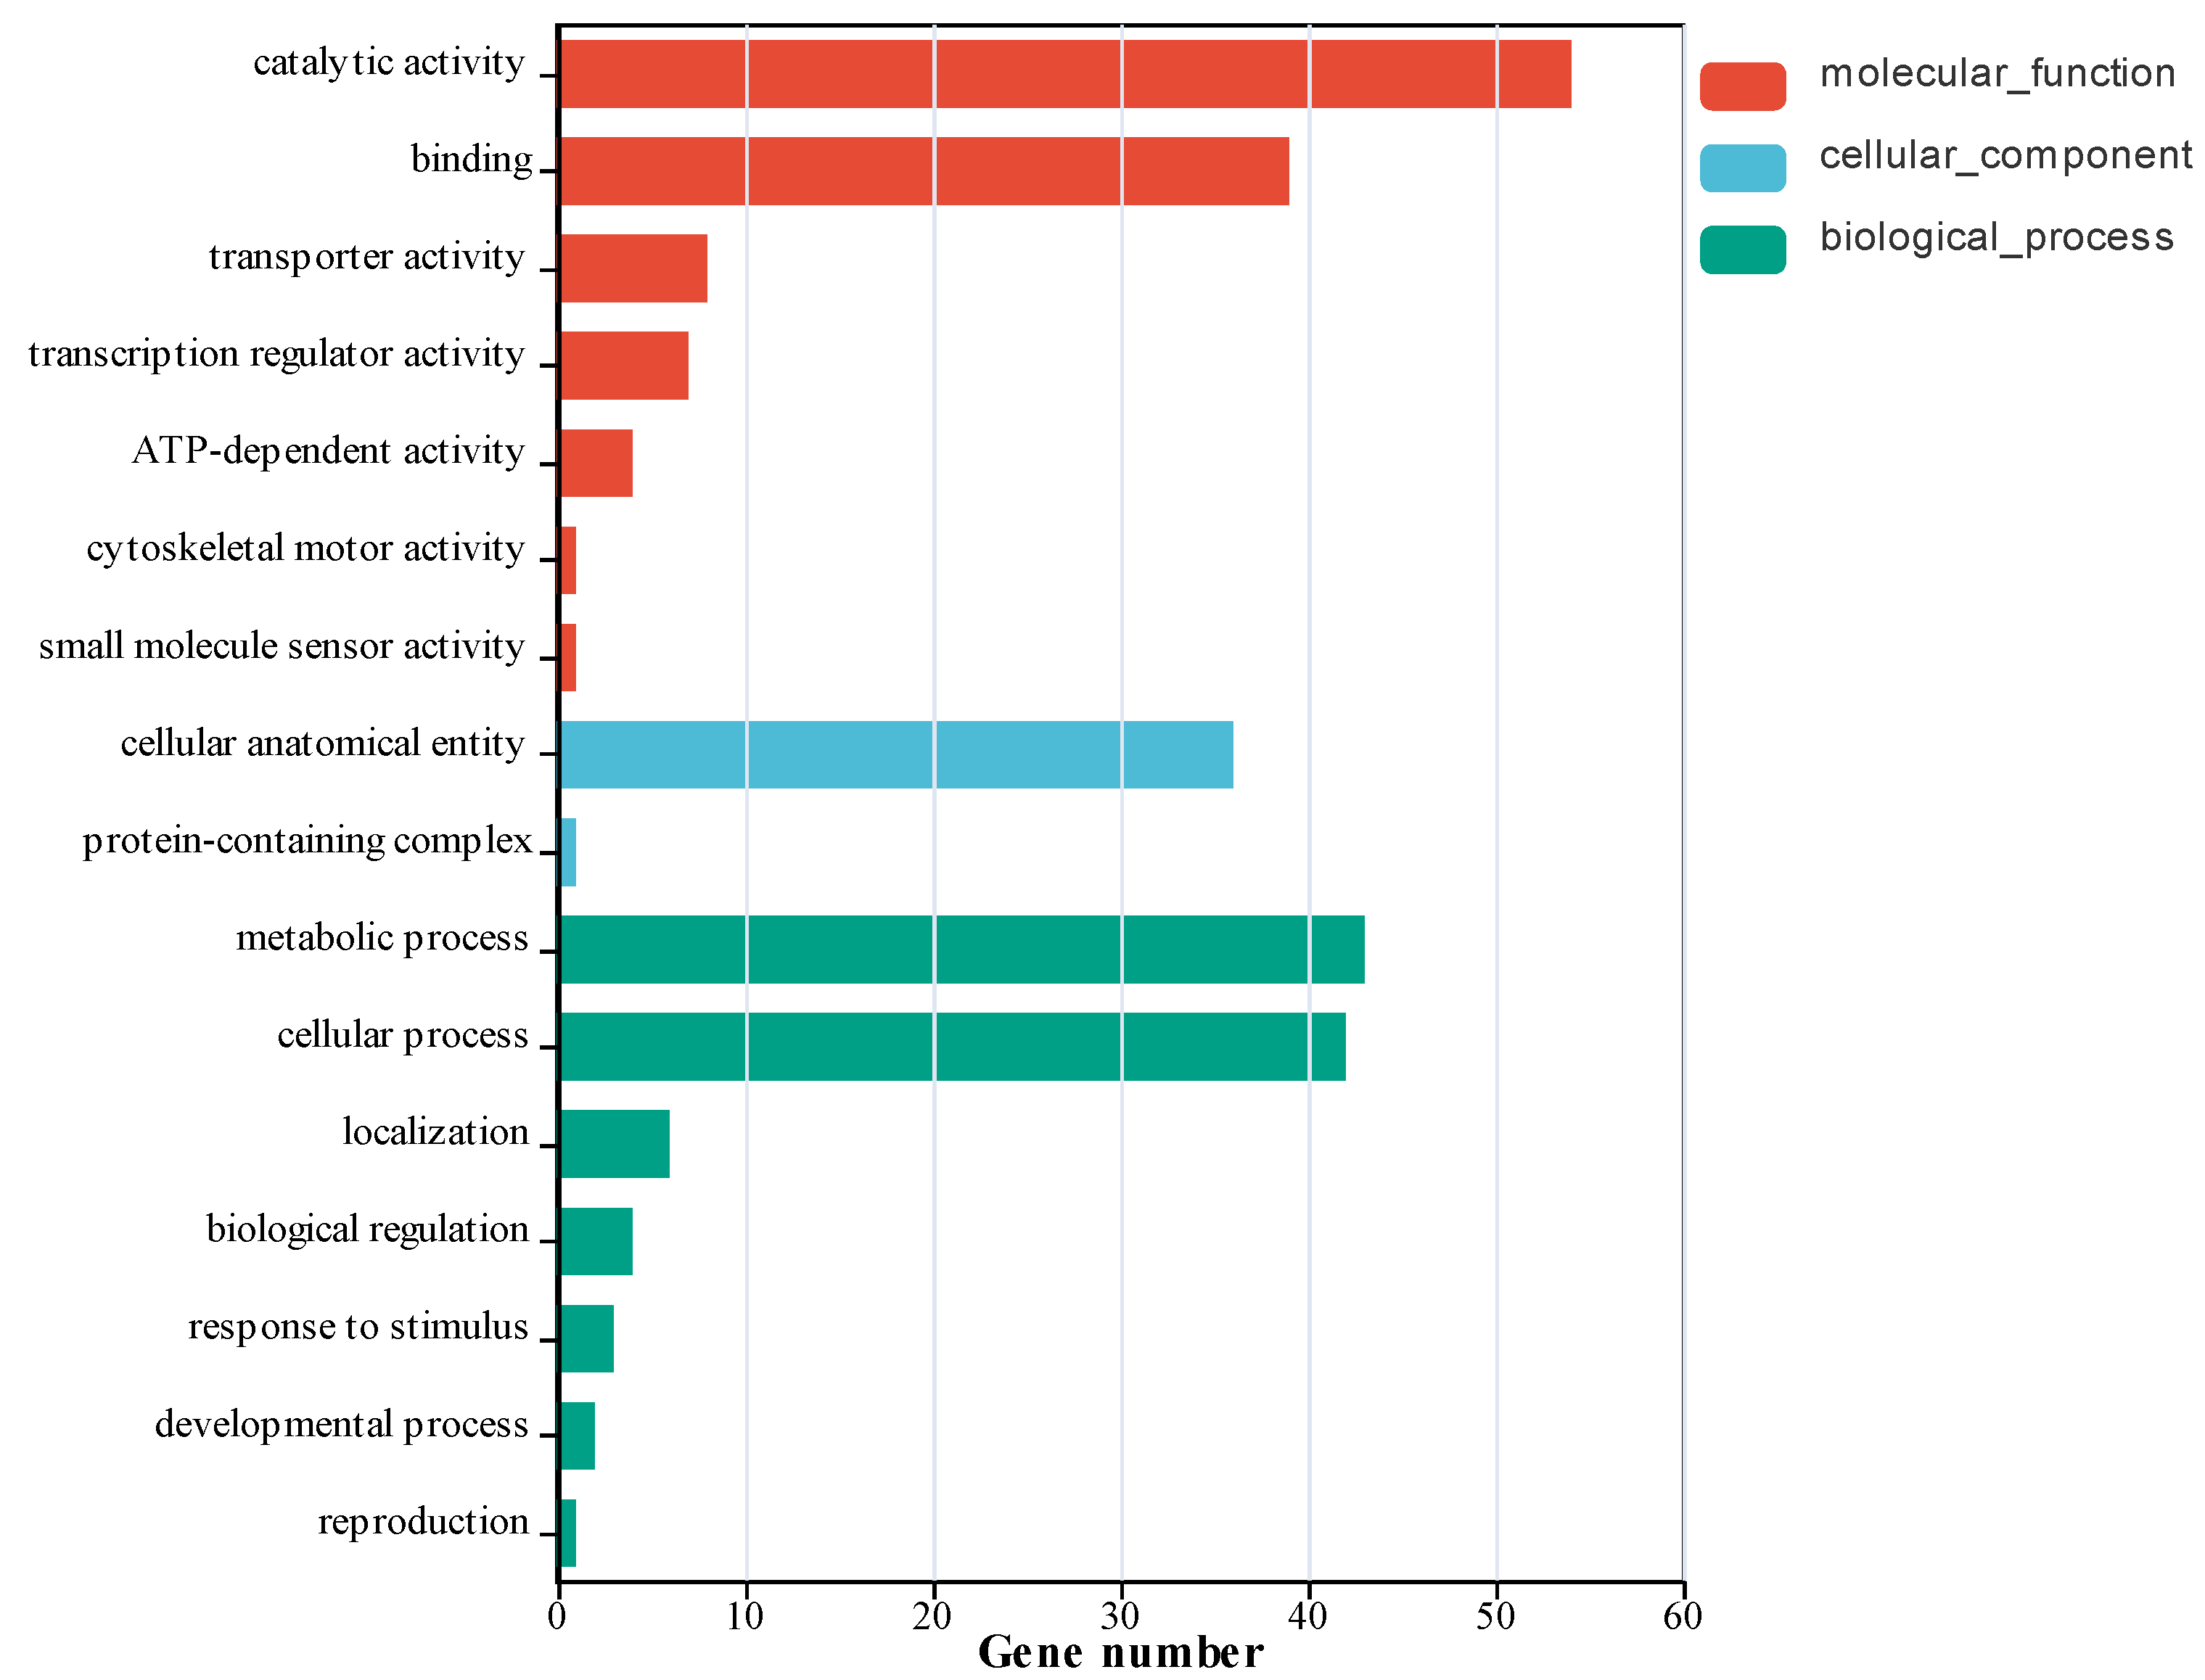
GO annotation analysis of differentially expressed genes revealed that genes with significant expression changes in the treatment group were primarily enriched in metabolic processes, cellular processes, cellular anatomical entities, catalytic activity, and binding compared to the control group (
Figure 3). A smaller subset of genes was associated with transporter activity, transcription regulator activity, biological regulation, and ATP-dependent activity. The GO annotation results demonstrated that the addition of glutamine and hypoxanthine, which increased adenosine production, significantly altered the expression of functional genes in
Bacillus subtilis involved in metabolic synthesis, enzyme expression, and intracellular metabolite transport. These changes may influence the types and levels of secondary metabolites biosynthesized by the bacterium and directly regulate adenosine biosynthesis.
Building upon previous analyses, further GO enrichment analysis revealed that DEGs were predominantly enriched in small-molecule metabolic processes and multiple purine-related pathways, including purine-containing compound metabolic/biosynthetic processes, purine nucleotide metabolic/biosynthetic processes, and eight specific pathways associated with purine nucleoside metabolism (
Figure 4). Additional enriched pathways encompassed inosine monophosphate (IMP) biosynthesis, IMP metabolism, IMP de novo synthesis, nicotinamide adenine dinucleotide (NAD) binding, and glutamate synthesis/metabolism. Notably, the initial carbon metabolic flux from glucose remained largely unaffected by the addition of glutamine and hypoxanthine, indicating that these substrates primarily influenced downstream purine synthesis pathways dependent on 5-phosphoribosyl-1-pyrophosphate (PRPP) rather than altering upstream glucose utilization. This suggests that the enhanced adenosine production induced by glutamine and hypoxanthine supplementation is mechanistically linked to the targeted modulation of PRPP-driven purine biosynthesis.
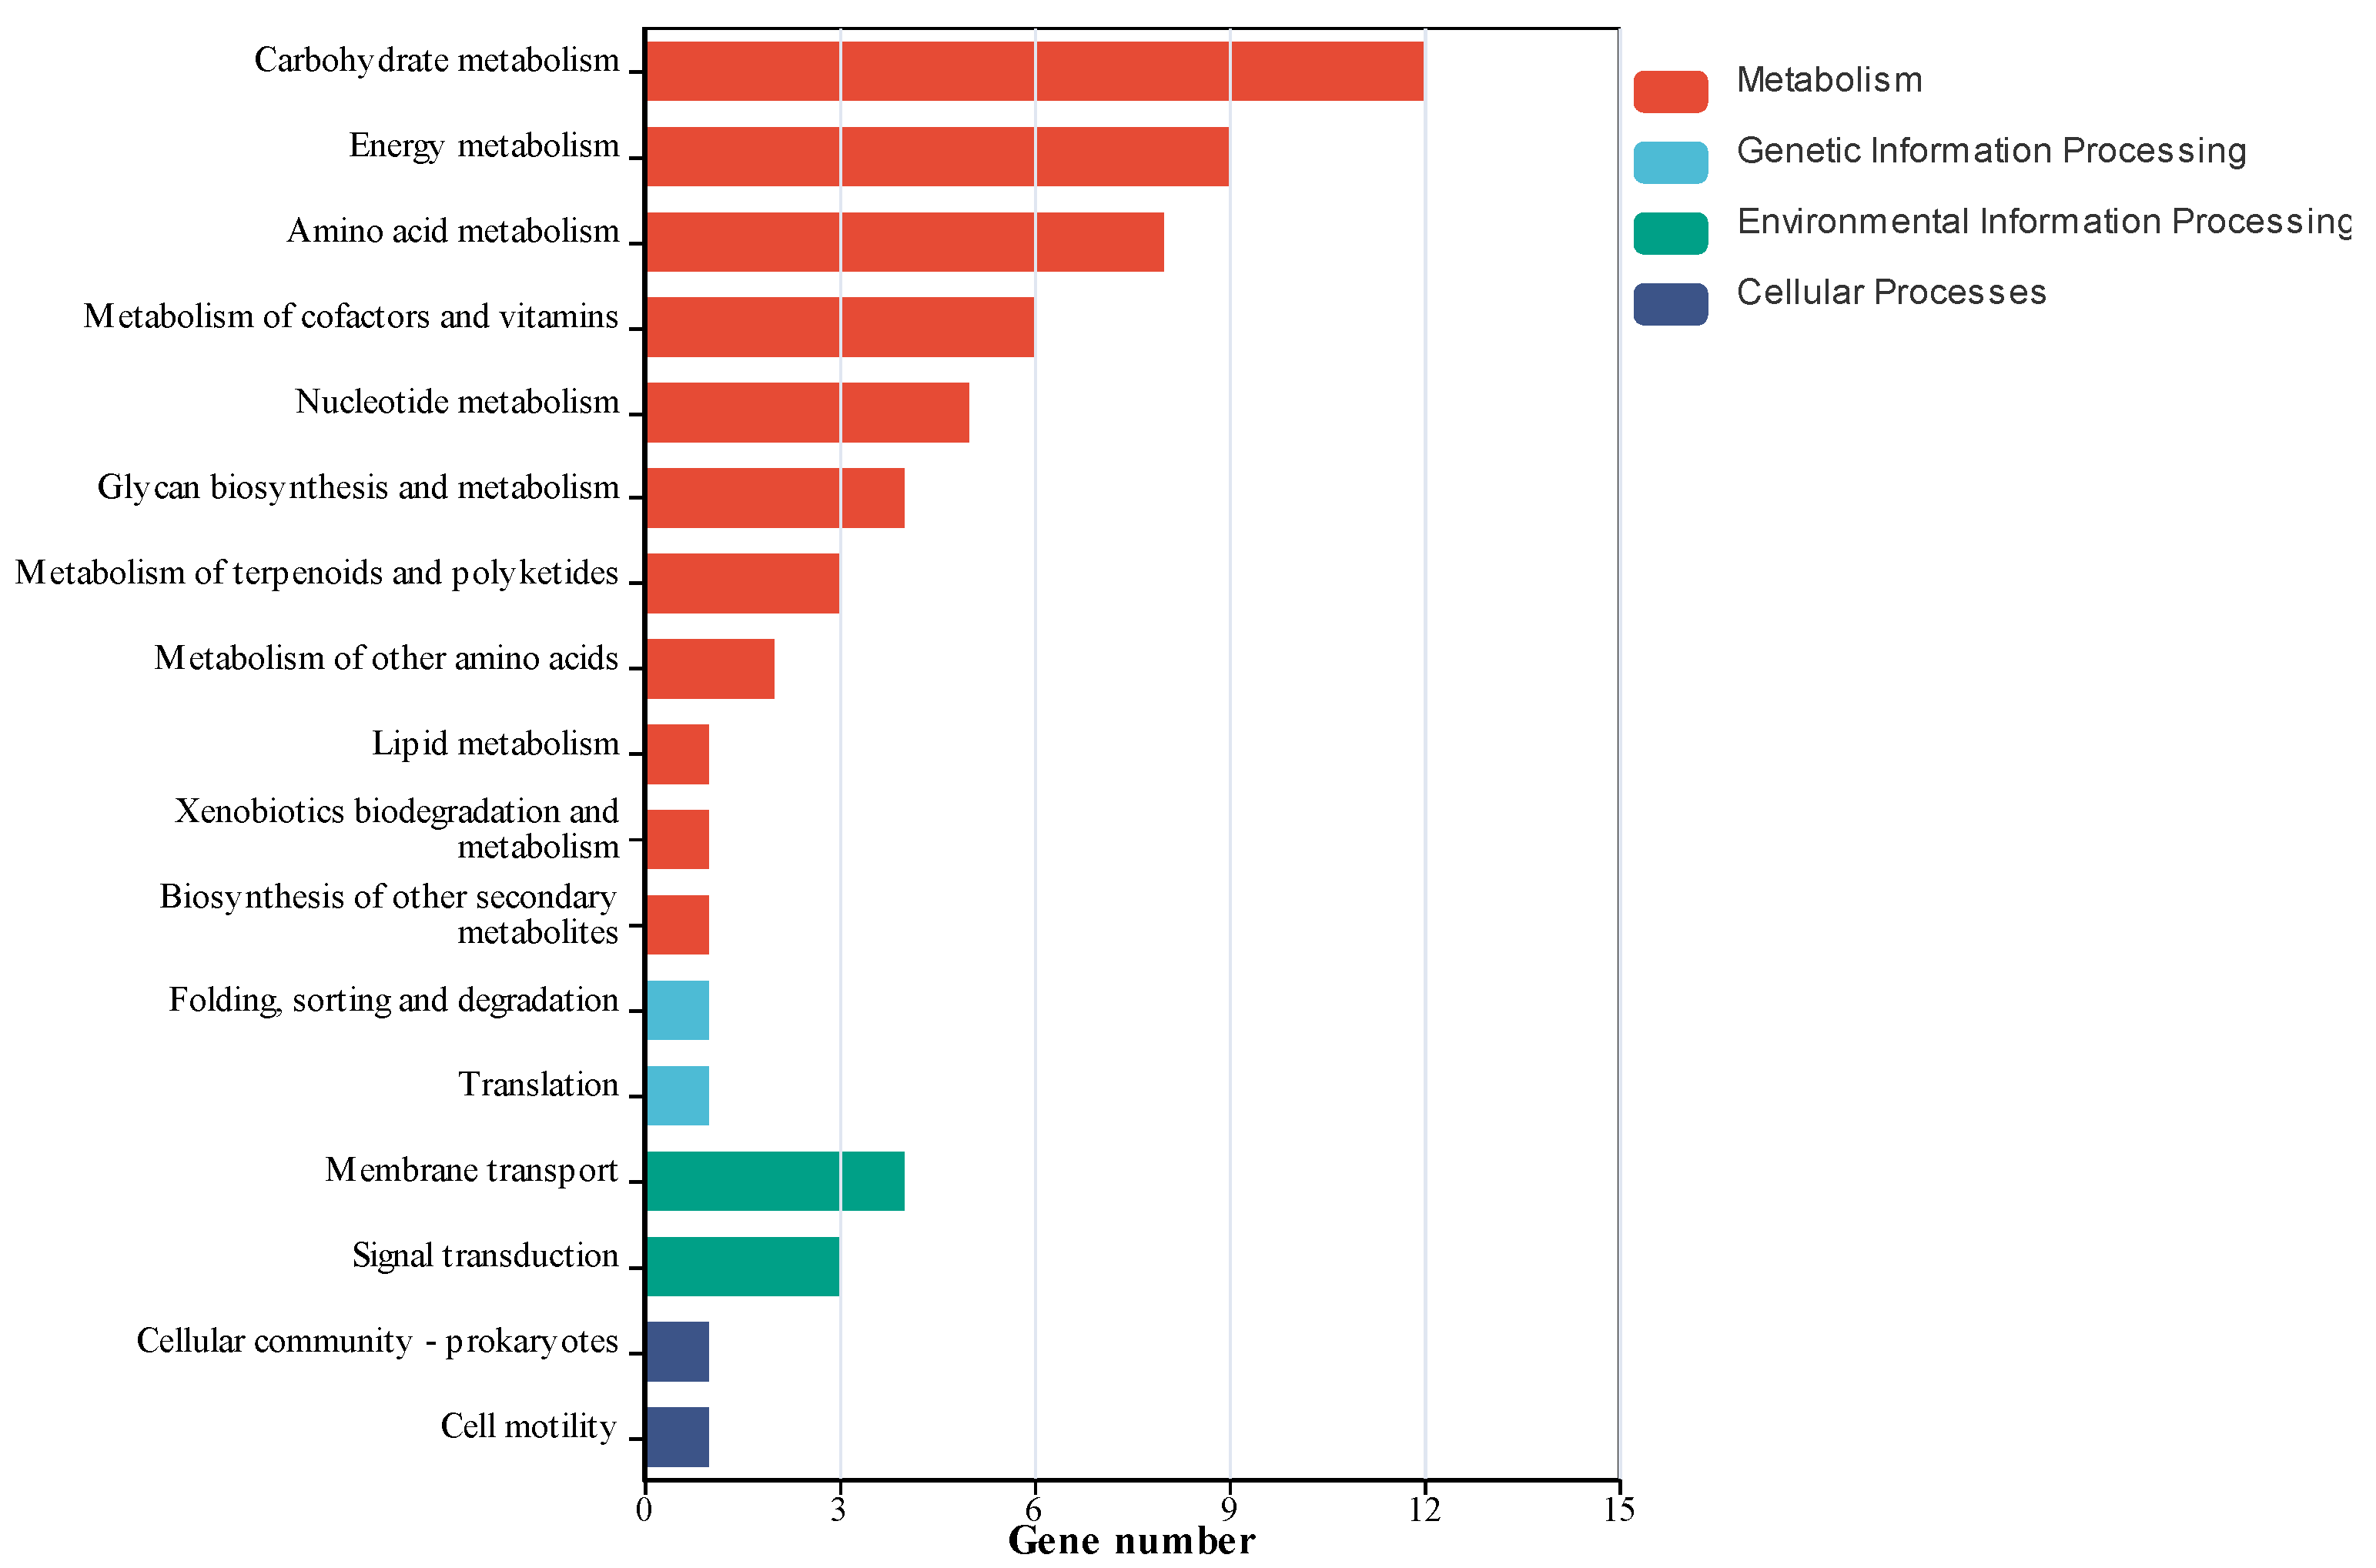
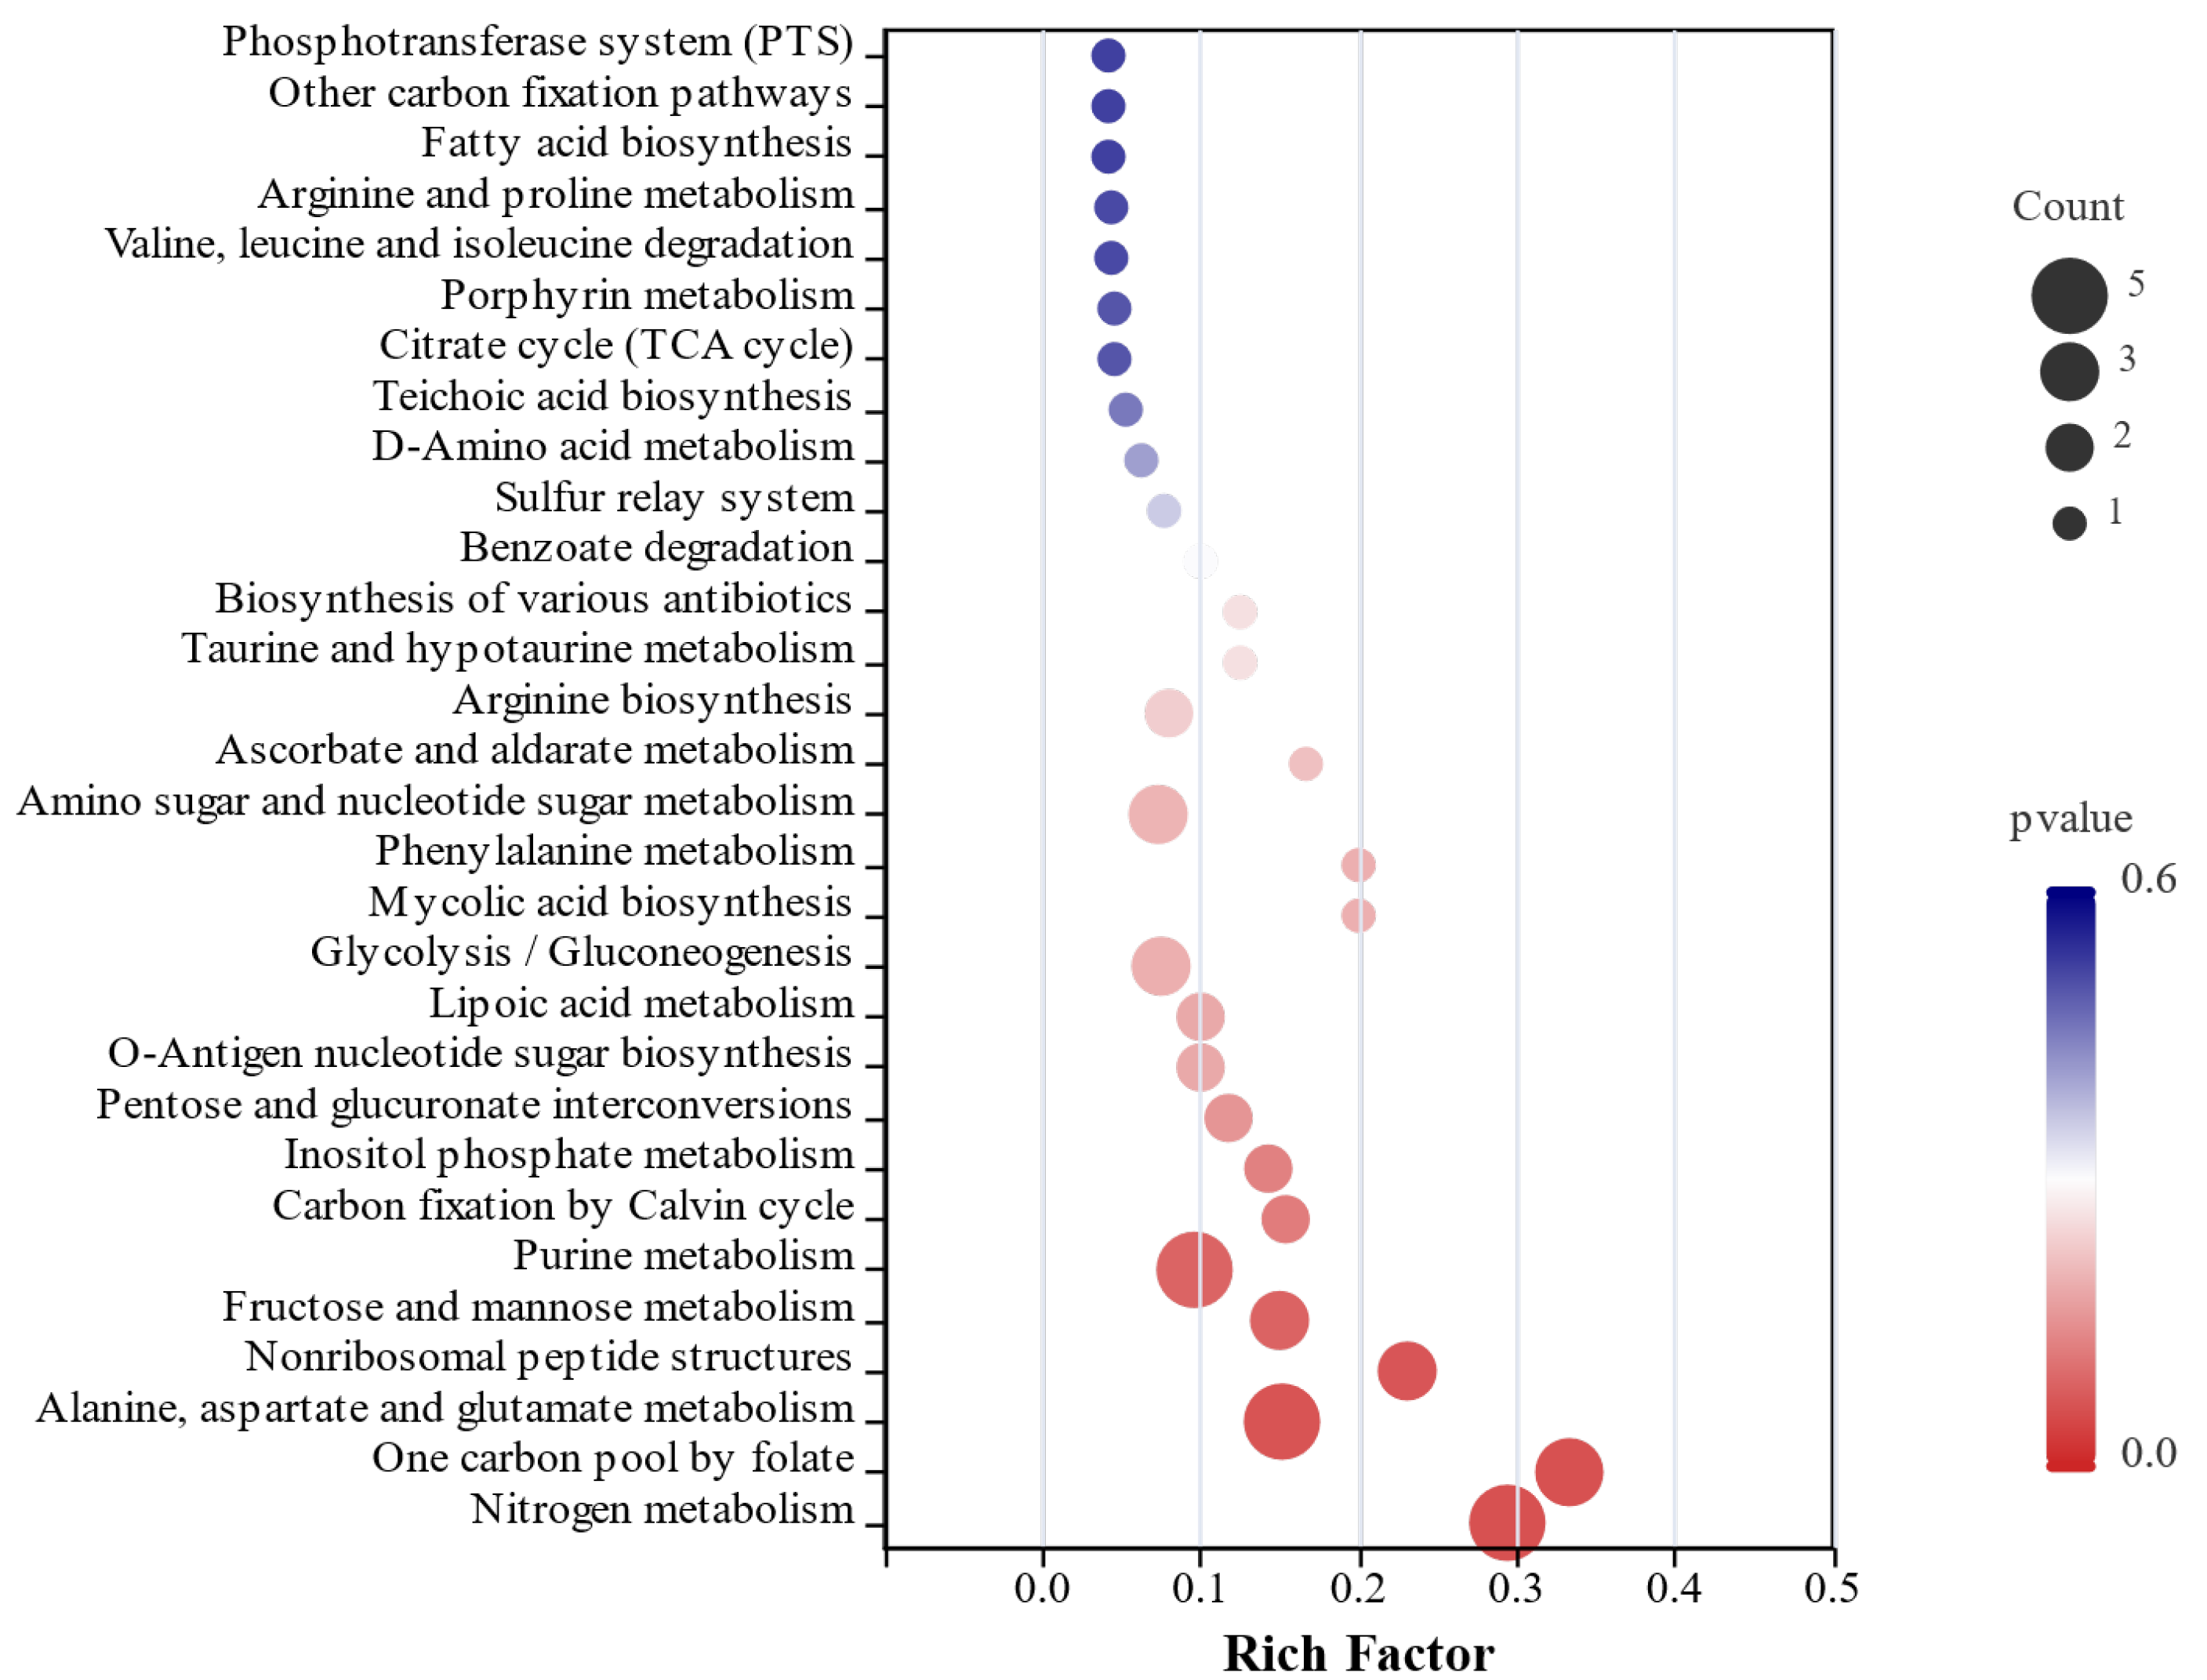
KEGG functional annotation analysis of differentially expressed genes was conducted to identify their involvement in major biochemical, metabolic, and signal transduction pathways. Statistical analysis of gene enrichment across metabolic pathways (
Figure 5) demonstrated that the treatment group utilizing hypoxanthine and glutamine as carbon sources showed significant enrichment of differentially expressed genes in 17 metabolic categories. The most prominently enriched pathways included carbohydrate metabolism, amino acid metabolism, and energy metabolism, with additional enrichment observed in nucleotide metabolism, cofactor and vitamin metabolism, glycan biosynthesis and metabolism, signal transduction, and terpenoid and polyketide metabolism. These results systematically map the regulatory effects of hypoxanthine and glutamine supplementation on adenosine-producing
Bacillus subtilis, highlighting their targeted influence on carbon flux partitioning and nucleotide biosynthesis networks.
The KEGG functional enrichment analysis of differentially expressed genes (
Figure 6) revealed that the treatment group supplemented with hypoxanthine and glutamine as additional carbon sources showed significant enrichment of DEGs in the purine and glutamate metabolism pathways. Notably, the glutamate metabolism pathway serves as a critical carbon metabolic branch that diverts carbon flux away from nucleotide purine metabolism, thereby reducing carbon flow intensity in the latter. Beyond these pathways, differential genes were also enriched in nitrogen metabolism, fructose and mannose metabolism, and tricarboxylic acid cycle (TCA) cycle pathways.
Further screening of key differentially expressed genes linked to adenosine biosynthesis highlighted their predominant localization in the biosynthetic pathway from PRPP to IMP, suggesting an increase in the efficiency of PRPP-to-IMP conversion, a process typically regulated by the pur operon. In this study, downregulated expression of purD and purH genes was observed, indicating potential associations between pur operon-related gene expression and high adenosine yield. Concurrently, the upregulated expression of other relevant genes suggests additional regulatory influences on adenosine biosynthesis efficiency.
3.4. Analysis of the Expression Levels of Key Genes in Bacterial Growth and Adenosine Biosynthesis
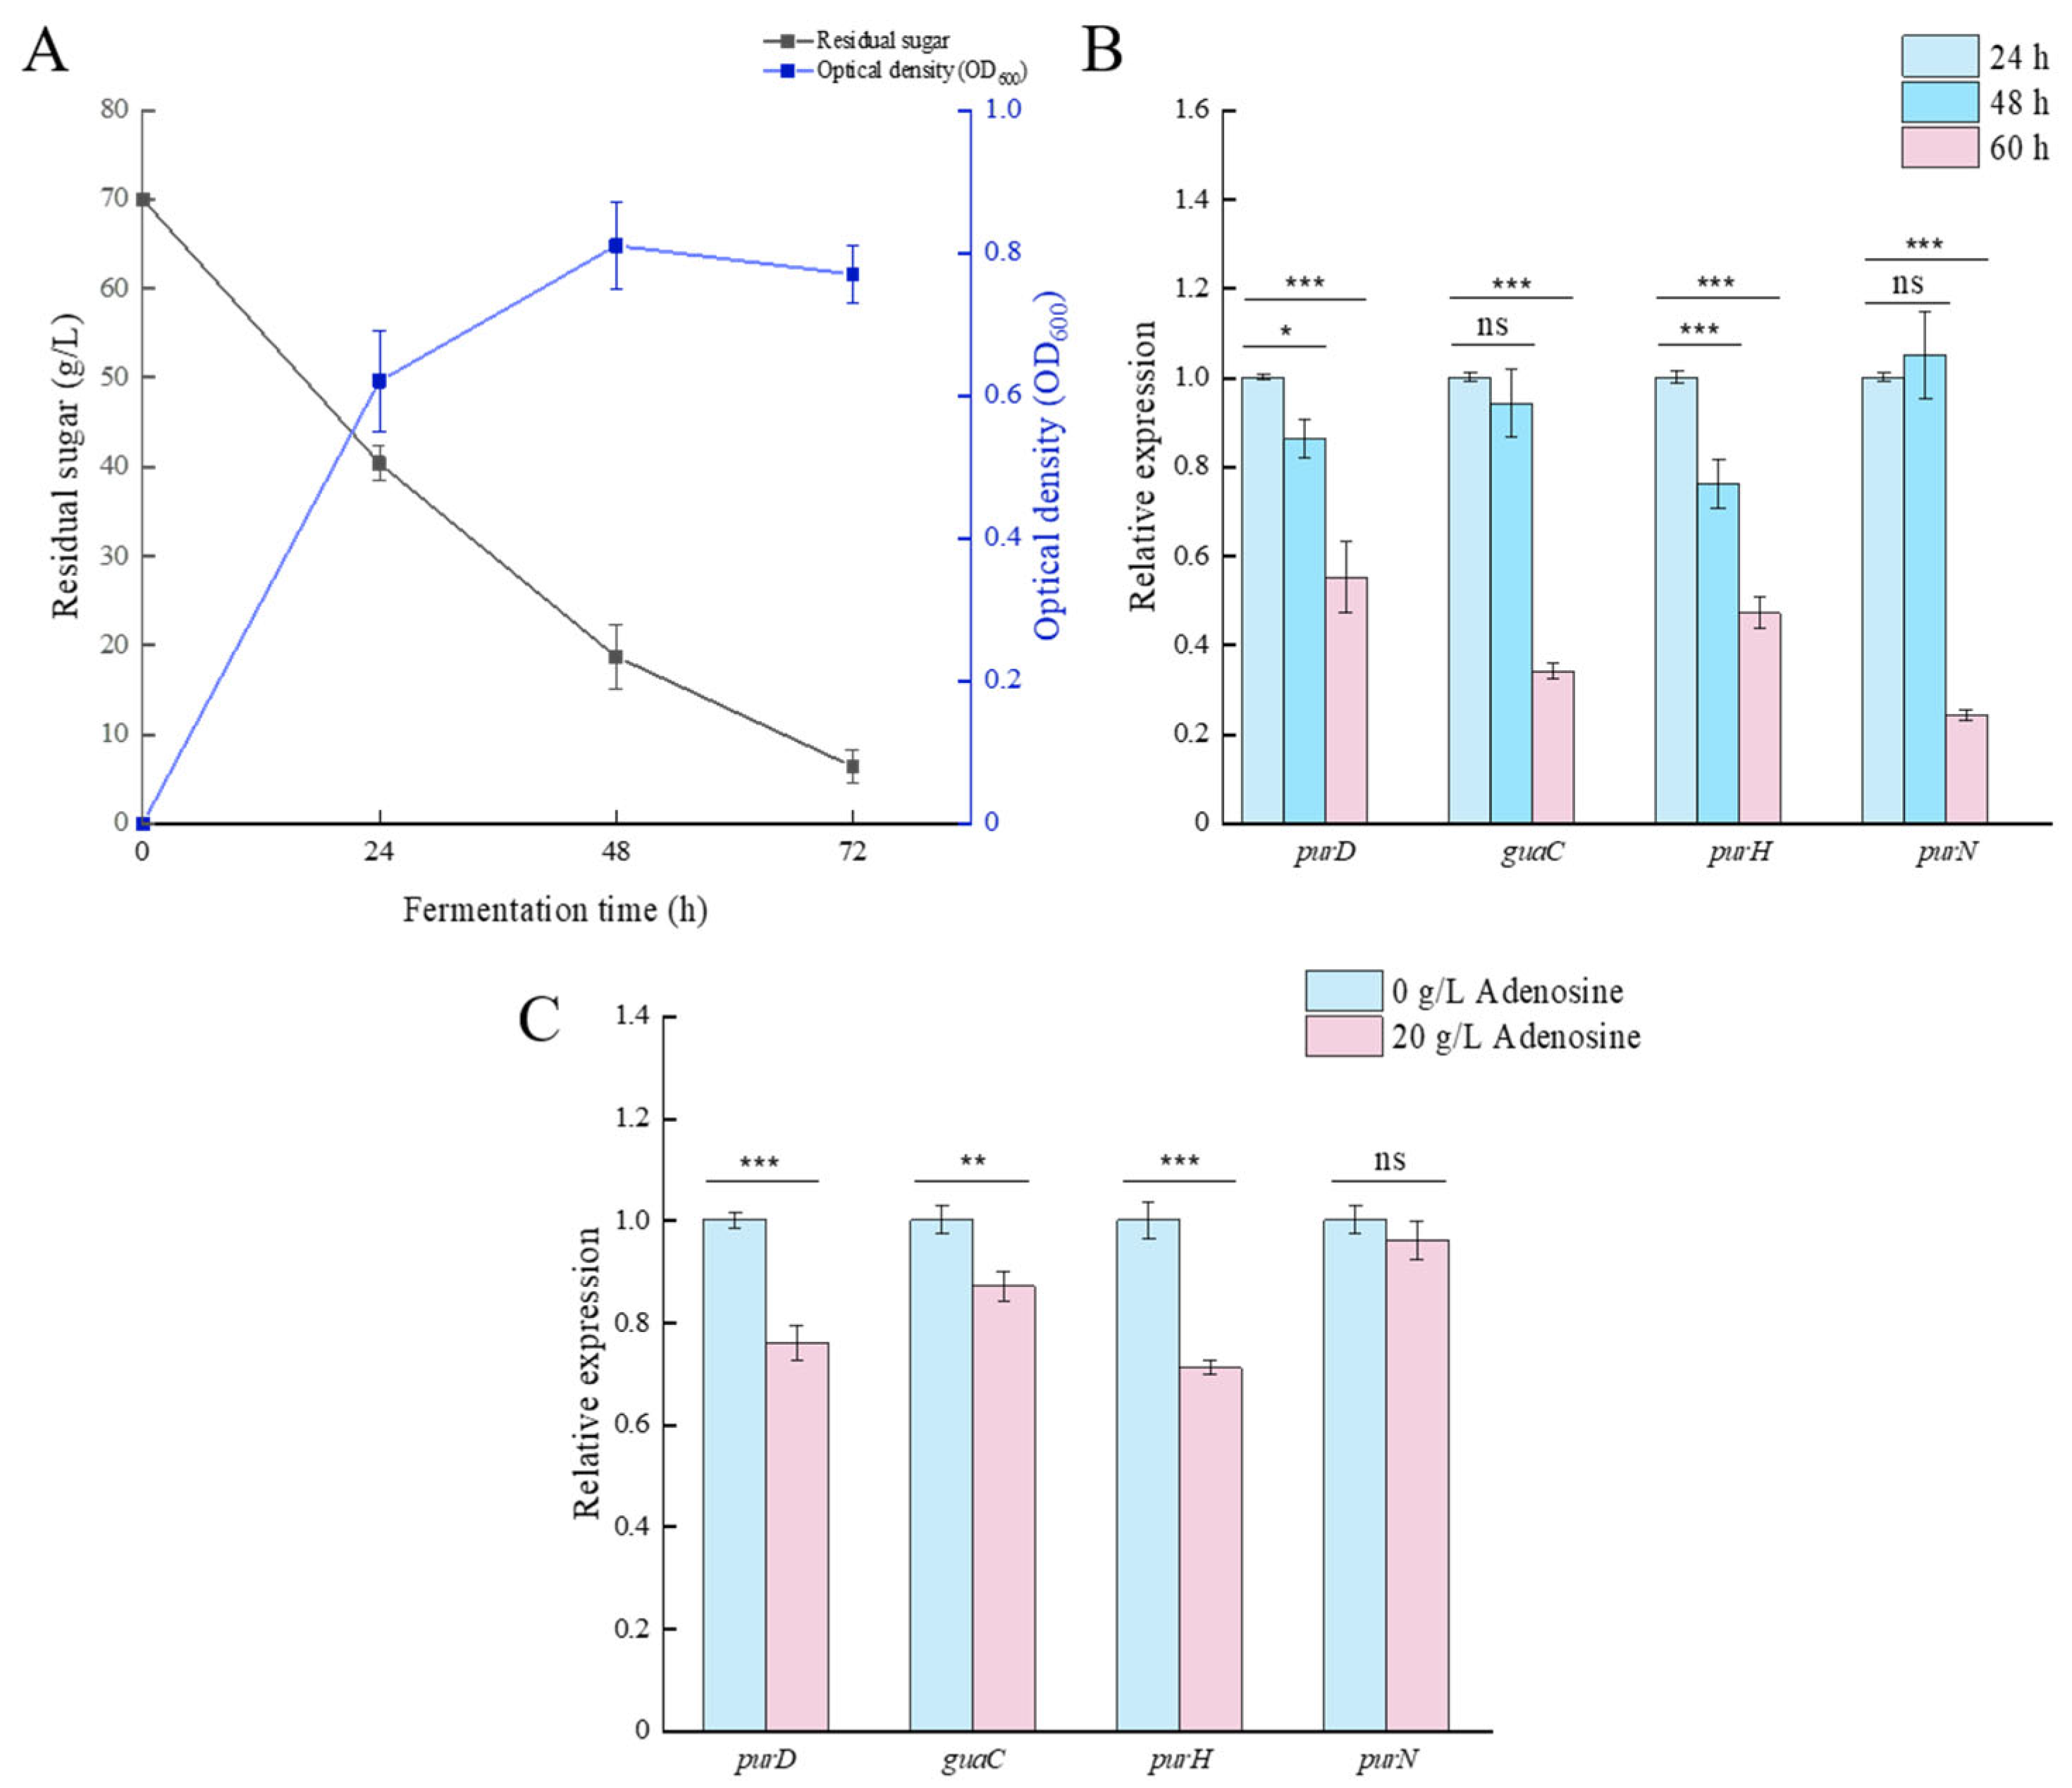
To analyze the expression patterns of key genes involved in adenosine biosynthesis in microbial strains cultured in fermentation media supplemented with glutamine and hypoxanthine, we investigated the residual sugar content and optical density (OD) of treated fermentation broth over time (
Figure 7A). The cell biomass reached its peak at 48 h, after which it continued to decline despite further supplementation of glutamine and hypoxanthine. This decline is attributed to the residual glucose levels (<5 g/L) in the fermentation broth at 48 h, which were insufficient to sustain microbial growth, coupled with high cell density triggering extensive cell lysis. This also explains why the adenosine content in the fermentation broth at 72 h (
Figure 1) continued to increase compared to that at 60 h, as cell lysis releases intracellular contents, allowing adenosine to diffuse into the broth.
Based on the transcriptome sequencing results, several genes with significantly altered transcript abundance in the treatment groups (
purD,
guaC,
purH, and
purN) were screened to analyze their expression differences at various fermentation time points (
Figure 7B). During fermentation, the expression levels of
purD,
guaC, and
purH all decreased significantly, reaching their lowest levels at 60 h of fermentation. While the expression level of
purN remained stable at 48 h of fermentation, it showed a significant reduction at 60 h of fermentation.
To verify whether adenosine accumulation affects the expression of differentially expressed genes, we measured the relative expression levels of these genes under the conditions in which adenosine was supplemented (20 g/L,
Figure 7C). The results revealed that compared to the control group without additional adenosine, the expression of the
purD,
guaC, and
purH genes was significantly downregulated after adenosine supplementation. This trend aligns with the gene expression changes observed during prolonged fermentation-induced adenosine accumulation, demonstrating that the expression of these genes is significantly influenced by adenosine levels. In contrast,
purN gene expression showed no significant change, suggesting that it may be less susceptible to adenosine accumulation.
4. Discussion
Adenosine plays essential roles in physiological processes and is found in most organisms. Adenosine can be used to produce food additives, such as adenosine monophosphate (AMP) and adenosine diphosphate (ADP), demonstrating significant economic potential. Currently, the primary method for adenosine production is microbial fermentation [
24]. However, adenosine biosynthesis involves complex metabolic pathways, and a substantial portion of adenosine is further converted into energy carriers (e.g., ATP) or genetic material during synthesis, making its effective accumulation in fermentation broth challenging [
25]. To address this, genetic engineering strategies are required to optimize microbial strains by reducing growth or metabolic burdens, necessitating the identification of key regulatory genes and their expression patterns in adenosine biosynthesis.
Our findings confirm that supplementing fermentation media with glutamine and hypoxanthine significantly enhances adenosine yield. Hypoxanthine is a hydrolysis product of nucleotides, and glutamine, derived from glucose, can be catabolized into glutamate. Both compounds exhibit relatively straightforward downstream metabolic pathways in bacteria and minimally impact cellular growth yet significantly enhance adenosine synthesis [
26,
27]. Compared to the direct supplementation of carbon or nitrogen sources, hypoxanthine and glutamine enable more precise regulation for conducting transcriptome analysis of adenosine synthesis. However, due to their high production costs, these compounds are generally not recommended for industrial-scale adenosine production. Instead, selecting low-cost raw materials (for example, using ammonium sulfate as a substitute for glutamine) and engineering bacterial strains to utilize these substrates more efficiently represents a more viable approach. Building on transcriptome analysis, this study identified and screened differentially expressed genes, providing robust reference data for developing metabolically engineered strains optimized for adenosine biosynthesis.
We identified 105 DEGs potentially associated with adenosine biosynthesis, including 69 downregulated and 36 upregulated genes. These DEGs were predominantly enriched in pathways, such as purine metabolism and glutamate metabolism, with key adenosine-related genes clustered in the purine metabolic pathway downstream of 5-phosphoribosyl-1-pyrophosphate (PRPP). The pur operon plays a critical regulatory role in nucleotide synthesis; transcriptomic analysis revealed a significant downregulation of the core biosynthetic genes (purD, guaC, purH, and purN) of the pur operon in high-yield strains, suggesting that adenosine accumulation may suppress their expression via negative feedback regulation. However, we observed no significant differential expression in purR (the repressor gene of the pur operon). This indicates that the expression of purD, purH, and purN is independently regulated rather than co-expressed as part of the operon. The guaC gene encodes guanosine monophosphate (GMP) reductase, which catalyzes the reduction of IMP to GMP. Intriguingly, under conditions of adenosine overproduction, guaC expression was significantly suppressed. This repression redirects carbon flux toward adenosine synthesis, providing a novel strategy for industrial strain engineering.
Cell biomass and residual glucose were monitored during fermentation, showing that biomass peaked at 48 h (OD600 = 0.82), with residual glucose at 18.7 g/L (consumption rate: 73.28%). Continued fermentation further depleted glucose but reduced biomass, indicating that glucose levels were insufficient to sustain continued microbial growth, in turn suggesting that carbon source supplementation requires attention in industrial-scale operations. Gene expression analysis demonstrated that exogenous supplementation of hypoxanthine (6 g/L) and glutamine (10 g/L) markedly inhibited purD, guaC, purH, and purN expression. We hypothesize that although hypoxanthine and glutamine enhance adenosine accumulation, hypoxanthine may bypass the early steps of the de novo adenosine biosynthesis pathway. Excessive adenosine levels likely trigger feedback inhibition, repressing genes in the de novo synthesis pathway and ultimately downregulating adenosine-related gene expression.
5. Conclusions
In summary, purD, guaC, purH, and purN were identified as core regulatory genes for adenosine synthesis, though other differentially expressed genes may also contribute to this process. From a strain engineering perspective, we propose enhancing metabolic flux through the pur operon synthesis genes while suppressing guaC expression in order to enhance carbon flux toward adenosine production. We anticipate that the aforementioned research findings will provide clearer strategic guidance for the genetic modification of adenosine-producing strains.
Supplementary Materials
The following supporting information can be downloaded at
https://www.mdpi.com/article/10.3390/app15137592/s1, Figure S1: Impact of varying concentrations of glutamine and inosine on adenosine synthesis. Based on the slope of adenosine accumulation, 10 g/L glutamine and 6 g/L inosine were selected as the induction conditions for subsequent studies. Letter labeling is used to indicate the statistical significance of differences between groups. (A) Glutamine; (B) inosine. Table S1: Mutation profile of ARTP-mutagenized strains. Table S2: QPCR primers used in this experiment. Table S3: Reads mapped to the reference genome. Table S4: Differentially expressed genes and their annotations.
Author Contributions
Conceptualization, Y.T. and C.Y.; methodology, G.Y.; validation, S.Z.; resources, C.L.; data curation, H.W.; writing—original draft preparation, G.Y.; writing—review and editing, Y.T. and C.Y.; All authors have read and agreed to the published version of the manuscript.
Funding
This research was funded by Key R&D Projects in Heilongjiang Province, grant number 2022ZX02C10.
Institutional Review Board Statement
Not applicable.
Informed Consent Statement
Not applicable.
Data Availability Statement
The sequencing data have been deposited in the NCBI Sequence Read Archive and are accessible through NCBI BioProject Acc. No. PRJNA1261693.
Acknowledgments
The publication fee for this manuscript was supported by the Institute of Microbiology, Heilongjiang Academy of Sciences, China.
Conflicts of Interest
The authors declare no conflicts of interest.
References
- Layland, J.; Carrick, D.; Lee, M.; Oldroyd, K.; Berry, C. Adenosine: Physiology, pharmacology, and clinical applications. JACC Cardiovasc. Interv. 2014, 7, 581–591. [Google Scholar] [CrossRef]
- Reiss, A.B.; Grossfeld, D.; Kasselman, L.J.; Renna, H.A.; Vernice, N.A.; Drewes, W.; Konig, J.; Carsons, S.E.; DeLeon, J. Adenosine and the cardiovascular system. Am. J. Cardiovasc. Drugs 2019, 19, 449–464. [Google Scholar] [CrossRef]
- Riksen, N.P.; Rongen, G.A.; Yellon, D.; Smits, P. Human in vivo research on the vascular effects of adenosine. Eur. J. Pharmacol. 2008, 585, 220–227. [Google Scholar] [CrossRef]
- Camici, M.; Garcia-Gil, M.; Tozzi, M.G. The inside story of adenosine. Int. J. Mol. Sci. 2018, 19, 784. [Google Scholar] [CrossRef]
- Zhang, C.; Du, S.; Liu, Y.; Xie, X.; Xu, Q.; Chen, N. Strategy for enhancing adenosine production under the guidance of transcriptional and metabolite pool analysis. Biotechnol. Lett. 2015, 37, 1361–1369. [Google Scholar] [CrossRef]
- Meyer, S.; Noisommit-Rizzi, N.; Reuss, M.; Neubauer, P. Optimized analysis of intracellular adenosine and guanosine phosphates in Escherichia coli. Anal. Biochem. 1999, 271, 43–52. [Google Scholar] [CrossRef]
- Ke, B.-J.; Lee, C.-L. Using submerged fermentation to fast increase N6-(2-hydroxyethyl)-adenosine, adenosine and polysaccharide productions of Cordyceps cicadae NTTU 868. Amb. Express 2019, 9, 198. [Google Scholar] [CrossRef]
- Li, B.; Yan, Z.-Y.; Liu, X.-N.; Zhou, J.; Wu, X.-Y.; Wei, P.; Jia, H.-H.; Yong, X.-Y. Increased fermentative adenosine production by gene-targeted Bacillus subtilis mutation. J. Biotechnol. 2019, 298, 1–4. [Google Scholar] [CrossRef]
- Put, H.; Gerstmans, H.; Vande Capelle, H.; Fauvart, M.; Michiels, J.; Masschelein, J. Bacillus subtilis as a host for natural product discovery and engineering of biosynthetic gene clusters. Nat. Prod. Rep. 2024, 41, 1113–1151. [Google Scholar] [CrossRef]
- Zhao, S.; Shi, T.; Li, L.; Chen, Z.; Li, C.; Yu, Z.; Sun, P.; Xu, Q. The metabolic engineering of Escherichia coli for the high-yield production of hypoxanthine. Microb. Cell Fact. 2024, 23, 309. [Google Scholar] [CrossRef]
- Cao, R.; Hu, S.; Lu, Y.; Wang, W.; Fu, Z.; Cheng, J. Fermentative Production of L-Theanine in Escherichia coli via the Construction of an Adenosine Triphosphate Regeneration System. Fermentation 2023, 9, 875. [Google Scholar] [CrossRef]
- De Carvalho, L.; Borelli, G.; Camargo, A.; De Assis, M.; De Ferraz, S.; Fiamenghi, M.; José, J.; Mofatto, L.; Nagamatsu, S.; Persinoti, G. Bioinformatics applied to biotechnology: A review towards bioenergy research. Biomass Bioenergy 2019, 123, 195–224. [Google Scholar] [CrossRef]
- Liu, Y.; He, J.; Xu, Q.; Zhang, C.; Chen, N.; Xie, X. Enhanced Adenosine Production by Bacillus subtilis at Condition with Comprehensively Controlled Dissolved Oxygen and pH During Fermentation. In Proceedings of the Advances in Applied Biotechnology: Proceedings of the 2nd International Conference on Applied Biotechnology (ICAB 2014), Tianjin, China, 28–30 November 2014; Volume I, pp. 439–452. [Google Scholar]
- Xue, X.F.; Zhou, J.H.; Wu, L.M.; Fu, L.H.; Zhao, J. HPLC determination of adenosine in royal jelly. Food Chem. 2009, 115, 715–719. [Google Scholar] [CrossRef]
- Bolger, A.M.; Lohse, M.; Usadel, B. Trimmomatic: A flexible trimmer for Illumina sequence data. Bioinformatics 2014, 30, 2114–2120. [Google Scholar] [CrossRef]
- Langmead, B.; Salzberg, S.L. Fast gapped-read alignment with Bowtie 2. Nat. Methods 2012, 9, 357–359. [Google Scholar] [CrossRef]
- Li, B.; Dewey, C.N. RSEM: Accurate transcript quantification from RNA-Seq data with or without a reference genome. BMC Bioinf. 2011, 12, 323. [Google Scholar] [CrossRef]
- Maza, E.; Frasse, P.; Senin, P.; Bouzayen, M.; Zouine, M. Comparison of normalization methods for differential gene expression analysis in RNA-Seq experiments: A matter of relative size of studied transcriptomes. Commun. Integr. Biol. 2013, 6, e25849. [Google Scholar] [CrossRef]
- Love, M.I.; Huber, W.; Anders, S. Moderated estimation of fold change and dispersion for RNA-seq data with DESeq2. Genome Biol. 2014, 15, 550. [Google Scholar] [CrossRef]
- Ye, J.; Zhang, Y.; Cui, H.; Liu, J.; Wu, Y.; Cheng, Y.; Xu, H.; Huang, X.; Li, S.; Zhou, A. WEGO 2.0: A web tool for analyzing and plotting GO annotations, 2018 update. Nucleic Acids Res. 2018, 46, W71–W75. [Google Scholar] [CrossRef]
- Yon Rhee, S.; Wood, V.; Dolinski, K.; Draghici, S. Use and misuse of the gene ontology annotations. Nat. Rev. Genet. 2008, 9, 509–515. [Google Scholar] [CrossRef]
- Yu, G.; Wang, L.-G.; Han, Y.; He, Q.-Y. clusterProfiler: An R package for comparing biological themes among gene clusters. OMICS J. Integr. Biol. 2012, 16, 284–287. [Google Scholar] [CrossRef] [PubMed]
- Kanehisa, M.; Araki, M.; Goto, S.; Hattori, M.; Hirakawa, M.; Itoh, M.; Katayama, T.; Kawashima, S.; Okuda, S.; Tokimatsu, T. KEGG for linking genomes to life and the environment. Nucleic Acids Res. 2007, 36, D480–D484. [Google Scholar] [CrossRef] [PubMed]
- Solakov, N.; Kostova, M.; Loginovska, K.; Markov, Z.; de Oliveira, A.C.; Muhovski, Y. Investigation of Adenosine Precursors and Biologically Active Peptides in Cultured Fresh Mycelium of Wild Medicinal Mushrooms. Appl. Sci. 2022, 12, 10618. [Google Scholar] [CrossRef]
- Ha, S.Y.; Kim, H.C.; Lim, W.S.; Yang, J.-K. Effects of culture conditions on the adenosine production in submerged culture of Paecilomyces tenuipes. J. Mushroom 2024, 22, 73–80. [Google Scholar]
- Liu, M.; Fu, Y.; Gao, W.; Xian, M.; Zhao, G. Highly efficient biosynthesis of hypoxanthine in Escherichia coli and transcriptome-based analysis of the purine metabolism. ACS Synth. Biol. 2020, 9, 525–535. [Google Scholar] [CrossRef]
- Lv, Q.; Hu, M.; Tian, L.; Liu, F.; Wang, Q.; Xu, M.; Rao, Z. Enhancing l-glutamine production in Corynebacterium glutamicum by rational metabolic engineering combined with a two-stage pH control strategy. Bioresour. Technol. 2021, 341, 125799. [Google Scholar] [CrossRef]
| Disclaimer/Publisher’s Note: The statements, opinions and data contained in all publications are solely those of the individual author(s) and contributor(s) and not of MDPI and/or the editor(s). MDPI and/or the editor(s) disclaim responsibility for any injury to people or property resulting from any ideas, methods, instructions or products referred to in the content. |
© 2025 by the authors. Licensee MDPI, Basel, Switzerland. This article is an open access article distributed under the terms and conditions of the Creative Commons Attribution (CC BY) license (https://creativecommons.org/licenses/by/4.0/).

