
Pit Collapse Risk Fusion Early-Warning Method Based on Machine Learning and Improved Cloud Dempster–Shafer

Abstract
1. Introduction
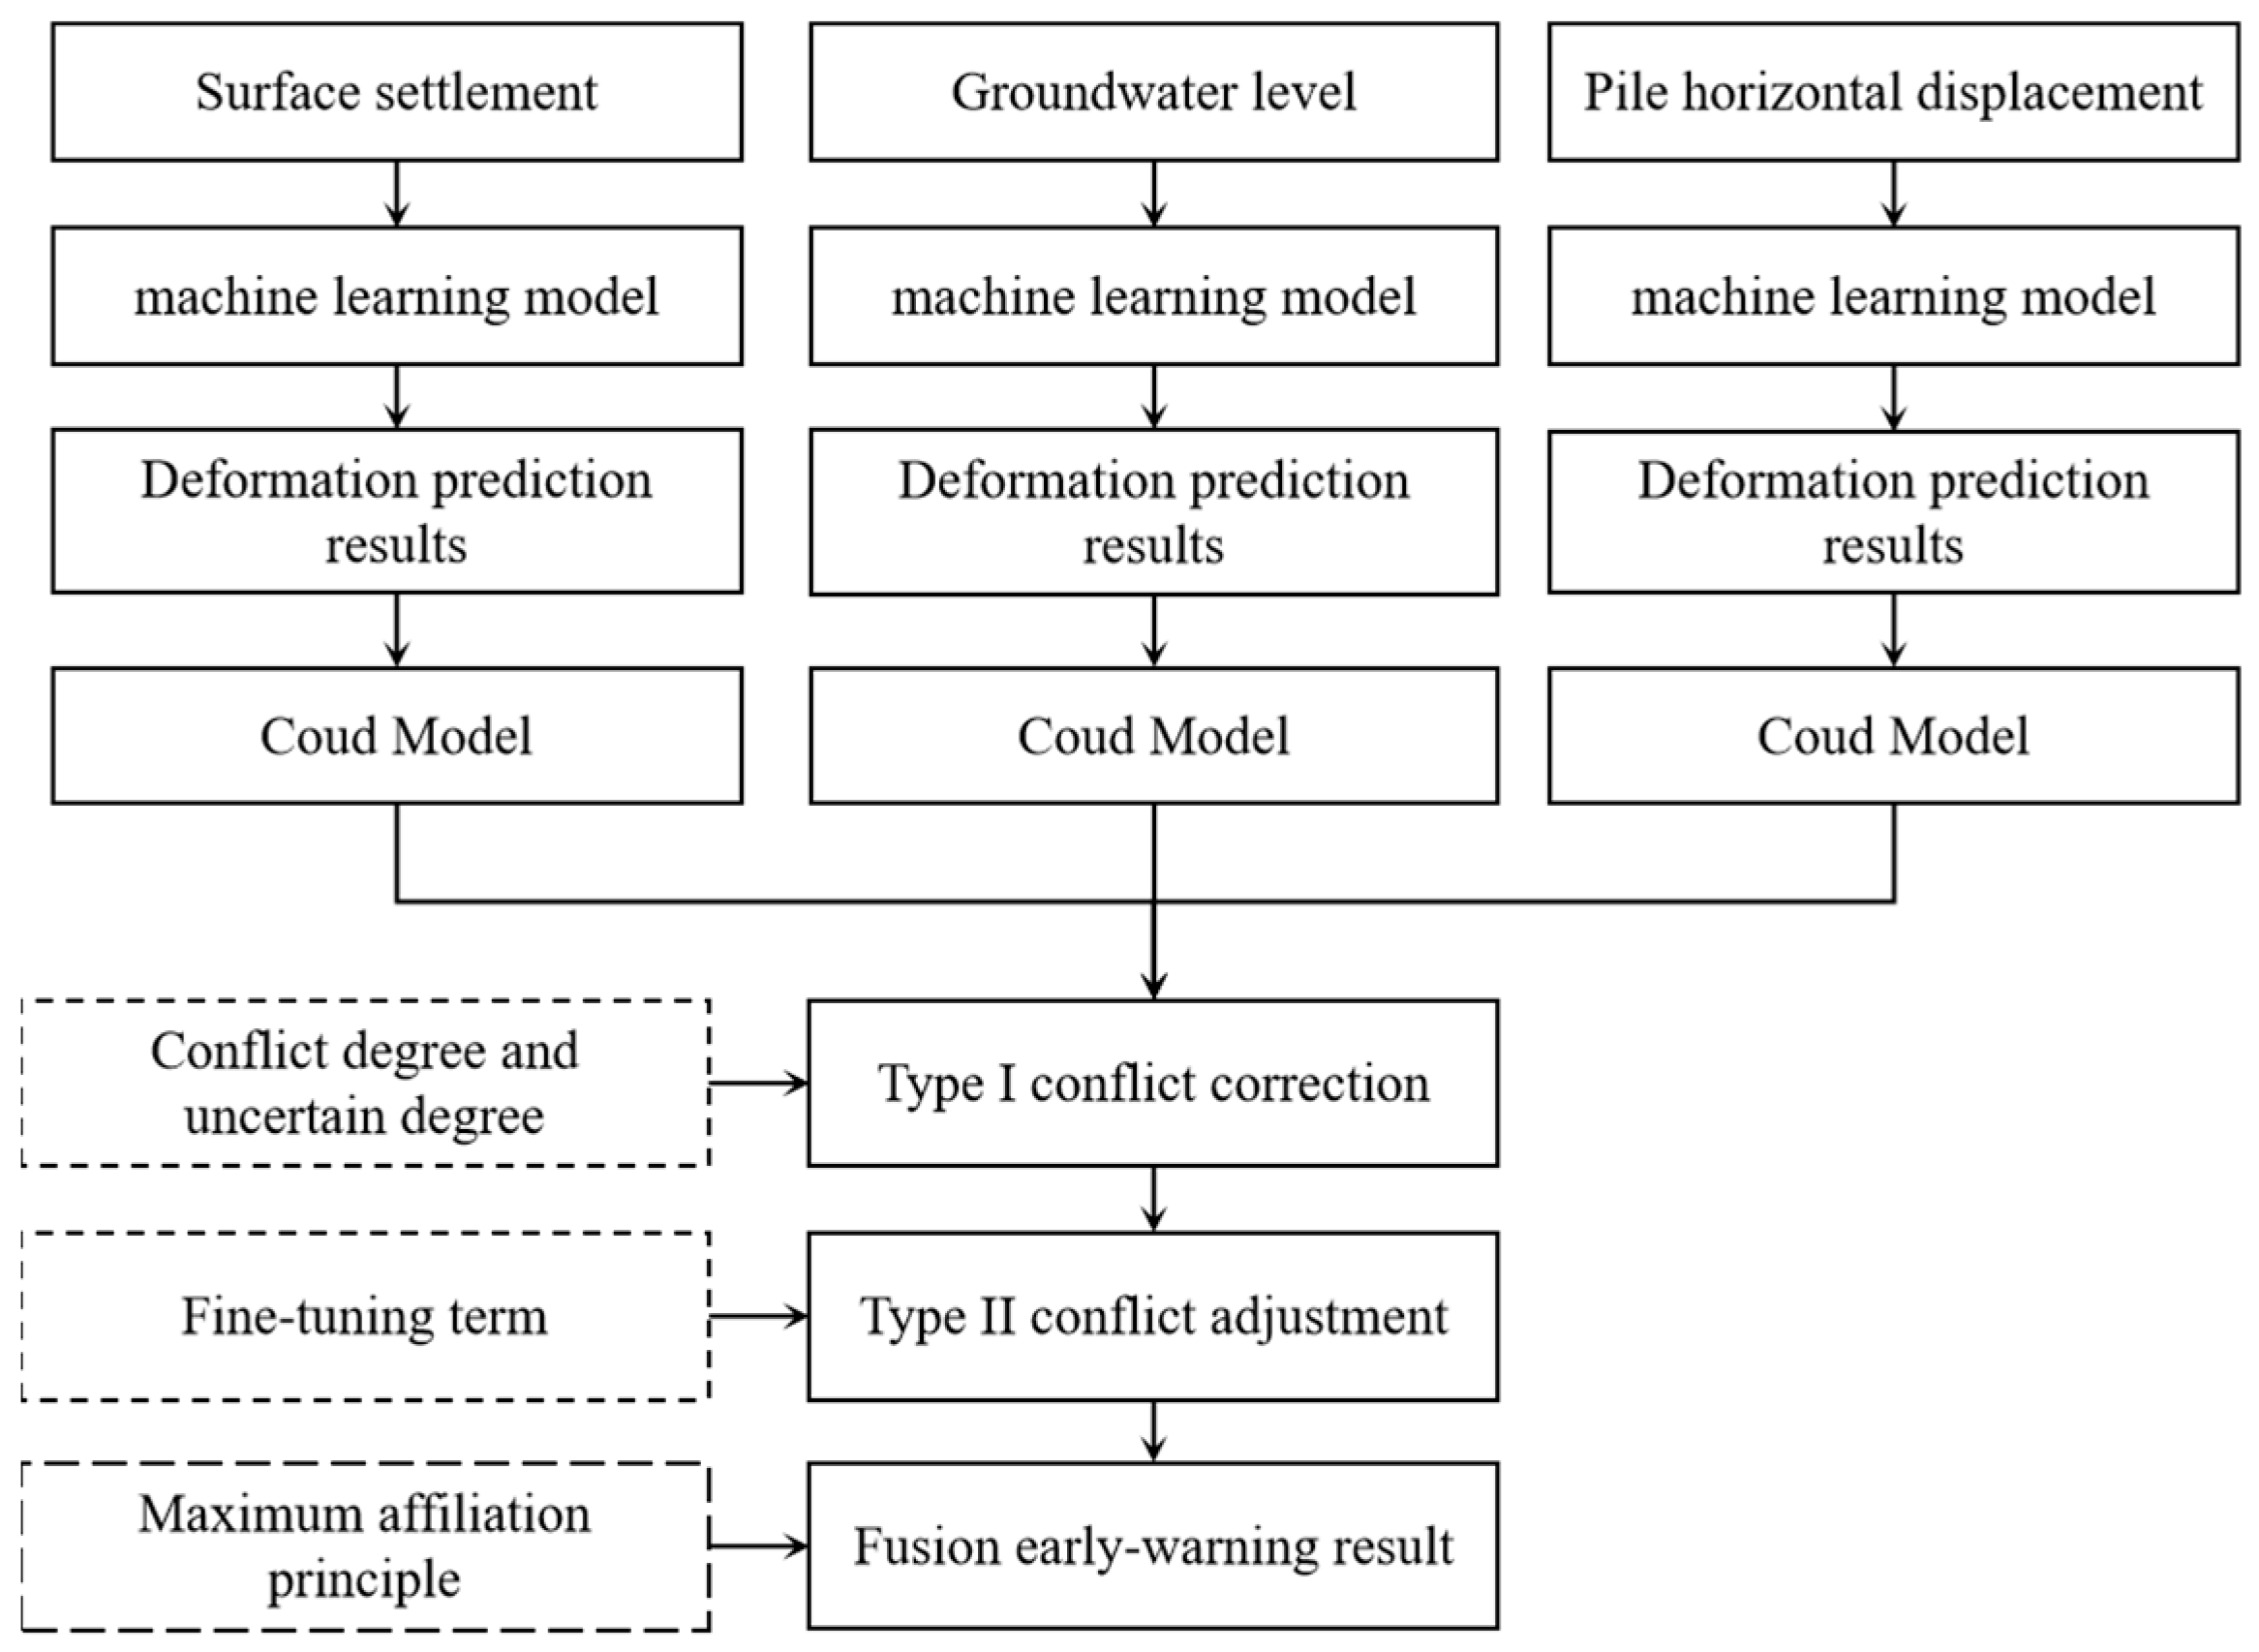
2. Methodology
2.1. Cloud Model
2.2. Improved High-Conflict Evidence Fusion
3. Results
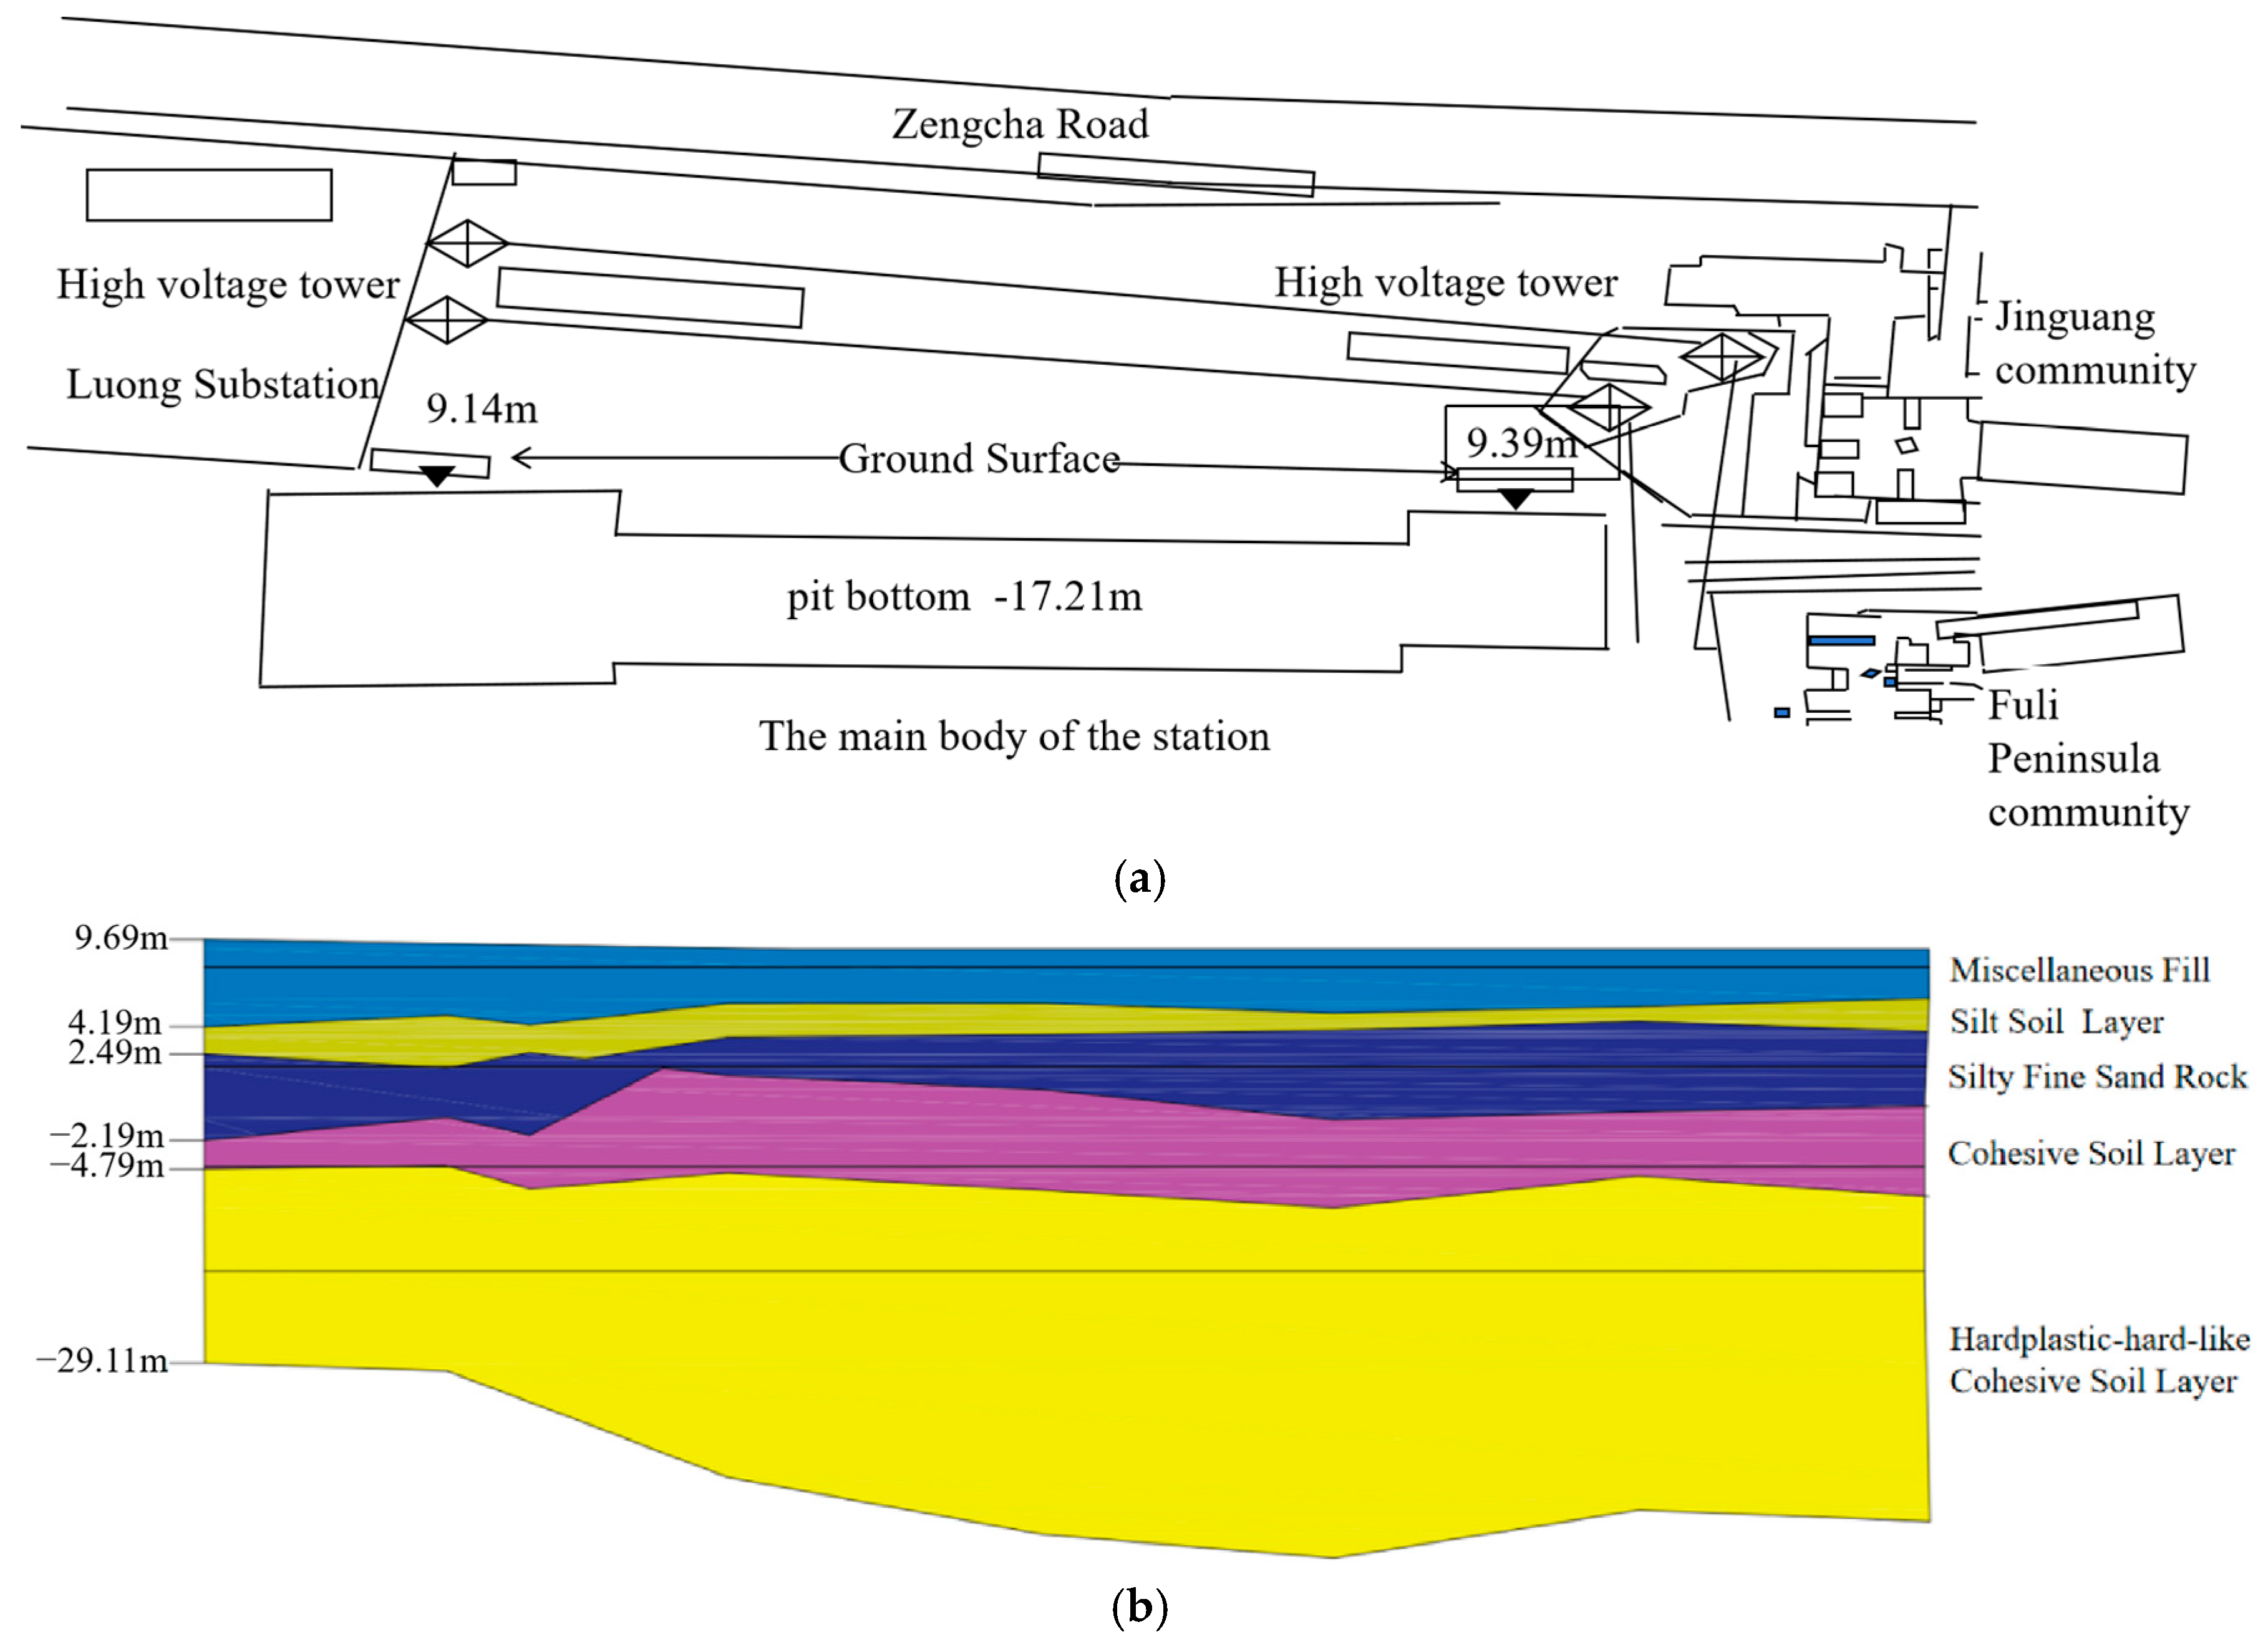
3.1. Engineering Background
3.2. Early-Warning Indicator System
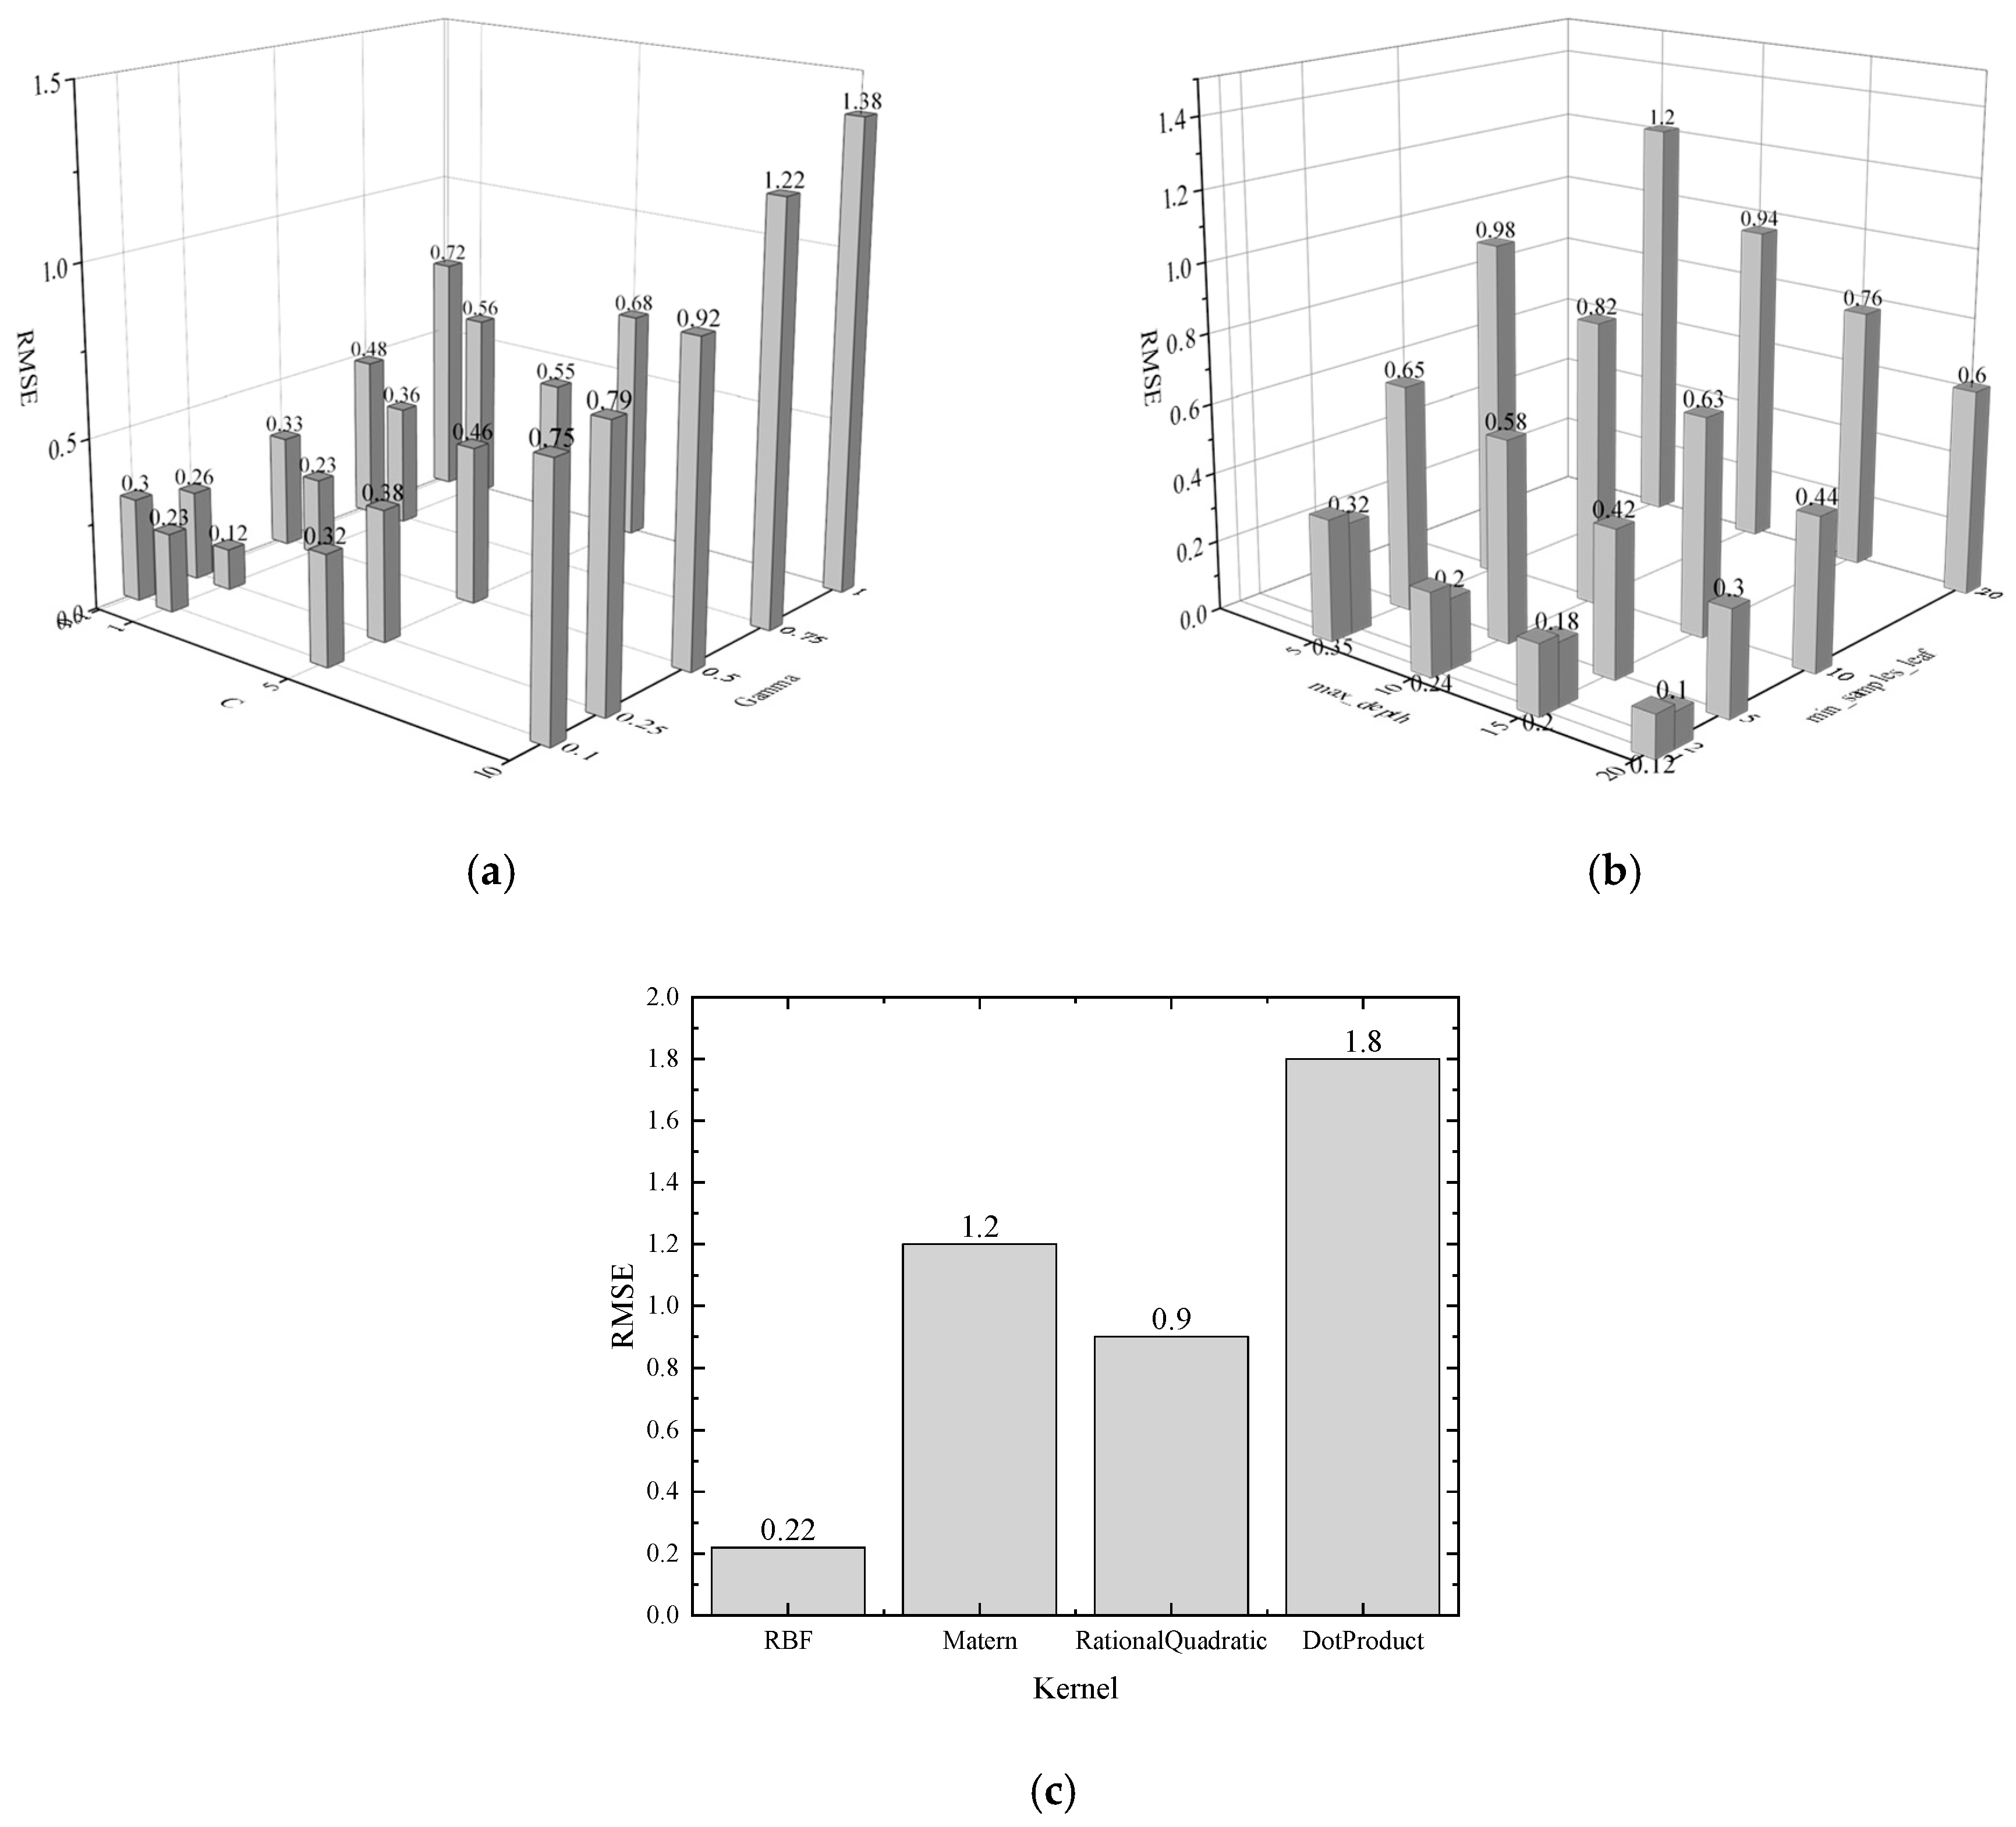
3.3. Analysis of Deformation Predictions
- (1)
- For the same risk source, the MAE and RMSE are similar. This indicates that the training data have no obvious outliers and can be better adapted to model training. From Figure 6a,b, the MAE of surface settlement ranges from 0 to 3.5 and the RMSE ranges from 0 to 4. From Figure 6c,d, the MAE of groundwater level ranges from 0 to 3.5 and the RMSE ranges from 0 to 4.5. From Figure 6e,f, the MAE of pile horizontal displacement ranges from 0 to 4.5 and the RMSE ranges from 0 to 5.5.
- (2)
- For the small sample of data in this paper, the GPR model and stacked ML gives the best prediction, followed by the SVR model and finally the DTR model. As can be seen from Figure 6, the “red circle position” is the lowest point of error. At the same time, considering the complexity of the model, the GPR model is simpler, easier to implement, and more difficult to overfit. Therefore, this paper chooses the GPR model as the prediction model.
- (3)
- The smaller the number of days of prediction, the better the model prediction. As can be seen in Figure 6a–f, the number of prediction days is set as three, five, seven and nine. When the number of prediction days is three, the model error is lower, the MAE is usually kept within 1.5, and the RMSE is kept within 2.5. But when the number of days of prediction is five, seven, and nine, the error value becomes higher in that order. Therefore, the forecasting model in this paper selects the number of forecasting days as three.
- (4)
- The GPR model performs best with a training sample length p of five when the number of prediction days is q of three. From the “red dots” in Figure 6a, it can be seen that when the number of prediction days is three, the training sample of five days has the smallest error value. Therefore, the prediction model in this paper chooses the GPR model with a training sample length of 5 days and 3 prediction days, denoted as GPR (5,3).
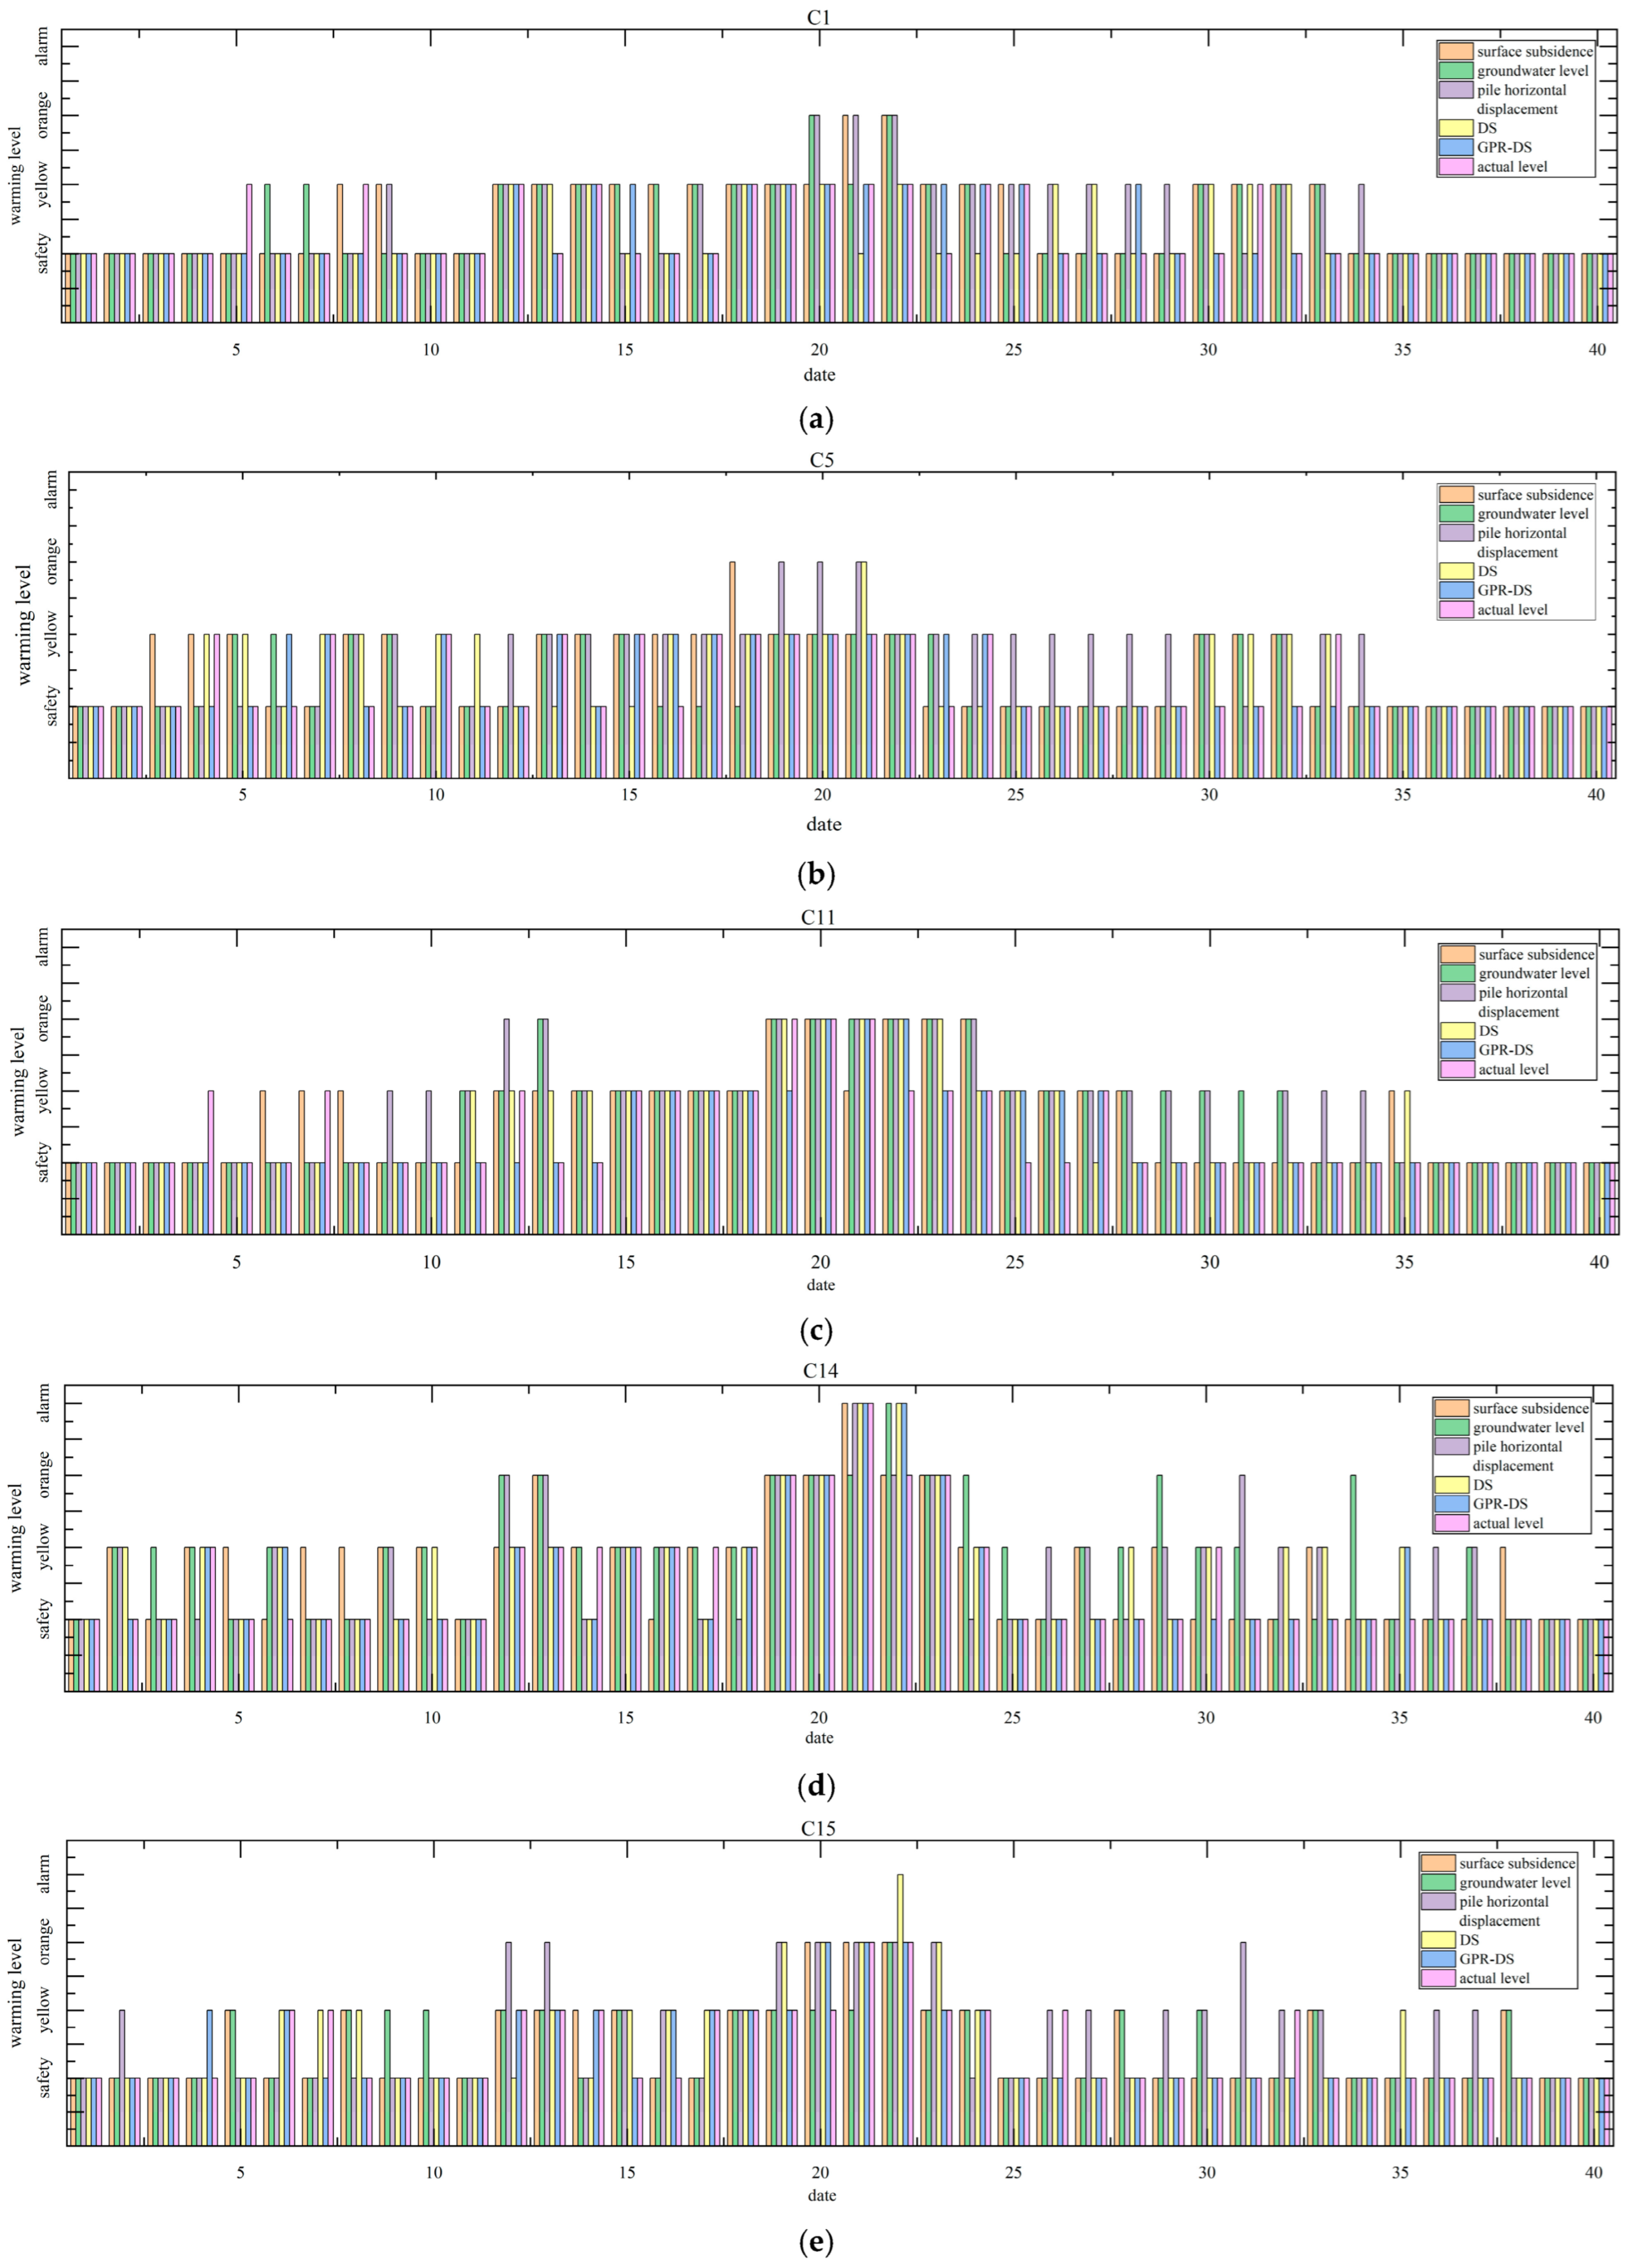
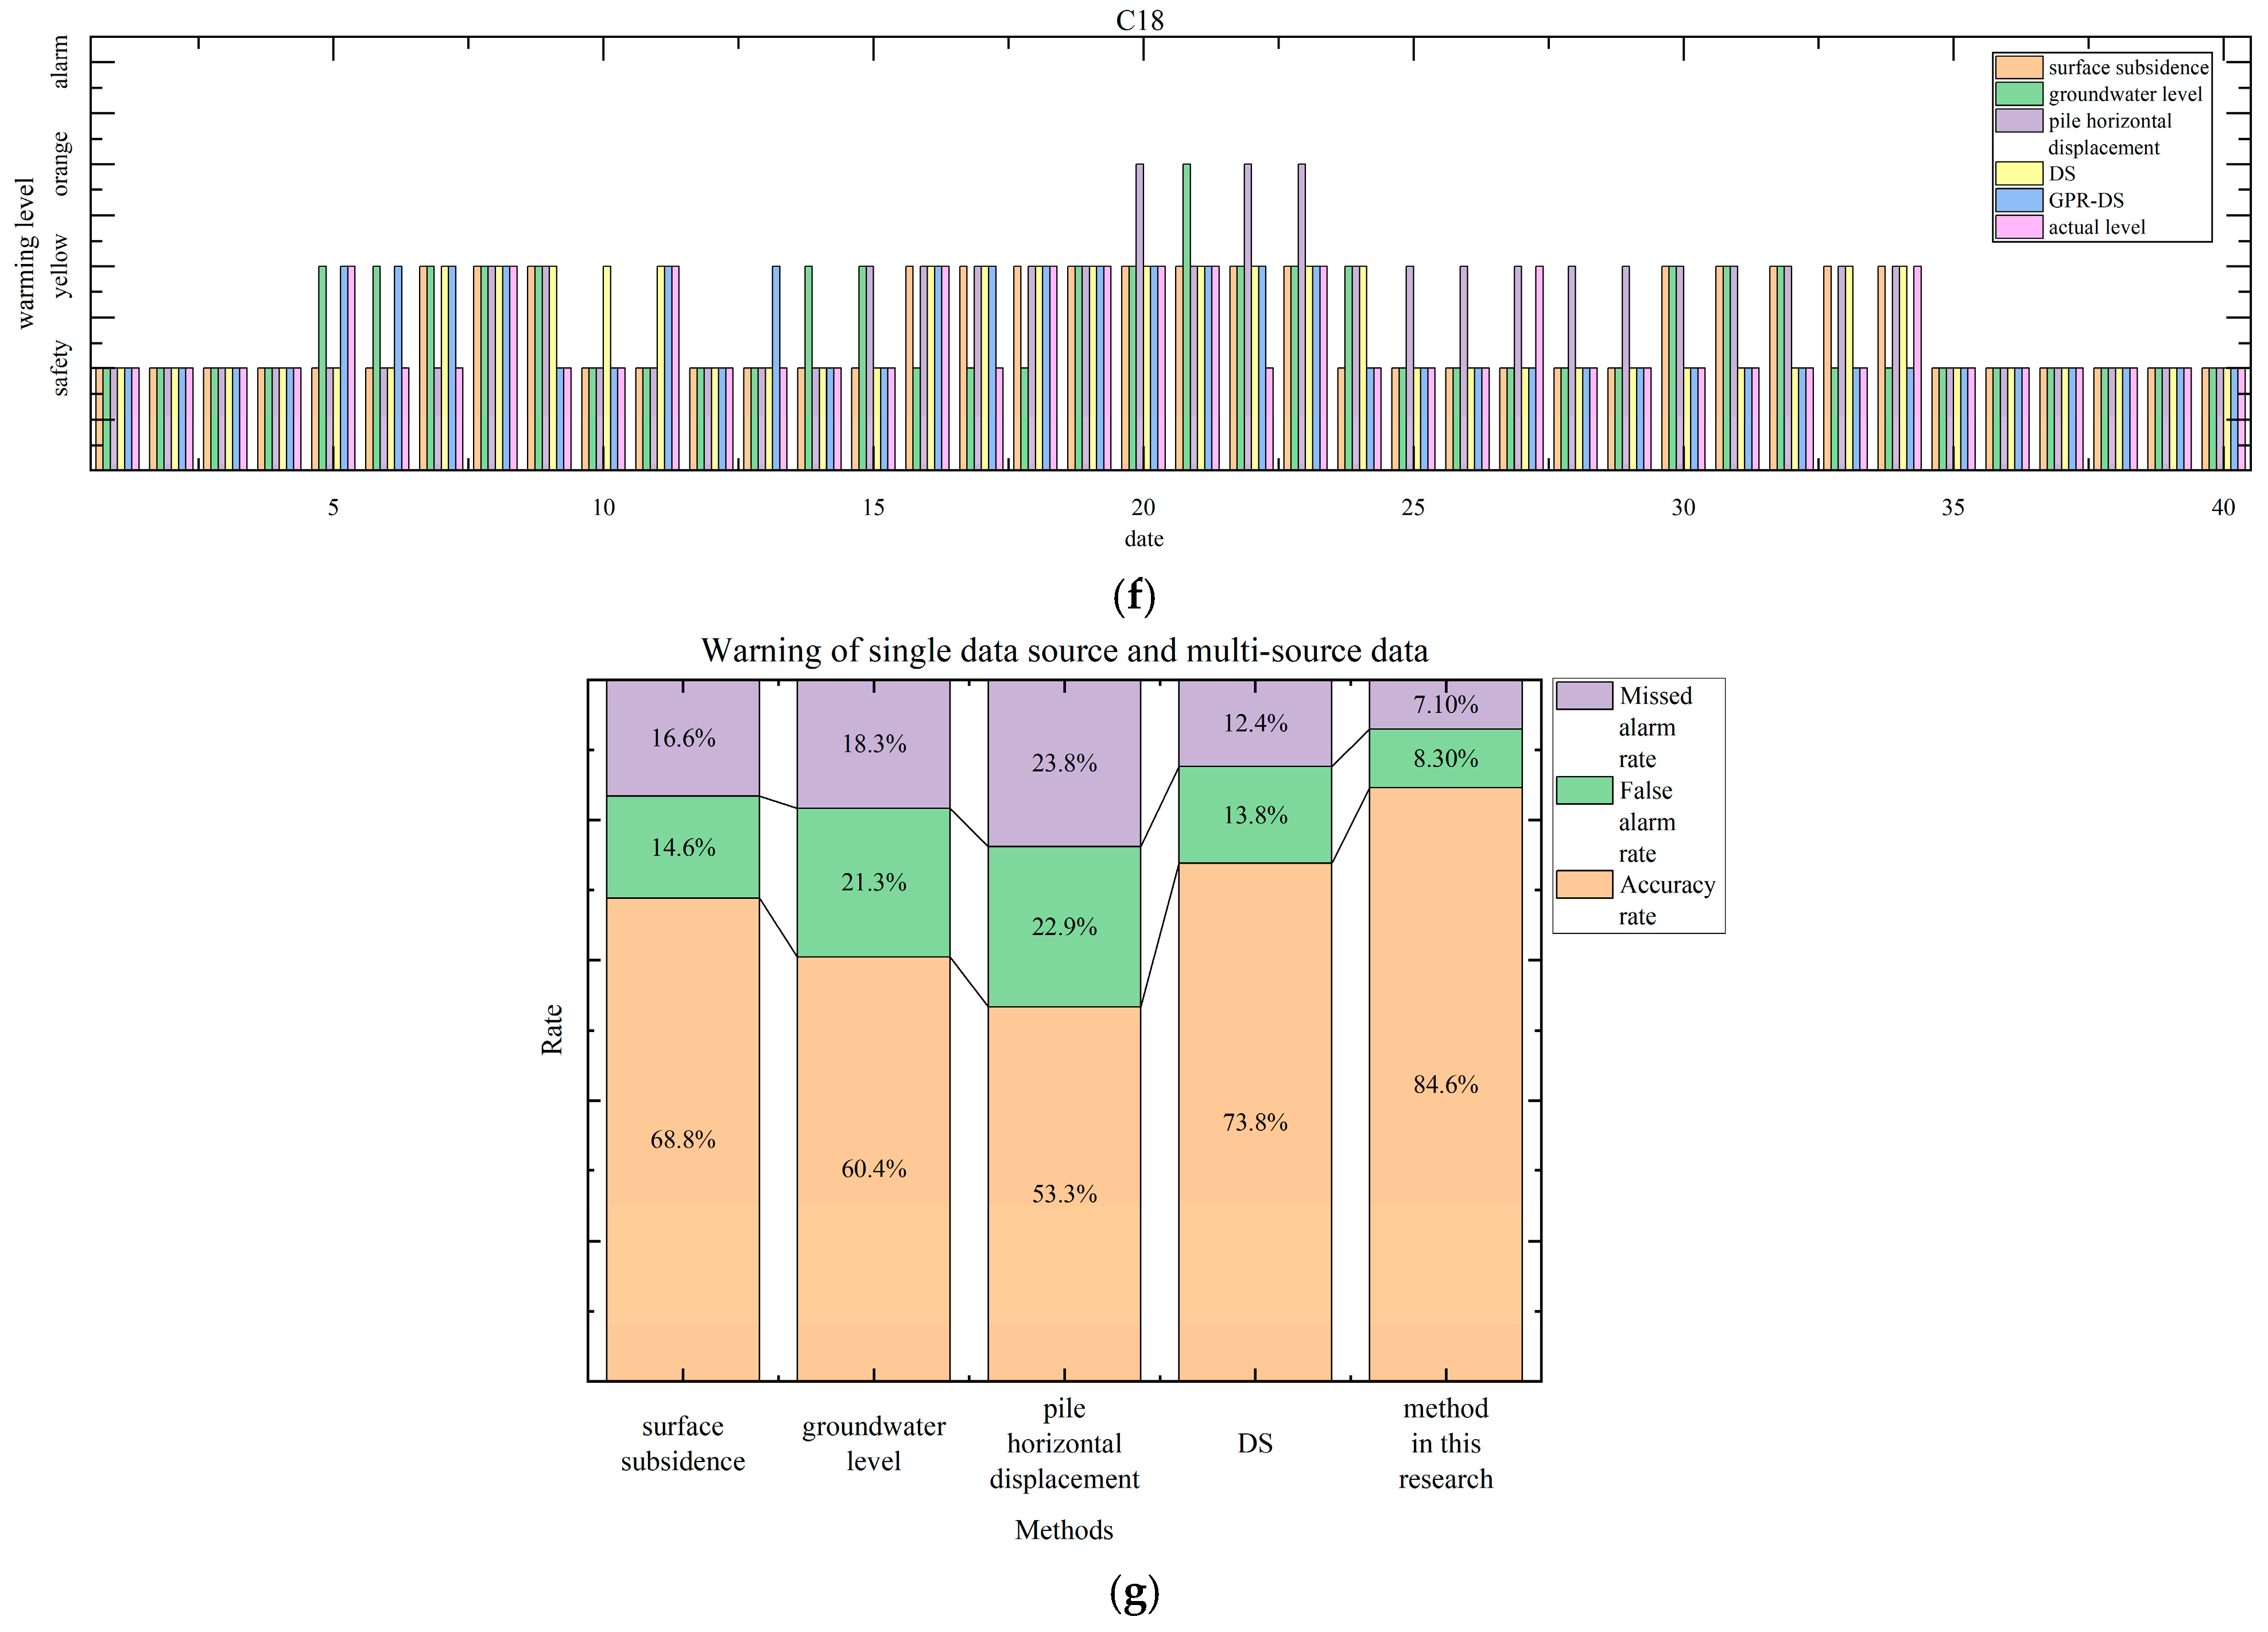
3.4. Multi-Source Data Fusion for Early Warning
- (1)
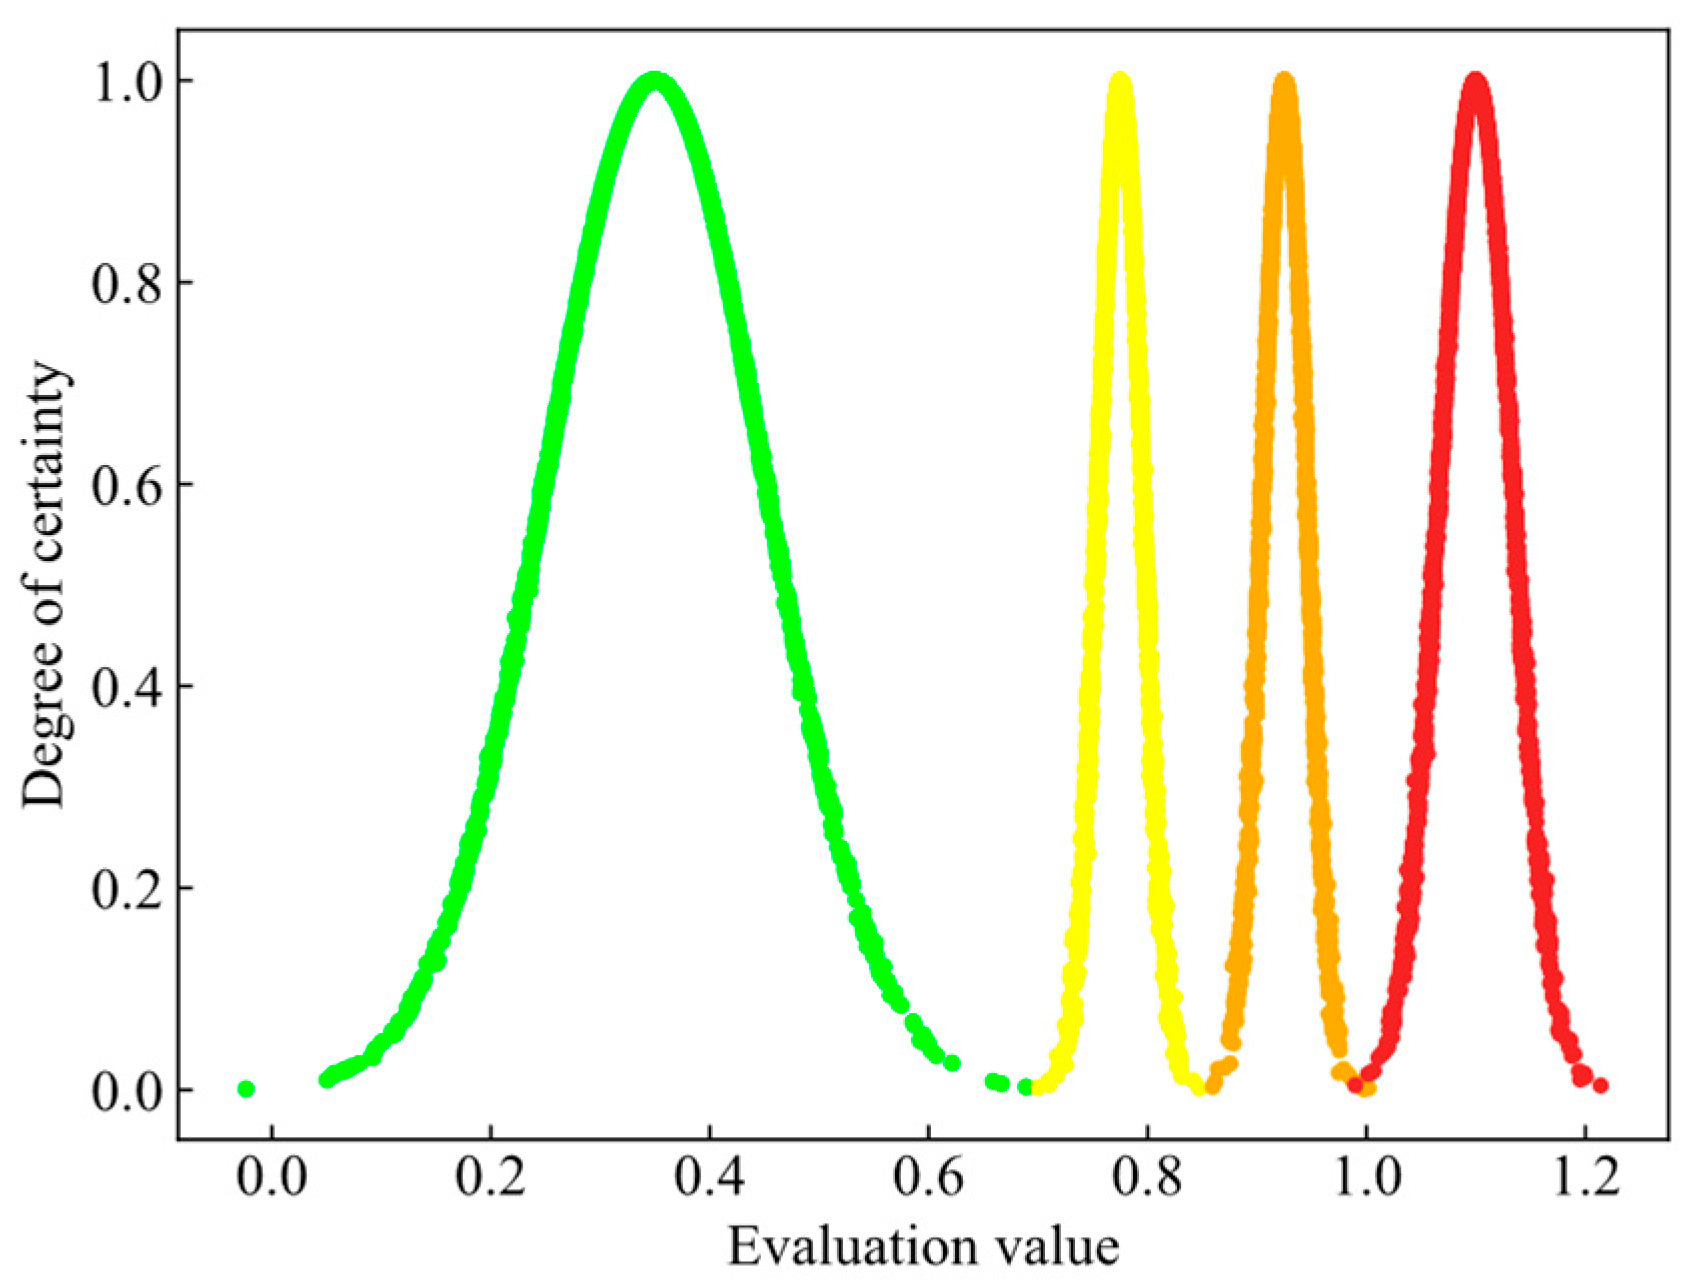
- Delineate evaluation intervals and determine cloud model parameters.
- (2)
- BPA generation for different data sources
- (3)
- Multi-source data fusion.
4. Discussion
5. Conclusions
- (1)
- Limited to the variability of the geological conditions of the pit and the uncertainty of the construction process, it is difficult to judge the early-warning level by the environmental conditions and structural conditions of the pit. Since all kinds of monitoring data are the visual embodiment of the integrated effect of environmental conditions, construction conditions, etc., it is of great significance to study the early warning of pit risk based on monitoring data.
- (2)
- Multi-step rolling prediction of deformation trends is performed using a small-sample machine learning approach. The predictions are transformed into basic probability distributions through cloud modelling, providing multiple sources of input information for the fusion early-warning model. The small-sample prediction results in this paper are consistent with the construction site monitoring results, which can provide decision makers with an over-advanced risk prediction signal so that construction workers have sufficient risk emergency response time to reduce the probability of collapse accidents.
- (3)
- In order to solve the problems of low credibility of a single source of information and the failure of fusion of highly conflicting evidence from multiple sources, an improved multi-source information fusion early-warning method is proposed. The three sources of information, namely surface settlement, groundwater level, and pile horizontal displacement, are considered together, and the predicted values of multiple monitoring items are fused for early warning based on the newly defined evidence correction parameters and optimized fusion rules. The results show that the method proposed in this paper outperforms the single information source method and the traditional D-S method. The proposed method has high accuracy and effectiveness.
Author Contributions
Funding
Institutional Review Board Statement
Informed Consent Statement
Data Availability Statement
Conflicts of Interest
References
- Chen, H.; Zhang, K.; Jiang, Y.B.; Cao, M.H. Research on Axial Force Prediction and Safety Warning Model of Steel Bracing System in Deep Foundation Pit of Subway Station. J. Disaster Prev. Mitig. Eng. 2023, 43, 576–587. [Google Scholar]
- Yan, M. Research on Safety Monitoring and Prediction and Early Warning of Ultra-large and Ultra-deep Foundation Pit for Large Water Purification Plant; Kunming University of Science and Technology: Kunming, China, 2023. [Google Scholar]
- Li, L. Research on Intelligent Warning of Safety Risk Based on BIM and Multi-Source Monitoring During the Subway Construction; China University of Mining and Technology: Xuzhou, China, 2022. [Google Scholar]
- Clough, G.W.; O’Rourke, T.D. Construction induced movements of in situ walls. In Design and Performance of Earth Retaining Structures; Geotechnical Special Publication: Reston, VA, USA, 1990; Available online: https://www.researchgate.net/publication/279565072_Construction_induced_movements_of_in_situ_wall (accessed on 1 July 2025).
- Long, M. Database for retaining wall and ground movements due to deep excavations. J. Geotech. Geoenviron. Eng. 2001, 127, 203–224. [Google Scholar] [CrossRef]
- Moormann, C. Analysis of Wall and Ground Movements Due to Deep Excavations in Soft Soil Based on a New Worldwide Database. Soils Found. 2004, 44, 87–98. [Google Scholar] [CrossRef]
- Yin, L.J.; Li, Y.J.; Zhu, Y.P. Monitoring and numerical simulation of support for foundation pit at Yanyuan Road Station of Lanzhou Metro. Chin. J. Geotech. Eng. 2021, 43, 111–116. [Google Scholar] [CrossRef]
- Wang, W.D. Analytical methods and controlling techniques for deformation and environmental influence of deep excavations in soft soils. Chin. J. Geotech. Eng. 2024, 46, 1–25. [Google Scholar] [CrossRef]
- Huang, H.; Ruan, B.; Wu, X.G.; Qin, Y.W. Parameterized modeling and safety simulation of shield tunnel based on BIM-FEM automation framework. Autom. Constr. 2024, 162, 105362. [Google Scholar] [CrossRef]
- Zhang, L.F.; Chen, Z.H.; Nian, G.Q.; Bao, M.; Zhou, Z.H. Base friction testing methodology for the deformation of rock masses caused by mining in an open-pit slope. Measurement 2023, 206, 112235. [Google Scholar] [CrossRef]
- Chen, S.J.; Gu, X.Q.; Gao, G.Y. Comparison and application of small strain shear moduli from field and laboratory measurements. Chin. J. Geotech. Eng. 2019, 41, 133–136. [Google Scholar] [CrossRef]
- An, Z.Z.; Liu, T.Y.; Zhang, Q.L.; Zhang, Z.S.; Huangfu, Z.H.; Li, Q.B. Vibration compaction process model for rockfill materials considering viscoelastic-plastic deformation. Autom. Constr. 2021, 131, 103889. [Google Scholar] [CrossRef]
- Shan, J.Z.; Zhang, X.; Liu, Y.W.; Zhang, C.B.; Zhou, J.H. Deformation prediction of large-scale civil structures using spatiotemporal clustering and empirical mode decomposition-based long short-term memory network. Autom. Constr. 2024, 158, 105222. [Google Scholar] [CrossRef]
- Xue, Y.J. Time Series Prediction of Deep Foundation Pit Deformation in Soil-rock Composite Stratum Based on Machine Learning Algorithm. Mod. Tunn. Technol. 2022, 59, 77–85. [Google Scholar]
- Meng, G.W.; Liu, J.L.; Huang, J.S.; Wu, B.; Ou, Q. Automatic Prediction of the Deformation of a Retaining Structure in a Deep Foundation Pit Construction Based on a BP Artificial Neural Network. Urban Rapid Rail Transit 2022, 35, 80–88. [Google Scholar]
- Feng, T.G.; Wang, C.R.; Zhang, J.; Wang, B.; Jin, Y.F. An improved artificial bee colony-random forest (IABC-RF) model for predicting the tunnel deformation due to an adjacent foundation pit excavation. Undergr. Space 2022, 7, 514–527. [Google Scholar] [CrossRef]
- Cao, J.; Li, W.Y.; Zhao, D.S.; Song, Z.G.; Ding, W.Y. Forecast of building inclination around foundation pit based on PSO-LSSVM model. Comput. Eng. Appl. 2016, 52, 254–259. [Google Scholar]
- Chen, H.Y.; Shen, Q.P.; Feng, Z.B.; Liu, Y. Vulnerability assessment in urban metro systems based on an improved cloud model and a Bayesian network. Sustain. Cities Soc. 2023, 98, 104823. [Google Scholar] [CrossRef]
- Wang, M.W.; Wang, X.; Liu, Q.Y.; Shen, F.Q.; Jin, J.L. A novel multi-dimensional cloud model coupled with connection numbers theory for evaluation of slope stability. Appl. Math. Model. 2020, 77, 426–438. [Google Scholar] [CrossRef]
- Xie, B.; Liu, Y.; Cui, L.B. High Altitude Railway Construction Risk Warning Based on Improved Game Theory-2D Cloud Model. Railw. Stand. Des. 2025, 69, 144–152. [Google Scholar]
- Zhang, Q.Y.; Babanajad, S.; Sun, H.R.; Braley, J.; Alavi, A.H. Multi-resource fusion of nondestructive evaluation data for bridge deck assessment using discrete wavelet transform and Dempster-Shafer theory. Measurement 2023, 220, 113303. [Google Scholar] [CrossRef]
- Chen, X.D.; Xu, Y.; Guo, H.D.; Hu, S.W.; Gu, C.S.; Hu, J.; Que, H.; Guo, J. Comprehensive evaluation of dam seepage safety combining deep learning with Dempster-Shafer evidence theory. Measurement 2024, 226, 114172. [Google Scholar] [CrossRef]
- Fei, L.G.; Feng, Y.Q.; Wang, H.L. Modeling heterogeneous multi-attribute emergency decision-making with Dempster-Shafer theory. Comput. Ind. Eng. 2021, 161, 107633. [Google Scholar] [CrossRef]
- Belmahdi, F.; Lazri, M.; Ouallouche, F.; Labadi, K.; Absi, R.; Ameur, S. Application of Dempster-Shafer theory for optimization of precipitation classification and estimation results from remote sensing data using machine learning. Remote Sens. Appl. Soc. Environ. 2023, 29, 100906. [Google Scholar] [CrossRef]
- Luo, Z.Q.; Li, Y.Y.; Qin, Y.G.; Wen, L. A method developed for early warning of under ground rock mass instability in mining area based on Cusp catastrophe model and D-S fusion evidence theory. Chin. J. Geol. Hazard Control 2020, 31, 60–69. [Google Scholar]
- Huang, J.; Weng, C.P.; Ding, W.Q. Study on the Early-warning Index of Deflection of Deep Foundation Excavation Group in Coastal Under-consolidated Stratum. Constr. Technol. 2021, 50, 95–98+108. [Google Scholar] [CrossRef]
- Wang, T.; Shi, B. Study on safety level and deformation control index of transit foundation pit works in Jiangsu Province. Mod. Uransit 2019, 07, 89–92. [Google Scholar] [CrossRef]
- Wang, Y.S.; Zhang, W.J.; Zeng, G.D. Study on Deformation Law and Early Warning Monitoring Index of Deep Foundation Pit at Water-rich Sandy Stratum. Bull. Sci. Technol. 2018, 34, 227–231. [Google Scholar] [CrossRef]
- Yan, X.; Liu, H.S.; Tu, N.W.; Shu, S.W. Study on Early-warning of Coal and Gas Outburst in Mines Based on Image Recognition. Control. Eng. China 2023, 30, 1935–1942. [Google Scholar] [CrossRef]
- Qiu, W.X.; Zhao, L.H.; Wu, B. A Multi-source Information Fusion Assessment for the Tunneling Collapse Disaster Based on Evidential Reasoning. J. Hunan Univ. (Nat. Sci.) 2024, 51, 190–200. [Google Scholar] [CrossRef]
- Wu, B.; Qiu, W.X.; Xu, S.X. A Method for Assessing Probability of Tunnel Collapse Based on Artificial Intelligence Deformation Prediction. Earth Sci. 2024, 49, 4204–4215. [Google Scholar] [CrossRef]
- Ma, Q.; Lu, L.F.; Li, Q.F.; Wang, Z.P. Green Construction Grade Evaluation of Large Channels Based on Uncertain AHP-Multidimensional Cloud Model. Sustainability 2022, 14, 6143. [Google Scholar] [CrossRef]
- Li, P.Y.; Han, H.D.; Wang, D.H.; Wang, C.S. Current situation and development trends of suitability evaluation of urban underground space resources. Sediment. Geol. Tethyan Geol. 2021, 41, 121–128. [Google Scholar] [CrossRef]
- Xu, X.B.; Guo, H.H.; Zhang, Z.H.; Yu, S.N.; Chang, L.L.; Steyskal, F.; Brunauer, G. A cloud model-based interval-valued evidence fusion method and its application in fault diagnosis. Inf. Sci. 2024, 658, 119995. [Google Scholar] [CrossRef]
- Liu, X.Y.; Liu, S.L.; Xiang, J.W.; Sun, R.X. A conflict evidence fusion method based on the composite discount factor and the game theory. Inf. Fusion 2023, 94, 1–16. [Google Scholar] [CrossRef]
- Xue, P.Y.; Fei, L.G.; Ding, W.P. A volunteer allocation optimization model in response to major natural disasters based on improved Dempster-Shafer theory. Expert Syst. Appl. 2024, 236, 121285. [Google Scholar] [CrossRef]
- Kavya, R.; Jabez, C.; Subhrakanta, P. A new belief interval-based total uncertainty measure for Dempster-Shafer theory. Inf. Sci. 2023, 642, 119150. [Google Scholar] [CrossRef]
- Li, S.L.; Liang, W.Q.; Chen, X.B.; Xie, Q.Y.; Xiao, Y.Z.; Sun, Q.F. Safety Monitoring and Early Warning Indexes of Urban Underground Space. Geol. Explor. 2024, 60, 95–104. [Google Scholar] [CrossRef]
- Zeng, Y.S. Monitoring and Analysis of Ultra-deep Foundation Pit of Shield Working Well. Subgrade Eng. 2024, 2, 228–234. [Google Scholar]
- Kazemi, F.; Asgarkhani, N.; Jankowski, R. Optimization-based stacked machine-learning method for seismic probability and risk assessment of reinforced concrete shear walls. Expert Syst. Appl. 2024, 255, 124897. [Google Scholar] [CrossRef]


| Stratum | Category | Code | Name of Rock | Water Content (%) | Natural Density (g/cm3) | Void Ratio | Stratigraphic Characteristics |
|---|---|---|---|---|---|---|---|
| Q4ml | Reclamation soil layer | <1-1> | Miscellaneous Fill | 43.3 | 1.49 | 1.650 | It is composed of fly ash, clay, sand, and concrete blocks, and the soil is uneven. |
| Q4mc | Sea–land interaction layer | <2-1B> | Silt Soil Layer | 55.8 | 1.65 | 1.444 | Gray black, flow plastic, high compressive soil, mainly clay, containing a small amount of sand. |
| <2-2> | Silty Fine Sand Layer | None | None | None | Gray, saturated, loose, local slightly dense, mainly quartz sand, local silt. | ||
| Q3 + 4al+pl | Continental alluvial–proluvial layer | <4N-2> | Cohesive Soil Layer | 27.9 | 1.96 | 0.771 | It is grayish white, plastic, mainly composed of clay particles, containing a large amount of fine sand. |
| Qel | Residual soil stratum | <5N-2> | Hard plastic–hard-like Cohesive Soil Layer | 21.6 | 1.94 | 0.709 | It is brownish yellow, hard plastic to hard, mainly powder and clay, containing powder fine sand and medium sand. |
| Monitoring Items | Location and Monitoring Objects | Measuring Point Position | Numbers | Monitoring Equipment |
|---|---|---|---|---|
| surface subsidence | Soil around the foundation pit within the range of 4 times the depth of the foundation pit | The horizontal spacing of monitoring points is about 20~30 m, and there are two monitoring points in the monitoring section. | 91 | Level instrument, Indium steel ruler |
| groundwater level | Around the foundation pit | The distance between the outside of the foundation pit is about 20~25 m, and the surrounding of the protected building is protected. | 20 | Steel ruler water level meter |
| pile horizontal displacement | Inside the pile | The horizontal spacing is 20~30 m, at least one on each side of the foundation pit, the midpoint of each side of the foundation pit, the corner, and the typical wall. | 20 | Clinometer |
| Indicators | Cumulative Value/mm | Rate of Change/(mm/d) |
|---|---|---|
| Surface settlement | 30 | 3 |
| Groundwater level | 2 | 0.6 |
| Pile horizontal displacement | 30 | 2.4 |
| Indicators | Early-Warning Level | ||||
|---|---|---|---|---|---|
| Primary Indicators | Secondary Indicators | Safe | Yellow Early-Warning | Orange Early-Warning | Alarm |
| surface settlement (E1) | cumulative value k1 | case1: 0 < k1 < 0.7, 0 < k2 < 0.7 | case1: 0.7 < k1 < 0.85, 0.7 < k2 < 0.85 case2: 0.85 < k1 < 1 case3: 0.85 < k2 < 1 | case1: 0.85 < k1 < 1, 0.85 < k2 < 1 case2: 1 < k1 < 1.6 case3: 1 < k2 < 1.6 | case1: 1 < k1 < 1.6, 1 < k2 < 1.6 |
| rate of change k2 | |||||
| groundwater level (E2) | cumulative value k1 | ||||
| rate of change k2 | |||||
| pile horizontal displacement (E3) | cumulative value k1 | ||||
| rate of change k2 | |||||
| Evaluation Intervals | Cloud Numerical Characteristics (Ex, En, He) |
|---|---|
| [0, 0.7] | (0.35, 0.10, 0.001) |
| [0.7, 0.85] | (0.775, 0.02, 0.001) |
| [0.85, 1] | (0.925, 0.02, 0.001) |
| [1, 1.6] | (1.3, 0.10, 0.001) |
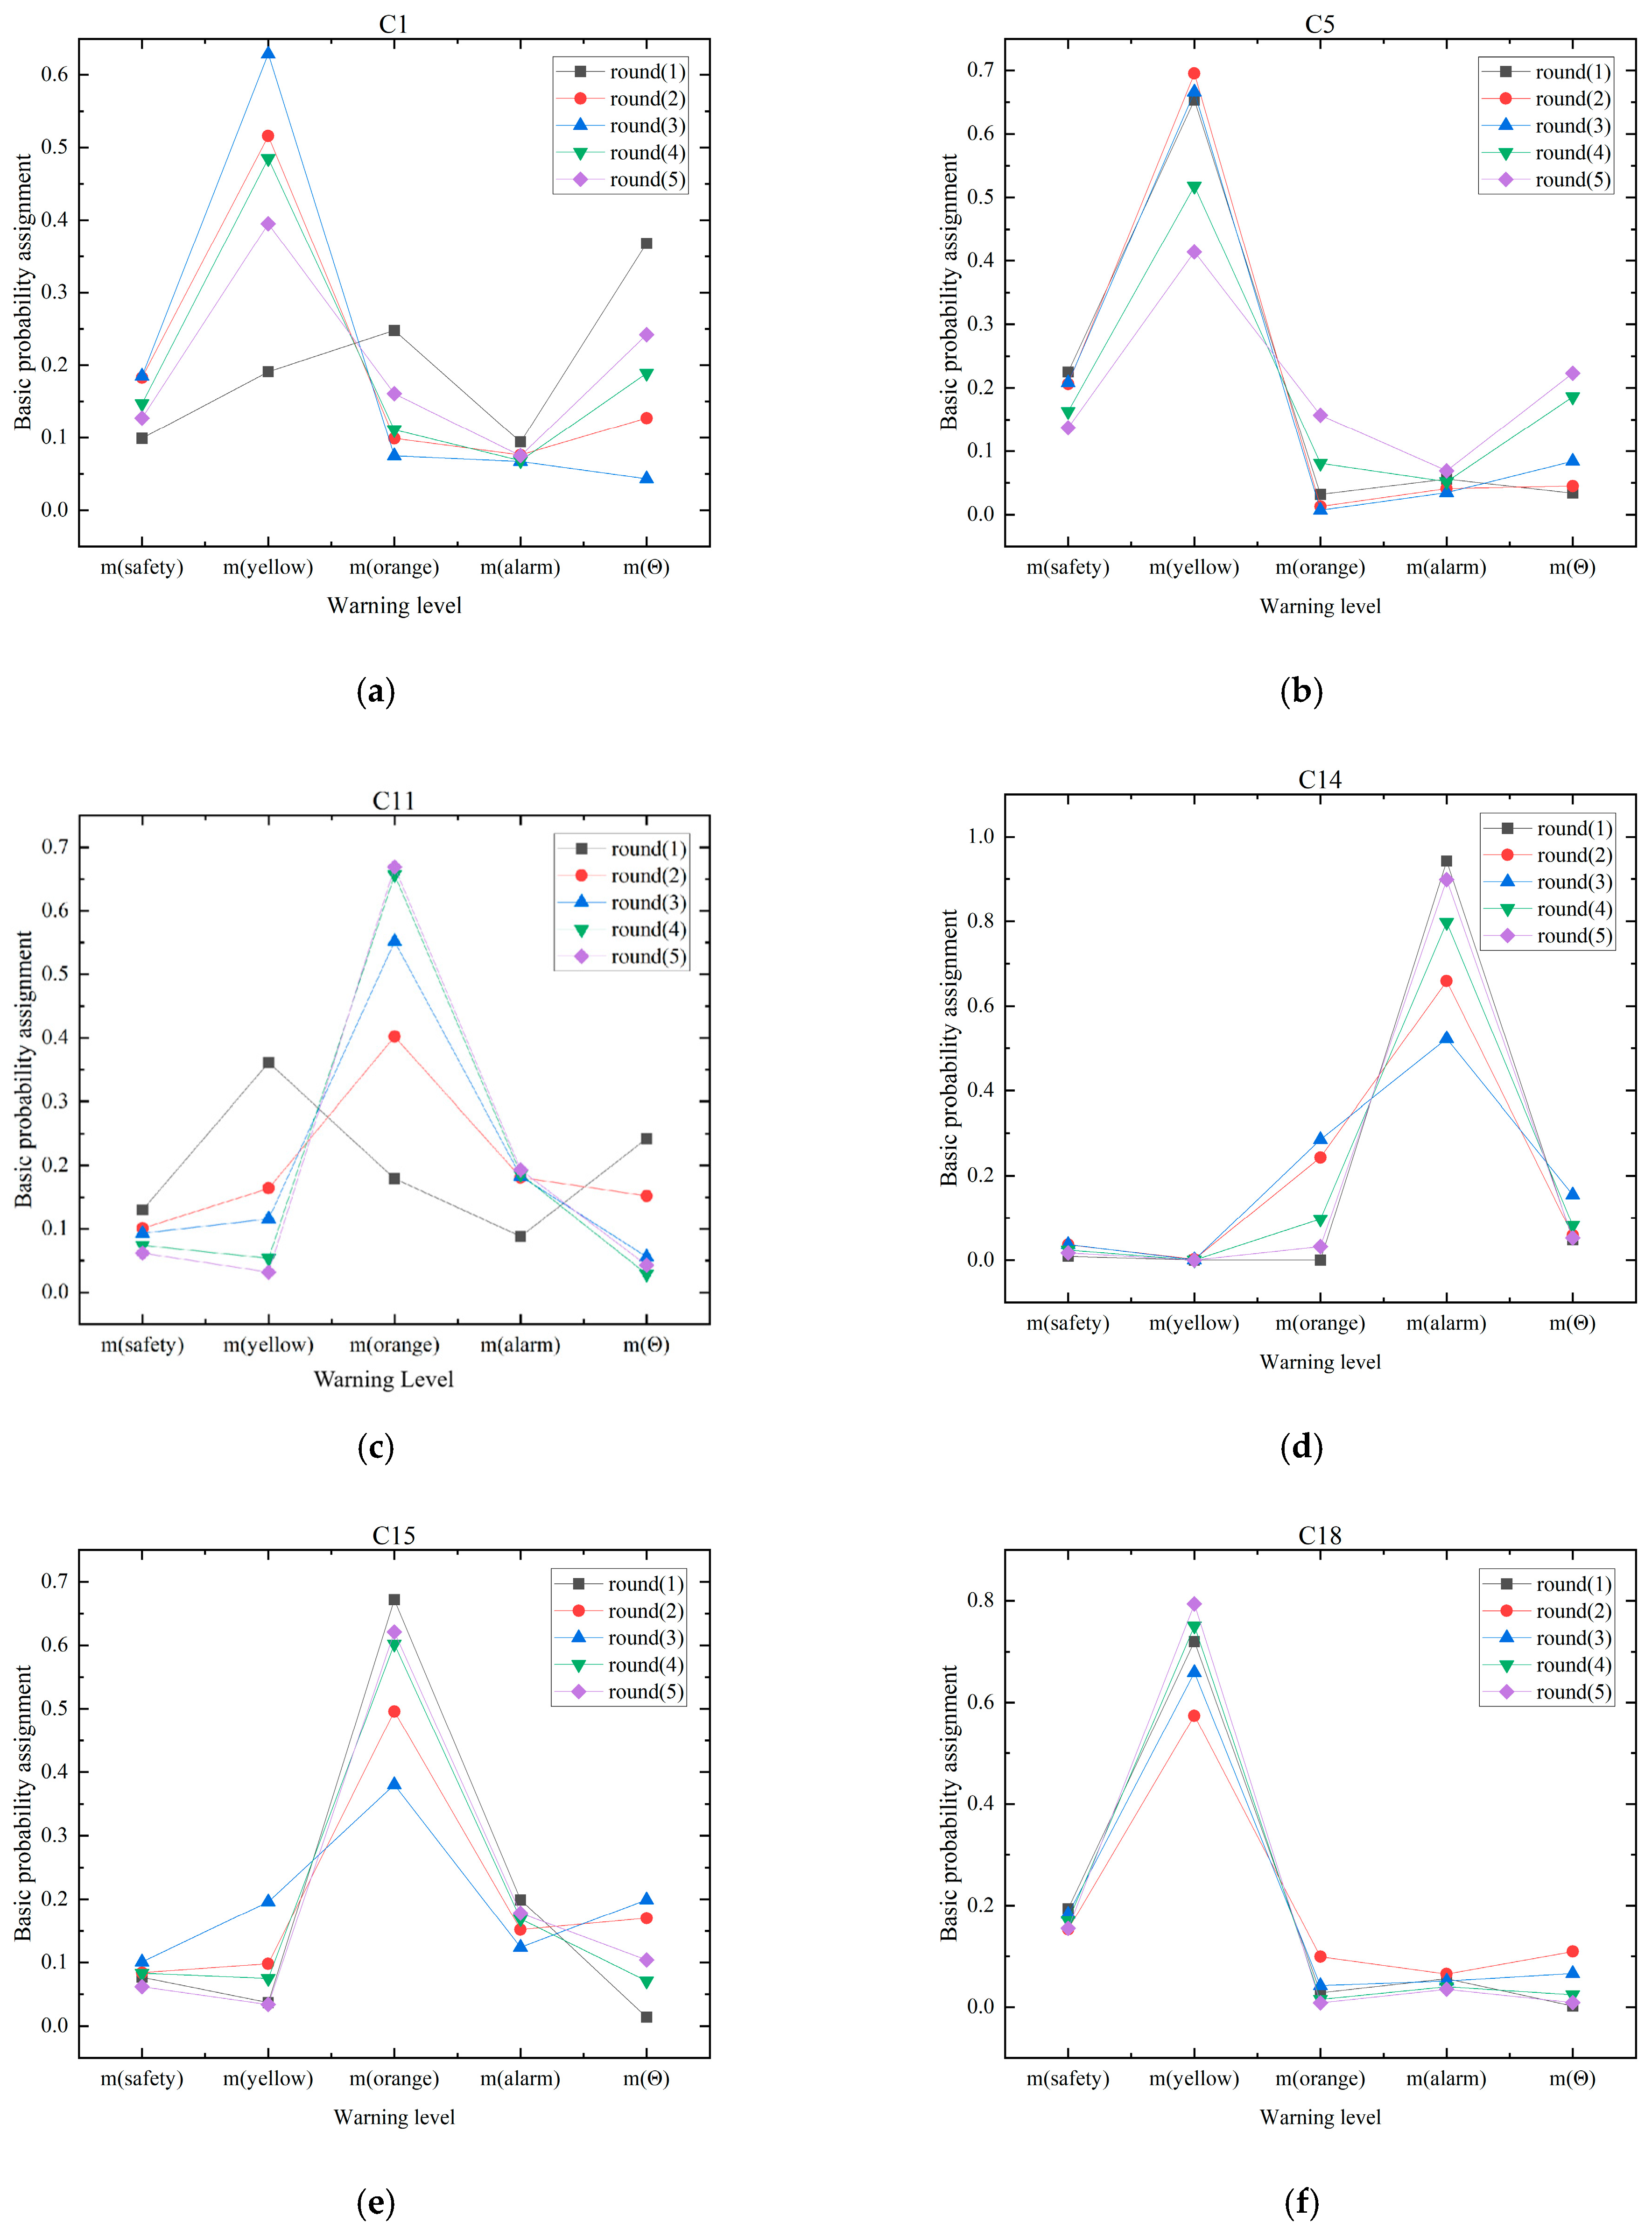
| Point | Primary Indicators | Secondary Indicators | m (Safe) | m (Yellow) | m (Orange) | m (Alarm) | m (Θ) |
|---|---|---|---|---|---|---|---|
| C1 | surface settlement | cumulative value | 0.056 | 0.000 | 0.424 | 0.230 | 0.289 |
| rate of change | 0.093 | 0.049 | 0.570 | 0.249 | 0.039 | ||
| groundwater level | cumulative value | 0.191 | 0.582 | 0.045 | 0.081 | 0.101 | |
| rate of change | 0.119 | 0.290 | 0.152 | 0.083 | 0.357 | ||
| pile horizontal displacement | cumulative value | 0.112 | 0.130 | 0.525 | 0.177 | 0.056 | |
| rate of change | 0.057 | 0.000 | 0.471 | 0.218 | 0.254 | ||
| C5 | surface settlement | cumulative value | 0.244 | 0.600 | 0.068 | 0.082 | 0.006 |
| rate of change | 0.260 | 0.574 | 0.012 | 0.060 | 0.095 | ||
| groundwater level | cumulative value | 0.250 | 0.591 | 0.003 | 0.053 | 0.102 | |
| rate of change | 0.258 | 0.474 | 0.003 | 0.047 | 0.218 | ||
| pile horizontal displacement | cumulative value | 0.091 | 0.187 | 0.209 | 0.082 | 0.432 | |
| rate of change | 0.095 | 0.185 | 0.243 | 0.092 | 0.384 | ||
| C11 | surface settlement | cumulative value | 0.128 | 0.327 | 0.165 | 0.087 | 0.293 |
| rate of change | 0.121 | 0.302 | 0.173 | 0.086 | 0.318 | ||
| groundwater level | cumulative value | 0.077 | 0.013 | 0.528 | 0.254 | 0.129 | |
| rate of change | 0.109 | 0.103 | 0.575 | 0.207 | 0.006 | ||
| pile horizontal displacement | cumulative value | 0.091 | 0.028 | 0.618 | 0.238 | 0.025 | |
| rate of change | 0.084 | 0.027 | 0.535 | 0.258 | 0.097 | ||
| C14 | surface settlement | cumulative value | 0.019 | 0.000 | 0.000 | 0.881 | 0.100 |
| rate of change | 0.015 | 0.000 | 0.000 | 0.885 | 0.100 | ||
| groundwater level | cumulative value | 0.076 | 0.005 | 0.587 | 0.238 | 0.094 | |
| rate of change | 0.049 | 0.000 | 0.321 | 0.229 | 0.400 | ||
| pile horizontal displacement | cumulative value | 0.026 | 0.000 | 0.003 | 0.874 | 0.096 | |
| rate of change | 0.032 | 0.000 | 0.009 | 0.845 | 0.114 | ||
| C15 | surface settlement | cumulative value | 0.101 | 0.046 | 0.639 | 0.210 | 0.003 |
| rate of change | 0.094 | 0.053 | 0.566 | 0.249 | 0.038 | ||
| groundwater level | cumulative value | 0.098 | 0.211 | 0.132 | 0.073 | 0.486 | |
| rate of change | 0.120 | 0.299 | 0.166 | 0.085 | 0.330 | ||
| pile horizontal displacement | cumulative value | 0.089 | 0.015 | 0.661 | 0.225 | 0.011 | |
| rate of change | 0.059 | 0.000 | 0.484 | 0.223 | 0.233 | ||
| C18 | surface settlement | cumulative value | 0.226 | 0.628 | 0.060 | 0.083 | 0.003 |
| rate of change | 0.238 | 0.669 | 0.019 | 0.070 | 0.004 | ||
| groundwater level | cumulative value | 0.103 | 0.240 | 0.240 | 0.094 | 0.323 | |
| rate of change | 0.257 | 0.592 | 0.012 | 0.061 | 0.078 | ||
| pile horizontal displacement | cumulative value | 0.234 | 0.691 | 0.005 | 0.061 | 0.010 | |
| rate of change | 0.235 | 0.687 | 0.009 | 0.065 | 0.005 |
| Model | m(Safe) | m(Yellow) | m(Orange) | m(Alarm) | m(Θ) | Model Levels | Actual Levels |
|---|---|---|---|---|---|---|---|
| E1 | 0.099 | 0.191 | 0.248 | 0.094 | 0.368 | orange | yellow |
| k1 = 0.967, k2 = 0.947 | |||||||
| E2 | 0.197 | 0.705 | 0.037 | 0.059 | 0.002 | yellow | yellow |
| k1 = 0.8, k2 = 0.833 | |||||||
| E3 | 0.098 | 0.201 | 0.227 | 0.088 | 0.386 | orange | yellow |
| k1 = 0.9, k2 = 0.958 | |||||||
| D-S | 0.655 | 0.128 | 0 | 0.123 | 0.094 | safe | yellow |
| Method in this paper | 0.133 | 0.537 | 0.163 | 0.075 | 0.092 | yellow | |
Disclaimer/Publisher’s Note: The statements, opinions and data contained in all publications are solely those of the individual author(s) and contributor(s) and not of MDPI and/or the editor(s). MDPI and/or the editor(s) disclaim responsibility for any injury to people or property resulting from any ideas, methods, instructions or products referred to in the content. |
© 2025 by the authors. Licensee MDPI, Basel, Switzerland. This article is an open access article distributed under the terms and conditions of the Creative Commons Attribution (CC BY) license (https://creativecommons.org/licenses/by/4.0/).
Share and Cite
Zeng, J.; Wu, B.; Liu, C. Pit Collapse Risk Fusion Early-Warning Method Based on Machine Learning and Improved Cloud Dempster–Shafer. Appl. Sci. 2025, 15, 7571. https://doi.org/10.3390/app15137571
Zeng J, Wu B, Liu C. Pit Collapse Risk Fusion Early-Warning Method Based on Machine Learning and Improved Cloud Dempster–Shafer. Applied Sciences. 2025; 15(13):7571. https://doi.org/10.3390/app15137571
Chicago/Turabian StyleZeng, Jiajia, Bo Wu, and Cong Liu. 2025. "Pit Collapse Risk Fusion Early-Warning Method Based on Machine Learning and Improved Cloud Dempster–Shafer" Applied Sciences 15, no. 13: 7571. https://doi.org/10.3390/app15137571
APA StyleZeng, J., Wu, B., & Liu, C. (2025). Pit Collapse Risk Fusion Early-Warning Method Based on Machine Learning and Improved Cloud Dempster–Shafer. Applied Sciences, 15(13), 7571. https://doi.org/10.3390/app15137571