Abstract
The materials typically used for radiation shielding include lead, concrete, and polymers. However, some of these materials can be toxic or very expensive to produce. This raises interest in using more readily available natural materials, such as rocks, as an alternative. In this study, we analyzed the radiation shielding efficiency of sandstones. We evaluated different layers of rock and obtained shielding parameters based on the composition of various oxides. The analysis revealed that these layers showed a predominance of silicon and aluminum oxides. Notably, the lowest photon energies (0.015 MeV and 0.1 MeV) displayed significant differences in photon attenuation, as indicated by linear and mass attenuation coefficients. This suggests that the chemical composition of the samples had a considerable impact on their shielding performance. Samples containing higher amounts of heavier elements proved to be more effective at attenuating radiation, efficiently reducing 50% (half-value layer) and 90% (tenth-value layer) of the photons. Additionally, the presence of these heavier elements decreased the production of secondary photons (buildup factor), further enhancing the samples’ efficiency in shielding against radiation. Our results indicate that sandstones hold potential for radiation shielding, particularly when they contain higher quantities of heavier elements.
1. Introduction
The use of radioactive sources in various applications, including medical imaging, radiation therapy, and industrial processes, requires effective radiation shielding [1]. A range of materials is available for this purpose, including lead, concrete, rocks, and polymers [2,3]. Typically, materials that are denser and consist of elements with high atomic numbers are preferred [4]. However, some of these materials, such as lead and concrete, can be toxic, heavy, and costly, and they may deteriorate over time. Therefore, it is essential to explore alternative materials for radiation shielding.
One of the significant challenges facing our planet is the production of radioactive waste by the nuclear industry and power plants. The increasing demand for safe radioactive waste management highlights the need to explore alternative methods to protect humans from the harmful effects of radiation [5]. Therefore, it is essential to identify materials that can effectively shield against radiation, especially from photons. Rocks present a compelling alternative for this purpose, as they are composed of materials with moderate atomic numbers [6,7]. Furthermore, rocks are abundant and less expensive compared to synthetic materials, such as polymers. This widespread availability facilitates the construction of remote storage facilities. Another advantage of using rocks is that they can be combined with other materials to create composite materials, which can enhance their effectiveness in radiation shielding [8,9,10].
Gamma and X-ray photons are often produced by medical equipment or emitted by radioactive sources, such as those found in radioactive waste. The effectiveness of different materials in shielding these photons varies based on the energies involved [11]. For rocks, the elemental composition is a key factor that affects radiation shielding. Additionally, the structure of the rock, which influences its density, plays a crucial role in determining how well it can shield radiation [12]. The presence of elements with higher atomic numbers improves a material’s ability to attenuate photons. Therefore, simulating how photons interact with rocks of various chemical compositions and structures is essential for understanding these materials’ effectiveness in radiation shielding.
To understand how materials shield against radiation, a crucial parameter to calculate is the linear attenuation coefficient (LAC). However, because the LAC depends on the material’s density, the mass attenuation coefficient (MAC) is more useful when comparing materials of different densities [13]. Other important parameters include the mean free path (MFP), the half-value layer (HVL), and the tenth-value layer (TVL). These parameters are essential for understanding how photons interact with matter. For instance, the HVL and TVL indicate the thicknesses of materials needed to attenuate 50% and 90% of photons, respectively [14].
In addition to the previously mentioned parameters, two key factors in quantifying the complex interactions between photons and matter are the energy buildup factor (EBF) and the exposure buildup factor (EABF). The EBF is defined as the ratio of the total photon energy fluence—comprising both primary and scattered photons—to the primary photon energy fluence at a specific point within a shielding material. On the other hand, the EABF represents the ratio of total exposure, which includes both primary and scattered photons, to exposure from primary photons alone at the same point within the shielding material [15]. In practical terms, the EBF indicates the increase in radiation dose due to secondary photons, while the EABF reflects the increase in exposure, demonstrating the amount of ionization in the air caused by these photons.
Very few studies have investigated the radiation shielding properties of sandstones [16,17], despite their potential relevance. Because the composition and structural features of sandstones can vary significantly based on their geological origin, it is essential to evaluate their radiation shielding effectiveness in specific regions. Although other studies have examined sandstones [17,18,19], the rocks analyzed in those studies often come from different origins and have different chemical compositions and structures. Our study focuses on analyzing sandstones that are relatively common in our study region and throughout Brazil. The abundance of this rock type makes it an interesting potential material for radiation shielding [20]. Therefore, the findings from our research will not only advance the understanding of alternative materials for radiation shielding but also aim to identify options that are both cost-effective and widely available.
The objectives of the study were as follows: (1) to determine the oxide content of sandstones from the same geological profile, (2) to examine how variations in the oxide composition and density of the samples impact the shielding parameters, (3) to identify the parameters that exhibit the most significant differences between the samples, and (4) to create reference data for selecting alternative materials for radiation shielding. It is important to mention that all analyses were conducted using computer simulations of the shielding parameters, which were based on the samples’ chemical composition and density data. This method was chosen because of the photon energies being studied and the unavailability of radioactive sources with sufficient activity for experimental measurements.
2. Materials and Methods
2.1. Study Area, Site Selection, and Rocky Sampling
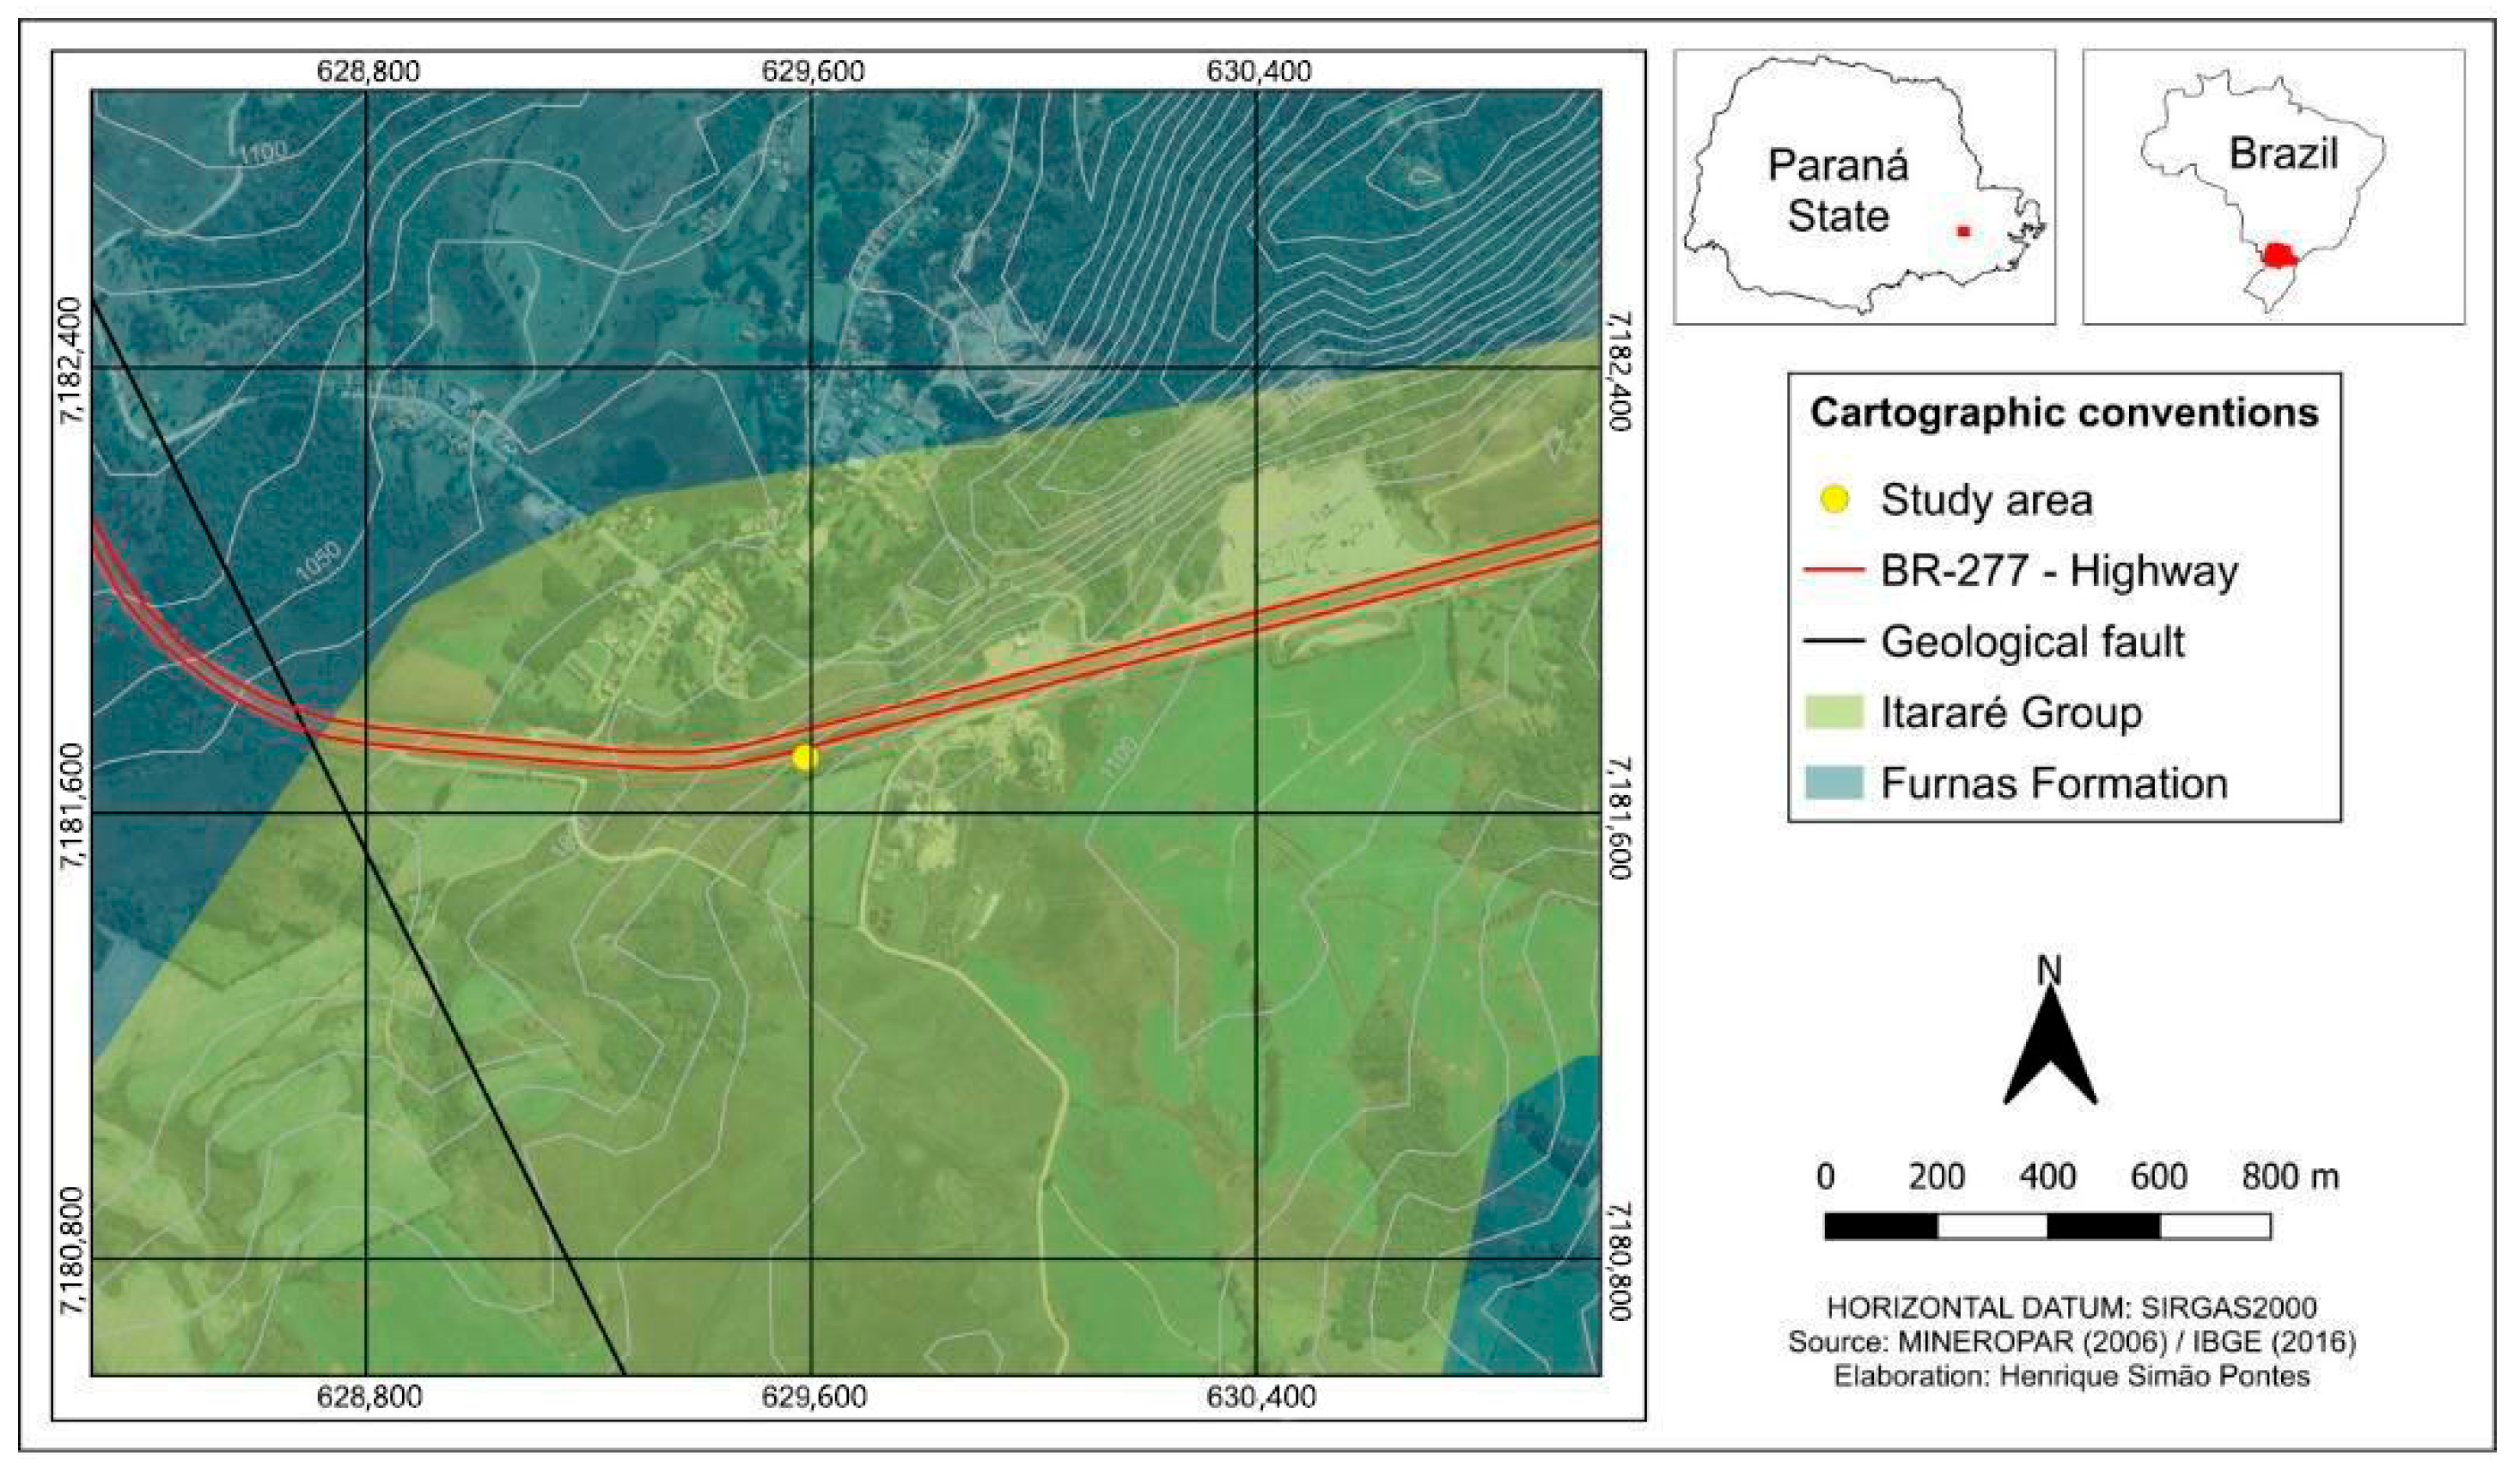
The study area consists of sandstones and diamictites from the Itararé Group, which dates back to the Carboniferous–Permian period. This formation is located in the Paraná Sedimentary Basin in southern Brazil [21]. At the research site, identified by UTM coordinates 7,181,700 and 629,590 (Figure 1), we observed diamictites, which are a mixture of sand and silt, along with layers of fine to medium sandstone. These sandstone layers are part of the Lagoa Azul Formation, also included in the Itararé Group. Both the sandstones and the diamictites show signs of weathering, indicated by the presence of iron oxide veins. The rocks exhibit vertical and sub-vertical fractures, while the sandstones are characterized by massive structures [22]. Additionally, the slope features a layer of young residual soil at the top and has an incline of approximately 90 degrees.
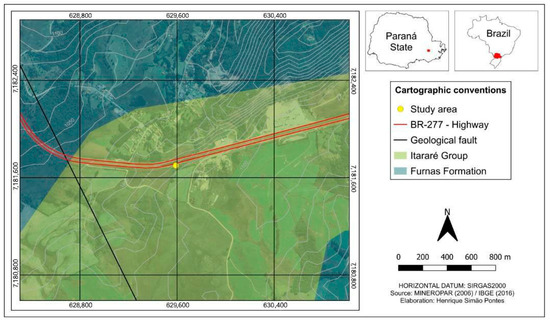
Figure 1.
Map showing the region where the samples were collected in Paraná State, Brazil.
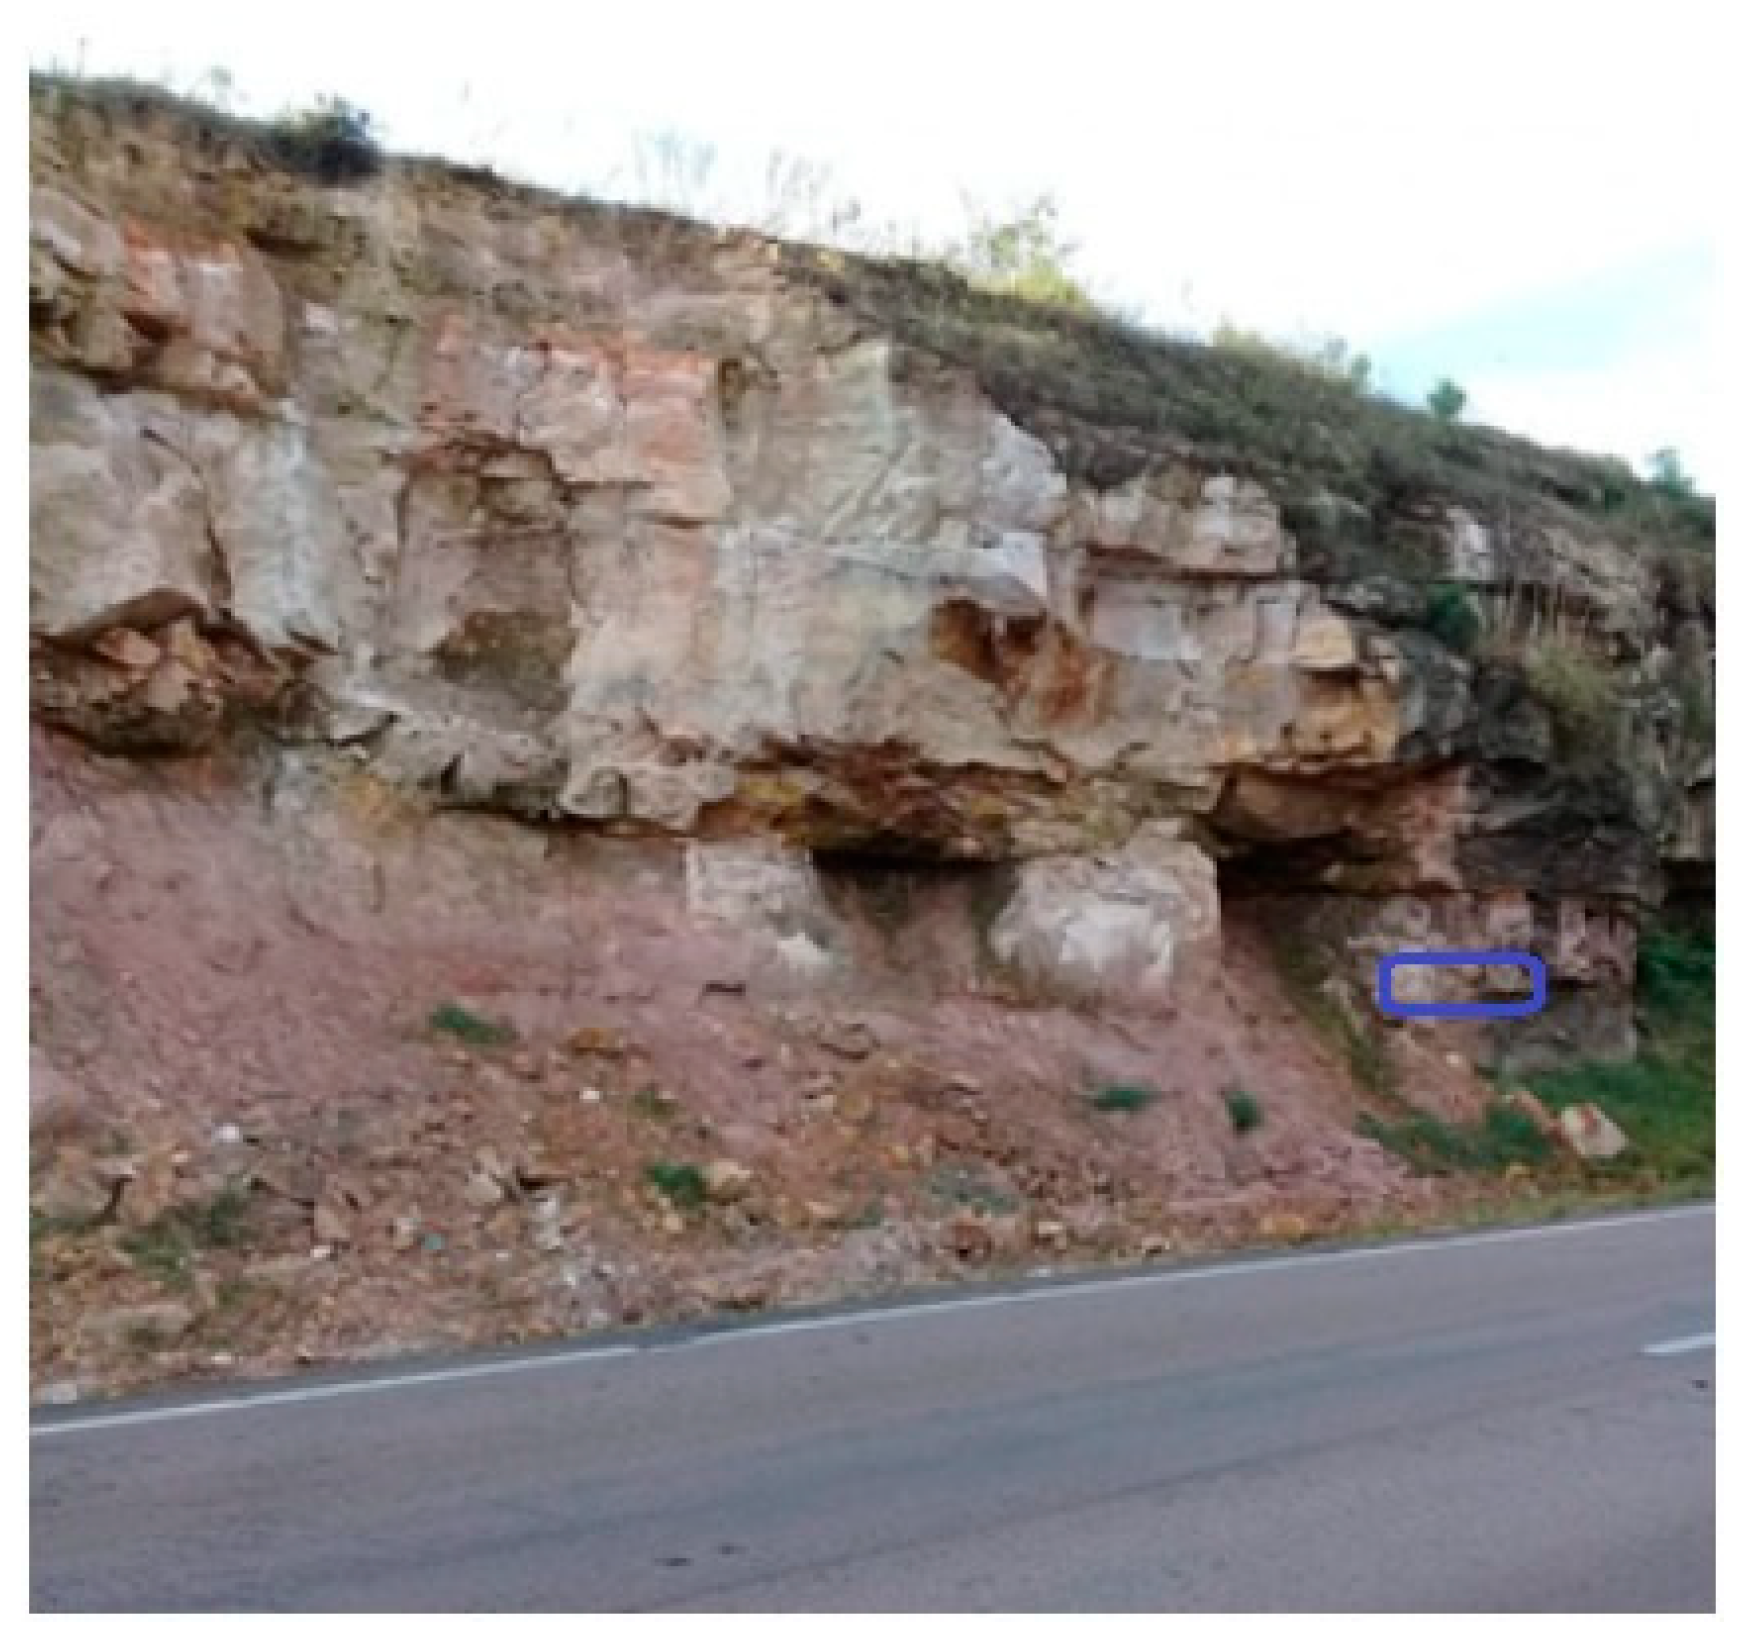
Rock samples were collected at various depths using specialized hammers and chisels designed for obtaining geological material. The samples were taken from the following depths, measured from the top of the rock (Figure 2): 13.97 m (AR4), 14.02 m (RMPS), 14.12 m (RMPI), 14.23 m (RMPS), 14.32 m (AR2), and 15.50 m (AR1).

Figure 2.
Photo showing the place where the rock samples were collected. The blue area represents where the samples were taken.
To determine the density of the samples, 15 mL volumetric flasks were utilized. The samples were initially sieved using a 2 mm mesh, which is standard for dry fine soil, and then ground to a particle size of approximately 45 μm using a mortar and pestle. This particle size was chosen for analyzing the chemical composition of the samples. The internal volume of the volumetric flask (Equation (1)) was calculated by filling it with water and applying the known density of water at the measured temperature.
where Vbv is the internal volume of the volumetric flask, is the density of the water at room temperature, and mbv is the mass of the dry and empty volumetric flask.
After drying the volumetric flask, it was filled with rock samples until it reached the same volume previously occupied by water during the internal volume measurement step. This allowed for the determination of density using the relation provided in Equation (2):
where represents the sandstone’s density.
2.2. Chemical Composition of the Samples
The oxide composition of the rock samples was obtained using an energy-dispersive X-ray fluorescence spectrometer. The equipment used was the EDX-720 model (Shimadzu, Kyoto, Japan), which contains a Rhodium (Rh) tube. The voltage varies from 5 to 50 kV, and the operating current of the filament ranges from 1 to 1000 μA. The equipment’s detection system consists of a Si(Li) semiconductor cooled with liquid nitrogen to −196 °C.
The measurements were carried out in triplicate (n = 3), consisting of approximately 2 g of sample for each measurement. The samples were dried in an oven at 105 °C for 24 h to remove residual moisture. Prior to measurement, the samples were passed through a sieve with a mesh diameter of 2 mm and then reduced to a diameter of 45 μm through maceration using a mortar and pestle. These samples were placed in sample holders supplied by the equipment manufacturer and covered with Mylar film (6 μm thick).
Before measuring the chemical composition of the samples, the detector was calibrated using the A750 standard [23], which is primarily composed of aluminum (98%) and was provided by the equipment manufacturer. The energy and full width at half maximum (FWHM) were calibrated during this process. To confirm the accuracy of the detector’s calibration, we analyzed the chemical composition of the standard. However, we did not calibrate for other elements due to the unavailability of quality standards.
The measurement time for each sample was 100 s in the Na-Sc (15 kV voltage) and Ti-U (50 kV voltage) energy ranges. The measurements were carried out under atmospheric pressure in a semi-quantitative mode. After the measurements, the data were obtained in the form of oxides as well as elements. However, only the data in oxide form were used to calculate the interaction parameters.
2.3. Radiation Shielding Parameters
The radiation shielding parameters were theoretically simulated using Phy-X PSD, a free code developed by Şakar et al. [24], which allows for the calculation of radiation shielding parameters over a broad range of energies. The software is Photon Shielding and Dosimetry (PSD) software. To conduct measurements utilizing the software, we firstly selected the appropriate data input form. For our analysis, we utilized the chemical composition measured by weight. Next, we entered the density of each sample. We chose an energy range of 0.015 MeV to 15 MeV (the standard grid). This energy range allows us to evaluate how different interaction effects, such as photoelectric absorption, incoherent scattering, and pair production, impact the attenuation of photons. We then selected the shielding parameters relevant to our study, including MAC, LAC, HVL, TVL, MFP, EBF, and EABF. Each sandstone sample for every layer was analyzed in triplicate, and we simulated the parameters for each sample independently.
The first parameter calculated was the mass attenuation coefficient using the mixture rule (Equation (3)):
where wi represents the weight fraction of the i-th constituent element of the absorber material and MACi represents the mass attenuation coefficient of each element of the absorber material.
After determining the MAC, the linear attenuation coefficient (Equation (4)) was calculated by multiplying the MAC by the rock’s density (). The density of the rock was obtained using the volumetric flask method (Equation (2)) after macerating the rocks and passing them through a 45 μm sieve. We also measured the particle density, which was later used to measure porosity. High-purity ethyl alcohol was used for the measurements. The average particle density (six samples) for the rock fragments was 2.53 ± 0.01 g cm−3.
The mean free path (Equation (5)), which represents the average distance a photon travels inside of the material until it interacts with one of its components, the half-value layer (Equation (6)), which indicates the thickness of material needed to attenuate 50% of the photons, and the tenth-value layer (Equation (7)), which refers to the thickness of material that attenuates 90% of the photons, were calculated as
To obtain the EBF and the EABF, the first step was to calculate the ratio (R) (Equation (8)) between the partial MAC due to the Compton Effect (incoherent scattering) and the total MAC:
The second step was to calculate the equivalent atomic number (Zeq) (Equation (9)) through interpolation using the following equation:
where Z1 and Z2 represent the atomic numbers of the elements corresponding to the radii R1 and R2 that satisfy the inequality R2 < R < R1 for photons of a given energy. The values of Zeq are used in the interpolation of the G-P fitting function coefficients (a, b, c, d, and Xk) of the analyzed absorber material through the following fitting function (Equation (10)):
where P represents the fitting function corresponding to Zeq and P1 and P2 represent the fitting values for Z1 and Z2, respectively.
The next step was to obtain the buildup factor B as a function of the primary photon energy and the depth in MFP for both the EBF and the EABF, starting from the G-P fitting function parameters:
where the parameters E and X represent the primary photon energy and the penetration depth. The parameter X varies from 1 to 40 MFP, and b is a fitting coefficient. The function K (Equation (13)), which depends on E and X, is calculated as follows:
where a, c, and d are fitting coefficients of the G-P function and Xk is a material-specific fitting parameter.
A single density measurement was taken for the different sandstone layers. However, as previously mentioned, each sandstone sample from each layer was measured in triplicate (n = 3) for the other parameters. Samples from each layer were collected from three different locations, and each of these samples was prepared for XRF analysis. The average values of each shielding parameter refer to the averages of the three measurements taken from each location, which is why the variability varies among the different sets of samples. To compare the results between the sandstone samples at the same energy level, we used the standard deviation of the mean as a measure of variability. When the bars intersected, we concluded that there were no significant differences between the samples. Results in graphs where the error bars are not visible do not mean that the data had no standard deviations but rather that their values were very small.
3. Results
The results of the elemental analysis (Table 1) indicate that the AR4 sample contained the highest amount of silicon oxide (SiO2). In contrast, the RMPS sample contained the lowest amount, with a difference of approximately 1.1 times between them. For aluminum oxide (Al2O3), the highest amounts were found in sample AR1 and the lowest in sample AR4, with a difference of approximately 1.2 times between them. For iron oxide (Fe2O3), the highest quantities were found in the RMPS sample, while the lowest quantity was found in the RMPP sample, with a difference of approximately 1.7 times between them. The other oxides (K2O, SO3, TiO2) had concentrations of less than 2%. It is also worth mentioning that other oxides were found, but their concentrations were very low. For this reason, we decided not to present their concentrations, as their contributions to the shielding parameters are negligible.

Table 1.
Chemical composition (wt. %), density, and porosity of the sandstone samples studied.
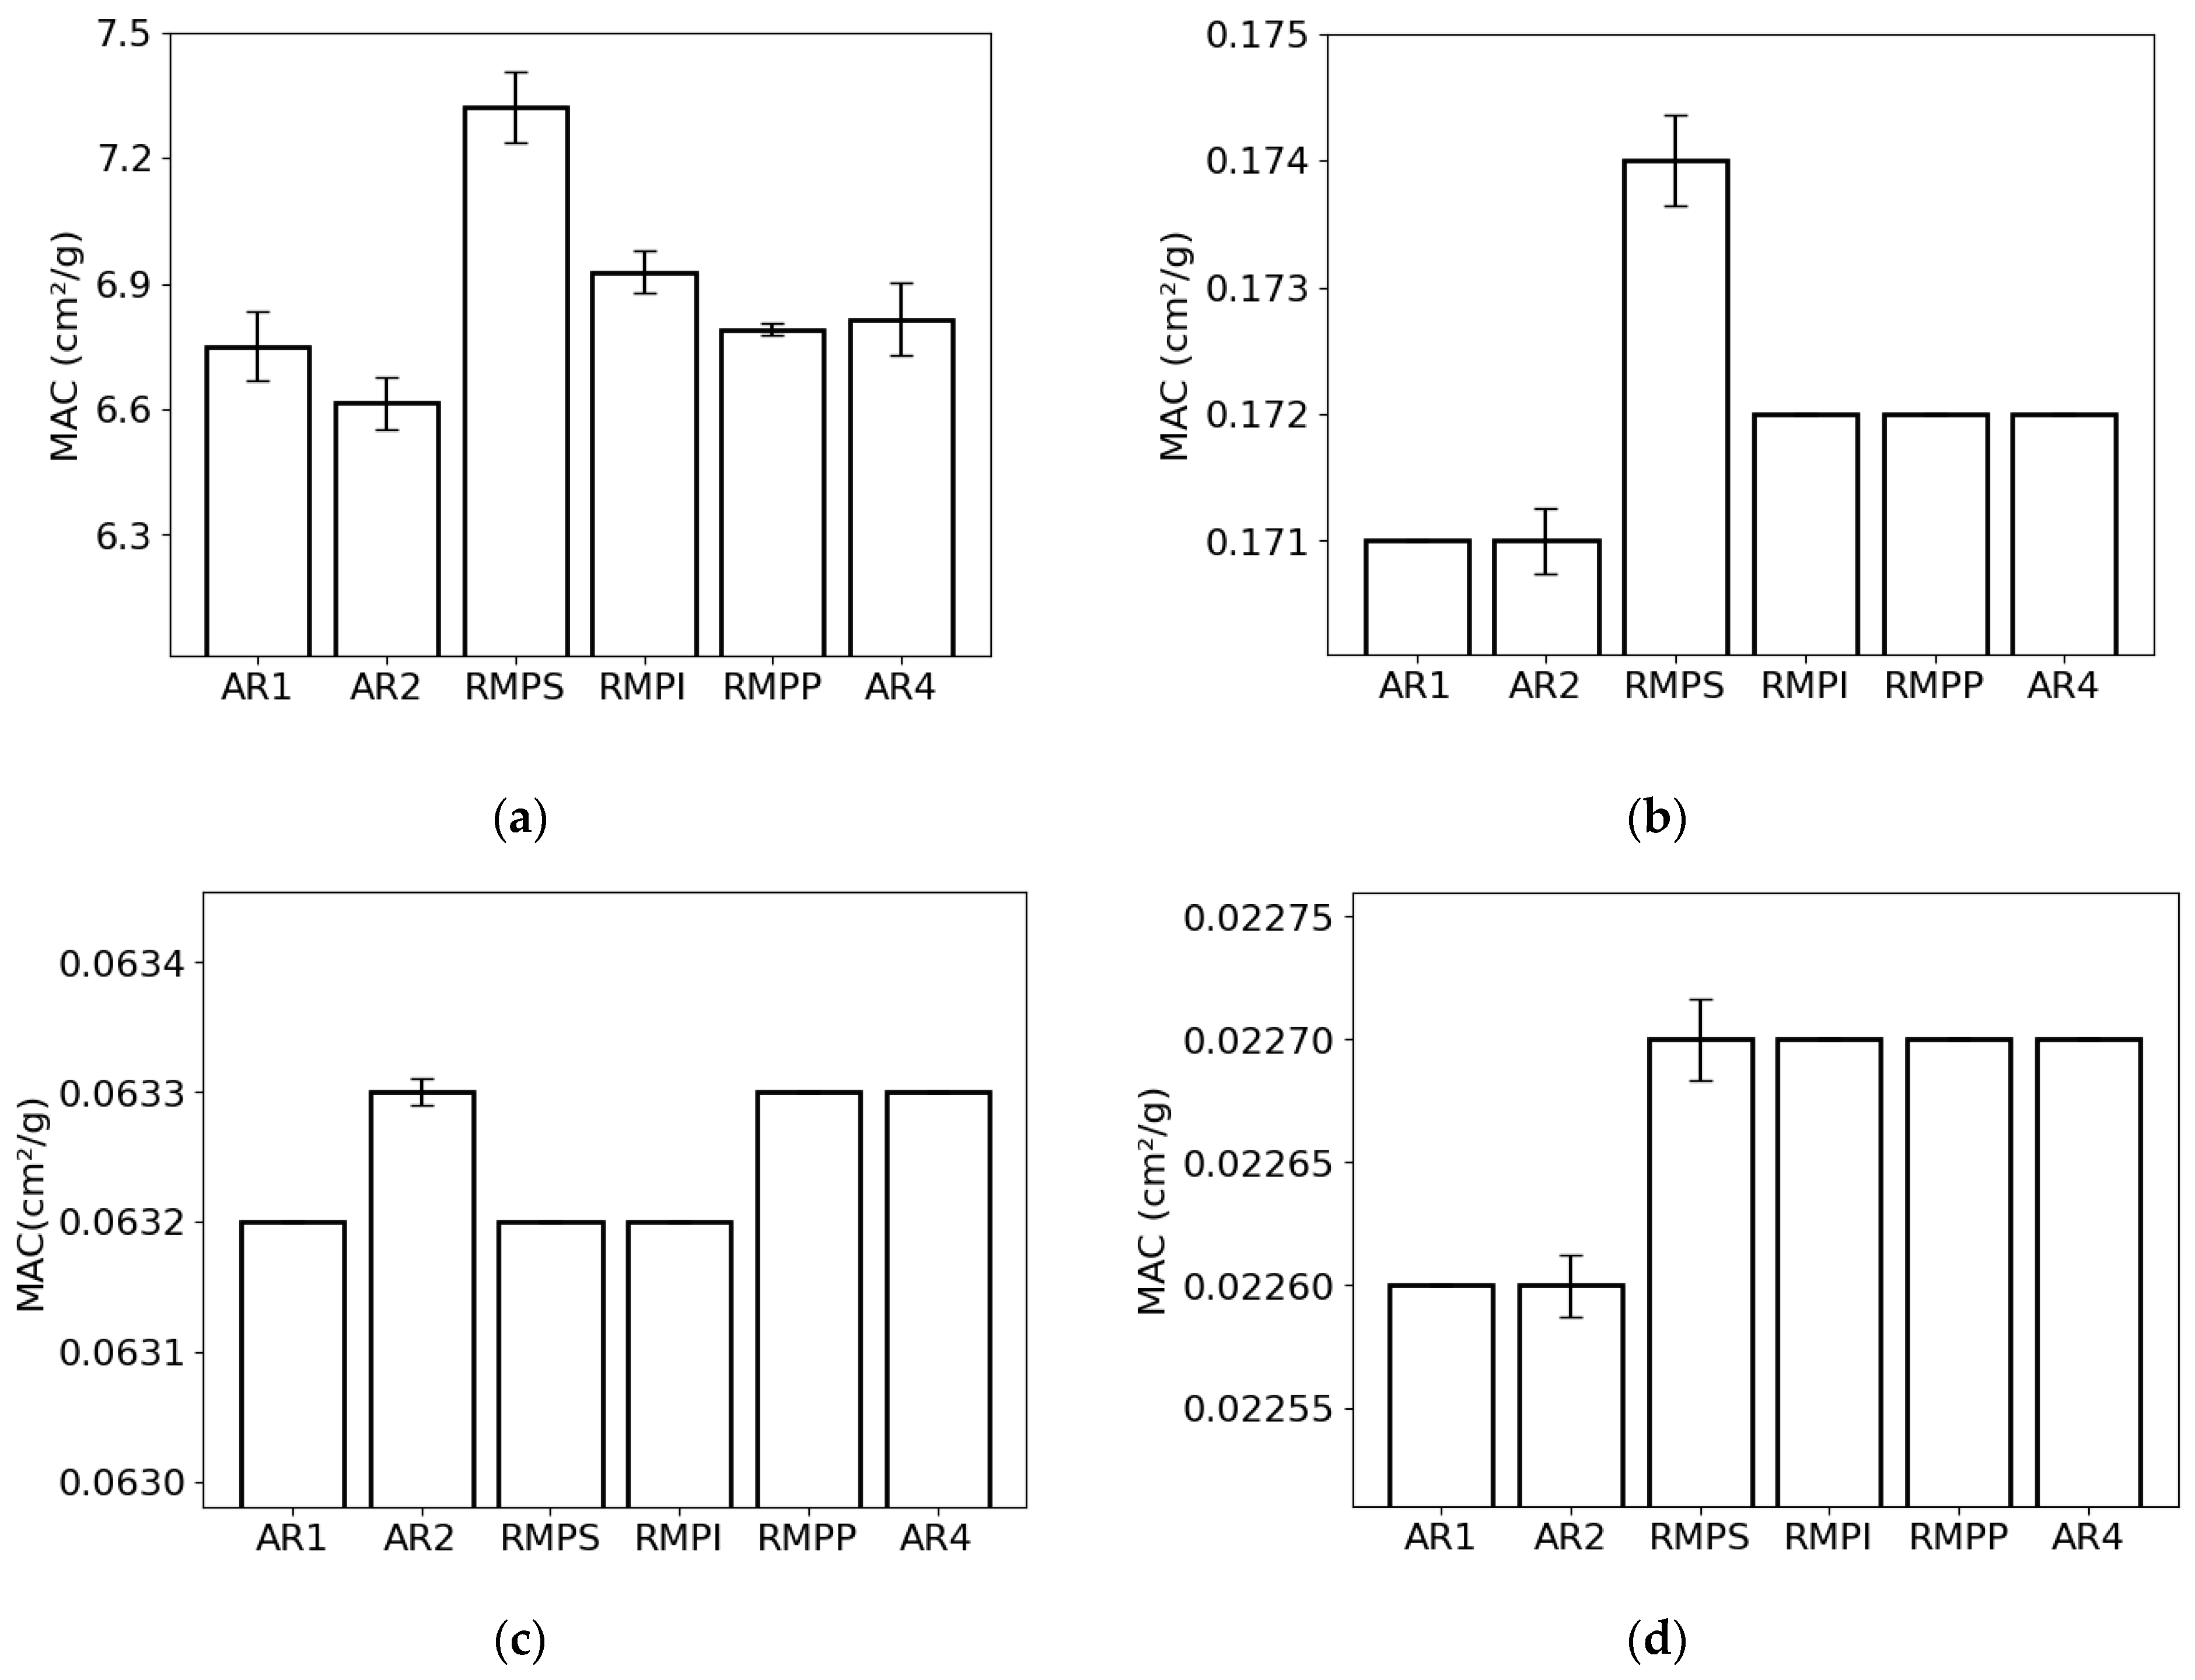
The mass attenuation coefficient for the lowest photon energy (0.015 MeV) was highest for RMPS (c. 7.3 cm2/g) and lowest for AR2 (c. 6.6 cm2/g) (Figure 3a). For the energy of 0.1 MeV (Figure 3b), RMPS (c. 0.174 cm2/g) showed the highest MAC, while the lowest was found for AR2 (c. 0.171 cm2/g). For photons with an energy of 1.0 MeV (Figure 3c), MAC values ranged from c. 0.0632 cm2/g (AR1, RMPS, RMPP) to c. 0.0633 cm2/g (AR2, RMPP, AR4). At the highest photon energy analyzed (10 MeV) (Figure 3d), the values found were c. 0.0226 cm2/g for samples AR1 and AR2 and c. 0.0227 cm2/g for the others. The deviations (error bars) observed for the lower photon energies in MAC are primarily attributed to variations in the oxide composition between repetitions for each rock sample studied. The differences in the deviations for the different energies are associated with the different effects (photoelectric absorption, incoherent scattering, and pair production) of photon attenuation.
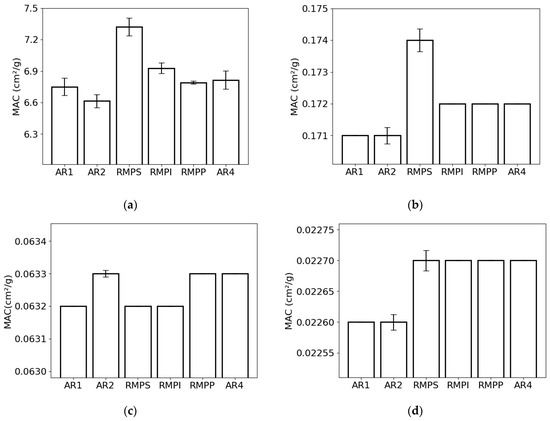
Figure 3.
Mass attenuation coefficient (MAC) of the different rock samples (AR1, AR2, RMPS, RMPI, RMPP, AR4) for the following photon energies: (a) 0.015 MeV, (b) 0.1 MeV, (c) 1 MeV, and (d) 10 MeV. The bars represent the standard deviation from the mean.
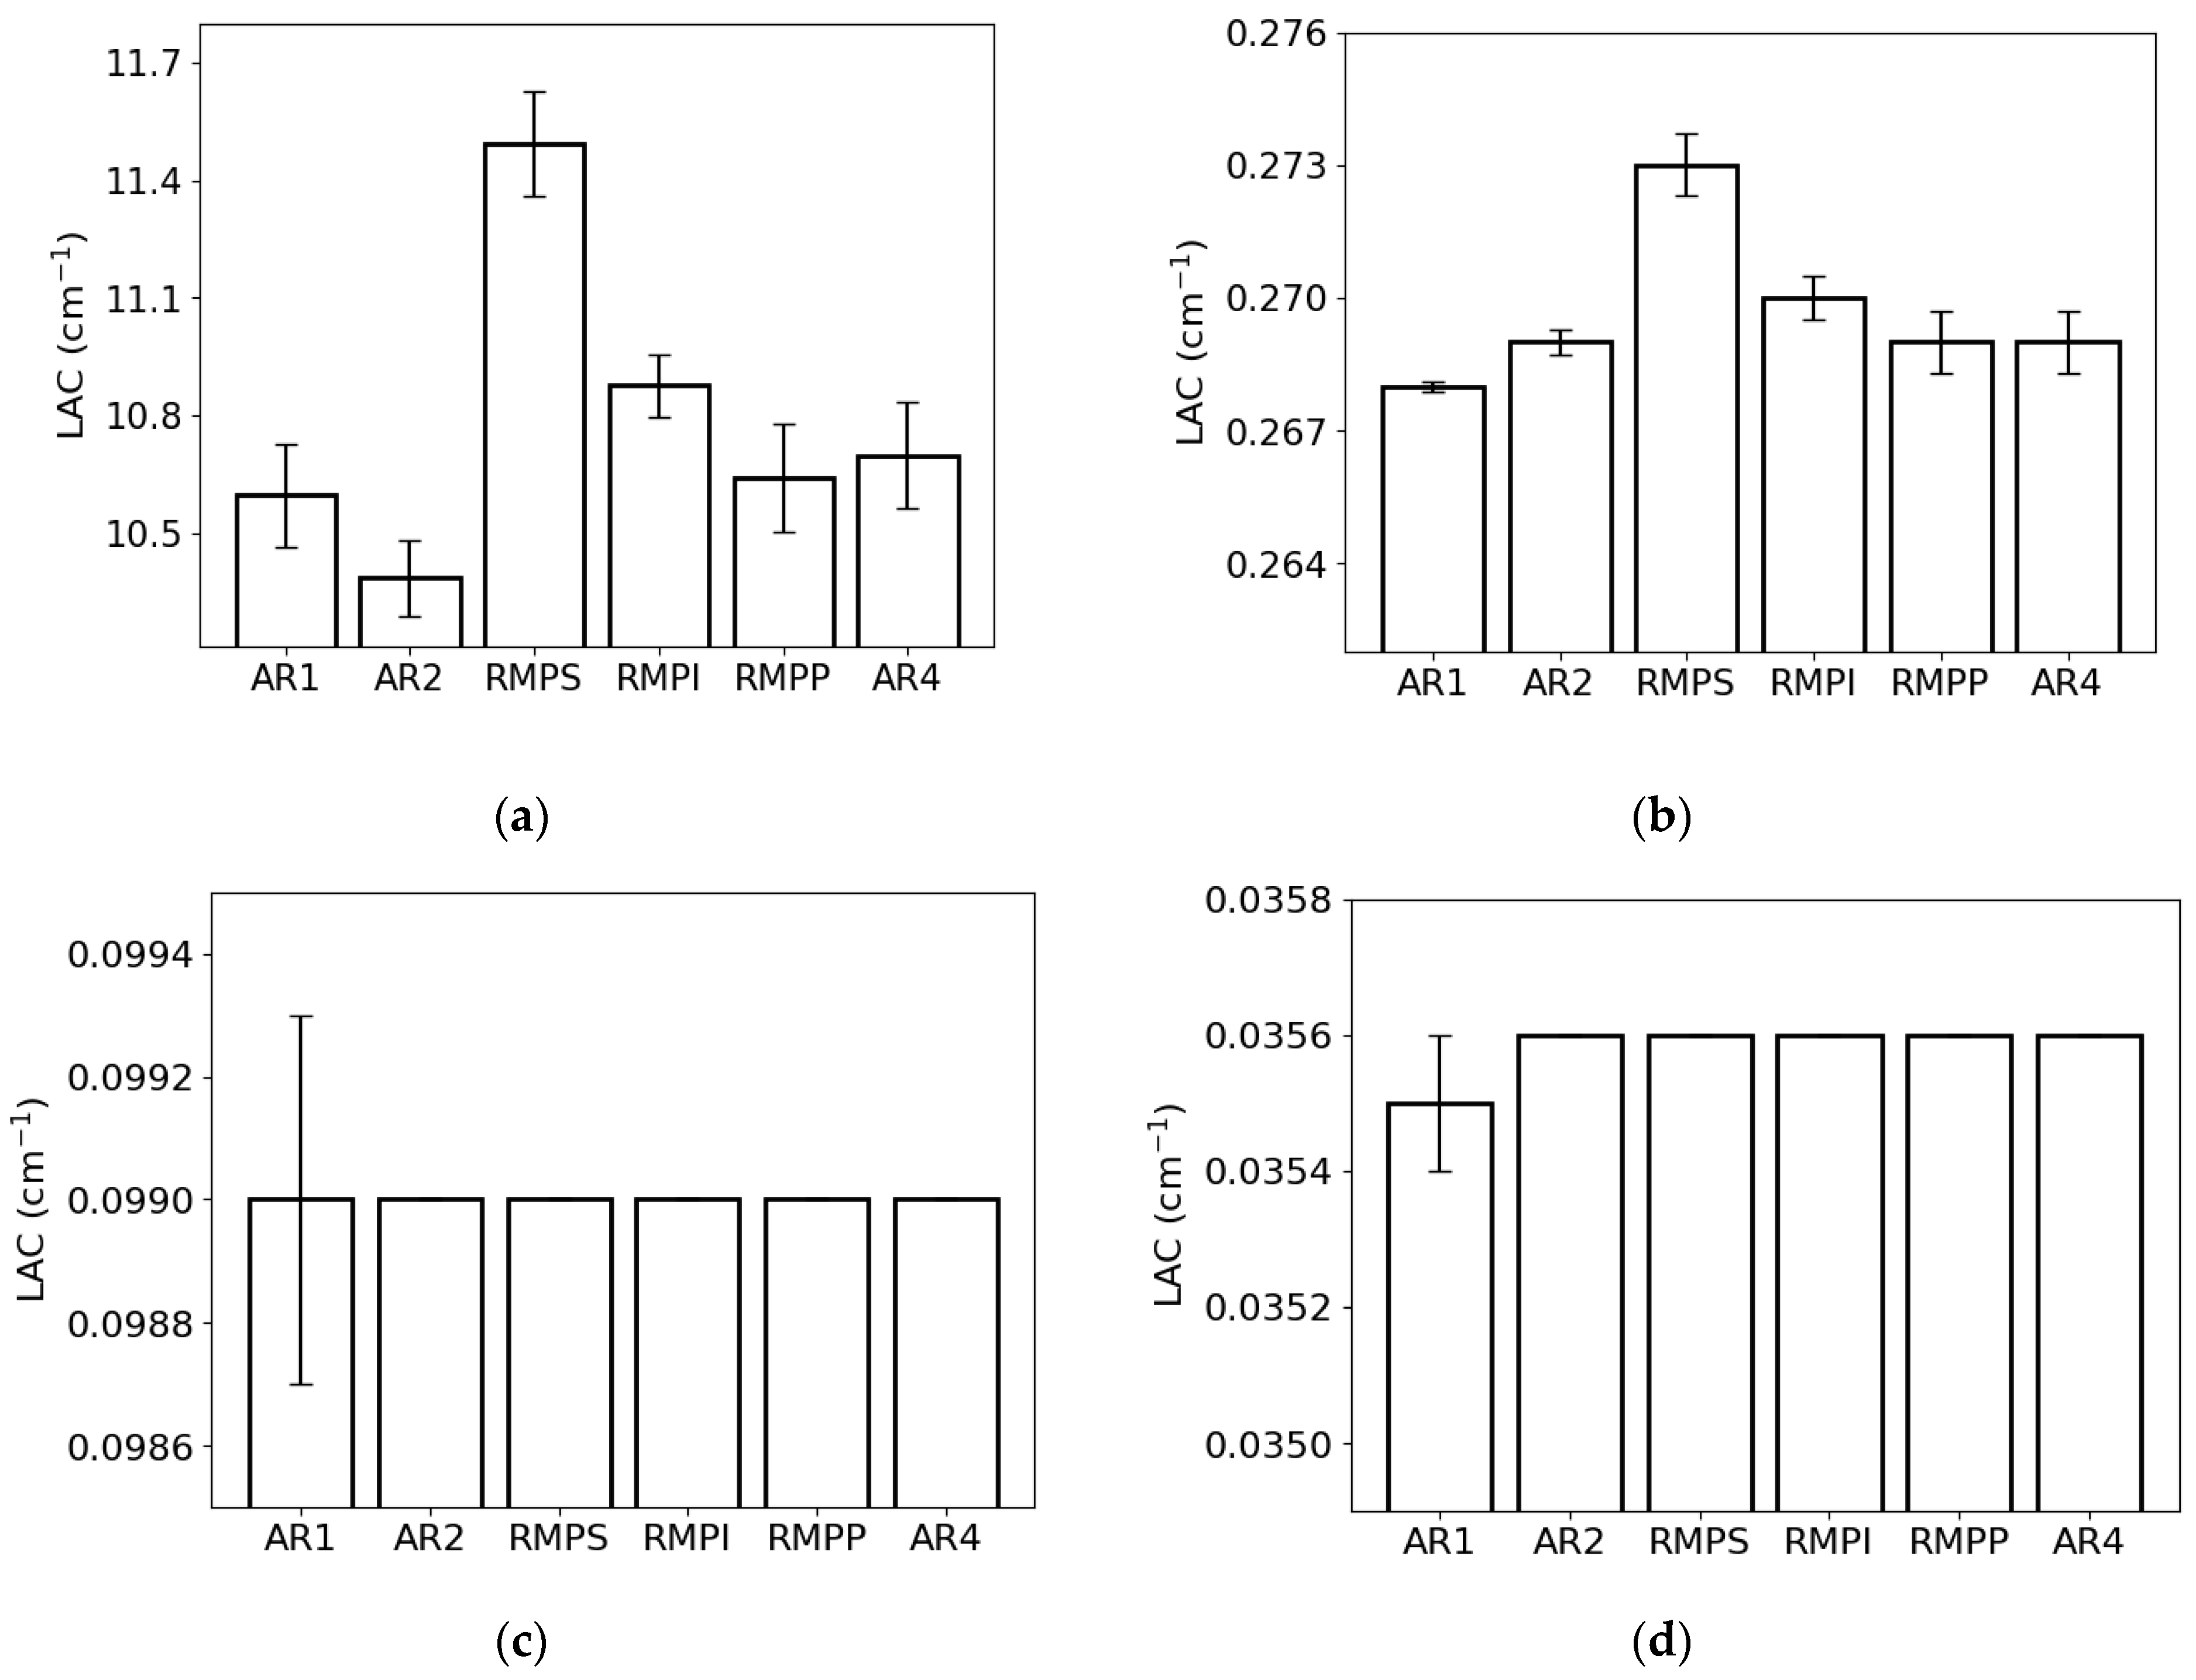
The LAC for the lowest photon energy (0.015 MeV) exhibited the greatest value for RMPS (c. 11.6 cm−1) and the least for AR2 (c. 10.4 cm−1) (Figure 4a). For the energy of 0.1 MeV (Figure 4b), the RMPS (c. 0.273 cm−1) demonstrated the highest LAC, while the lowest was observed for AR1 (c. 0.268 cm−1). For photons with an energy of 1.0 MeV (Figure 4c), all samples exhibited the same value of c. 0.099 cm−1. At the highest photon energy examined (10 MeV) (Figure 4d), only sample AR1 exhibited a value of c. 0.035 cm−1, whereas the remaining samples showed a value of c. 0.036 cm−1.

Figure 4.
Linear attenuation coefficient (LAC) of the different rock samples (AR1, AR2, RMPS, RMPI, RMPP, AR4) for the following photon energies: (a) 0.015 MeV, (b) 0.1 MeV, (c) 1 MeV, and (d) 10 MeV. The bars represent the standard deviation from the mean.
The lowest and highest MFP values for the lowest photon energy were observed in RMPS (c. 0.087 cm) and AR2 (c. 0.096 cm) (Figure 5a), respectively. For the energy of 0.1 MeV (Figure 5b), the lowest MFP value was found for RMPS (c. 3.67 cm), while the highest was found for AR1 (c. 3.73 cm). For the 1 MeV photons (Figure 5c), the AR2 samples (c. 10.06 cm) showed the lowest MFP values, and the RMPS samples (c. 10.07 cm) had the highest. For the highest photon energy studied (10 MeV) (Figure 5d), the lowest MFP values were found for RMPS (c. 28.01 cm) and the highest for AR1 (c. 28.15 cm).
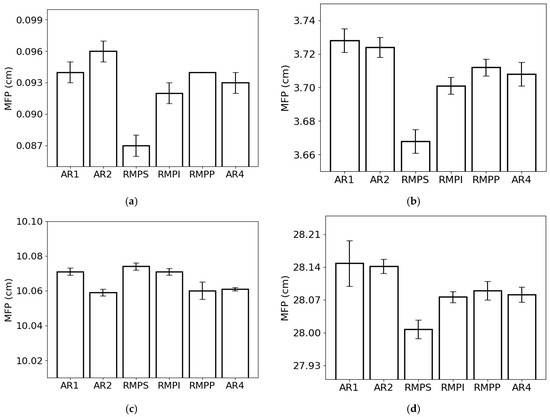
Figure 5.
Mean free path (MFP) of the different rock samples for the following photon energies: (a) 0.015 MeV, (b) 0.1 MeV, (c) 1 MeV, and (d) 10 MeV. The bars represent the standard deviation from the mean.
The HVL (Figure 6) followed the same trend as the MFP. This result was expected, as both parameters are inversely proportional to LAC. The lowest and highest HVL values for the lowest photon energy were observed in RMPS (c. 0.060 cm) and AR2 (0.067 cm), respectively (Figure 6a). For the energy of 0.1 MeV (Figure 6b), RMPS showed the lowest HVL value (c. 2.54 cm), while AR1 showed the highest (c. 2.58 cm). For 1 MeV photons (Figure 6c), the RMPS samples (c. 6.98 cm) had the highest HVL values, and the AR2 samples (c. 6.97 cm) had the lowest. For the highest studied photon energy (10 MeV) (Figure 6d), the lowest HVL values were found for the RMPS samples (c. 19.41 cm), and the highest values were found for the AR1 samples (c. 19.51 cm).
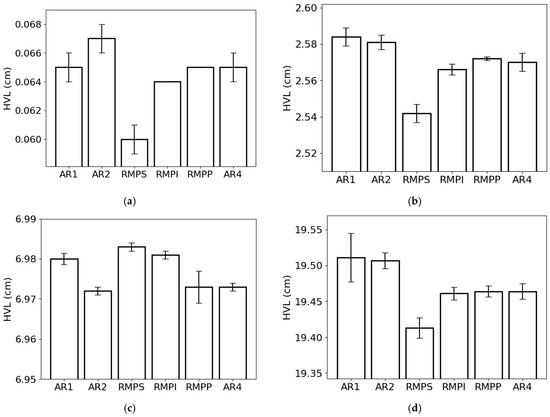
Figure 6.
Half-value layer (HVL) of the different rock samples (AR1, AR2, RMPS, RMPI, RMPP, AR4) for the following photon energies: (a) 0.015 MeV, (b) 0.1 MeV, (c) 1 MeV, and (d) 10 MeV. The bars represent the standard deviation from the mean.
The tenth-value layer (Figure 7) followed the same trend as HVL and MFP due to its dependence on LAC. When we analyze the lowest photon energy studied (0.015 MeV) (Figure 7a), we observe that the lowest TVL was obtained for RMPS (c. 0.20 cm), while the highest was obtained for AR2 (c. 0.22 cm), respectively. With the increment in photon energy (Figure 7b), the lowest and the highest TVL were found for RMPS (c. 8.45 cm) and AR1 (c. 8.58 cm). For the photon energy of 1 MeV (Figure 7c), the RMPS samples had the highest TVL (c. 23.20 cm), while the lowest was noted for the AR2 samples (c. 23.16 cm). For the highest photon energy studied (Figure 7d), similar to the findings of the previous two energies, RMPS (c. 64.5 cm) presented the lowest TVL and AR1 (c. 64.8 cm) the highest, respectively.
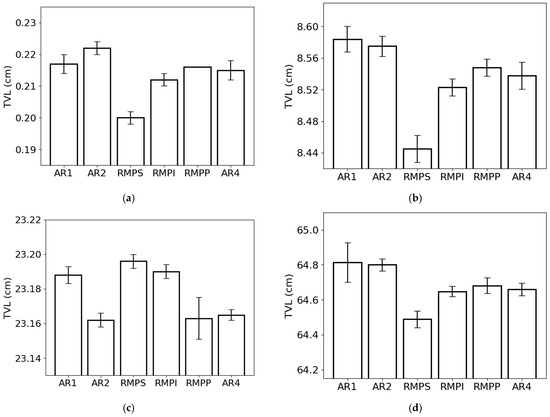
Figure 7.
Tenth-value layer (TVL) of the different rock samples (AR1, AR2, RMPS, RMPI, RMPP, AR4) for the following photon energies: (a) 0.015 MeV, (b) 0.1 MeV, (c) 1 MeV, and (d) 10 MeV. The bars represent the standard deviation from the mean.
The EBF (Figure 8) exhibited similar behavior across different photon energies for the rock samples. The lowest values were found at the lowest (<0.1 MeV) and highest (>1 MeV) photon energies. The most significant differences were observed in the region between 0.1 and 1 MeV for the various MFP values. The increase in MFP led to an increase in EBF. This parameter was practically unaffected for 1 MFP. When comparing samples, the highest EBF values were found for AR2 (Figure 8b) with maximum values (peaks) of c. 2.3 (1 MFP), c. 38 (10 MFP), c. 140 (20 MFP), c. 316 (30 MFP), and c. 568 (40 MFP). The lowest values were seen for RMPS (Figure 8c), with maximum values of c. 2.5 (1 MFP), c. 33 (10 MFP), c. 107 (20 MFP), c. 227 (30 MFP), and c. 398 (40 MFP).
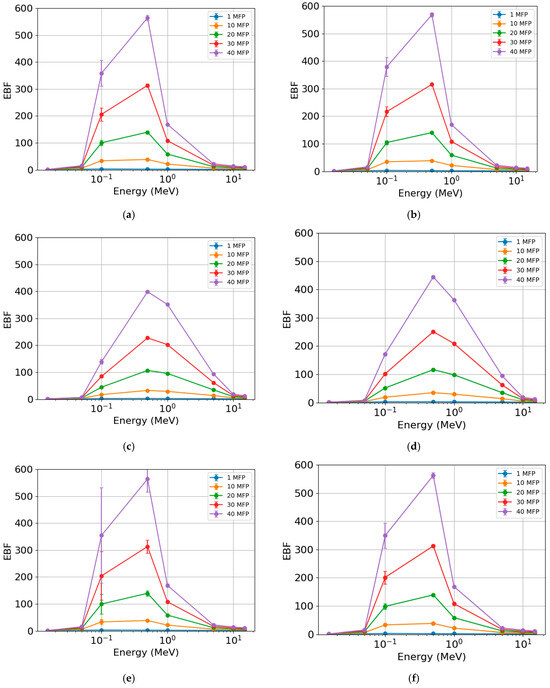
Figure 8.
Energy buildup factor (EBF) of the different rock samples: (a) AR1, (b) AR2, (c) RMPS, (d) RMPI, (e) RMPP, and (f) AR4. The bars represent the standard deviation from the mean.
The EABF (Figure 9) also showed similar behavior across different photon energies for the rock samples. The lowest values were found at the lowest (<0.1 MeV) and highest (>1 MeV) photon energies, respectively. The most significant differences were observed in the region between 0.1 and 1 MeV for the different MFP values. With the increase in MFP, there was an increase in EABF, with this parameter being practically insensitive for 1 and 10 MFP. When comparing samples, the highest EBF values were found for AR2 (Figure 9b), with maximum values (peaks) of c. 2.6 (1 MFP), c. 51 (10 MFP), c. 191 (20 MFP), c. 437 (30 MFP), and c. 791 (40 MFP). The lowest values were observed for RMPS (Figure 9c), with maximum values of c. 2.6 (1 MFP), c. 51 (10 MFP), c. 190 (20 MFP), c. 435 (30 MFP), and c. 787 (40 MFP).
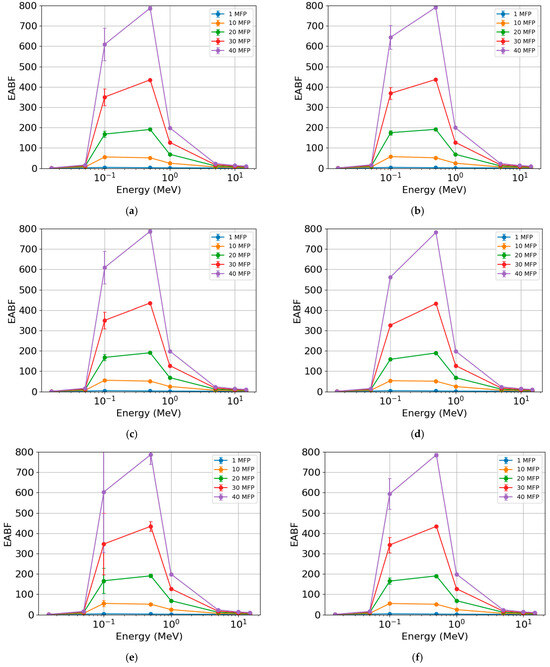
Figure 9.
Exposure buildup factor (EABF) of the different rock samples: (a) AR1, (b) AR2, (c) RMPS, (d) RMPI, (e) RMPP, and (f) AR4. The bars represent the standard deviation from the mean.
To analyze the impact of the chemical composition of the sandstones on the EBF and EABF parameters, we conducted a linear correlation analysis (Table 2). The EBF and EABF values selected for the correlation were those obtained at the peak (maximum value) in the incoherent scattering domain region (between 0.1 and 1 MeV). High to very high negative correlations were observed between EBF and the contents of Fe2O3 and K2O, ranging from −0.75 to −0.66 and −0.83 to −0.68, respectively. These results indicate that higher concentrations of these elements reduce the amount of scattered photons, favoring greater shielding capacity. Moderate negative correlations were also observed for Al2O3 and EBF, with values ranging from −0.47 to −0.49. In contrast, SiO2 exhibited a high positive correlation with EBF (0.68–0.69), suggesting that samples with higher silica content favor photon scattering. The titanium oxide showed low positive correlations with EBF (0.32–0.39). Regarding EABF (Table 2), only very low or low correlations were observed for Fe2O3, Al2O3, and SiO2, indicating that these oxides do not have a significant influence on this parameter. However, an increase in K2O content (showing a high negative correlation) reduces photon scattering in the studied sandstones. In contrast, an increase in SO3 and TiO2 content (showing a very high positive correlation) increases photon scattering, indicating a lower shielding capacity. However, it is important to note that the oxides K2O, SO3, and TiO2 (Table 1) make only a small contribution to the chemical composition of the sandstones studied. Therefore, the results of the correlation analysis should be interpreted cautiously.
Table 2.
Linear correlation analysis between the main oxides found in sandstones and EBF and EABF.
The interaction mechanisms responsible for MAC results in the studied sandstone samples are presented in Figure 10, which shows the average contribution of photoelectric absorption, incoherent scattering, and pair production at different photon energies. At 0.015 MeV, photoelectric absorption dominates the attenuation process, accounting for nearly 100% of the interactions. As the photon energy increases to 0.1 MeV, the relative contribution of photoelectric absorption decreases substantially, while incoherent scattering becomes the predominant mechanism, accounting for approximately 90% of the interactions. This trend continues at 1 MeV, where incoherent scattering accounts for virtually all interactions, and the contributions from both photoelectric absorption and pair production are negligible. At 10 MeV, although incoherent scattering remains the dominant interaction process, pair production contributes more significantly, accounting for approximately one-third of the total. To simulate the influence of different photon interaction processes on the MAC, we considered the average values of the chemical composition across all samples, as the differences between them were negligible. The error bars indicate the standard deviation, reflecting compositional variability.
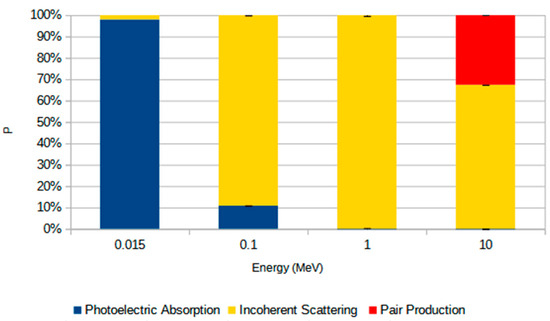
Figure 10.
Average relative contribution (P, %) of photon interaction mechanisms—photoelectric absorption (blue), incoherent scattering (yellow), and pair production (red)—at different photon energies (0.015, 0.1, 1, and 10 MeV). Values represent the mean percentage for all rock samples studied, and the error bars indicate the standard deviation from the mean.
To contextualize the shielding performance of the studied sandstones, we simulated the attenuation parameters for lead (Pb) and ASTM C150 Type I Portland cement (PC) for comparison (Table 3). The data for the cement were obtained from the article by Oluwaseun Azeez et al. [25]. As expected, lead—being a high-Z and high-density material (11.34 g/cm3)—exhibited the most effective photon attenuation across all energy levels. For example, at 0.015 MeV, Pb demonstrated MAC of c. 112 cm2/g and LAC of c. 1265 cm−1. In contrast, Portland cement, with a density of 3.15 g/cm3, displayed significantly lower values (MAC ≈ 18 cm2/g; LAC ≈ 58 cm−1), offering intermediate performance between lead and the sandstone samples we studied. This trend continues at higher photon energies. At 1.0 MeV, HVL and TVL for lead were c. 0.86 cm and c. 2.9 cm, respectively, while Portland cement required c. 3.5 cm (HVL) and c. 11.5 cm (TVL), confirming its lower, yet still practical, shielding performance. In comparison, the sandstone samples in our study exhibited lower attenuation capacity than both lead and cement. The values for the sandstone are closer to those of cement, with the differences primarily attributable to variations in the chemical composition of the samples, particularly their density. Notably, the density of the cement (Table 1) is nearly double that of the sandstone samples.
Table 3.
Comparison of attenuation parameters for lead (Pb) and ASTM C150 Type I Portland cement (PC) at selected photon energies (0.015, 0.1, 1.0, and 10 MeV). Parameters include the mass attenuation coefficient (MAC, cm2/g), linear attenuation coefficient (LAC, cm−1), mean free path (MFP, cm), half-value layer (HVL, cm), and tenth-value layer (TVL, cm). The values illustrate the difference in shielding effectiveness between a high-Z material (Pb) and a conventional low-Z construction material (Portland cement) across a wide photon energy range. The parameter values shown are approximate after rounding.
4. Discussion
The study presented here aimed to demonstrate that even minor changes in the chemical composition of sandstone samples can have a significant impact on their radiation shielding properties. The density of each sample was determined using the volumetric balloon method, which involved powdered rock samples, resulting in values ranging from 1.51 to 1.64 g/cm3. Therefore, the method used to measure the density of the samples takes into account the space between the particles and not just the particle density, for which the measured relative density was 2.53. Our values are lower than those reported by Zhou et al. [18] and Ramos et al. [26], which can be attributed to the porosity of the materials analyzed. Differences in chemical composition due to the origin of the rocks also explain the lack of agreement between studies.
Samples RMPI and RMPP exhibited the highest sandstone densities, indicating lower porosity. Although the mineralogical composition was not addressed in our study [27,28], which also influences sample density, our results highlight the importance of considering both chemical composition and structural characteristics when evaluating the shielding efficiency of natural rocks. However, it is essential to note that our study does not present experimental measurements, which would allow for a more in-depth exploration of the structural characteristics of the samples, such as the influence of porosity on attenuation. Our study presents a theoretical analysis of the shielding parameters based on data from the samples’ chemical composition and density.
The chemical composition of the samples is predominantly made up of silicon and aluminum oxides, with SiO2 being the major component, accounting for 66% to 74% of the weight. In rocks like sandstones, it is typical to find a high concentration of SiO2-rich minerals, such as quartz [29]. Smaller quantities of other elements were also detected, including Fe2O3, K2O, and TiO2. Marszałek et al. [30] reported that Fe2O3 levels range from 1.08% to 3.49% by weight, TiO2 from 0.01% to 0.27%, and K2O from 1.37% to 1.97%, which are comparable to the findings of our study. Furthermore, the research by Shao et al. [31] also indicates a predominance of SiO2 in sandstone’s composition; however, the Al2O3 content they measured was nearly half of what we found. Still, the values for Fe2O3, K2O, and TiO2 reported in their study align closely with our results. Other research on Brazilian sandstones from various formations has yielded results that are consistent with our findings, as well [28,29].
The results presented in Figure 3 and Figure 4 indicate that the mass attenuation coefficient and linear attenuation coefficient were influenced by the chemical composition of the samples [32]. At the lowest photon energies, samples with higher Fe2O3 content, such as RMPS and RMPI, demonstrated superior attenuation performance compared to samples like AR2. The higher density values listed in Table 1 for these samples help explain their increased LAC, especially at lower energies (0.015 and 0.1 MeV). This behavior is primarily due to the dominance of photoelectric absorption mainly at the lowest photon energies, where the chemical composition—particularly the presence of high atomic number elements, like iron—and density play a crucial role in photon attenuation. In contrast, aluminum and silicon oxides had minimal impact on the rocks’ attenuation properties. As shown by Angelone et al. [33], elements like iron have a high capacity for photon attenuation at low energies. Medhat et al. [13] also reported a positive correlation between MAC and Fe2O3 content, along with an inverse relationship between MAC and SiO2 content for photons with energy levels around 0.06 MeV. However, as photon energy increases (from 1 MeV to 10 MeV), both MAC and LAC show a decrease in photon attenuation, which is consistent with findings from several other studies involving rocks [6,34,35]. Another observation is the slight differences between MAC and LAC as photon energy increases. This can be explained by the fact that as photon energy rises, the likelihood of photons interacting with the samples decreases, making variations in chemical composition less significant. It is well known that when photon energy increases, denser materials are required to attenuate them. When the differences in density and chemical composition of the materials are minor, the variations in attenuation between samples become negligible [1,3,6,7].
The parameters of MFP (Figure 5), HVL (Figure 6), and TVL (Figure 7) exhibited the lowest values for the RMPS and RMPI samples at the lowest photon energies (0.015 MeV and 0.1 MeV). This finding aligns with the higher LAC values observed for these samples at lower energies, as MFP, HVL, and TVL are inversely related to LAC (see Equations (5)–(7)). In other words, a higher LAC in a sample results in a shorter distance that photons can travel, along with the necessary thicknesses to attenuate 50% and 90% of the radiation [36]. As the photon energy increases from 1 to 10 MeV, the differences between these parameters become less pronounced, with the lowest values generally observed for the RMPS samples. Abd El-Azeem and Harpy [37] reported similar HVL, LAC, and MAC values for sandstones at photon energies around 0.1 MeV and 1 MeV. Their sandstone samples contained higher amounts of SiO2 and Fe2O3 compared to our samples. The LAC and TVL values found in our study are comparable to those reported by Jaha et al. [38] for concrete samples at energies near 1 MeV, as concrete is commonly used for radiation shielding. Additionally, at approximately the same photon energy of 1 MeV, Khan et al. [39], who studied rocks from the Jabal Elham mountain, found LAC, MFP, HVL, and TVL values similar to those observed in our research. This suggests that the sandstones we investigated exhibit attenuation characteristics comparable to those of other rock types.
The greater sensitivity of the shielding parameters (LAC, MAC, MFP, HVL, and TVL) to the chemical composition and density of the samples at lower photon energies (0.015 MeV and 0.1 MeV) is associated with the process responsible for attenuating the photons. At lower energies, the most important process is photoelectric absorption, which is dependent on Z4−5 [40,41,42]. For this reason, slight variations in the chemical composition of the samples, particularly in the heavier elements, have a greater impact on the shielding parameters [43]. For energies where incoherent scattering becomes the primary interaction mechanism (E > 0.1 MeV), the rock’s chemical composition becomes less significant [44]. This effect has only a linear dependence on Z [38,45,46]. At 10 MeV, the shielding parameters again exhibit greater differences between samples, but these differences are still less pronounced than those observed at the smallest photon energies. This result is mainly associated with the production of pairs that begins to occur for photons greater than 1.02 MeV [44]. This effect is dependent on Z2 [37,38], which explains why the shielding parameters become more sensitive to the chemical composition of the samples again [47]. Heavier elements have a higher probability of undergoing the pair production effect, which accounts for almost 30% of the contribution of this effect to photon attenuation (Figure 10).
Both EBF and EABF (Figure 8 and Figure 9) demonstrate a clear dependence on the energy of the incident photons. In both low- and high-energy regions, the accumulation factors are at their lowest. This trend is linked to the predominant interaction mechanisms, such as photoelectric absorption and pair production [48]. In the low-energy range, where photoelectric absorption is most pronounced, the number of photons that are completely absorbed or removed is maximized. Consequently, photons are absorbed quickly [49]. This results in EBF and EABF values being close to one, indicating minimal scattering and no buildup [50]. In contrast, in intermediate energy regions where incoherent scattering is more significant, photons continue to interact with the material after their initial interaction with it. This leads to higher accumulation factors [51]. Multiple incoherent scattering events occur, which increase the EBF and EABF values [47]. Moreover, accumulation factors are affected by the depth of photon penetration. The deeper a photon penetrates the material, the lower the likelihood of significant interaction, resulting in reduced accumulation factors [52].
Correlation analysis confirmed that chemical composition differences significantly influence the buildup behavior of the sandstone samples (Table 2). High negative correlations were observed between Fe2O3 and EBF, as well as K2O and EBF. This indicates that samples with higher levels of these oxides, such as RMPS, tend to exhibit lower buildup values and, therefore, better shielding performance. Conversely, SiO2 showed a positive correlation with EBF, supporting the observation that silica-rich samples, like AR2 and AR4, tend to have higher buildup factors. Regarding EABF, both TiO2 and SO3 demonstrated direct correlations with this parameter. This suggests that an increase in the amounts of these oxides corresponds to an increase in photon scattering. However, the small quantities of these oxides present in the samples, particularly in relation to SiO2 and Al2O3, mean that this finding should be approached with caution. Notably, EABF was not affected by variations in the iron oxide content of the sandstone samples studied. This suggests that air ionization is influenced more by the overall composition of the sample than by any single oxide in particular [53].
The previous literature supports our interpretations regarding EBF and EABF. Studies on basaltic rocks, such as those by Karabul et al. [53] and Bantan et al. [54], have shown variations in EBF and EABF that relate to the effective atomic number and interaction depth. Similarly, Rashwan et al. [55] reported higher buildup values in granitoids with increased silica content, consistent with the trends observed in our study. Elsafi et al. [50] emphasized the importance of iron-rich phases in enhancing photon attenuation, which leads to decreased buildup values—this aligns with our observations in samples like RMPS. The similarity in behavior among specific samples within the 0.1–1 MeV range, despite differing Fe2O3 content (for example, RMPS versus AR1), may be attributed to compensating effects from other oxides, such as Al2O3 and TiO2, as well as structural factors not solely explained by chemical composition.
In general, we observed that the heavier elements have a greater influence on the shielding parameters (MAC, LAC, MFP, HVL, and TVL), particularly at lower photon energies. The density of the sample was also a significant factor, particularly at lower photon energies. This result indicates that even slight differences in the chemical composition of the samples can significantly influence the shielding parameters. The Fe2O3 content between the highest and lowest concentrations found in the sandstones was approximately 1.6 times. In the case of K2O, this difference was approximately 4.5 times, although the concentration of this oxide was significantly lower than that of the major ones. Thus, for the lowest photon energies (0.015 MeV and 0.1 MeV), the RMPS samples represent the material with the highest shielding capacity, while AR2 represents the lowest. At 1 MeV, the AR2 sample exhibited slightly superior attenuation performance compared to the other samples. However, as photon energy increases, the RMPS sample tends to outperform the others, indicating improved shielding effectiveness at higher energies.
The increased energy of the photons requires thicker layers of material to shield them [56,57,58]. Considering the lowest (0.015 MeV) and highest (10 MeV) photon energies analyzed, along with the most suitable shielding materials, we found that c. 0.06 cm of material shields 50% of the photons, and c. 0.2 cm shields 90% for the first case and, in the second case, c. 19 cm (HVL) and c. 65 cm (TVL), respectively. Thus, 65 cm layers of sandstone are capable of shielding almost all of the photons considered to be high-energy. When considering EBF and EABF, we found that the RMPS sample yielded the best shielding results. The lower values of these parameters indicate better shielding performance, lower buildup, and greater photon absorption by the sample. This finding means that people are less exposed to scattered photons.
5. Conclusions
Our results indicate that even minor variations in the composition of sandstone oxides, particularly those with higher atomic numbers, such as Fe2O3, significantly affect the shielding properties of these rocks. Generally, samples containing larger quantities of heavier elements exhibited higher mass and linear attenuation coefficients. The density of the samples also influenced the latter. As a result, these samples required reduced material thicknesses (mean free path, half-value layer, and tenth-value layer) to effectively attenuate photons across various energy levels. At the lowest analyzed photon energy, the main differences between samples were primarily explained by photoelectric absorption, for which the chemical composition of the sandstones had an impact on the shielding parameters. In intermediate energy regions, such as 1 MeV, incoherent scattering explained the differences between samples, with less impact of the chemical composition on the results. For the highest energy (10 MeV), although incoherent scattering remained the dominant process, pair production influenced the shielding parameters, with differences in the chemical composition of the samples affecting these parameters.
Parameters related to photon scattering, such as EBF and EABF, exhibited effective shielding characteristics, particularly in samples with higher concentrations of heavier elements. Our findings indicate that the studied sandstone samples demonstrate satisfactory shielding capabilities, especially when compared to materials like cement. The results were simulated based on the chemical composition and density of bulk samples, while also considering their porosity. If we had chosen to analyze solely the powder form—suitable for producing compacted bricks—the performance of the evaluated sandstones could have potentially improved. Although various samples from different rock layers showed some variability in shielding effectiveness, all layers yielded close results in terms of shielding. Therefore, this study suggests that sandstone samples can be employed in their natural state or that material can be extracted from the rocks to produce blocks or be blended with other substances, such as concrete, to create more efficient photon attenuation materials.
It is essential to note that this study was conducted theoretically based on the chemical composition and density of the sandstone samples and without the use of experimental measurements. Factors like sample volume and mechanical properties—important for practical applications—were also not taken into account. Therefore, future research should include experimental studies and mechanical characterization to fully assess the suitability of the sandstone studied for radiation shielding in close-field conditions. We also need to mention that our results were obtained for a sandstone type common in Brazil; however, for other types of sandstones from other regions with different chemical compositions and structures, new simulations or measurements are necessary.
Author Contributions
Conceptualization, L.F.P. and I.S.M.; methodology, G.W.P. and I.S.M.; formal analysis, G.W.P.; investigation, G.W.P.; resources, L.F.P. and I.S.M.; writing—original draft, G.W.P. and L.F.P., writing—review and editing, G.W.P. and L.F.P., project administration, I.S.M. and L.F.P.; funding acquisition, L.F.P. All authors have read and agreed to the published version of the manuscript.
Funding
This research was partially funded by “Conselho Nacional de Desenvolvimento Científico e Tecnológico” (CNPQ) (Grant 303950/2023-4) and “Coordenação de Aperfeiçoamento de Pessoal de Nível Superior” (Capes) (Grant Code 001).
Institutional Review Board Statement
Not applicable.
Informed Consent Statement
Not applicable.
Data Availability Statement
The raw data supporting the conclusions of this article will be made available by the authors on request.
Acknowledgments
We thank FASCA (Laboratory of Physics Applied to Soils and Environmental Sciences) for the infrastructure for the XRF analyses.
Conflicts of Interest
The authors declare no conflicts of interest.
References
- Arif Sazali, M.; Alang Md Rashid, N.K.; Hamzah, K. A Review on Multilayer Radiation Shielding. IOP Conf. Ser. Mater. Sci. Eng. 2019, 555, 012008. [Google Scholar] [CrossRef]
- More, C.V.; Alsayed, Z.; Badawi, M.S.; Thabet, A.A.; Pawar, P.P. Polymeric composite materials for radiation shielding: A review. Environ. Chem. Lett. 2021, 19, 2057–2090. [Google Scholar] [CrossRef] [PubMed]
- Onaizi, A.M.; Amran, M.; Tang, W.; Betoush, N.; Alhassan, M.; Rashid, R.S.; Onaizi, S.A. Radiation-shielding concrete: A review of materials, performance, and the impact of radiation on concrete properties. J. Build. Eng. 2024, 97, 110800. [Google Scholar] [CrossRef]
- Abdo, A.E.S.; Ali, M.A.M.; Ismail, M.R. Natural fibre high-density polyethylene and lead oxide composites for radiation shielding. Radiat. Phys. Chem. 2003, 66, 185–195. [Google Scholar] [CrossRef]
- Pioro, L.S.; Sadovskiy, B.F.; Pioro, I.L. Research and development of a high-efficiency one-stage melting converter-burial-bunker method for vitrification of high-level radioactive wastes. Nucl. Eng. Des. 2001, 205, 133–144. [Google Scholar] [CrossRef]
- Al-Buriahi, M.S.; Sayyed, M.I.; Bantan, R.A.R.; Al-Hadeethi, Y. Nuclear radiation shielding characteristics of some natural rocks by using EPICS2017 library. Materials 2021, 14, 4669. [Google Scholar] [CrossRef]
- Masoud, M.A.; El-Khayatt, A.M.; Shahien, M.G.; Bakhit, B.R.; Suliman, I.I.; Zayed, A.M. Radiation Attenuation Assessment of Serpentinite Rocks from a Geological Perspective. Toxics 2022, 10, 697. [Google Scholar] [CrossRef]
- Ding, B.; Zhang, L.; Liu, J. Study on Shielding and Radiation Resistance of Basalt Fiber to Gamma Ray. Materials 2022, 15, 2522. [Google Scholar] [CrossRef]
- Abdullah, M.A.H.; Rashid, R.S.M.; Amran, M.; Hejazii, F.; Azreen, N.M.; Fediuk, R.; Voo, Y.L.; Vatin, N.I.; Idris, M.I. Recent Trends in Advanced Radiation Shielding Concrete for Construction of Facilities: Materials and Properties. Polymers 2022, 14, 2830. [Google Scholar] [CrossRef]
- Badarloo, B.; Lehner, P.; Bakhtiari Doost, R. Mechanical Properties and Gamma Radiation Transmission Rate of Heavyweight Concrete Containing Barite Aggregates. Materials 2022, 15, 2173. [Google Scholar] [CrossRef]
- Mansouri, E.; Mesbahi, A.; Malekzadeh, R.; Mansouri, A. Shielding Characteristics of Nanocomposites for Protection against X- and Gamma Rays in Medical Applications: Effect of Particle Size, Photon Energy and Nano-Particle Concentration. Radiat. Environ. Biophys. 2020, 59, 583–600. [Google Scholar] [CrossRef] [PubMed]
- Çelen, Y.Y.; Akkurt, I.; Ceylan, Y.; Atçeken, H. Application of Experiment and Simulation to Estimate Radiation Shielding Capacity of Various Rocks. Arab. J. Geosci. 2021, 14, 1471. [Google Scholar] [CrossRef]
- Medhat, M.E.; Demir, N.; Akar Tarim, U.; Gurler, O. Calculation of Gamma-Ray Mass Attenuation Coefficients of Some Egyptian Soil Samples Using Monte Carlo Methods. Radiat. Eff. Defects Solids 2014, 169, 706–714. [Google Scholar] [CrossRef]
- Akman, F.; Kaçal, M.R.; Sayyed, M.I.; Karataş, H.A. Study of Gamma Radiation Attenuation Properties of Some Selected Ternary Alloys. J. Alloys Compd. 2019, 782, 315–322. [Google Scholar] [CrossRef]
- Sayyed, M.I.; AlZaatreh, M.Y.; Dong, M.G.; Zaid, M.H.M.; Matori, K.A.; Tekin, H.O. A Comprehensive Study of the Energy Absorption and Exposure Buildup Factors of Different Bricks for Gamma-Rays Shielding. Results Phys. 2017, 7, 2528–2533. [Google Scholar] [CrossRef]
- Maruyama, I.; Meawad, A.; Kondo, T.; Sawada, S.; Halodova, P.; Fedorikova, A.; Ohkubo, T.; Murakami, K.; Igari, T.; Rodriguez, E.T.; et al. Radiation-Induced Alteration of Sandstone Concrete Aggregate. J. Nucl. Mater. 2023, 583, 154547. [Google Scholar] [CrossRef]
- Masoud, M.A.; El-Khayatt, A.M.; Marashdeh, M.W.; Shahien, M.G.; Bakhit, B.R.; Abdelwahab, W.; Abdel Rafea, M.; Zayed, A.M. Deep insights into the radiation shielding features of heavy minerals in their native status: Implications for their physical, mineralogical, geochemical, and morphological properties. Sustainability 2022, 14, 16225. [Google Scholar] [CrossRef]
- Zhou, Z.; Cai, X.; Chen, L.; Cao, W.; Zhao, Y.; Wei, L. Influence of Cyclic Wetting and Drying on Physical and Dynamic Compressive Properties of Sandstone. Eng. Geol. 2017, 220, 1–12. [Google Scholar] [CrossRef]
- He, W.; Chen, K.; Hayatdavoudi, A.; Sawant, K.; Lomas, M. Effects of Clay Content, Cement and Mineral Composition Characteristics on Sandstone Rock Strength and Deformability Behaviors. J. Pet. Sci. Eng. 2019, 176, 962–969. [Google Scholar] [CrossRef]
- Sérgio de Melo, M.; César Fonseca Giannini, P. Sandstone Dissolution Landforms in the Furnas Formation, Southern Brazil. Earth Surf. Process. Landf. 2007, 32, 2149–2164. [Google Scholar] [CrossRef]
- Vesely, F.F.; Delgado, D.; Spisila, A.L.; Brumatti, M. Divisão Litoestratigráfica Do Grupo Itararé No Estado Do Paraná. Bol. Parana. Geociênc. 2021, 78, 3–23. [Google Scholar] [CrossRef]
- Meneguzzo, I.S.; Pontes, H.S.; Ribeiro, A.G. Classificação e fatores condicionantes dos movimentos de massa em taludes de corte na BR 277- Balsa Nova, Paraná. Rev. SODEBRAS 2023, 18, 39–45. [Google Scholar] [CrossRef]
- A750 Standard; X-Ray Fluorescence (XRF) Standard Operating Procedure; Shimadzu EDX-720 X-Ray Fluorescence. SHIMADZU: Kyoto, Japan, 2006.
- Şakar, E.; Özpolat, Ö.F.; Alım, B.; Sayyed, M.I.; Kurudirek, M. Phy-X/PSD: Development of a User Friendly Online Software for Calculation of Parameters Relevant to Radiation Shielding and Dosimetry. Radiat. Phys. Chem. 2020, 166, 108496. [Google Scholar] [CrossRef]
- Oluwaseun Azeez, M.; Ahmad, S.; Al-Dulaijan, S.U.; Maslehuddin, M.; Abbas Naqvi, A. Radiation Shielding Performance of Heavy-Weight Concrete Mixtures. Constr. Build. Mater. 2019, 224, 284–291. [Google Scholar] [CrossRef]
- Ramos, P.F.O.; Stael, G.C.; Azeredo, R.B.; Ade, M.V.B.; Bergamaschi, S.; Lourenço, J.; Bermudez, S.L.B. Petrographic and Petrophysical Characterization of Sandstones from Rio Bonito Formation, Paraná Basin (Southern Brazil). An. Acad. Bras. Ciênc. 2024, 96, e20240365. [Google Scholar] [CrossRef]
- Hurst, A.; Archer, J.S. Sandstone Reservoir Description: An Overview of the Role of Geology and Mineralogy. Clay Miner. 1986, 21, 791–809. [Google Scholar] [CrossRef]
- Corrêa, J.C.; Cavallaro, F.A.; Garcia, R.H.; Santos, R.S.; Amade, R.A.; da Silva Bernardes, T.L.; Hamada, M.M. Chemical and physical analysis of sandstone rock from Botucatu formation. Braz. J. Radiat. Sci. 2021, 9, 1–19. [Google Scholar] [CrossRef]
- Montibeller, C.C.; Rafael, G.; Zanardo, A.; Rohn, R.; Roveri, C.D. Geochemistry of Siltstones from the Permian Corumbataí Formation from the Paraná Basin (State of São Paulo, Brazil): Insights of Provenance, Tectonic and Climatic Settings. J. S. Am. Earth Sci. 2020, 102, 102582. [Google Scholar] [CrossRef]
- Marszałek, M.; Alexandrowicz, Z.; Rzepa, G. Composition of Weathering Crusts on Sandstones from Natural Outcrops and Architectonic Elements in an Urban Environment. Environ. Sci. Pollut. Res. Int. 2014, 21, 14023–14036. [Google Scholar] [CrossRef]
- Shao, L.; Stattegger, K.; Garbe-Schoenberg, C.-D. Sandstone Petrology and Geochemistry of the Turpan Basin (NW China): Implications for the Tectonic Evolution of a Continental Basin. J. Sediment. Res. 2001, 71, 37–49. [Google Scholar] [CrossRef]
- Akkurt, I.; Mavi, B.; Akkurt, A.; Basyigit, C.; Kilincarslan, S.; Yalim, H.A. Study on Dependence of Partial and Total Mass Attenuation Coefficients. J. Quant. Spectrosc. Radiat. Transf. 2005, 94, 379–385. [Google Scholar] [CrossRef]
- Angelone, M.; Bubba, T.A.; Esposito, A. Measurement of the Mass Attenuation Coefficient for Elemental Materials in the Range 6 ≤ Z ≤ 82 Using X-Rays from 13 up to 50 Kev. Appl. Radiat. Isot. 2001, 55, 505–511. [Google Scholar] [CrossRef]
- Han, I.; Demir, L.; Şahin, M. Determination of Mass Attenuation Coefficients, Effective Atomic and Electron Numbers for Some Natural Minerals. Radiat. Phys. Chem. 2009, 78, 760–764. [Google Scholar] [CrossRef]
- Obaid, S.S.; Sayyed, M.I.; Gaikwad, D.K.; Pawar, P.P. Attenuation Coefficients and Exposure Buildup Factor of Some Rocks for Gamma Ray Shielding Applications. Radiat. Phys. Chem. 2018, 148, 86–94. [Google Scholar] [CrossRef]
- Sayyed, M.I.; Issa, S.A.M.; Auda, S.H. Assessment of Radio-Protective Properties of Some Anti-Inflammatory Drugs. Prog. Nucl. Energy 2017, 100, 297–308. [Google Scholar] [CrossRef]
- Abd El-Azeem, S.A.; Harpy, N.M. Radioactive Attenuation Using Different Types of Natural Rocks. Materials 2024, 17, 3462. [Google Scholar] [CrossRef] [PubMed]
- Jaha, N.; Islam, G.S.; Kabir, M.F.; Khandaker, M.U.; Chowdhury, F.-U.-Z.; Bhuian, A.S.I. Ionizing Radiation Shielding Efficacy of Common Mortar and Concrete Used in Bangladeshi Dwellings. Case Stud. Constr. Mater. 2022, 17, e01547. [Google Scholar] [CrossRef]
- Khan, A.; Al alhareth, A.; Mobark, S.; Al-Mahri, W.; Sharyah, N.A.; Zmanan, S.A.; Albargi, H.B.; Abdalla, A.M. Experimental and Theoretical Investigations of the γ-Rays Shielding Performance of Rock Samples from Najran Region. Ann. Nucl. Energy 2023, 183, 109676. [Google Scholar] [CrossRef]
- Singh, M.; Mudahar, G.S. Energy Dependence of Total Photon Attenuation Coefficients of Composite Materials. Int. J. Radiat. Appl. Instrum. Part A Appl. Radiat. Isot. 2002, 43, 907–911. [Google Scholar] [CrossRef]
- Appoloni, C.R.; Rios, E.A. Mass Attenuation Coefficients of Brazilian Soils in the Range 10–1450 KeV. Appl. Radiat. Isot. 1994, 45, 287–291. [Google Scholar] [CrossRef]
- Şensoy, A.T.; Gökçe, H.S. Simulation and Optimization of Gamma-Ray Linear Attenuation Coefficients of Barite Concrete Shields. Constr. Build. Mater. 2020, 253, 119218. [Google Scholar] [CrossRef]
- Pires, L.F. Radiation Shielding Properties of Weathered Soils: Influence of the Chemical Composition and Granulometric Fractions. Nucl. Eng. Technol. 2022, 54, 3470–3477. [Google Scholar] [CrossRef]
- Kaky, K.M.; Sayyed, M.I. The Radiation Shielding Parameters of a Standard Silica Glass System. Silicon 2023, 16, 1197–1203. [Google Scholar] [CrossRef]
- Singh, C.; Singh, T.; Kumar, A.; Mudahar, G.S. Energy and Chemical Composition Dependence of Mass Attenuation Coefficients of Building Materials. Ann. Nucl. Energy 2004, 31, 1199–1205. [Google Scholar] [CrossRef]
- Singh, V.; Badiger, N. Investigation on Radiation Shielding Parameters of Ordinary, Heavy and Super Heavy Concretes. Nucl. Technol. Radiat. Prot. 2014, 29, 149–156. [Google Scholar] [CrossRef]
- Issa, S.A.M.; Rashad, M.; Hanafy, T.A.; Saddeek, Y.B. Experimental Investigations on Elastic and Radiation Shielding Parameters of WO3-B2O3-TeO2 Glasses. J. Non-Cryst. Solids 2020, 544, 120207. [Google Scholar] [CrossRef]
- Büyükyıldız, M.; Kılıç, A.D.; Yılmaz, D. White and Some Colored Marbles as Alternative Radiation Shielding Materials for Applications. Radiat. Eff. Defects Solids 2020, 175, 657–671. [Google Scholar] [CrossRef]
- Issa, S.A.M.; Sayyed, M.I.; Kurudirek, M. Study of Gamma Radiation Shielding Properties of TeO2ZnO−TeO2 Glasses. Bull. Mater. Sci. 2017, 40, 841–857. [Google Scholar] [CrossRef]
- Elsafi, M.; Alrashedi, M.F.; Sayyed, M.I.; Al-Hamarneh, I.F.; El-Nahal, M.A.; El-Khatib, M.; Khandaker, M.U.; Osman, H.; Askary, A.E. The Potentials of Egyptian and Indian Granites for Protection of Ionizing Radiation. Materials 2021, 14, 3928. [Google Scholar] [CrossRef]
- Lakshminarayana, G.; Baki, S.O.; Kaky, K.M.; Sayyed, M.I.; Tekin, H.O.; Lira, A.; Kityk, I.V.; Mahdi, M.A. Investigation of Structural, Thermal Properties and Shielding Parameters for Multicomponent Borate Glasses for Gamma and Neutron Radiation Shielding Applications. J. Non-Cryst. Solids 2017, 471, 222–237. [Google Scholar] [CrossRef]
- Sayyed, M.I.; Lakshminarayana, G.; Kityk, I.V.; Mahdi, M.A. Evaluation of Shielding Parameters for Heavy Metal Fluoride Based Tellurite-Rich Glasses for Gamma Ray Shielding Applications. Radiat. Phys. Chem. 2017, 139, 33–39. [Google Scholar] [CrossRef]
- Karabul, Y.; Amon Susam, L.; İçelli, O.; Eyecioğlu, Ö. Computation of EABF and EBF for Basalt Rock Samples. Nucl. Instrum. Methods Phys. Res. Sect. A Accel. Spectrometers Detect. Assoc. Equip. 2015, 797, 29–36. [Google Scholar] [CrossRef]
- Bantan, R.A.R.; Sayyed, M.I.; Mahmoud, K.A.; Al-Hadeethi, Y. Application of Experimental Measurements, Monte Carlo Simulation and Theoretical Calculation to Estimate the Gamma Ray Shielding Capacity of Various Natural Rocks. Prog. Nucl. Energy 2020, 126, 103405. [Google Scholar] [CrossRef]
- Rashwan, M.A.; Abdelwahab, W.; Azer, M.K.; Zakaly, H.M.H.; Alarifi, S.S.; Ene, A.; Thabet, I.A. Physico-Mechanical Properties and Shielding Efficiency in Relation to Mineralogical and Geochemical Compositions of Um Had Granitoid, Central Eastern Desert, Egypt. Front. Earth Sci. 2023, 11, 1228489. [Google Scholar] [CrossRef]
- Karpuz, N. Radiation Shielding Properties of Glass Composition. J. Radiat. Res. Appl. Sci. 2023, 16, 100689. [Google Scholar] [CrossRef]
- Camargo, M.A.; Kodum, K.S.; Pires, L.F. How does the soil chemical composition affect the mass attenuation coefficient? A study using computer simulation to understand the radiation-soil interaction processes. Braz. J. Phys. 2021, 51, 1775–1783. [Google Scholar] [CrossRef]
- Costa, J.C.; Borges, J.A.R.; Pires, L.F.; Arthur, R.C.J.; Bacchi, O.O.S. Soil mass attenuation coefficient: Analysis and evaluation. Ann. Nucl. Energy 2014, 64, 206–211. [Google Scholar] [CrossRef]


Disclaimer/Publisher’s Note: The statements, opinions and data contained in all publications are solely those of the individual author(s) and contributor(s) and not of MDPI and/or the editor(s). MDPI and/or the editor(s) disclaim responsibility for any injury to people or property resulting from any ideas, methods, instructions or products referred to in the content. |
© 2025 by the authors. Licensee MDPI, Basel, Switzerland. This article is an open access article distributed under the terms and conditions of the Creative Commons Attribution (CC BY) license (https://creativecommons.org/licenses/by/4.0/).