1. Introduction
Airborne pathogens are defined by their mode of transmission through the air. Substantial evidence supports that SARS-CoV-2, the virus responsible for the COVID-19 pandemic, transmitted through the air [
1,
2]. This mode of transmission has been recognized by global health authorities, based on extensive experimental and epidemiological data [
3,
4]. Notably, SARS-CoV-2 can be introduced into the environment not only through sneezing and coughing but also through normal breathing and speaking, highlighting the pervasive nature of airborne transmission [
5,
6,
7].
Hence, the COVID-19 pandemic has underscored the critical need for effective methods to mitigate the transmission of airborne pathogens in indoor environments [
8,
9,
10,
11]. Among various strategies, microwave (MW) sanitation has emerged as a promising technology due to its potential to inactivate viruses, including SARS-CoV-2, on surfaces and in the air [
12,
13,
14]. Structural resonant energy transfer (SRET) methodology enables the inactivation of pathogens using MWs without inducing thermal effects [
15,
16,
17,
18]. Pathogens, which consist of an internal core and an outer envelope made of structural proteins and lipids, can be modeled as nano-dimensional condensed matter with core–shell charge separation. It has been demonstrated that exposure to an electromagnetic (EM) field at specific resonant frequencies can cause external disruption of viruses, leading to their inactivation. This technology forms the foundation of air sanitization E4Shield devices (Elettronica SpA, Rome, Italy) designed to eliminate pathogens such as SARS-CoV-2 and H1N1. Its efficacy has been proven in a laboratory environment [
19,
20,
21,
22] but not in a real environment.
This study aims to evaluate the efficacy of microwave sanitation in reducing the risk of the airborne SARS-CoV-2 contagion in office environments, introducing the E4Shield device, which is a microwave (MW) sanitization system. Utilizing advanced electromagnetic and fluid-dynamic simulations, the dispersion and inactivation of viral particles under the influence of microwave radiation has been modeled. In fact, Computational Fluid-Dynamic (CFD) studies are crucial to evaluate pathogen transmission and diffusion [
23,
24,
25]. This approach allows for a detailed analysis of the interaction between microwaves and airborne pathogens, providing insights into the effectiveness of this method in real-world office settings. By integrating experimental data with simulation results, we seek to establish a comprehensive understanding of how MW sanitation can be optimized to enhance indoor air quality and reduce the risk of viral transmission.
2. Evaluation Study and Design
This work combines the modeling of relevant real environments, including human beings, EM simulations to evaluate the propagation of the EM field in real scenarios, MW inactivation principles and fluid dynamic simulations to study particle emission and diffusion. In fact, the main aim of this study is to assess the infection risk for susceptible individuals, both in the absence and presence of an E4Shield device.
2.1. Scenario Design
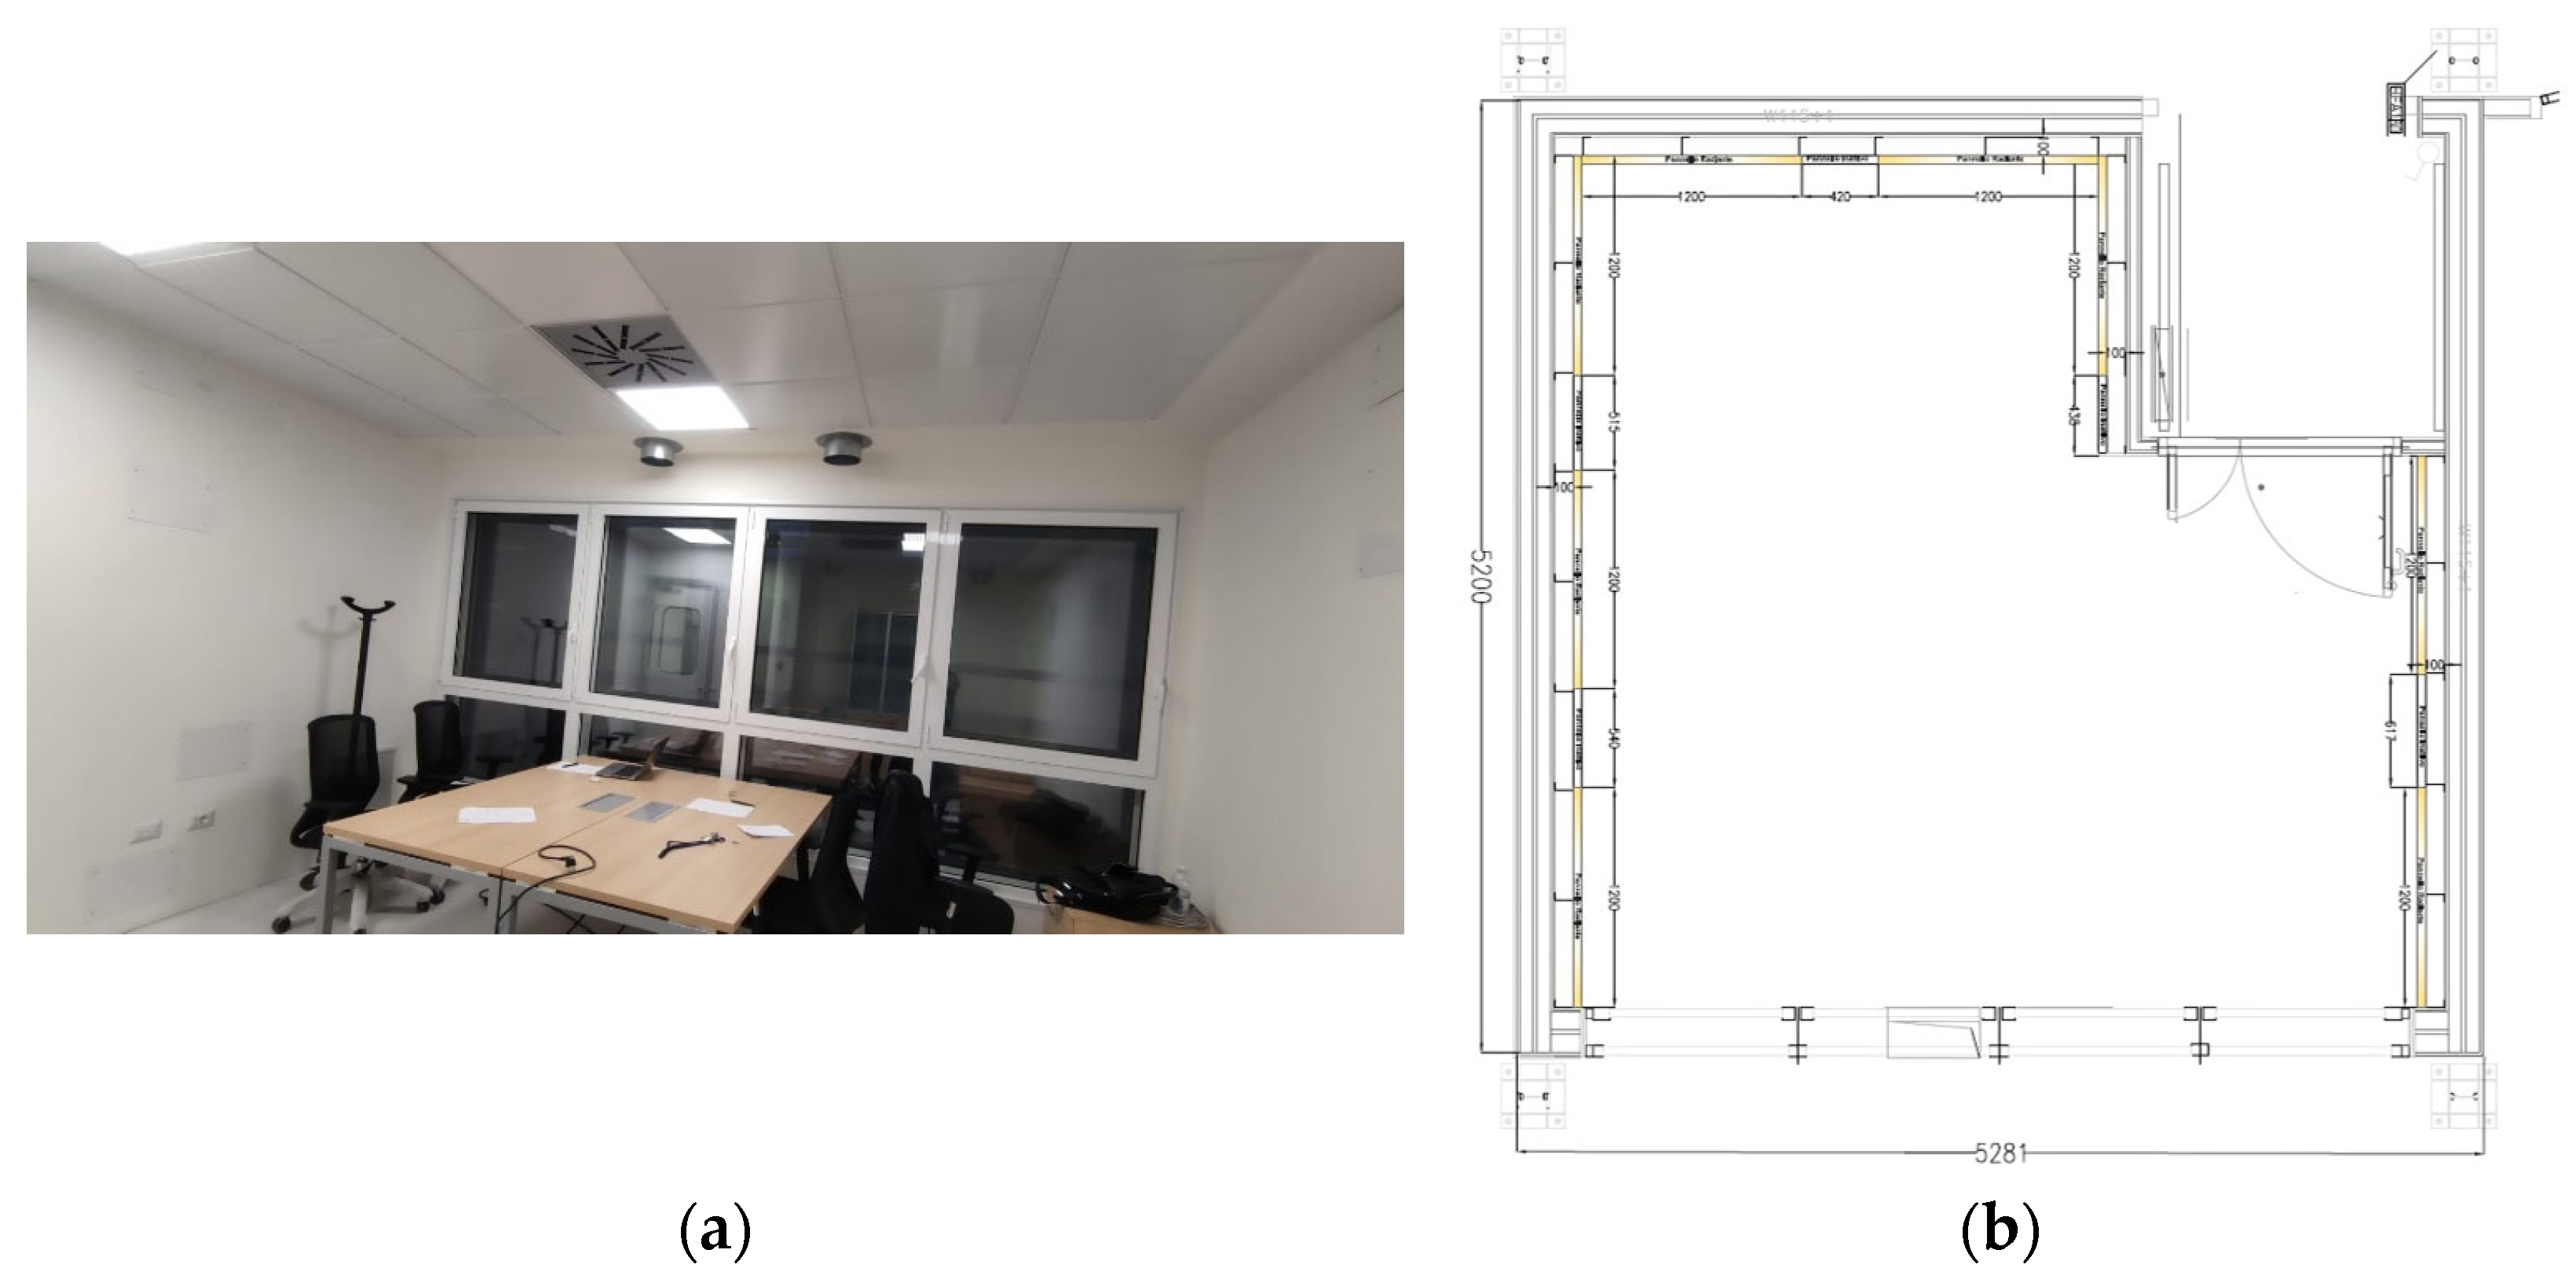
The first step consisted of the design of the environment, including the disposition of the individuals. The Office Laboratory at the Energy Center Lab of the Polytechnic University of Turin was selected as the reference environment (
Figure 1). This laboratory comprises a room approximately 5 × 5 m
2 in size, including an antechamber (airlock), with a total net volume of about 64 m
3.
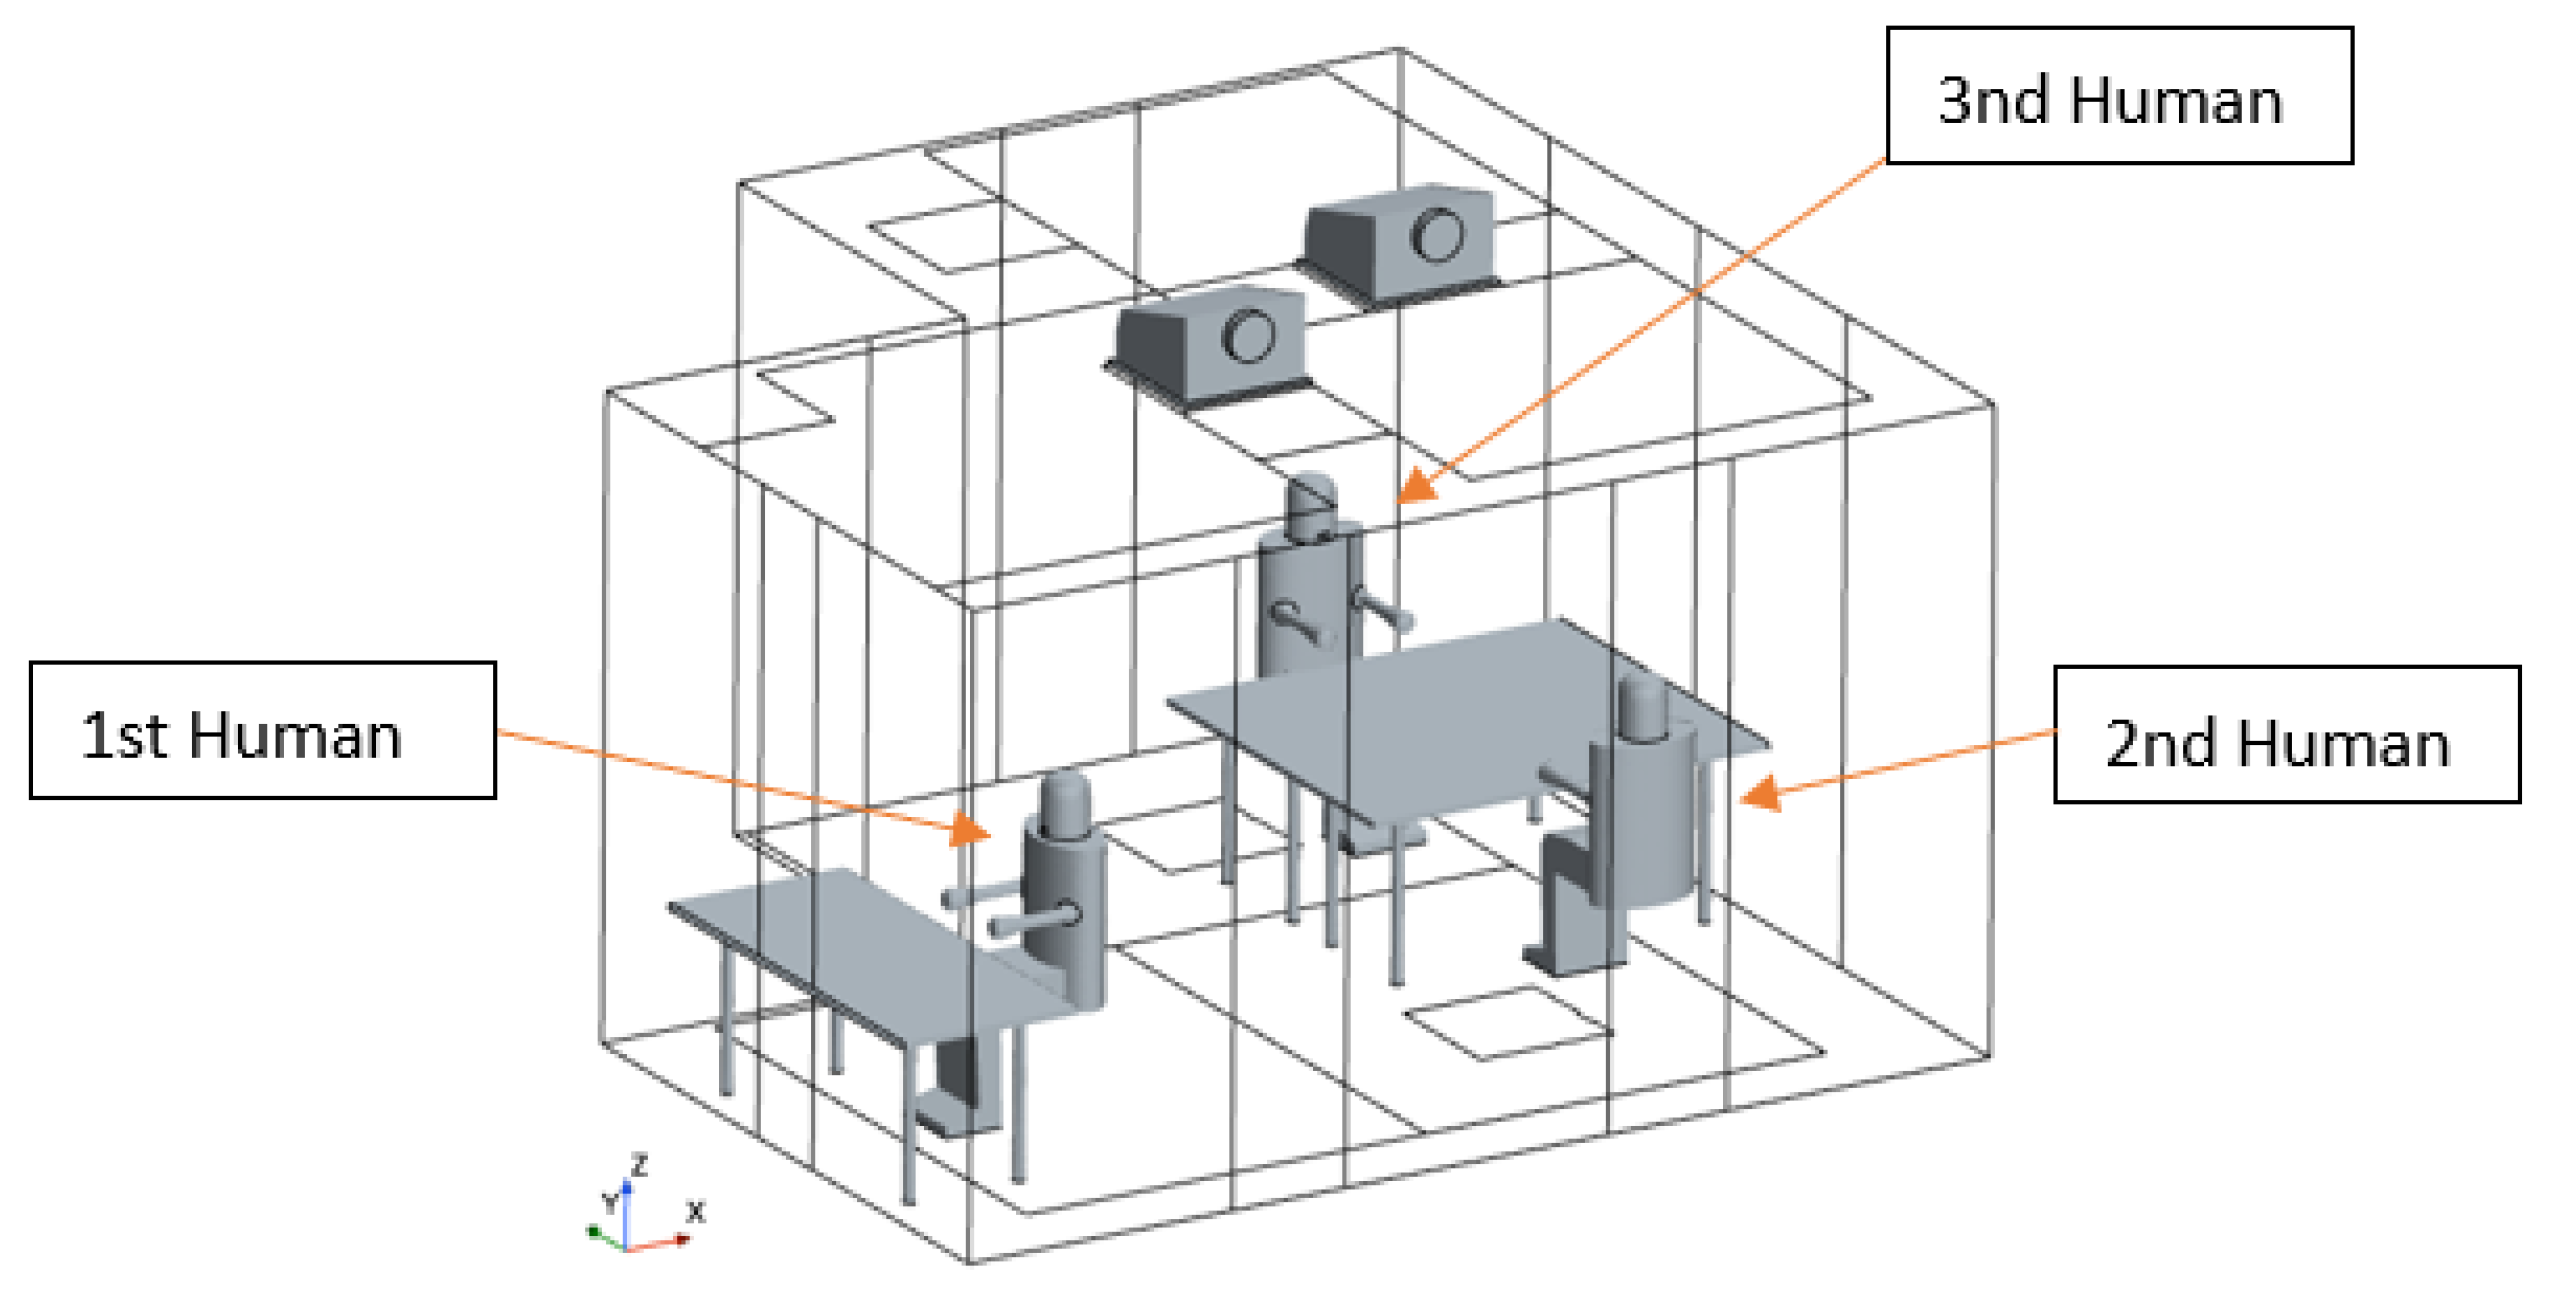
In the office setting, three occupants were considered: two individuals were positioned at desks placed side by side and facing each other, thereby maximizing the potential for direct transmission of contagions. The last individual was situated separately, positioned against a wall, which reduces their risk of direct exposure, as depicted in
Figure 2. Among them, the third individual was the SARS-CoV-2 infected individual, and the other two people were susceptible individuals.
2.2. Electromagnetic Simulations
The purpose of the electromagnetic simulations, conducted using CST Microwave Studio 2024 (Dassault Systèmes, Velizy-Villacoublay, France), was to assess the distribution of the EM field within the laboratory office based on the placement of devices. This evaluation aimed to determine the optimal positioning of the device within the actual reference site.
2.2.1. Device Design and Electromagnetic Simulation in Free Space
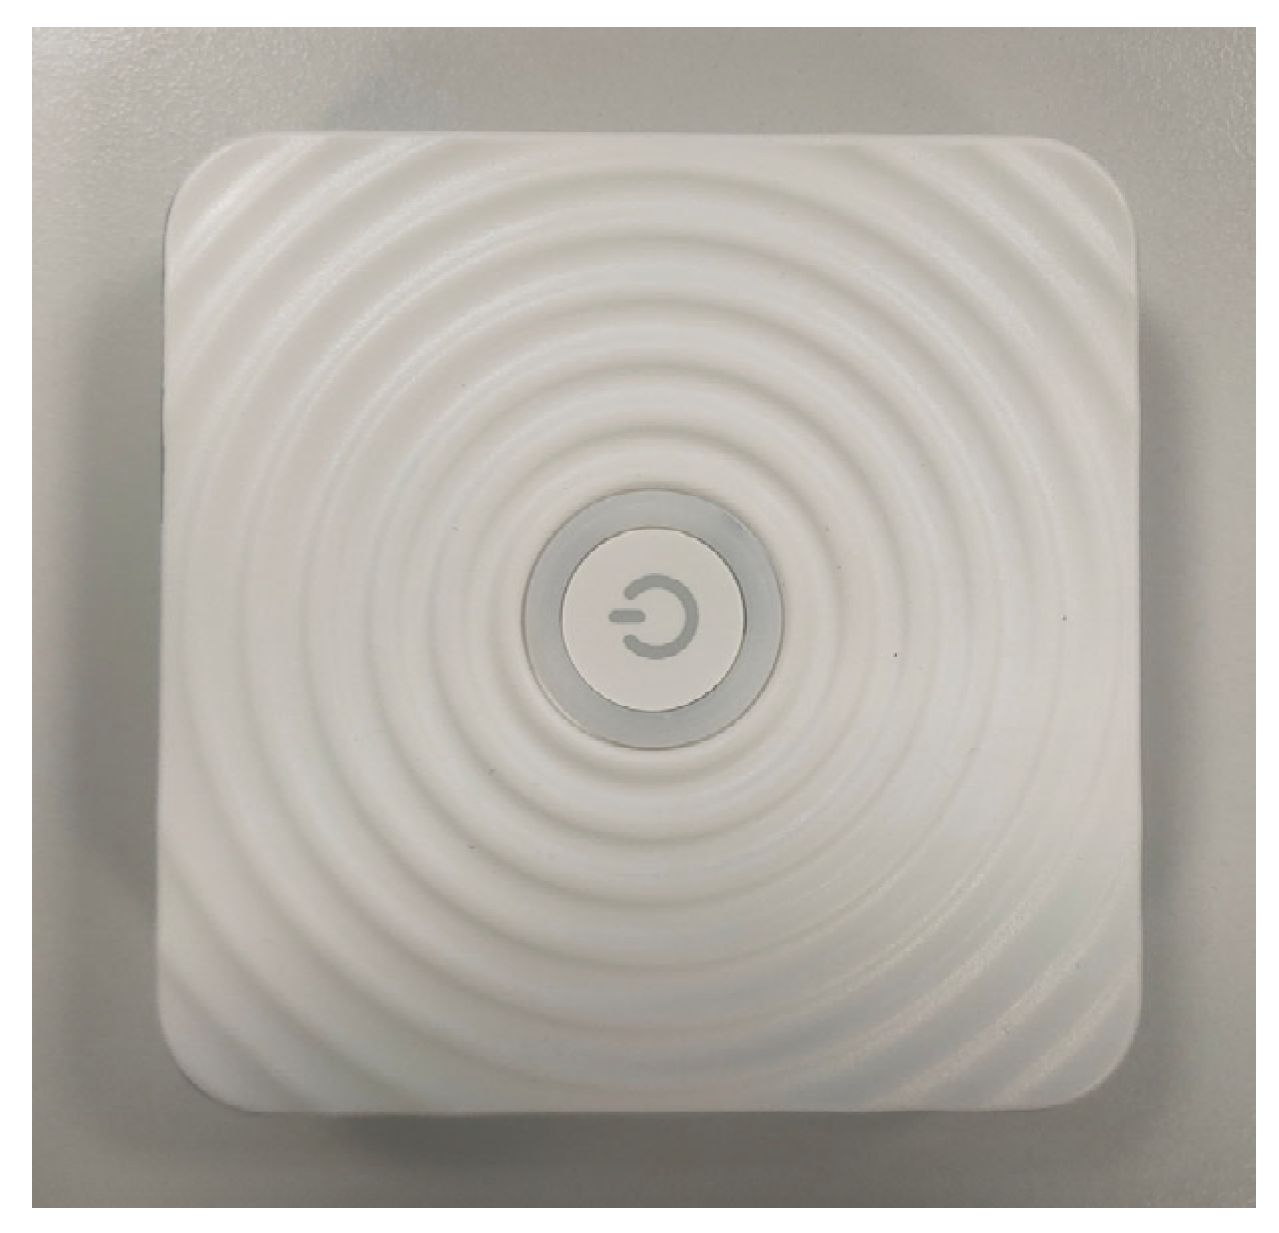
Initially, we conducted an analysis of the electromagnetic device within a simulation environment. The E4Shield device (Elettronica SpA, Rome, Italy) was meticulously modeled in CST to replicate the actual design of the object, as illustrated in
Figure 3.
The antenna designed is a miniaturized patch antenna fed by a microstrip (
Figure 4). The pattern of the device was simulated in free space and is shown in
Figure 4.
To acquire the near-field data, the field source was evaluated. Utilizing the field source in place of the actual device can significantly streamline subsequent simulations conducted in complex environments.
2.2.2. Electromagnetic Simulation in Real Environment
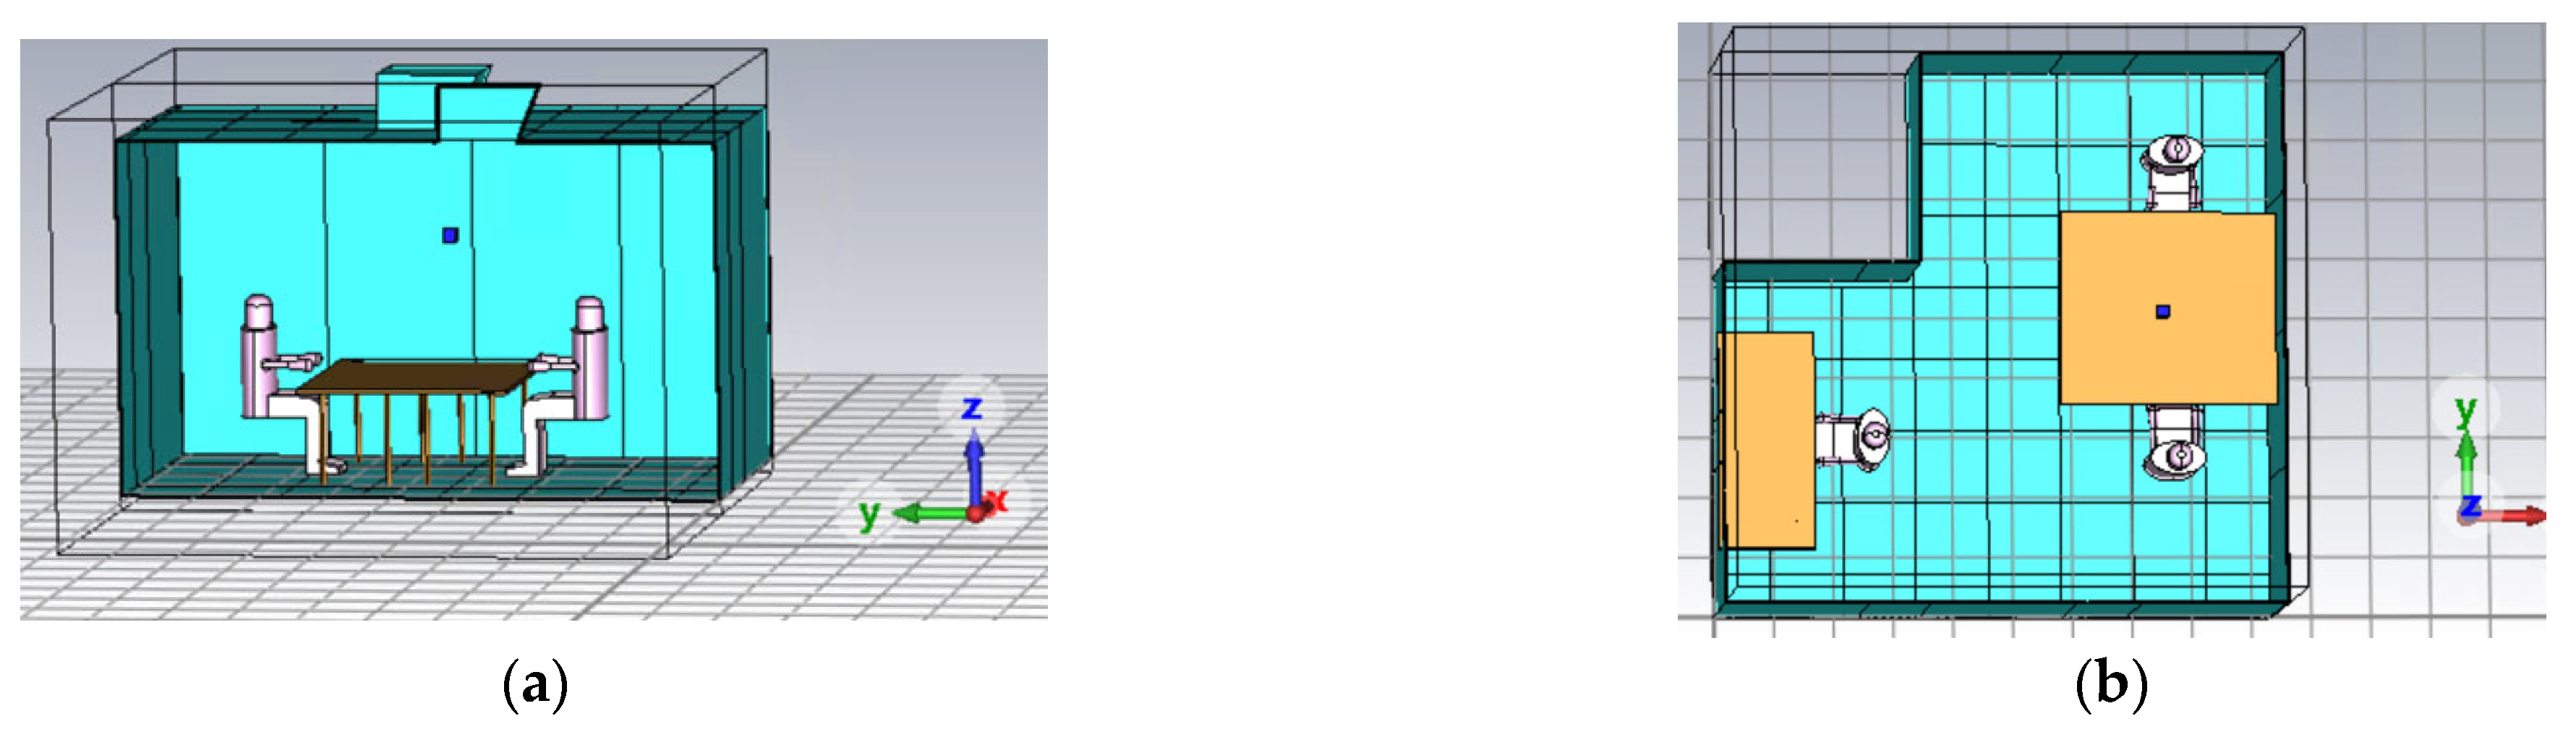
The previously assessed field source was subsequently integrated into the office environment. Two distinct device locations were evaluated, with the primary aim of the study being to determine the optimal placement to minimize contagions among the individuals present in the office. These two positions, shown in
Figure 5, were
On the main wall, among the two individuals (the infected one and the susceptible one) at 1.7 m from the ground;
In the middle of the main table, among the two individuals (the infected one and the susceptible one).
The materials for the various elements within the room were selected from the electromagnetic software library. For the structural components, concrete was utilized for the walls and floor, while wood was chosen for the table and seating. Regarding the occupants of the environment, who were represented schematically, muscle tissue was selected as the sole representative tissue due to its primary significance. The conductivity, relative permeability, and tangent loss values of the muscle at various frequencies were obtained from the Institute For Applied Physics ‘Nello Carrara’ (IFAC)-provided library [
26] (
Table 1).
2.2.3. SAR Evaluation
One of the notable characteristics of this technology is its ability to be used in the presence of humans, thereby effectuating real-time sanitation and reducing the risk of contagion in the event of an infected individual. To validate this approach, the Specific Absorption Rate (SAR) value was evaluated under these specific conditions and compared to the International Commission on Non-Ionizing Radiation Protection (ICNIRP) guidelines [
27].
Simulations were conducted to determine the maximum field amplitude at the edge of the nearest subject in two scenarios: the device placed on a table or mounted on a wall. The maximum field amplitude in the subject’s head and trunk was estimated to be 0.48 V/m. Considering conductivity and muscle density, the SAR was calculated to be 0.002 W/kg under these conditions. According to ICNIRP regulations, the SAR should not exceed 2 W/kg for the head and trunk. As the calculated SAR value is significantly below this threshold, the device is compliant with the ICNIRP guidelines.
2.3. Fluid-Dynamic Methods and Simulations
The methodology involves the use of CFD software (STAR-CCM+ software v.2410) to simulate the distribution of viral load emitted by an infected individual within a confined environment. This simulation specifically calculates the viral dose potentially absorbed by a reference susceptible individual over a defined time interval. Following the determination of the viral dose, this data is applied to the Airborne Risk Indoor Assessment (ARIA) calculation model, which has been developed and published by the World Health Organization (WHO) [
28]. The ARIA model enables the association of an average probability of infection with the potentially absorbed viral dose (
Figure 6).
CFD simulations were conducted using the Star-CCM+ software v.2410 developed by Siemens and licensed to the Department of Energy of the Polytechnic University of Turin. These simulations employed Reynolds-Averaged Navier–Stokes (RANS) equations in a three-dimensional (3D) framework. The study focused on modeling aerosol transport and diffusion within a confined environment to understand the spread of airborne viruses from an infected individual. The simulations were categorized into two main groups based on the modeling approach: the first group utilized a Lagrangian method, while the second group employed an Eulerian method. Simulations employing both methodologies were conducted. The primary objective was to enhance security levels, while the secondary aim was to validate the reliability of the Eulerian approach. This approach is notably faster and demands less computational power, has already been proposed and is a promising candidate for future research extensions [
29].
Based on the described geometry, an analysis was conducted for a summer scenario utilizing a mixed radiant cooling and primary air system (mixing ventilation). The boundary conditions used for the simulations are expressed in
Table 2.
The emission from the infected individual was modeled in constant and sinusoidal mode according to the schedule shown in
Table 3.
2.3.1. Lagrangian Method
In the Lagrangian approach, the motion and temperature fields within the environment are initially simulated under steady-state conditions. Subsequently, particle input conditions are imposed, with the particle trajectories derived from a temporal dynamic calculation (i.e., using a transient model) based on the balance of forces acting on the particles, specifically aerodynamic forces. This simulation method allows for a more accurate reproduction of the distribution and diffusion of the aerosol particles emitted by an infected individual through breathing, talking, and coughing. However, as the duration of the simulation increases, the computational power and time required grow exponentially.
The particle distribution considered was characterized with the spectrum summarized in
Table 4, as described in [
30,
31].
Respiratory droplets are inherently complex, comprising mixtures of water, salts, proteins (e.g., mucin), and biological materials such as virions. Nevertheless, the modelling approach employed in this study simplifies droplets as single-component spherical particles to concentrate on their aerodynamic transport and dispersion behavior rather than their intricate internal composition or biological viability.
The representation of respiratory droplets as spherical particles is widely accepted in the literature, particularly for the purposes of airflow interaction and transport, as demonstrated in previous studies [
7,
32,
33,
34,
35]. These models have effectively captured the fundamental dynamics of droplet sedimentation and airborne suspension.
Moreover, due to the rapid evaporation of the water content [
32,
36], the residual droplet nuclei primarily consist of non-volatile materials and virions. Previous studies [
5,
37] have shown that the trajectory and suspension time of these nuclei are predominantly governed by their aerodynamic size and environmental conditions rather than their detailed chemical composition. Once the water has evaporated, the particle’s effective size stabilizes, and its subsequent motion can be reasonably approximated using a spherical model.
This simplification may constrain the ability to predict virion viability or detailed droplet-phase behavior. However, the primary focus of this study is on modeling transport pathways and exposure potential. In this context, the assumption of spherical droplets offers a computationally efficient and physically reasonable representation.
By employing the Lagrangian approach, the trajectory of emitted aerosol particles can be accurately tracked. This method necessitates transient simulations, which are constrained by the requirement for substantial computational power and extended processing times. In these transient models, the emission from the infected individual is represented using a sinusoidal function, meaning the digital dummy emits particles at intervals with modulated intensity.
2.3.2. Eulerian Method
In the Eulerian approach, the diffusion and distribution of inert gas are simulated by tracking individual particles. The software calculates the steady-state mass balance of the inert gas within the discretized volumes of space. In this method, the observation point for the balances is a control volume through which traverse flows. This approach allows for the simulation and calculation of long-term dynamics under steady-state conditions, i.e., at the end of the transient phase. However, it does not permit the resolution of individual particle trajectories. The behavior of a reference gas molecule is assumed to be unaffected by gravity or aerodynamic forces, diffusing instead by Brownian motion and being transported by advection through the air.
To model the bio-aerosol emission from an infected individual, carbon dioxide (CO
2) gas was utilized, constituting 4% of the total exhaled volume [
29,
38,
39]. A stationary approach was employed to simulate a long-term scenario, maintaining a constant emission velocity of air of 3 m/s from the individual’s mouth.
2.4. The Process and Evaluation of the Electromagnetic Incativation of Viruses
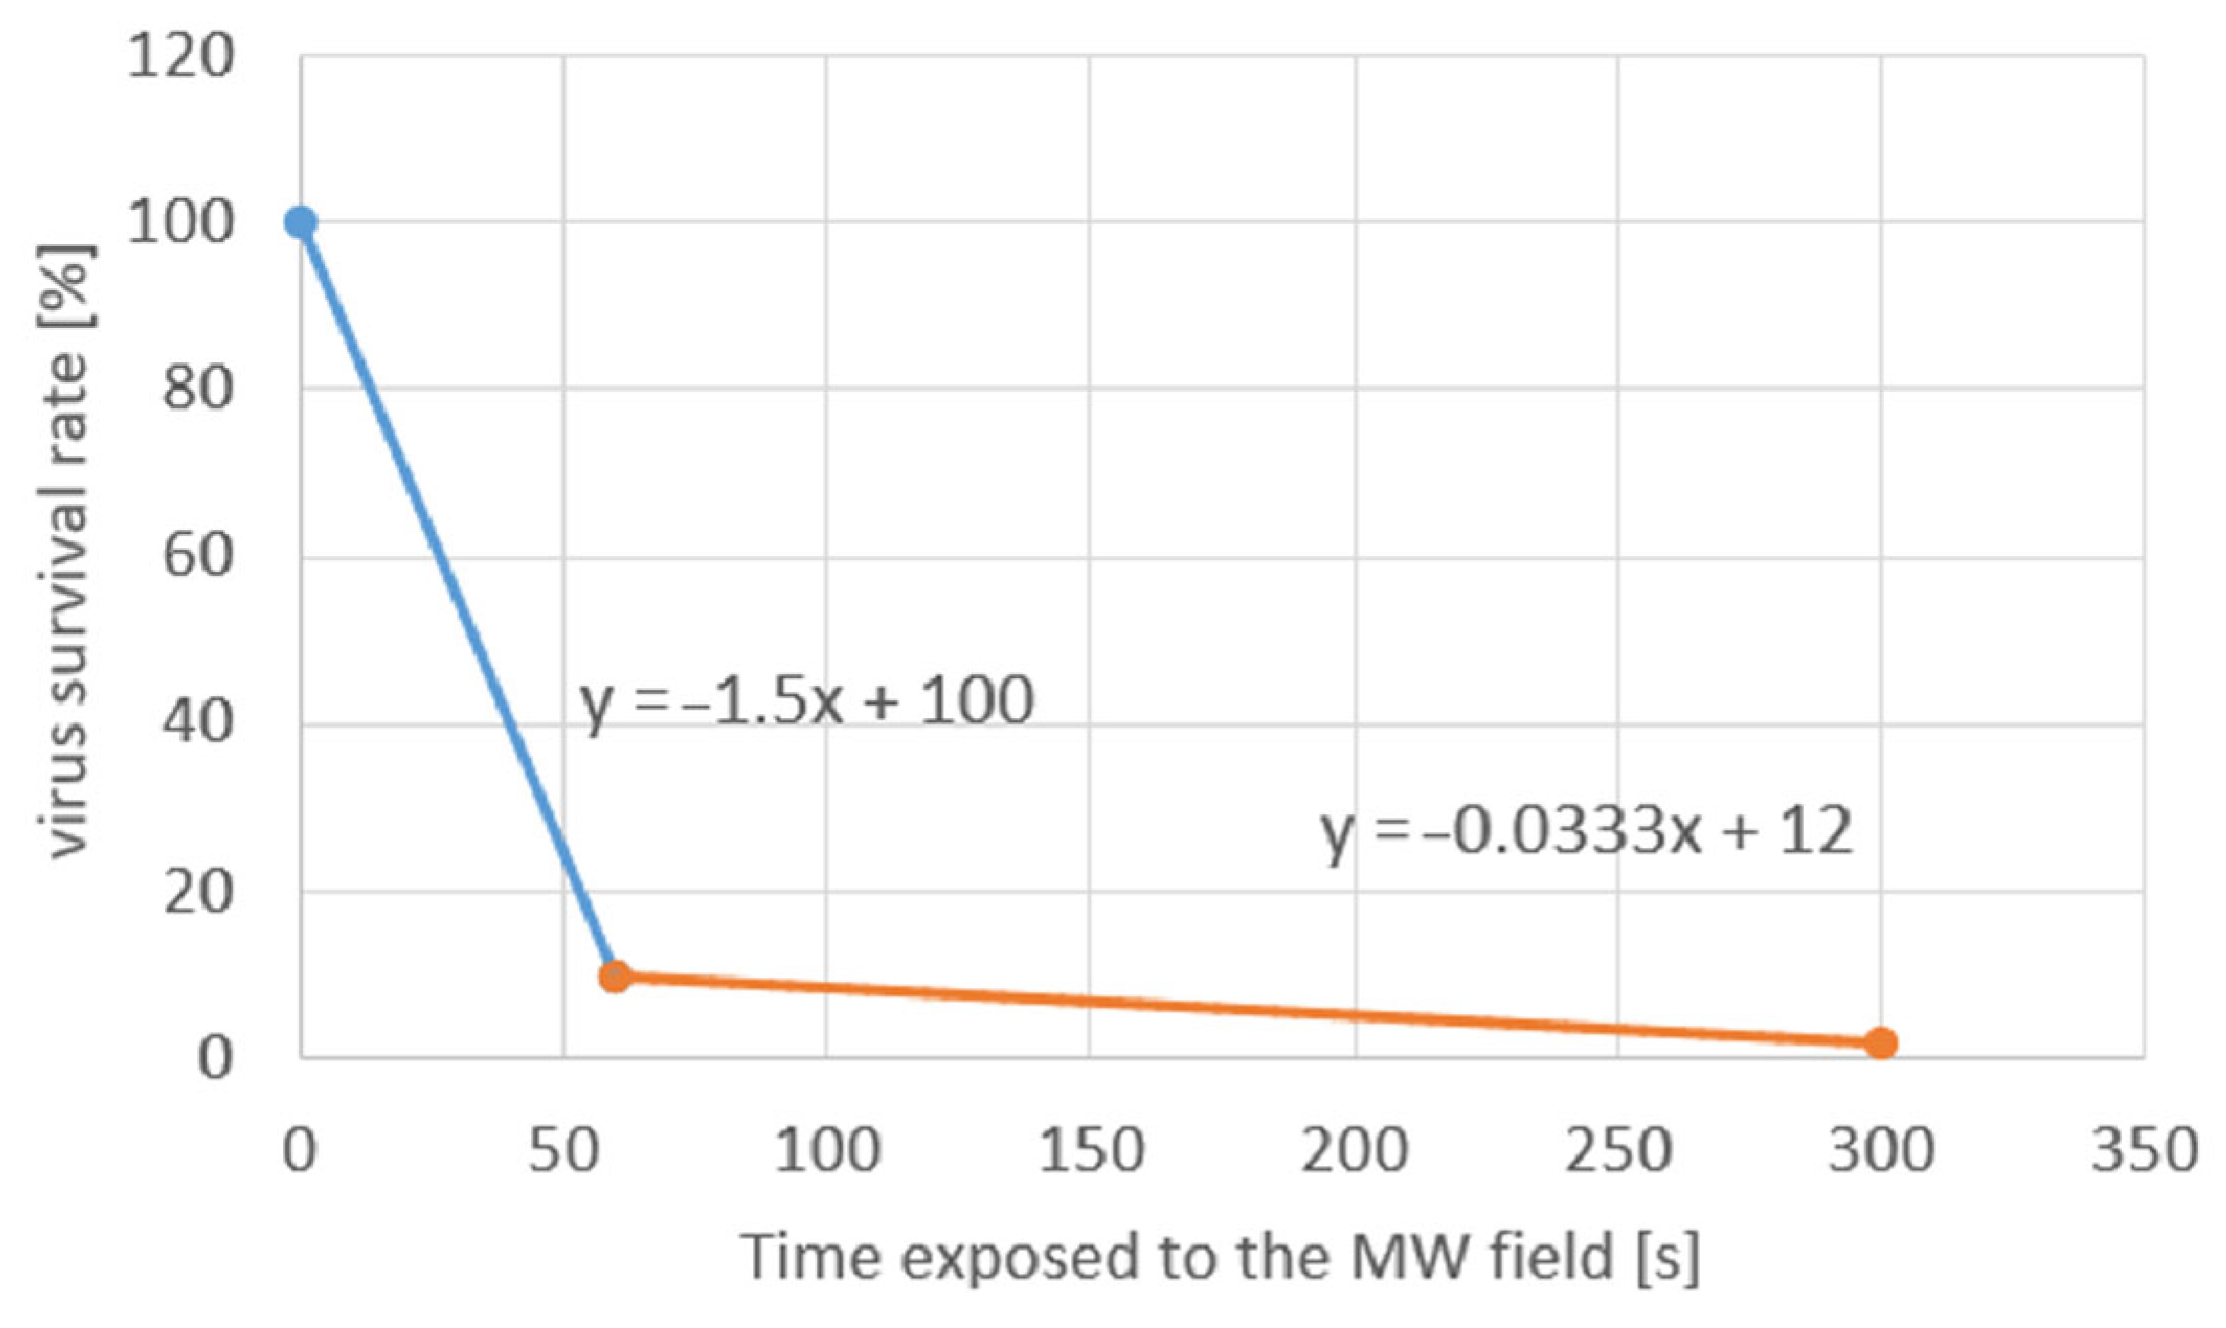
To evaluate the device’s effectiveness in real-world environments, it is crucial to assess the inactivation effectiveness over time, as particle diffusion in the environment is inherently time dependent. For this purpose, experimentally obtained SARS-CoV-2 inactivation results [
19,
20,
21,
22] were analyzed as a function of time. The experimentally obtained inactivation percentages are associated with EM field amplitudes greater than 6 V/m for 1, 5 and 10 min of MW exposure and shown in
Figure 7.
3. Results
3.1. Electromagnetic Numerical Results
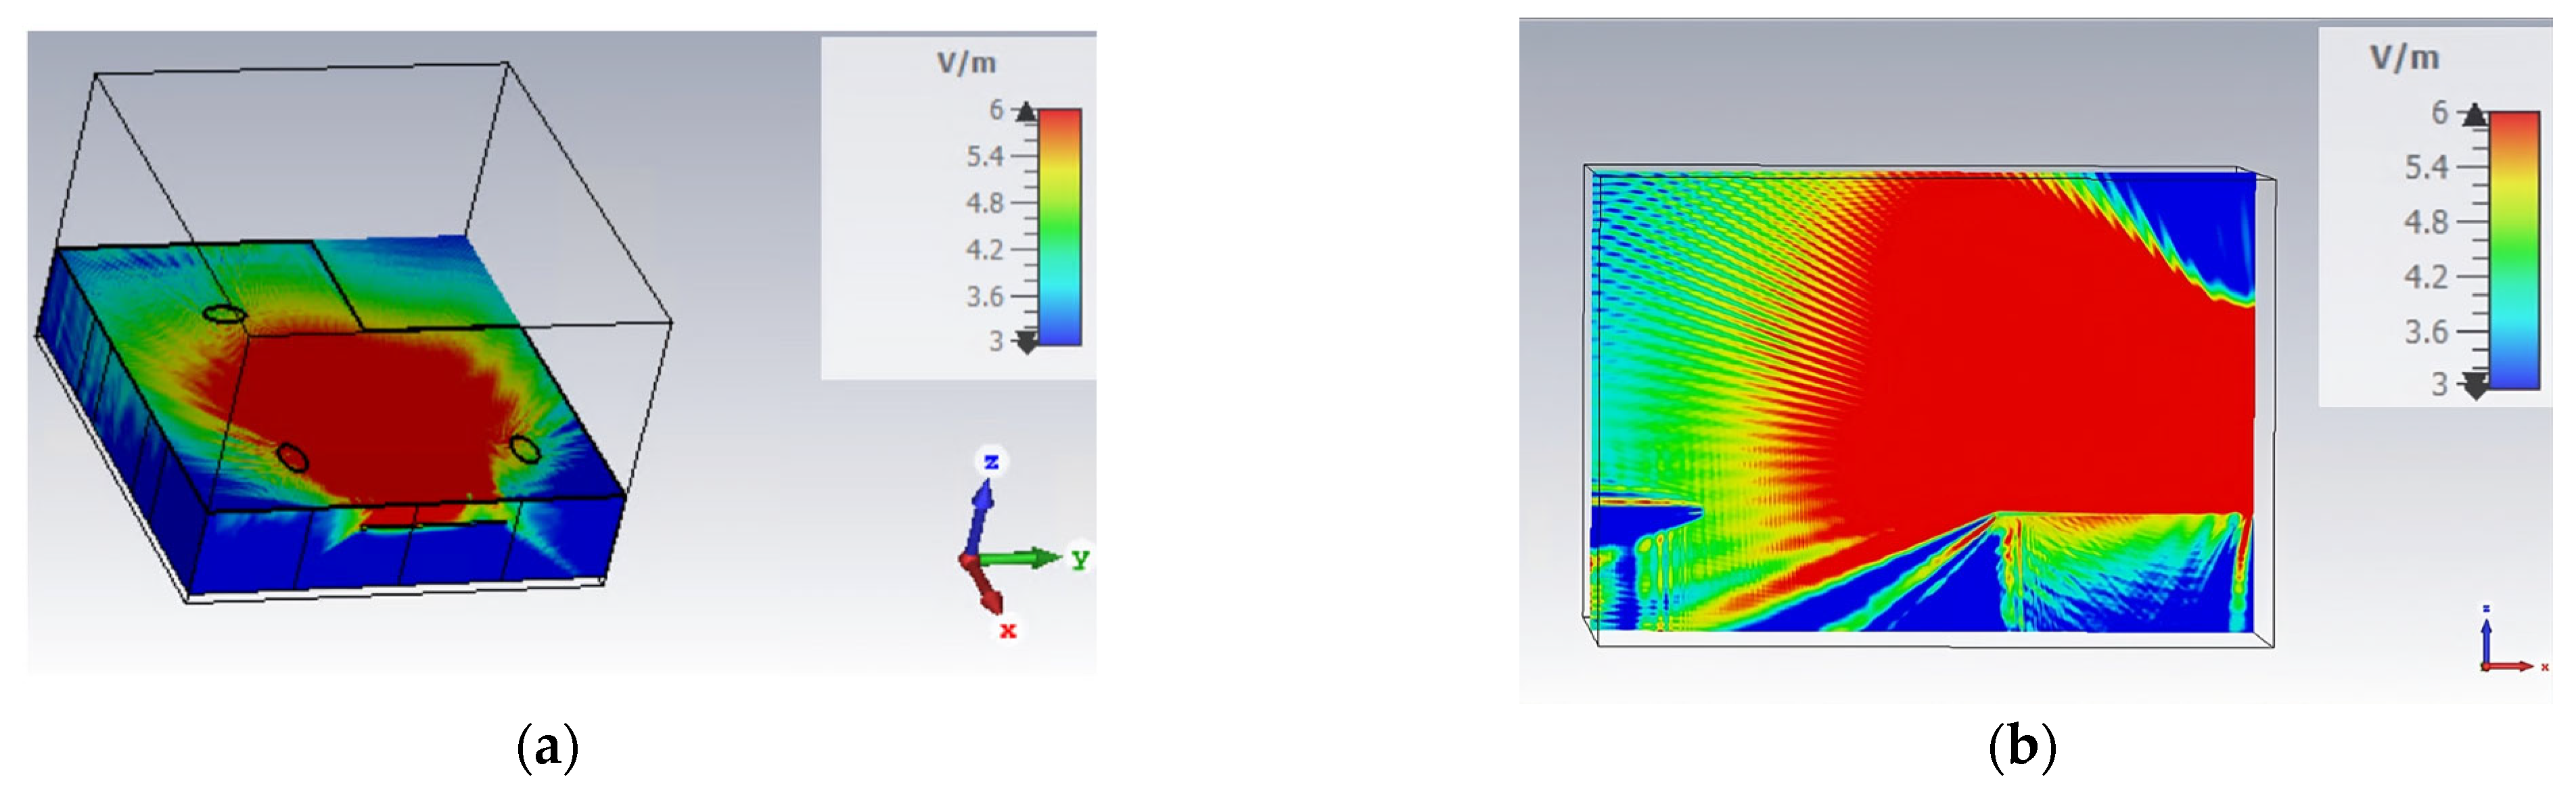
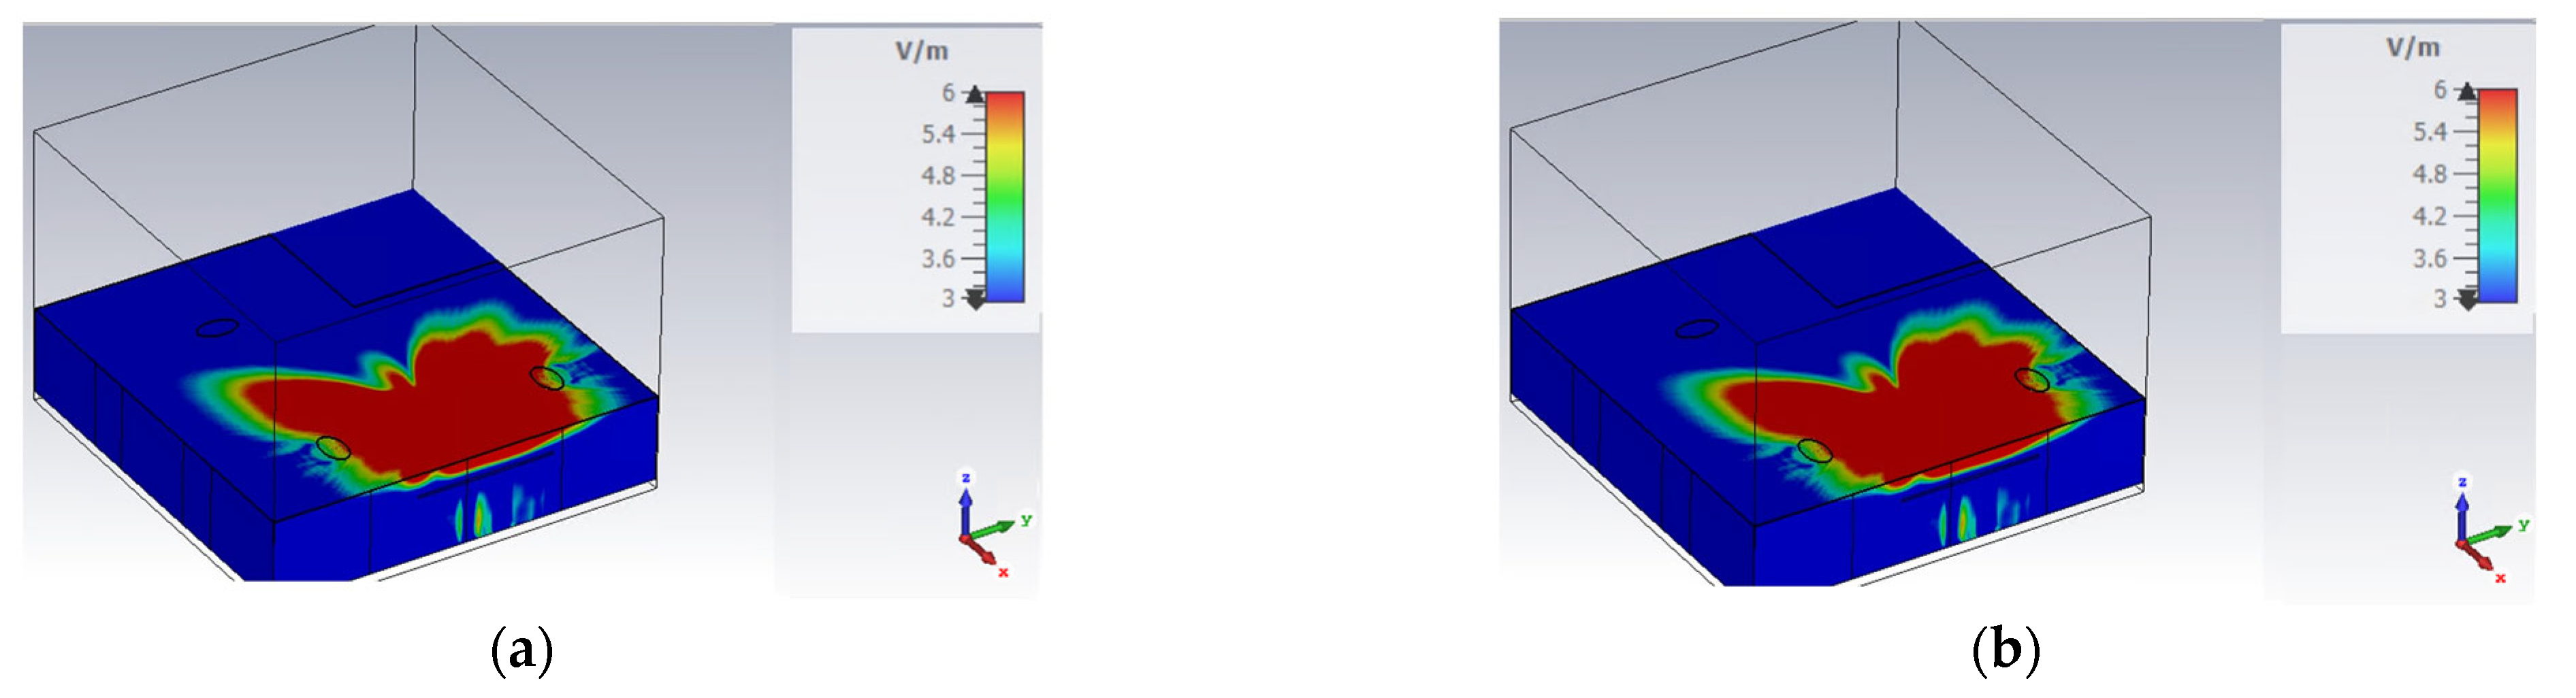
Figure 8 and
Figure 9 show the field amplitude values obtained in simulations of the two conditions previously described (device on wall and device on table).
As illustrated in the images, both positions evaluated are critical for achieving an optimal EM field distribution. This optimal distribution is essential for ensuring the field’s effectiveness in pathogen inactivation.
3.2. Fluid-Dynamic Results
This model allows for the determination of the transit time for each individual particle within the electromagnetic wave field generated by the E4Shield device, taking into account the relative probability of virus inactivation in the particle. A sphere with a diameter of 0.5 m, clearly depicted in grey in
Figure 10, was used as a reference for the proximity area of the susceptible individual.
The experimentally derived deactivation temporal function (reported in
Figure 7) exhibits a very fast action. Nonetheless, it was necessary to investigate the fate of the virus-laden particles during the very first minute of emission from the infected individual’s mouths. During the first minute, the exposure to the MW field is assumed to deactivate from 10% to 90% of the virus particles.
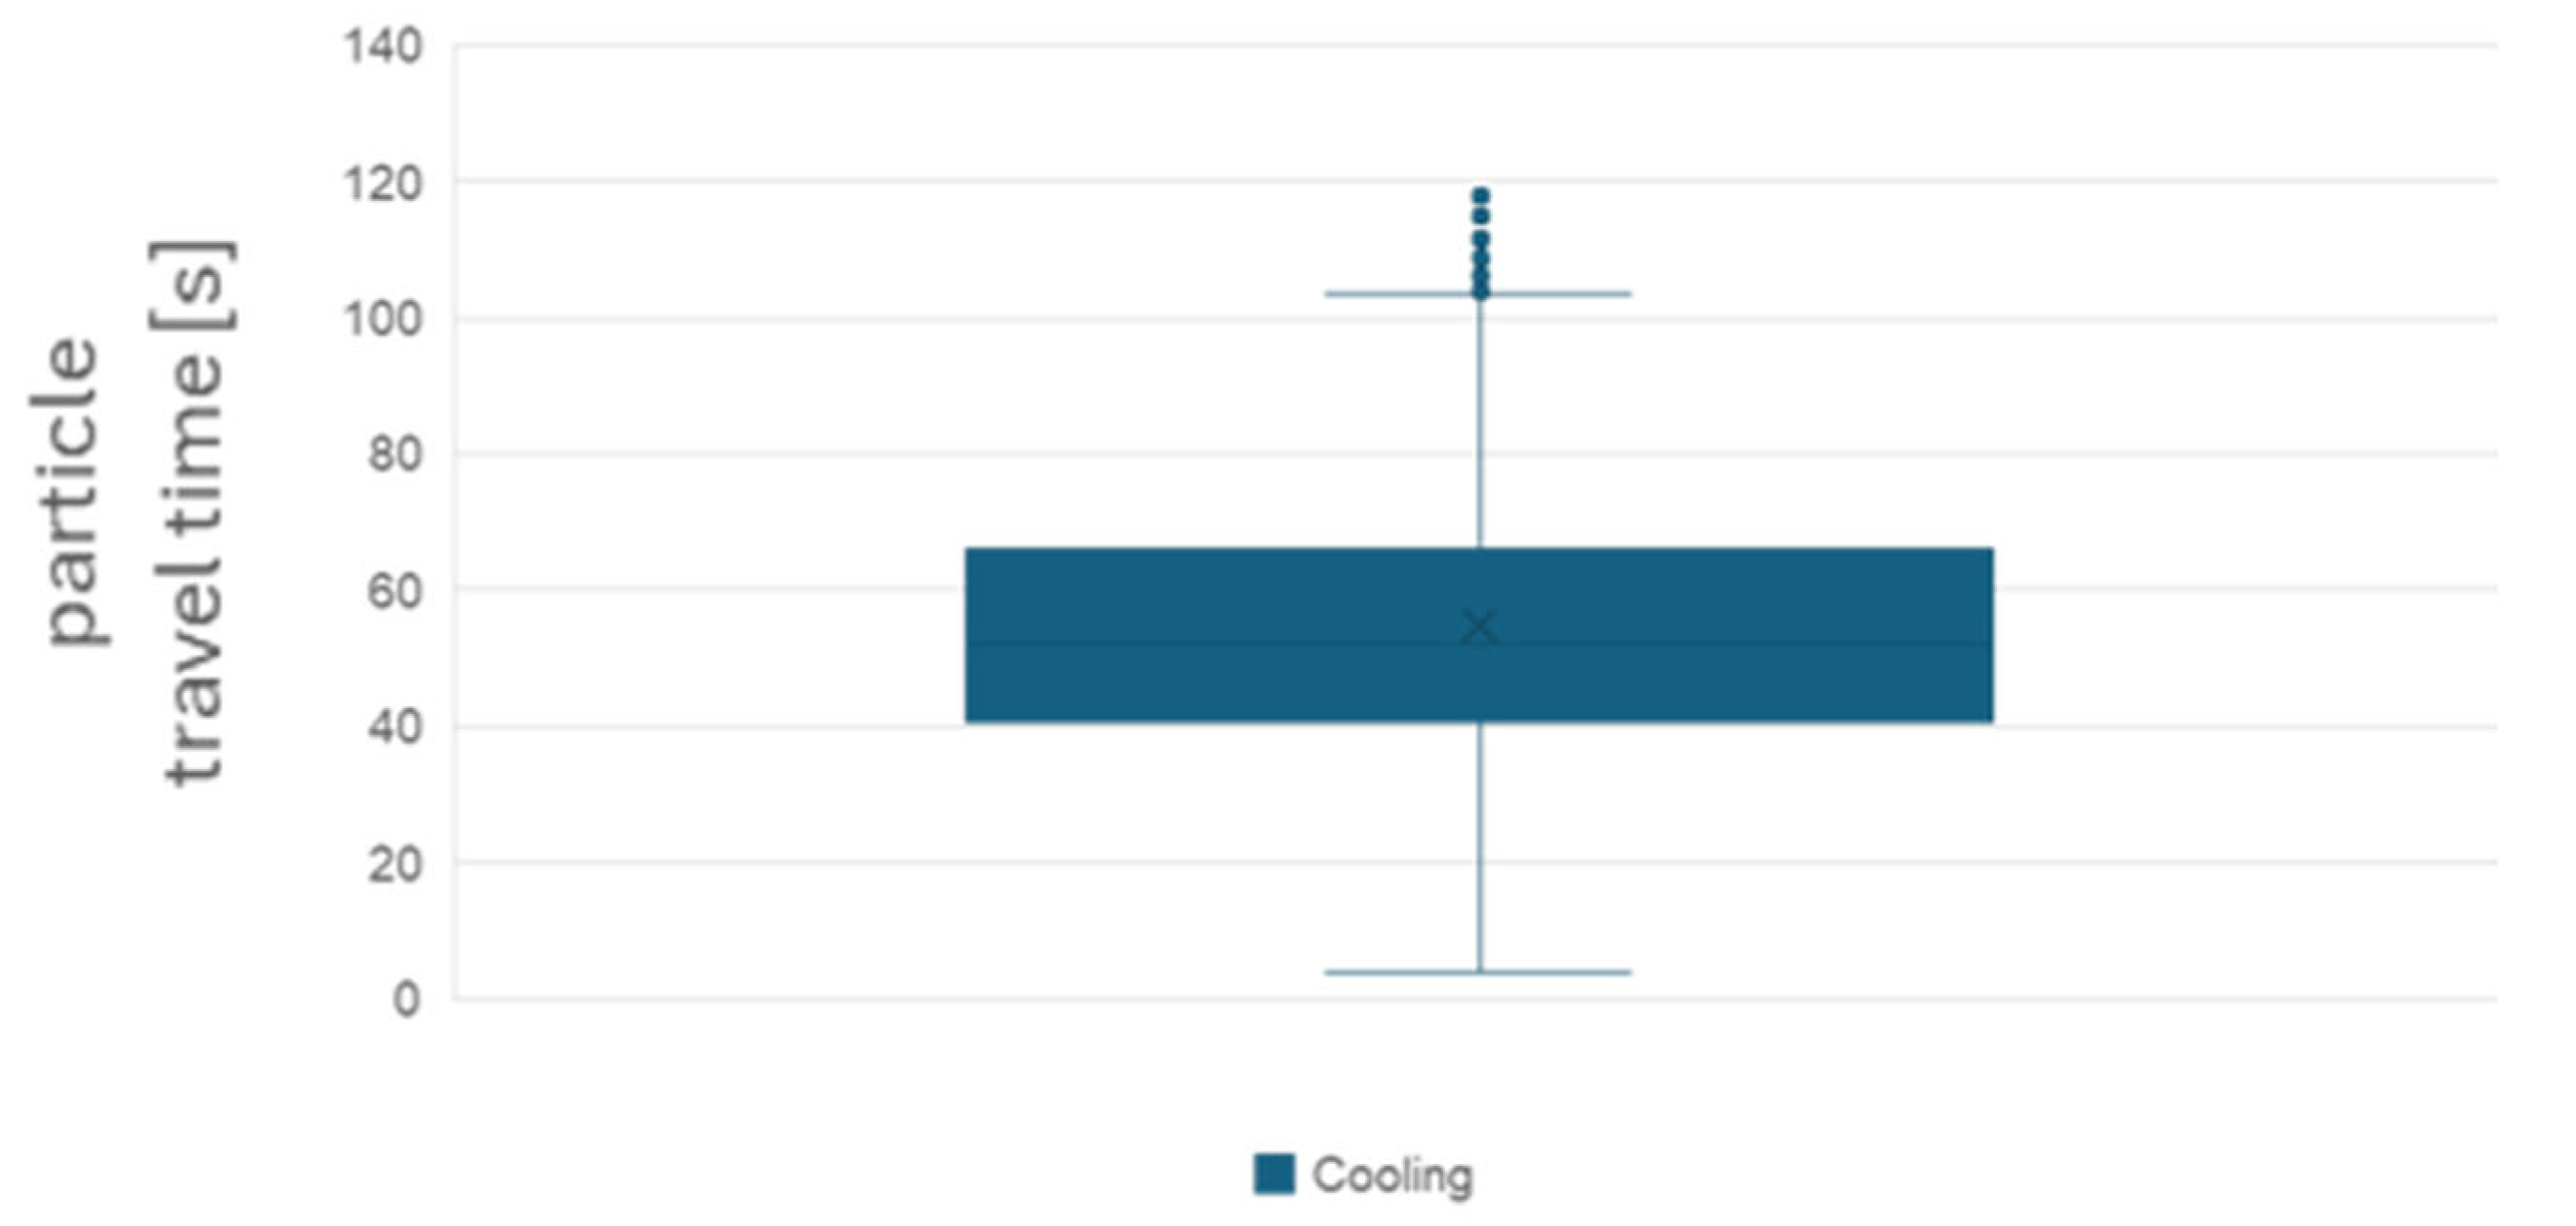
With the Lagrangian model, it was possible to mark a single particle and track its fate, “measuring” the time from emission to the moment it enters the 50 cm diameter respiratory sphere. Focusing on the particles that entered the respiratory sphere in the 120 s since their emission, in
Figure 11 the distribution of travel times is depicted for the cooling and heating scenarios. It can be observed that the average time to the respiratory volume is close to 60 s and that a non-negligible proportion of the particles reaches the volume in a shorter time period. The deactivation effect after 40 s of exposure to MWs is assumed to be around 60% (40% survival rate). The analysis of
Figure 11 is critical to the evaluation of the reduction in the risk of contagion.
The Eulerian simulations generated concentration contours of the gas in various regions of the room. A limitation of this approach lies in the homogenous dispersion assumption that correlates gas concentration (solved as a scalar transport in the simulations) to the particle spectral concentration and the viral loads. In fact, only the smallest diameter particles have a diffusion and advection behavior very close to the gas. At a short distance and time after emission, the respiratory jet might generate a different distribution of particles than in the case of gas. Nonetheless, the Eulerian approach allows for much longer transient simulations and even steady-state ones, which can be used to analyze the ventilation efficiency of the room.
Figure 12 shows the strong deflection effect of the thermal plume of the emitter individual due to the motion field imposed by the air diffuser.
Table 5 reports the gas concentrations in the proximity of the two susceptible individuals with and without the E4Shield device (in both placements). Although using gas as a proxy is appropriate for respiratory particles with diameters below 5 microns, it should be noted that the particles analyzed in this study were considered to be up to 800 microns in diameter. This assumption does not contradict the use of gas as a proxy for respiratory particles. More than 94% of the particles had diameters less than 5 microns, while the remaining particles quickly fall to the ground due to gravity. These larger particles do not become suspended in the air and therefore do not contribute to the risk of infection [
29,
38,
40,
41].
3.3. Risk Contamination Outcome
By integrating data from both simulations, the aerosol concentrations within the reference volumes of susceptible individuals were determined. From these concentrations, the inhalable amounts over a specified time frame were estimated and the corresponding absorbed doses were calculated, both with and without the effects of the E4Shield device. Utilizing the ARIA model, these doses were then correlated with the probability of infection, which was defined as the risk under analysis. The risk rates, characterized by a margin of uncertainty, are presented as a range encompassing the values derived from both the Eulerian and Lagrangian simulations.
The results obtained are summarized in
Table 6.
4. Discussion
The inhalation of aerosols and droplets emitted by infected individuals is the predominant route of respiratory virus transmission for viruses such as SARS-CoV-2. The spread of these droplets is affected by their size and the surrounding environmental conditions.
In this study, fluid-dynamics simulations were employed to examine the dispersion of particles emitted by an infectious individual. Additionally, mathematical models were utilized to assess the infection potential for susceptible individuals. A real scenario has been modeled, and the risk of infection has been proved to be significant.
Two CFD modeling approaches were used: the Lagrangian and Eulerian approaches. The Lagrangian method, which tracks the motion of individual particles within the study environment, provides the detailed descriptions necessary to evaluate the deactivation effect of the E4Shield when the particles have travelled for a short time from mouth to mouth, which characterizes the direct route of the contagion. The Eulerian method is an alternative computational approach, the results of which showed a good agreement with the Lagrangian approach at a much lower computational costs, which allows for longer transient simulations. Nonetheless, the approach lacks detailed descriptions of short distance phenomena.
To estimate the risk of infection with the introduction of an E4Shield sanitizing device into the environment, a series of preliminary electromagnetic simulations has been conducted. The E4Shield device utilizes microwave irradiation to inactivate the respiratory virus responsible for airborne COVID-19 transmission. The microwaves emitted by this device are compatible with the presence of humans, therefore this device can be used in these kinds of scenarios.
Our investigations involved evaluating the electromagnetic field emitted by the device, which was then integrated with fluid-dynamic studies, the ARIA contamination risk model, and experimentally obtained inactivation rates. Two different positions of the E4Shield device were studied, both of which ensured a substantial reduction in the estimated risk of infection thanks to the virucidal effect achieved by the electromagnetic waves. The reduction in risk between these two positions is not significant. This is because, in both scenarios, the device is positioned between the two individuals who are facing each other. Nevertheless, the risk of infection is drastically lowered by the inclusion of the device.
5. Conclusions
In this study, the effectiveness of the E4Shield device in reducing the risk of SARS-CoV-2 contamination was evaluated using simulations of real-world scenarios, with a particular focus on office environments. The evaluation was conducted under a single environmental condition, specifically a summer scenario with a mixed ventilation system.
For future developments, it would be valuable to evaluate various thermofluid-dynamic scenarios within the same type of real environment (i.e., winter cases), considering different emission types from infected individuals. Additionally, assessing environments of different natures, including those with higher crowd densities, could provide further insights. Regarding electromagnetic considerations, more detailed experimental studies on the inactivation of pathogens within subminute timescales are necessary. In addition, it is of particular relevance to this study to conduct experiments that replicate the characteristics of this environment. These experiments will allow for an analysis of the accuracy and validity of the simulations performed.
Regardless, the findings of this work have significant implications for public health, particularly in the context of maintaining safe and healthy workspaces during and beyond the current pandemic. Our research contributes to the growing body of knowledge on innovative disinfection technologies and offers practical solutions for mitigating airborne contagion risks in office environments.
Author Contributions
Conceptualization, P.B. and M.S.; methodology, P.B. and M.S.; software, M.L., M.S., M.V. and H.R.; validation, M.S., M.V. and H.R.; formal analysis, M.S., M.V. and H.R.; investigation, M.L., M.S., M.V. and H.R.; resources, M.L. and M.S.; data curation, M.L., M.S., M.V. and H.R.; writing—original draft preparation, M.L., M.S., M.V. and H.R.; writing—review and editing, P.B. and A.M.; visualization, M.L., M.S., M.V. and H.R.; supervision, A.M.; project administration, P.B.; funding acquisition, A.M. All authors have read and agreed to the published version of the manuscript.
Funding
The authors declare that this study received funding from Elettronica SpA. The funder was involved in the study by providing sponsorship.
Institutional Review Board Statement
Not applicable.
Informed Consent Statement
Not applicable.
Data Availability Statement
The original contributions presented in this study are included in the article. Further inquiries can be directed to the corresponding author.
Conflicts of Interest
Authors M. Losardo, P. Bia and A. Manna are employed by the company Elettronica SpA. The remaining authors declare that the research was conducted in the absence of any commercial or financial relationships that could be construed as a potential conflict of interest.
References
- Comber, L.; Murchu, E.O.; Drummond, L.; Carty, P.G.; Walsh, K.A.; De Gascun, C.F.; Connolly, M.A.; Smith, S.M.; O’Neill, M.; Ryan, M.; et al. Airborne transmission of SARS-CoV-2 via aerosols. Rev. Med. Virol. 2021, 31, e2184. [Google Scholar] [CrossRef]
- Zuo, Y.Y.; Uspal, W.E.; Wei, T. Airborne transmission of COVID-19: Aerosol dispersion, lung deposition, and virus-receptor interactions. ACS Nano 2020, 14, 16502–16524. [Google Scholar] [CrossRef]
- WHO Scientific. Transmission of SARS-CoV-2: Implications for Infection Prevention Precautions; World Health Organization: Geneva, Switzerland, 2020. [Google Scholar]
- Lewis, D. Why the WHO took two years to say COVID is airborne. Nature 2022, 604, 26–31. [Google Scholar] [CrossRef] [PubMed]
- Stadnytskyi, V.; Bax, C.E.; Bax, A.; Anfinrud, P. The airborne lifetime of small speech droplets and their potential importance in SARS-CoV-2 transmission. Proc. Natl. Acad. Sci. USA 2020, 117, 11875–11877. [Google Scholar] [CrossRef] [PubMed]
- Duguid, J.P. The size and the duration of air-carriage of respiratory droplets and droplet-nuclei. Epidemiol. Infect. 1946, 44, 471–479. [Google Scholar] [CrossRef]
- Morawska, L.J.G.R.; Johnson, G.R.; Ristovski, Z.D.; Hargreaves, M.; Mengersen, K.; Corbett, S.; Chao, C.Y.H.; Li, Y.; Katoshevski, D. Size distribution and sites of origin of droplets expelled from the human respiratory tract during expiratory activities. J. Aerosol Sci. 2009, 40, 256–269. [Google Scholar] [CrossRef]
- Rayegan, S.; Shu, C.; Berquist, J.; Jeon, J.; Zhou, L.; Wang, L.; Mbareche, H.; Tardif, P.; Ge, H. A review on indoor airborne transmission of COVID-19–modelling and mitigation approaches. J. Build. Eng. 2023, 64, 105599. [Google Scholar] [CrossRef]
- Agarwal, N.; Meena, C.S.; Raj, B.P.; Saini, L.; Kumar, A.; Gopalakrishnan, N.; Kumar, A.; Balam, N.B.; Alam, T.; Kapoor, N.R.; et al. Indoor air quality improvement in COVID-19 pandemic. Sustain. Cities Soc. 2021, 70, 102942. [Google Scholar] [CrossRef]
- Mata, T.M.; Martins, A.A.; Calheiros, C.S.C.; Villanueva, F.; Alonso-Cuevilla, N.P.; Gabriel, M.F.; Silva, G.V. Indoor air quality: A review of cleaning technologies. Environments 2022, 9, 118. [Google Scholar] [CrossRef]
- Maggos, T.; Binas, V.; Siaperas, V.; Terzopoulos, A.; Panagopoulos, P.; Kiriakidis, G. A promising technological approach to improve indoor air quality. Appl. Sci. 2019, 9, 4837. [Google Scholar] [CrossRef]
- Wang, P.-J.; Pang, Y.-H.; Huang, S.-Y.; Fang, J.-T.; Chang, S.-Y.; Shih, S.-R.; Huang, T.-W.; Chen, Y.-J.; Sun, C.-K. Microwave resonant absorption of SARS-CoV-2 viruses. Sci. Rep. 2022, 12, 12596. [Google Scholar] [CrossRef] [PubMed]
- Hoff, B.W.; McConaha, J.W.; Cohick, Z.W.; Franzi, M.A.; Enderich, D.A.; Revelli, D.; Cox, J.; Irshad, H.; Pohle, H.H.; Schmitt-Sody, A.; et al. Apparatus for controlled microwave exposure of aerosolized pathogens. Rev. Sci. Instrum. 2021, 92, 014707. [Google Scholar] [CrossRef]
- Law, V.J.; Dowling, D.P. Dowling. Microwave detection, disruption, and inactivation of microorganisms. Am. J. Anal. Chem. 2022, 13, 135–161. [Google Scholar] [CrossRef]
- Yang, S.-C.; Lin, H.-C.; Liu, T.-M.; Lu, J.-T.; Hung, W.-T.; Huang, Y.-R.; Tsai, Y.-C.; Kao, C.-L.; Chen, S.-Y.; Sun, C.-K. Efficient structure resonance energy transfer from microwaves to confined acoustic vibrations in viruses. Sci. Rep. 2015, 5, 18030. [Google Scholar] [CrossRef]
- Xiao, Y.; Zhao, L.; Peng, R. Effects of electromagnetic waves on pathogenic viruses and relevant mechanisms: A review. Virol. J. 2022, 19, 161. [Google Scholar] [CrossRef]
- Sadraeian, M.; Kabakova, I.; Zhou, J.; Jin, D. Virus inactivation by matching the vibrational resonance. Appl. Phys. Rev. 2024, 11, 021324. [Google Scholar] [CrossRef]
- Wu, Y.; Yao, M. In situ airborne virus inactivation by microwave irradiation. Chin. Sci. Bull. 2014, 59, 1438–1445. [Google Scholar] [CrossRef] [PubMed]
- Manna, A.; De Forni, D.; Bartocci, M.; Pasculli, N.; Poddesu, B.; Lista, F.; De Santis, R.; Amatore, D.; Grilli, G.; Molinari, F.; et al. SARS-CoV-2 inactivation in aerosol by means of radiated microwaves. Viruses 2023, 15, 1443. [Google Scholar] [CrossRef]
- Manna, A.; Forni, D.; Bartocci, M.; Pasculli, N.; Poddesu, B.; Vincentelli, A.S.; Lori, F. Endemic respiratory viruses inactivation in aerosol by means of radiated microwaves. Med. Res. Arch. 2023, 11. [Google Scholar] [CrossRef]
- Bartocci, M.; Bia, P.; Manna, A.; Pasculli, N. SARS-CoV-2 and H1N1 Inactivation in Aerosol by Means of Radiated Microwaves with Novel Setup. In Proceedings of the 2024 IEEE International Symposium on Antennas and Propagation and INC/USNC-URSI Radio Science Meeting (AP-S/INC-USNC-URSI), Firenze, Italy, 14–19 July 2024. [Google Scholar]
- Bia, P.; Losardo, M.; Manna, A.; Brusaferro, S.; Privitera, G.P.; Vincentelli, A.S. Selected microwave irradiation effectively inactivates airborne avian influenza A (H5N1) virus. Sci. Rep. 2025, 15, 2021. [Google Scholar] [CrossRef]
- Sheikhnejad, Y.; Aghamolaei, R.; Fallahpour, M.; Motamedi, H.; Moshfeghi, M.; Mirzaei, P.A.; Bordbar, H. Airborne and aerosol pathogen transmission modeling of respiratory events in buildings: An overview of computational fluid dynamics. Sustain. Cities Soc. 2022, 79, 103704. [Google Scholar] [CrossRef] [PubMed]
- Peng, S.; Chen, Q.; Liu, E. The role of computational fluid dynamics tools on investigation of pathogen transmission: Prevention and control. Sci. Total Environ. 2020, 746, 142090. [Google Scholar] [CrossRef] [PubMed]
- Tsang, T.-W.; Mui, K.-W.; Wong, L.-T. Computational Fluid Dynamics (CFD) studies on airborne transmission in hospitals: A review on the research approaches and the challenges. J. Build. Eng. 2023, 63, 105533. [Google Scholar] [CrossRef]
- Tissue Properties Query. Available online: http://niremf.ifac.cnr.it/tissprop/htmlclie/uniquery.php?func=stfrfun&tiss=Muscle&freq=&outform=disphtm&tisname=on&frequen=on&conduct=on&permitt=on&losstan=on&wavelen=on&pendept=on&freq1=1000000&tissue2=Muscle&frqbeg=8e9&frqend=12e9&mode=lin&linstep=100&logstep=5&tissue3=Muscle&freq3= (accessed on 19 November 2024).
- Ziegelberger, G.; Croft, R.; Feychting, M.; Green, A.C.; Hirata, A.; d’Inzeo, G.; Jokela, K.; Loughran, S.; Marino, C.; Miller, S.; et al. Guidelines for limiting exposure to electromagnetic fields (100 kHz to 300 GHz). Health Phys. 2020, 118, 483–524. [Google Scholar]
- ARIA Tools. Available online: https://partnersplatform.who.int/tools/aria/ (accessed on 19 November 2024).
- Gao, N.; Niu, J.; Morawska, L. Distribution of respiratory droplets in enclosed environments under different air distribution methods. Build. Simul. 2008, 1, 326–335. [Google Scholar] [CrossRef]
- Cortellessa, G.; Stabile, L.; Arpino, F.; Faleiros, D.; Bos, W.v.D.; Morawska, L.; Buonanno, G. Close proximity risk assessment for SARS-CoV-2 infection. Sci. Total Environ. 2021, 794, 148749. [Google Scholar] [CrossRef]
- Cortellessa, G.; Canale, C.; Stabile, L.; Grossi, G.; Buonanno, G.; Arpino, F. Effectiveness of a portable personal air cleaner in reducing the airborne transmission of respiratory pathogens. Build. Environ. 2023, 235, 110222. [Google Scholar] [CrossRef]
- Xie, X.; Li, Y.; Chwang, A.T.; Ho, P.L.; Seto, W.H. How far droplets can move in indoor environments–revisiting the wells evaporation–falling curve. Indoor Air 2007, 17, 211. [Google Scholar] [CrossRef]
- Nicas, M.; Nazaroff, W.W.; Hubbard, A. Toward understanding the risk of secondary airborne infection: Emission of respirable pathogens. J. Occup. Environ. Hyg. 2005, 2, 143–154. [Google Scholar] [CrossRef]
- Vuorinen, V.; Aarnio, M.; Alava, M.; Alopaeus, V.; Atanasova, N.; Auvinen, M.; Balasubramanian, N.; Bordbar, H.; Erästö, P.; Grande, R.; et al. Modelling aerosol transport and virus exposure with numerical simulations in relation to SARS-CoV-2 transmission by inhalation indoors. Saf. Sci. 2020, 130, 104866. [Google Scholar] [CrossRef]
- Dbouk, T.; Drikakis, D. On respiratory droplets and face masks. Phys. Fluids 2020, 32, 063303. [Google Scholar] [CrossRef] [PubMed]
- Balachandar, S.; Zaleski, S.; Soldati, A.; Ahmadi, G.; Bourouiba, L. Host-to-host airborne transmission as a multiphase flow problem for science-based social distance guidelines. Int. J. Multiph. Flow 2020, 132, 103439. [Google Scholar] [CrossRef]
- Wells, W.F. On air-borne infection: Study II. Droplets and droplet nuclei. Am. J. Epidemiol. 1934, 20, 611–618. [Google Scholar] [CrossRef]
- Su, W.; Yang, B.; Melikov, A.; Liang, C.; Lu, Y.; Wang, F.; Li, A.; Lin, Z.; Li, X.; Cao, G.; et al. Infection probability under different air distribution patterns. Build. Environ. 2022, 207, 108555. [Google Scholar] [CrossRef]
- Rudnick, S.N.; Milton, D.K. Risk of indoor airborne infection transmission estimated from carbon dioxide concentration. Indoor Air 2003, 13, 237. [Google Scholar] [CrossRef]
- Zhang, D.; Bluyssen, P.M. Exploring the possibility of using CO2 as a proxy for exhaled particles to predict the risk of indoor exposure to pathogens. Indoor Built Environ. 2023, 32, 1958–1972. [Google Scholar] [CrossRef]
- Ai, Z.; Mak, C.M.; Gao, N.; Niu, J. Tracer gas is a suitable surrogate of exhaled droplet nuclei for studying airborne transmission in the built environment. Build. Simul. 2020, 13, 489–496. [Google Scholar] [CrossRef]
Figure 1.
Real environment study: (a) Laboratory Office at Energy Center Lab (the Polytechnic University of Turin); (b) planimetry of the Office Lab.
Figure 1.
Real environment study: (a) Laboratory Office at Energy Center Lab (the Polytechnic University of Turin); (b) planimetry of the Office Lab.
Figure 2.
Geometric model for the environment ‘Office’.
Figure 2.
Geometric model for the environment ‘Office’.
Figure 3.
E4Shield device.
Figure 3.
E4Shield device.
Figure 4.
E4Shield device: (a) antenna design; (b) device’s radiation pattern @9 GHz (CST Studio Suite2024).
Figure 4.
E4Shield device: (a) antenna design; (b) device’s radiation pattern @9 GHz (CST Studio Suite2024).
Figure 5.
E4Shield device’s placement in CST simulations: (a) device in the middle of the main wall (1.7 m from the ground); (b) device on the main table between the two individuals.
Figure 5.
E4Shield device’s placement in CST simulations: (a) device in the middle of the main wall (1.7 m from the ground); (b) device on the main table between the two individuals.
Figure 6.
Probability of infection as a function of viral load provided by the ARIA model.
Figure 6.
Probability of infection as a function of viral load provided by the ARIA model.
Figure 7.
Time-dependent reduction of SARS-CoV-2 concentration obtained experimentally with values of electromagnetic field amplitudes greater than 6 V/m and the linear trendline adopted in the simulations.
Figure 7.
Time-dependent reduction of SARS-CoV-2 concentration obtained experimentally with values of electromagnetic field amplitudes greater than 6 V/m and the linear trendline adopted in the simulations.
Figure 8.
Simulation of E4Shield device’s E-field in the office: the device was placed on the wall between the two individuals at 1.7 m from the ground. In this figure, the E-field amplitude evaluated in CST @9 GHz is shown: (a) view in the xy plane (z = 1 m); (b) view in the zx plane (y = 1 m).
Figure 8.
Simulation of E4Shield device’s E-field in the office: the device was placed on the wall between the two individuals at 1.7 m from the ground. In this figure, the E-field amplitude evaluated in CST @9 GHz is shown: (a) view in the xy plane (z = 1 m); (b) view in the zx plane (y = 1 m).
Figure 9.
Simulation of E4Shield device’s E-field in the office: the device was placed on the table between the two individuals. In this figure, the E-field amplitude evaluated in CST @9 GHz is shown: (a) view in the xy plane (z = 1 m); (b) view in the zx plane (y = 1.5 m).
Figure 9.
Simulation of E4Shield device’s E-field in the office: the device was placed on the table between the two individuals. In this figure, the E-field amplitude evaluated in CST @9 GHz is shown: (a) view in the xy plane (z = 1 m); (b) view in the zx plane (y = 1.5 m).
Figure 10.
Lagrangian simulation: states corresponding to different moments of the transient in the summer case with mixed system (a) at 10 s and (b) at 60 s.
Figure 10.
Lagrangian simulation: states corresponding to different moments of the transient in the summer case with mixed system (a) at 10 s and (b) at 60 s.
Figure 11.
Distribution of particles travel times from the mouth to the respiratory sphere.
Figure 11.
Distribution of particles travel times from the mouth to the respiratory sphere.
Figure 12.
Eulerian simulation: radiant system with primary air, summer season.
Figure 12.
Eulerian simulation: radiant system with primary air, summer season.
Table 1.
Dielectric properties of human muscle at different frequencies (from IFAC-CNR).
Table 1.
Dielectric properties of human muscle at different frequencies (from IFAC-CNR).
| Frequency [GHz] | Conductivity [S/m] | Relative
Permittivity | Loss
Tangent |
|---|
| 8 | 7.7978 | 45.497 | 0.38511 |
| 9 | 9.1923 | 44.126 | 0.41607 |
| 10 | 10.626 | 42.764 | 0.44666 |
| 11 | 12.083 | 41.419 | 0.47672 |
| 12 | 13.55 | 40.101 | 0.50616 |
Table 2.
Boundary conditions for summer conditions.
Table 2.
Boundary conditions for summer conditions.
| Season | Characteristic | Value |
|---|
| Summer | T_Human_Head [K] | 310 |
| T_Human_Body [K] | 300 |
| Air_Density [kg/m3] | 1.1762 |
| T_Windows [K] | 302 |
| T_Walls [K] | 300 |
| | T_Office [K] | 300 |
| | T_Air [K] | 298 |
| | Volume_Flow_Rate_X_Fan [m3/s] | 0.0333–0.0666 |
Table 3.
Infected individual’s emission conditions.
Table 3.
Infected individual’s emission conditions.
| Activity | Normal Speaking | Breathing | Normal Breathing |
|---|
| Exhale Velocity [m/s] | Sinusoidal (0–1) and peak of 5 | 1 | Sinusoidal 0–1 |
| Duration [s] | 9.2 | 12.5 | 40 (20 top of the area) |
Table 4.
Dimensional spectrum of bio-aerosol emission from the infected individual.
Table 4.
Dimensional spectrum of bio-aerosol emission from the infected individual.
| Diameter [µm] | <1 | 1–3.8 | 3.8–6.6 | 6.6–14.7 | 14.7–19.2 | 90–120 | 120–800 |
Emission rate
(particle/s) | 217.6 | 20.3 | 3.1 | 5.7 | 1.8 | 1.6 | 4.6 |
Table 5.
Gas concentrations in the proximity of the near and far susceptible individuals, with and without an active E4Shield placed on the wall or table.
Table 5.
Gas concentrations in the proximity of the near and far susceptible individuals, with and without an active E4Shield placed on the wall or table.
| Scenario | E4Shield Position | Nearby Individual | Distant Individual |
|---|
| Summer: radiant system with primary air | | CO2 passive scalar | CO2 passive scalar after device operation | CO2 passive scalar | CO2 passive scalar after device operation |
| Wall | 8.1 × 10⁻⁴ | 0.20 × 8.1 × 10−4 | 7.2 × 10⁻⁴ | 0.6 × 7.2 × 10−4 |
| Table | 8.1 × 10⁻⁴ | 0.02 × 8.1 × 10−4 | 7.2 × 10⁻⁴ | 0.6 × 7.2 × 10−4 |
Table 6.
Summary of E4Shield system de-activation results on the considered scenarios.
Table 6.
Summary of E4Shield system de-activation results on the considered scenarios.
Environment
Configuration | ARIA Model
Risk | ARIA Model
Risk—E4Shield on Table | ARIA Model
Risk—E4Shield on Wall |
|---|
| Lab Office: mixed radiant ceiling and primary air system, summer case | 32% | 6–7% | 7–8% |
| Disclaimer/Publisher’s Note: The statements, opinions and data contained in all publications are solely those of the individual author(s) and contributor(s) and not of MDPI and/or the editor(s). MDPI and/or the editor(s) disclaim responsibility for any injury to people or property resulting from any ideas, methods, instructions or products referred to in the content. |
© 2025 by the authors. Licensee MDPI, Basel, Switzerland. This article is an open access article distributed under the terms and conditions of the Creative Commons Attribution (CC BY) license (https://creativecommons.org/licenses/by/4.0/).


 ,
, 


