Abstract
Monitoring forearm muscle contraction force in home-based rehabilitation remains challenging. Electromyography (EMG), as a standard technique, is considered impractical and complex for independent use by patients at home, which poses a risk of device misattachment and inaccurate recorded data. Considering the muscle-related modality, several studies have demonstrated an excellent correlation between stretch sensors and EMG, which provides significant potential for addressing the monitoring issue at home. Additionally, due to its flexible nature, it can be attached to the finger, which facilitates the logging of the kinematic mechanisms of a finger. This study proposes a method for estimating forearm muscle contraction in a cylinder grasping environment during home-based rehabilitation using a stretch-sensor glove. This study employed support vector machine (SVM), multi-layer perceptron (MLP), and random forest (RF) to construct the estimation model. The root mean square (RMS) of the EMG signal, representing the muscle contraction force, was collected from 10 participants as the target learning for the stretch-sensor glove. This study constructed an experimental design based on a home-based therapy protocol known as the graded repetitive arm supplementary program (GRASP). Six cylinders with varying diameters and weights were employed as the grasping object. The results demonstrated that the RF model achieved the lowest root mean square error (RMSE) score, which differed significantly from the SVM and MLP models. The time series waveform comparison revealed that the RF model yields a similar estimation output to the ground truth, which incorporates the contraction–relaxation phases and the muscle’s contraction force. Additionally, despite the subjectivity of the participants’ grasping power, the RF model could produce similar trends in the muscle contraction forces of several participants. Utilizing a stretch-sensor glove, the proposed method demonstrated great potential as an alternative modality for monitoring forearm muscle contraction force, thereby improving the practicality for patients to self-implement home-based rehabilitation.
1. Introduction
Skeletal muscle is crucial for generating strength and force for daily tasks, comprising 40% of the body and being primarily located near the surface [1,2]. Despite its importance, it is prone to injury, especially in the forearm and hand, where injuries account for 6.6% to 28.6% of cases, often occurring in sports, industrial work, and daily activities [3]. Muscle dysfunction can lead to irregularities in contraction force and movement, with forearm muscles playing a significant role in hand and finger movements. Untreated injuries may lead to permanent abnormalities.
Rehabilitation is a standard treatment for muscle injuries, integrating medical, social, educational, and vocational interventions to restore functional abilities [4]. Recent research shows that home-based rehabilitation is effective, providing individuals better access and allowing more time for retraining [5]. Additionally, since the approach is both affordable and readily available, therapy can continue until the individual is satisfied with their ability to perform daily activities independently. One of the methods known for its safety, practicality, and affordability is the graded repetitive arm supplementary program (GRASP). GRASP consists of several exercises, one of which is the coordination function designed to enhance the affected hand’s ability to perform daily activities using affordable and everyday tools, such as lifting or pouring with cylinder objects [6]. A key point during the program is to ensure that the exercises are challenging for the patients. Thus, several cylinder sizes and weight variations are applicable. However, monitoring muscle conditions during home-based therapy presents challenges.
Monitoring the condition of the muscle, especially during functional activities such as cylindrical grasping, is essential to observe any existing abnormalities comprehensively. One viable method for understanding muscle condition is estimating the muscle contraction force [7]. Muscle contraction force provides the contraction information emitted by a muscle associated with a movement, enabling the observation of abnormal conditions in a muscle related to the specific movement. Electromyography (EMG) is one of the common modalities to estimate the contraction force of the muscle [8,9]. Most studies utilized EMG, as it directly correlates with muscle activity and showed promising results. Nevertheless, EMG is acknowledged for its complexity, applicability, and low signal-to-noise ratio (SNR). Several studies have highlighted the limitations of EMG in estimating muscle contraction force due to interference patterns, delay limitations, the need for subjective perception, and complex reconstruction or self-calibration procedures [7,9,10,11]. Despite the direct correlation with muscle, the nature of EMG is associated with several shortcomings regarding usability and wearability aspects for the user.
Considering the alternative modality to the muscle, several studies have introduced an excellent correlation between the stretch sensor and EMG [12,13,14]. Studies show a strong correlation between stretch sensors and EMG for evaluating muscle activation timing [12]. Stretch sensors offer advantages such as softness, flexibility, low power consumption, and ease of integration with microelectronics, capturing finger kinematic mechanisms and facilitating the logging of complex movements [13]. These findings suggest that the stretch sensor has great potential as an alternative to EMG for muscle monitoring. Despite its great features and potential, it remains unexplored whether the stretch sensor can accurately estimate the muscle contraction force, as represented by the root mean square (RMS) of the EMG signal, which becomes the main issue addressed in this study.
This study attempted to address the issues of convenience and practicality associated with using EMG sensors as monitoring tools for home-based rehabilitation. This study proposes a method to estimate the contraction force of the forearm muscles through a stretch-sensor glove, where the muscle contraction force is expressed as the RMS value of the linear envelope of the electromyography (EMG) signal. Kinematic information of the finger is captured by the stretch sensor as input to learn the forearm muscle contraction force. The experimental design was constructed by adopting the essence of cylinder grasping activity with varying sizes and weights based on the home-based therapy program of GRASP.
2. Related Research
2.1. Home-Based Therapy and the Monitoring Challenge
Home-based physical therapy has emerged as an effective and cost-efficient approach to improving patient outcomes and quality of life. It was reported that after being discharged from the hospital, patients were dissatisfied with the subsequent in-hospital training options, and 85% of patients prefer home-based therapy [15,16]. Recent research has demonstrated the efficacy of home-based therapy for stroke patients, showing comparable functional outcomes to institutional care while reducing costs and improving patient satisfaction [17]. Home therapy programs have expanded to include various disciplines, including physiotherapy and occupational therapy. These services can be crucial in emergencies, but more research is needed to develop comprehensive models, especially in the monitoring function [18]. Monitoring patients’ progress in home environments presents challenges and opportunities for improved care [19]. Several technologies have been proposed to address this, including video game-based systems, web-based platforms, and wireless motion sensors [20,21,22]. Interestingly, wearable devices or camera-based systems are emerging as cost-effective, non-intrusive options for remote monitoring [23], while these technologies show promise, improving the independence of rehabilitation at home by enhancing user-friendliness remains an area for further investigation and development.
2.2. Monitoring the Contraction Force of Muscle
One of the primary monitoring purposes is to observe the muscle contraction force [7]. Monitoring the contraction force of muscle has been widely acknowledged due to its usefulness in evaluating musculoskeletal health and aiding in the diagnosis of various conditions. A study suggested that measuring the maximal voluntary contraction force and range of motion helps quantify human muscle injury [24]. Another study highlighted the role of a specific force in muscle injury, which potentially plays a significant role in exercise-induced muscle injury, requiring the observation of muscle force associated with training [25]. Meanwhile, a study utilized force measurement to assess muscle damage and recovery in animal models [26]. In the context of forearm muscle, a study has shown that forearm muscle activity varies significantly across different grasps, whereas cylindrical grasps show the highest muscle force [27]. The studies suggest that monitoring muscle contraction force is an essential procedure for understanding the actual condition of the muscle, particularly the cylindrical grasp, which is one of the most commonly used grasps in activities of daily living.
2.3. Estimation of the Muscle Contraction Force
Monitoring the muscle contraction force is possible using the estimation method. Several studies have introduced potential modalities for estimating the muscle contraction force. A study compared the conventional method of Hill’s musculoskeletal actuator type with the EMG-based estimation method for reaching and grasping a cylinder object [28]. They confirmed that the EMG-based estimation, a more direct approach, showed promising performance. A study developed an estimation system using joint angles from goniometers and EMG signals [29]. Another study combined EMG and joint angle to predict muscle force [30]. The aforementioned studies have shown that EMG is a viable modality due to its direct relationship with muscle activity. Nevertheless, EMG-based approaches are limited by the precision of the recording, as they have a low signal-to-noise ratio (SNR) and a complicated self-calibration procedure. Furthermore, EMG installation is limited to experts, which makes it less practical for patients to use at home.
2.4. Utilization of the Stretch Sensor to Estimate the Contraction Force of Muscle
Recent studies have used stretch sensors to estimate muscle contraction force. One developed a fabric stretch sensor to monitor muscle activity during leg motions [31]. Another demonstrated a wearable soft strain sensor sensitive to isometric contractions, tracking changes in muscle deformation [32]. A further study introduced Motion Tape, a self-adhesive, elastic fabric skin-strain sensor that monitors muscle engagement during activities such as biceps curls [33]. Additionally, a handgrip strength estimation system was created using a flexible deformation sensor, achieving good accuracy and stability [34]. However, these studies do not provide necessary finger-kinematic information for finger activity, especially cylinder grasping. This limitation suggests that they focus on normal muscle conditions without considering finger shape, which is crucial for accurate monitoring as it indicates the hand’s actual kinematic information.
Subsequently, several studies have demonstrated the outstanding performance of stretch sensors attached to the finger and glove in providing shape and kinematic information about the finger [13,35,36,37]. The studies demonstrated the feasibility of the stretch sensor for monitoring cylindrical grasping by tracking joint angles and finger movements. Nevertheless, the studies only provide kinematic information about the finger, which is a peripheral outcome of the primary source, the muscle contraction force.
Regarding the aforementioned studies, although there is a fundamental discrepancy between the EMG and stretch sensor approaches, they share a particular relationship. EMG is directly correlated with muscle information, while the stretch sensor is limited to kinematic information only, which is considered insufficient; however, it provides the actual condition of finger shape while grasping a cylinder. Therefore, the proposed method attempted to utilize the stretch sensor to estimate the force of the forearm muscle contraction, especially in cylindrical grasping. As part of the proposed method, we utilized a stretch sensor attached to each finger, enabling the observation of finger movement and the contraction force produced on the forearm muscle while holding various cylinders. Using a stretch-sensor glove, our proposed method employed an approach to address the practicality issue of monitoring in home-based rehabilitation.
3. Methods
In this section, we propose an estimation method of the contraction force of the forearm muscle in the cylinder grasping condition. The proposed method aims to provide patients with a user-friendly device for monitoring during the grasping of cylinders, a standard training method often performed at home. Thus, it enhances the patient’s independence in home-based rehabilitation.
3.1. Participants
In this study, healthy participants were recruited to conduct the data collection experiment for constructing the estimation model. Ten healthy participants (9 Males and one female), aged in their 20s and 30s, were recruited, regardless of gender. Eight participants were right-handed, and two were left-handed. As previously stated, the current study also focused on observing the performance of the proposed method in estimating the forearm muscle force using a stretch sensor glove. Therefore, an estimation output similar to the actual muscle force is expected, regardless of the type of participants. Furthermore, data from healthy participants are crucial as it provides insights into muscle and finger function under normal conditions, which is the goal of the rehabilitation program. Prior to the experiment, all subjects were informed about the procedures and voluntarily agreed to participate. Additionally, it was ensured that all participants had no injuries to their upper limbs on the day of the experiment, which served as an inclusion criterion for participation. All experimental procedures were approved on 23 May 2025 by the Ethical Committee of the Graduate School of Engineering, Kobe University (No. 07-02).
3.2. Instrumentation
3.2.1. Stretch-Sensor Glove
This study employed stretch sensors provided by Image Scientific Instruments, Inc., Staten Island, New York. as depicted in Figure 1. The sensor is designed as a flexible cylindrical cord with a diameter ranging from 0.06 to 0.07 cm. It features a distinctive polymer composition that alters its resistance in response to stretching. An unstretched sensor exhibits a resistance of 1000 ohms per linear inch. When stretched to 50% of its original length, the resistance gradually rises to approximately 2000 ohms per inch. As illustrated in Figure 2, at this 50% stretch, the resistance effectively doubles compared to its initial value. Furthermore, after being stretched, there may be a slight increase in resistance upon release before it eventually returns to its original resting state [38].
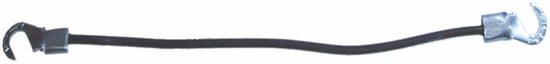
Figure 1.
Flexible stretch sensor with hook at the terminal [38].
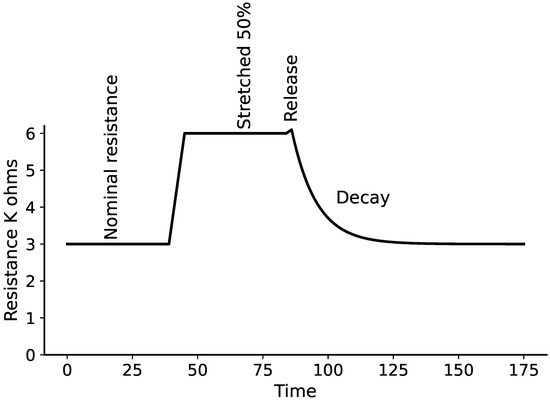
Figure 2.
Characteristic of stretch sensor under 50% stretch from the initial length [38].
A total of five stretch sensors were employed and individually affixed to the finger sections of the glove, as depicted in Figure 3. This configuration facilitated the monitoring of each finger’s movement by tracking alterations in the resistance values. The stretch sensor’s length was customized to span from the metacarpophalangeal (MCP) joint to the interphalangeal (IP) joint for the thumb. For the index, middle, ring, and little fingers, it extended from the MCP joint to the proximal interphalangeal (PIP) joint. The specific lengths of the stretch sensors for each finger are detailed as follows:
| 1. | Thumb | : 5.5 cm; |
| 2. | Index | : 6.5 cm; |
| 3. | Middle | : 7.5 cm; |
| 4. | Ring | : 6.5 cm; |
| 5. | Small | : 6.0 cm. |
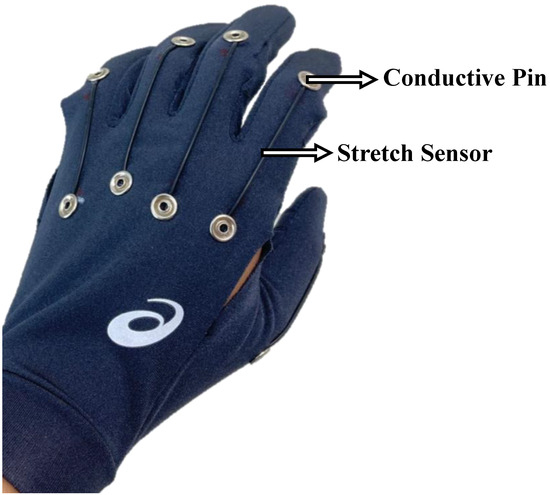
Figure 3.
Proposed stretch-sensor glove.
To determine the resistance value of the stretch sensor, the voltage divider method was utilized, as illustrated in Figure 4. A 5 V power supply and ground connection for all five stretch sensors were sourced from the Arduino Nano, with the output voltage from each sensor being individually linked to an analog input pin. This output voltage was subsequently converted to reflect the resistance value of the stretch sensor, allowing for real-time observation of changes in resistance. The Arduino Nano was calibrated to facilitate a sampling rate of approximately 100 Hz for the data collected from the stretch sensors.
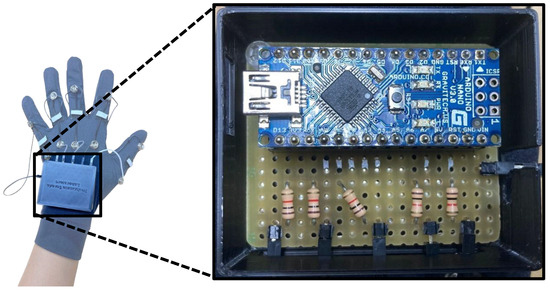
Figure 4.
Voltage divider and data acquisition circuits.
3.2.2. EMG Sensor
In this study, an EMG sensor was used solely to gather the root mean square (RMS) of the EMG signal from the forearm muscle, which served as the reference for developing a contraction force estimation model using a stretch-sensor glove. The system’s use case will include only the glove that can estimate the RMS of the EMG of the forearm muscle. The armband EMG sensor, featuring eight channels from MindRove, was used to record the activity of the forearm muscles. As illustrated in Figure 5, the arrangement of the EMG channels is circular, facilitating the monitoring of forearm muscle activity, with each electrode positioned at equal distances apart. The MindRove EMG sensor operates at a sampling rate of 500 Hz, which effectively captures the optimal EMG frequency [39].
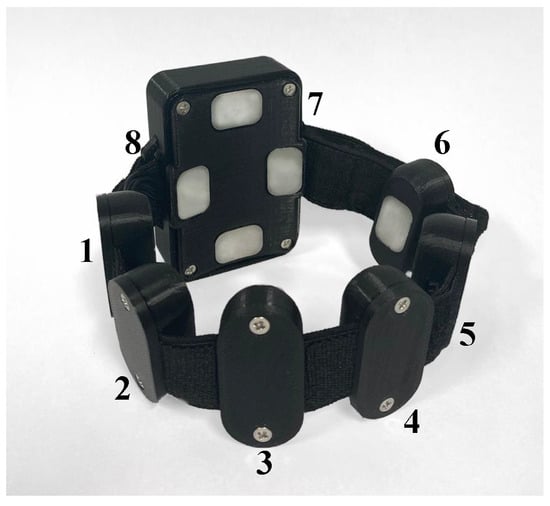
Figure 5.
MindRove armband EMG sensor and the eight electrode configurations [39].
The armband EMG sensor affixed to the forearm was strategically placed to monitor muscle activity, as depicted in Figure 6. This figure illustrates that the muscle, identified in blue, primarily governs the flexion and extension of the fingers. In contrast, the muscle labeled in red is responsible for the flexion and extension of the thumb. The muscles associated with thumb movement are situated deeper within the forearm, whereas the muscles controlling the remaining four fingers are located closer to the surface. The muscles that manage movements from the index finger to the little finger are referred to as dominant muscles, as they possess a larger size, leading to stronger EMG signals [40]. The MindRove’s default electrode configuration might capture a crosstalk event of the EMG signal from the adjacent target muscles. However, according to the nature of human muscle, crosstalk is inevitable since finger movement is composed of a combination of several forearm muscle contractions. Therefore, the crosstalk event on an EMG channel will further provide information about adjacent muscle conditions, especially when an abnormality occurs.
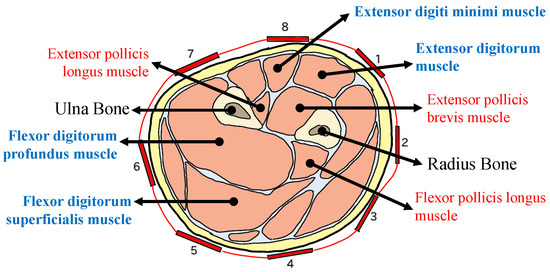
Figure 6.
Cross-section of the left distal forearm muscle (palm pronation) and the eight electrode configurations of MindRove. Muscle names in red are involved in the thumb movement. Muscle names in blue are involved in the flexion and extension from the index to the small finger [40].
3.2.3. Experimental Object
This study utilized the object for training by following the GRASP protocol of home-based training. In the GRASP protocol, one of the training methods involves increasing the coordination function of the limb for daily activities, where the participant performs the pouring movement with a cup filled with water [6]. The patient is also challenged to accomplish the task with different cup sizes, resulting in varying weights. Therefore, this study utilized six cylinders with several diameter sizes, as shown in Figure 7. Additionally, four weight variations were applied to each cylinder as a challenge for the participant. The weight variation of each cylinder was applied by placing a marble load with target weights of approximately 250 g, 500 g, 750 g, and 1000 g. The combination of cylinder sizes and weights resulted in 24 patterns. Additionally, the total number of cylinder grasping events is further explained in the latter section.
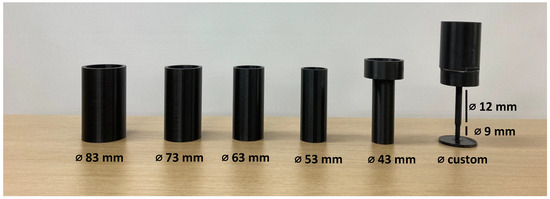
Figure 7.
Cylinder with varying diameter sizes.
3.3. Data Processing
The data were processed to be fed to the machine learning algorithm, using both the stretch sensor data as input and the RMS of EMG as the target for learning. The RMS of EMG was extracted with a 0.2 s window size directly during the data collection experiment, thus requiring no further processing. In contrast, the stretch sensor data used as input for machine learning were carefully prepared to contain the most important information for the machine learning model.
3.3.1. Signal Smoothing
Signal smoothing was primarily performed to remove unwanted spikes in the stretch sensor data, which were caused mainly by the unstable condition of the circuit. The transient or unwanted spike commonly occurred frequently and randomly over time. Therefore, one method to eliminate noise is to apply a low-pass filter, which removes higher-frequency signals [41]. As shown in Figure 8, the raw signal of the stretch sensor contained several transient spikes, which were commonly caused by the unstable condition of the circuit. In this study, a 4th-order Butterworth low-pass digital filter with a threshold frequency of 2 Hz was employed.
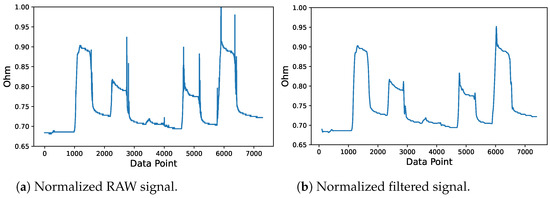
Figure 8.
Stretch sensor signal filtering process.
3.3.2. Feature Extraction
In this study, the window size for feature extraction was adjusted to match the length of the RMS of EMG as the ground truth. Statistical features are commonly employed to extract important information from non-periodic type signals [42,43]. In this study, the following four statistical features were employed in the feature extraction process: the mean, standard deviation (std), kurtosis, and skewness. The mean is a common feature that is usually utilized as a smoothing method. The std was employed to extract information correlated with the deflection in the value of a signal over time. Skewness and kurtosis are features that extract distribution information from data. Skewness measures the asymmetry of a variable within a distribution. Zero skewness signifies a symmetric distribution, while positive skewness indicates a right-skewed distribution and vice versa. Meanwhile, kurtosis is used to quantify the tail characteristic of a distribution. A positive kurtosis means super-Gaussian distribution, while a negative kurtosis means sub-Gaussian.
3.4. Regression and Evaluation
In this study, three distinct regression algorithms were utilized to predict the forearm muscle contraction force, as indicated by the RMS value of the EMG. The employed estimators included the support vector regressor (SVR), the ensemble algorithm of the random forest regressor (RFR), and the neural network-based multi-layer perceptron regressor (MLPR). The parameters for each algorithm were established in advance to align with the dataset utilized in this research. Throughout this study, all algorithms were implemented using the scikit-learn library in Python.
The parameters set for the Support Vector Regression (SVR) included a radial basis function (RBF) kernel, a regularization parameter (C) of 5, an epsilon value of 0.01, and a gamma of 0.001. For the Random Forest Regression (RF), the adjusted parameters comprised 100 estimators, the use of a squared error function to evaluate the quality of splits, a maximum tree depth of 10, and a random state value of 42. Additionally, the modified parameters for the Multi-Layer Perceptron Regression (MLP) included the Rectified Linear Unit (ReLU) as the activation function for the hidden layer, an initial learning rate of 0.0001, an adaptive learning rate adjustment method, a tolerance set at 0.0000001, and a random state of 42.
The performance of the regression model was evaluated for each weight variation using root mean square error (RMSE). Additionally, the RMSE scores of the models, along with the standard deviation of the ground truth, were compared to further evaluate the performance quality in terms of estimating the mean. The comparison between these two parameters has three meanings. A model has worse performance than estimating the mean value of the ground truth (ground truth’s std. < model’s RMSE), a model estimates the mean value of the ground truth (ground truth’s std. = model’s RMSE), and a model has better performance than estimating the mean value of the ground truth (ground truth’s std. > model’s RMSE). Lastly, an association was observed between participants’ perceived difficulty in lifting a 1000 g cylinder and the model’s RMSE in the first finger condition. As mentioned in Section 3.2.3, the GRASP protocol involves the patient performing a challenge using a cylinder object or a cup of varying sizes and weights. Therefore, this study also analyzed the behavior of the muscle between the easiest and the most difficult cylinders. Additionally, considering that the recruited participants were in normal condition, only the first finger condition was employed in this analysis.
3.5. Data Collection Experiment
The data collection experiment is a data acquisition process for both the stretch sensor and EMG data. The data collection experiment consists of two main processes comprising the following: signal normalization and data collection. The proposed stretch-sensor glove and the attachment of the EMG sensor for ground truth data acquisition are shown in Figure 9. As shown in Figure 10, the experimental environment involved the participant in a sitting condition with their hand resting on a table. The participant was instructed to grasp and lift the cylinder when an alarm rang from the timer. In addition, the participant was asked to emit a minimum power only to maintain the hand posture and ensure that the cylinder remained lifted.
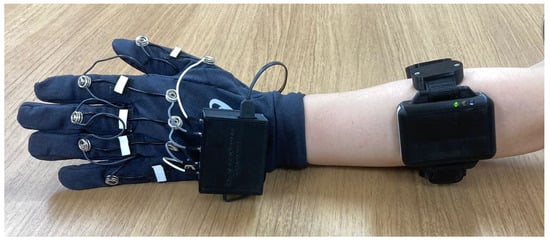
Figure 9.
Attachment of the armband EMG sensor and the proposed stretch-sensor glove.
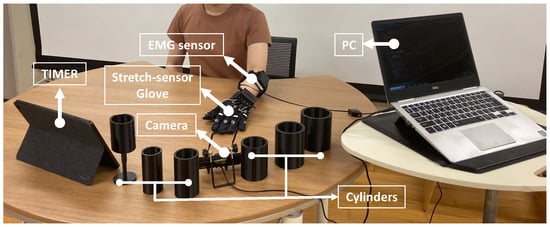
Figure 10.
Experimental environment of data collection experiment.
3.5.1. Signal Normalization
The signal normalization procedure was conducted at the outset of each data collection phase. This session aimed to achieve a consistent value on a scale from 0 to 1 for both the resistance readings of the stretch sensor and the RMS of the EMG using the maximum normalization approach. Each stretch sensor and EMG channel underwent this normalization process separately. The first step was to normalize the glove data for a 10-s period. In the first 5 s, the participant will close their hand tightly and open it in the next 5 s. Subsequently, the normalization for the RMS of the EMG was held individually for each cylinder.
In cases where the patient is unable to produce a maximal voluntary contraction (MVC), an alternative normalization method for EMG was employed. A study used a sub-MVC as a reference value for EMG normalization, where an individual emitted a muscle power weaker than the maximal condition [44]. Another study utilized the isometric contraction based on manual muscle testing of grade 3 (isoMMT3), where an individual performs an isometric contraction against gravity [45]. Therefore, this study employed an alternative EMG normalization method that combines concepts from the aforementioned studies. The participants were instructed to lift each cylinder weighing 1500 g, which was 500 g heavier than the heaviest cylinder in the weight variations mentioned in Section 3.2.3. The participant was instructed to grasp and lift the cylinder with minimal power to prevent it from falling. The maximum value of stretch-sensor data and the RMS of EMG were used as dividers for normalizing the signal during the data collection process. While it is rare, we add an extra measure to treat any data that exceeds 1 or falls below 0, automatically adjusting it to 1 or 0, respectively.
3.5.2. Data Collection
In the experiment, only the left-hand side was utilized for cylinder grasping. The participants consisted of both right-handed and left-handed people, which may have affected the way they grasp the cylinder. Therefore, this condition is crucial for evaluating the performance of the employed machine-learning models in accounting for the corresponding variations in the data. Subsequently, the participants were instructed to emit a minimum power required to lift the cylinder with varying weights, which depicted the actual rehabilitation case with a patient, where achieving specific minimum power levels may be challenging for patients with certain severity levels. As mentioned in Section 3.2.3, this study has four weight variations. The data collection was repeated three times for each weight variation, constituting the three sessions. In this study, holdout data splitting was employed, where data from the first and third sessions were used as training data, while data from the second session were used as testing data. One session consisted of grasping and lifting the six cylinders with varying diameter sizes. Subsequently, for each cylinder, the participants were asked to perform five-finger conditions. The first condition was that all fingers grasp the cylinder. The second condition was that the index finger was open while the other fingers grasped the cylinder. The third to fifth conditions consisted of keeping the middle, ring, and little finger open, respectively, while the other fingers grasped the cylinder. The illustration of finger conditions is shown in Figure 11.
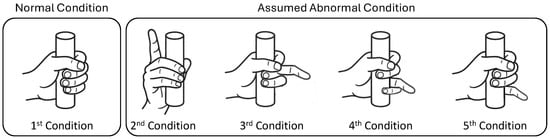
Figure 11.
Illustration of finger conditions.
A resting period was applied between finger conditions and sessions to avoid muscle fatigue and prioritize participants’ safety. Additionally, a randomized order of weight variation was applied to prevent bias of muscle power toward certain cylinders’ weights. These finger conditions were employed by assuming the normal and abnormal conditions of the patient’s finger, where the first condition corresponds to the normal condition. During cylinder grasping activity, the abnormal condition corresponds to the inability to perform finger flexion to grasp the object due to the dysfunctionality of the corresponding muscle [3]. Consequently, one or more fingers remain open instead of grasping the object. In this study, the assumed abnormal condition was arranged to involve only one finger, represented by the second through fifth conditions, as shown in Figure 11. This setting was employed to enable the machine learning model to learn both normal and abnormal conditions. Subsequently, the performance of the machine learning model in distinguishing between normal and abnormal conditions could be evaluated through the RMSE score. The illustration of the data collection flow is shown in Figure 12. After the experiment, each participant was asked to rate the perceived difficulty of lifting 1000 g cylinders. Accordingly, each participant provided information about the easiest and hardest cylinders.
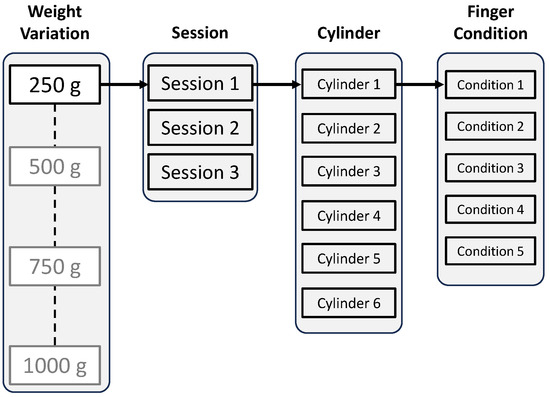
Figure 12.
Data collection flow.
4. Results
A method for estimating forearm muscle contraction force using a stretch-sensor glove under cylinder grasping conditions has been proposed. In this section, the estimation results are presented along with the RMSE score. Additionally, the RMSE scores of the machine learning models and the standard deviations of the ground truth are presented. This section also illustrates the relationship between RMSE and the perceived difficulty of lifting a 1000 g cylinder, thereby providing insight into the muscle’s behavior under both easy and difficult conditions.
4.1. Estimation Performance
In this study, the performance of the employed machine learning models was evaluated by their similarity to the ground truth of RMS of EMG from eight channels, represented by the score of RMSE. Figure 13 shows the distribution of RMSE for each machine-learning model across eight channels and 10 participants. All models showed similar results in that the increase in cylinder weight narrowed the distribution of error. However, heavier cylinders also yielded a higher average of error for all models. Another interesting outcome was obtained, where the SVR and MLP models produced identical error distribution trends across weight variations, whereas the RF model was unique. Furthermore, the RF model achieved an overall lower error than the SVR and MLP models. This finding was further supported by the results of an independent t-test, which showed that the error distribution of the RF model differed significantly from that of the other models. Meanwhile, the error distribution of the SVR and MLP models was not statistically different.
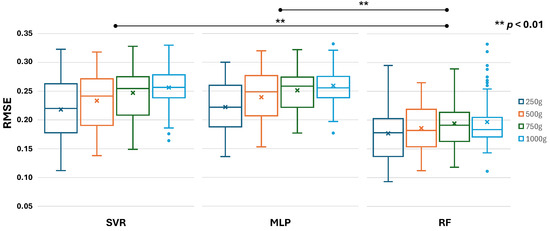
Figure 13.
Boxplot of RMSE score of each machine learning model across eight channels and ten participants.
To further evaluate the performance of the employed machine learning models, it is necessary to compare the models’ RMSE scores and the standard deviations of the ground truth. A comparison between these two parameters is necessary to further evaluate the performance quality of the models in terms of estimating the mean, as mentioned in Section 3.4. As illustrated in Figure 14, the ground truth’s standard deviation in blue color shows an increasing value for heavier cylinder weight. This finding suggests that a heavier cylinder weight yields greater muscle power, resulting in a larger amplitude and higher RMS of EMG deviations between the relaxation and contraction states. The same condition also occurred in the RMSE score of all models with heavier weights. According to Figure 14, all models have a lower RMSE score than the ground truth’s standard deviation on each weight variation. In the 250 g cylinder, the reductions for SVM, MLP, and RF were 14.5%, 12.9%, and 30.6%, respectively. In the 500 g cylinder, the reductions were 13.5%, 11.2%, and 30.9%, respectively. In the 750 g cylinder, the reductions were 16.6%, 15.2%, and 34.5%, respectively. In the 1000 g cylinder, the reductions were 17.7%, 16.7%, and 36.7%, respectively. This finding suggests that all models outperform simply estimating the mean of the ground truth. The greater the gap from the ground truth’s standard deviation, the better the estimation quality. Thus, it can be inferred that the estimation result of the RF model was more similar to the ground truth than those of other models.
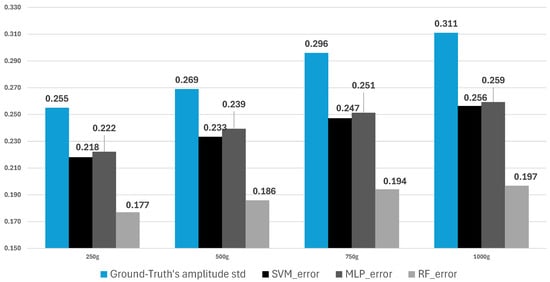
Figure 14.
Average of ground truth’s std. vs the average RMSE score of models.
The aforementioned finding was further emphasized by the time series estimation result for each model, as shown in Figure 15. The figure represents the ground truth and estimation waveform of RMS for a channel in a cylinder. The RMS ground truth, in blue, showed five waveform peaks representing the contraction force of each finger condition. From left to right, each belonged to the first finger condition until the fifth, respectively. The ground truth showed the highest peak on the third finger condition, where the middle finger was open while the other fingers grasped the cylinder. The estimation waveform of each model, in red, showed varying results. The estimation result of the SVM model showed an identical height in all contraction states and had slightly negative values. The estimation result of the MLP model yielded more negative values, while the shape of the waveform was rather unrecognizable. On the other hand, the estimation result of the RF model had the most identical shape with the ground truth in both the relaxation-contraction state and RMS amplitude, while all models showed an average RMSE score below the ground truth’s standard deviation, the greater gap between these two parameters was preferable, resulting in a greater similarity between the estimated result and the ground truth. As shown in the figure, the Pearson correlation score showed that RF has the highest positive similarity to the actual muscle contraction force.
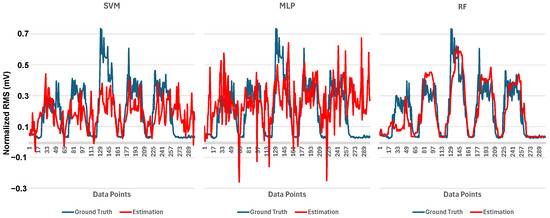
Figure 15.
Time series comparison between ground truth and estimation of RMS of EMG.
4.2. Perceived Cylinder Lifting Difficulty
As mentioned in the latter part of Section 3.5.2, each participant was asked to state their perceived ease and difficulty when grasping and lifting the 1000 g cylinders. As shown in Table 1, each person perceives the difficulty of lifting the heaviest cylinder differently. The first and second participants stated that two cylinders were perceived as difficult, while others mentioned only one cylinder. An interesting finding was that all participants recognized the first or second cylinder as the most difficult. The first cylinder had the largest diameter, while the fifth cylinder had the smallest diameter. On the other hand, the easiest cylinder varied between the third, fourth, and fifth. The information in the table suggests that participants primarily experienced difficulty when lifting the heaviest cylinder in either an almost entirely open or closed hand posture, as represented by the first and fifth cylinders, respectively. To fully understand the association between the perceived cylinder difficulty level and the behavior of the muscle, a comparison of muscle information at these two difficulty levels is necessary. Figure 16 shows the comparison of the average of the RMS of EMG for the first finger condition in perceived easy and difficult cylinders for each participant. The bar in green represents perceived easy cylinders, while the bar in red represents perceived difficult cylinders.

Table 1.
Perceived heaviest cylinder’s lifting difficulty.
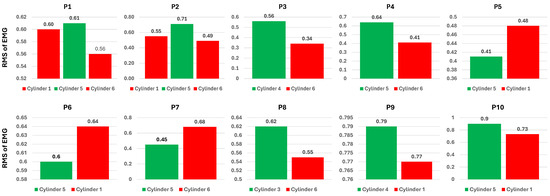
Figure 16.
Average ground truth’s RMS of EMG across eight channels of the first finger condition in perceived easy and difficult cylinders.
Figure 16 shows that most participants have a higher average RMS for the perceived easy cylinder than for the difficult cylinder, which is represented by participants 1, 2, 3, 4, 8, 9, and 10. On the other hand, participants 5, 6, and 7 have a higher RMS of EMG on the perceived difficult cylinder. An interesting result occurred with participants 1 and 2, where both cylinders perceived as difficult had a smaller RMS of EMG than the cylinder perceived as easy. Some participants showed a clear gap in the power of the RMS of EMG between perceived easy and difficult cylinders, such as participants 2, 3, 4, 7, 8, and 10. The remaining participants showed a marginal gap in perceived difficulty, especially in the first participant for the first and fifth cylinders. Subsequently, an assessment of the perceived difficulty levels associated with the estimation outcomes was conducted. This assessment aimed to further analyze the model’s performance with actual ground truth data. Figure 17 depicts the average estimated root mean square (RMS) of electromyography (EMG) from the random forest (RF) model under the first finger condition for each participant. Consistent with Figure 16, among the estimation results, seven participants reported a higher average RMS for the perceived easy cylinder compared to the perceived difficult one. However, only four participants exhibited a linear correlation between the ground truth and the estimated results. The first participant demonstrated nearly identical results for both the ground truth and the estimations. On the other hand, participants 4, 5, 6, 7, and 9 exhibited an inverse relationship.
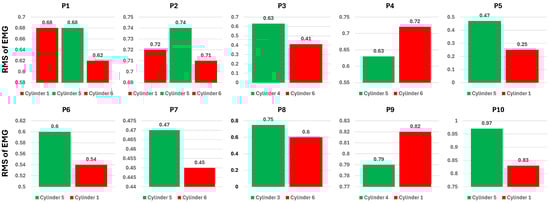
Figure 17.
Average of the estimated RMS of EMG of RF model across eight channels of the first finger condition in perceived easy and difficult cylinders.
5. Discussion
The monitoring function in home-based rehabilitation presents a challenge that requires a method capable of individual implementation by the patient. EMG is a standard technique for assessing muscle contraction force; however, it carries the risk of device misattachment or misuse. A practical monitoring approach must address the reliability of the data obtained, particularly given the elevated risk of improper device usage, while also boosting patients’ motivation through the use of a user-friendly and practical device and method. Consequently, this study introduces a method for estimating forearm muscle contraction force during home-based rehabilitation using a stretch-sensor glove. This section focuses on the advantages and challenges of the glove-type sensor, as well as the performance of the proposed estimation method. Ultimately, this section also describes the limitations of the current study.
5.1. Advantage and Challenge of Glove-Type Sensor
In contrast to the EMG sensor, the glove-type sensor is believed to offer ease of use, comfort, and wearability [46,47,48,49,50]. This condition arises due to its proximity to daily life, where everyone is already familiar with it and considers it a part of daily clothing. Therefore, an approach utilizing a glove as the base of constructing a sensing technology is preferable. Several studies have introduced the advantages of the glove system for sensing purposes, especially in home-based rehabilitation. Glove-based devices are commonly equipped with typical sensors such as flex sensors, force-sensitive resistors (FSR), and accelerometers. Thus, it enables a logging function for several finger-related parameters, such as joint angles, finger movements, and hand gestures or postures, making it more suitable for kinematic analysis. Especially in rehabilitation, this approach is ideal for gesture recognition, motor training, and hand monitoring, providing clinicians with essential data.
Along with its practicality for patients’ self-implementation and several benefits in finger-related parameters, this approach is limited in capturing only the peripheral products originating from the muscle activity that controls the finger. The glove-based sensing method currently remains incapable of directly detecting the muscle condition linked to a finger’s posture, let alone the force of contraction that is crucial in the monitoring process. Following the potential of a stretch sensor mentioned in Section 2.4, the proposed method utilized the RMS of the EMG signal as the ground truth, allowing the system to estimate the muscle contraction force based on input from the stretch-sensor glove. Therefore, the output of the proposed method would contribute to improving the monitoring function in home-based rehabilitation. Furthermore, the final product of this study may lead to the broader implementation of the stretch-sensor glove, which can output the correlated muscle contraction force. Accordingly, the system’s good estimation performance served as the primary focus of this study.
5.2. Estimation Performance of the Proposed Method
A good system performance is represented by the similarity between the system’s output and the actual RMS of the EMG signal. Therefore, a minor error is preferable in the output of the employed machine learning model. According to the GRASP characteristic mentioned in Section 1, the exercise must be challenging for a patient, involving several cylinder sizes and weights. Therefore, a favorable model must demonstrate equally low error across all variations. The results in Figure 13 and Figure 14 showed that all the employed machine learning models achieved an error below the standard deviation of the ground truth. However, Figure 15 illustrates a more comprehensive performance, which depicts the actual estimated RMS of EMG for each model. A good model’s output must comprise characteristics or shapes similar to the ground truth, represented by the cyclical pattern in the waveform. Figure 15 shows that all models have a positive correlation coefficient, indicating a correct direction of the estimation. Nevertheless, a higher coefficient number is the most preferable. The MLP model exhibited a waveform shape that was mainly unrecognizable, accompanied by an unstable portion that reached negative values. Accordingly, the MLP model has the lowest correlation coefficient, indicating a great discrepancy with the actual muscle force. The condition of the ground truth was in the normalized form, where the value ranged from 0 to 1. Therefore, a negative value is meaningless and considered a shortcoming of the corresponding model. Subsequently, the SVM model demonstrated better performance with a correlation coefficient of 0.52, as indicated by a waveform shape consisting of an ascending and descending phase, representing the contraction and relaxation of the muscle, respectively. However, the estimated contraction force was identical for all finger conditions, indicating that the SVM model was unable to produce different contraction forces depending on the finger conditions. Additionally, some of the estimated contraction forces exhibited negative values, indicating instability in the estimation performance. This condition is possibly due to the model’s inability to properly learn the actual forearm muscle contraction force with the given varied input on the stretch-sensor data. Ultimately, the RF model demonstrated a preferable condition, where no portion exhibited negative values. More importantly, the shape was identical to the actual contraction force, with a correlation coefficient of 0.81, indicating clear estimated relaxation and contraction phases of the muscle. The five peaks of the ground truth corresponding to the first to fifth finger conditions, respectively, show a trend where the first to third finger conditions are increasing, while the fourth to fifth finger conditions are decreasing, accompanied by the relaxation state in between. Accordingly, the RF model exhibited a similar trend in the contraction force for each finger condition, accompanied by relaxation states that did not exceed negative values, indicating stable estimation performance.
The RF model demonstrated better performance in similarity to the actual contraction force compared to other models. Thus, the RF model was further utilized to compare it with the actual contraction force of the perceived difficulty of lifting the cylinders. As described in Section 4.2, the ground truth and the estimation showed a similar number of participants for whom the grasping cylinders’ contraction force of perceived ease was higher than the perceived difficulty. However, only four participants exhibited a linear relationship between the ground-truth contraction force and the estimation. The first participant had a rather identical contraction force. Meanwhile, the remaining five participants showed a reverse relationship between those data. The possible reason for this condition was the inconsistency in the exhibited contraction force for the corresponding participant. As explained in Section 3.5, the participant was instructed to emit only a minimum muscle power to lift and keep the cylinder from falling. Even though such mechanisms minimize the possibility of human error, there is still a chance that a participant may have emitted a different muscle power, either stronger or weaker, within the same cylinder weight session. Despite the varying results in the data for several participants, the RF model demonstrated better performance in providing information on the muscles’ contraction–relaxation state and the contraction force corresponding to finger conditions. Furthermore, the proposed method demonstrated great potential in addressing the challenge of monitoring muscle contraction force for home-based rehabilitation using an alternative modality, a stretch-sensor glove.
5.3. Limitations and Future Work
The current study presented a fundamental stage in developing an alternative monitoring modality. Therefore, it also has several limitations and potential areas for improvement. The current study was designed only for the cylinder’s grasping purposes, specifically utilizing certain weights during home-based training. Furthermore, the implementation of the proposed method is limited to the selection of weights and cylinder sizes adopted in the current experimental setting. Any modification to the movement type or weight variations requires a thorough adjustment to the system. Additionally, the current study constructed the estimation model utilizing a stretch sensor that provided the kinematic mechanism of the finger. Therefore, an additional sensor that provides force or pressure information may complement the kinematic information to improve the estimation model. The system’s ultimate goal is designed for patients in rehabilitation; however, the study included only ten healthy participants to simulate the assumed abnormal finger conditions, which differs from the actual abnormal condition of patients. Consequently, this limits the generalizability of the findings. Therefore, further observation of the estimation performance of a patient’s abnormal finger conditions is necessary. In terms of potential for clinical trials, future improvements will be considered, including glove size personalization and recruiting actual patients to obtain actual abnormal grasping postures.
6. Conclusions
The study addressed the monitoring challenges of forearm muscle contraction force in home-based rehabilitation using a stretch-sensor glove. The estimation of the RF model demonstrated superior performance compared to the SVM and MLP models, achieving the lowest error and yielding a waveform of contraction force that closely resembles the ground truth. In the analysis of the perceived cylinder’s lifting difficulty, several results showed different estimations from the ground truth, which was mainly caused by subjectivity in the emitted muscle power. However, most of the results output a successful estimation, which has a similar trend to the actual contraction force of several participants. The proposed method of using a stretch-sensor glove to estimate forearm muscle contraction force demonstrates great potential as an alternative modality, providing a practical device for patients to self-implement home-based rehabilitation.
Author Contributions
Conceptualization, A.R.S.S.P., A.O., T.T. and M.T.; methodology, A.R.S.S.P., A.O. and T.T.; validation, A.R.S.S.P.; formal analysis, A.R.S.S.P. and T.T.; investigation, A.R.S.S.P.; resources, A.R.S.S.P.; data curation, A.R.S.S.P.; writing—original draft preparation, A.R.S.S.P.; writing—review and editing, A.R.S.S.P., A.O. and T.T.; visualization, A.R.S.S.P.; supervision, A.O., T.T. and M.T.; project administration, A.R.S.S.P., A.O., T.T. and M.T. All authors have read and agreed to the published version of the manuscript.
Funding
This work was supported in part by JST Moonshot R&D Program Grant Number JPMJMS239F.
Institutional Review Board Statement
This study was conducted following the guidelines of the Declaration of Helsinki and approved on 23 May 2025 by the Ethics Committee of the Graduate School of Engineering, Kobe University (No. 07-02).
Informed Consent Statement
Informed consent was obtained from all participants involved in the study.
Data Availability Statement
The data are not publicly published due to ethical restrictions.
Acknowledgments
The authors appreciate the cooperation of the participants.
Conflicts of Interest
The authors declare no conflicts of interest.
Abbreviations
The following abbreviations are used in this manuscript:
| SVM | Support Vector Machine |
| RF | Random Forest |
| MLP | Multi-Layer Perceptron |
| GRASP | Graded Repetitive Arm Supplementary Program |
References
- Rasmussen, B.B.; Richter, E.A. The Balancing Act Between the Cellular Processes of Protein Synthesis and Breakdown: Exercise as a Model to Understand the Molecular Mechanisms Regulating Muscle Mass. Appl. Physiol. 2009, 106, 1365–1366. [Google Scholar] [CrossRef]
- Rasmussen, B.B.; Phillips, S.M. Contractile and Nutritional Regulation of Human Muscle Growth. J. Exerc. Sport Sci. Rev. 2003, 31, 127–131. [Google Scholar] [CrossRef]
- Bisht, B.; Rajan, M.; Dvivedi, S.; Rawat, K.A.V.; Konda, S. Management of Patients with Forearm and Hand Injuries. J. Int. Surg. 2020, 7, 1593. [Google Scholar] [CrossRef]
- Dombovy, M.L.; Sandok, B.A.; Basford, J.R. Rehabilitation for Stroke: A Review. Stroke 1986, 17, 363–369. [Google Scholar] [CrossRef] [PubMed]
- Reed, K.B.; Handžić, I.; McAmis, S. Home-Based Rehabilitation: Enabling Frequent and Effective Training. In Neuro-Robotics; Artemiadis, P., Ed.; Springer: Dordrecht, The Netherlands, 2014; Volume 2, pp. 379–403. [Google Scholar]
- GRASP Instructor Manuals. Available online: https://med-fom-neurorehab.sites.olt.ubc.ca/grasp-instruction-manual-2/ (accessed on 20 November 2024).
- Troiano, A.; Naddeo, F.; Sosso, E.; Camarota, G.; Merletti, R.; Mesin, L. Assessment of Force and Fatigue in Isometric Contractions of the Upper Trapezius Muscle by Surface EMG Signal and Perceived Exertion Scale. J. Gait Posture 2008, 28, 179–186. [Google Scholar] [CrossRef] [PubMed]
- Erfanian, A.; Chizeck, H.J.; Hashemi, R.M. Using Evoked EMG as a Synthetic Force Sensor of Isometric Electrically Stimulated Muscle. IEEE Trans. Biomed. Eng. 1998, 45, 188–202. [Google Scholar] [CrossRef]
- Son, J.; Hwang, S.; Kim, Y. An EMG-based Muscle Force Monitoring System. J. Mech. Sci. Technol. 2010, 24, 2099–2105. [Google Scholar] [CrossRef]
- Calvert, T.; Chapman, A.E. The Relationship Between the Surface EMG and Force Transients in Muscle: Simulation and Experimental Studies. Proc. IEEE 1977, 65, 682–689. [Google Scholar] [CrossRef]
- Tarata, M.; Spaepen, A. A Method of Reconstruction of the Muscular Force Profile from the EMG in the Voluntary Exercise. J. Acta Physiol. Et Pharmacol. Bulg. 2001, 26, 45–48. [Google Scholar]
- Linderman, S.E.; Scarborough, D.; Day, W.; Wrafter, D.; Berkson, E. Using a Stretch Sensor to Evaluate Muscle Contraction Timing During a Neuromuscular Control Screening Activity. J. Med. Sci. Sport. Exerc. 2019, 51, 149. [Google Scholar] [CrossRef]
- O’Brien, B.M.; Gisby, T.; Anderson, I. Stretch Sensors for Human Body Motion. In Proceedings of the SPIE, Electroactive Polymer Actuators and Devices (EAPAD), San Diego, CA, USA, 8 March 2014. [Google Scholar]
- Bifulco, P.; Esposito, D.; Gargiulo, G.; Savino, S.; Niola, V.; Iuppariello, L.; Cesarelli, M. A Stretchable, Conductive Rubber Sensor to Detect Muscle Contraction for Prosthetic Hand Control. In Proceedings of the E-Health and Bioengineering Conference (EHB), Sinaia, Romania, 22–24 June 2017. [Google Scholar]
- Tyson, S.; Turner, G. Discharge and follow-up for people with stroke: What happens and why. Clin. Rehabil. 2000, 14, 381–392. [Google Scholar] [CrossRef] [PubMed]
- Gregory, P.; Edwards, L.; Faurot, K.; Williams, S.; Felix, A. Patient preferences for stroke rehabilitation. Top Stroke Rehabil. 2010, 17, 394–400. [Google Scholar] [CrossRef] [PubMed]
- Mayo, N.E. Stroke Rehabilitation at Home: Lessons Learned and Ways Forward. Stroke 2016, 47, 1685–1691. [Google Scholar] [CrossRef] [PubMed]
- Mousavi, G.; Ardalan, A.; Khankef, H.; Kamali, M.; Ostadtaghizadeh, A. Physical Rehabilitation Services in Disasters and Emergencies: A Systematic Review. Iran J. Public Health 2019, 48, 808–815. [Google Scholar] [CrossRef] [PubMed]
- Singh, A.; Ajeya, J.; Shankar, P. Perceived risk and hazards associated with home health care among home health nurses of India. Home Health Care Manag. Pract. 2020, 32, 134–140. [Google Scholar] [CrossRef]
- Smith, S.T.; Talaei-Khoei, A.; Ray, M.; Ray, P. Agent-Based Monitoring of Functional Rehabilitation Using Video Games. In Advanced Computational Intelligence Paradigms in Healthcare 5; Brahnam, S., Jain, L.C., Eds.; Springer: Berlin/Heidelberg, Germany, 2010; Volume 326, pp. 113–141. [Google Scholar]
- Zheng, H.; Davies, R.J.; Black, N.D. Web-based monitoring system for home-based rehabilitation with stroke patients. In Proceedings of the 18th IEEE Symposium on Computer-Based Medical Systems (CBMS’05), Dublin, Ireland, 23–24 June 2005. [Google Scholar]
- Daponte, P.; De Vito, L.; Sementa, C. A wireless-based home rehabilitation system for monitoring 3D movements. In Proceedings of the 2013 IEEE International Symposium on Medical Measurements and Applications (MeMeA), Gatineau, QC, Canada, 4–5 May 2013. [Google Scholar]
- Sassi, M.; Villa Corta, M.; Pisani, M.G.; Nicodemi, G.; Schena, E.; Pecchia, L.; Longo, U.G. Advanced Home-Based Shoulder Rehabilitation: A Systematic Review of Remote Monitoring Devices and Their Therapeutic Efficacy. Sensors 2024, 24, 2936. [Google Scholar] [CrossRef]
- Warren, G.L.; Lowe, D.A.; Armstrong, R.B. Measurement Tools Used in the Study of Eccentric Contraction-Induced Injury. J. Sport. Med. 1999, 27, 43–59. [Google Scholar] [CrossRef]
- Black, C.; McCully, K. Force Per Active Area and Muscle Injury During Electrically Stimulated Contractions. J. Med. Sci. Sport. Exerc. 2008, 40, 1596–1604. [Google Scholar] [CrossRef]
- Lovering, R.M.; Roche, J.A.; Goodall, M.H.; Clark, B.B.; McMillan, A. An In Vivo Rodent Model of Contraction-induced Injury and Non-invasive Monitoring of Recovery. J. Vis. Exp. 2011, 27, 43–59. [Google Scholar]
- Jarque-Bou, N.J.; Vergara, M.; Sancho-Bru, J.L. Understanding Forearm Muscle Activity during Everyday Common Grasps: Insights for Rehabilitation, Prosthetic Control, and Human–Machine Interaction. Appl. Sci. 2024, 14, 3190. [Google Scholar] [CrossRef]
- Louis, N.; Gorce, P. Upper Limb Muscle Forces: A Comparative Study. J. Comput. Methods Biomech. Biomed. Eng. 2008, 11, 147–148. [Google Scholar] [CrossRef] [PubMed]
- Son, J.; Kim, Y. Development of System for Estimating Muscle Force in Real-Time. In Proceedings of the World Congress on Medical Physics and Biomedical Engineering, Munich, Germany, 7–12 September 2009. [Google Scholar]
- Du, Y.; Yao, W.; Wang, H.; Xie, P.; Qiu, S.; Zhang, N.; Zhang, J.; Xie, B. Research on An Method of Muscle Force Prediction Based on Dynamic Fuzzy Neural Network. In Proceedings of the Chinese Automation Congress (CAC), Xi’an, China, 30 November–2 December 2018. [Google Scholar]
- Vu, C.; Kim, J. Muscle Activity Monitoring with Fabric Stretch Sensors. J. Fibers Polym. 2017, 18, 1931–1937. [Google Scholar] [CrossRef]
- Alvarez, J.T.; Gerez, L.F.; Araromi, O.A.; Hunter, J.G.; Choe, D.K.; Payne, C.J.; Wood, R.J.; Walsh, C.J. Towards Soft Wearable Strain Sensors for Muscle Activity Monitoring. J. IEEE Trans. Neural Syst. Rehabil. Eng. 2022, 30, 2198–2206. [Google Scholar] [CrossRef]
- Lin, Y.-A.; Mhaskar, Y.; Silder, A.; Sessoms, P.H.; Fraser, J.J.; Loh, K.J. Muscle Engagement Monitoring Using Self-Adhesive Elastic Nanocomposite Fabrics. Sensors 2022, 22, 6768. [Google Scholar] [CrossRef] [PubMed]
- Wang, Y.; Zheng, L.; Yang, J.; Wang, S. A Grip Strength Estimation Method Using a Novel Flexible Sensor under Different Wrist Angles. Sensors 2022, 22, 2002. [Google Scholar] [CrossRef] [PubMed]
- Dahiya, A.S.; Gil, T.; Azemard, N.; Thireau, J.; Lacampagne, A.; Todri-Sanial, A.; Charlot, B. Stretchable strain sensors for human movement monitoring. In Proceedings of the 2020 Symposium on Design, Test, Integration & Packaging of MEMS and MOEMS (DTIP), Lyon, France, 15–26 June 2020. [Google Scholar]
- Sbernini, L.; Pallotti, A.; Saggio, G. Evaluation of a Stretch Sensor for its inedited application in tracking hand finger movements. In Proceedings of the 2016 IEEE International Symposium on Medical Measurements and Applications (MeMeA), Benevento, Italy, 15–18 May 2016. [Google Scholar]
- Wu, Y.; Beker, L.; Karakurt, I.; Cai, W.; Elwood, J.; Li, X.; Zhong, J.; Zhang, M.; Wang, X.; Lin, L. High resolution flexible strain sensors for biological signal measurements. In Proceedings of the 2017 19th International Conference on Solid-State Sensors, Actuators and Microsystems (TRANSDUCERS), Kaohsiung, Taiwan, 18–22 June 2017. [Google Scholar]
- Flexible Stretch Sensor. Available online: https://www.imagesco.com/sensors/stretch-sensor.html (accessed on 20 March 2025).
- MindRove Armband EMG. Available online: https://mindrove.com/armband/ (accessed on 20 March 2025).
- Muscles in the Posterior Compartment of the Forearm. Available online: https://teachmeanatomy.info/upper-limb/muscles/posterior-forearm/ (accessed on 20 March 2025).
- Practical Guide to Data Smoothing and Filtering. Available online: http://isbweb.org/software/sigproc/bogert/filter.pdf (accessed on 8 February 2025).
- Xin, Q.; Yahya, N.; Izhar, L.I.; Xie, P.; Qiu, S.; Zhang, N.; Zhang, J.; Xie, B. Classification of Neurological States from Biosensor Signals Based on Statistical Features. In Proceedings of the 2019 IEEE Student Conference on Research and Development (SCOReD), Bandar Seri Iskandar, Malaysia, 14 November 2019. [Google Scholar]
- Chang, C.Y.; Wu, Y.T.; Lin, C.Y.; Liu, T.S.; Ho, T.Y.; Shen, Y.P.; Liu, K.C.; Lu, T.Y.; Chou, L.W. Inertial Measurement Unit-Based Functional Evaluation for Adhesive Capsulitis Assessment. ConScientiae Saúde 2013, 12, 470–479. [Google Scholar] [CrossRef]
- Silva, R.A.D., Jr. EMG normalization: Considerations of the literature for muscular function evaluation. J. Med. Sci. 2022, 42, 115–119. [Google Scholar]
- Tabard-Fougère, A.; Rose-Dulcina, K.; Pittet, V.; Dayer, R.; Vuillerme, N.; Armand, S. EMG normalization method based on grade 3 of manual muscle testing: Within-and between-day reliability of normalization tasks and application to gait analysis. Gait Posture 2018, 60, 6–12. [Google Scholar] [CrossRef]
- Ali, A.M.M.; Yusof, Z.M.D.; Kushairy, A.K.; Zaharah, H.F.; Ismail, A. Development of Smart Glove system for therapy treatment. In Proceedings of the 2015 International Conference on BioSignal Analysis, Processing and Systems (ICBAPS), Kuala Lumpur, Malaysia, 8 October 2015. [Google Scholar]
- Janarthanan, V.; Assad-Uz-Zaman, M.; Rahman, M.H.; McGonigle, E.; Wang, I. Design and development of a sensored glove for home-based rehabilitation. J. Hand Ther. 2020, 33, 209–219. [Google Scholar] [CrossRef]
- Imtiaz, S.; Humyra, R.; Sharar Kashem, M.R.; Khan, M.F.; Hossain, M.S.; Kabir, M.H. Rehabilitation For Stroke Survivors: The Development of a Smart Glove. In Proceedings of the 2023 26th International Conference on Computer and Information Technology (ICCIT), Cox’s Bazar, Bangladesh, 27 February 2024. [Google Scholar]
- Bernocchi, P.; Mulè, C.; Vanoglio, F.; Taveggia, G.; Luisa, A.; Scalvini, S. Home-based hand rehabilitation with a robotic glove in hemiplegic patients after stroke: A pilot feasibility study. Top. Stroke Rehabil. 2018, 25, 114–119. [Google Scholar] [CrossRef]
- Wittmann, F.; Held, J.P.; Lambercy, O.; Starkey, M.L.; Curt, A.; Höver, R.; Gonzenbach, R.R. Self-directed arm therapy at home after stroke with a sensor-based virtual reality training system. J. Neuroeng. Rehabil. 2016, 13, 1–10. [Google Scholar] [CrossRef] [PubMed]
Disclaimer/Publisher’s Note: The statements, opinions and data contained in all publications are solely those of the individual author(s) and contributor(s) and not of MDPI and/or the editor(s). MDPI and/or the editor(s) disclaim responsibility for any injury to people or property resulting from any ideas, methods, instructions or products referred to in the content. |
© 2025 by the authors. Licensee MDPI, Basel, Switzerland. This article is an open access article distributed under the terms and conditions of the Creative Commons Attribution (CC BY) license (https://creativecommons.org/licenses/by/4.0/).