
The Evolutionary Traits of Carbon Emissions from the Planting Industry in Beijing, China

Abstract
1. Introduction
2. Materials and Methods
2.1. Main Sources of Carbon Emissions from the Planting Industry
2.2. Data Sources and Calculation Methods
2.2.1. Carbon Emissions from Agricultural Inputs
2.2.2. Carbon Emissions of N2O from Agricultural Land
Direct Carbon Emissions
Indirect Carbon Emissions of N2O from Agricultural Land
2.2.3. Carbon Emissions of CH4 Caused by Rice Cultivation
3. Results
3.1. Carbon Emissions from the Planting Industry
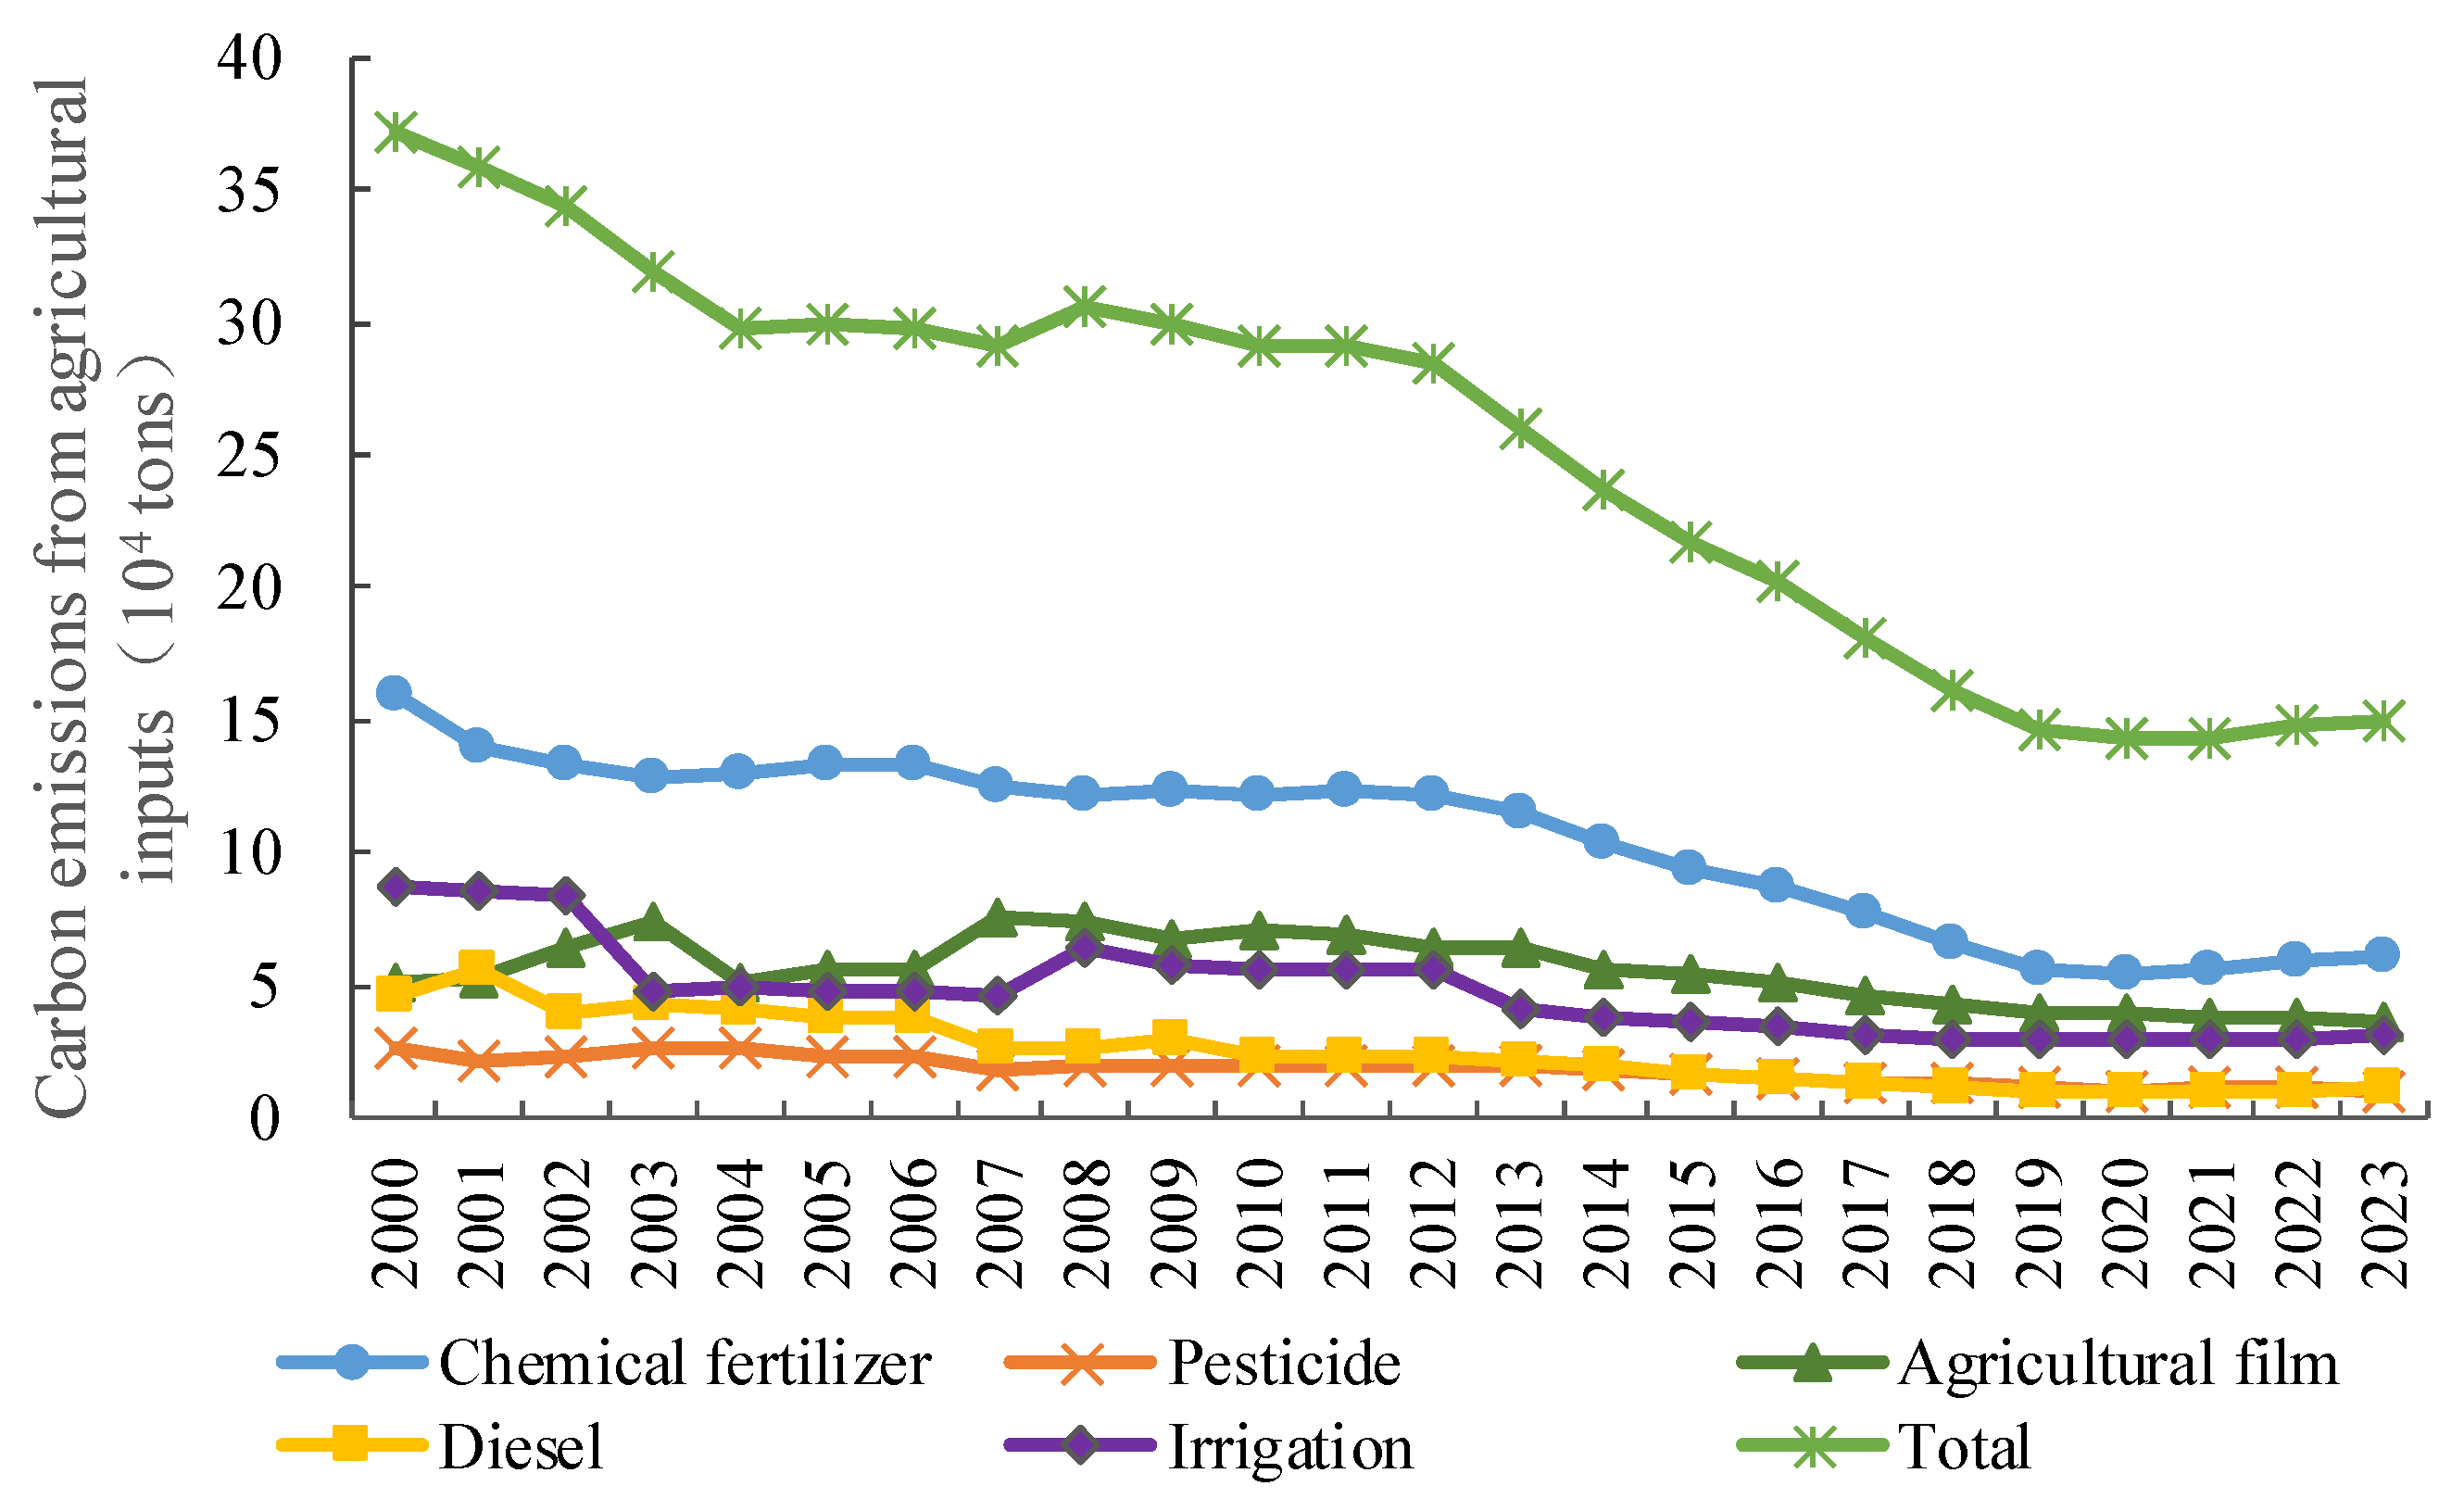
3.1.1. Carbon Emissions from Agricultural Inputs
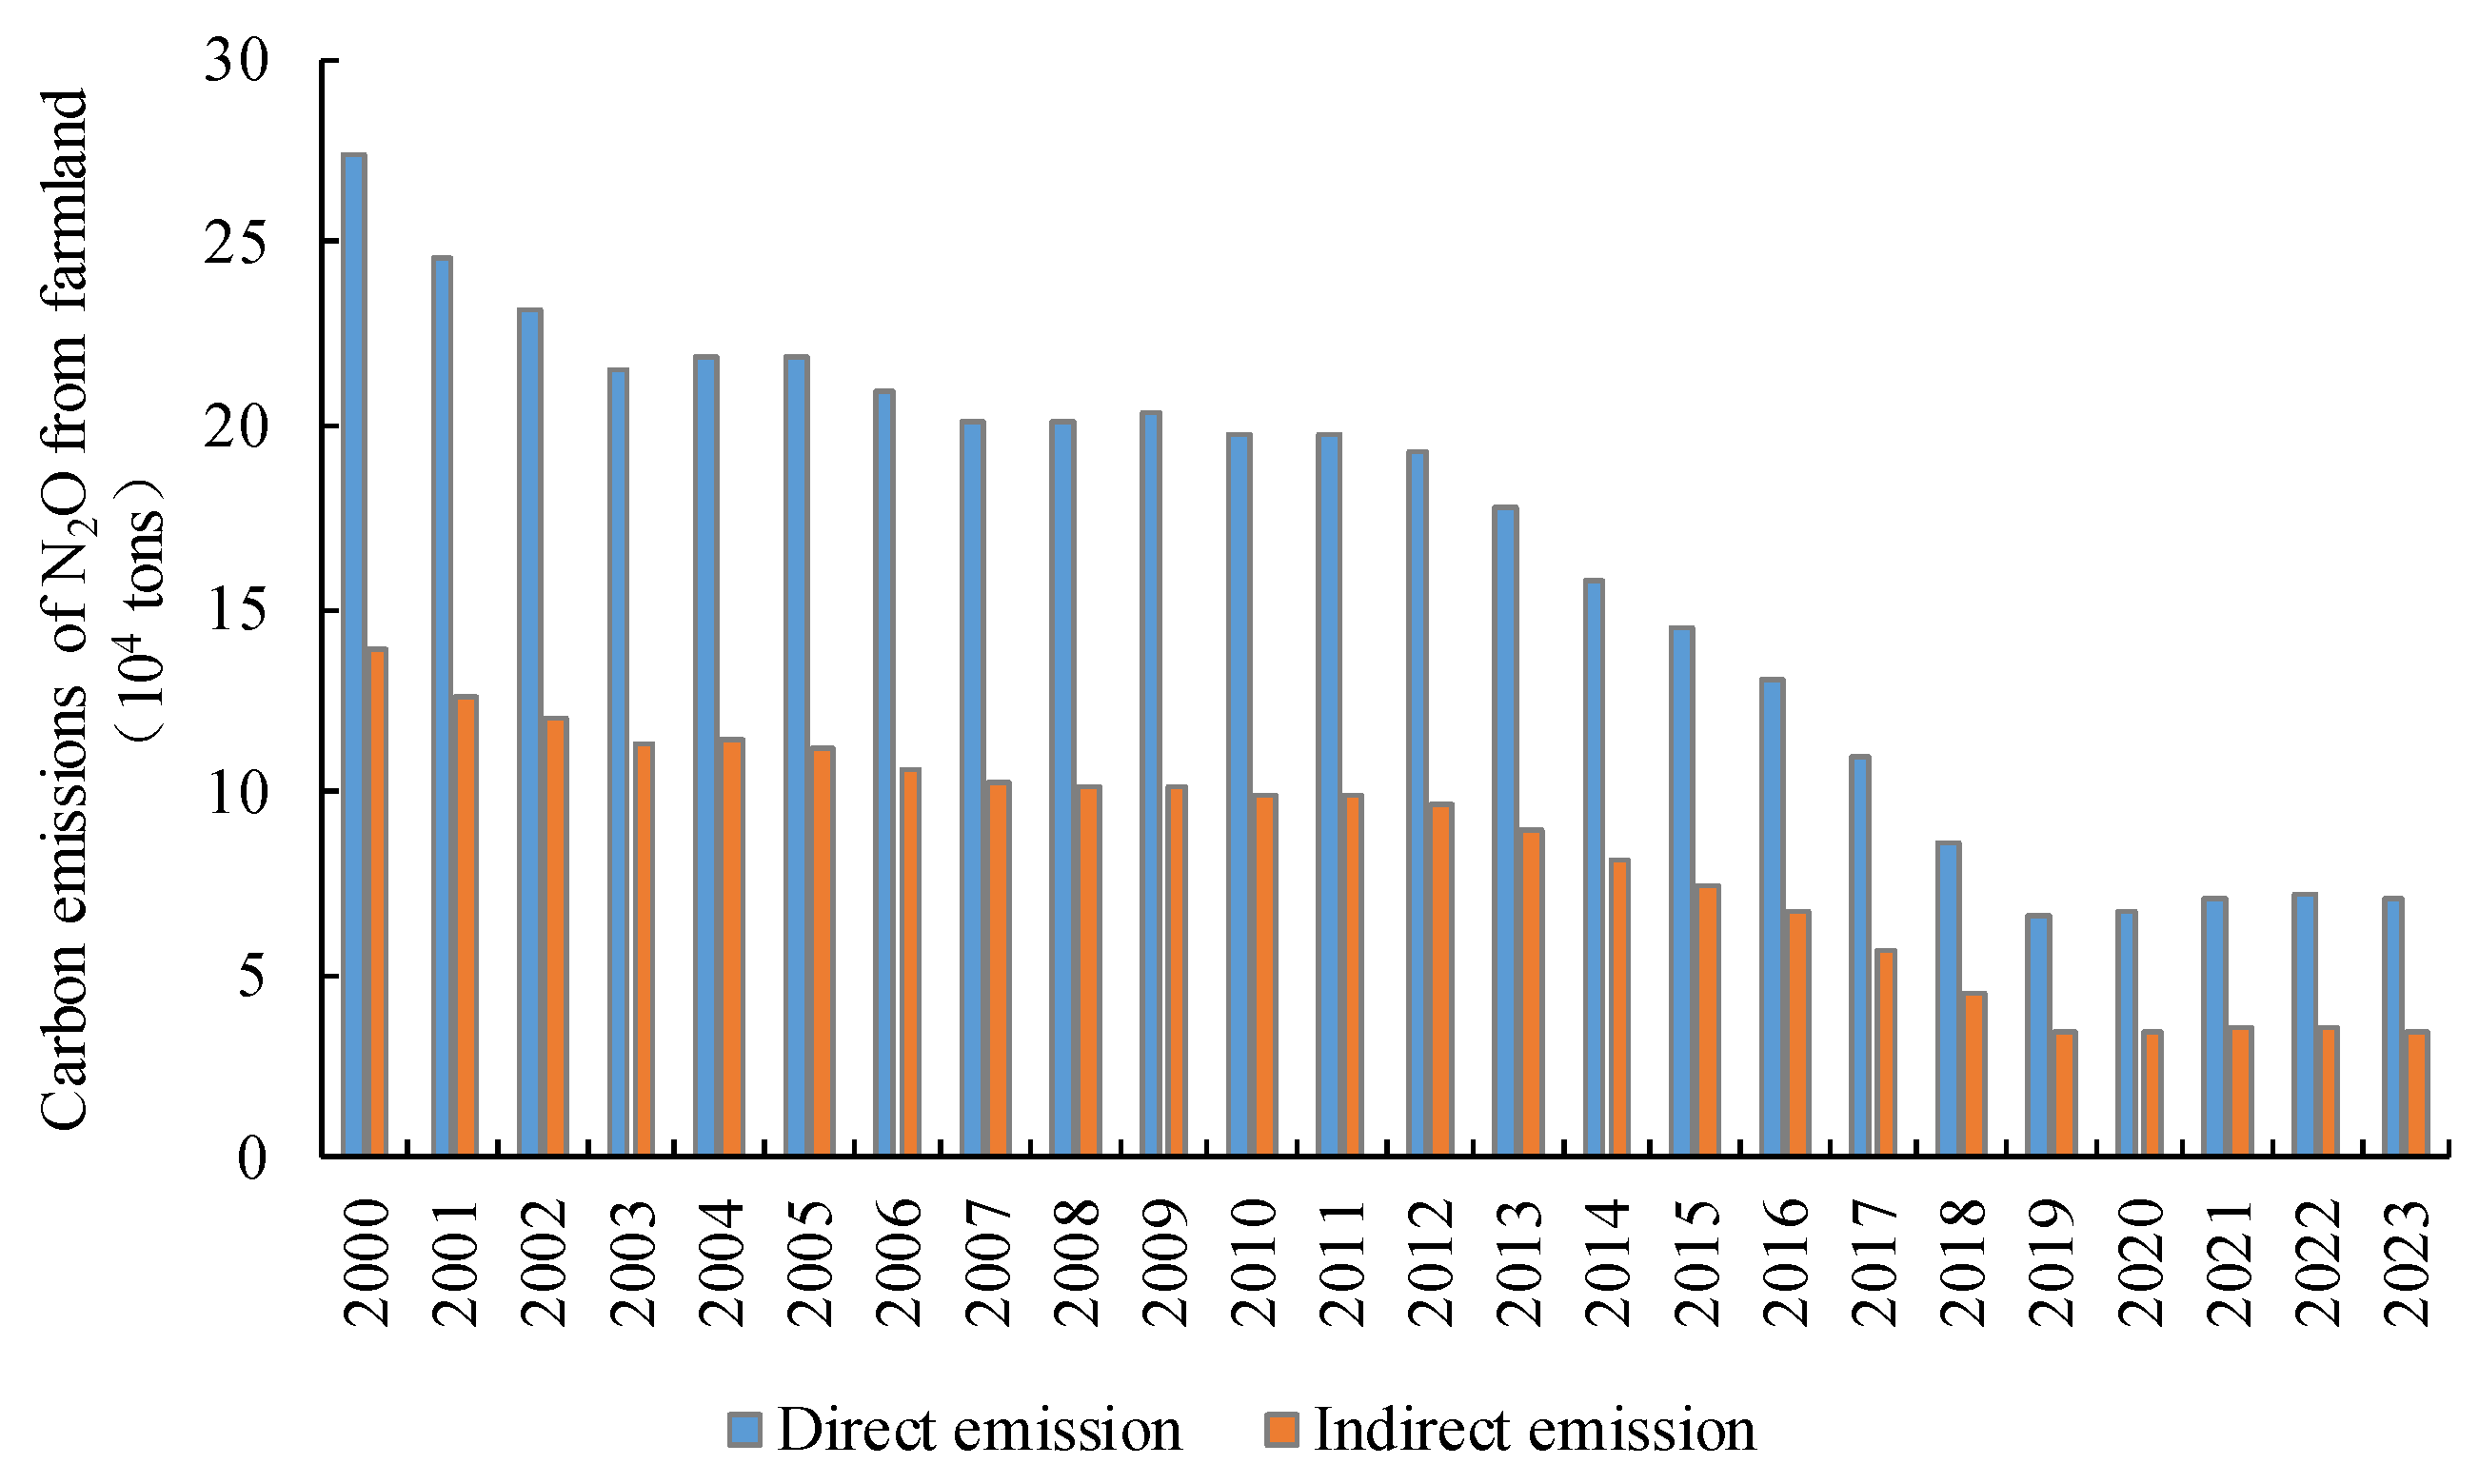
3.1.2. Carbon Emissions of N2O from Agricultural Land
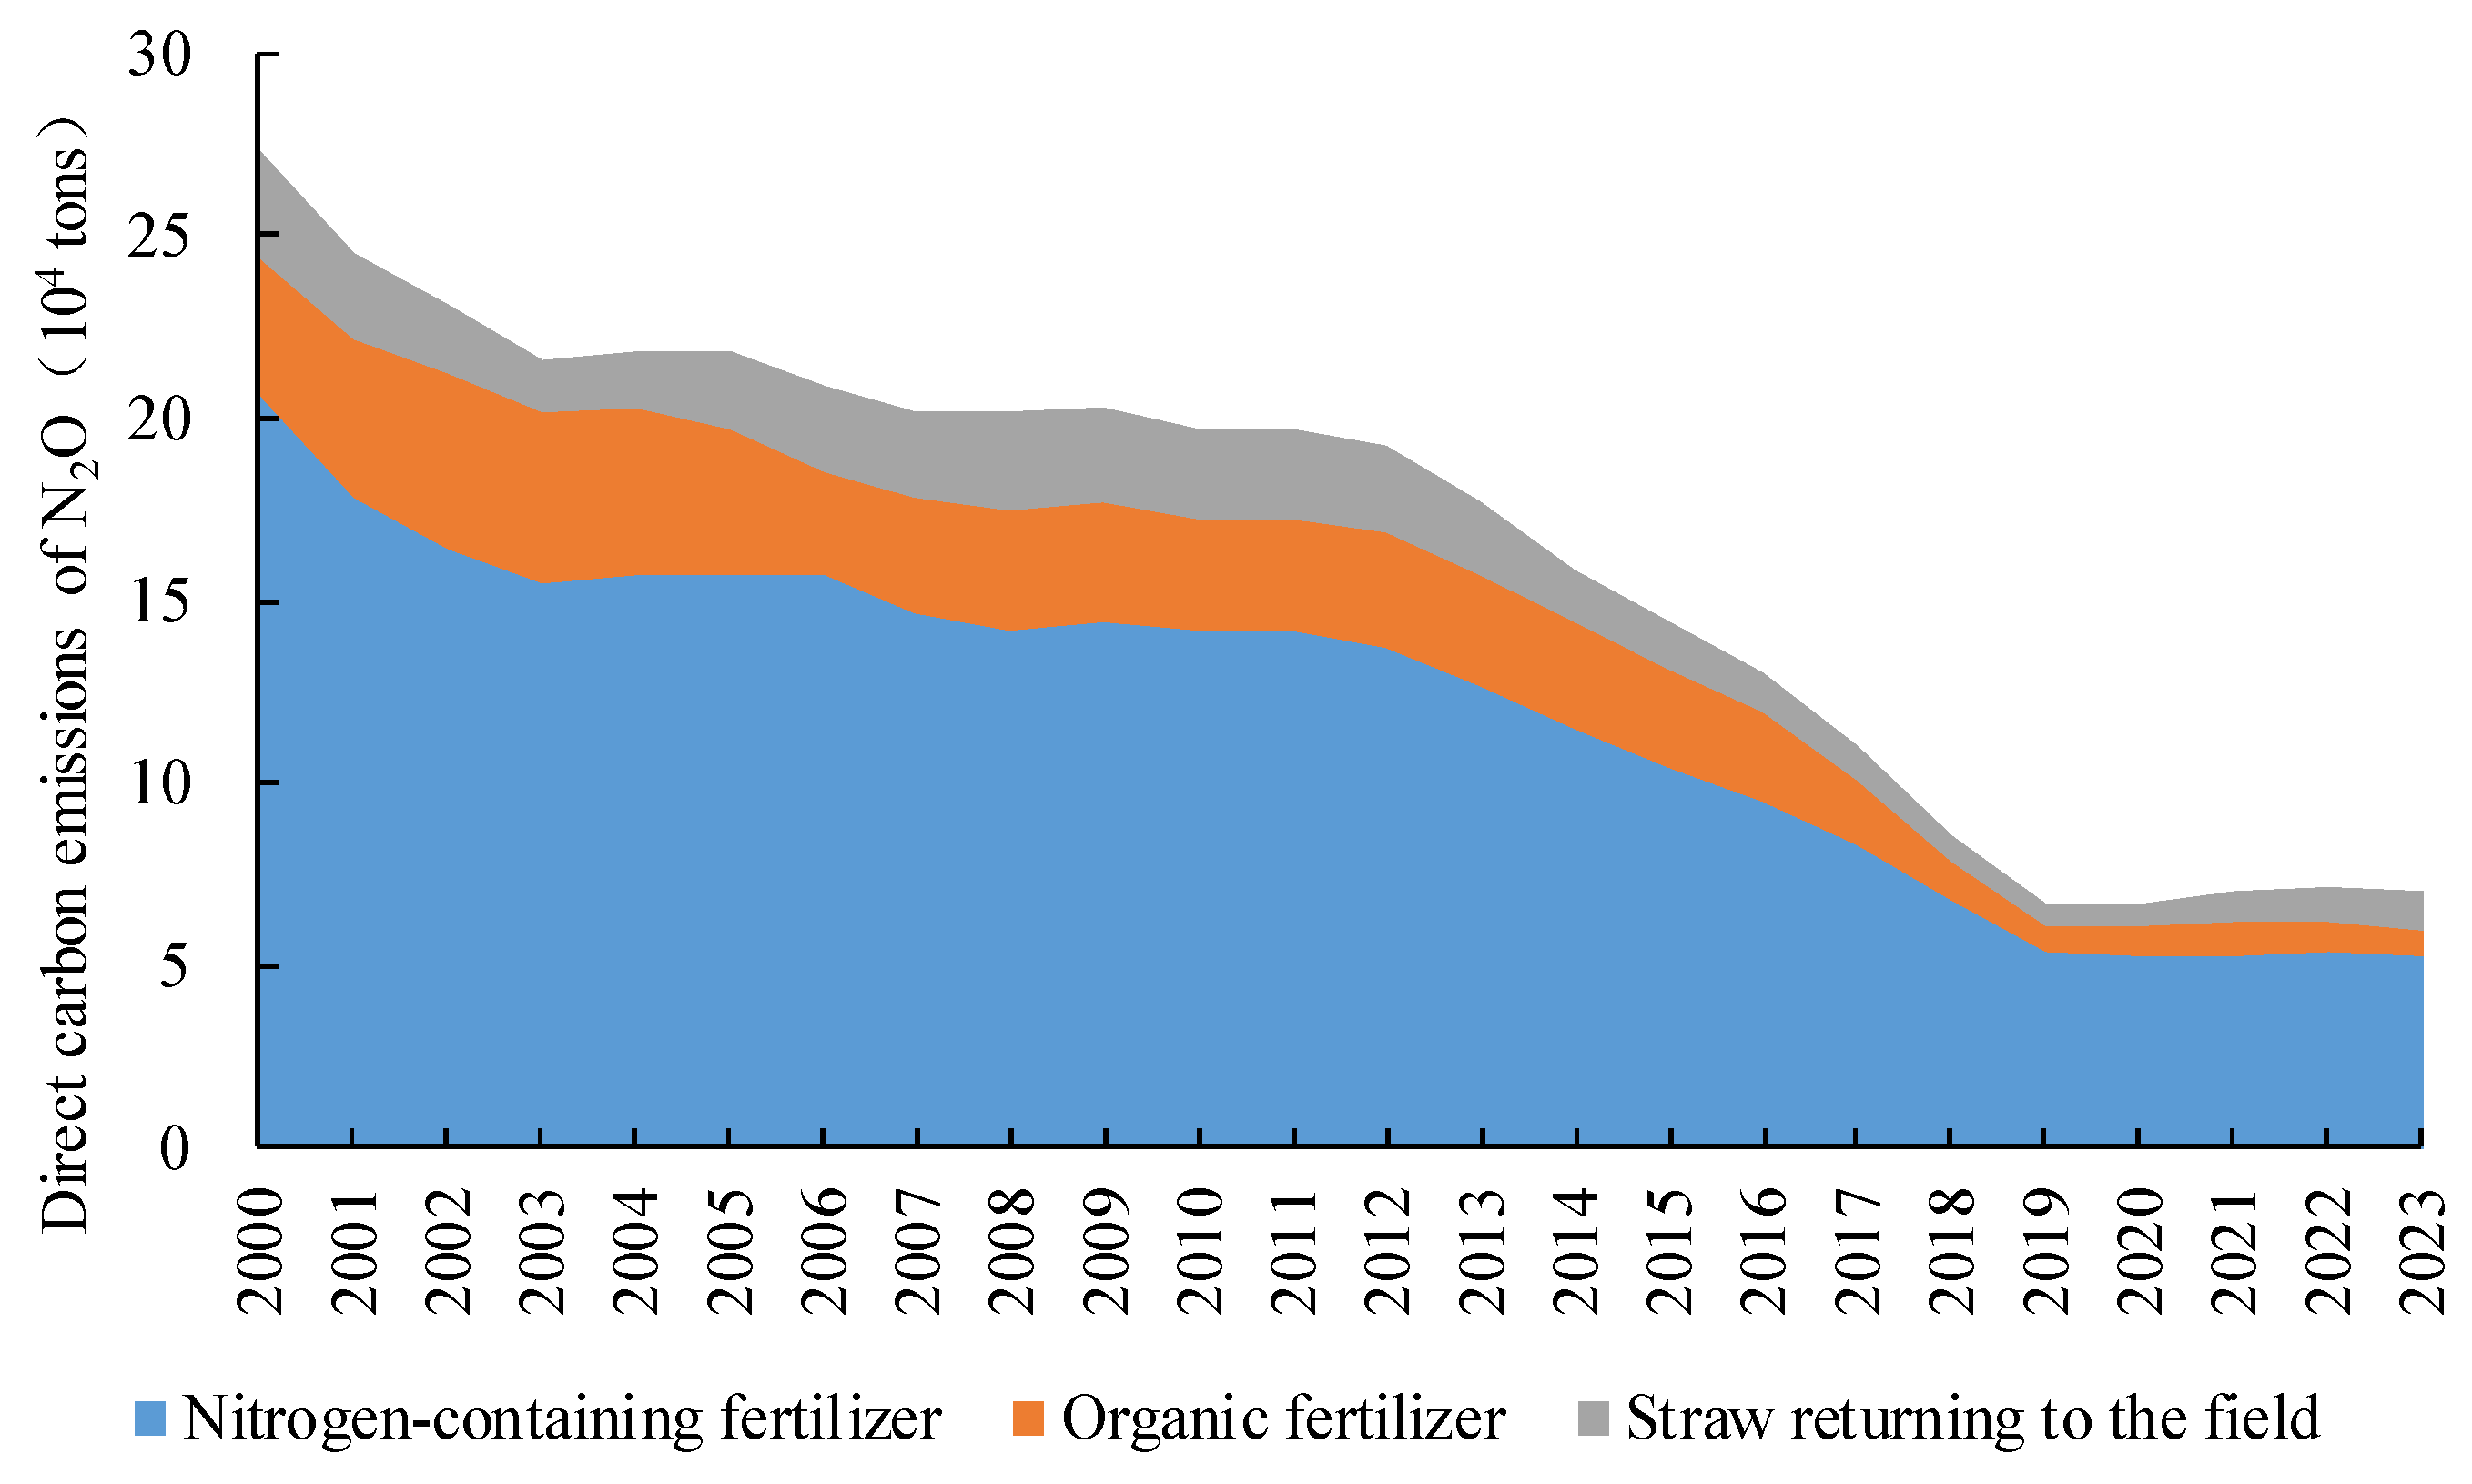
Direct Carbon Emissions of N2O
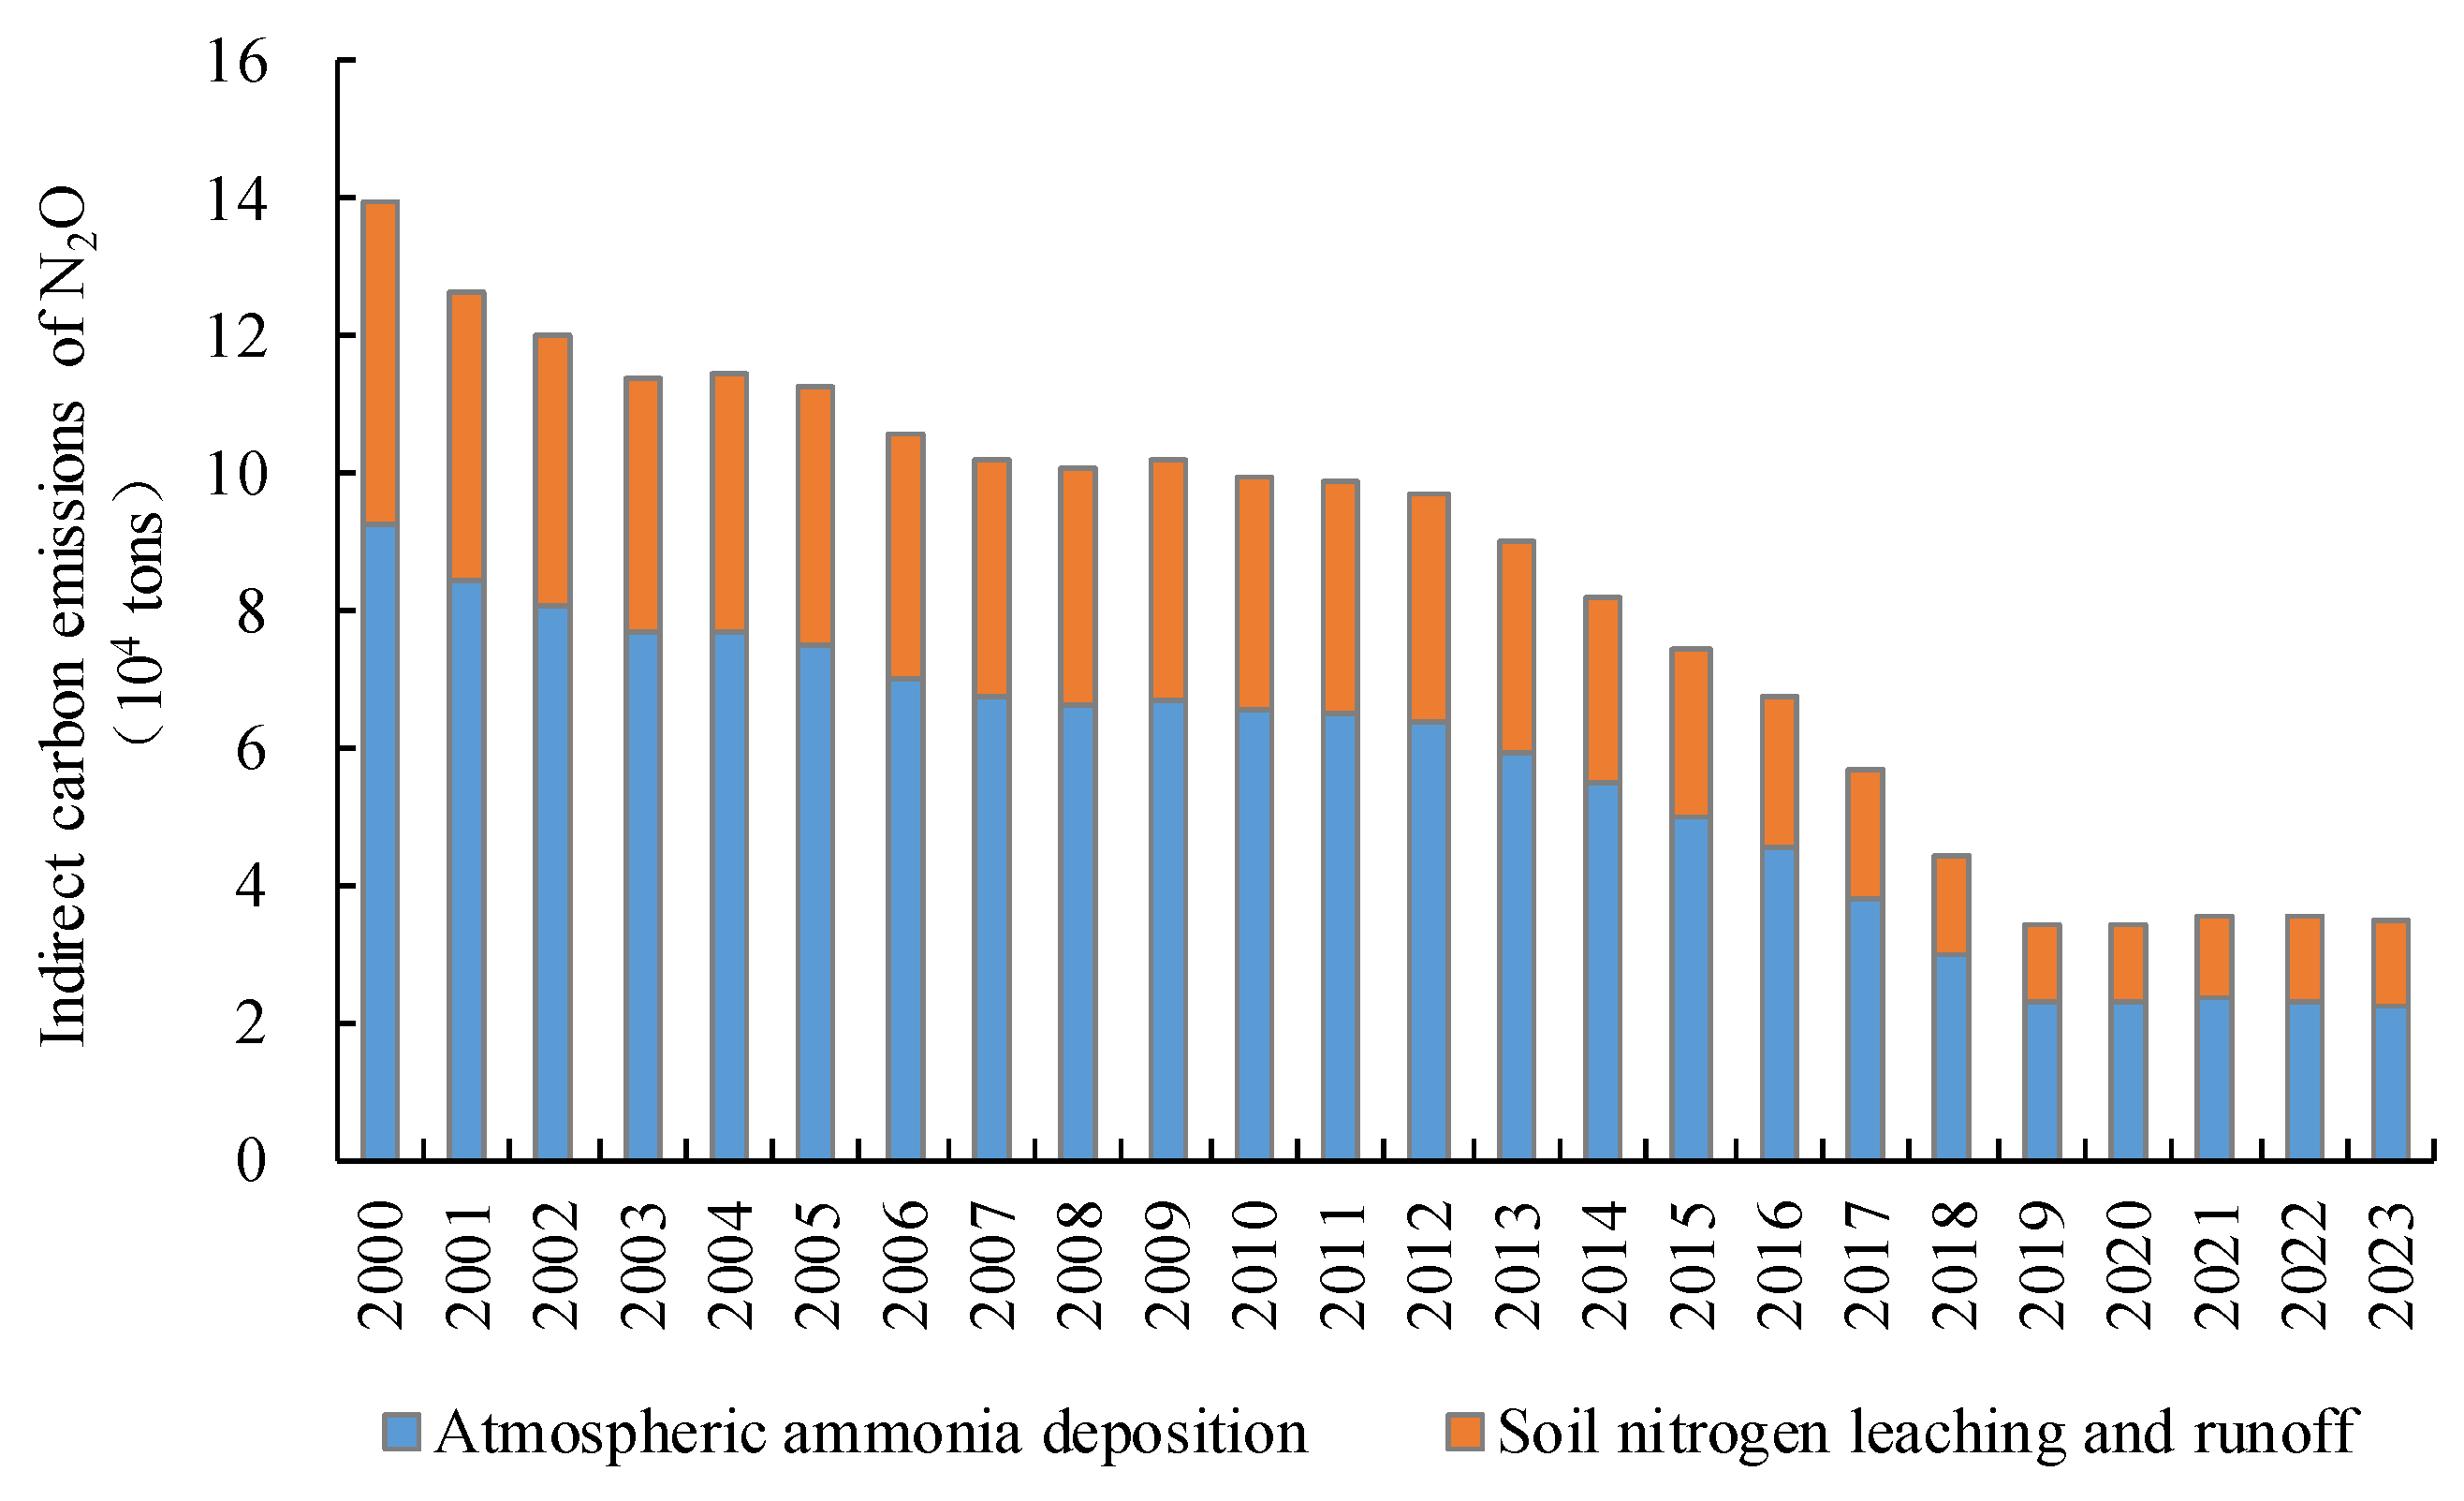
Indirect Carbon Emissions of N2O
Total Carbon Emissions of N2O from Agricultural Land
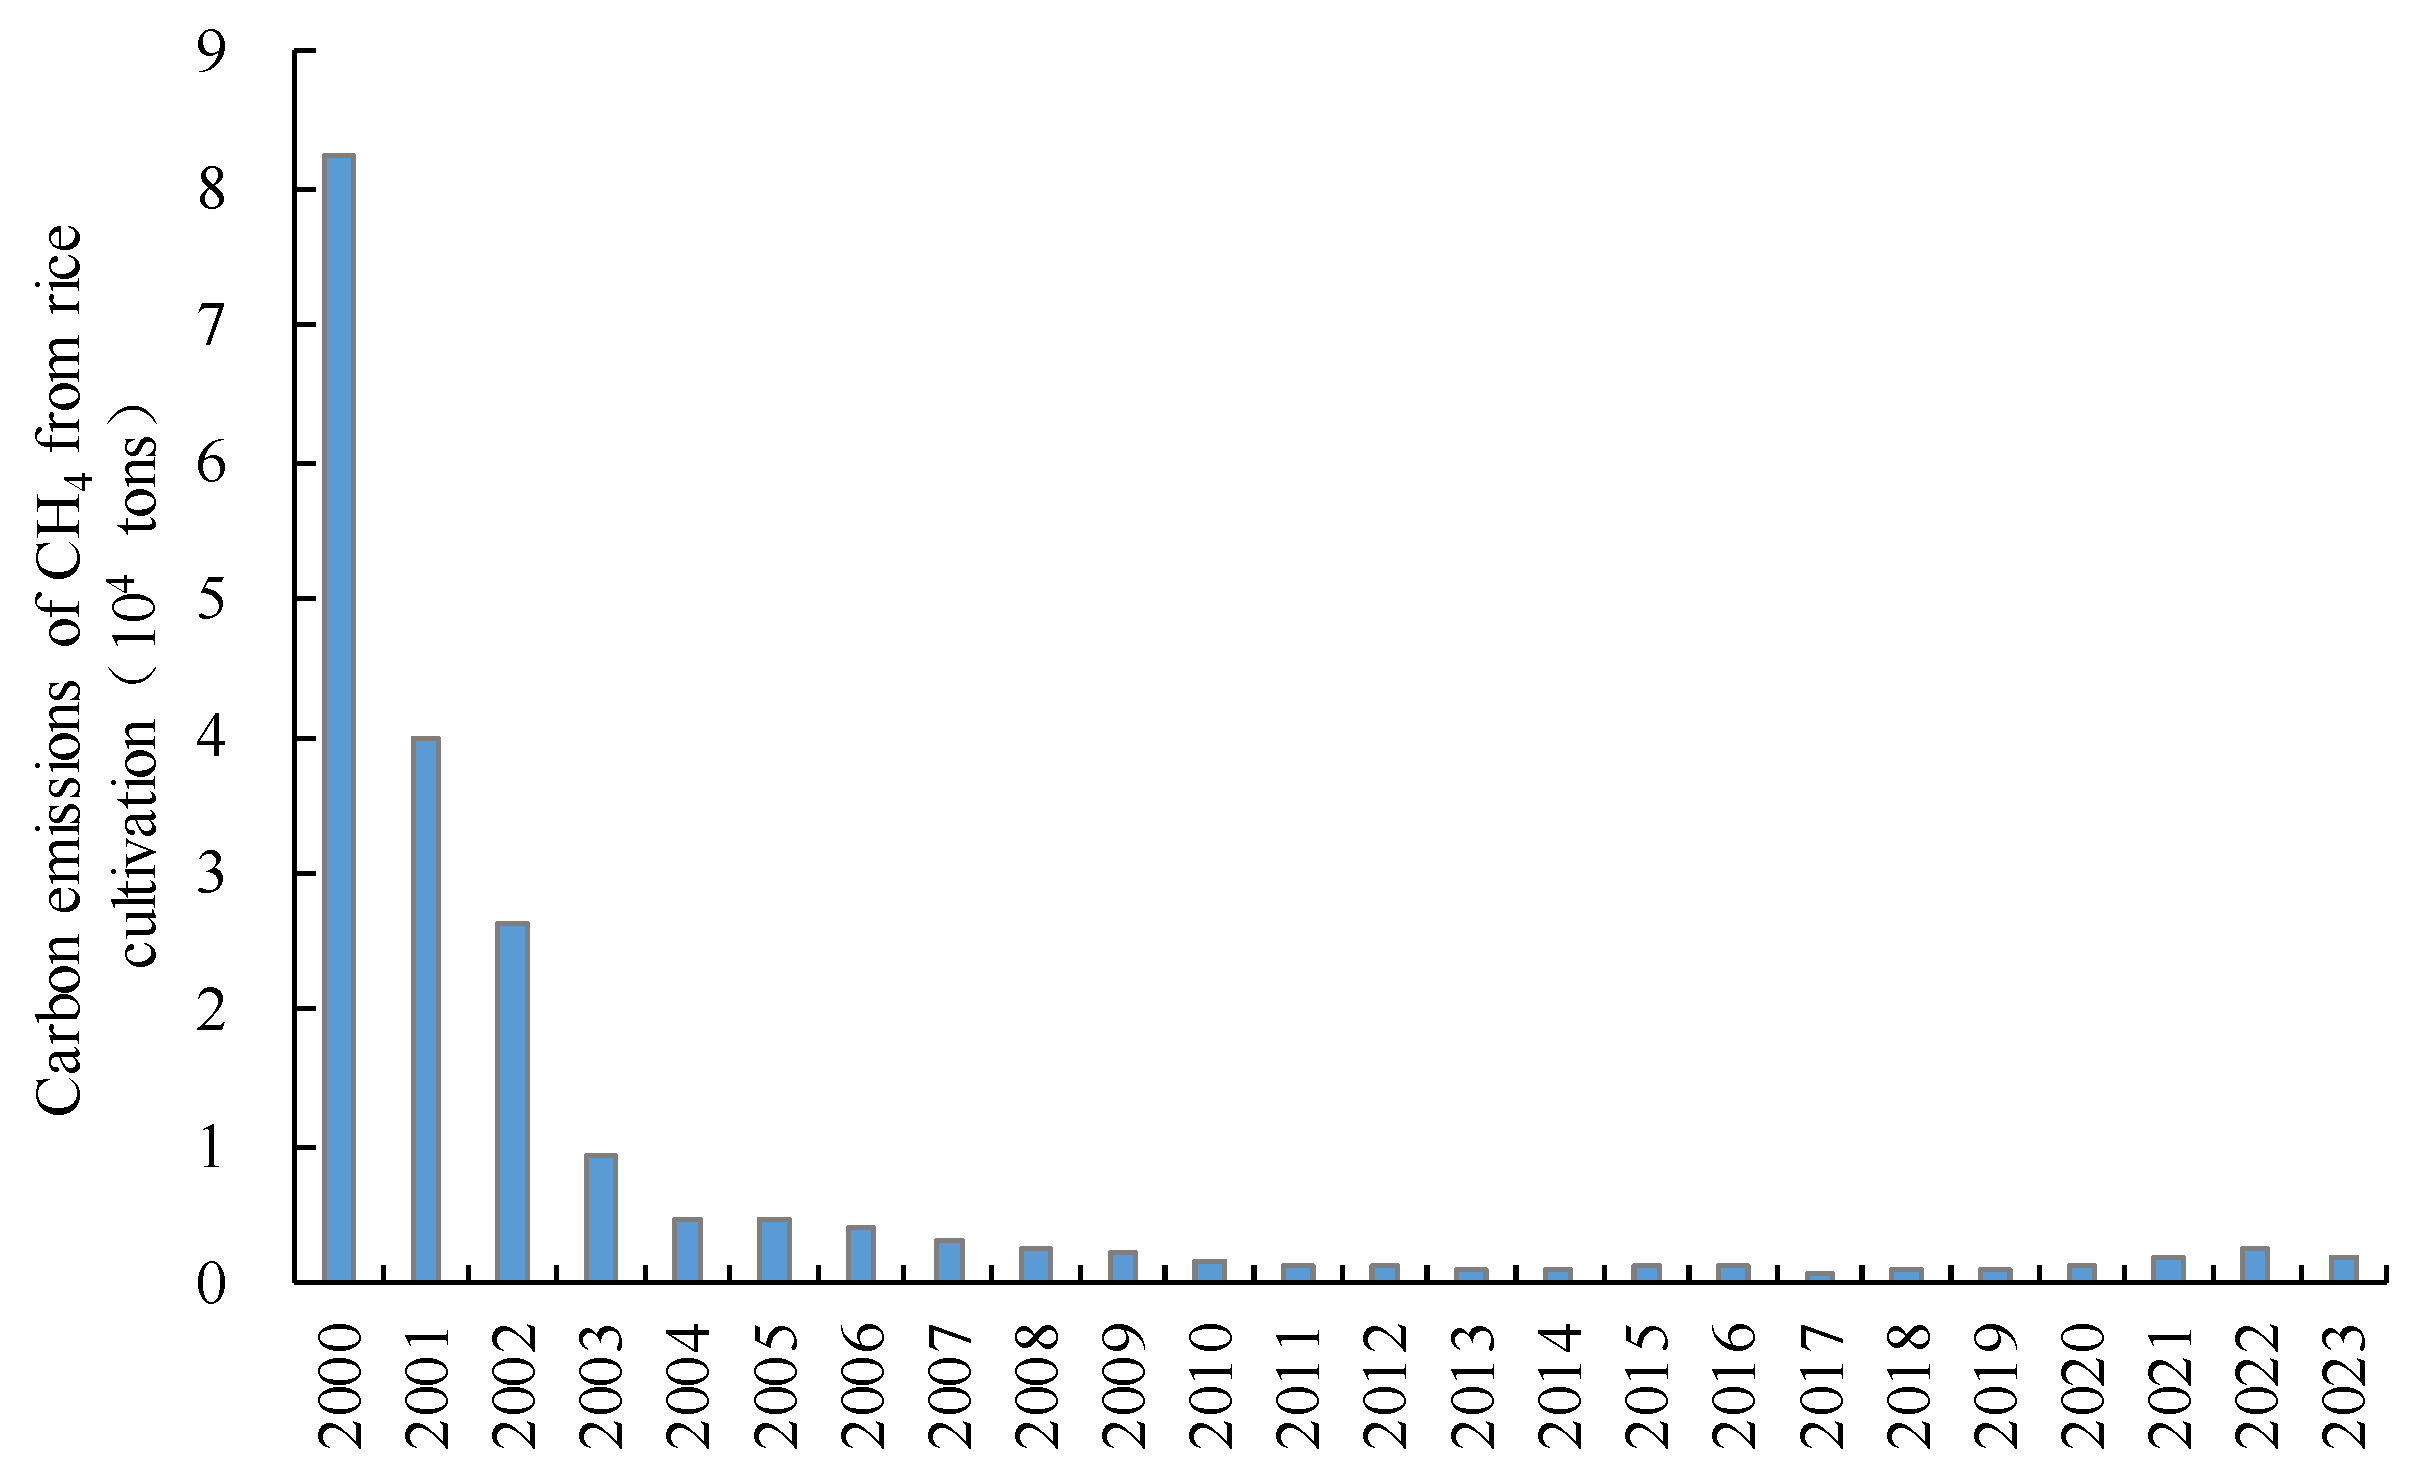
3.1.3. Carbon Emissions of CH4 from Rice Cultivation
3.1.4. Total Carbon Emissions from the Planting Industry
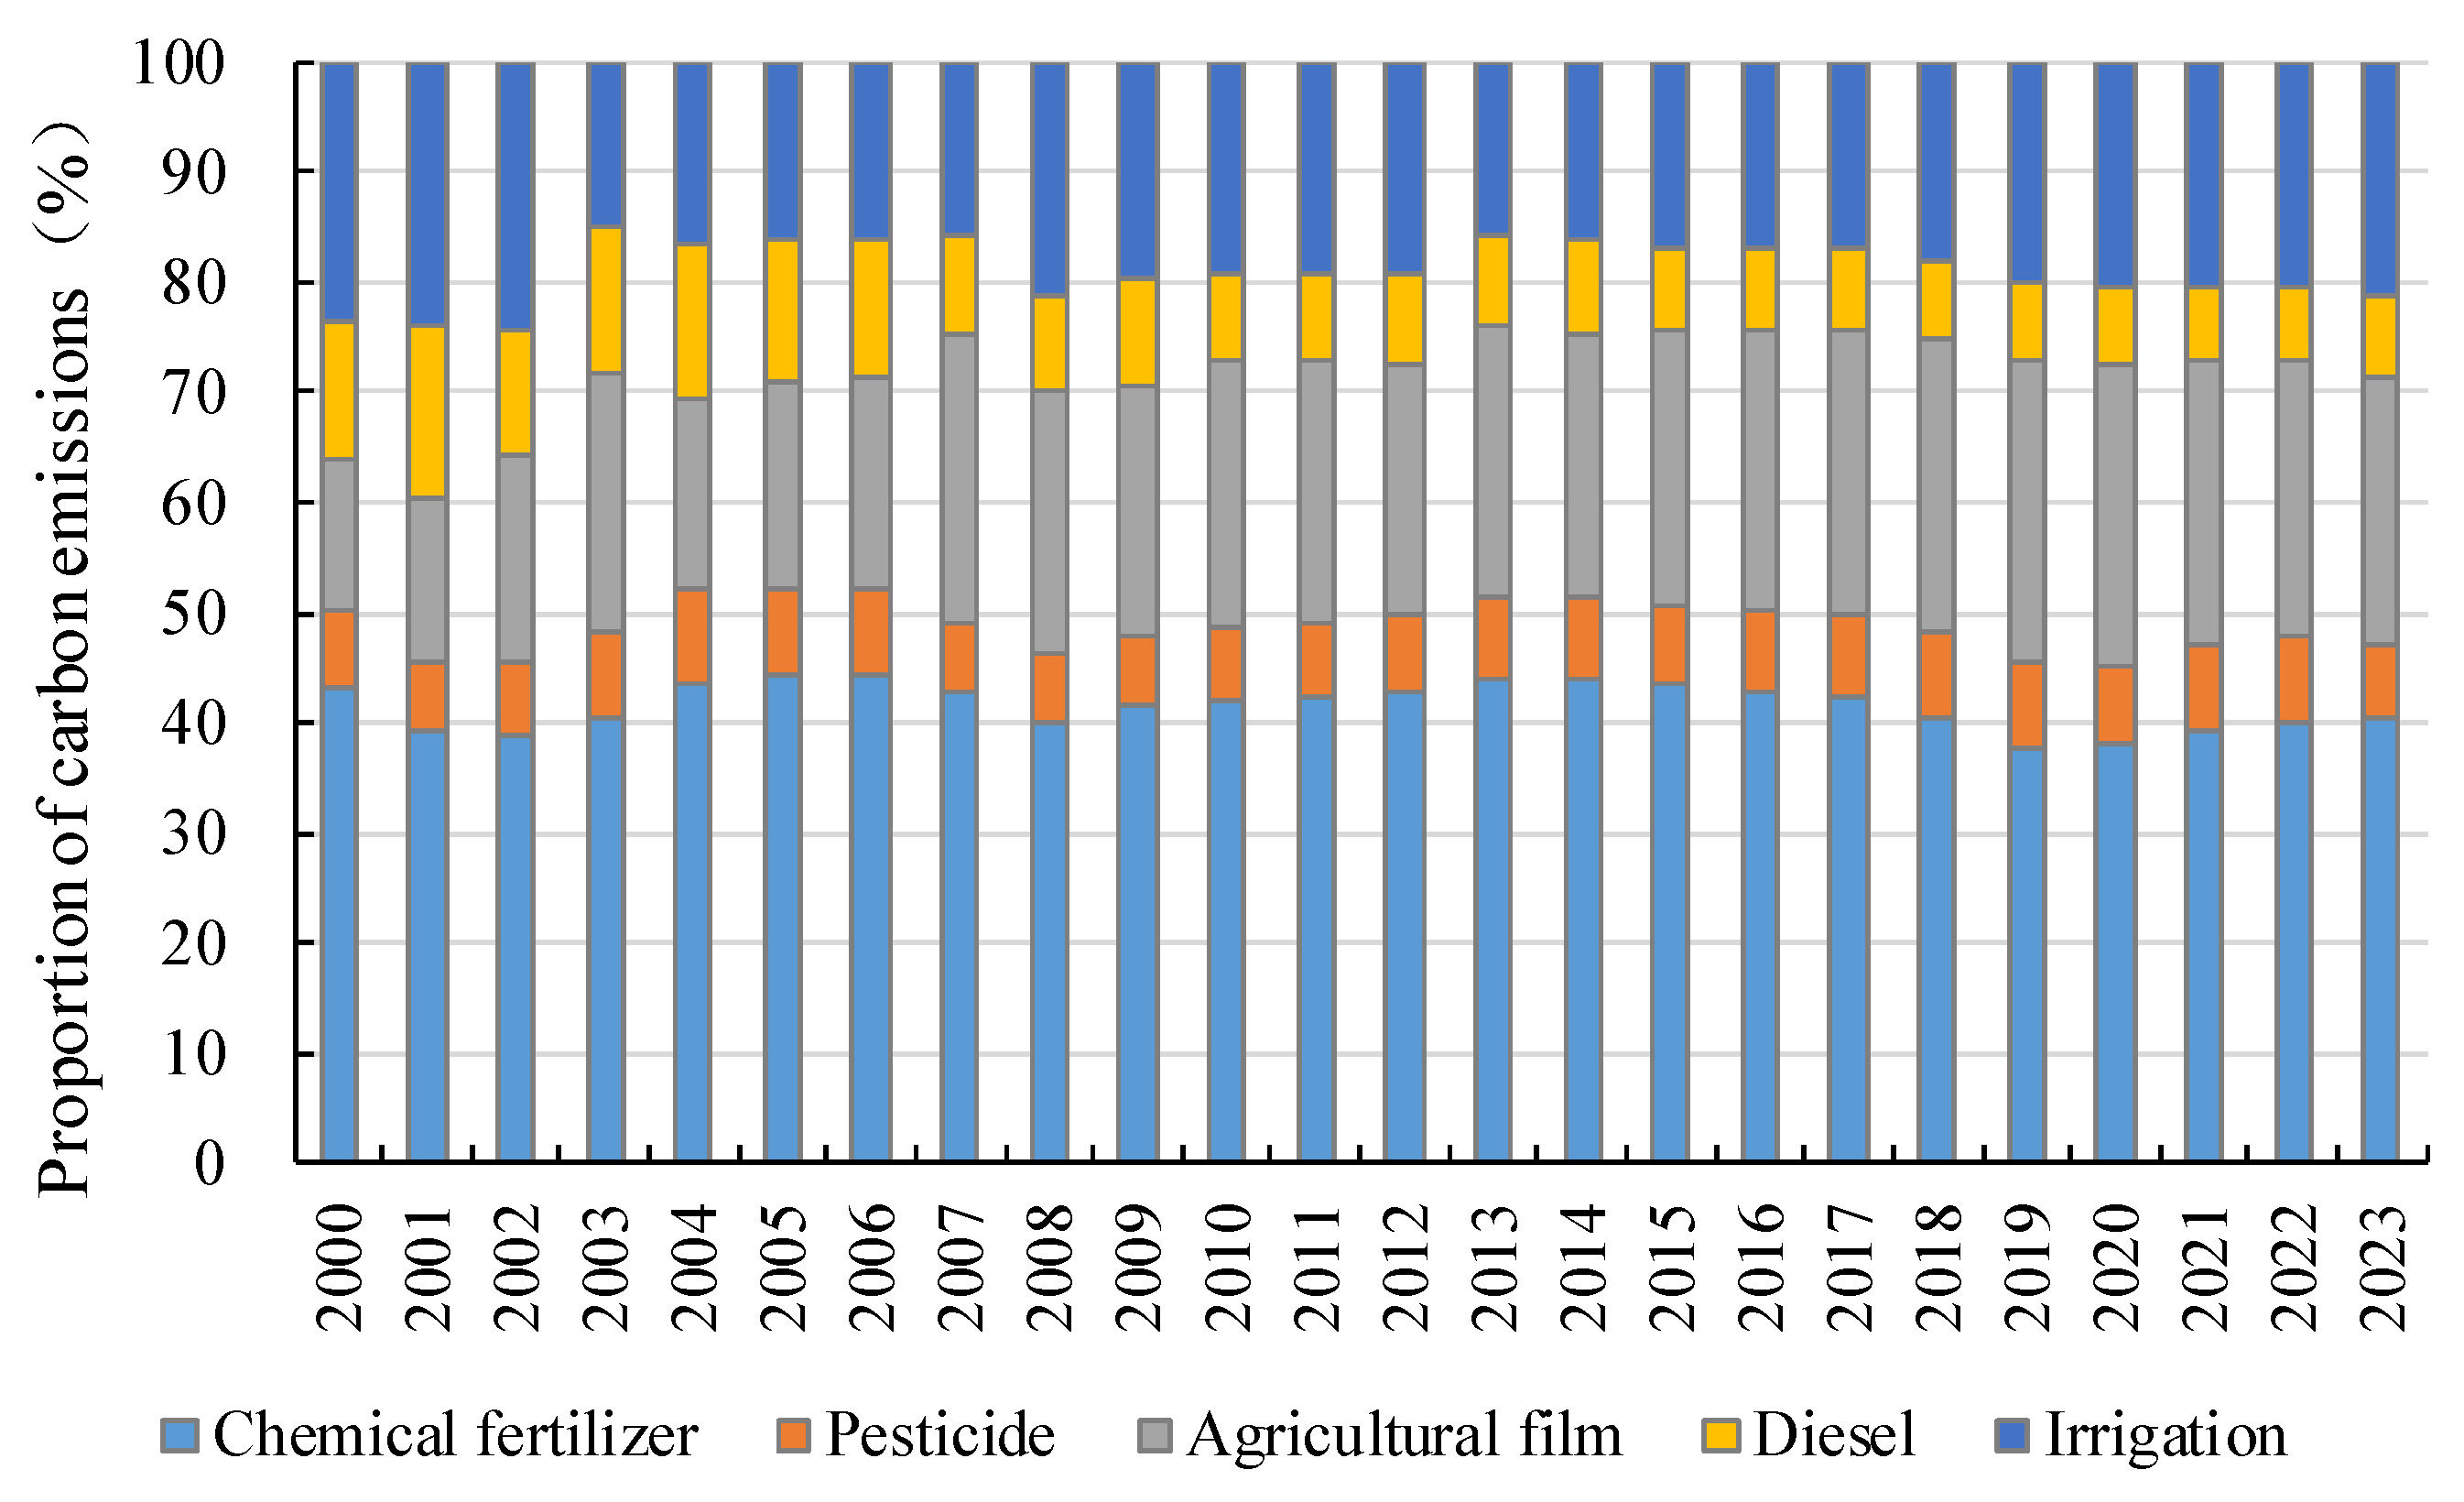
3.1.5. Carbon Emissions Structure in the Planting Industry
3.2. Characteristics of Carbon Benefits in the Planting Industry of Beijing
3.2.1. Production Benefit of Carbon
3.2.2. Economic Benefit of Carbon
3.2.3. Ecological Benefit of Carbon
3.3. Characteristics of Carbon Emissions from the Planting Industry in Beijing
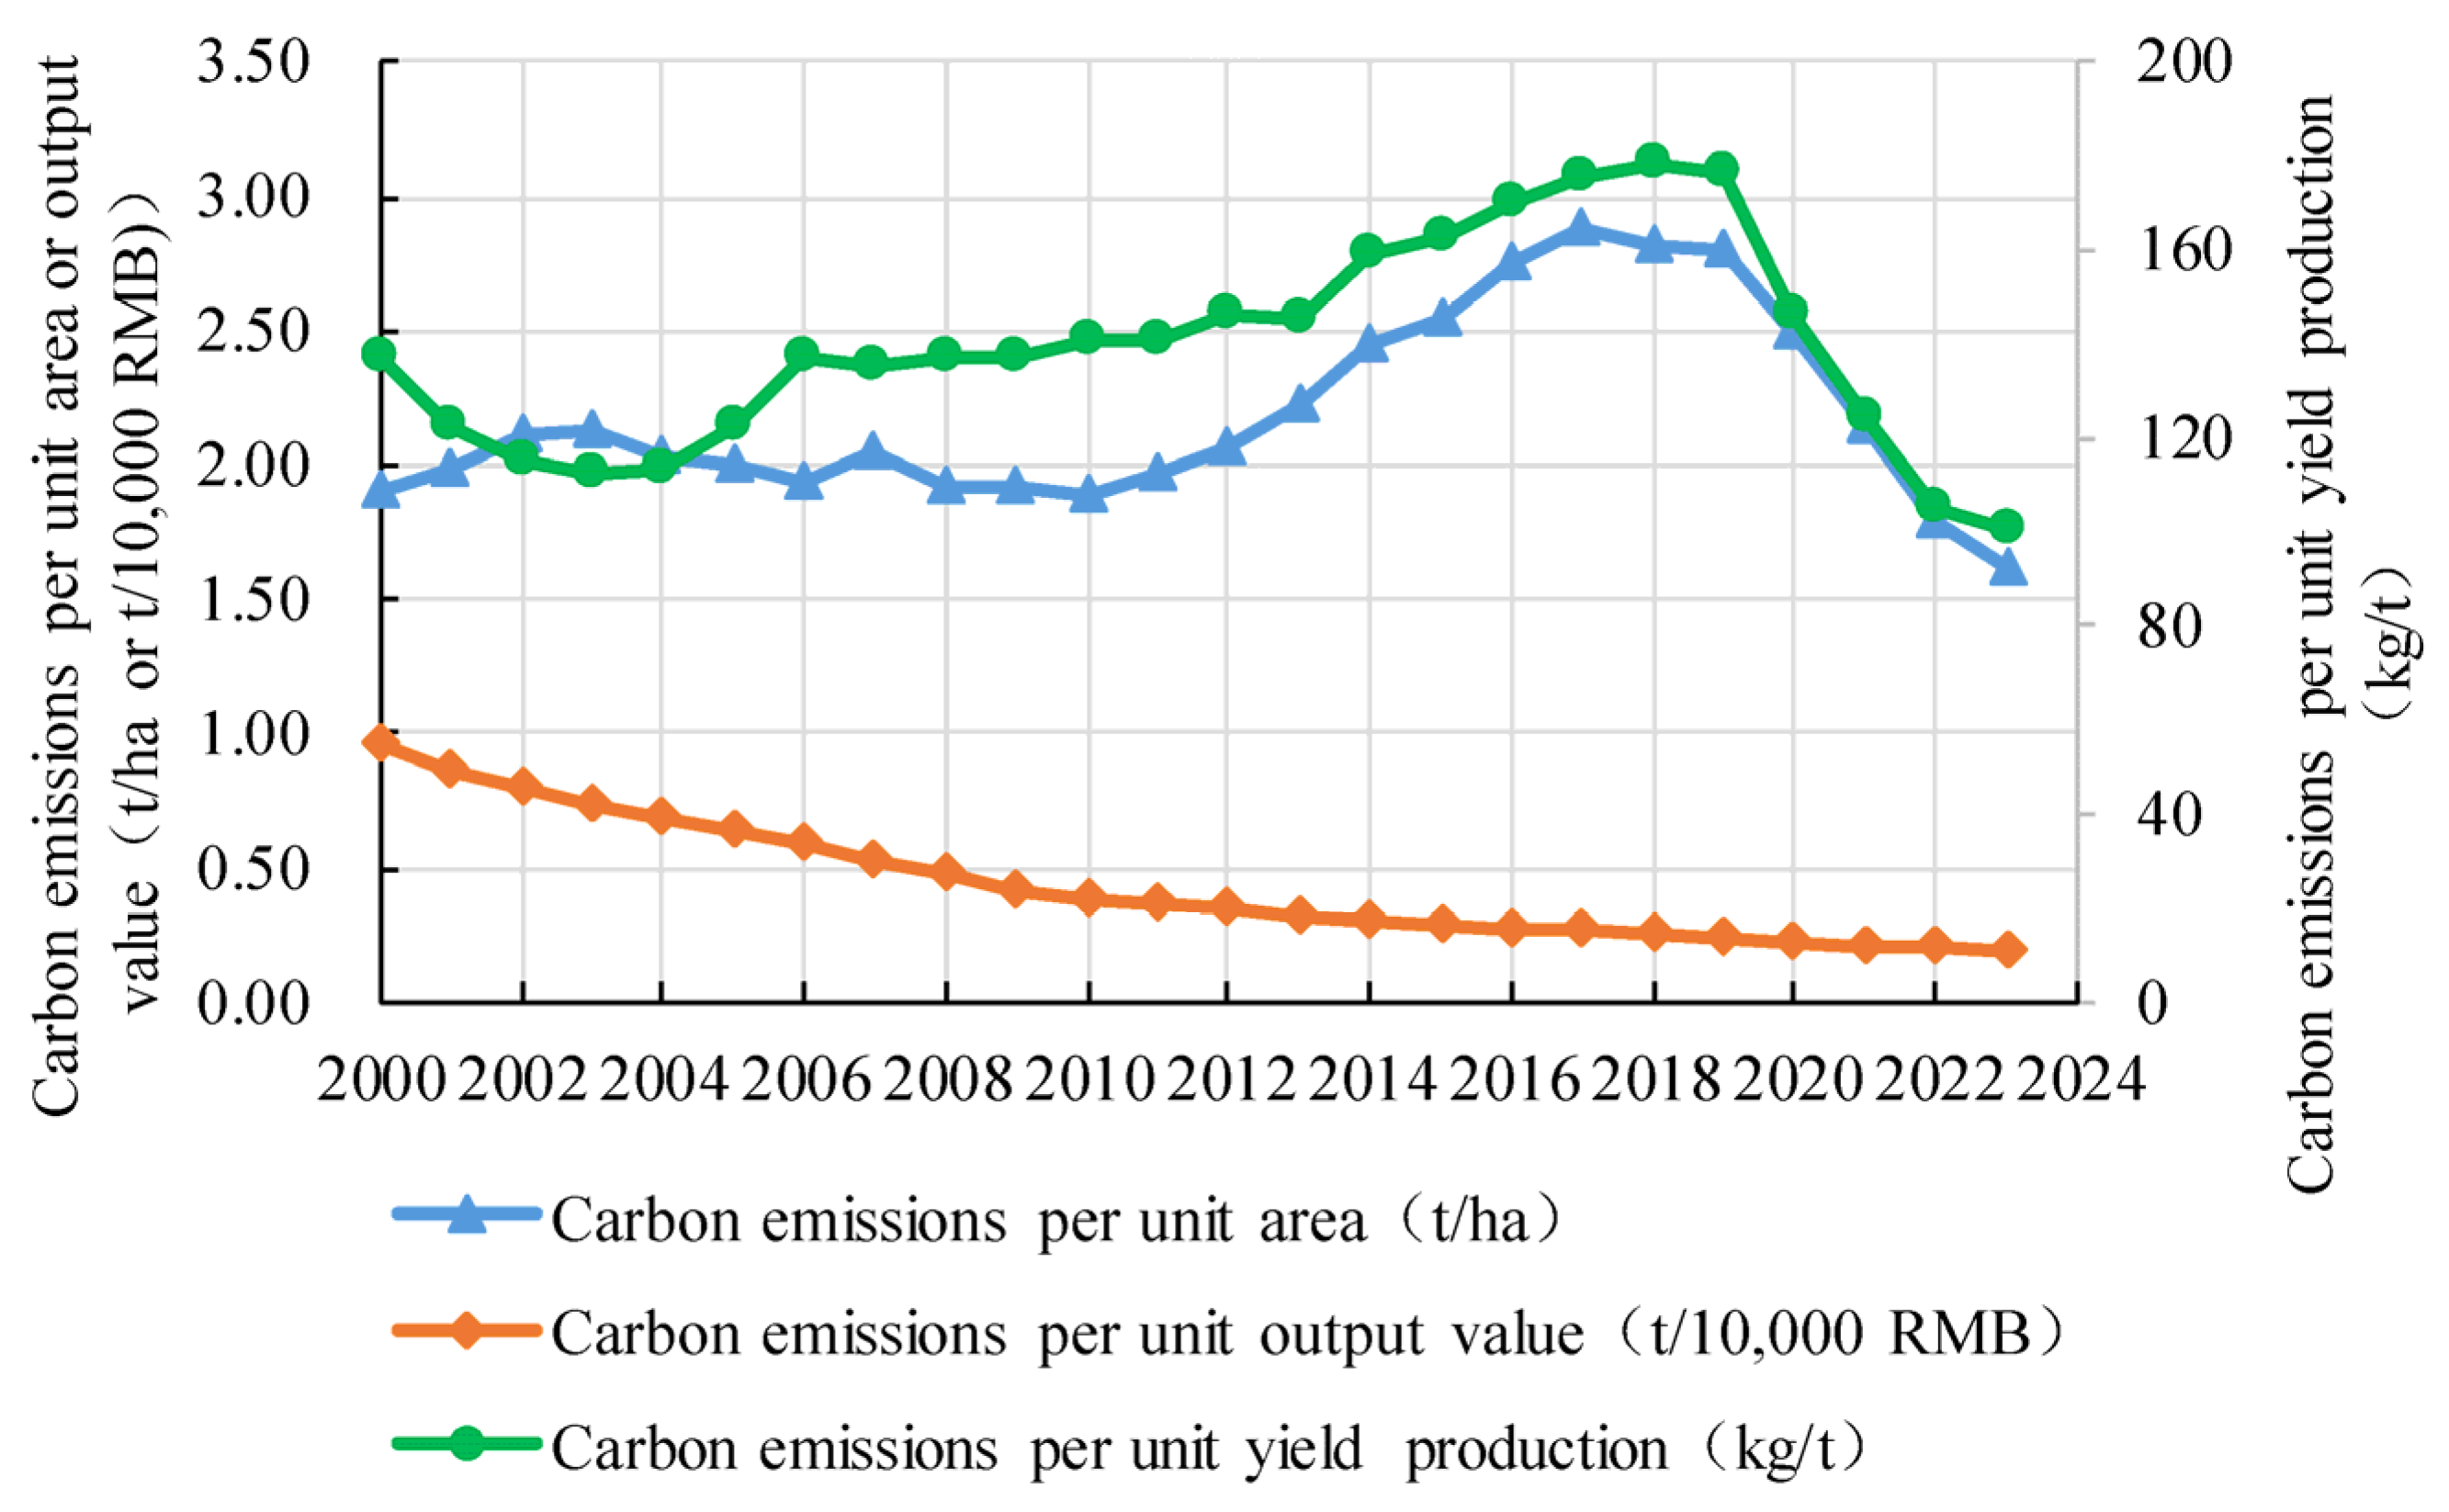
3.3.1. Carbon Emissions per Unit of Area
3.3.2. Carbon Emissions per Unit of Output
3.3.3. Carbon Emissions per Unit of Output Value
4. Discussion
4.1. Carbon Emissions and Carbon Source Contributions from the Planting Industry
4.2. Factors Affecting Carbon Emissions from the Planting Industry
5. Conclusions
Author Contributions
Funding
Institutional Review Board Statement
Informed Consent Statement
Data Availability Statement
Acknowledgments
Conflicts of Interest
References
- Ministry of Ecology and Environment of the People’s Republic of China. Third Biennial Update Report on Climate Change in the People’s Republic of China. December 2023. Available online: https://www.mee.gov.cn/ywdt/hjywnews/202312/W020231229717236049262.pdf (accessed on 1 July 2025).
- Anthony, T.L.; Silver, W.L. Hot moments drive extreme nitrous oxide and methane emissions from agricultural peatlands. Glob. Change Biol. 2021, 27, 5141–5153. [Google Scholar] [CrossRef] [PubMed]
- Tang, X.; Woodcock, C.E.; Olofsson, P.; Hutyra, L.R. Spatiotemporal assessment of land use/land cover change and associated carbon emissions and uptake in the Mekong River Basin. Remote Sens. Environ. 2021, 256, 112336. [Google Scholar] [CrossRef]
- Yadav, D.; Wang, J.Y. Modelling carbon dioxide emissions from agricultural soils in Canada. Environ. Pollut. 2017, 230, 1040–1049. [Google Scholar] [CrossRef]
- Haider, A.; Bashir, A.; Ul Husnain, M.I. Impact of agricultural land use and economic growth on nitrous oxide emissions: Evidence from developed and developing countries. Sci. Total Environ. 2020, 741, 140421. [Google Scholar] [CrossRef]
- Khan, R.; Abbas, A.; Farooque, A.A.; Abbas, F.; Wang, X. Mitigation of greenhouse gas emissions from agricultural fields through bioresource management. Sustainability 2022, 14, 5666. [Google Scholar] [CrossRef]
- Rodrigues, L.; Hardy, B.; Huyghebeart, B.; Fohrafellner, J.; Fornara, D.; Barančíková, G.; Bárcena, T.G.; De Boever, M.; Di Bene, C.; Feizienė, D.; et al. Achievable agricultural soil carbon sequestration across Europe from country-specific estimates. Glob. Change Biol. 2021, 27, 6363–6380. [Google Scholar] [CrossRef] [PubMed]
- Dumortier, J.; Elobeid, A. Effects of a carbon tax in the United States on agricultural markets and carbon emissions from land-use change. Land Use Policy 2021, 103. [Google Scholar] [CrossRef]
- Grosjean, G.; Fuss, S.; Koch, N.; Bodirsky, B.L.; De Cara, S.; Acworth, W. Options to overcome the barriers to pricing European agricultural emissions. Clim. Policy 2018, 18, 151–169. [Google Scholar] [CrossRef]
- Niles, M.T.; Waterhouse, H.; Parkhurst, R.; McLellan, E.L.; Kroopf, S. Policy options to streamline the carbon market for agricultural nitrous oxide emissions. Clim. Policy 2019, 19, 893–907. [Google Scholar] [CrossRef]
- Zhou, Y.F.; Li, B.; Zhang, R.Q. Spatiotemporal evolution and influencing factors of agricultural carbon emissions in Hebei Province at the county scale. Chin. J. Eco-Agric. 2022, 30, 570–581. [Google Scholar] [CrossRef]
- Li, C.; Jia, J.W.; Wu, F.; Zuo, L.; Cui, X. New spatiotemporal characteristics of greenhouse gas emissions from China′s crop farming under the construction of ecological civilization. Acta Ecol. Sin. 2024, 44, 9199–9208. [Google Scholar] [CrossRef]
- Zhao, X.Y.; Zhang, T.T.; Xie, X.M.; Peng, Y.; Zhao, Q. Analysis of the driving factors of carbon emissions and decoupling in the Yangtze River Delta Region. Res. Environ. Sci. 2025, 38, 767–776. [Google Scholar] [CrossRef]
- Liu, J.H.; Yan, J.; Wang, H.Y.; Shi, T. The influence of agricultural technological innovation on agricultural carbon emission intensity in the Yellow River Basin. Ecol. Econ. 2024, 40, 118–127. [Google Scholar]
- Su, M.; Xia, L.L. Analysis of the influencing mechanism of space-time heterogeneity of greenhouse gas emissions from agriculture in China. Environ. Sci. 2024, 45, 6775–6782. [Google Scholar] [CrossRef]
- Wang, L.L.; Xu, Y.X.; Chai, Z.Z.; Xu, X.; Lv, J. Study on the impact of agricultural mechanization development on agricultural carbon emission intensity—based on a panel data test for 30 provinces from 2004–2021. Chin. J. Agric. Resour. Reg. Plan. 2024, in press. Available online: http://kns.cnki.net/kcms/detail/11.3513.S.20241127.1853.002.html (accessed on 1 July 2025).
- Huang, T.Y.; Xie, L.Y.; Deng, T.L.; Zu, T.; Zhao, H.; Guo, L.; Wang, X. Analysis on agricultural carbon emissions efficiency and driving factors in Liaoning Province based on LMDI model. Chin. J. Eco-Agric. 2025, 33, 424–434. [Google Scholar] [CrossRef]
- Li, C.L.; Zhou, H. Relationship between agricultural technology progress and carbon emission intensity: An empirical analysis under different influence paths. J. China Agric. Univ. 2020, 25, 162–171. [Google Scholar] [CrossRef]
- Xu, Y.; Xu, Z.H. Agricultural carbon emission efficiency and influencing factors in Hebei Province. Chin. J. Eco-Agric. 2024, 32, 1981–1993. [Google Scholar] [CrossRef]
- Chu, X.L.; Zheng, L.X.; Ye, G.S.; Chen, J. Comparison of greenhouse gas emissions of open-field and facility-grown tomato production systems in China. J. Agro-Environ. Sci. 2023, 42, 1870–1881. [Google Scholar] [CrossRef]
- Zhang, Q. Spatio-Temporal Evolution and Influencing Factors of Carbon Emission Efficiency of Soybean Production in China. Master's Thesis, Shandong Normal University, Jinan, China, 2023. [Google Scholar]
- National Bureau of Statistics. China Statistical Yearbook; China Statistics Press: Beijing, China, 2024. Available online: https://www.stats.gov.cn/sj/ndsj/2024/indexch.htm (accessed on 1 July 2025).
- Zhuang, Z.; Mu, H.-Y.; Fu, P.-N.; Wan, Y.-N.; Yu, Y.; Wang, Q.; Li, H.-F. Accumulation of potentially toxic elements in agricultural soil and scenario analysis of cadmium inputs by fertilization: A case study in Quzhou county. J. Environ. Manag. 2020, 269, 110797. [Google Scholar] [CrossRef]
- Bu, Y.Q.; Kong, Y.; Zhi, Y.; Wang, J.; Shan, Z. Pollution of chemical pesticides on environment and suggestion for prevention and control countermeasures. J. Agric. Sci. Technol. 2014, 19–25. [Google Scholar] [CrossRef]
- Ren, S.X.; Li, E.L.; Deng, Q.Q.; Cui, Z. Characteristics of chemical fertilizer application and environmental risk assessment of three major food crops in China. Resour. Environ. Yangtze Basin 2019, 28, 2936–2947. [Google Scholar] [CrossRef]
- Cheng, S. Sources and Characteristics of Phosphorus Loss in Non-Point Source Pollution from Tangxun Lake Watershed. Master's Thesis, Huazhong Agricultural University, Wuhan, China, 2020. [Google Scholar]
- Sjerps, R.M.A.; Kooij, P.J.F.; van Loon, A.; Van Wezel, A.P. Occurrence of pesticides in Dutch drinking water sources. Chemosphere 2019, 235, 510–518. [Google Scholar] [CrossRef] [PubMed]
- Peng, C.H.; Huang, Z.W.; Huang, C.Y.; Zhang, J.J.; Tong, L.; Xiao, H. Pollution characteristics and spatial-temporal variation of organochlorine pollutants (OCs) in eastern areas of Ningbo City, China. J. Agro-Environ. Sci. 2019, 38, 787–797. [Google Scholar] [CrossRef]
- Linhart, C.; Panzacchi, S.; Belpoggi, F.; Clausing, P.; Zaller, J.G.; Hertoge, K. Year-round pesticide contamination of public sites near intensively managed agricultural areas in South Tyrol. Environ. Sci. Eur. 2021, 33, 1. [Google Scholar] [CrossRef]
- Zhang, B.; Hu, X.; Yang, Y.; Deng, X.; Li, B.; Gong, X.; Xiang, X.; Cai, X.; Liu, T. Comprehensive evaluation of groundwater quality in population-dense and extensive agricultural regions and study on its relationship with agricultural production and human activities. Environ. Geochem. Health 2025, 47, 62. [Google Scholar] [CrossRef]
- National Development and Reform Commission. Guidelines for Provincial Greenhouse Gas Inventory Compilation (Trial). 12 November 2024. Available online: http://www.cbcsd.org.cn/sjk/nengyuan/standard/home/20140113/download/shengjiwenshiqiti.pdf (accessed on 1 July 2025).
- Hu, Y.H.; Zhang, K.Y.; Hu, N.Y.; Wu, L. Review on measurement of agricultural carbon emission in China. Chin. J. Eco-Agric. 2023, 31, 163–176. [Google Scholar] [CrossRef]
- Song, Y.H.; Yang, J.B.; Fan, P.; Yang, Q.; Wang, L. Synergistic improvement method of cultivated land quality and farmland carbon sequestration capacity. Jiangsu Agric. Sci. 2024, 52, 241–249. [Google Scholar] [CrossRef]
- Li, S.T.; Liu, X.Y.; He, P. Analyses on nutrient requirements in current agriculture production in China. J. Plant Nutr. Fertil. 2017, 23, 1416–1432. [Google Scholar] [CrossRef]
- Susan, S. Climate Change 2007: The Physical Science Basis; Cambridge University Press: Cambridge, UK, 2007; Available online: https://www.ipcc.ch/report/ar4/wg1/ (accessed on 1 July 2025).
- Fu, M.; Jiang, X.S.; He, Z.P.; Liu, Y.; Chen, T. N excretion coefficient based on the whole process of pig production and manure N excretion in China. Chin. J. Eco-Agric. 2020, 28, 1799–1810. [Google Scholar] [CrossRef]
- Cai, Z.C. Guidelines for Nitrogen Flow Analysis in China; Science Press: Beijing, China, 2018. [Google Scholar]
- Han, Z. Spatial and Temporal Analysis and Forecasting of Agricultural Net Carbon Sink Accounting—A Case Study in Zhejiang Province; Hangzhou Dianzi University: Hangzhou, China, 2024. [Google Scholar] [CrossRef]
- Beijing Agricultural and Rural Publicity Center. Beijing: The Significant Rate of Comprehensive Utilization of Straw is over 99%. 12 August 2024. Available online: http://www.kepu.gov.cn/jcsn/2024-04/18/content_190123.html (accessed on 1 July 2025).
- IPCC. 2019 Refinement to the 2006 IPCC Guide Lines for National Greenhouse Gas Inventory. 2019. Available online: https://www.ipcc.ch/report/2019-refinement-to-the-2006-ipcc-guidelines-for-national-greenhouse-gas-inventories/ (accessed on 1 July 2025).
- Yang, L.; Le, K.D.; Zhang, L.J. Carbon footprint of major crop production in Xinjiang, China under the goal of ‘double carbon’. Chin. J. Appl. Ecol. 2025, 36, 1147–1158. [Google Scholar] [CrossRef]
- Li, B.; Du, J.G.; Liu, X.Q. Spatial-Temporal Characteristics and Economic Relevance of Agricultural Carbon Emissions in Hubei Province. Sci. Agric. Sin. 2019, 52, 4309–4319. [Google Scholar] [CrossRef]
- Qian, F.K.; Wang, X.G.; Gu, H.L.; Wang, D.; Li, P. Spatial temporal differentiation characteristics and key driving factors of agricultural carbon emissions in the three northeastern provinces of China. Chin. J. Eco-Agric. 2024, 32, 30–40. [Google Scholar] [CrossRef]
- Jia, L.H.; Wang, M.S.; Wang, M.Y.; Cui, P.; Yang, S.; Zhang, F.; Wang, Y.; Li, P.; Ma, W.; Sui, S.; et al. Analyses of carbon emissions from agricultural inputs and outputs in China in a low carbon context. Environ. Sci. Technol. 2024, 47, 43–54. [Google Scholar] [CrossRef]


| Agricultural Inputs | Application Amount (tons) | Planting Area (Thousand Hectares) | Application Amount per Unit Area (kg/hm2) | National Average (kg/hm2) |
|---|---|---|---|---|
| Chemical fertilizers | 67,000 | 159.0 | 421.38 | 292.60 |
| Pesticides | 2100 | 159.0 | 13.21 | 6.73 |
| Agricultural films | 7000 | 159.0 | 44.03 | 14.08 |
| Agricultural Inputs | Carbon Emissions Coefficient | Unit (Calculated by C) | Data Sources |
|---|---|---|---|
| Production, transportation, and use of fertilizers | 0.8956 | kg/kg | ORNL (Oak Ridge National Laboratory, USA) |
| Production, transportation, and use of pesticides | 4.9341 | kg/kg | ORNL (Oak Ridge National Laboratory, USA) |
| Production, transportation, and use of agricultural film | 5.18 | kg/kg | IREEA (Institute of Agricultural Resources and Ecological Environment, Nanjing Agricultural University) |
| Agricultural machinery diesel | 0.5927 | kg/kg | IPCC (United Nations Intergovernmental Committee of Experts on Climate Change) |
| Irrigation | 266.48 | kg/hm2 | Song et al. [33] |
| Item | Ti | Ei (kg N Each) | Wi (%) | Data Source |
|---|---|---|---|---|
| Cattle | 365 | 60 (30~60) | 54 | Guidelines for Compiling Provincial Greenhouse Gas Inventories [31] |
| Horse | 365 | 40 | 36 | Guidelines for Compiling Provincial Greenhouse Gas Inventories [31] |
| Donkey | 365 | 40 | 36 | Guidelines for Compiling Provincial Greenhouse Gas Inventories [31] |
| Pig | 180 | 12 | 36 | Fu [36] |
| Sheep | 365 | 9 | 23 | Cai [37] |
| Poultry | 55 | 0.6 | 22 | Guidelines for Compiling Provincial Greenhouse Gas Inventories [31] |
| Item | WCi 1 | WNi (%) | WRi (%) 2 |
|---|---|---|---|
| Rice | 0.93 | 0.91 | 99 |
| Wheat | 1.34 | 0.65 | 99 |
| Corn | 1.73 | 0.75 | 99 |
| Soybean | 1.57 | 2.10 | 99 |
| Tubers | 1.00 | 2.50 | 99 |
| Peanut | 1.22 | 1.80 | 99 |
Disclaimer/Publisher’s Note: The statements, opinions and data contained in all publications are solely those of the individual author(s) and contributor(s) and not of MDPI and/or the editor(s). MDPI and/or the editor(s) disclaim responsibility for any injury to people or property resulting from any ideas, methods, instructions or products referred to in the content. |
© 2025 by the authors. Licensee MDPI, Basel, Switzerland. This article is an open access article distributed under the terms and conditions of the Creative Commons Attribution (CC BY) license (https://creativecommons.org/licenses/by/4.0/).
Share and Cite
Chuan, L.; Zhang, H.; Zhao, J.; Zhao, J.; Wang, A. The Evolutionary Traits of Carbon Emissions from the Planting Industry in Beijing, China. Appl. Sci. 2025, 15, 7535. https://doi.org/10.3390/app15137535
Chuan L, Zhang H, Zhao J, Zhao J, Wang A. The Evolutionary Traits of Carbon Emissions from the Planting Industry in Beijing, China. Applied Sciences. 2025; 15(13):7535. https://doi.org/10.3390/app15137535
Chicago/Turabian StyleChuan, Limin, Hui Zhang, Jiang Zhao, Jingjuan Zhao, and Ailing Wang. 2025. "The Evolutionary Traits of Carbon Emissions from the Planting Industry in Beijing, China" Applied Sciences 15, no. 13: 7535. https://doi.org/10.3390/app15137535
APA StyleChuan, L., Zhang, H., Zhao, J., Zhao, J., & Wang, A. (2025). The Evolutionary Traits of Carbon Emissions from the Planting Industry in Beijing, China. Applied Sciences, 15(13), 7535. https://doi.org/10.3390/app15137535