Article

Decoding Humor-Induced Amusement via Facial Expression Analysis: Toward Emotion-Aware Applications

by
Gabrielle Toupin
1,
Arthur Dehgan
1,
Marie Buffo
1,
Clément Feyt
2,
Golnoush Alamian
1,
Karim Jerbi
1,3,4,* and
Anne-Lise Saive
1,4,5,*
1
Cognitive and Computational Neuroscience Lab, Psychology Department, University of Montréal, Montreal, QC H3T 1J4, Canada
2
Independent Scientist, 38000 Grenoble, France
3
Mila, The Quebec AI Research Institute, Montreal, QC H2S 3H1, Canada
4
Unique Center, The Quebec Neuro-AI Research Center, Montreal, QC H3T 1P1, Canada
5
Institute Lyfe Research and Innovation Center, 69130 Écully, France
*
Authors to whom correspondence should be addressed.
Appl. Sci. 2025, 15(13), 7499; https://doi.org/10.3390/app15137499
Submission received: 23 April 2025 / Revised: 18 June 2025 / Accepted: 25 June 2025 / Published: 3 July 2025
(This article belongs to the Special Issue Emerging Research in Behavioral Neuroscience and in Rehabilitation)

Abstract

Humor is widely recognized for its positive effects on well-being, including stress reduction, mood enhancement, and cognitive benefits. Yet, the lack of reliable tools to objectively quantify amusement—particularly its temporal dynamics—has limited progress in this area. Existing measures often rely on self-report or coarse summary ratings, providing little insight into how amusement unfolds over time. To address this gap, we developed a Random Forest model to predict the intensity of amusement evoked by humorous video clips, based on participants’ facial expressions—particularly the co-activation of Facial Action Units 6 and 12 (“% Smile”)—and video features such as motion, saliency, and topic. Our results show that exposure to humorous content significantly increases “% Smile”, with amusement peaking toward the end of videos. Importantly, we observed emotional carry-over effects, suggesting that consecutive humorous stimuli can sustain or amplify positive emotional responses. Even when trained solely on humorous content, the model reliably predicted amusement intensity, underscoring the robustness of our approach. Overall, this study provides a novel, objective method to track amusement on a fine temporal scale, advancing the measurement of nonverbal emotional expression. These findings may inform the design of emotion-aware applications and humor-based therapeutic interventions to promote well-being and emotional health.

1. Introduction

Although defining the pleasures of life is a very subjective question, most humans would agree that a good laugh and the associated positive affect are hard to beat. This probably partly explains why millions of individuals intensely scroll through funny short videos on social media on a daily basis. Crucially, a good sense of humor, smiling, and mirthful laughter are thought to contribute to health and overall well-being [1,2]. Repeated exposures to positive humor allows individuals to better cope with stressful events [3,4,5], and have long-term beneficial effects on depression, anxiety, and memory [6,7,8,9,10]. Despite the acknowledged benefits of humor and laughter for health, the difficulty in inducing and measuring humorous amusement in experimental contexts is an important issue for researchers and clinicians.
The main challenges arise from the highly variable and subjective nature of humor perception [11], as well as the limited choice of stimuli that may have low personal relevance for participants [12,13,14,15]. Although comedies are consistently—and expectedly—rated as funnier than horror or romance movies [16,17], personality traits and environment significantly impact humor appreciation [18,19,20,21,22]. Furthermore, the comprehension-elaboration theory of humor [23] posits that inducing humor consists of two stages: comprehension and elaboration. Comprehension entails the identification and resolution of incongruity, while elaboration involves the experience of amusement. These two stages introduce inherent fluctuations in the intensity of amusement, further complicating its assessment.
To address these challenges, we aimed to develop an objective measure of amusement intensity induced by humorous video clips based on nonverbal emotional expressions and video features. Specifically, the Facial Action Coding System (FACS) has been commonly used to infer positive emotions from nonverbal behavior [24,25]. The FACS involves transforming facial expressions into Action Units (AU), usually corresponding to a specific facial muscle, and separately rating them on a quantitative scale. The FACS has been proved useful to assess the latent physical traits of moods [26,27] and distinguish between genuine Duchenne smiles, which involve movement of the orbicularis oculi muscle around the eye (AU6) and zygomatic major muscle at the corners of the mouth (AU12), and non-genuine smiles only involving AU12 [28,29,30,31]. However, there is a controversy surrounding Duchenne smiles that could be feigned and wrongly detected when simply looking for eye constriction (AU6) [32,33,34]. This research suggests that more fine-grained methods may be necessary to accurately measure the dynamic and complex nature of humor perception.
Some recent research has turned to machine learning to automate the identification of basic emotions [35] using facial expressions [36,37,38], as well as multimodal bio-signals such as speech [39] and physiological activity [40,41]. Another approach to detect emotion relies on feature extraction from pictures and videos, including geometry [42,43], art-features such as colors or contrasts and semantic annotations [44,45,46]. Such features can accurately distinguish comedies from action, dramas, and horror films [47], and be used to partially modulate the funniness of a scene [48]. While these methods have shown promising results in classifying films and pictures into emotional groups, they rarely target humor and do not predict the intensity of the emotions experienced by the viewer. Further research is needed to develop fine-grained methods to accurately measure the dynamic and complex nature of humor perception and its induced amusement intensity.
The present study implements and validates a machine learning approach to predict the intensity of amusement evoked by humorous video content using both nonverbal emotional expressions and video features. We trained a supervised Random Forest (RF) classifier to predict self-rated humorous amusement using facial expressions and video clips features, track its temporal dynamics, and (3) explore its long-term carried effect on subsequent trials. This research aims to improve accurate measuring of amusement dynamics over time, which may pave the way toward a greater understanding of its role in improving health and cognition. We expected amusement to peak at the end of the video clip, when the punchline typically comes, and to have a carrying effect proportional to its intensity.

2. Material and Methods

2.1. Participants

Thirty-one participants (20 women, age: 22.06 ± 1.5 years [mean ± SD]), mostly university students, took part in this experiment. All participants were right-handed, in good health, and had normal or corrected-to-normal vision. This study was not preregistered, and data were recorded in 2020.

2.2. Compliance with Ethical Standards

All participants were in good health and provided written informed consent prior to their participation in this study. The study protocol was approved by the Ethics Committee of the Art and Science Faculty of the University of Montreal (CERAS-2017-18-100-D) and conducted in accordance with the ethical standards set forth in the Declaration of Helsinki. All research followed the relevant guidelines and regulations.

2.3. Videos

2.3.1. Stimuli Selection

For this experiment, we established three distinct categories for the videos: neutral, funny, and very funny. We made this decision based on the recognition that humor is a complex and subjective construct, and may prove challenging to quantify on a continuous scale. By discretizing the videos into these three categories, we aimed to more effectively capture the qualitative aspects of humor, and facilitate the identification of patterns and relationships between the features and the level of amusement elicited. All of the videos utilized in this experiment were selected based on two pilot studies which are elaborated upon below. They ranged in duration from 8 to 12 s, with an overall average length of 10 s. In instances where it was necessary, black frames and any accompanying musical background were removed from the videos to ensure consistency and accuracy in the analysis.
Humorous Stimuli. Humorous videos (available here) were pretested in an online pilot study in 2017 including 205 participants (141 women, age = 34.77 ± 14.22; range) and grouped into funny and very funny categories based on ratings. Participants viewed 94 humorous videos and rated each of them using sliders in terms of arousal (from “very relaxed/calm” to “very excited”), pleasantness (from “very unpleasant” to “very pleasant”) and funniness (from “not funny” to “very funny/hilarious”). We computed the mean and variance of arousal, pleasantness, and funniness ratings by video across participants. These ratings were then used as features into an unsupervised k-means classifier to split the videos into two categories: funny and very funny. The categories were generated based on the mean ratings of each video but also depend on the variance of the participants’ ratings. The weight of each video being proportional to the variance of ratings across participants. A video leading to greater agreement across participants, and thus to a lower variance, was assigned greater weight in the model. The first cluster consists of 51 videos with high arousal (m = 4.90 ± 0.44), high pleasantness (m = 6.13 ± 0.37) and high funniness (m = 5.41 ± 0.50). The second cluster contains 43 videos with low arousal (M = 4.43 ± 0.41), low pleasantness (M = 5.26 ± 0.44) and low funniness (M = 4.13 ± 0.45). The two clusters were significantly different in terms of arousal (t (92) = 5.363, p < 0.001), pleasantness (t (92) = 10.330, p < 0.001) and funniness (t (92) = 13.132, p < 0.001). To achieve a balanced experimental design, the very funny video with the lowest scores was dropped and seven 9gag videos with averaged ratings were added to the funny category.
Neutral Stimuli. In a second pilot experiment in 2020, 40 participants (28 women-age = 24 ± 5.32 years) rated 50 neutral videos to control for their arousal and pleasantness using non-graded scales. These videos mainly consisted of scenery, everyday activities (ex: walking, biking, meeting) and animals. All videos were rated with low arousal (mean = 4.09 ± 0.73) and neutral pleasantness (neither negative nor positive) (mean = 5.35 ± 0.74). These videos were included in the present study as the neutral group.

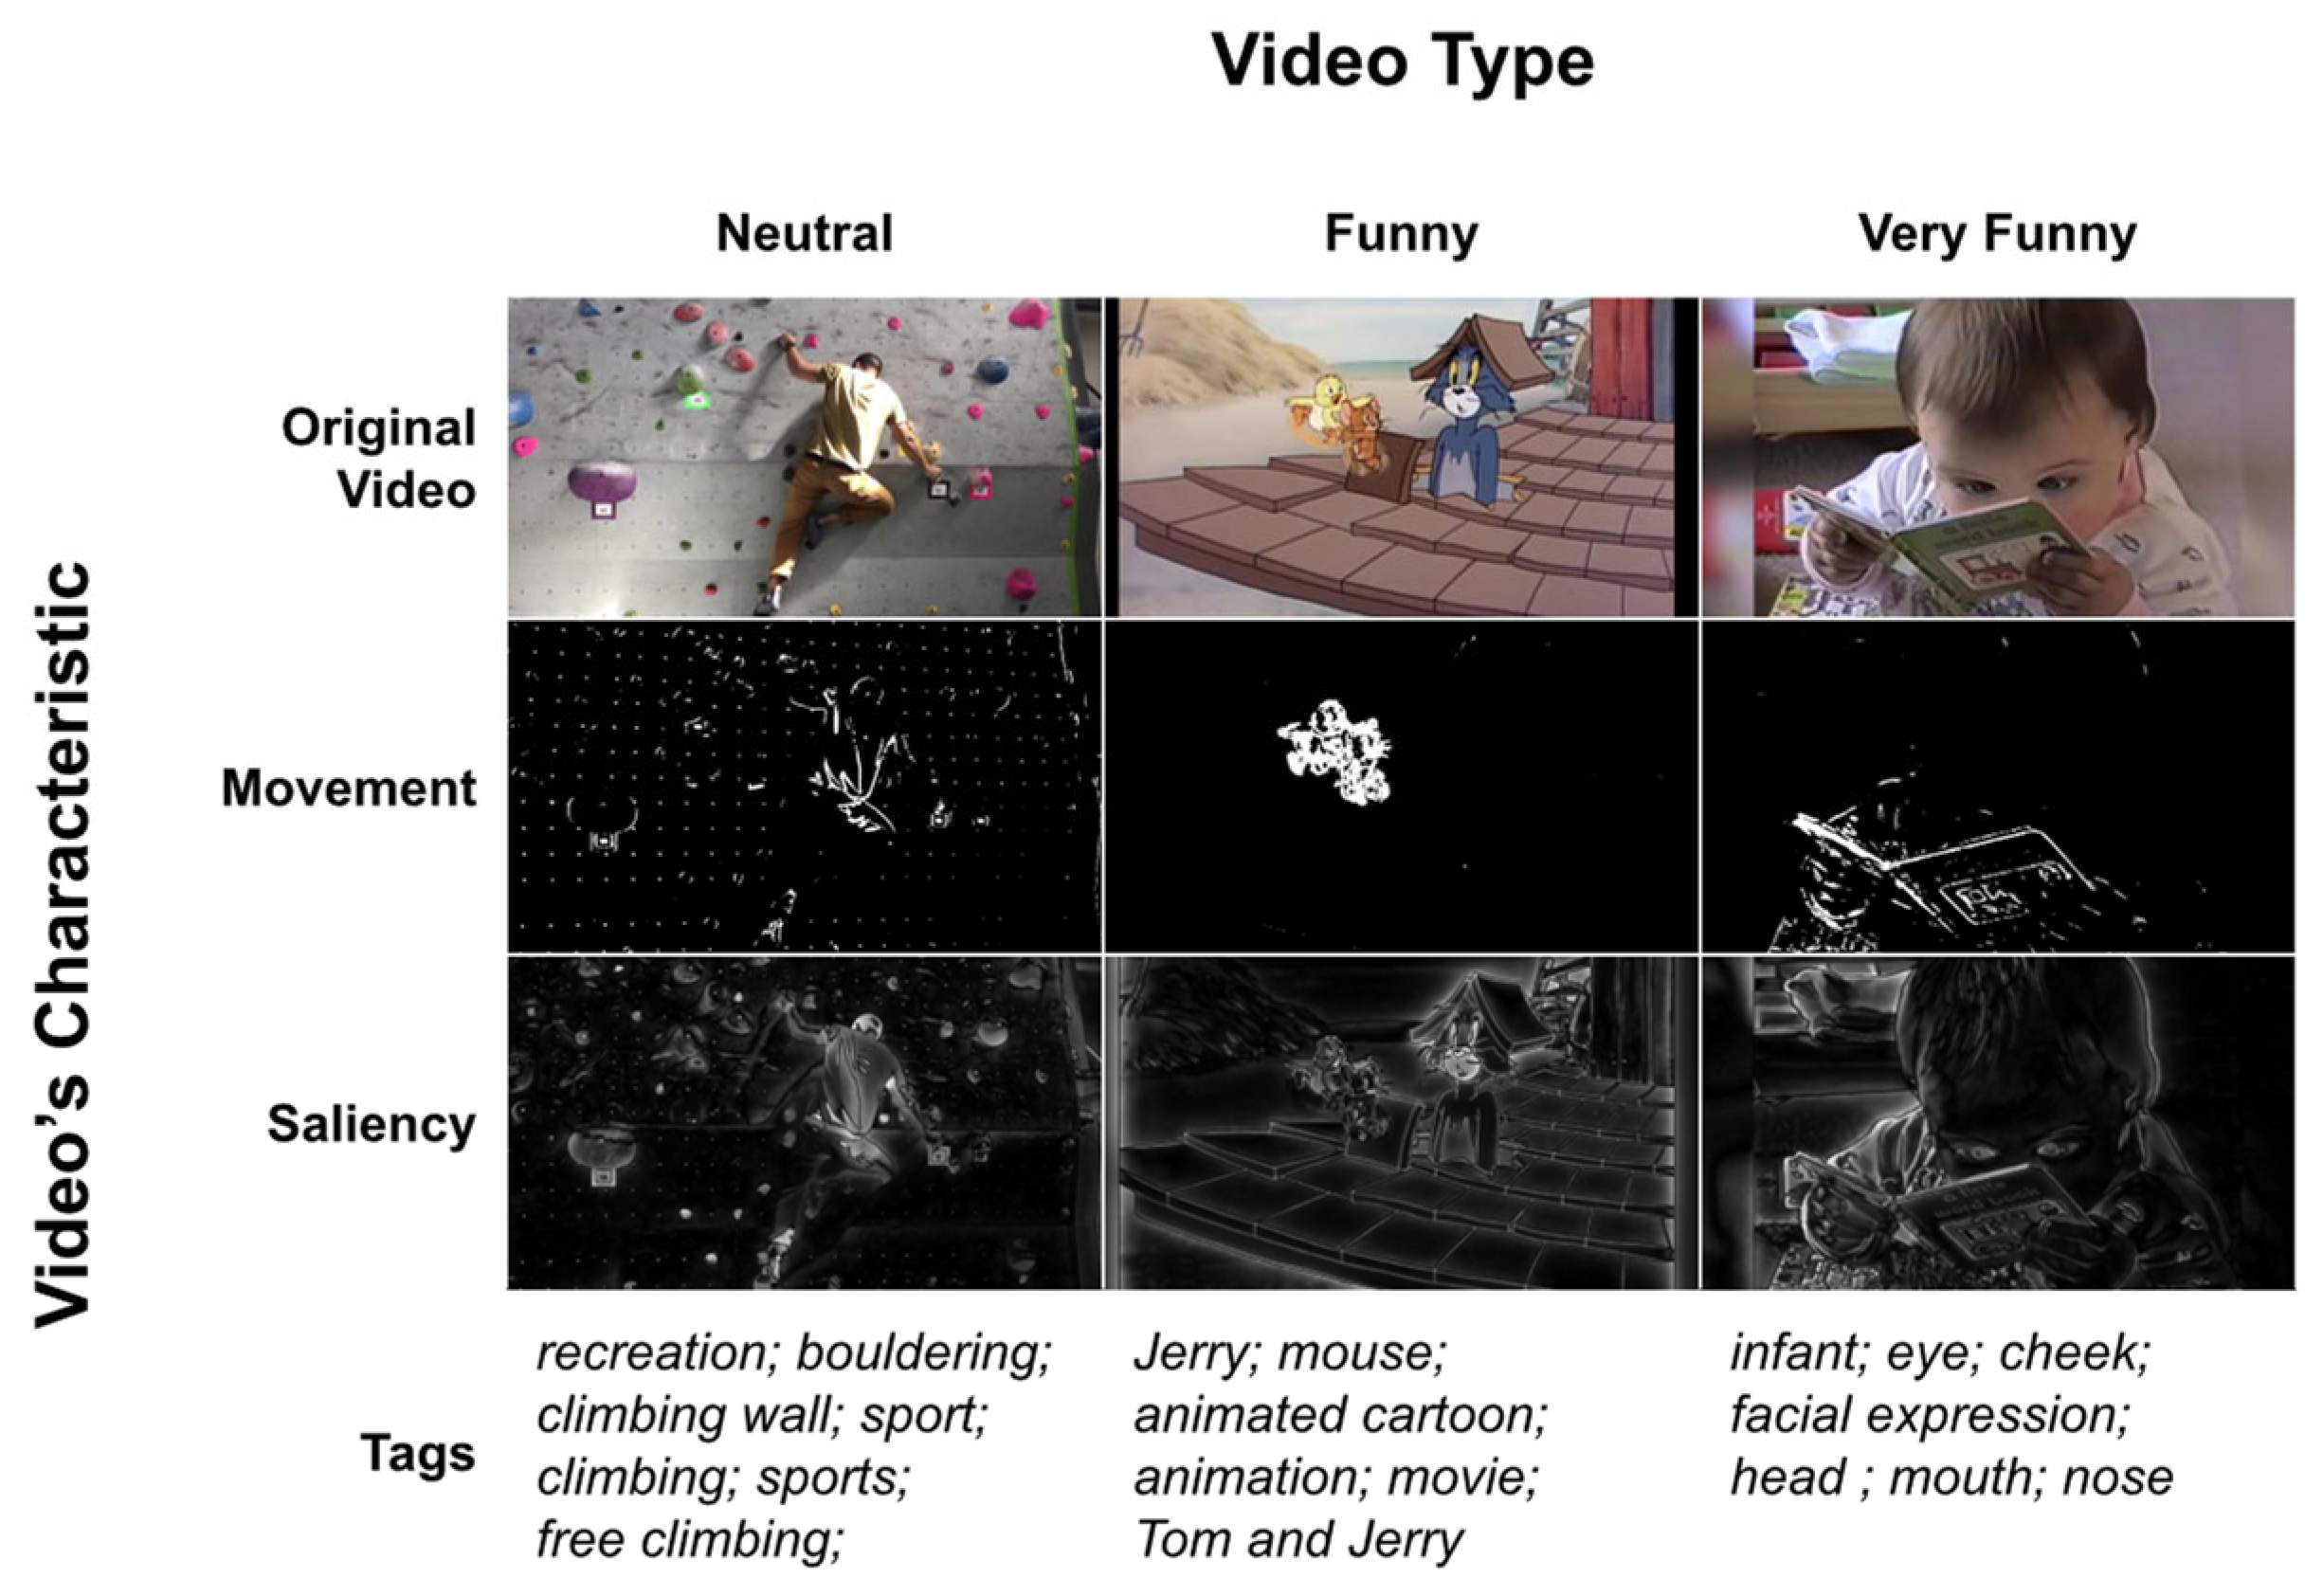
2.3.2. Video Features

To obtain a more comprehensive understanding of amusement, we investigated the influence of visual properties and semantic content on amusement intensity (Figure 1). We extracted visual properties frame-by-frame to capture the dynamic elements of the video and the visual cues that contribute the most to amusement. To accomplish this, we measured each frame’s movement because humor often involves unexpected or exaggerated movements such as falls or slips. Additionally, we measured frame saliency to highlight the most important parts of the video that are likely to capture the viewer’s attention. Furthermore, previous studies have linked these parameters to movie genres such as action, romance, and horror [47], and they can be utilized to some degree to modulate the level of funniness of a 2D scene [45,48]. Secondly, we were interested in analyzing the topics and themes present in the videos to gain insights into what types of videos are more likely to elicit amusement. We generated labels or tags automatically using a pre-trained algorithm (Video Intelligence) from Google (https://cloud.google.com/video-intelligence, e.g., accessed on 2 June 2020), and then measured the similarity of content between videos using the semantic distance score and the normalized Google distance score. These measures provide information on the relatedness between the content of the video and other related concepts or topics, which can be useful in identifying what types of videos are more likely to be funny.
Movement and saliency. We extracted the movement and saliency in each video on a frame by frame basis using OpenCV [50], an open-source Python library specialized in computer vision. Since most of our videos have a moving background and were taken mid-action, we opted for a technique where we compared each frame with its previous frame [49]. We transformed each colored frame of the video into a grayscale with values between 0 (white) and 100 (black). Then, we computed the absolute difference in gray values between successive frames (|t−1 – t|). For each pixel, a value greater than 50 was considered a moving pixel between frames t−1 and t, while a value less than 50 was considered a static object. We chose a threshold of 50 to compensate for the fact that humorous videos are usually taken on the fly in sub-optimal conditions with unstable shooting processes. The final result is a matrix of dimension [width × height × frame] where each data point is a binary value of motion (1) or static (0). The saliency of each frame was obtained based on the spectral residual of an image [51]. We obtained a Boolean array [width × height × frame] for each video, where 0 represented a non-salient pixel and 1 a salient pixel.
Keyword creation. We extracted tags for each video using an algorithm developed by Google. Video Intelligence (https://cloud.google.com/video-intelligence accessed on 20 May 2025) is a machine learning algorithm trained to recognize a large number of objects, locations and actions in videos. The number of keywords automatically extracted for each video ranged from 0 to 15, with an average of 4.66 (STD = 3.27). The most popular keywords were “animal”, “pet”, “cat”, “dog”, and “sport”, with over 16 appearances each. The resulting tags were then homogenized to avoid duplicates. We transformed all the tags into singular common nouns.
Semantic Distance. The semantic distance between two words was calculated using WordNet, an extensive lexical database of English words and the NLTK library [52]. We used the similarity technique of Wu and Palmer [53] to calculate the relatedness of a pair of keywords. This technique finds the closest semantic concept between two words (e.g., pet for cat and dog) and calculates the number of words that separate them through this common concept. Wu and Palmer’s technique [53] also considers the semantic concept’s specificity by calculating its depth in the hypernym tree. Thus, for the same distance between two words, generic words like animal and object were considered more distant than more specific words like “cat” and “dog”. In this study, we computed the mean and variance of all keyword pairs for each video.
Normalized Google Distance. The normalized Google distance (NGD) is a unit of relative semantic distance based on the number of results obtained in a keyword search on Google [54]. The idea is to compare the number of pages where words “a” and “b” appear separately and together. Thus, if two terms never appear together, the NGD between them will be infinite. Conversely, if the two terms always appear together, their NGD score will be zero. We used Google’s API to obtain the frequency of each word individually and per word pair for all tags in each video. Since the Google API limits the number of searches, we took the ten keywords with the highest confidence level per video. Similarly, keywords common to multiple videos, such as “cat,” were searched only once. We calculated the NGD score between each pair of keywords and then averaged these scores per video for each video.

2.4. Behavioral Task and Data

2.4.1. The Experimental Design

The experiment took place at the University of Montreal. After reading and signing the consent form, participants were seated comfortably in a quiet experimental room with a screen, mouse, and keyboard. At the beginning of the experiment, participants completed a demographic questionnaire and the short version of the Sense of Humor Questionnaire (SHQ-6, [55]). The SHQ-6 assesses participants’ habitual relationship to humor using three dimensions: the ability to appreciate humor in everyday situations (cognitive dimension), appreciation of humor in relationships with others (social dimension), and the tendency to express emotions related to humor (affective dimension). Before starting the experiment and at the end of the experiment, participants rated their mood by via 20 emotions (10 positives and 10 negatives) on a Likert scale ranging from 1 (very little/not at all) to 5 (extremely) (Positive and Negative Affect Schedule; [56]).
The experimental task was created using PsychoPy 3 [57] and consisted of 3 blocks of 50 trials. The order of the videos was pseudo-randomized such that there were never more than three videos of the same type in a row. Each trial consisted of a fixation cross (2–3 s), followed by a video (8–12 s), another fixation cross (3 s), and then the evaluation of the videos (free paced) (Figure 2). Participants were asked to rate each video in the following order: “What is your level of arousal, i.e., the state of excitement this video provoked in you?” (1 = very calm/relaxed and 100 = very excited/stimulated), “What is your level of pleasure, i.e., the pleasantness level evoked by the video?” (1 = very unpleasant and 100 = very pleasant), and “How funny was the video?” (1 = not funny, and 100 = very funny). Participants rated the videos using non-graded scales. Throughout the experiment, participants’ facial expressions were continuously tracked using a webcam (5.0 MP front-facing camera with 1080 p).

2.4.2. Behavioral Reactions: Detection of Facial Expression with iMotions

The participants’ facial expression recordings were analyzed with the FACET classifier included in the iMotions software [58,59]. FACET automatically detects facial expressions and reports a score representing the probability that seven different emotions are present per image. The more positive a value is, the more FACET believes? that the emotion in question is present in the image. A negative value indicates that the emotion is unlikely to be present, and a value of 0 indicates a null estimate: there is an equal chance that the emotion is present or absent. These estimates are based on the detection of observable facial actions in the form of 20 Action Units (AUs). In this study, we focused on smiling, i.e., a combination of cheeks raise (AU6) and lips corners pull (AU12). We used either independent values of these UAs or their combination accessible using “joy” estimate. To quantify smiling, we assigned a value of 1 when the FACET joy estimate was strictly positive (>0) and a value of 0 otherwise, following recommendations from [58,59]. These estimates are made for each video frame and then summarized for each period of interest as a percentage: 100% meant that the person had smiled the entire duration of the given time window, and 0% meant that the person had not smiled at all.

2.4.3. Individual Behavioral Ratings of Videos

We computed participants ratings for each video in terms of arousal, pleasantness, and funniness. Arousal reflected participants’ level of excitement or stimulation elicited by the video, while pleasantness provided information about their level of enjoyment. We also recorded reaction times of these judgements to obtain information about how quickly, and therefore how easily, participants were able to quantify and respond to the emotions elicited by the video depending on their category. Identifying which responses were associated with faster or slower judgments can help us better capture the mechanisms underlying the emotional responses elicited by the videos.

2.4.4. Final Video Categories Based on Individual Ratings

The primary goal of this study was to implement and validate a machine learning framework that can predict, in a time resolved manner and using objective metrics, the level of humorous amusement experienced by participants for each video. Therefore, it was essential to re-label the videos for each participant individually to ensure that the three video categories (very funny, funny, and neutral) were consistent with their individual ratings. First, we reordered each participant’s videos in increasing order of funniness and separated them into three levels of amusement: new-neutral [0–33rd], new-funny [34–66th] and new-very funny [67–100th]. We then ensured that despite inter-individual differences, the funniness ratings of these three groups of videos were still significantly different at the group level (ANOVA: F(3,50) = 4196, p < 0.001; Student-T’s > 11,565.35, p’s < 0.001). Very funny videos (65.88 ± 21.67) were rated as funnier than funny videos (29.23 ± 23.69), which were both funnier than neutral videos (5.36 ± 6.63). In a second step, we re-labeled the new-funny and new-very funny videos with more precision to create three levels of amusement using the same percentile approach: low amusement [0–33rd], medium amusement [34–66th] and high amusement [67–100th]. Similarly, we ensured that the funniness ratings of the three video groups were significantly different (F(3,33) = 1173, p < 0.001; T’s > 9124.91, p’s < 0.001) [low = 25.86 ± 21.57; medium = 50.36 ± 22.40; high = 71.26 ± 20.11).

2.5. Machine Learning Analyses

We used a machine learning approach to predict humorous amusement over time using behavioral and video features. We chose to discretize funniness feature into clear categories (neutral, funny, very funny or low/mid/high) to improve signal-to-noise ratio and reduce the impact of small fluctuations on the model. In addition, using categories also allowed us to investigate potential non-linear correlations of funniness, and ease the interpretability of the results including the importance and contributions of the selected features to funniness. The present section describes the supervised Random Forest (RF) we chose and the machine learning pipeline we used throughout this study. We ran different classifications and compared decoding accuracies for different time intervals to characterize the dynamic variations in amusement.

2.5.1. Random Forest Classifier

Random forest is a machine learning method where the results of a collection of decision trees are aggregated into one single result [60]. One crucial advantage of RF is that it limits overfitting without substantially increasing error due to bias. Interestingly, because it consists of a combination of decision trees that each use random subsets of features, RF also provides access to feature importance. As its name indicates, feature importance provides a quantification of the contribution of each feature to the success of the classifier, and helps results interpretation. If a feature (e.g., video movement) exhibits a high contribution to the outcome of the RF model, we can reliably assume that it strongly relates to the level of amusement [61,62].

2.5.2. The Machine Learning Pipeline

The training method of the model is described below, and an overview of the pipeline can be found in Figure 3. We randomly split participants’ 150 video ratings into a training set (90% of the participants) and a test set (10% of the participants). This 90–10 split was repeated ten times.
For the training–validation phase, we applied the Scikit-learn random search technique (i.e., RandomizedSearchCV) to find the best hyperparameters that fits these data subset using the training set. We randomly tried 100 different combinations of hyperparameters. We used the leave-one-subject-out approach for each set of hyperparameters in the random search, where one subject corresponds to 150 videos ratings (i.e., validation set). In other words, we trained a model with the random hyperparameters on all the training participants minus one (i.e., training set) and tested it on the unseen participant’s data (i.e., validation set) to determine the model’s accuracy. We repeated this process so that each participant was left out once. The model’s performance was calculated using the decoding accuracy (DA) metric and computed as the mean correct classification across all cross-validation folds using Shuffle-Group-Out cross-validation iterator (GroupShuffleSplit). From the 100 models tested during the training–validation phase, we selected the model’s hyperparameters leading to the best DA to train a final model which used all the participants from the training set.
The statistical significance of the obtained DA was evaluated by computing statistical thresholds using permutation tests (n = 100, p < 0.01). We computed the classification 100 times on randomly permuted class labels (i.e., levels of amusement) to generate a null distribution of DAs. In all our decoding analyses, we used maximum statistics to correct for multiple comparisons across experimental conditions and time intervals with a statistical threshold of p < 0.05.

2.5.3. Application of the Pipeline

For each time interval (beginning, middle and end of the video) detailed in the following section, we trained ten models (10× this machine learning pipeline) with different participants for each training and testing set. Having ten optimized models for each time interval reduced the risk that features importance was biased by a single specific 90–10 train–test split.

2.6. Data Analyses

2.6.1. Behavioral Data and Facial Expressions

First, we sought out to compare the behavioral evaluation (i.e., ratings of arousal and pleasantness, and reaction times) and facial expressions (i.e., AU6 and AU12) between video categories (i.e., neutral, funny and very funny). We used ANOVAs and Tukey’s tests to compare each video category, and Spearman’s correlation tests to quantify how amusement ratings were correlated with the average presence of smiles over time. Correlation analyses were first carried out using all the video categories and, second with funny and very funny videos only to test whether these effects persisted without the extreme values associated with neutral videos.

2.6.2. Predicting Humorous Amusement

We used the machine learning pipeline described (specify the location) to determine the facial expressions and behavioral features that best predicted participants’ level of amusement. We investigated DA and features’ contributions over time by dividing the viewing of each video into three parts: the beginning (first third of the video), the middle (the second third of the video), and the end (last third) of the video. The five features used in this analysis were videos properties: salience, movement, semantic distance, and normalized Google distance, as well as the presence of smiles. Video properties were specific to each part of the video, while semantic distance and normalized Google distance were the same throughout the video. We used ANOVA and multiple comparisons to compare decoding accuracies and contributions scores between the three-time intervals.

2.6.3. Temporal Dynamics of Amusement

To investigate the temporal dynamics of amusement over time, we divided each trial into different segments, including two sections for pre-fixation, four sections for video viewing, two sections for post-video fixation, and one section for evaluations. Next, we trained a Random Forest algorithm to predict the level of amusement for each time-interval independently, utilizing participants’ facial expressions, and examined the temporal dynamics of amusement. In a subsequent step, we aimed to determine the duration of the amusement evoked by a video. We used the same Random Forest decoding approach described in Section 2.4.2, with the exception that the classifiers trained at a given trial (t) were tested for predicting the class of the previous trial (t−1). This method provided an estimation of the duration of facial expression changes associated with amusement.

2.6.4. Transparency and Openness

The data that support the findings of this study are available from the corresponding author upon reasonable request. The code for the PsychoPy experimental design, the video features extraction and the ML pipeline are freely available at https://github.com/annelisesaive/Decoding_amusement_ML (accessed on 17 June 2025). Humorous video material is openly available at https://youtube.com/playlist?list=PLcBTyKtg-JVDx9nAnzD8lnmIvXfH9avnL (accessed on 17 June 2025).

3. Results

3.1. Behavioral and Facial Correlates of Humorous Amusement

3.1.1. Behavioral Ratings

We first examined whether arousal (Figure 4A) and pleasantness (Figure 4B) ratings differed as a function of amusement (Figure 4A). A two one-way ANOVAs revealed that there was a significant difference in mean arousal (F(3,50) = 478 p < 0.001) and pleasantness (F(3,50) = 961.28, p < 0.001) between the three different levels of amusement (new-neutral, new-funny and new-very funny). Very funny videos were rated with a higher level of arousal than funny videos, which generated a higher level of arousal than neutral videos. Very funny videos were also rated more pleasant than funny videos, which were rated more pleasant than neutral videos. In addition, the perceived intensity of amusement was significantly correlated over time so that the funnier one video was, the funnier the next one was rated (R = 0.477, p < 0.001).
Next, we assessed whether participants’ response times (RT) to evaluate videos differed as a function of amusement. Three one-way ANOVAs revealed that there was a significant difference in mean RT for arousal (F(3,28) = 5.40, p < 0.001) (Figure 5A), pleasantness (F(3,28) = 9.60, p < 0.001) (Figure 5B) and funniness (F(3,28) = 15.02, p < 0.001) (Figure 5C) between the three levels of amusement. Very funny videos were rated faster than funny videos for all ratings (p’s < 0.03) and faster than neutral video for arousal (p = 0.007) and funniness (p = 0.001). Neutral videos were rated faster than funny video on the funniness scale (p = 0.004).

3.1.2. Facial Expressions

We focused our analysis on AU6 related to cheek raiser and AU12 associated with lip corner puller when investigating facial expressions. In iMotions, these two AUs are combined in a variable whose value represents the propensity of smiling over time (i.e., iMotions’s confidence in the smile detection). For more clarity, we called this variable “% Smile”. The intensity of amusement measured as the individual’s funniness rating at the end of the viewing was significantly correlated with the % Smile during video viewing (R = 0.522, p < 0.001) (Figure 6A). This relationship increased when focusing the analysis on the resting period following each video (R = 0.767, p < 0.001) (Figure 6B). Because we noticed that % Smile was quite different for neutral videos compared to funny and very funny videos, we also conducted the same analysis discarding neutral videos (Figure 6C,D). Similar patterns of correlations were obtained both when considering videos viewing (R = 0.324, p < 0.001), and post-video resting periods (R = 0.703, p < 0.001) (Figure 6D).

3.2. Predicting Humorous Amusement Intensity Using Video Characteristics and Smiling

To identify the key features related to humorous amusement, we compared videos’ properties (i.e., movement, saliency, semantic distance and normalized Google distance) and % Smile in neutral, funny and very funny videos. Note that the videos were different for each participant depending on their evaluation (neutral, funny or very funny). We classified video types using a Random Forest algorithm at three specific moments in time: the beginning, middle and end of the viewing time window. These classifications led to significant predictions of amusement intensity [low, medium, and high] (above permutations threshold p’s < 0.01 and probabilistic chance level of 33% for three classes) and displayed mean DA of 62.1% ± 5.0 for the beginning of the video, 62.4% ± 5.6 for the middle part and 64.1% ± 5.4% at the end (DA and SD values were computed across bootstraps). An ANOVA showed no significant difference between DAs across time (t (3,10) = 0.417, p = 0.662). Figure 7A and Table 1 show that the importance of % Smile varied with time to reach its utmost importance at the end of the video, corresponding to the punchline in funny videos. On the other hand, movement, saliency, and semantic distance were the most important contributors to classification at any point in time. However, their contribution did not vary over time, suggesting that these features are more related to the intrinsic properties of the neutral, funny, and very funny video groups and did not predict humorous amusement per se. This idea is supported by the confusion matrix (Figure 7B) in which we find that our models distinguished neutral videos with very high accuracy (accuracy = 83%) but made errors when predicting funny (accuracy = 37%) and very funny (accuracy = 70%) videos. These results suggest that the properties of neutral and humorous videos differed but were not sufficient to predict the intensity of amusement experienced by participants. These results also suggests that only the % Smile variable was relevant in this classification. Finally, we also performed the same classification (neutral, funny, very funny) using all available AUs, and were able to show that only AUs 6 and 12 (represented by the % Smile variable) contributed significantly and equally to the prediction of amusement over time.
In order to further characterize the importance of % Smile in humorous amusement, we replicated the same classification approach but now to predict three different levels of amusement (low, moderate and high) over time while the neutral videos were removed. These classifications led to significant predictions of amusement intensity (above permutations threshold p’s > 0.009 for the middle and end of the video), and displayed mean DA of 41.1% ± 2.8 for the beginning of the video, 44.0% ± 3.1 for the middle part and 45.2% ± 4.4 for the end. An ANOVA showed a significant difference between the three sections of the video (F (3,10) = 3.395, p < 0.001). Post hoc Tukey’s tests showed that middle (p = 0.05) and final (p = 0.05) DAs were higher than DA for the beginning of the video. In. this case, % Smile was the largest contributing feature (Figure 7C and Table 1) and varied with time to peak at the end of the video, as in the first classification (neutral, funny, very funny). As predicted, the importance of video property features was very low and constant over time. The confusion matrix (Figure 7D) shows that the algorithm was able to predict low (accuracy = 50%) and high (accuracy = 69%) levels of amusement, but struggled for moderate amusement (accuracy = 33%). These two classifications suggest that % Smile is the most relevant factor to significantly predict up to three different intensities of humorous amusement over time, with an increasing importance at the end of the video when the punchline occurs.

3.3. Temporal Evolution of Humorous Amusement Intensity

In order to better characterize how the intensity of the humorous amusement experienced by the participants evolved in time, we assessed the decoding of neutral, funny and very funny videos using the % Smile feature over successive trials, including resting and inter-trial periods. In brief, this analysis consists in testing the temporal window during which % Smile can significantly predict the intensity of the amusement perceived by the participants and thus to highlight the duration during which the amusement was maintained after the viewing of a video. Decoding accuracy obtained at each moment in time over two consecutive trials is shown in Figure 8. We used the highest permutation score across all time points (DA = 35.9%) as the threshold to consider a DA significant. The DA was at chance level during resting periods preceding the video (prefix-1: DA = 32.6%, prefix-2: DA = 32.6%), and became significant a few seconds after the start of the video (video 1/4: DA = 36.3%). The DA stayed significant until the middle of the next video in the successive trial (>20 s apart): it gradually increased during the viewing of the video (video 2/4: DA = 41.6%, video 3/4: DA = 43.9%, video 4/4: DA = 49.3%) until it reached its peak during the time period right after the video (end-fix-1: DA = 52.5%, end-fix-2: DA = 52.5%). The DA started to drop when the participant was rating the video (DA = 45.5%). The DA decreased slowly (prefix-1: DA = 45.2%, prefix-2: DA = 45.2%, video-1/4: DA = 41.2%, video-2/4: DA = 36.7%) until it reached the chance level in the middle (video 3/4: DA = 35.3%) of the second video and stayed under the chance level for the rest of the trial (video 4/4: DA = 31.5%, enfix-1: DA = 32.5%, endfix-2: DA = 32.5%, ratings: DA = 33.3%). These results confirmed that smiles are stronger predictors of amusement levels toward the end of the video, and this discriminative power persists over time even after the end of the video and beginning of the following one. This is coherent with our observation that the level of amusement for funny videos is generally stronger toward the end of the videos, and a lingering smile even after the end of the video reflects the persistence of the amusement. In addition, this lasting impact potentially explains the potentiating effect of amusement we demonstrated behaviorally: a video will be more easily evaluated as funny if the previous one was also funny (see Section 3.1.1).

4. Discussion

To the best of our knowledge, the present study provides the first data-driven attempt to characterize the temporal dynamics of humorous amusement during viewing of naturalistic video content. We demonstrated that facial expressions, behavioral data, and video properties can successfully predict the level of a participants’ amusement. Among all the examined features, the participants’ tendency to smile (measured by real-time facial expression monitoring) was the most significant contribute to a successful prediction. By running classifications over successive short time intervals, we observed that the decoding accuracy peaked toward the end of the video, which is consistent with the fact that participants smiled more toward the end of the video. Importantly, the temporal generalization approach established that the amusement triggered by viewing a video persists in time, as predicted by smiles lasting over 20 s (i.e., until the middle of the subsequent trial). While these observations confirm the link one would naturally expect between amusement and facial expression, they also illustrate the possibility of using a machine learning framework to track the gradual evolution of amusement over time. In addition, these results highlight methodological avenues for refining basic and clinical humor research protocols by identifying the best time window for measuring and tracking amusement and characterizing the duration of the potentiating effect of humor across trials.

4.1. Behavioral Correlates and Facial Expressions of Humorous Amusement

We first set out to establish the behavioral and facial expressions changes associated with humorous amusement. We found that the intensity of amusement as assessed by the participants was proportional to their evaluations of arousal and pleasantness across participants. High arousal and pleasantness are associated with positive emotions such as being amused, stimulated, and excited, which correspond to the emotional state of mirth expected from amusement [63,64,65]. We also found that participants were faster to rate the videos they considered to be either neutral or very funny, but slower to rate somewhat amusing videos, consistent with the fact that decisions were more difficult for intermediate, less clear-cut, cases of funniness. In addition, the perceived intensity of amusement was significantly correlated over time: the more intense the amusement, the longer it lasted. This last result is consistent with previous studies showing that humor-induced amusement has a lasting effect and could constitute a reliable tool for stimulating subsequent memory formation and boosting learning experiences (see [66] for a review).
Facial expression dynamics further supported these findings: when participants rated a video as funnier, they tended to smile more during and immediately after the video. However, when analyzed trial-by-trial across participants, the correlation between smiles and funniness was relatively weak, which can be explained by the high variance in expressiveness across individuals. Some participants never smiled, while others smiled on most trials (average proportion of smiles per participant: min = 1.0%; max = 90.1%; mean = 25.4% ± 22.9). Such variability may reflect individual differences in humor responsiveness and expressiveness—factors known to vary with traits like age and gender [67,68,69,70]. Additionally, transient emotional states (e.g., recent stress) may have modulated amusement expression during the session. Although we could not directly control for this, we aimed to mitigate its effect by (1) presenting a large number of videos per participant and (2) re-labeling video categories based on each participant’s individual funniness ratings. This approach reduces the influence of temporary mood fluctuations and preserves the focus on relative intra-individual variation. To further enhance robustness and ecological validity, all humorous videos were pretested in an online study (n = 205) and categorized via unsupervised clustering based on group-level arousal, pleasantness, and funniness scores, weighted by inter-rater agreement. In the main study, we then reclassified the videos at the individual level using a percentile-based method to ensure that the neutral, funny, and very funny categories were statistically distinct per participant. As such, the results reported here were not driven by the content of specific videos but by participants’ idiosyncratic ratings, allowing us to model amusement-related processes while accommodating substantial inter-individual differences.

4.2. Propensity to Smile Is the Best Predictor of Humorous Amusement

We found that viewing videos that were perceived as being amusing was associated with a higher propensity to smile (% Smile), a combination of raising cheek (AU6) and pulling corner (AU12). % Smile was the only feature able to significantly discriminate between three intensities of humorous amusement (whether the neutral videos were included in the classifications or not). In addition, % Smile contribution to predictions increased with time during video viewing, which supports our hypothesis that amusement mostly appears at the end of the video, when most punchlines occur. Thus, % Smile appears to be sufficient to precisely predict amusement intensity and to efficiently track its evolution with high temporal resolution. These results are in line with humor theories in which amusement is thought to happen at the end when the punchline of the joke occurs and the potential incongruities are resolved [23,71]. Notably, the model achieved consistent performance across a diverse set of humorous stimuli, including both animal behavior and absurd physical actions, suggesting that the decoding captures general amusement-related dynamics rather than responses tied to specific video content.
We also explored how videos’ content and characteristics could influence humorous amusement. We found that the movement and the saliency of video content, known to reflect movies’ genre (ex: action, romance, horror) [47], and videos’ semantic content, previously used to modulate to some extent the level of funniness of a 2D scene [48], were able to distinguish neutral vs. funny vs. very funny videos efficiently (DA up to 64%). However, the confusion matrix (Figure 7D) showed a model that uses video features to accurately differentiates between neutral and all humorous videos but not the intensity of amusement (funny vs. very funny). Finding significant differences between neutral and humorous videos’ characteristics is consistent with numerous studies decoding emotions based on pictures or videos geometry [42,43], art-features and semantic annotations [44,45,46]. The contribution of video features to DA scores remains constant over time, which is contrary to the dynamic nature of the amusement process that we seek to quantify in this study. Moreover, when only considering humorous videos, videos’ properties did not contribute to predictions, and DAs dropped to 41–45%, supporting the idea that they are mainly relevant to classify neutral and humorous videos only. In sum, visual and semantic properties of neutral and funny videos in our experiment were quite different and led to high DAs, but these features did not differ between humorous videos and therefore cannot explain the other DA results reported in this article.
When only considering humorous videos, % Smile mainly drove the prediction of amusement (contributions: beginning = 0.21, middle = 0.39, and end = 0.53). This classification required more precision and represented a greater challenge than the first one. In addition, while there might be a greater consensus on what defines a humorous versus a neutral video, the different humorous clips might be more specific to individual preferences. It would be interesting for future studies to boost these predictions by testing other algorithms and including physiological variables, such as heart rate or breathing, as well as psychological scores, such as reasoning types or affective traits.

4.3. Temporal Dynamics of Humor Appreciation

Compared to the funniness rating provided at the end of the video, analyzing the proportion of smiles allowed us to capture amusement at each time point during the experiment. Therefore, we were able to predict with significant accuracy how amusement (neutral, funny, and very funny videos) was experienced by participants across successive trials. The propensity to smile reflected amusement from the beginning of the video (after a few seconds) until the middle of the subsequent trial, indicating that each expression of amusement remained present for at least 20 s. At the end of this time, the amusement generated by the first video faded away and was replaced by the amusement felt by the second video. These results confirmed that smiles are stronger predictors of amusement levels toward the end of the video, and this discriminative power persists over time, even after the video ends and into the following trial. This is consistent with our observation that the level of amusement for funny videos is generally stronger toward the end, and that a lingering smile reflects the persistence of the emotional state. Furthermore, our behavioral data show that when a funny or very funny video follows another amusing one, it tends to be rated as even funnier than when preceded by a neutral video. This potentiation effect highlights how humor-related affect can spill over across trials, both enhancing subjective ratings and boosting facial expression-based decoding. Together, these findings reveal both within-trial dynamics and cross-trial emotional carry-over, underscoring the temporal richness of amusement responses for modeling and intervention.
It is worth noting that while we were able to use facial expressions to predict amusement intensity, each participant only provided a single holistic rating per video. This means that there is no “ground truth” or trusted label for the temporal dynamics analyses. However, the consistency of our results with previous studies, such as Barral et al.’s [72] identification of brain activity linked to humor during 5 s resting periods after humorous stimuli, and our own study’s confirmation of a time window for predicting humorous amusement intensity using electrophysiology recording (EEG) [73], provide support for the validity of our approach.
Strengths and Limitations. In this study, we used a large subset of pre-validated videos to ensure that every participant will experience different intensities of amusement. We implemented state-of-the-art techniques to predict humorous amusement intensity and tracked how it evolved during video viewing with a high temporal resolution. However, better decoding scores might have been achieved if additional physiological and psychological data were included in the ML pipeline. Furthermore, while using Google API Video Intelligence to generate keywords for our video is an easy-to-implement tool, having keywords identified by another independent group of participants could increase their relevance and lead to a better understanding of how semantics impact humor. Finally, the findings of this paper are constrained by the limited sample size and specific demographic characteristics of the participants. Given that humor is influenced by culture, interests, and community-specific experiences, generalizing the system’s performance to broader or cross-cultural samples may be limited. Our findings demonstrate model robustness within a relatively homogeneous sample of young adults, but extending this framework would require training models on diverse samples tailored to specific groups or cultural norms. Future work should explore domain adaptation techniques or transfer learning strategies to improve model performance across subgroups (e.g., older adults, culturally distinct communities). Additionally, unsupervised clustering of response patterns may help identify participant subgroups with similar humor appreciation profiles, offering a more nuanced understanding of inter-individual variability. To further validate and extend our findings, large-scale online studies involving several hundred participants should be conducted. Such studies would support more robust modeling of individual and cultural differences, improve generalizability, and facilitate the development of scalable emotion-aware systems. Finally, future applications should account for individual emotional context and integrate real-time mood tracking to enhance the relevance and effectiveness of humor-based interactions.
In sum, this study introduces a novel, proof-of-concept framework for quantifying and tracking the temporal dynamics of humorous amusement based on facial expressions during video viewing. By leveraging participants’ propensity to smile, we achieved significant and time-resolved decoding accuracies, demonstrating the feasibility of modeling amusement intensity over time. Beyond establishing technical viability, our results suggest methodological directions for both basic and clinical humor research, including the identification of optimal time windows for capturing emotional peaks and assessing the duration of humor’s potentiating effects. While our approach focused on within-subject prediction and exploratory modeling, future work should benchmark performance against existing emotion-recognition systems and explore cross-subject generalization. We hope these findings will encourage broader use of facial expression tracking in emotion research and contribute to the development of emotion-aware applications, such as mental health tools, adaptive e-learning systems, or personalized entertainment platforms.
Real-time facial analysis may also support the therapeutic use of humor by enhancing emotional engagement in virtual interventions for stress relief. In such contexts, ethical and technical considerations must be addressed. Crucially, our framework enables the extraction of facial AUs (e.g., cheek raising or lip corner pulling) without the need to record or store identifiable video data. As emotion-tracking systems evolve toward real-world use, it will be important to maintain transparency, ensure informed consent, offer users control over data sharing, and assess algorithmic fairness.

Author Contributions

G.T., G.A., K.J. and A.-L.S. contributed to the study conception and design. All authors were involved in material preparation, data collection and analysis. The first draft of this manuscript was written by G.T. and A.-L.S. and all authors commented on previous versions of this manuscript. All authors have read and agreed to the published version of the manuscript.

Funding

G.T. was supported by Prompt and BMU (Beam Me Up). A.-L.S. was supported by IVADO Excellence Scholarship–Postdoc and a postdoctoral fellowship from Fonds de Recherche du Québec-Nature et Technologies (FRQNT) and received funding from the Union of AI and Neuroscience in Quebec (UNIQUE). K.J. is supported by funding from the Canada Research Chairs program and a Discovery Grant (RGPIN-2015-04854) from the Natural Sciences and Engineering Research Council of Canada, a New Investigators Award from the FRQNT (2018-NC-206005) and an IVADO-Apogée fundamental research project grant. The funders had no role in study design, data collection and analysis, decision to publish, or preparation of this manuscript.

Institutional Review Board Statement

The study was conducted in accordance with the Declaration of Helsinki, and approved by the Ethics Committee of the Art and Science Faculty of the University of Montreal (CERAS-2017-18-100-D, 20 July 2017).

Informed Consent Statement

Informed consent was obtained from all subjects involved in the study.

Data Availability Statement

The data that support the findings of this study are available from the corresponding author upon reasonable request. The code for the PsychoPy experimental design, the video features extraction and the ML pipeline are freely available at https://github.com/annelisesaive/Decoding_amusement_ML (accessed on 17 June 2025). Humorous video material is openly available at https://youtube.com/playlist?list=PLcBTyKtg-JVDx9nAnzD8lnmIvXfH9avnL (accessed on 17 June 2025).

Conflicts of Interest

The authors have no relevant financial or non-financial interests to disclose. Neither the study nor the analysis was preregistered by the authors in an independent institutional registry prior to conducting the research.

References

  1. Abernathy, D.; Zettle, R.D. Inducing Amusement in the Laboratory and Its Moderation by Experiential Approach. Psychol. Rep. 2022, 125, 2213–2231. [Google Scholar] [CrossRef]
  2. Aillaud, M.; Piolat, A. Influence of gender on judgment of dark and nondark humor. Individ. Differ. Res. 2012, 10, 211–222. [Google Scholar]
  3. Aslam, A.; Hussian, B. Emotion recognition techniques with rule based and machine learning approaches. arXiv 2021, arXiv:2103.00658. [Google Scholar] [CrossRef]
  4. Averill, J.R. Autonomic Response Patterns During Sadness and Mirth. Psychophysiology 1969, 5, 399–414. [Google Scholar] [CrossRef]
  5. Bains, G.S.; Berk, L.S.; Daher, N.; Lohman, E.; Schwab, E.; Petrofsky, J.; Deshpande, P. The effect of humor on short-term memory in older adults: A new component for whole-person wellness. Adv. Mind-Body Med. 2014, 28, 16–24. [Google Scholar] [PubMed]
  6. Bains, G.S.; Berk, L.S.; Lohman, E.; Daher, N.; Petrofsky, J.; Schwab, E.; Deshpande, P. Humors Effect on Short-term Memory in Healthy and Diabetic Older Adults. Altern. Ther. Health Med. 2015, 21, 16–25. [Google Scholar] [PubMed]
  7. Barral, O.; Kosunen, I.; Jacucci, G. No Need to Laugh Out Loud: Predicting Humor Appraisal of Comic Strips Based on Physiological Signals in a Realistic Environment. ACM Trans. Comput.-Hum. Interact. 2017, 24, 1–29. [Google Scholar] [CrossRef]
  8. Baveye, Y.; Bettinelli, J.-N.; Dellandréa, E.; Chen, L.; Chamaret, C. A Large Video Database for Computational Models of Induced Emotion. In Proceedings of the 2013 Humaine Association Conference on Affective Computing and Intelligent Interaction, Geneva, Switzerland, 2–5 September 2013; pp. 13–18. [Google Scholar] [CrossRef]
  9. Bennett, M.P.; Zeller, J.M.; Rosenberg, L.; McCann, J. The Effect of Mirthful Laughter on Stress and Natural Killer Cell Activity; Western Kentucky University: Bowling Green, KY, USA, 2003. [Google Scholar]
  10. Bird, S.; Klein, E.; Loper, E. Natural Language Processing with Python: Analyzing Text with the Natural Language Toolkit; O’Reilly Media, Inc.: Sebastopol, CA, USA, 2009. [Google Scholar]
  11. Bischetti, L.; Canal, P.; Bambini, V. Funny but aversive: A large-scale survey of the emotional response to Covid-19 humor in the Italian population during the lockdown. Lingua 2021, 249, 102963. [Google Scholar] [CrossRef]
  12. Bradski, G. The openCV library. Dr. Dobb’s J. Softw. Tools Prof. Program. 2000, 25, 120–123. [Google Scholar]
  13. Breiman, L. Random Forests. Mach. Learn. 2001, 45, 5–32. [Google Scholar] [CrossRef]
  14. Cann, A.; Collette, C. Sense of Humor, Stable Affect, and Psychological Well-Being. Eur. J. Psychol. 2014, 10, 464–479. [Google Scholar] [CrossRef]
  15. Carretero-Dios, H.; Ruch, W. Humor Appreciation and Sensation Seeking: Invariance of Findings Across Culture and Assessment Instrument? De Gruyter Brill: Berlin, Germany, 2010. [Google Scholar]
  16. Chandrasekaran, A.; Vijayakumar, A.K.; Antol, S.; Bansal, M.; Batra, D.; Zitnick, C.L.; Parikh, D. We are humor beings: Understanding and predicting visual humor. In Proceedings of the IEEE Conference on Computer Vision and Pattern Recognition, Las Vegas, NV, USA, 27–30 June 2016; pp. 4603–4612. [Google Scholar]
  17. Cilibrasi, R.L.; Vitanyi, P.M. The google similarity distance. IEEE Trans. Knowl. Data Eng. 2007, 19, 370–383. [Google Scholar] [CrossRef]
  18. Clark, L.A.; Tellegen, A. Development and validation of brief measures of positive and negative affect: The PANAS scales. J. Personal. Soc. Psychol. 1988, 54, 1063–1070. [Google Scholar]
  19. Crawford, S.A.; Caltabiano, N.J. Promoting emotional well-being through the use of humour. J. Posit. Psychol. 2011, 6, 237–252. [Google Scholar] [CrossRef]
  20. Dente, P.; Küster, D.; Skora, L.; Krumhuber, E. Measures and metrics for automatic emotion classification via FACET. In Proceedings of the Conference on the Study of Artificial Intelligence and Simulation of Behaviour (AISB), Bath, UK, 18–21 April 2017; pp. 160–163. [Google Scholar]
  21. Domínguez-Jiménez, J.A.; Campo-Landines, K.C.; Martínez-Santos, J.C.; Delahoz, E.J.; Contreras-Ortiz, S.H. A machine learning model for emotion recognition from physiological signals. Biomed. Signal Process. Control 2020, 55, 101646. [Google Scholar] [CrossRef]
  22. Ekman, P. Are there basic emotions? Psychol. Rev. 1992, 99, 550–553. [Google Scholar] [CrossRef]
  23. Ekman, P.; Davidson, R.J.; Friesen, W.V. The Duchenne smile: Emotional expression and brain physiology: II. J. Personal. Soc. Psychol. 1990, 58, 342. [Google Scholar] [CrossRef]
  24. Ekman, P.; Friesen, W.V. Facial action coding system. Environ. Psychol. Nonverbal Behav. 1978. [Google Scholar] [CrossRef]
  25. Ekman, P.; Friesen, W.V. Felt, false, and miserable smiles. J. Nonverbal Behav. 1982, 6, 238–252. [Google Scholar] [CrossRef]
  26. Ekman, P.; Friesen, W.V. Unmasking the Face: A Guide to Recognizing Emotions from Facial Clues; ISHK: Los Altos, CA, USA, 2003. [Google Scholar]
  27. Ellard, K.K.; Farchione, T.J.; Barlow, D.H. Relative Effectiveness of Emotion Induction Procedures and the Role of Personal Relevance in a Clinical Sample: A Comparison of Film, Images, and Music. J. Psychopathol. Behav. Assess. 2012, 34, 232–243. [Google Scholar] [CrossRef]
  28. Frank, M.G.; Ekman, P. Not All Smiles Are Created Equal: The Differences Between Enjoyment and Nonenjoyment Smiles; De Gruyter Brill: Berlin, Germany, 1993. [Google Scholar]
  29. Frank, M.G.; Ekman, P.; Friesen, W.V. Behavioral markers and recognizability of the smile of enjoyment. J. Personal. Soc. Psychol. 1993, 64, 83. [Google Scholar] [CrossRef] [PubMed]
  30. Froehlich, E.; Madipakkam, A.R.; Craffonara, B.; Bolte, C.; Muth, A.-K.; Park, S.Q. A short humorous intervention protects against subsequent psychological stress and attenuates cortisol levels without affecting attention. Sci. Rep. 2021, 11, 1. [Google Scholar] [CrossRef]
  31. Gavanski, I. Differential sensitivity of humor ratings and mirth responses to cognitive and affective components of the humor response. J. Personal. Soc. Psychol. 1986, 51, 209–214. [Google Scholar] [CrossRef]
  32. Geslin, E.; Jégou, L.; Beaudoin, D. How color properties can be used to elicit emotions in video games. Int. J. Comput. Games Technol. 2016, 2016, 5182768. [Google Scholar] [CrossRef]
  33. Ghai, M.; Lal, S.; Duggal, S.; Manik, S. Emotion recognition on speech signals using machine learning. In Proceedings of the 2017 International Conference on Big Data Analytics and Computational Intelligence (ICBDAC), Chirala, India, 23–25 March 2017; pp. 34–39. [Google Scholar] [CrossRef]
  34. Ghimire, D.; Lee, J. Geometric feature-based facial expression recognition in image sequences using multi-class adaboost and support vector machines. Sensors 2013, 13, 7714–7734. [Google Scholar] [CrossRef]
  35. Girard, J.M.; Cohn, J.F.; Yin, L.; Morency, L.-P. Reconsidering the Duchenne Smile: Formalizing and Testing Hypotheses About Eye Constriction and Positive Emotion. Affect. Sci. 2021, 2, 32–47. [Google Scholar] [CrossRef] [PubMed]
  36. Gunnery, S.D.; Hall, J.A. The expression and perception of the Duchenne smile. In The Social Psychology of Nonverbal Communication; Palgrave Macmillan: London, UK; Springer Nature: Berlin, Germany, 2015; pp. 114–133. [Google Scholar] [CrossRef]
  37. Herzog, T.R.; Karafa, J.A. Preferences for Sick Versus Nonsick Humor; De Gruyter Brill: Berlin, Germany, 1998. [Google Scholar]
  38. Hofmann, J.; Platt, T.; Lau, C.; Torres-Marín, J. Gender differences in humor-related traits, humor appreciation, production, comprehension,(neural) responses, use, and correlates: A systematic review. Curr. Psychol. 2020, 42, 16451–16464. [Google Scholar] [CrossRef]
  39. Hou, X.; Zhang, L. Saliency detection: A spectral residual approach. In Proceedings of the 2007 IEEE Conference on Computer Vision and Pattern Recognition, Minneapolis, MN, USA, 17–22 June 2007; pp. 1–8. [Google Scholar]
  40. Jang, E.-H.; Park, B.-J.; Kim, S.-H.; Chung, M.-A.; Park, M.-S.; Sohn, J.-H. Emotion classification based on bio-signals emotion recognition using machine learning algorithms. In Proceedings of the 2014 International Conference on Information Science, Electronics and Electrical Engineering, Sapporo, Japan, 26–28 April 2014; Volume 3, pp. 1373–1376. [Google Scholar] [CrossRef]
  41. Jeganathan, J.; Campbell, M.; Hyett, M.; Parker, G.; Breakspear, M. Quantifying dynamic facial expressions under naturalistic conditions. Elife 2022, 11, e79581. [Google Scholar] [CrossRef]
  42. Krumhuber, E.G.; Manstead, A.S.R. Can Duchenne smiles be feigned? New evidence on felt and false smiles. Emotion 2009, 9, 807–820. [Google Scholar] [CrossRef]
  43. Kumar, P.; Happy, S.L.; Routray, A. A real-time robust facial expression recognition system using HOG features. In Proceedings of the 2016 International Conference on Computing, Analytics and Security Trends (CAST), Pune, India, 19–21 December 2016; pp. 289–293. [Google Scholar] [CrossRef]
  44. Lefcourt, H.M.; Martin, R.A. Humor and Life Stress: Antidote to Adversity; Springer Science & Business Media: Berlin/Heidelberg, Germany, 2012. [Google Scholar]
  45. Liu, X.; Li, N.; Xia, Y. Affective image classification by jointly using interpretable art features and semantic annotations. J. Vis. Commun. Image Represent. 2019, 58, 576–588. [Google Scholar] [CrossRef]
  46. Martin, R.A. The social psychology of humor. In The Psychology of Humor: An Integrative Approach; Routledge: Abingdon, UK, 2007; pp. 113–152. [Google Scholar]
  47. Martin, R.A.; Kuiper, N.A.; Olinger, L.J.; Dance, K.A. Humor, Coping with Stress, Self-Concept, and Psychological Well-Being; De Gruyter Brill: Berlin, Germany, 1993; Volume 6, pp. 89–104. [Google Scholar] [CrossRef]
  48. Moran, C.C. Short-term mood change, perceived funniness, and the effect of humor stimuli. Behav. Med. 1996, 22, 32–38. [Google Scholar] [CrossRef]
  49. Peirce, J.; Gray, J.R.; Simpson, S.; MacAskill, M.; Höchenberger, R.; Sogo, H.; Kastman, E.; Lindeløv, J.K. PsychoPy2: Experiments in behavior made easy. Behav. Res. Methods 2019, 51, 195–203. [Google Scholar] [CrossRef]
  50. Rasheed, Z.; Sheikh, Y.; Shah, M. On the use of computable features for film classification. IEEE Trans. Circuits Syst. Video Technol. 2005, 15, 52–64. [Google Scholar] [CrossRef]
  51. Ruch, W. Will the real relationship between facial expression and affective experience please stand up: The case of exhilaration. Cogn. Emot. 1995, 9, 33–58. [Google Scholar] [CrossRef]
  52. Ruch, W. State and Trait Cheerfulness and the Induction of Exhilaration. Eur. Psychol. 1997, 2, 328–341. [Google Scholar] [CrossRef]
  53. Ruch, W. The Perception of Humor; Word Scientific Publisher: Tokyo, Japan, 2001. [Google Scholar] [CrossRef]
  54. Ruch, W.; Heintz, S.; Platt, T.; Wagner, L.; Proyer, R.T. Broadening Humor: Comic Styles Differentially Tap into Temperament, Character, and Ability. Front. Psychol. 2018, 9, 6. [Google Scholar] [CrossRef]
  55. Saive, A.-L. Laughing to remember: Humor-related memory improvement. Rev. Psicol.-Terc. Época 2021, 20, 178–192. [Google Scholar] [CrossRef]
  56. Schaefer, A.; Nils, F.; Sanchez, X.; Philippot, P. Assessing the effectiveness of a large database of emotion-eliciting films: A new tool for emotion researchers. Cogn. Emot. 2010, 24, 1153–1172. [Google Scholar] [CrossRef]
  57. Singh, S.; Gupta, P. Comparative study ID3, cart and C4. 5 decision tree algorithm: A survey. Int. J. Adv. Inf. Sci. Technol. IJAIST 2014, 27, 97–103. [Google Scholar]
  58. Stöckli, S.; Schulte-Mecklenbeck, M.; Borer, S.; Samson, A.C. Facial expression analysis with AFFDEX and FACET: A validation study. Behav. Res. Methods 2018, 50, 1446–1460. [Google Scholar] [CrossRef]
  59. Strobl, C.; Boulesteix, A.-L.; Kneib, T.; Augustin, T.; Zeileis, A. Conditional variable importance for random forests. BMC Bioinform. 2008, 9, 307. [Google Scholar] [CrossRef]
  60. Svebak, S. The Development of the Sense of Humor Questionnaire: From SHQ to SHQ-6; De Gruyter Brill: Berlin, Germany, 1996. [Google Scholar]
  61. Svebak, S.; Martin, R.A.; Holmen, J. The Prevalence of Sense of Humor in a Large, Unselected County Population in Norway: Relations with Age, Sex, and Some Health Indicators; De Gruyter Brill: Berlin, Germany, 2004. [Google Scholar]
  62. Terry, R.L.; Ertel, S.L. Exploration of Individual Differences in Preferences for Humor. Psychol. Rep. 1974, 34 (Suppl. S3), 1031–1037. [Google Scholar] [CrossRef] [PubMed]
  63. Thomas, C.A.; Esses, V.M. Individual Differences in Reactions to Sexist Humor. Group Process. Intergroup Relat. 2004, 7, 89–100. [Google Scholar] [CrossRef]
  64. Tian, Y.-L.; Kanade, T.; Cohn, J.F. Recognizing Action Units for Facial Expression Analysis. IEEE Trans. Pattern Anal. Mach. Intell. 2001, 23, 97–115. [Google Scholar] [CrossRef]
  65. Toupin, G.; Benlamine, M.S.; Frasson, C. Prediction of Amusement Intensity Based on Brain Activity. In Novelties in Intelligent Digital Systems; IOS Press: Amsterdam, The Netherlands, 2021; pp. 229–238. [Google Scholar] [CrossRef]
  66. Vernon, P.A.; Martin, R.A.; Schermer, J.A.; Cherkas, L.F.; Spector, T.D. Genetic and Environmental Contributions to Humor Styles: A Replication Study. Twin Res. Hum. Genet. 2008, 11, 44–47. [Google Scholar] [CrossRef]
  67. Vieillard, S.; Pinabiaux, C. Spontaneous response to and expressive regulation of mirth elicited by humorous cartoons in younger and older adults. Aging Neuropsychol. Cogn. 2019, 26, 407–423. [Google Scholar] [CrossRef] [PubMed]
  68. Wang, B.; Dudek, P. A fast self-tuning background subtraction algorithm. In Proceedings of the IEEE Conference on Computer Vision and Pattern Recognition Workshops, Columbus, OH, USA, 23–28 June 2014; pp. 395–398. [Google Scholar]
  69. Westermann, R.; Spies, K.; Stahl, G.; Hesse, F.W. Relative effectiveness and validity of mood induction procedures: A meta-analysis. Eur. J. Soc. Psychol. 1996, 26, 557–580. [Google Scholar] [CrossRef]
  70. Wu, Z.; Palmer, M. Verb semantics and lexical selection. arXiv 1994, arXiv:cmp-lg/9406033. [Google Scholar]
  71. Wyer, R.S.; Collins, J.E. A theory of humor elicitation. Psychol. Rev. 1992, 99, 663. [Google Scholar] [CrossRef]
  72. Zhao, J.; Yin, H.; Wang, X.; Zhang, G.; Jia, Y.; Shang, B.; Zhao, J.; Wang, C.; Chen, L. Effect of humour intervention programme on depression, anxiety, subjective well-being, cognitive function and sleep quality in Chinese nursing home residents. J. Adv. Nurs. 2020, 76, 2709–2718. [Google Scholar] [CrossRef]
  73. Zhao, S.; Gao, Y.; Jiang, X.; Yao, H.; Chua, T.-S.; Sun, X. Exploring Principles-of-Art Features For Image Emotion Recognition. In Proceedings of the 22nd ACM International Conference on Multimedia, Orlando, FL, USA, 3–7 November 2014; pp. 47–56. [Google Scholar] [CrossRef]
Figure 1. Visual representation of the video’s characteristics with video examples. The first row “original video” displays an actual frame from the video. The second row “movement” displays the movement matrix of the original frame, where a black pixel (value of 0) shows no movement while a white pixel (value of 1) shows movement [49]. The third row “saliency” displays the matrix of spectral residual of the original frame, where a black pixel (value of 0) is not salient while a white pixel (value of 1) is salient [34]. The last row “tags” shows the list of tags extracted by Google’s Video Intelligence algorithm.
Applsci 15 07499 g001
Figure 2. Experimental design. Experimental design of the video viewing task. For each trial, participants were instructed to view videos and rate their arousal, pleasantness, and funniness after a delay of 3 s. An interval of 2–3 s was set between trials.
Applsci 15 07499 g002
Figure 3. Visual representation of our machine learning pipeline. Separation of our dataset into a training set and a testing set; one participant can either be in the training or the validation sets. Leave-one-group-out technique was used to tune the hyperparameters of the model. The best model was trained on all the training sets and tested on the testing set. Accuracy and feature contributions are based on the testing set. All the procedure described in this figure was repeated 10 times.
Applsci 15 07499 g003
Figure 4. Ratings of arousal and pleasantness based on the level of amusement. Groups of humorous amusement were based on individuals’ ratings of funniness. (A) The funnier the videos were, the more participants rated them as highly arousing (blue). (B) The funnier the videos were, the more participants rated them as highly pleasant (orange). Significative t-test are shown as: ***, p < 0.001.
Applsci 15 07499 g004
Figure 5. Reaction time to rate each video. Groups of humorous amusement were based on individuals’ ratings of funniness. (A) Mean reaction times per participant to rate arousal (blue), (B) mean reaction times per participant to rate pleasant (orange) and (C) mean reaction times per participant to rate funny (green). Significative t-test are shown as: *** for p < 0.001, ** for p < 0.01 and * for p < 0.05.
Applsci 15 07499 g005
Figure 6. Relation between humorous amusement and smiling. Correlation between the intensity of amusement and the proportion of smiling for all videos (A,B) and for funny videos only (C,D). Correlations were obtained using averaged smile proportion during video viewing (A,C) and during post-video resting periods (B,D).
Applsci 15 07499 g006
Figure 7. Evolution of feature importance for predicting amusement intensity (A) shows the evolution of feature importance when predicting amusement for all videos. Evolution in the video (beginning, middle, end) of the contribution of each feature to the model decoding accuracy. Features observed are smiles (blue), normalized Google distance (orange), semantic distance (green), movement (red) and saliency (purple). (B) Confusion matrix from the best model obtained while trying to predict amusement on all videos (accuracy = 73%). The best model was during the end part of the video. (C) shows the evolution of feature importance when predicting amusement for humorous videos only. (D) Confusion matrix from the best model obtained while trying to predict funniness on humorous video only (accuracy = 51%). The best model was during the end part of the video.
Applsci 15 07499 g007
Figure 8. Dynamic of amusement intensity over consecutive trials. Dynamics of decoding accuracy to predict amusement intensity using participants’ propensity to smile (% Smile) in time for the current video (video X, light orange) and the following one (X + 1, light blue)–whatever its type (neutral, funny, or very funny). The red dashed line represents the significance threshold for all models (determined as the maximum of all permutations tests over time, DA = 35.9%).
Applsci 15 07499 g008
Table 1. Feature contributions to models and decoding accuracy. This table illustrates how each feature contributed to predictive models (average ± std), focusing on the beginning, the middle and the end of videos. Average contributions and corresponding decoding accuracies are represented using all videos (left) and humorous videos only (right).
Average Feature Contribution (STD)
FeaturesAll Videos
(Classes: Neutral/Funny/Very Funny)
Humorous Video
(Classes: Low/Moderate/High)
BeginningMiddleEndBeginningMiddleEnd
Movement0.318 (0.008)0.328 (0.006)0.220 (0.018)0.209 (0.033)0.213 (0.011)0.171 (0.030)
Saliency0.291 (0.009)0.269 (0.007)0.282 (0.006)0.248 (0.022)0.213 (0.019)0.142 (0.039)
Semantic Distance0.294 (0.011)0.248 (0.007)0.237 (0.006)0.223 (0.023)0.191 (0.022)0.106 (0.036)
NGD0.059 (0.006)0.047 (0.002)0.052 (0.003)0.089 (0.010)0.046 (0.007)0.037 (0.009)
Smile0.037 (0.021)0.107 (0.012)0.209 (0.018)0.232 (0.053)0.337 (0.042)0.543 (0.098)
Mean Accuracy62.1% (5.0%)62.3% (5.6%)64.1% (5.4%)41.0% (2.8%)43.9% (3.1%)45.2% (4.6%)
Disclaimer/Publisher’s Note: The statements, opinions and data contained in all publications are solely those of the individual author(s) and contributor(s) and not of MDPI and/or the editor(s). MDPI and/or the editor(s) disclaim responsibility for any injury to people or property resulting from any ideas, methods, instructions or products referred to in the content.

