Abstract
Aiming at the problems of the imprecise safety distance standards for low-altitude UAVs within complex low-altitude environments and the difficulty of managing heterogeneous vehicles, a UAV safety interval calibration method based on random heading is proposed. Firstly, a UAV clustering model based on K-Means++ was established for the performance characteristics of UAVs, using evaluation indexes such as contour coefficient, sum of squares of errors, Davidson–Bourdain index, etc. Then, combining this with the characteristics of UAVs with random heading, a UAV safety interval calibration model based on random heading was constructed, and the conflict probability and airspace utilization rate were determined and metered for UAV safety interval calibration. The experimental results showed that the profile coefficient, sum of squares of errors, and Davidson–Berding index of the iteratively optimized UAV clustering were optimized by 53.9%, 55.6%, and 46.6%, respectively, compared with the initial clustering results, and that the safe intervals calibrated in the experimental environment of a single category of UAVs were also applicable to the fusion airspace environment after validation. The research results can provide a theoretical basis and methodological support for the safety interval calibration of UAVs in low-altitude fusion operations.
1. Introduction
In recent years, the country has been vigorously developing high-tech industries, with a focus on the low-altitude economy in the field of air transportation. The drone industry has been assigned enormous development potential. In May 2023, the State Council issued the “Interim Provisions on the Flight Management of Unmanned Aerial Vehicles” [1], aimed at regulating drone operations and production management. The 2024 government work report from the Two Sessions pointed out the importance of promoting the construction of a modern industrial system, accelerating the development of new productivity, and actively cultivating emerging industries. Notably, the low-altitude economy was included in the government work report for the first time, signaling that it has become a representative of new productivity and a new growth point for the national economy of the future.
From 2018 to 2022, the number of drone registrations, the number of pilot licenses, and the total flight hours all showed a rapid upward trend, as shown in Figure 1. This growth trend indicates that the drone industry is developing rapidly and has broad application prospects. However, as the scale of drone operations expands, ensuring operational safety has become the main obstacle to the industry’s further development. Therefore, studying drone operational safety, especially in the context of the rapid growth of the low-altitude economy, is of great practical significance.
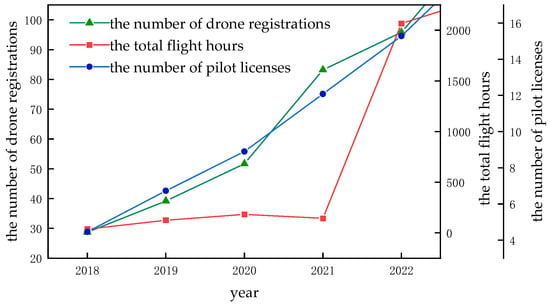
Figure 1.
Drone industry development trend chart.
Currently, many scholars have carried out work to solve the operational safety issues of drones in terms of airspace management and drone safety. In airspace management, many scholars have conducted in-depth research on airspace discretization and digital expression of airspace. For instance, Zhi-Jie Chen et al. [2] deeply analyzed the control issues of urban drones from the perspective of digital airspace and proposed effective solutions to key technologies. Xin-Yu Xu et al. [3] used the GeoSOT grid partitioning method to grid airspace information for easy representation of airspace data. Yong-Wen Zhu et al. [4] proposed an airspace plane grid model and airspace spatial grid model to address the high density and heterogeneity of air traffic, providing scientific guidance for the sustainable development of airspace gridization and digital theory and applications. Ze-Hui Chen [5] used a discretization method to classify airspace hierarchically and quantitatively evaluated airspace spatiotemporal efficiency indicators. Hua Xie et al. [6] created a digital low-altitude airspace gridding representation measurement method to address the complex and difficult-to-represent nature of low-altitude flight environments. Ma [7] proposed a detection method for conflicts between drone planning paths based on airspace grids. Miao [8] proposed a new low-altitude flight conflict detection algorithm to address the strong timeliness and high computational complexity of conflict monitoring, transforming traditional trajectory traversal multi-variable conflict calculations into distributed grid database conflict state queries.
In the field of drone safety, scholars from both domestic and international backgrounds have conducted research on drone conflicts and safety intervals. Hua Xie et al. [9] proposed a drone flight conflict model based on dynamic recognition of conflict occurrence to address the safety issues brought by the large-scale application and intensive flight of drones in the future. Hua Xie et al. [10] proposed a safety risk assessment and three-dimensional path planning method for low-altitude drones in complex urban environments, where flight safety and efficiency need significant improvement. Y. Chen [11] proposed a new operational framework for four-dimensional (4D) trajectory conflict management in the context of free-flight airspace. A. Tyagi et al. [12] established a collision risk assessment model between drones and transport aircraft throughout the full drone system. Chang Liu [13] used geometric methods to determine the collision area of drones and established a dynamic collision area mathematical model. Qing-Yuan Yu [14] improved the Event model with ADS-B and studied the regulation intervals of drones flying in different airspaces. Jun-Jie Gao [15] set collision templates targeting manned aircraft and established a safety flight risk assessment model for drones, to avoid intruding into manned aircraft’s isolated airspace. Qiang He [16] established a drone flight risk assessment model based on fuzzy cognitive maps. Zhang [17] established a cylindrical drone collision risk model in non-isolated airspace by referring to the civil aviation passenger aircraft conflict zone theory. Min Yang [18] analyzed the collision risk between drones and manned aircraft in shared airspace by improving the existing civil aviation transport aircraft collision risk model. Shuo Yang [19] constructed a collision model for large drones based on four-dimensional coordinates, analyzing the flight collision probability of large drones by collecting and analyzing the three-dimensional coordinates, velocity, and other information of large drones and intruder aircraft. A. Perez-Castan [20] proposed a framework and method for non-isolated airspace design and planning based on conflict risks, along with research methods for drone collision risks in non-isolated airspace. Gan [21] established a cylindrical static protection zone model for drones to detect flight conflict trends and near-air collisions between drones and intruders, and proposed a three-dimensional dynamic collision avoidance area modeling method based on the emergency collision avoidance trajectories of drones. Ma [22] established a minimum interval algorithm for the phased ballistic deviations of combat drones, which can deduce the minimum interval between different aircraft types according to side wind effects and drone characteristics at different flight stages.
At present, research in the field of drone operations encounters several significant challenges. Firstly, the lack of a unified definition for drone categories both domestically and internationally has resulted in varied classification standards. These standards are predominantly based on factors such as application scenarios and drone weight, but there remains a considerable gap in classifications related to the flight safety performance of drones. Secondly, the demand for effective low-altitude airspace management is on the rise, necessitating adaptations for the joint operation of various types of drones. However, existing research has predominantly focused on maintaining safety intervals among drones within the same category, while insufficient attention has been paid to the safety intervals between different drone categories. This oversight limits the efficiency of integrated operations in low-altitude airspace, where diverse drone types are increasingly utilized. To address these issues, this paper highlights the inadequacies of current drone classification standards in low-altitude environments and the lack of universal safety intervals. To this end, we employed the K-Means++ algorithm to cluster drones operating in low-altitude airspace based on four key feature indicators: maximum takeoff weight, maximum flight altitude, maximum vertical speed, and maximum horizontal speed. This clustering approach facilitated the development of a classification model specifically tailored for low-altitude drones.
Furthermore, we propose a safety interval calibration model that takes into account heading randomness, allowing for the calibration of safety intervals for drones navigating in three-dimensional airspace. This calibrated model aims to provide theoretical support for partitioning low-altitude airspace into grid granularity, thereby enhancing safety and operational efficiency. By addressing the critical gaps in classification and safety standards, this research aims to pave the way for more effective and integrated low-altitude drone operations. The drones studied in this paper are all multi-rotor drones, and they operate at flight altitudes of less than 1000 m.
2. Drone Clustering Based on the K-Means++ Algorithm
2.1. Clustering Feature Indicator Design
According to the relevant provisions on drone performance evaluation in the “Test Methods for Civil Multirotor UAV Systems”, this article selects four indicators: maximum takeoff weight, maximum flight altitude, maximum horizontal speed, and maximum climb rate. These four indicators can represent the performance of a drone. The specific descriptions of the four indicators are as follows:
(1) Maximum Takeoff Weight
When a drone is functioning normally, with sufficient battery power, and the payload is designed with the optimal weight distribution, the maximum weight at which it can take off smoothly and adjust its posture freely during takeoff is defined as the maximum takeoff weight, represented as .
(2) Maximum Flight Altitude
When a drone is functioning normally, with sufficient battery power, and the payload is within the manufacturer’s specified weight limits, the maximum altitude at which the drone can maintain control during forward flight, backward flight, sideways flight, and turning is defined as the maximum flight altitude, represented as .
(3) Maximum Horizontal Speed
When a drone is functioning normally, with sufficient battery power, and the payload is within the manufacturer’s specified weight limits, the speed at which the drone can transition from a vertical takeoff to a specified height and then accelerate horizontally until the speed stabilizes within the range for 5 s is defined as the maximum horizontal speed, represented as .
(4) Maximum Climb Rate
When a drone is functioning normally, with sufficient battery power, and the payload is within the manufacturer’s specified weight limits, the rate at which the drone can climb vertically and accelerate its climb to the maximum rate until the climb rate stabilizes within the range for 5 s is defined as the maximum climb rate, represented as .
2.2. UAV Clustering Modeling Based on K-Means++
Currently, there is a lack of unified and clear standard documents for classifying drone performance, which has led to discussions on safety separation mainly focusing on specific drone models. The performance differences between drones mean that there are significant variations in safety separation across different models. Based on this, specific algorithms should be used to deeply explore the intrinsic patterns of indicator feature data, thereby achieving the classification of drones based on their performance. In the process of classifying drones based on performance, clustering algorithms can be used as the primary tool to explore the data features in depth. By pre-setting the number of clusters and performing clustering operations according to a specific objective function, drones with different performances can be effectively grouped into multiple categories. A detailed analysis of the cluster centers can reveal the key parameters of drone performance within each category, thus providing strong support for the study of universal drone safety separation.
(1) Initialize the data matrix
Let be the number of drones and be the number of drone performance indicators. The initial performance indicator evaluation data are established as
(2) Standardize the data matrix
The elements in the initial data matrix are processed using the range normalization method. Since the selected indicators are all positive indicators, the processing method is as follows:
(3) K-Means++ Clustering Algorithm Process
Based on the clustering feature indicators designed in Section 2.1, the K-Means++ algorithm-related parameters are calculated by extracting the performance indicators of the drones. This results in the final outcome, which includes the drone categories and the performance parameters of each category.
2.3. Selection of Clustering Evaluation Indicators
To validate the scientificity and effectiveness of the K-Means++ algorithm, this section selects three commonly used evaluation metrics: the Silhouette Coefficient, Sum of Squared Errors (SSE), and Davies–Bouldin Index, to comprehensively assess the clustering results. Below is a detailed description of these evaluation metrics:
(1) Silhouette Coefficient (Sil): This metric measures the relative distance between samples within each cluster and samples from other clusters. It evaluates the compactness of the samples within their assigned cluster and the degree of separation between clusters by calculating the relative difference between the average distance of each sample to other samples in the same cluster and the average distance to samples in other clusters. The calculation formula is as follows:
In Equation (3), i denotes the ith sample; denotes the average distance between sample point i and all other sample points in the same cluster, i.e., intra-cluster dissimilarity; and denotes the average distance between sample point i and all sample points in other clusters, i.e., inter-cluster dissimilarity.
(2) Sum of Squared Errors (SSE): As one of the most common clustering quality metrics, this indirectly reflects the closeness of the clusters by calculating the sum of squares of the distances between each sample and the cluster center they belong to. The specific formula is as follows:
In Equation (4), SSE denotes the sum of squared errors, k denotes the number of clusters, i denotes the cluster number, denotes the set of model performance data samples in cluster i, p denotes the model performance data sample points, and denotes the center of data samples in cluster i. The smaller the sum of squared errors, the closer the data points are to the center of clusters they belong to, and the better the clustering results.
(3) Davies–Bouldin Index: This index evaluates the degree of separation of clusters by calculating the average distance between each cluster and its most similar cluster, taking into account the closeness within the cluster. A lower Davies–Bouldin Index (close to 0) indicates a better clustering effect. The specific formula for this is as follows:
where denotes the value of the Davidson–Bourdain index, denotes the average distance of all sample element points of the ith category to the cluster center of that category, denotes the distance between the cluster centers of the ith category and the jth category, and denotes the number of cluster centers.
2.4. Analysis of Experimental Results
In this paper, 50 UAVs were selected as experimental samples, covering UAV models widely used in low-altitude scenarios. A total of 100 iterations were performed under different numbers of clustering centers, aiming to explore and verify the robustness and optimal configuration of the clustering effect through a large-scale experimental design. The clustering results were quantitatively evaluated using three key evaluation metrics, namely, contour coefficient, sum of squared errors, and Davidson–Bourdain index, and in terms of multiple dimensions, such as compactness within clusters, separation between clusters, and relative positions of samples in the clusters to which they belong, thus enabling systematic comparisons of differences in effectiveness under different numbers of clustering centers. The results of the performance-based UAV clustering evaluation index are shown in Table 1.

Table 1.
Results of clustering evaluation indicators.
Based on the analysis of the clustering evaluation indexes in the table, it can be seen that when the K value was set to 4, the profile coefficient was closest to the ideal value of 1, which indicated that at this time the clustering structure was the clearest, the separation between clusters was the greatest, and the clustering effect reached the best state; when the K value was 3, the sum of squares of the error was the minimum, which indicates that in the process of dimensionality reduction and reconstruction of the data, the loss of information was minimized, and the accuracy of the clustering was the highest; and when the K value was 15, the Davidson–Bourdain index was closest to 0, which means that the homogeneity within the clusters was excellent and the differences between the clusters were significant, also showing good clustering performance.
However, the optimization of a single index did not fully represent the optimization of the clustering effect. Therefore, it was necessary to comprehensively consider the trend of the clustering indicators under different K values to find a balance point, so that the clustering effect was both interpretable and relatively ideal. Figure 2 graphically shows the dynamic curve of these indicators with the change in K value. The analysis of these curves was used to more accurately determine a more appropriate K value, in order to achieve the optimization goal of clustering analysis.

Figure 2.
K-Means++ clustering evaluation index result map: (a) plot of the results of contour coefficients as a function of the value of K; (b) plot of the results of the sum of squares of errors as a function of the value of K; (c) plot of the results of the Davidson–Bourdain index as a function of the value of K.
In Figure 2a, when the K value was raised from 2 to 4, it is observed that the profile coefficient Sil was significantly elevated, which indicates that the groups formed by clustering showed a higher degree of differentiation among themselves. Following this, when the K-value was gradually increased from 4 to 16, the Sil value showed a decreasing trend, but this decreasing rate slowed down significantly. Combined with the change in Sil value and K-value, we can judge that when the K-value was set to 4, the separation between the clustered groups reached the optimal state; in Figure 2b, the error squared and the SSE reached their lowest points when the K-value was set to 3, which indicates that, at this time, the accuracy of the data clustering was the highest, with the increase in K value. Although the SSE value had some ups and downs, the overall trend tended to grow. It is worth noting that, in the process of the K value increasing from 3 to 4, the rate of increase in SSE slowed down significantly. Thus, using the SSE as an evaluation index, it can be assumed that for a K value between 3 and 4, the clustering effects presented are more ideal. From Figure 2c of the Davidson–Bourdain index curve trend, it can be seen that with the increase in K value, the clustering effect presented was more ideal. With the increment in K value, DBI showed a decreasing trend, especially when the K value reached 4. It was observed that the decrease rate of DBI slowed down significantly, and the decrease amplitude became extremely small. Based on the evaluation criterion of the DBI, it can be assumed that the clustering result reached a relatively desirable level when the K value was 4. In summary, the clustering effect was best when K = 4 was chosen.
Based on the above analysis, for this collection of datasets, the best number of clustering effects using K-Means++ was 4. Based on the performance of the clustering evaluation indexes, the clustering results were adjusted over many iterations, a total of 100 iterations, as shown in Figure 3 of the comparison of the clustering effect before and after the iteration. Sil, SSE, and DBI were gradually optimized and the iterations tended to stabilize at 0.8032, 0.731, and 0.312 respectively.
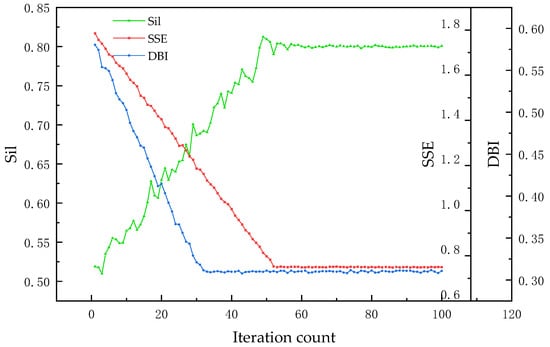
Figure 3.
Plot of changes in evaluation indicators for clustering iterations.
The final clustering results are shown in Figure 4. From Figure 4a–d, it can be seen that the UAVs were divided into four categories according to the four performance dimensions, and there was a high degree of separation between the various categories, which reflects the performance-based distribution characteristics of UAVs, and at the same time, indicates the reasonableness and effectiveness of the clustering results.
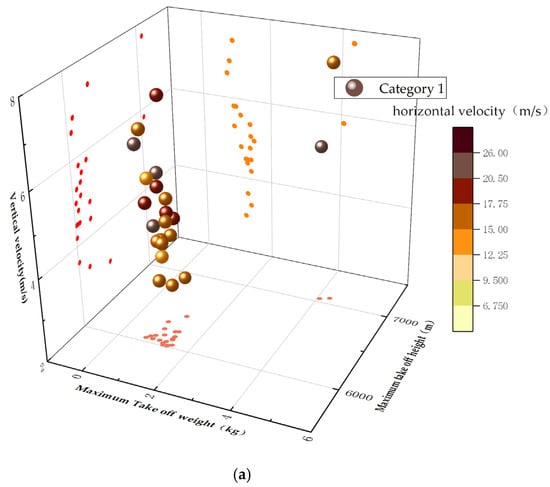
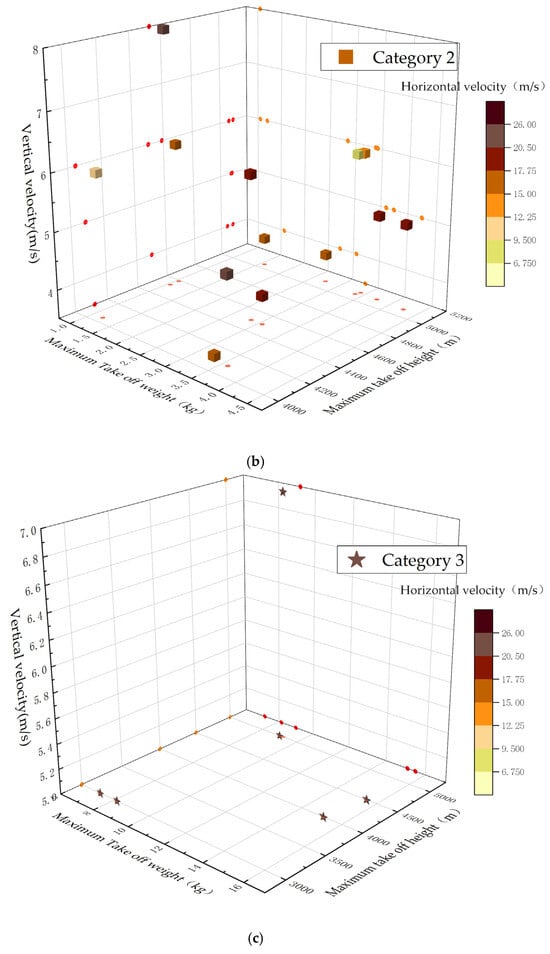
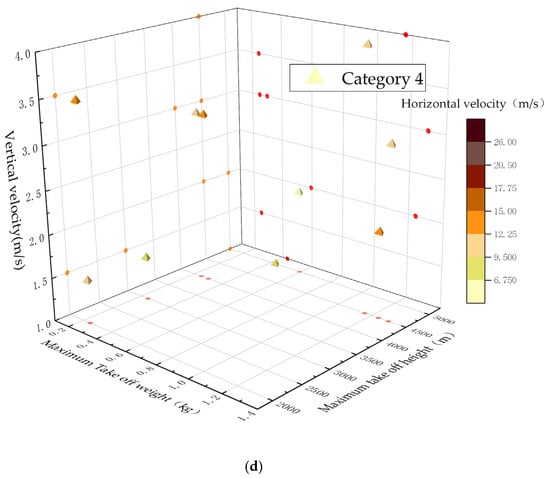
Figure 4.
UAV clustering result map: (a) Category 1; (b) Category 2; (c) Category 3; (d) Category 4.
After the K-Means++ algorithm was used to classify the UAVs by performance, the final UAV performance index for each category was as shown in Table 2.

Table 2.
Performance indicators for each type of UAV.
3. Random-Heading-Based Calibration of UAV Safety Intervals
3.1. Stochastic Movement Model
In order to explore in depth the high flexibility characteristics demonstrated by UAVs when flying at low altitude, this paper adopted a stochastic movement model approach in order to systematically model the dynamic behavior of UAVs. By accurately assessing the risk of collision between UAVs, and then establishing safety interval criteria, this ensures that UAVs perform their tasks safely and efficiently in dense environments. Within the framework of the stochastic movement model, the trajectories of nodes (i.e., UAVs) are assumed to be free, random, and independent of each other, and their trajectories are not affected by other nodes, a setting that helps to simulate the dynamic behaviors of UAVs in complex environments. In this paper, a random heading movement model was used to finely simulate the movement process of UAVs, which can not only capture the characteristics of UAVs moving randomly in space, but also reflect their behavioral patterns in a highly flexible operating environment.
In the stochastic-heading-based model, the UAV performs independent flight routes in low-altitude airspace . At each instantaneous point, the UAV autonomously selects a heading in a given coordinate space and travels along the selected heading at a constant rate. The movement of the UAV in each direction in 3D space presents an equal probability distribution, and the flight probability in any given direction remains the same, and thus a uniform probability density function is constructed , which is described in Equation (6) below:
where denotes the polar angle and denotes the azimuth angle.
In order to simulate a wide range of airspaces, this paper adopted the encircling boundary model to deal with the case of a UAV impacting the boundary, which will appear on the opposite side with the same speed and heading when it impacts the boundary. The UAV motion model in this scenario is described as shown in Equations (7)–(9) below:
where , , and denote the equations of motion of the UAV along the x-axis, y-axis, and z-axis, and denotes the rounding functions. The boundary wrapping model allows drones to re-enter the designated airspace from the opposite boundary at the same angle, preventing them from exceeding the limits of the specified airspace.
Figure 5 shows the two-dimensional random heading model.
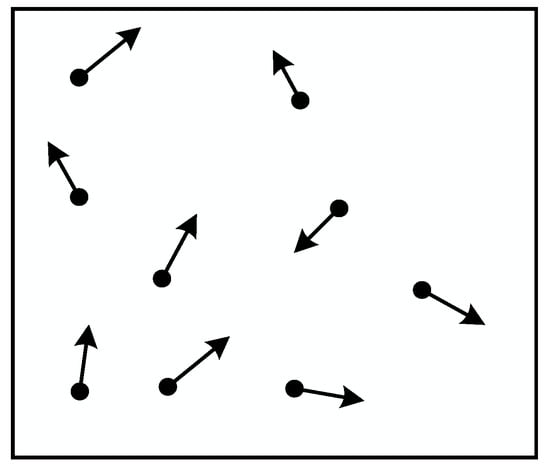
Figure 5.
Two-dimensional schematic of the stochastic heading model.
3.2. Conflict Probability Definition and Measurement
For the determination of the conflict between two UAVs and , the conflict distance is defined as , when the distance is between two UAVs, it is considered that the two UAVs are at the point of conflict. Where is determined by the distance of the safety zone when the two UAVs are at a tangent. In this paper, we simplify the position space of the UAVs and fully consider the flight attitude of the UAVs, taking into account the high-frequency attitude changes of the UAVs, such as their pitching motion, and in order to ensure that the wings of the UAVs did not go beyond the area of the safety zone of the UAVs in the process of attitude change. The proposed use of the outer sphere of the body of a UAV as the safety zone for UAVs is shown in Figure 6.

Figure 6.
Schematic diagram of the UAV safety zone: (a) three-dimensional figure; (b) front view; (c) top view.
The physical parameters of the UAV safety zone sphere are as follows:
Assuming that the horizontal length of the UAV is x, the horizontal width is y, and the height is z, the radius λ, the volume v, and the surface area s of the sphere model can be obtained as shown in Equations (10)–(12):
By constructing a sphere model of the safety zone, the conflict problem between UAVs can be transformed into a geometric problem of analyzing the positional relationship of spheres in 3D space. To simplify the analysis process, the safety zone of UAV i is relocated to the position of UAV j. This adjusted protection area is defined as the combined sphere safety zone. The motion relationship between UAV i and UAV j can be expressed as a relative motion state; i.e., UAV i is regarded as a stationary entity under the global coordinate system, whereas UAV j has a specific relative velocity with respect to UAV i. In this setting, the UAVs within the combined sphere safety zone are regarded as potentially vulnerable. In this setting, UAV j within the safety of the combined sphere is treated as a target potentially attacked, while the other UAV i is abstracted as a prime, symbolic intruder. This strategy eliminates the complex spatial geometric relationships and dynamic interactions in traditional collision analysis, effectively focuses on the critical intrusion threat assessment, and thus provides a more intuitive and simplified mathematical model for UAS security policy formulation, as shown in Figure 7.

Figure 7.
Schematic diagram of the multi-UAV motion model. The arrow represents the combination process of multiple drone speed vectors and protected areas.
In summary, UAVs i and j are considered to be at risk of conflict when .
For the calculation of the conflict probability between two UAVs, the concept of a conflict heading cone is introduced, and the definition of a conflict heading cone is as follows:
Conflict heading cone: In the three-dimensional space from the UAV to the combined sphere safety zone as a ray, so that the ray and the combined sphere safety zone are at a tangent, tangent rays are combined into a cone side. This side surrounded by the cone includes the set of relative headings that will be in conflict in the three-dimensional space. A sectional view of the cone of conflicting headings is shown in Figure 8.
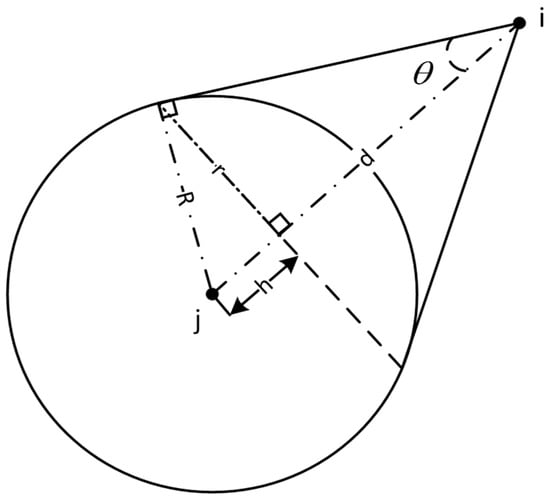
Figure 8.
Conflict heading cone profile.
Based on the above definition, a formula is derived for the conflict probability between two UAVs:
The relative heading of UAV i is spherically distributed in three-dimensional space, and the sphere contains the set of relative headings of UAV i. The conflict probability can be regarded as the ratio between the geometric surface areas. In Equation (14), denotes the surface area of the intersecting part of the conflict heading cone and the UAV j heading sphere, denotes the surface area of the UAV j heading sphere, denotes the set of conflicting headings, and denotes the set of all headings.
where x, y, and z denote the length, width, and height dimensions of the UAV; λ denotes the radius of the sphere safety zone of the UAV; and R denotes the radius of the combined sphere safety zone.
where d denotes the height of the conflict heading cone, θ denotes the angle of separation of the conflict heading cone, and the radius of the base of the conflict heading cone is r.
where denotes the surface area of the spherical crown where the conflict heading cone intersects the prime heading sphere, denotes the surface area of the heading sphere of UAV i, and denotes the conflict probability of two UAVs.
The conflict probability of multiple UAVs can be deduced from two UAVs.
When at least one pair of UAVs i and j have conflict risk at moment k, then the whole airspace has conflict risk at moment k, as shown in Equation (23):
3.3. Design of Other Safety Interval Indicators
UAV safety interval calibration affects the level of safe UAV operation and the operational efficiency of low-altitude airspace. In order to scientifically and reasonably carry out UAV safety interval calibration, this paper determined a safety interval airspace utilization rate, in addition to the UAV conflict probability, as a UAV safety interval calibration index, which was used to assess and calibrate the UAV safety interval.
The safe interval airspace utilization rate refers to the ratio of the volume of the UAV’s smallest outer sphere in the sphere enclosed by the UAV safe interval. From the perspective of low-altitude airspace resources, an excessively large safety interval can lead to a reduction in the number of UAVs that can operate per unit of airspace, which greatly reduces the airspace utilization rate.
In Equation (24), is the UAV safety interval, i.e., the radius of the UAV safety zone, is the minimum outer sphere radius of the UAV, is the utilization rate of the safety interval airspace, and denotes the disturbance coefficient that influences the results due to factors such as positioning errors. From Equation (24), it can be seen that the safety interval airspace utilization rate decreases with the increase in , and a decrease in safety interval airspace utilization rate means that the airspace occupied by a single UAV operation increases, so it is not possible to be overly conservative when calibrating the safety interval of UAVs.
4. Simulation Experiment and Result Analysis
4.1. Experimental Design
In this section, based on the Python 3.8 environment, a simulation analysis of UAV collision risk was carried out. Based on the classification of UAV performance, the performance parameters for each type of UAV were selected as the experimental data inputs, and the specific data are referred to in Table 2. The experiments were designed to simulate N drones flying independently in a low-altitude airspace according to the stochastic-heading model. The radius of the UAV safety zone was set as the independent variable, the time step was set to 5 s, indicating the type of UAV, and the simulation time was set to 1000 s. As the independent variable, i denotes the UAV type, the time step was set to 5 s, and the simulation time was set to 1000 s.
4.2. Analysis of Results
Multi-flight combination simulation experiments were conducted for UAVs of category 1, and the minimum outer catch sphere radius was used as the radius of the UAV safety zone. The experimental results are shown in Figure 9.
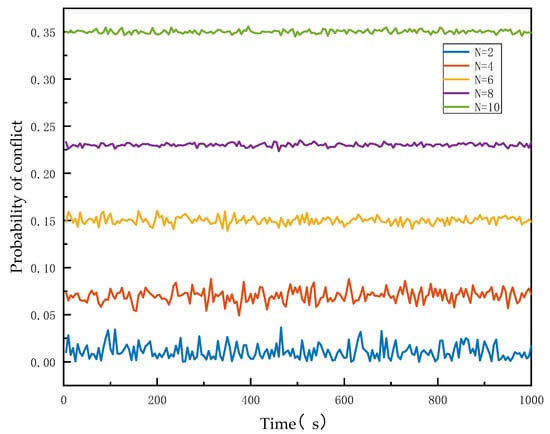
Figure 9.
Graph of experimental results of 10 UAVs of the same category.
As demonstrated in Figure 9, for the stochastic heading model, the UAV operational sorties were kept constant, and the conflict rate of UAVs in the airspace exhibited a fluctuating pattern around a specific value. It is worth noting that the magnitude of this fluctuation decreased as the number of operational sorties increased, while at the same time, the conflict rate exhibited an irregular upward trend.
For the two UAVs of category 1, the radius of the safety zone of their UAV combination sphere as adjusted to be the independent variable, and the step size was set to 1. Simulation experiments were conducted, and the experimental results are shown in Figure 10.
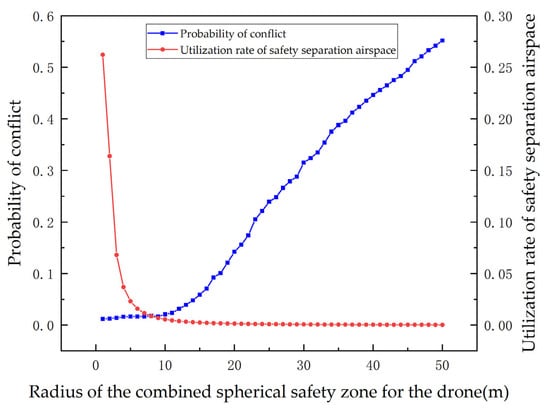
Figure 10.
Experimental results of single category UAV simulation.
As illustrated in Figure 10, the probability of conflict among UAVs increased monotonically with a larger safety radius of the combined sphere. Notably, there was a significant acceleration in the growth rate when the radius reached 10 m. Conversely, as the safety radius of the combined sphere increased, the airspace utilization rate in relation to safety spacing demonstrated a monotonically decreasing trend. The decline in utilization rate gradually slowed down, and beyond a radius of 9 m, the change became relatively insignificant. Therefore, we concluded that the optimal safety interval for type 1 UAVs is 10 m.
Figure 11 further supports this conclusion. As the safety radius of the combined sphere gradually increased, the conflict probability between UAVs showed a consistent upward trend. Particularly at a radius of 10 m, the rate of increase in conflict probability was notably accelerated. At the same time, the airspace utilization rate corresponding to the safety interval exhibited a monotonically decreasing trend, with the rate of decline tapering off over time. Similarly to the earlier findings, when the safety radius exceeded 9 m, the difference in the rate of change became less pronounced.
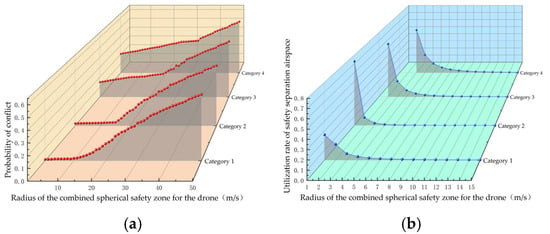
Figure 11.
Results of simulation experiments for each category: (a) plot of conflict probability versus safety zone radius; (b) plot of airspace utilization versus safety zone radius.
Based on the comprehensive analyses presented, we can conclude that the safety interval for type 1 UAVs should indeed be set at 10 m. In addition, similar experiments were conducted for the other categories of UAVs to calibrate their respective safety intervals, as illustrated in Figure 11.
The specific results of the UAV safety interval calibration are shown in Table 3.

Table 3.
UAV safety interval calibration results.
To further validate the rationale behind the calibration of UAV safety intervals, we designed an experimental scheme to analyze the fusion operations of the four categories of UAVs with equal proportions. The results of this experiment are presented in Figure 12, which clearly illustrates that the airspace conflict probability was significantly influenced by the category of UAV when the radius of the combined sphere safety zone was small. As the safety zone radius increased, the impact of UAV category on conflict probability gradually diminished. Our analysis indicates that at smaller safety zone radii, the size and speed of the UAVs have a notable effect on the probability of conflict. However, as the radius of the safety zone increased, the significance of these factors in determining conflict probability became less pronounced. Eventually, when the safety zone radius reached a specific threshold, the conflict probability curves for the different UAV types began to overlap. This experimental finding further confirmed the validity of the safety interval calibration conducted for the individual UAV categories.
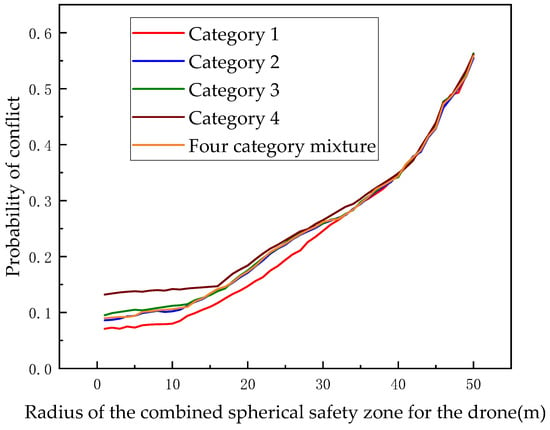
Figure 12.
Comparison of conflict probability in multiple scenarios.
5. Discussion
This study addressed two critical challenges in low-altitude UAV operations: the absence of performance-based classification standards for heterogeneous UAVs and the lack of universally applicable safety interval criteria. We proposed a UAV clustering model based on the K-Means++ algorithm, which demonstrated significant improvements in classification accuracy compared to the initial clustering results. The optimized silhouette coefficient showed a 53.9% improvement, the sum of squared errors was reduced by 55.6%, and the Davies–Bouldin index decreased by 46.6%. These metrics indicated enhanced intra-cluster cohesion and inter-cluster separation. Such advancements lay a robust foundation for categorizing UAVs based on performance metrics, thereby addressing gaps in existing classification systems that primarily rely on weight or application scenarios rather than safety-critical flight characteristics.
Furthermore, our safety interval calibration model, which incorporates random heading dynamics, introduces a novel approach to conflict probability assessment. By transforming collision risk analysis into a geometric problem involving intersecting spherical safety zones, this model effectively quantifies conflicts in 3D airspace. The experimental results revealed a calibrated safety interval of 10 m for Category 1, 15 m for Category 2, 25 m for Category 3, and 33 m for Category 4. These intervals strike a balance between safety requirements and airspace utilization efficiency. Notably, the conflict probability curves for multi-category UAV operations converged as the safety intervals increased, validating the applicability of single-category calibration results in mixed airspace environments. This finding aligns with prior studies emphasizing dynamic risk assessment in shared airspace, but extends their scope by integrating performance-based classification.
The implications of this work are twofold. Firstly, it supports the standardization of low-altitude airspace management by providing data-driven UAV classification and safety interval criteria. Secondly, it offers a scalable framework for incorporating emerging UAV technologies into existing air traffic management systems. However, limitations exist, including the assumption of a uniform heading distribution and the simplification of spherical safety zones, which may not fully account for complex UAV maneuvers or environmental factors. Future research should aim to explore adaptive safety intervals for dynamic environments and validate the model in real-world scenarios involving heterogeneous UAV fleets.
6. Conclusions
This study established a performance-based UAV classification system using the K-Means++ algorithm and calibrated safety intervals for low-altitude operations under random heading conditions. Key contributions include the following:
- A UAV clustering model that improved the silhouette coefficient, SSE, and DBI by 53.9%, 55.6%, and 46.6%, respectively, enabling precise categorization based on maximum takeoff weight, flight altitude, and speed metrics.
- A conflict probability model that translates 3D collision risks into geometric intersections of spherical safety zones, with calibrated intervals demonstrating applicability in both single-category and mixed airspace environments.
- Empirical validation showing that Category 1–4 UAVs require safety intervals of 10 m, 15 m, 25 m, and 33 m, respectively, balancing collision prevention (conflict probability < 5%) and airspace utilization (>70%).
These results provide theoretical and methodological support for standardizing low-altitude airspace management, facilitating the safe integration of diverse UAV operations.
Author Contributions
Conceptualization, H.X. and J.Y.; methodology, X.J.; software, Y.W.; validation, H.X. and X.J.; formal analysis, H.X. and S.D.; investigation, X.J.; resources, J.Y.; data curation, X.J. and S.D.; writing—original draft preparation, H.X.; writing—review and editing, H.X. and J.Y.; visualization, X.J.; supervision, J.Y. and Y.Z.; project administration, J.Y. All authors have read and agreed to the published version of the manuscript.
Funding
This research was funded by the Frontier Leading Technology Basic Research Project of Jiangsu Province (No. BK20222013), and the Major Science and Technology Project of Nanjing (No. 202405026).
Institutional Review Board Statement
Not applicable.
Informed Consent Statement
Not applicable.
Data Availability Statement
Data are contained within the article.
Conflicts of Interest
The authors declare no conflicts of interest.
Abbreviations
The following abbreviations are used in this manuscript:
| UAV | Unmanned Aerial Vehicle |
| SSE | Sum of Squared Errors |
| DBI | Davies–Bouldin Index |
| Sil | Silhouette Coefficient |
| K-Means++ | K-Means++ Clustering Algorithm |
| 3D | Three-Dimensional |
| ADS-B | Automatic Dependent Surveillance-Broadcast |
| 4D | Four-Dimensional |
References
- State Council of the People’s Republic of China. Interim Regulations on the Flight Management of Unmanned Aircraft [Administrative Regulation]. Gaz. Minist. Public Secur. People’s Repub. China 2023, 4, 44–54. [Google Scholar]
- Chen, Z.J.; Zhu, Y.W.; Liu, Y. Research on Urban UAV Management Strategies Based on Digital Airspace Systems. J. Civ. Aviat. Univ. China 2023, 41, 8–12. [Google Scholar]
- Xu, X.Y.; Wan, L.J.; Chen, P.; Dai, J.B.; Cai, P. Airspace Grid Characterization Method Based on GeoSOT Grid. J. Air Force Eng. Univ. 2021, 22, 15–22. [Google Scholar]
- Zhu, Y.W.; Xie, H.; Pu, F.; Zhang, Y.; Hei, W.W. Airspace Gridding Methods and Their Application in Air Traffic Control. Adv. Aeronaut. Eng. 2021, 12, 12–24. [Google Scholar]
- Chen, Z.H. Improving Spatiotemporal Efficiency in Complex Airspace Operations Using Discrete Methods. Master’s Thesis, Civil Aviation Flight University of China, Guanghan, China, 2023. [Google Scholar]
- Xie, H.; Yin, J.N.; Zhu, Y.W.; Chen, Z.J. Characterization Metrics and Optimal Calibration of Digital Low-Altitude Airspace Gridding. J. Data Acquis. Process. 2024, 39, 31–43. [Google Scholar]
- Ma, Z.; Chen, J. Adaptive path planning method for UAVs in complex environments. Int. J. Appl. Earth Obs. Geoinf. 2022, 115, 103133. [Google Scholar] [CrossRef]
- Miao, S.; Cheng, C.; Zhai, W.; Ren, F.; Zhang, B.; Li, S.; Zhang, J.; Zhang, H. A low-altitude flight conflict detection algorithm based on a multilevel grid spatiotemporal index. ISPRS Int. J. Geo-Inf. 2019, 8, 289. [Google Scholar] [CrossRef]
- Xie, H.; Su, F.Z.; Yin, J.N.; Han, S.T.; Zhang, X.J. Network Modeling and Refined Management of UAV Flight Conflicts in Complex Low-Altitude Airspace. Acta Aeronaut. Astronaut. Sin. 2023, 44, 221–241. [Google Scholar]
- Xie, H.; Han, S.T.; Yin, J.N.; Ji, X.H.; Yang, Y.C. Safety Risk Assessment and 3D Path Planning for UAVs in Complex Urban Low-Altitude Airspace. J. Saf. Environ. 2024, 1, 1–17. [Google Scholar]
- Chen, Y.; Hu, M.; Yang, L. Autonomous planning of optimal four-dimensional trajectory for real-time en-route airspace operation with solution space visualisation. Transp. Res. Part C Emerg. Technol. 2022, 140, 103701. [Google Scholar] [CrossRef]
- Tyagi, A.; Zhang, Y.; Toussaint, S.; Luxhoj, J.T. Strategies to Model System Risk Using UAS Safety Analysis Model (USAM). In Proceedings of the 16th AIAA Aviation Technology, Integration, and Operations Conference, Washington, DC, USA, 13–17 June 2016; p. 3597. [Google Scholar]
- Liu, C.; Wang, H.L.; Yao, P.; Lei, Y.P. Dynamic Collision Zone Modeling and Analysis for UAVs Facing Aerial Threats. J. Beijing Univ. Aeronaut. Astronaut. 2015, 41, 1231–1238. [Google Scholar]
- Yu, Q.Y. Research on Anti-Collision Technology for UAVs in Controlled Airspace. Master’s Thesis, Civil Aviation Flight University of China, Guanghan, China, 2018. [Google Scholar]
- Gao, J.J. Research on Risk Assessment for UAV Safe Flight. Master’s Thesis, Civil Aviation Flight University of China, Guanghan, China, 2018. [Google Scholar]
- He, Q.; Xu, Y.; Ma, Y. UAV Flight Safety Risk Assessment Based on FCM. J. Civ. Aviat. 2018, 2, 31–34. [Google Scholar]
- Zhang, Z.; Zhang, J.; Wang, P.; Chen, L. Research on Operation of UAVs in Non-isolated Airspace. Comput. Mater. Contin. 2018, 57, 151–166. [Google Scholar] [CrossRef]
- Yang, M. Safety Risk Assessment of Collisions Between UAVs and Civil Aircraft. Master’s Thesis, Civil Aviation Flight University of China, Guanghan, China, 2019. [Google Scholar]
- Yang, S. Research on Modeling Methods for Collision of Large UAVs. Master’s Thesis, Hebei University of Science and Technology, Shijiazhuang, China, 2019. [Google Scholar]
- Pérez-Castán, J.A.; Comendador, F.G.; Rodríguez-Sanz, A.; Cabrera, I.A.; Torrecilla, J. RPAS conflict-risk assessment in non-segregated airspace. Saf. Sci. 2019, 111, 7–16. [Google Scholar] [CrossRef]
- Gan, X.; Wu, Y.; Liu, P.; Wang, Q. Dynamic collision avoidance zone modeling method based on UAV emergency collision avoidance trajectory. In Proceedings of the 2020 IEEE International Conference on Artificial Intelligence and Information Systems (ICAIIS), Dalian, China, 20–22 March 2020; pp. 693–696. [Google Scholar]
- Ma, X.; Zhang, X.; Wang, H.; Ding, S.; Li, X. An operational safety evaluation method for manned transport aircraft and large UAV in mixed airspace. Math. Probl. Eng. 2021, 2021, 6636794. [Google Scholar] [CrossRef]
Disclaimer/Publisher’s Note: The statements, opinions and data contained in all publications are solely those of the individual author(s) and contributor(s) and not of MDPI and/or the editor(s). MDPI and/or the editor(s) disclaim responsibility for any injury to people or property resulting from any ideas, methods, instructions or products referred to in the content. |
© 2025 by the authors. Licensee MDPI, Basel, Switzerland. This article is an open access article distributed under the terms and conditions of the Creative Commons Attribution (CC BY) license (https://creativecommons.org/licenses/by/4.0/).