Article

Evaporation and Ignition of Isolated Fuel Drops in an Oxidizing Environment: Analytical Study Based on Varshavskii’s ‘Diffusion Theory’

by
Laurencas Raslavičius
Faculty of Mechanical Engineering and Design, Kaunas University of Technology, LT-51424 Kaunas, Lithuania
Appl. Sci. 2025, 15(13), 7488; https://doi.org/10.3390/app15137488
Submission received: 27 May 2025 / Revised: 26 June 2025 / Accepted: 1 July 2025 / Published: 3 July 2025
(This article belongs to the Special Issue Advances in Combustion Science and Engineering)

Abstract

Featured Application

The proposed methodology for the assessment of evaporation and ignition of the hydrocarbon fuel droplets is essential, not only for improving combustion efficiency and reducing the process-generated pollution levels but also for controlling the fire hazard when handling these fuels.

Abstract

Varshavskii’s ‘Diffusion Theory’, less investigated due to its limited international visibility, can offer one of the simplest and, on the other hand, high-accuracy methods for evaluating the ignition delay of fossil fuel and biofuel droplets, including their blend. In this study, experimental pre-tests were conducted to determine pre-existing subject knowledge on stationary droplet combustion at ambient pressure and temperatures varying from 935 to 1010 K followed by simulation of droplet ignition times. The test fuels were mineral diesel (DF), RME and a 20% RME blend with DF. Simulations were performed for isobaric conditions. Using the detailed transport model and detailed chemical kinetics, the necessary rearrangements were made for the governing equations to meet the criteria for modern fuels (biodiesel, diesel, and blend). The influence of different physical parameters, such as droplet radius, or initial conditions, on the ignition delay time was investigated. The high sensitivity of the proposed methodology to experimental results was substantiated.

1. Introduction

The foundation for a broader understanding of the combustion phenomena was laid down by Antoine Lavoisier early between 1772 and 1782. He investigated the products of the burned fraction of sulphur and noticed that their ashes outweighed the initial substances, which led him to the conclusion that it was due to their combined with air. A scientific explanation was given that the ‘fixed’ air (that is, carbon dioxide) that had combined with sulphur as an active fraction of O2 that sustained combustion [1,2]. Lavoisier called the gas ‘oxygen’. The scientist discovered the composition of air and propounded the new doctrine of oxidation, which was based on scientific principles, the most important of which was the law of matter conservation [1,2].
The second decade of the 20th century may be taken as a starting point for modern understanding of the mechanism of chemical chain reactions, discovery of the chain branching reactions whose active site generates the appearance of two or more active centers, and in-depth and detailed examination of explosions and combustion. After the 1930s extensive studies in the field of reaction kinetics became an indispensable part of flame propagation theory. The lack of experimental data at this time gave momentum to the formation of theoretical knowledge in the scientific works of Semionov [3,4], Zeldovich [4,5], Frank-Kameneckii [5] and Varshavskii [6]. Among the very first experimental works carried out to investigate the combustion of an isolated fuel droplet belong to Godsave [7,8,9], Kumagai and Isoda [10] and Spalding [11], which were later reviewed in refs [12,13,14,15,16,17] and became what we call today ‘the classical theory of droplet combustion’ [13,18]. Two typical cases of droplet combustion are distinguished. The first is the combustion of liquid fuels in a high-pressure oxidizing medium (near critical conditions), the so-called bipropellant droplet combustion [19]. Being the subject of a variety of research works, this form of combustion is used extensively in practical applications [20,21]. The second is the combustion of monopropellants, such as nitromethane, which has its own oxygen supply [22].
This study focuses specifically on the combustion of spherically symmetric droplet combustion under normal gravity conditions, since the real combustion of diesel fuel, rapeseed oil methyl ester (RME) and their binary blends usually takes place under normal, rather than reduced (or zero) gravity environments. As discussed in [13], there are various types of research done under prescribed conditions, including, but not limited to, the D2-law of droplet evaporation [23,24,25,26], the Dn-law of droplet evaporation (where n = 8/3) [26], droplet evaporation in a finite domain [27], droplet ignition [28,29], burning rate [30,31] of different single component [32] and multicomponent [33,34,35] fuels. Having analyzed typical cases of mathematical modelling of the droplet burning process described in the classical combustion theory, it was established that those methods had two main shortcomings:
  • Many mathematical calculations were performed using pure hydrocarbons: n-heptane, n-pentane, and n-hexane, motivating the fact that those fuel types were best investigated [6,9,10,11,14,17]. Thus, the flammability features of certain investigated fuels of fossil origin are often established by approximation, taking numerical values of the required parameter of a hydrocarbon compound closest to its chemical composition. Such an attitude introduces calculation errors and aggravates the establishment of flammability features of blended fuels.
  • Some of the so-called advanced models presented by the authors who investigated droplet burning theory are very complicated [16,36,37,38,39]. However, the authors admit that most of these models are still rather complicated, which limits their wide application [16]. To apply them to establish flammability characteristics of combustible mixtures, experiments determining calorific and physical features that require a lot of time and resources are needed; moreover, they would level the advantage of mathematical modelling against experimental trials.
Liquid fossil fuels and biofuels cannot be consumed in a bulky form, but rather mixed with an oxidizing agent and burned in the form of sprays of small droplets. This form of combustion is relevant to a variety of systems that use low-, high-, and atmospheric-pressure combustion. By providing an overview of what has already been said about the above topic, we found that Varshavskii’s ‘Diffusion Theory’ [6,15], due to its limited international visibility, can offer one of the simplest and, on the other hand, most accurate methods for the evaluation of ignition delay of fossil fuel and biofuel droplets, including their blend. Considering new types of liquid biofuel as a fully-fledged alternative in its own capacity to replace DF, the focus of researchers must be on improving the combustion process itself (which is primarily affected by the breakup of droplets and their distribution during spray penetration), especially during the ignition delay period [40]. At a shorter ignition delay time, the fuel burns near the injector and new portions of the fuel enter the mixture of air with the combustion products rather than the hot air zone [40]. Evaluation of the ignition delay of alternative fuel through a global mechanism approach, which accounts for the physical and chemical contributions separately (both usually overlap in time), has shown that in considering the case of uniform duration of the induction phase for fossil fuels and alternative fuels, the chemical delay for the injection of biofuel has an advantage over DF to a great extent due to the higher Cetane number, density, and chemical composition [40]. These assumptions have vital roles in accelerating fundamental research and reimagining its role in providing a more effective way to predict and understand the core systematic processes without the need to perform costly experimental tests or the use of sophisticated analysis techniques (such as CFD), which still require the establishment of some physico-chemical characteristics for the investigated type of fuel [41].

2. Materials and Methods

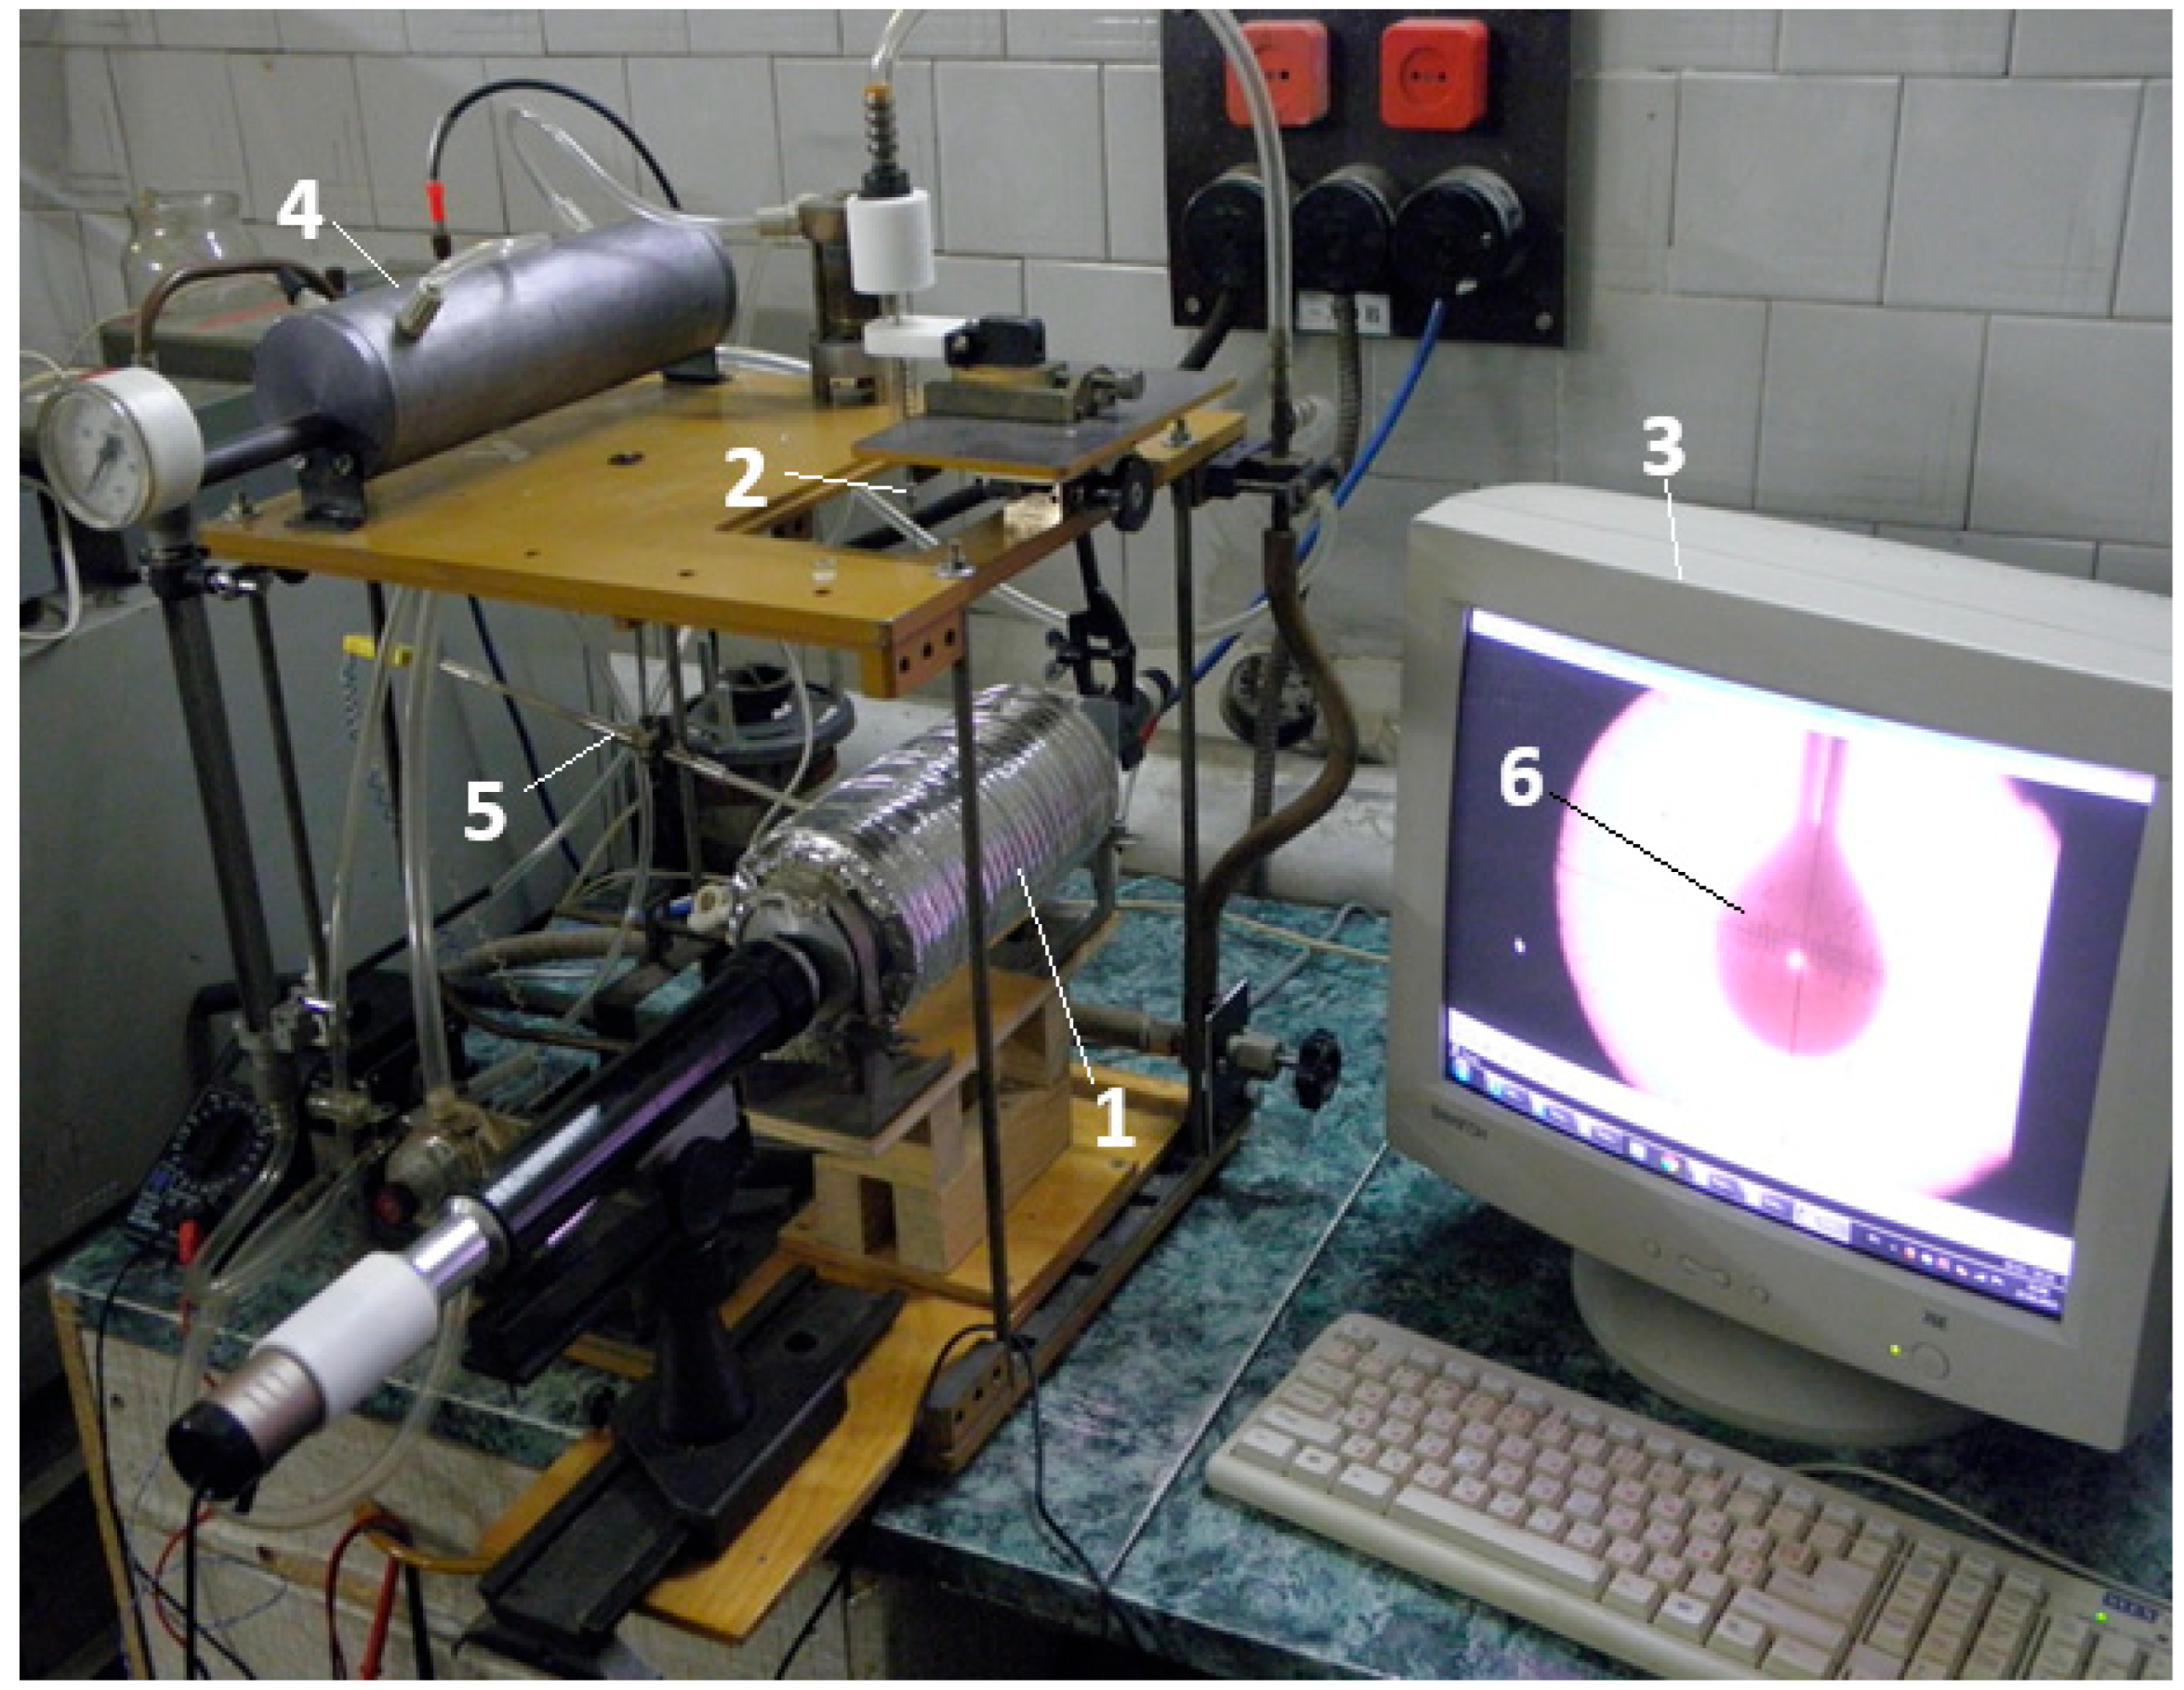
2.1. Description of the Experimental Test

Laboratory equipment for single suspended droplet research, developed by the Odessa National University (Ukraine), was used as shown in Figure 1. Experiments were conducted in an optically accessible constant-volume combustion furnace. The radiation-supported heating conditions of a suspended droplet in a tubular furnace were used for the experiment. If too many experiments were carried out, the vapor pressure of the fuel in the furnace increased and had a negative effect on combustion. To avoid this effect, the air in the furnace was properly changed after every second experiment.
As documented in Ref. [40], during the ignition delay phase, diesel fuel is subjected to an in-cylinder temperature ranging from 960 to 1000 K. The upper limit of this interval for biofuel may reach 1017 K. During the period of physical ignition delay at the aforementioned in-cylinder temperature values, the fuel is atomized to form smaller droplets, then vaporized and mixed with the atmospheric air [40]. For carrying out an experiment, droplets with 2.2 mm diameter of pure and blended fuels were used. The alteration of a droplet radius over time was monitored using the integrated computer imaging system (see Figure 2). Depending on the surface tension characteristics of the tested fuel and the unique in-cylinder temperature range of the diesel engine, the most suitable temperature range for diesel fuel and RME drops was 930–1100 K. The surrounding conditions used in the laboratory during droplet combustion experiments were atmospheric pressure 1005 hPa, ambient temperature 20 °C and relative air humidity 47%.
Test fuels (see Table 1):
  • Diesel fuel (DF) not containing a required 5% biodiesel additive, produced by SC ‘Orlen Lietuva’ refinery (EN 590:2014 [42], KN 27101943, see Supplementary Materials).
  • Rapeseed oil methyl ester (RME) produced by the JSC ‘Rapsoila’, Lithuania.
  • One binary blend: DF80/RME20 (Kaunas University of Technology (Lithuania), Kaunas, Lithuania).
The compound of the B20 blend provided for laboratory droplet combustion experiments was prepared by applying graduated Blaubrand 5.0 mL pipettes (subdivision 0.05 mL, error limit 0.03 mL, Class AS) [28].
The composition of the diesel and biodiesel fuels was determined at the Lithuanian Energy Institute using the standardized gas chromatography technique. The fatty acid composition in % of the tested samples was determined using Clarus 500 (Perkin Elmer, Waltham, MA, USA) gas chromatography (ISO 12966-4:2015 [43]). For chromatographic separation of compounds, capillary column Alltech AT-FAME (30 m long, 0.25 mm–0.25 μm) was used.

2.2. Mathematical Model and Governing Equations

To develop and reorganize the classical ʹDiffusion Theoryʹ originally derived by Varshavskii [6,15], the following assumptions have been considered:
  • The model of the gas phase in the droplet vaporization and combustion is quasi-steady.
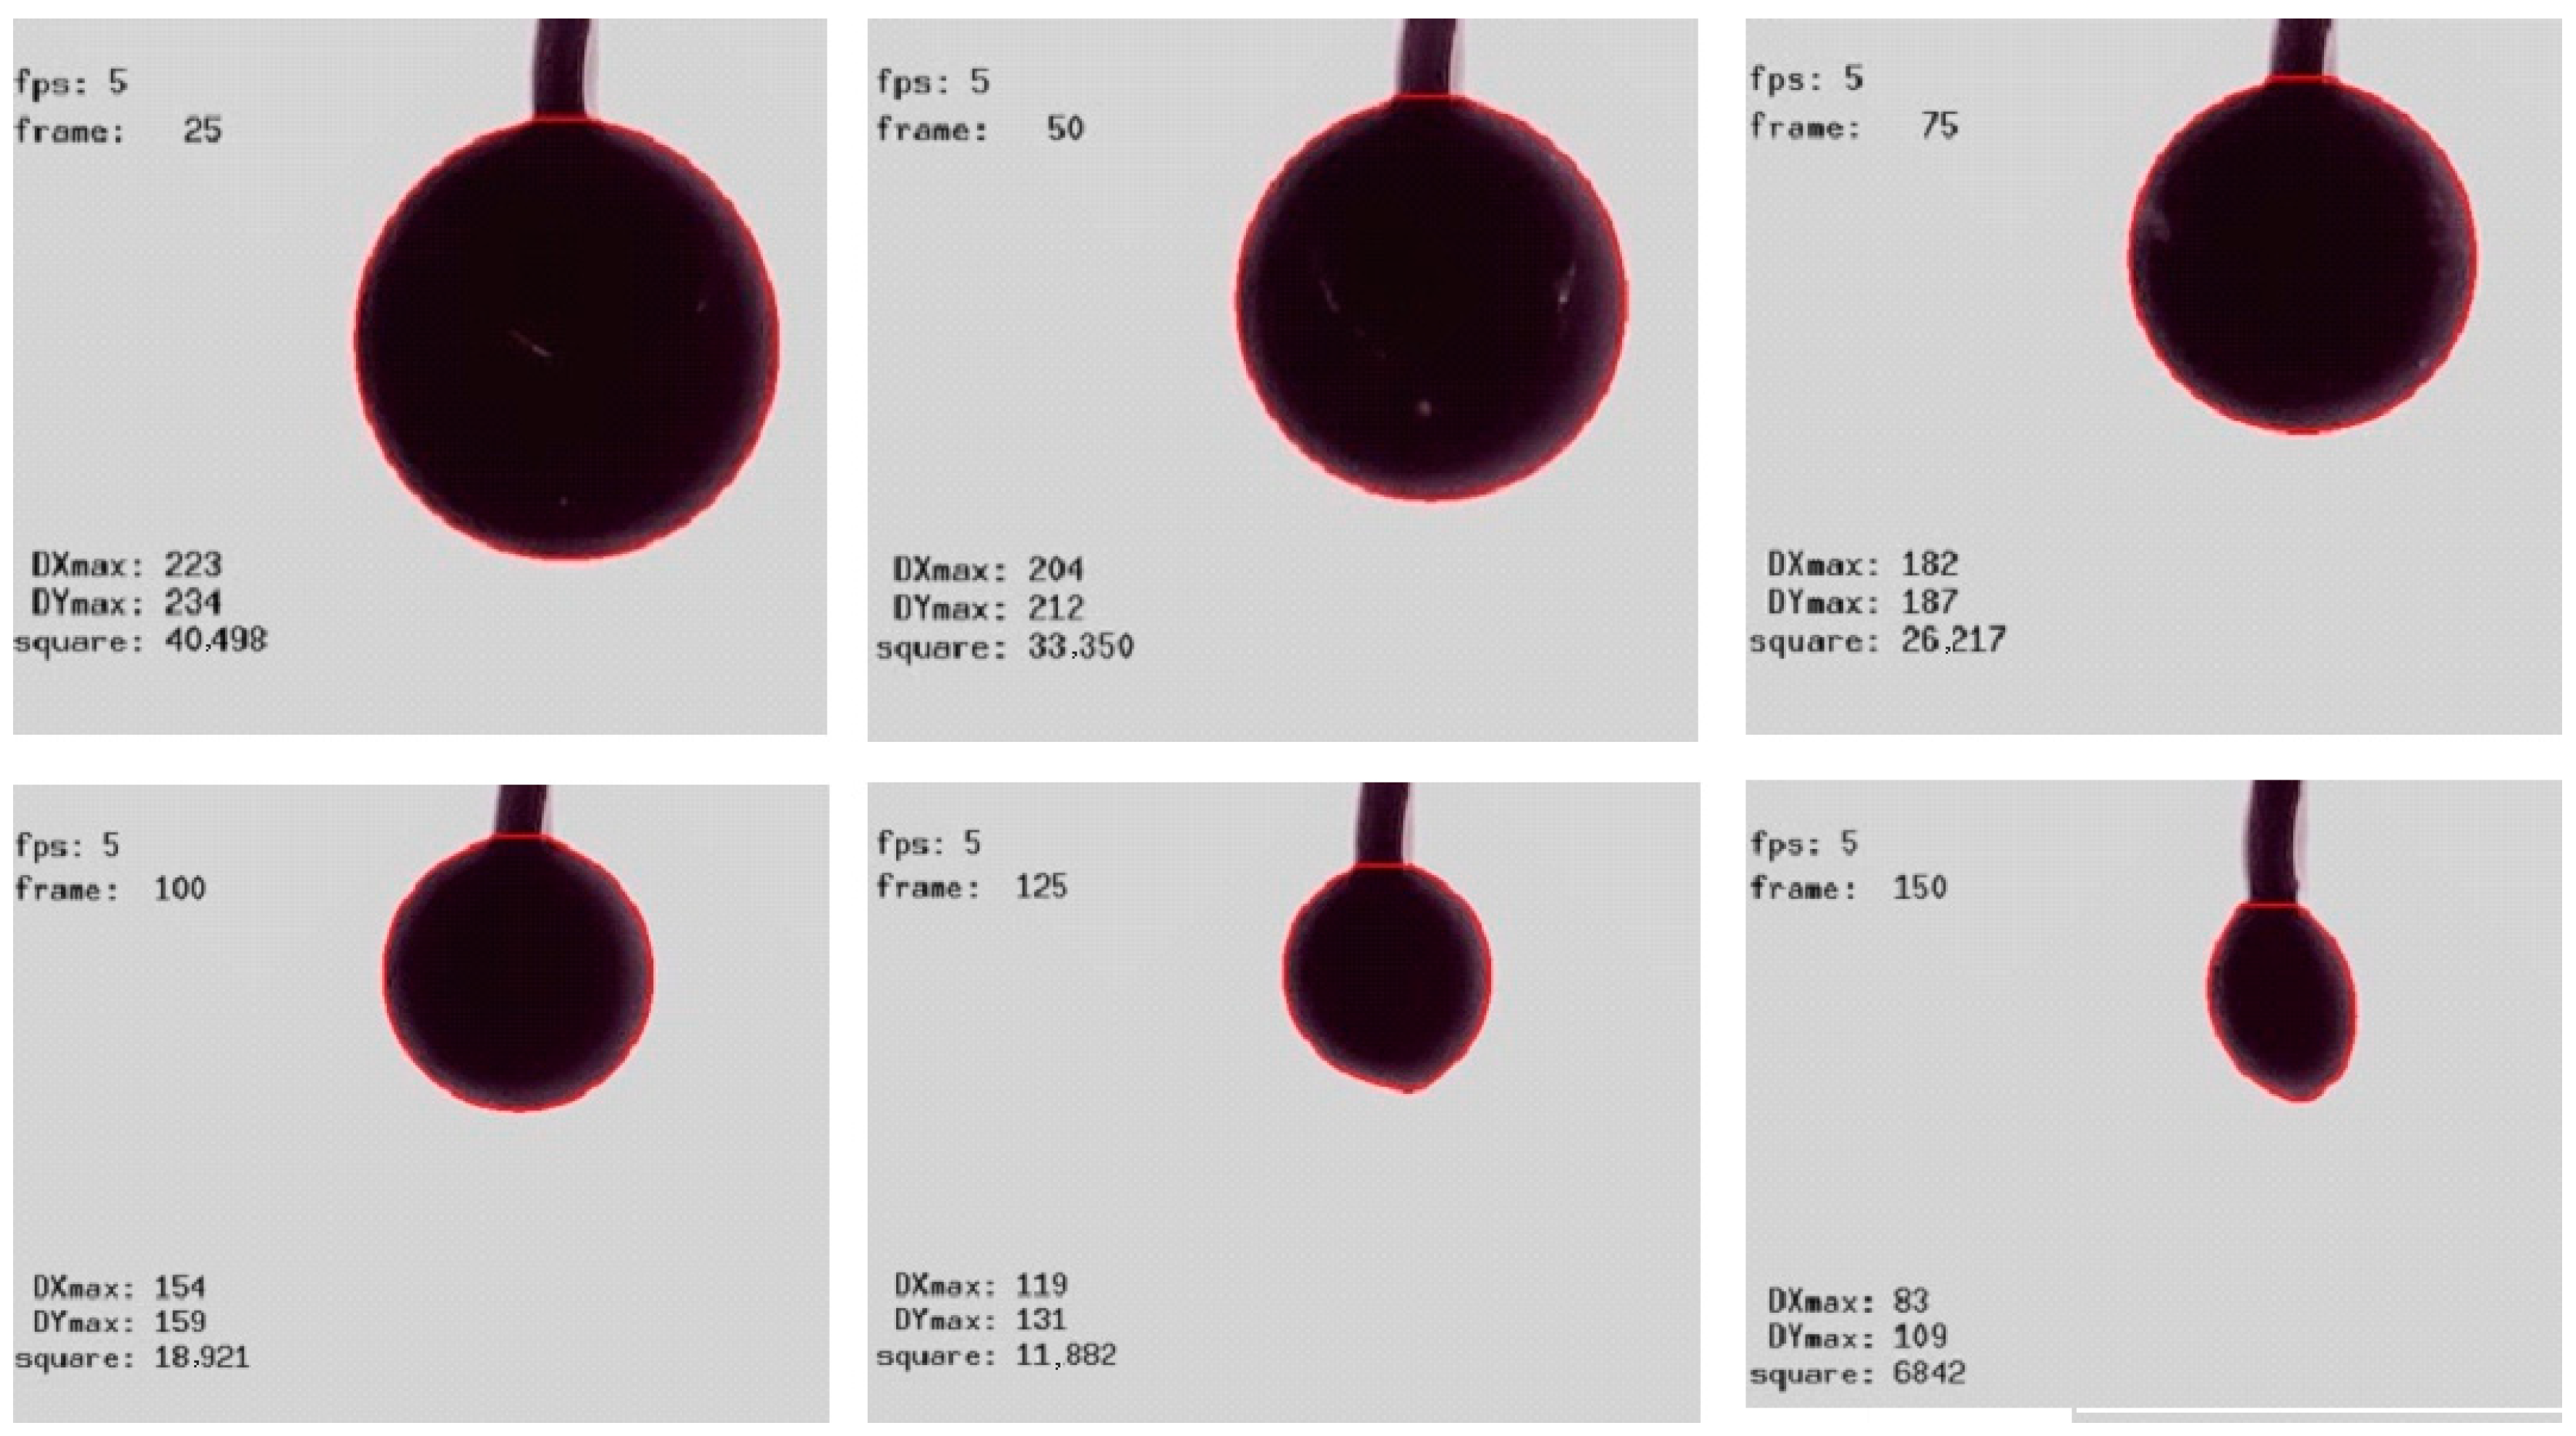
  • The droplet hanging on a thermocouple is spherically symmetrical in shape (see Figure 2). A spherical drop of radius r is surrounded by a flame zone of radius rc. Concentric to the drop, beyond the flame zone, there exists another boundary space. It consists of the ambient atmosphere.
  • During evaporation of the fuel drop (surface), the flame front does not act as a complete separation interface between fuel vapor and air, so that air may penetrate the flame zone. Thus, a hidden energy, namely latent heat, is supplied to change the state of a substance without changing its temperature (this condition does not apply in cases where combustion under critical conditions is considered).
  • Thermal diffusion effects are neglected. The effect of radiation heat transfer from the gas phase or neighboring particles is not considered.
  • The reaction between the fuel and the oxidizer at the flame front is considered stoichiometric.
  • The Lewis number is equal to unity, i.e., the temperature and concentration fields are similar, the thermal physical properties are independent of temperature, and the temperature of the drop over the entire radius is constant at any time.
  • The Nusselt number is equal to 2, i.e., thermal and concentration relaxation times around the drop are very short. Soret and Dufour effects are neglected.
  • Any internal flows in any dimension within the droplet are neglected.

3. Results

3.1. Experimental Tests

One of the main characteristics of any motor fuel, which characterizes the duration of all processes that precede ignition and then accompany combustion, is the lifetime of the droplet. This period, in turn, consists of the chemical ignition delay time of a droplet coupled with its combustion duration. The duration of the main phases of the chemical reaction kinetics for fuel droplets of d0 = 2.2 mm exposed to a high-temperature environment is presented in Figure 3. It is seen that diesel evaporation has the longest ignition delay times (Figure 3a). As biodiesel is used, not only a 16.4% shorter ignition delay was registered at T = 935 K, but at the highest temperature ranges the reduction becomes drastic. The same tendency is distinctive to the 80DF20RME blend. This abrupt event indicates the transition from more volatile diesel-dominated evaporating to one involving less volatile biodiesel. This is the most nonlinear phase of the chemical kinetics reaction. This is because intense flame heating drives the droplet surface temperature close to the boiling point of the surface components, at which the volatility of the fuel loses its sensitivity to the vapor concentration of the fuel at the surface and thereby the gasification rate of the fuel [34].
Figure 3b shows the combustion times for diesel, biodiesel, and their blend. It is clear that the combustion times of biodiesel droplets are slightly higher than those of diesel because of its lower heat content and higher boiling point. The combustion times of the blend are close to those of diesel fuel, with a slight increasing trend as RME is added. It is interesting to note that although the lifetimes of DF and RME droplets are highly comparable, the ignition delay time and combustion duration for these substances are related differently. If the ignition delay times for the RME droplets are shorter than those of the DF droplets, then the times of combustion for the RME droplets are longer than those of DT. In other words, the RME droplet ignites earlier than a DF droplet, but its burning time is longer. The state transition is classified in our study into transitions between non-combustion (evaporation) to combustion states, i.e., ignition and extinction (see Figure 3c).

3.2. Mathematical Model

A droplet of liquid fuel with radius r0 was analyzed in a stationary heated stationary oxidizing environment with its gas temperature T∞ (Figure 4).
The ignition process of a spherically symmetric droplet begins at the point r = r1 (see Figure 4b) where the speed of a chemical reaction exceeds its maximum W(T). A second–order chemical reaction of fuel oxidation can be written as follows [6,15]:
W = k 0 c 1 c 2 exp E R T
It was assumed that until the ignition vapor of the droplet and the oxidizer mix in the correct stoichiometric ratio. The flame separates the fuel and the oxidizer (which is usually air) and occurs at the ϕ = 1 (stoichiometric condition). The reaction rate is controlled by the molecular diffusion of the reactants toward the reaction zone. For the case of hydrocarbon fuel droplet combustion in air, the reaction is respectively described by
C x H y + x + y 4 O 2 + 3.76 N 2 x C O 2 + y 2 H 2 O + 3.76 x + y 4 N 2
In this situation, the air properties are obtained from the databases listed in Ref. [44]. The mole fractions can be estimated from the reactants. The coordinates of the ignition point of the evaporating droplet could be established from the common solution of a two-equation system [6,15]:
W r = 0 ;   p 1 = ϕ p 2
Differentiating Equation (1) and taking an expression of the stoichiometric ratio (Equation (3)), we derive a sum of two components. The first could be established from the partial pressure around the droplet and the second from the distribution of the vapor temperature [6,15].
2 p 1 k 0 ϕ exp E R T p 1 r + p 1 2 E R T 2 k 0 ϕ exp E R T T r = 0   or   2 p 1 p 1 r + E T R T 2 r = 0
In this model, because of the infinite rate assumption, the flame zone is of infinitesimal thickness and would thus be represented by a surface rather than an extended reaction zone. Generally, it is necessary to ensure that the fuel and oxidant diffuse to the reaction zone in stoichiometric proportions, and again, because of the infinite reaction rate assumption, their concentrations become zero at the reaction interface. When these approximations are made, an analytic solution may be obtained. The forms of the final equations depend on the exact method of solution [6,15]:
r 1 r 0 = 1 T 0 T exp 3 λ g a s τ i g n ρ c p l i q r 0 2 1 E 4 R T 1 + 8 R T E 1
Before further algebraic modifications, interim steps were undertaken to assess (i) gas thermal conductivity of the vapor phase for fossil fuel and biofuel, including their blend, (ii) critical temperature and pressure of hydrocarbon fuels, (iii) viscosity of the hydrocarbon fuels, and (iv) specific heat capacities of hydrocarbon fuel vapors.

3.2.1. Determination of Thermal Conductivity of the Vapor Phase

Diesel fuel is made up of a mixture of several different hydrocarbons, such as paraffins, aromatics, and naphthene, and biodiesel is composed of mono-alkyl esters of long-chain fatty acids. It is possible to determine the thermal conductivity of a gas from the process in which the excited state of a molecule transfers energy to another molecule, or alternatively, from the internal friction values or from the heat diffusivity. At low pressures and constant volume, it depends on the distance molecules travel between collisions, the average molecular speed, the gas density, and the specific heat capacity of a substance:
λ g a s = 1 3 c V ρ w ̄ l ̄
The dynamic viscosity of the gas was determined with the following formula:
μ = 1 3 ρ w ̄ l ̄
Dividing Equation (6) by Equation (7), the following expression was obtained:
λ g a s = μ c V   λ g a s = K μ c V
The formula derived by Misic and Thodos [44], which was used to determine the thermal conductivity of methane, petroleum and aromatic hydrocarbons at low pressures 0.2 < p < 5   a t   and temperatures below its critical values, can be written as
λ g a s = 0.445 1 0 5 C p g a s Λ T T c r
For all other hydrocarbons with temperatures exceeding 0.6 T c r , thermal conductivity was calculated using the formula
λ g a s = 14.52 T T c r 5.14 2 3 c p g a s Λ 1 0 6
According to the authors, the average error in calculating the thermal conductivity using Formula (10) varies from 1.8% to 2.6%. Furthermore, the method proposed by Misic and Thodos [44] was also used to establish the thermal conductivity value of diesel fuel gases at T = 293   K , whose value was equal to λ g a s = 95.72 1 0 4 W/(m·K). In practice, the thermal conductivity of gases is often determined from the expression of the Prandtl criterion P r = c p g a s μ / λ g a s . Alternatively, this criterion can be determined using the formula given in [15]:
P r = c p g a s c p g a s + 2.46
When the molecular weight of the gas is relatively small (M < 15), the values calculated using this formula agree quite accurately with the results of the experimental studies. Vargaftik [45] derived an analogous relationship that allows one to calculate the thermal conductivity of materials of high molecular weight:
P r = c p g a s 1.204 c p g a s + 1.47
The average error in calculating the molecular weight using Formulas (11) and (12) does not exceed 15% [15]. The result of the calculation using Equation (12) obtained for RME was P r = 0.819 . The mathematical expression λ g a s = c p g a s μ P r used for the assessment of the thermal conductivity of RME at T = 293   K shows the calculated result of λ g a s = 64.35 1 0 4   W / ( m · K ) , whose numerical value is very similar to that obtained using the equation proposed in [15]. Refs. [15,45] propose an empirical equation for the evaluation of fuel mixtures if their components have only slightly different molecular weights ( M 1 M 2 < 4 ):
λ m i x = λ 1 g a s x 1 + λ 2 g a s x 2
The inverse of thermal conductance can be obtained by employing Equation (14):
1 λ m i x = x 1 λ 1 g a s + x 2 λ 2 g a s
Brokaw and O’Neal [46] have noticed that when calculating a mixture composed of two fuels according to the Equation (13), higher values λ m i x = x i λ i g a s are obtained compared to those determined experimentally, and Equation (14), in contrast, leads to lower λ m i x = x i λ i g a s values. Thus, the authors proposed an empirical formula that allows for obtaining values close to experimental results:
λ m i x = a m i x x i λ i g a s + 1 a m i x 1 x i λ i g a s
For blended fuels, Brokaw and O’Neal [46] recommend the coefficient a m i x = 0.5 . According to their estimates, the average error for gaseous mixtures containing H2 or He varies from 2.6 to 11.4%. For the assessment of the thermal diffusivity of fuel mixtures, Cape and Lehman propose relying on the diagrams published in [47]. In the case where the molecular weights of the components are similar ( M 1 M 2 < 4 ), the choice of the right formula for precise calculations depends on the possibility of assessing the molecular polarity that makes up a particular mixture. If the degrees of molecular polarity of the components are similar, the Additivity Rule can be applied (5.8). For mixtures containing polar and nonpolar molecules, Cape and Lehman [47] suggest the following equation:
λ m i x = x i λ i 1 + x p o l x p o l 2 3.5
As indicated in Ref. [47], the maximum calculation error according to Equation (16) does not exceed 5.1%. Considering that the dipole moment values of diesel fuel and RME molecules are similar, and the ratio of their molecular weights is M 1 M 2 < 4 , then, according to [47] recommendations, the Additivity Rule can be applied to calculate the thermal conductivity of fuels (gas phase) comprising a mixture (4.8). For a fuel mixture of 80% MD + 20%RME ( x 1 = 0.8 ; x 2 = 0.2 ), at T = 293 K, when the thermal conductivity for diesel fuel is λ 1 g a s = 95.72 W/(m·K), and for RME is λ 2 g a s = 66.46   W /(m·K), λ m i x = 92.78 W/(m·K).

3.2.2. Determination of the Critical Temperature and Pressure of Hydrocarbon Fuels

Methods for calculating the thermophysical properties of liquids and gases are often described in the works of scientists [45,48]. For these calculations, it is necessary to know their critical parameters. The critical temperatures for hydrocarbon fuels are usually found using the Thomas and Smith method [48]. The formula derived by the authors is often used for viscosity assessment when the liquid temperature T l i q < 0.7 T c r . Knowing the viscosity of the liquid when the temperature values satisfy the conditions mentioned above, we calculate the critical temperature by solving the inverse problem (Table 2):
T c r = T l i q 1 θ lg 8.569 μ ρ + 1
Using this method, Sherwood and Reed [49] have found that there was a ± 15 % probability of calculation error for large molecular compounds such as polycyclic aromatic hydrocarbon molecules and ethers. The critical temperature T c r = 716.5   K for RME was calculated according to the method proposed by Thomas and Smith [48]. Other input parameters were μ = 5   cP, ρ = 0.9 g/cm3, T = 313.2   K and θ = 1.285 . The boiling point of a substance can also be calculated using the Law of Additivity ( θ = T b   T c r ), so it is easy to find the value of the critical temperature of a liquid, knowing its boiling point and structural formula. When applying this method, the coefficient θ was calculated using empirical formulas. In the present work, the Lydersen method [50] was used to determine the boiling point of the RME, as this method is highly accurate (Table 3):
θ = 0.567 + Δ θ + Δ θ 2
Considering that the boiling point of RME is T b = 610 K and θ = 0.8080 , the critical temperature T c r = 755 K was determined from the relationship θ = T b T c r . The value T c r = 785.7 K was determined according to the recommendations provided in [48,50]. It has close analogies to the results obtained by other researchers who also investigated different types of fuel, which consisted of molecules of the same chemical composition, but different molecular structure [51]:
T c r = 355 + 0.97 a 0.00049 a 2
where a = 1.8 T 50 359 ρ 15 15 . Equation (19) was used to determine the critical temperature of a diesel fuel fraction that led to the result of T c r = 739.4 K. In the calculation, the evaporation temperature of the 50% mineral diesel fraction was chosen. The evaporation temperature of the 50% diesel fuel fraction was assumed to be equal to T 50 = 553   K and ρ 15 15 = 0.8607 . A value of T c r = 737.6   K, which is very close to that calculated using Equation (19) was obtained using the nomogram approximation method [52]:
T c r = 189.83 + 450.6 ρ 15 15 + 0.4244 + 0.1174 ρ 15 15 T 50 + 0.1441 1.0069 ρ 15 15 1 0 5 T 50
The critical pressure of the RME was calculated using the Lydersen method [50] and the data presented in Table 4:
p c r = M ( Φ + 0.34 ) 2
where Φ = Δ Φ .
According to Equation (21), the pressure required to liquify an RME vapor at its critical temperature is p c r = 1.236 MPa (12.6 at). Alternatively, a critical pressure for oil fractions, measured in MPa, can also be obtained using the equation [45]:
p c r = 0.1 k T c r M 1
where k = 5.53 + 0.855 T 70 T 10 60 K. The distinctive temperatures T 10 ir T 70 for diesel fuel at M = 226.43 ; T c r = 739.4   K, k = 7.05 , and p c r = 2.3 MPa were 473 K and 580 K, respectively. A slightly lower value of the critical pressure for diesel fuel p c r = 1.9 MPa ( 19.37 at) was obtained by approximating calculations according to nomograms:
ln p c r = 3.3864 0.0566 ρ 15 15 0.43639 + 4.1216 ρ 15 15 + 0.21343 ρ 15 15 2 1 0 3 T 50 + + 4.7579 + 11.82 ρ 15 15 + 15302 ρ 15 15 3 1 0 7 T 50 2 2.4505 + 9.901 ρ 15 15 2 1 0 10 T 50 3 .
As the Ref. [52] states, when calculating the critical pressures according to Equation (23), deviations of 3 to 4%, sometimes reaching 10%, are possible.

3.2.3. Determination of the Dynamic Viscosity of Hydrocarbon Fuels

The kinetic theory developed by Chapman and Enskog [53] can be widely used to estimate the critical viscosity of liquids:
μ = 0.499 ρ w ̄ l ̄
Based on the reference equation, Falkovskii [54] proposed an expression which is more precise for the assessment of the dynamic viscosity of the fuel at lower pressure values:
μ = 1.286 1 0 4 M 1 2 p c r 2 3 T c r T
According to some sources in the literature [48], the calculation error using this formula does not exceed 5%. At T = 288 K, dynamic viscosity of RME vapor μ = 4.54 1 0 6 Pa·s ( 0.00454   cP). This value was obtained for p c r = 12.6 at, T c r = 755 K and M = 292 and is in good agreement with the physical and thermochemical properties of vegetable oil biodiesel fuel ( μ = 4.4 1 0 6 Pa·s at T = 298 K) estimated in ref. [55]. A similar result was obtained during the assessment of the dynamic vapor viscosity for RME using the formula proposed by Flynn and Thodos [55], which was adopted to meet a precondition of T 1.5 T c r and demonstrated the calculation outcome of μ = 4.21 1 0 6 Pa·s ( 0.00421   cP):
μ = 34 1 0 5 M 1 2 p c r 2 3 T c r 1 6 T T c r 0.94
The dynamic viscosity usually varies slightly with pressure, but more with temperature. Dynamic viscosity value for diesel fuel μ = 2.44 1 0 6 Pa·s at T = 313 K was adopted from ref. [56].

3.2.4. Determination of the Specific Heat Capacities of Hydrocarbon Fuel Vapors

Determining the specific heat capacities of the hydrocarbon fuel vapors at constant pressure does not cause any major difficulties if the dependence of enthalpy on temperature H T is known. Then
c p g a s = H T p
The variables required to build the dependence of H T in the temperature range of 323 K to 823 K and having different values of relative density ρ 15 15 can be found in [56,57]. After performing H T calculations for RME vapors having a relative density value ( ρ 15 15 = 0.91 ), an outcome of c p g a s = 1.630 J/(g·K) was obtained for a temperature of 323 K. For the assessment of the specific heat capacities of paraffinic combustible hydrocarbon liquids that are derived from petroleum and have relative densities ρ 15 15 = 0.68 ÷ 0.90 , the following equation can be used [57,58]:
c p g a s = 4 ρ 15 15 1541 1.8 T + 211
According to the proposed expression, the specific heat capacity values of c p g a s = 2.12   J / ( g · K )   were obtained for diesel fuel at T = 323 K. Very good correspondence between the obtained value and the calculation output presented in ref. [56] is more than evident.

3.2.5. Derivation of the Simplified Equation for the Assessment of the Ignition Delay

Assuming that t→0, the distance from the ignition point ( r 1 / r 0 ) could be written as follows [28]:
r 1 r 0 = 1 T 0 T 1 E 4 R T 1 + 8 R T E 1
Based on Equations (5) and (29):
r 1 r 0 exp L R T 1 L R T b = 1 ϕ + 1
It is evident that the ignition delay depends on both the distance from the ignition point (r1/r0) and the temperature of the droplet surface at the moment of ignition (T1):
T 1 = T T T 0 exp 3 λ g a s τ i g n ρ c p l i q r 0 2
Appreciating this, the fact that τign serves as the basis of the Equation (31) could be maintained [28]:
L R T 1 Y + ln Y 1 T r 1 T = ln 1 ϕ + 1 + L R T b
where Y = 1 T 0 T exp 3 λ g a s τ i g n ρ c p l i q r 0 2 .
Taking advantage of comparable occasions of the classical theory of combustion-based Q–S droplet ignition models [6,15], we have derived a basic expression for calculations of ignition delay of proposed types of fuel and their blends:
τ i g n = ρ c p l i q r 0 2 3 λ g a s 1 1 θ 0 1 T 0 T R T b L ln ϕ E θ 0 R T 1 R T b L ln ϕ E θ 0 R T
Assuming that R T b L ln ϕ E θ 0 R T < < 1 , Equation (33) can be rewritten as
τ i g n = ρ c p l i q r 0 2 3 λ g a s T b T 0 T T 0
Calculation can be simplified by leaving out the exponential dependence Y(τign) out:
τ i g n = ρ c p l i q r 0 2 3 λ g a s ln 1 T 0 T 1 T b A * T
where A * = 1 R T b L ln 1 T 0 T 1 T r 1 T ϕ 1 + ϕ .
It was established by calculations of the n-octane droplet that A* depended little on the temperature and in the case of droplet ignition its value was close to one (Figure 5). Now we put the final expression of the equation to calculate the ignition delay as follows:
τ i g n = ρ c p l i q r 0 2 3 λ g a s ln T T 0 T T b

4. Discussion

Figure 6 shows the comparison of the experimental vs. simulation outcomes of the droplet ignition delay assessment.
As can be seen from the juxtaposition of the experimental and simulation outcomes (Equation (36)), very good agreement was obtained between the ignition delay values for both DF and RME, including their blend. The greatest difference between the experimental and simulated values was obtained in a range of ambient temperature between 980 and 990 K for diesel fuel. This may be associated with the strong nonlinear character of the kinetic factor for diesel fuel and RME before reaching the inflammation temperature. Apparently, in the case of DF, the degree of influence of the kinetic factor on the process of ignition of the vapors surrounding the droplet is greater than that of RME (the process of combustion of the droplet occurs in a relatively slow diffusion mode). This work also provides the methodology for developing realistic droplet vaporization/ignition model with a simplified approach, which is not too complicated or oversimplified. The main physico-chemical characteristics of the test fuels, which were established in this study, are presented in Table 5. In this case, the disparity in values reaches 10–11%. For the remaining temperatures, the difference between the experimentally established values and the simulation result varies in the range of 1–13%. The error range in single droplet combustion modelling can vary significantly, but, according to an overview of previously published works on a particular topic, a common range for deviations between model predictions and experimental results is within 15%. However, some studies report errors as high as 21% under specific conditions. The sensitivity of the simulation results for DF80/RME20 vis-à-vis experimentally obtained values for the same blend has shown the highest level of correspondence of r = 0.91–0.98 throughout the temperature range, as presented in Figure 6. It should be mentioned that all the data points generated by a model for T = 990 K demonstrated the highest discrepancy in values (r = 0.87–0.91) if compared to the experimental results. This phenomenon can be associated with a prolonged time of evaporation for DF and a slightly higher mass of the RME droplet due to its higher density. In terms of simulation accuracy evaluated for six different temperatures, the ignition delay values for different fuels arranged in decreasing order DF80/RME20 (r = 0.98 (2), r = 0.96 (2), r = 0.92 (1), r = 0.91 (1)) > DF (r = 0.99 (1), r = 0.96 (2), r = 0.95 (1), r = 0.92 (1), r = 0.90 (1)) > RME (r = 0.95 (2), r = 0.92 (1), r = 0.91 (2), r = 0.87 (1)).
Based on the quasi-stationary model of the inertial heating of a hydrocarbon fuel droplet, an equation has been derived for calculating the ignition delay, which is applied to assess the ignition characteristics of combustible mixtures and predicting the possibilities of their use in the conventional industrial burners designed for premixed flames. It has been established that the calculations of the ignition delay period of diesel fuel and rapeseed methyl ester droplets using the quasi-stationary combustion model agree well with the results of experimental studies within the selected range of temperatures, up to 1010 K. This value exceeds the critical ignition temperature of the RME by 294 K. The described model can be applied to calculations in the case where the temperature values of the oxidizer surrounding the drop are equal to the ambient temperature and significantly exceed its critical ignition temperature, both.

5. Conclusions

Simplified solutions are derived and have been shown to closely approximate the bulk vaporization behavior described by the more detailed theory, particularly for the prediction of the total vaporization time [15]. It is also demonstrated that the behavior of hydrocarbon droplets of modern fuels and their blends during vaporization and ignition processes can be adequately estimated by using the simplified solutions of Varshavskii’s ʹDiffusion Theoryʹ offered by this model. These results qualitatively agree with experimental observations, implying that the various assumptions of the model that the influence of the kinetic factor exists are realistic. Finally, the model proposes a modified and accurate approach to ignition delay studies considering the difference in the gas phase diffusivity of diesel fuel and RME vapors. Comparison with experimental data shows that the proposed equation can accurately predict the ignition delay of a binary droplet. With the assumption that droplets can serve as moving flameholders within the injected spray, some insights about droplet vaporization during the ignition delay can also be formulated. From the present study, it is evident that the blend vaporizing time can be reduced by either increasing the ambient temperature or decreasing the droplet size. Along with the above, the following conclusions can be drawn:
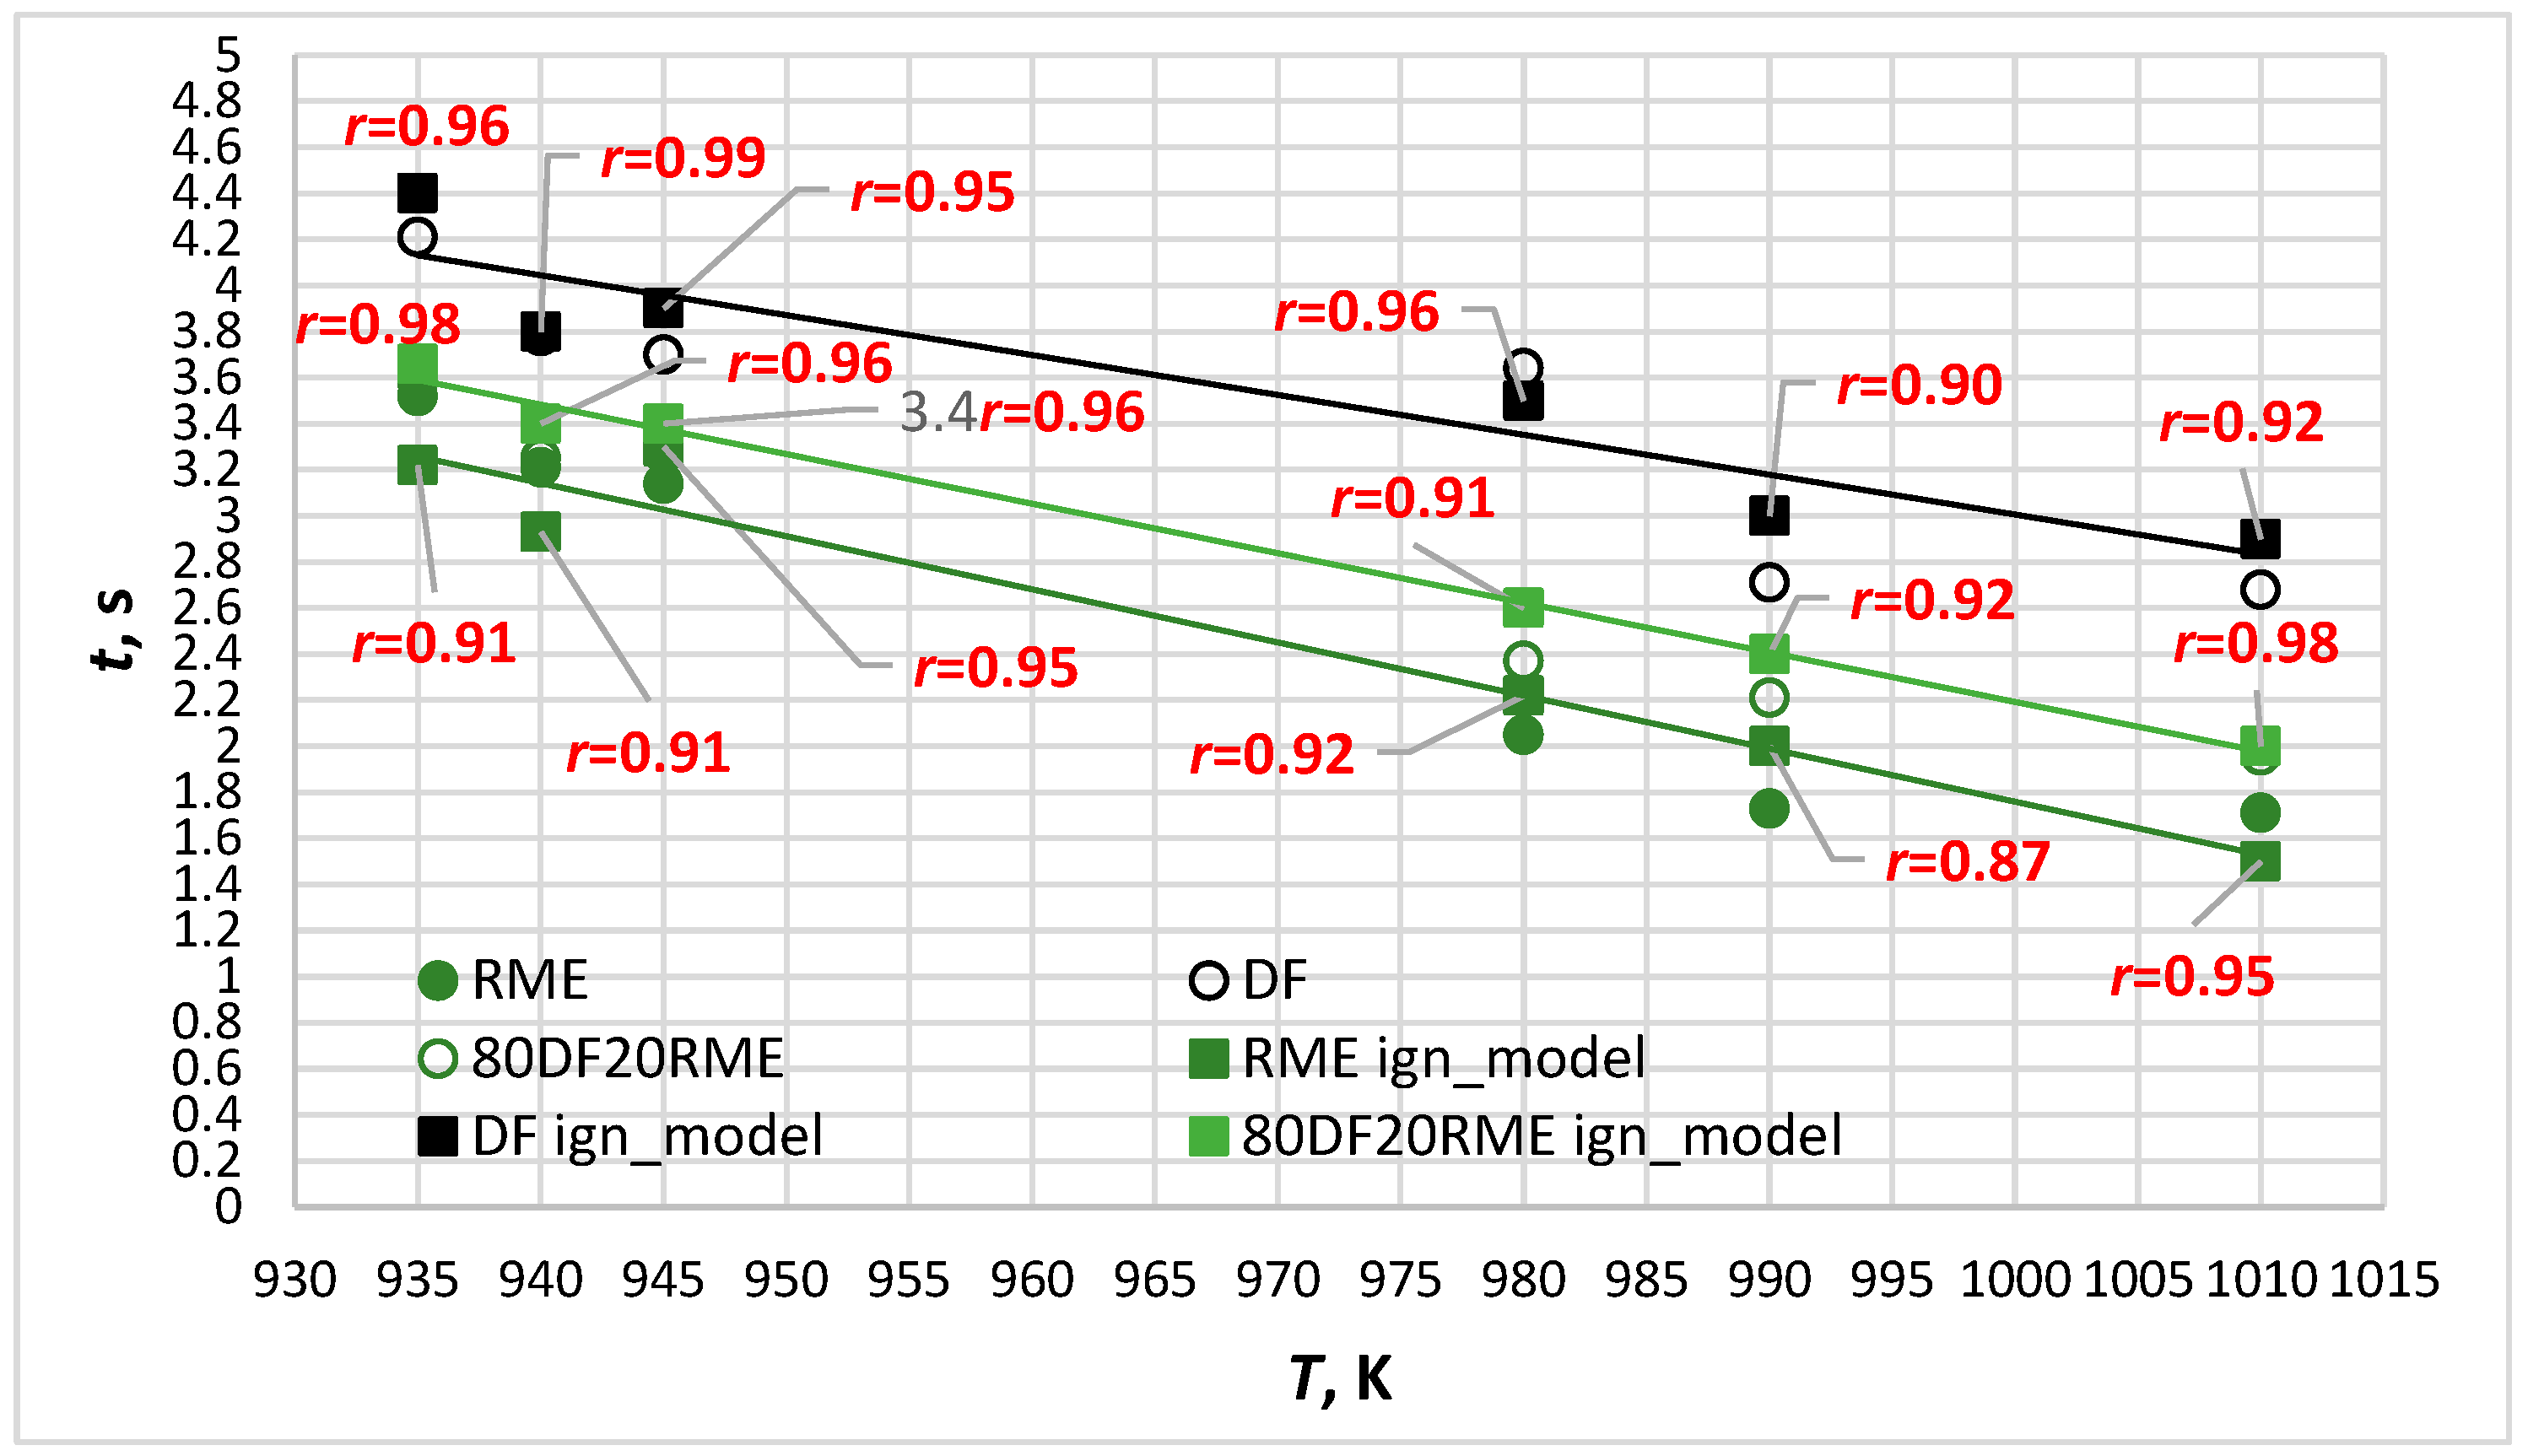
  • Single droplets of biodiesel, diesel and their 20% blend were suspended in a relatively static environment with an ambient temperature of 935 K to 1010 K to validate the model proposed in this paper. The semi-theoretical model can well describe the droplet ignition delay and the error between the predicted results, and the experimental data are within 1–13%.
  • The upper limit of the temperature range for this experiment exceeds the critical ignition temperature of the RME by 294 K.
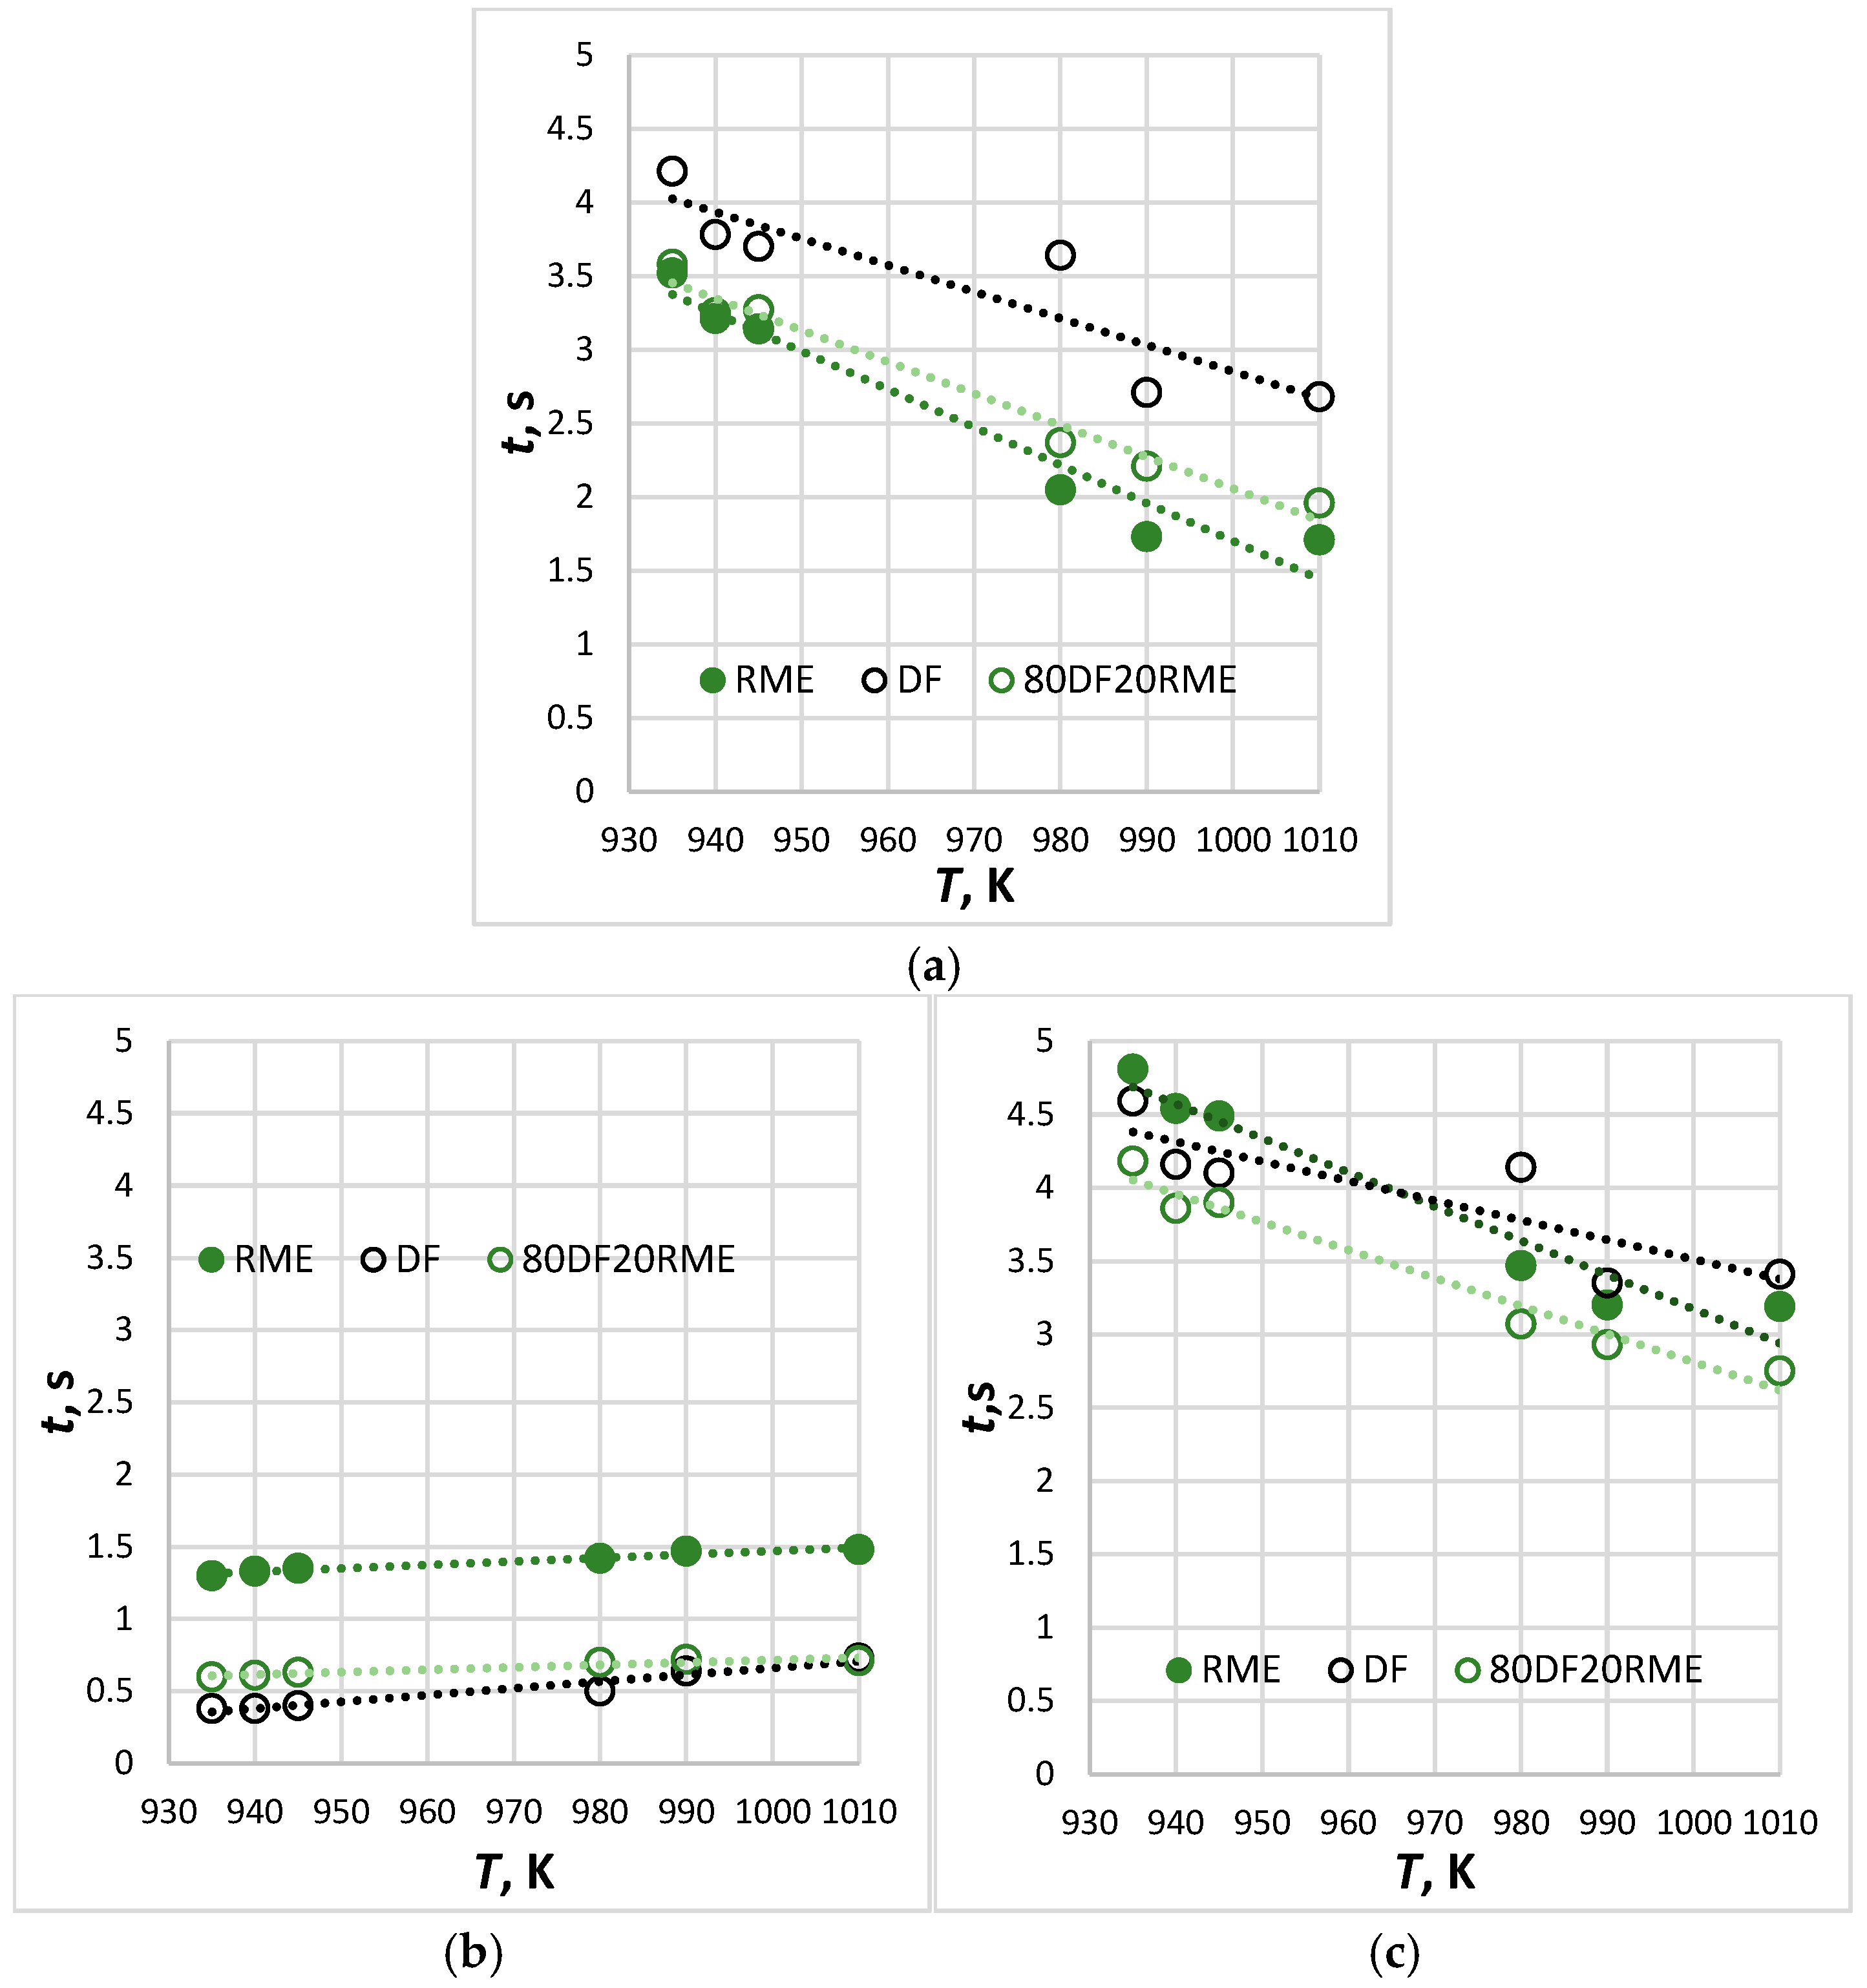
  • The longest ignition delay was established for diesel fuel and the shortest for RME, while blended fuel exhibited intermediate values. The time of combustion followed the opposite trend: fuels that exhibit longer ignition delays had shorter periods of combustion. This can be explained by the fact that the initial fuel mass per droplet from the thermocouple correlates with the fuel density and viscosity (see Table 2), i.e., biodiesel mass > diesel mass.
  • In terms of simulation accuracy assessed for six different temperatures, the average level of correspondence of the ignition delay values with the ones experimentally obtained for different types of fuel arranged in decreasing order: DF80/RME20 (average r = 0.95) > DF (average r = 0.95) > RME (average r = 0.92).
The data presented here can be used to predict or verify the ignition characteristics of yet less-investigated alternative fuels, such as microalgal oil blended with diesel fuel. The future scope of this study is primarily focused on the integration of the obtained findings to analyze the liquid jet atomization and the breakup of droplets of different alternative fuels.

Supplementary Materials

The following supporting information can be downloaded at: https://www.mdpi.com/article/10.3390/app15137488/s1.

Funding

This research received no external funding.

Institutional Review Board Statement

Not applicable.

Informed Consent Statement

Not applicable.

Data Availability Statement

The original contributions presented in this study are included in the article. Further inquiries can be directed to the corresponding author.

Conflicts of Interest

The author declares no conflicts of interest.

Abbreviations

Latin symbols
A*dimensionless coefficient
acoefficient
amixcoefficient, the size of which depends on the molar fraction of the lighter component in the mixture
c1fuel–vapour molar concentration
c2oxidizer’s molar concentration
c10fuel–vapor molar concentration of the drop surface (at the moment of ignition)
c p g a s specific heat capacity of vapor
c p l i q specific heat capacity of liquid fuel
cvconstant-volume specific heat
d0initial drop diameter
Eactivation energy
Henthalpy
Kdynamic modulus (Maxwell)
kcoefficient
k0temperature independent rate constant
Llatent heat of vaporization
l ̄ average distance between collisions for a molecule
LeLewis number
M1, M2molecular weights of the components in a gaseous mixture
NuNusselt number
p1partial pressure of the fuel–vapor
p2partial pressure of the oxidizer
PrPrandtl criterion
rradius
Runiversal gas constant
r0initial drop radius
r1distance to the zone, where chemical reaction begins
rcradius of a flame zone
ttime
Ttemperature
T10temperature at which 10% of the oil fraction evaporates
T50temperature at which 50% of the oil fraction evaporates
T70temperature at which 70% of the oil fraction evaporates
Tcrcritical temperature
T:temperature (K)
T0droplet temperature at initial time moment
T1temperature of the drop surface at the moment of ignition
Tambient temperature
Tliqtemperature of a liquid
Tbboiling temperature
Wrate of a chemical reaction
w ̄ average molecular speed
xnumber of carbon atoms in fuel molecule
xM (1, 2, 3… i)molar fractions of the components of a gaseous mixture
xMpolsum of the mole fractions of the polar components in a mixture
ynumber of hydrogen atoms in fuel molecule
Ydimensionless constant
Greek symbols
θ0temperature tensions between droplet surface and environment
summative coefficient
Λdimensionless coefficient
Λmixthermal conductivity of gaseous mixture
λgasthermal conductivity of fuel–vapor
μdynamic viscosity
ρdensity
ρ 15 15 relative density of a liquid (at T = 15 K)
τignignition delay time
φstoichiometric coefficient
Φsum of the parts of atoms, groups, and bonds
DFdiesel fuel
RMErapeseed methyl ester

References

  1. Kohler, R.E., Jr. The origin of Lavoisier’s first experiments on combustion. Isis 1972, 63, 349–355. [Google Scholar] [CrossRef]
  2. Kambas, L. Antoine-Laurent Lavoisier’s ‘Sur la nature de l’eau’: An annotated English translation. Ann. Sci. 2025, 82, 102–132. [Google Scholar] [CrossRef]
  3. Semionov, N.N. Zur Theorie des Verbrennungsprozesses. Z. Phys. 1928, 48, 571–582. [Google Scholar]
  4. Zeldovich, Y.B.; Semenov, N.N. Kinetics of chemical reactions in a flame. J. Exp. Theor. Phys. 1940, 10, 1116–1136. [Google Scholar]
  5. Zeldovich, Y.B.; Franz-Kamenetsky, D.A. Theory of thermal flame propagation. J. Phys. Chem. 1938, 12, 100–105. [Google Scholar]
  6. Varshavskii, G.A. Diffusion Theory of Droplet Combustion; Trudy BNT NKAP: Moscow, Russia, 1945; pp. 87–106. (In Russian) [Google Scholar]
  7. Godsave, G.A.E. Combustion of droplets in a fuel spray. Nature 1949, 164, 708–709. [Google Scholar] [CrossRef] [PubMed]
  8. Godsave, G.A.E. The Burning of Single Drops of Fuel, Parts 1 and 2. National Gas Turbine Establishment. Reports No. R66 (March 1950) and R87 (April 1951). Available online: https://apps.dtic.mil/sti/tr/pdf/AD0041743.pdf (accessed on 12 April 2025).
  9. Godsave, G.A.E. Studies of the combustion of drops in a fuel spray-the burning of single drops of fuel. Symp. Combust. Proc. 1953, 4, 818–830. [Google Scholar] [CrossRef]
  10. Kumagai, S.; Isoda, H. Combustion of fuel droplets. Nature 1950, 166, 1111. [Google Scholar] [CrossRef]
  11. Spalding, D.B. The combustion of liquid fuels. Symp. Combust. Proc. 1953, 4, 847–864. [Google Scholar] [CrossRef]
  12. Ulzama, S.; Specht, E. An analytical study of droplet combustion under microgravity: Quasi-steady transient approach. Proc. Combust. Inst. 2007, 31, 2301–2308. [Google Scholar] [CrossRef]
  13. Faik, A.M.E.-D. Quantitative Investigation of the Multicomponent Fuel Droplet Combustion Using High Speed Imaging and Digital Image Processing. Ph.D. Thesis, University of Sheffield, Sheffield, UK, 2017; 240p. Available online: https://core.ac.uk/download/96890617.pdf (accessed on 12 April 2025).
  14. Chiu, H.H. Advances and challenges in droplet and spray combustion. I. Toward a unified theory of droplet aerothermochemistry. Prog. Energy Combust. 2000, 26, 381–416. [Google Scholar] [CrossRef]
  15. Varshavskii, G.A.; Fedoseev, D.V.; Frank-Kamenetskii, A.D. Autoignition of a fuel droplet. In Problems of Evaporation, Combustion and Gas Dynamics in Disperse Systems, Proceedings of the Sixth Conference on Evaporation, Combustion and Gas Dynamics in Disperse Systems, Odessa, Ukraine, 3–5 October 1966; Fedoseev, V.A., Ed.; Odessa University Publishing House: Odessa, Ukraine, 1968; pp. 91–95. (In Russian) [Google Scholar]
  16. Sazhin, S.S. Advanced models of fuel droplet heating and evaporation. Prog. Energy Combust. 2006, 32, 162–214. [Google Scholar]
  17. Williams, A. Combustion of droplets of liquid fuels: A review. Combust. Flame 1973, 21, 1–31. [Google Scholar] [CrossRef]
  18. Finneran, J.; Garner, C.P.; Nada, F. Deviations from classicaldroplet evaporation theory. Proc. R. Soc. A 2021, 477, 2251. [Google Scholar] [CrossRef]
  19. Sun, K.; Jia, F.; Zhang, P.; Shu, L.; Wang, T. Marangoni effect in bipropellant droplet mixing during hypergolic ignition. Phys. Rev. Appl. 2021, 15, 034076. [Google Scholar] [CrossRef]
  20. Glushkov, D.; Klepikov, D.; Nigay, A.; Paushkina, K.; Pleshko, A. Experimental research of the initial temperature and additives effect on the ignition and combustion mechanisms of composite liquid fuel in a high-temperature oxidizer. Appl. Sci. 2023, 13, 3501. [Google Scholar] [CrossRef]
  21. He, C.; He, Z.X.; Zhang, P. Droplet collision of hypergolic propellants. Droplet 2024, 3, e116. [Google Scholar] [CrossRef]
  22. Schwind, R.A.; Sinrud, J.B.; Fuller, C.C.; Klassen, M.S.; Walker, R.A.; Goldsmith, C.F. Comparison of flame inception behavior of liquid nitromethane in inert and air environments. Combust. Flame 2022, 241, 112101. [Google Scholar] [CrossRef]
  23. Ochowiak, M.; Bielecki, Z.; Bielecki, M.; Włodarczak, S.; Krupinska, A.; Matuszak, M.; Choiński, D.; Lewtak, R.; Pavlenko, I. The D2-law of droplet evaporation when calculating the droplet evaporation process of liquid containing solid state catalyst particles. Energies 2022, 15, 7642. [Google Scholar] [CrossRef]
  24. Turns, S.R. An Introduction to Combustion; MacGraw Hill: Boston, MA, USA, 2000. [Google Scholar]
  25. Dalla, B.F.; Wang, J.; Picano, F. Revisiting d2-law for the evaporation of dilute droplets. Fluid Dyn. 2021, 33, 051701. [Google Scholar] [CrossRef]
  26. Chen, Y.-A.; Chiang, C.-H.; Yang, C.-I.; Yang, S.-Y.; Wei, H.-H. Defying the D2-law in fuel droplet combustion under gravity. Phys. Fluids 2024, 36, 097171. [Google Scholar] [CrossRef]
  27. Pathak, A.; Raessi, M. Steady-state and transient solutions to drop evaporation in a finite domain: Alternative benchmarks to the d2 law. Int. J. Heat Mass Trans. 2018, 127, 1147–1158. [Google Scholar] [CrossRef]
  28. Raslavičius, L.; Bazaras, Ž. Variations in oxygenated blend composition to meet energy and combustion characteristics very similar to the diesel fuel. Fuel Process. Technol. 2010, 91, 1049–1054. [Google Scholar] [CrossRef]
  29. Fang, W.; Tieshi, Z.; Min, L.; Rui, L.; Jie, J. Single droplet ignition models via evaporation and ignition competition. Meas. Sens. 2021, 13, 100029. [Google Scholar] [CrossRef]
  30. Xu, G.; Ikegami, M.; Honma, S.; Ikeda, K.; Ma, X.; Nagaishi, H.; Dietrich, D.L.; Struk, P.M. Inverse Influence of initial diameter on droplet burning rate in cold and hot ambiences: A thermal action of flame in balance with heat loss. Int. J. Heat Mass Transf. 2003, 46, 1155–1169. [Google Scholar] [CrossRef]
  31. Gallego, A.; Cacua, K.; Gamboa, D.; Rentería, J.; Herrera, B. Ignition delay and burning rate analysis of diesel–carbon nanotube blends stabilized by a surfactant: A droplet-scale study. Energies 2023, 16, 7740. [Google Scholar] [CrossRef]
  32. Araya, K.; Yoshida, T. Single droplet combustion of sunflower oil (part I). J. Senshu Univ. 1985, 18, 83–89. [Google Scholar]
  33. Law, C.L. Multicomponent droplet combustion with rapid internal mixing. Combust. Flame 1976, 26, 219–233. [Google Scholar] [CrossRef]
  34. Botero, M.L.; Huang, Y.; Zhu, D.L.; Molina, A.; Law, C.K. Synergistic combustion of droplets of ethanol, diesel and biodiesel mixtures. Fuel 2012, 94, 342–347. [Google Scholar] [CrossRef]
  35. Hallett, W.L.H. Simple model for the vaporization of droplets with large numbers of components. Combust. Flame 2000, 121, 334–344. [Google Scholar] [CrossRef]
  36. Sirignano, W.A. Advances in droplet array combustion theory and modelling. Prog. Energy Combust. 2014, 42, 54–86. [Google Scholar] [CrossRef]
  37. Brenn, G. Concentration fields in evaporating droplets. Int. J. Heat Mass Transf. 2005, 48, 395–402. [Google Scholar] [CrossRef]
  38. Mukhopadhyay, A.; Sanyal, D. A spherical cell model for multicomponent droplet combustion in a dilute spray. Int. J. Energy Res. 2001, 25, 1275–1294. [Google Scholar] [CrossRef]
  39. Mukhopadhyay, A.; Sanyal, D. A parametric study of burning of multicomponent droplets in a dilute spray. Int. J. Energy Res. 2001, 25, 1295–1314. [Google Scholar] [CrossRef]
  40. Lebedevas, S.; Klyus, O.; Raslavičius, L.; Krause, P.; Rapalis, P. Findings on droplet breakup behaviour of the preheated microalgae oil jet for efficiency improvement in diesel engines. Biomass Convers. Biorefin. 2023, 13, 17075–17086. [Google Scholar] [CrossRef]
  41. Sacomano Filho, F.L.; Krieger Filho, G.C.; van Oijen, J.A.; Sadik, A. Numerical investigation of droplet evaporation modeling in combustion environment. In Proceedings of the ICLASS 2018, 14th Triennial International Conference on Liquid Atomization and Spray Systems, Chicago, IL, USA, 22–26 July 2018. [Google Scholar]
  42. EN 590:2014; Automotive Fuels—Diesel—Requirements and Test Methods; German Version EN 590:2013 + AC:2014 (Foreign Standard). Available online: https://webstore.ansi.org/standards/din/dinen5902014?srsltid=AfmBOorKshQ54vfSh9u-WS2LfqxLyr5o7WDu2HcEREtPZAUAUMqacV8m (accessed on 30 June 2025).
  43. ISO 12966-4:2015; Animal and Vegetable Fats and Oils—Gas Chromatography of Fatty Acid Methyl Esters—Part 4: Determination by Capillary Gas Chromatography. ISO: Geneva, Switzerland, 2015.
  44. Misic, D.; Thodos, G. The thermal conductivity of hydrocarbon gases at normal pressures. AIChE J. 1961, 7, 264–271. [Google Scholar] [CrossRef]
  45. Vargaftik, N.B. Handbook of Thermal Conductivity of Liquids and Gases, 1st ed.; Taylor & Francis Ltd.: Abingdon, UK, 1993; 368p. [Google Scholar]
  46. Brokaw, R.S.; O’Neal, C., Jr. Rotational relaxation and the relation between thermal conductivity and viscosity for some nonpolar polyatomic gases. Symp. Combust. Proc. 1963, 9, 725–732. [Google Scholar] [CrossRef]
  47. Cape, J.; Lehman, G. Temperature and Finite Pulse-Time Effects in the Flash Method for Measuring Thermal Diffusivity. J. Appl. Phys. 1963, 34, 1909–1913. [Google Scholar] [CrossRef]
  48. Thomas, H.L.; Smith, H. Correlation of vapour pressure, temperature, and latent heat of vaporisation. J. Appl. Chem. 1970, 20, 33–36. [Google Scholar] [CrossRef]
  49. Sherwood, T.K.; Reed, C.E. Applied Mathematics in Chemical Engineering; McGraw-Hill Chemical Engineering Series; McGraw-Hill: New York, NY, USA, 1939; 403p. [Google Scholar]
  50. Lydersen, A.L. Estimation of Critical Properties of Organic Compounds by the Method of Group Contributions; University of Wisconsin, Engineering Experiment Station: Madison, WI, USA, 1955. [Google Scholar]
  51. Bretschneider, S. Properties of Gases and Liquids; Khimiya Publishing House: Moscow/Leningrad, Russia, 1966; 536p. (In Russian) [Google Scholar]
  52. Shelomentsev, A.M. The Calculation of Thermophysical Properties of Petroleum Products, Review; Publishing House of Standards: Moscow, Russia, 1985; 76p. (In Russian) [Google Scholar]
  53. Brush, S.G. Kinetic Theory. The Chapman–Enskog Solution of the Transport Equation for Moderately Dense Gases, 1st ed.; ter Haar, D., Ed.; Pergamon: Oxford, UK, 2013. [Google Scholar]
  54. Falkovskii, V.B. Approximate calculation of the viscosity of vapors of organic compounds. Zh. Fiz. Khimii 1953, 27, 768–770. (In Russian) [Google Scholar]
  55. Flynn, L.W.; Thodos, G. The viscosity of hydrocarbon gases at normal pressures. J. Chem. Eng. Data 1961, 6, 457–459. [Google Scholar] [CrossRef]
  56. Presser, C.; Nazarian, A.; Millo, A. Laser-driven calorimetry measurements of petroleum and biodiesel fuels. Fuel 2018, 214, 656–666. [Google Scholar] [CrossRef] [PubMed]
  57. Rudin, M.G. Oil Refiner’s Pocket Guide; Khimiya Publishing House: Leningrad, Russia, 1989; 464p. (In Russian) [Google Scholar]
  58. Kay, W.B. Density of hydrocarbon gases and vapors at high temperature and pressure. Ind. Eng. Chem. 1936, 28, 1014–1019. [Google Scholar] [CrossRef]
Figure 1. Droplet combustion stand: 1—furnace, 2—thermocouple head assembly equipped with transmitter, 3—integrated computer imaging system, 4—compressed air unit, 5—temperature monitoring unit, 6—suspended droplet.
Applsci 15 07488 g001
Figure 2. Screenshots of the tracking results on the alteration radius of the DF droplet (d0 = 2.2 mm) in a two-dimensional space over time.
Applsci 15 07488 g002
Figure 3. Duration of the main phases of the chemical reaction kinetics for fossil fuel and biofuel droplets (d0 = 2.2 mm), including their blend over time: ignition delay (a), combustion (b), and ignition delay + combustion (extinction) (c).
Applsci 15 07488 g003
Figure 4. Hydrocarbon fuel droplet. (a) Diagram of all phenomena involved in the evaporation and combustion processes: 1—surface of a droplet; 2—vapor; 3—heat; 4—oxygen; 5—chemical reaction zone; 6—products formed from chemical reaction. (b) Diagram of relationships between process parameters: 1—temperature distribution in space T(r); 2—distribution of vapor concentration around droplet c1(r). The dotted line indicates the zone where the chemical reaction starts (separating fuel vapor from the oxidizer).
Applsci 15 07488 g004
Figure 5. Dependence of the dimensionless coefficient A* on ambient temperature T (n–octane drop radius r0 = 2 mm).
Applsci 15 07488 g005
Figure 6. Comparison of experimental vs. simulation outcomes of droplet ignition delay assessment.
Applsci 15 07488 g006
Table 1. Properties of test fuels [28].
ParameterDiesel FuelRME
Density at 15 °C, kg/m3835884.3
Viscosity at 40 °C, mm2/s4.24.7
Cetane number51.055.0
Water content, mg/kg200223
Methanol content, % mass0.05
Total glycerol, % mass 0.51
Sulphur content, mg/kg6.9 (negligible)negligible
Table 2. Data to calculate the coefficient θ according to Formula (17).
Atoms, Groups, Bonds Parts   Δ θ Number of Parts Δ θ
C−0.46218−8.316
H+0.24936+8.964
O+0.0541+0.054
Double bonds+0.4781+0.478
CO (ketones, ethers)+0.1051+0.105
Table 3. Data to calculate the coefficient θ according to Formula (18).
Atoms, Groups, Bonds Parts Δ θ Number of Parts Δ θ
–CH30.02020.040
–CH20.020140.280
–O–0.02110.021
=CO0.04010.040
–CH0.01220.024
Table 4. Data to calculate the coefficient θ according to Formula (21).
Atoms, Groups, Bonds Parts Δ θ Number of Parts Δ θ
–CH30.22720.454
–CH20.227143.178
–O–0.1610.16
=CO0.2910.29
–CH=0.19820.396
Table 5. Physico-chemical characteristics of test fuels.
Atoms, Groups, BondsDiesel FuelRME
Chemical formulaC16H34C19H36O2
Molecular weight226.43292.00
Density at T = 293 K, kg/m3860900
Thermal conductivity, W/m·K95.72 66.46
Heat capacity (liquid phase) at T = 293 K, J/(g·K)1.852.12
Dynamic viscosity at T = 288 K, Pa·s2.44·10−6 [55]4.54·10−6
4.21·10−6
Specific heat capacity at T = 323 K, J / ( g K ) 1.632.12
Disclaimer/Publisher’s Note: The statements, opinions and data contained in all publications are solely those of the individual author(s) and contributor(s) and not of MDPI and/or the editor(s). MDPI and/or the editor(s) disclaim responsibility for any injury to people or property resulting from any ideas, methods, instructions or products referred to in the content.

