1. Introduction
Ammonium nitrate–fuel oil (ANFO) is a class of energetic materials (EMs) that has found extensive use in blasting, particularly for mining purposes, and also in civilian excavations, demolitions and tunnel construction [
1]. The main advantages of ANFO are the relatively low cost of its components and the ability to prepare the EM on site. It is also important to note that the “fuel oil” phase does not necessarily require petrol-based fuel oils and can be replaced by liquid waste products, such as spent oils, organic chemicals [
2,
3], or even by solid organic fuels, such as wood meal, rape seed or flour [
4].
The main drawbacks of ANFO are its susceptibility to water, high critical diameter and relatively low performance (typically described using velocity of detonation and detonation pressure) [
5]. This has sparked significant research interest in ameliorating these drawbacks while maintaining the advantages of ANFO, particularly its low unit cost. Works undertaking this goal typically focus on the introduction of a variety of additives, either to ANFO or to its components (ammonium nitrate and fuel oil) [
6,
7]. Simultaneously, as the issues of greenhouse gas (GHG) emissions and energy consumption have became more relevant in recent decades, the focus of research efforts shifted to also include these issues [
8].
Cellulose nitrate, commonly referred to as “nitrocellulose” (NC), is an energetic material that can also act as an energetic binder and has found diverse industrial applications [
9,
10]. Recently, microstructured NC (MNC) [
11,
12] has attracted significant research attention, including our initial study on the viability of using it as an additive to non-ideal EMs. The preparation method is essentially the esterification of a microcrystalline cellulose with nitric acid, reflecting the traditional process for producing NC.
An important discovery regarding MNC is its ability to coat ammonium nitrate (AN) [
13], producing core–shell structures. The use of NC-coated AN in the place of porous AN prills for preparing ANFO-type EMs would be expected to increase initiation sensitivity, reaction zone energy and the amount of gases produced during detonation. These changes would be expected to result in ANFO exhibiting a lower critical diameter, higher velocity of detonation (VoD) and higher detonation pressure compared to traditional ANFO.
In this work, we have aimed to explore the preparation of MNC, the process for coating AN, the preparation of ANFO from NC-modified AN and the sensitivity and combustion properties of the resultant ANFO formulations. In terms of synthesis, the effect of substituting the traditional HNO3/H2SO4 esterification mixture with in situ-produced nitric acid (using a KNO3/H2SO4) mixture was investigated. The two reagent systems were employed both for traditional cellulose (yielding NC) and for microcrystalline cellulose (yielding MNC). The four resultant samples were used to coat AN and to produce ANFO formulations. Both NC/MNC-coated AN and the resultant ANFO formulations were investigated in terms of structure and composition by Raman spectroscopy and scanning electron microscopy (SEM). The sensitivity parameters and thermal features of these samples have also been studied.
2. Materials and Methods
2.1. Chemicals
Ammonium nitrate (AN) porous prill (with >99.4% purity, UltrAN 70, bulk density of 670–720 kg/m3 and prill diameters in the range of 1.0–2.0 mm) was produced by Yara (Szczecin, Poland). The following reagents were used in this work: microcrystalline cellulose (>97%, Warchem, Zakręt, Poland), sulphuric acid (>96%, Chempur, Karlsruhe, Germany), potassium nitrate (<95%, Selkat, Krakow, Poland), acetone (technical grade, POCH S.A., Gliwice, Poland) and n-hexane (Sigma-Aldrich Co., Ltd., Darmstadt, Germany). Nitric acid was prepared from the above-mentioned potassium nitrate and sulphuric acid.
2.1.1. Synthesis of NC and MNC
Two esterifying mixtures were prepared in separate flasks, with the following compositions (wt. %): HNO3/H2SO4/H2O—24:67:9 and KNO3/H2SO4/H2O—59:33:8. Under continuous vigorous stirring at ambient temperature, 1 g of cellulose (conventional and microcrystalline, respectively) was introduced into 100 g of the corresponding esterifying mixture. The esterification reaction was maintained for approximately 1 h.
Upon completion, the reaction mixture was quenched in 600 cm3 of ice-cold water, followed by the gradual addition of sodium bicarbonate (POCH S.A., Gliwice, Poland) under stirring until the pH of the solution reached neutrality. The resulting precipitate was collected via vacuum filtration. The resultant cellulose nitrate was subsequently subjected to purification by boiling in 250 cm3 of deionised water for 1 h, followed by filtration and repeated boiling. This purification step was carried out three times, each with fresh portions of water. Following thorough deacidification, the cellulose nitrate was air-dried to obtain the final product.
2.1.2. Coating Method
The coating process was performed using a solvent/non-solvent approach based on the principle of co-acervation [
14]. Following the methodology outlined on the basis of [
13], NC and MNC—used as the coating material—were dissolved in acetone (3%
w/
w with respect to the total mass of prills and ground AN). Crystalline ammonium nitrate was then added to the solution and dispersed under moderate mechanical stirring. Next, n-hexane, a non-solvent for nitrocellulose, was gradually introduced dropwise into the stirring mixture. This step caused nitrocellulose to precipitate from the solution. As designed, the precipitated nitrocellulose adhered to the surface of the NH
4NO
3 particles, forming a uniform coating layer.
2.1.3. Material Characterization
The decomposition temperatures of the ANFO samples produced were determined using an Automatic Explosion Temperature 402 Tester (OZM Research, Bliznovice, Czech Republic). The measurement of the decomposition temperature was conducted five times (one “shot” consisting of five separate samples) for each sample, and the final result is presented as an average. Samples of 50 ± 1 mg were used to determine the ignition/explosion temperatures. The measurement was carried out in the range of 100–400 °C. Heating rates of 5 K/min, 10 K/min, 15 K/min and 20 K/min were used to determine the pseudo-activation energy using the Kissinger and Ozawa methods [
15,
16].
Raman spectra were obtained using the inVia (Renishaw, Wotton-under-Edge, UK) confocal Raman microscope with a diode laser at an excitation line of 532 nm, equipped with a long-focus 20× objective (Olympus Plan N NA = 0.25). The spectra were recorded at a light power of 500 mW and with a spectral resolution of approximately 1 cm−1 (2400 lines/mm grating) in the spectral range of 1100–3200 cm−1 using an EMCCD Newton 970 camera (Andor, Belfast, UK) as the detector. The acquisition time for a single spectrum was 3 s with 5 acquisitions. All spectra were pre-processed by removing cosmic radiation and baseline correction using the WiRE 5.2 software from Renishaw, UK. Samples containing fuel oil (diesel), i.e., ANFO-type EMs, were not investigated. This is both due to safety concerns (ANFO is capable of undergoing detonation) and due to the fact that Raman spectroscopy is a surface investigation method (fuel oil signals would obscure the signals arising from the NC-coated AN particles).
IR spectroscopy measurements were performed on a PerkinElmer Spectrum Two spectrometer (Waltham, MA, USA) equipped with a universal attenuated total reflectance (UATR) module (diamond). Spectra were recorded in the range of 450 to 4000 cm−1. Samples containing fuel oil (diesel), i.e., ANFO-type EMs, were not investigated. This is both due to safety concerns (ANFO is capable of undergoing detonation) and due to the fact that IR ATR spectroscopy is a surface investigation method (fuel oil signals would obscure the signals arising from the NC-coated AN particles).
The morphology of the components, additive-supplemented gAN, and the respective ANFO was investigated using a Phenom ProX (Phenom-World BV, Eindhoven, The Netherlands) scanning electron microscope (SEM). Regarding the SEM operation parameters, the working distance was 10 mm, the acceleration voltage of the incident electron was 10 kV and the current intensity of the incident electronic beam was about 95 µA. Samples containing fuel oil (diesel), i.e., ANFO-type EMs, were not investigated as the high vacuum present in the SEM sample chamber would result in the evaporation of the fuel oil, which would damage the instrument.
Scanning electron microscopy with energy dispersive X-ray spectroscopy system (SEM-EDS) experiments were carried out using an Inspect S50, FEI (Hillsboro, OR, USA) instrument, equipped with an EDS Octane Elect Plus, EDAX (Mahwah, NJ, USA) detector. Prior to measurement, the samples were coated with an 8-micrometer-thick gold layer to ensure conductivity and to safeguard the instrument, as the materials exhibited poor adhesion to the SEM stage. For this reason, gold was taken into account in the mathematical model, since its spectral line is close to that of sulphur, potentially leading to a false positive result in the EDS analysis. SEM images (used for overlaying EDS data) were obtained using an ETD detector, whereas elemental composition mapping was carried out using an EDS detector. The measurements were conducted at 15 kV.
Friction and impact sensitivity were performed according to relevant international standards and using the Peters friction apparatus [
17] and BAM Fallhammer apparatus [
18], respectively.
2.2. Sample Coding Scheme
Due to the relatively large amount of samples, the sample coding scheme employed in this work is presented in
Table 1, with the use of different esterification mixtures and types of cellulose being colour coded.
3. Results
3.1. Spectroscopic Investigation
The Raman spectra of the cellulose nitrate samples (
Figure 1a) show that the four types of samples have identical chemical structures. However, as expected, the signal widths from MNC are lower, confirming a better degree of ordering in MNC. An intense band characterises the Raman spectrum of cellulose nitrate at 1284 cm
−1, attributed to the stretching vibrations of the nitrate group. Other bands from the nitrate groups are observed at 1656 cm
−1 [
19]. The bending vibrations of the CH and CH
2 groups are observed at 1371 and 1456 cm
−1, respectively. Bands observed between 1000 and 1215 cm
−1 are attributed to the structure of the cellulose acetal, i.e., the cyclic ether and glycosidic bond.
The Raman spectra of AN (
Figure 1b) consist of secondary Raman bands belonging to other vibrational modes,
2,
3 and
4, combinations of fundamental modes and lattice modes. Out-of-plane bending (
2) is usually not active in Raman spectroscopy; asymmetric stretching (
3) is typically observed in the spectral range of 1300 to 1500 cm
−1. The set of combination modes (
1 +
4) observed near 1600 and 1700 cm
−1 of the spectrum is also characteristic of AN. In the spectra (
Figure 1b), only the signals originating from AN can be seen and since Raman spectroscopy is a surface technique, this confirms that AN covers NC and MNC rather than the opposite, as postulated in the literature.
The IR spectra of the produced NC samples (
Figure 2a) all contain signals at approx. 3440 cm
−1, corresponding to the stretching of the hydroxyl group (-OH). Additionally, in the 2900–3000 cm
−1 range, carbon–hydrogen (C-H) bond stretching signals, characteristic of tetrahedral carbon atoms, are present. The signal at 1060 cm
−1 originates from C-O-C bond stretching, whereas the signal at 800 cm
−1 arises from the vibrations of C-H bonds in glucose ring repeat units. These signals are well-described in the literature and in line with previous reports [
20].
The addition of AN (
Figure 2b) results in the signals originating from AN overshadowing other signals. The AN-originating absorption signals are in line with the literature data and include the following: strong absorption bands around 1280 cm
−1 and 720 cm
−1, corresponding to nitrate ion (NO
3−) vibrations, and bands near 3030 cm
−1 and 1400 cm
-1, corresponding to ammonium ion (NH4
+) [
21]. The spectra also contain signals at approx. 1700 and at less than 800 cm
−1, which originate from NC. The presence of NC signals in the IR-ATR spectra is primarily caused by the compression of the sample required in the ATR method and the resultant exposure of NC.
3.2. SEM Results
SEM analysis revealed that, regardless of the type of nitrocellulose used, adhesion of AN to the surface was observed in all samples. In the case of the NC-KNO
3 sample, residues of sulphate salts originating from the synthesis process were detected (
Figure 3). For MNC (
Figure 4), a higher degree of surface coverage was observed compared to the NC sample. However, no formation of a core–shell structure was detected in any of the analysed samples, as clearly confirmed by the obtained images.
The absence of core–shell structure formation may be attributed to several factors. The primary aspect is the coating procedure, which involved the application of a nitrocellulose solution onto AN particles. For the NC-KNO3 and MNC-KNO3 samples, the solubility of this specific NC in acetone was significantly lower compared to that of NC and MNC, a difference that was observable even macroscopically. Furthermore, the use of large volumes of solvent during the coating process may have affected the surface properties of the ammonium nitrate particles, particularly considering the partial solubility of ammonium nitrate in acetone. In addition, the presence of residual sulphate salts in the NC-KNO3 sample may have disrupted the coating deposition and growth process, causing local inhomogeneities and preventing the formation of a regular structure. The morphology of ammonium nitrate itself played an important role in the formation of the final structures.
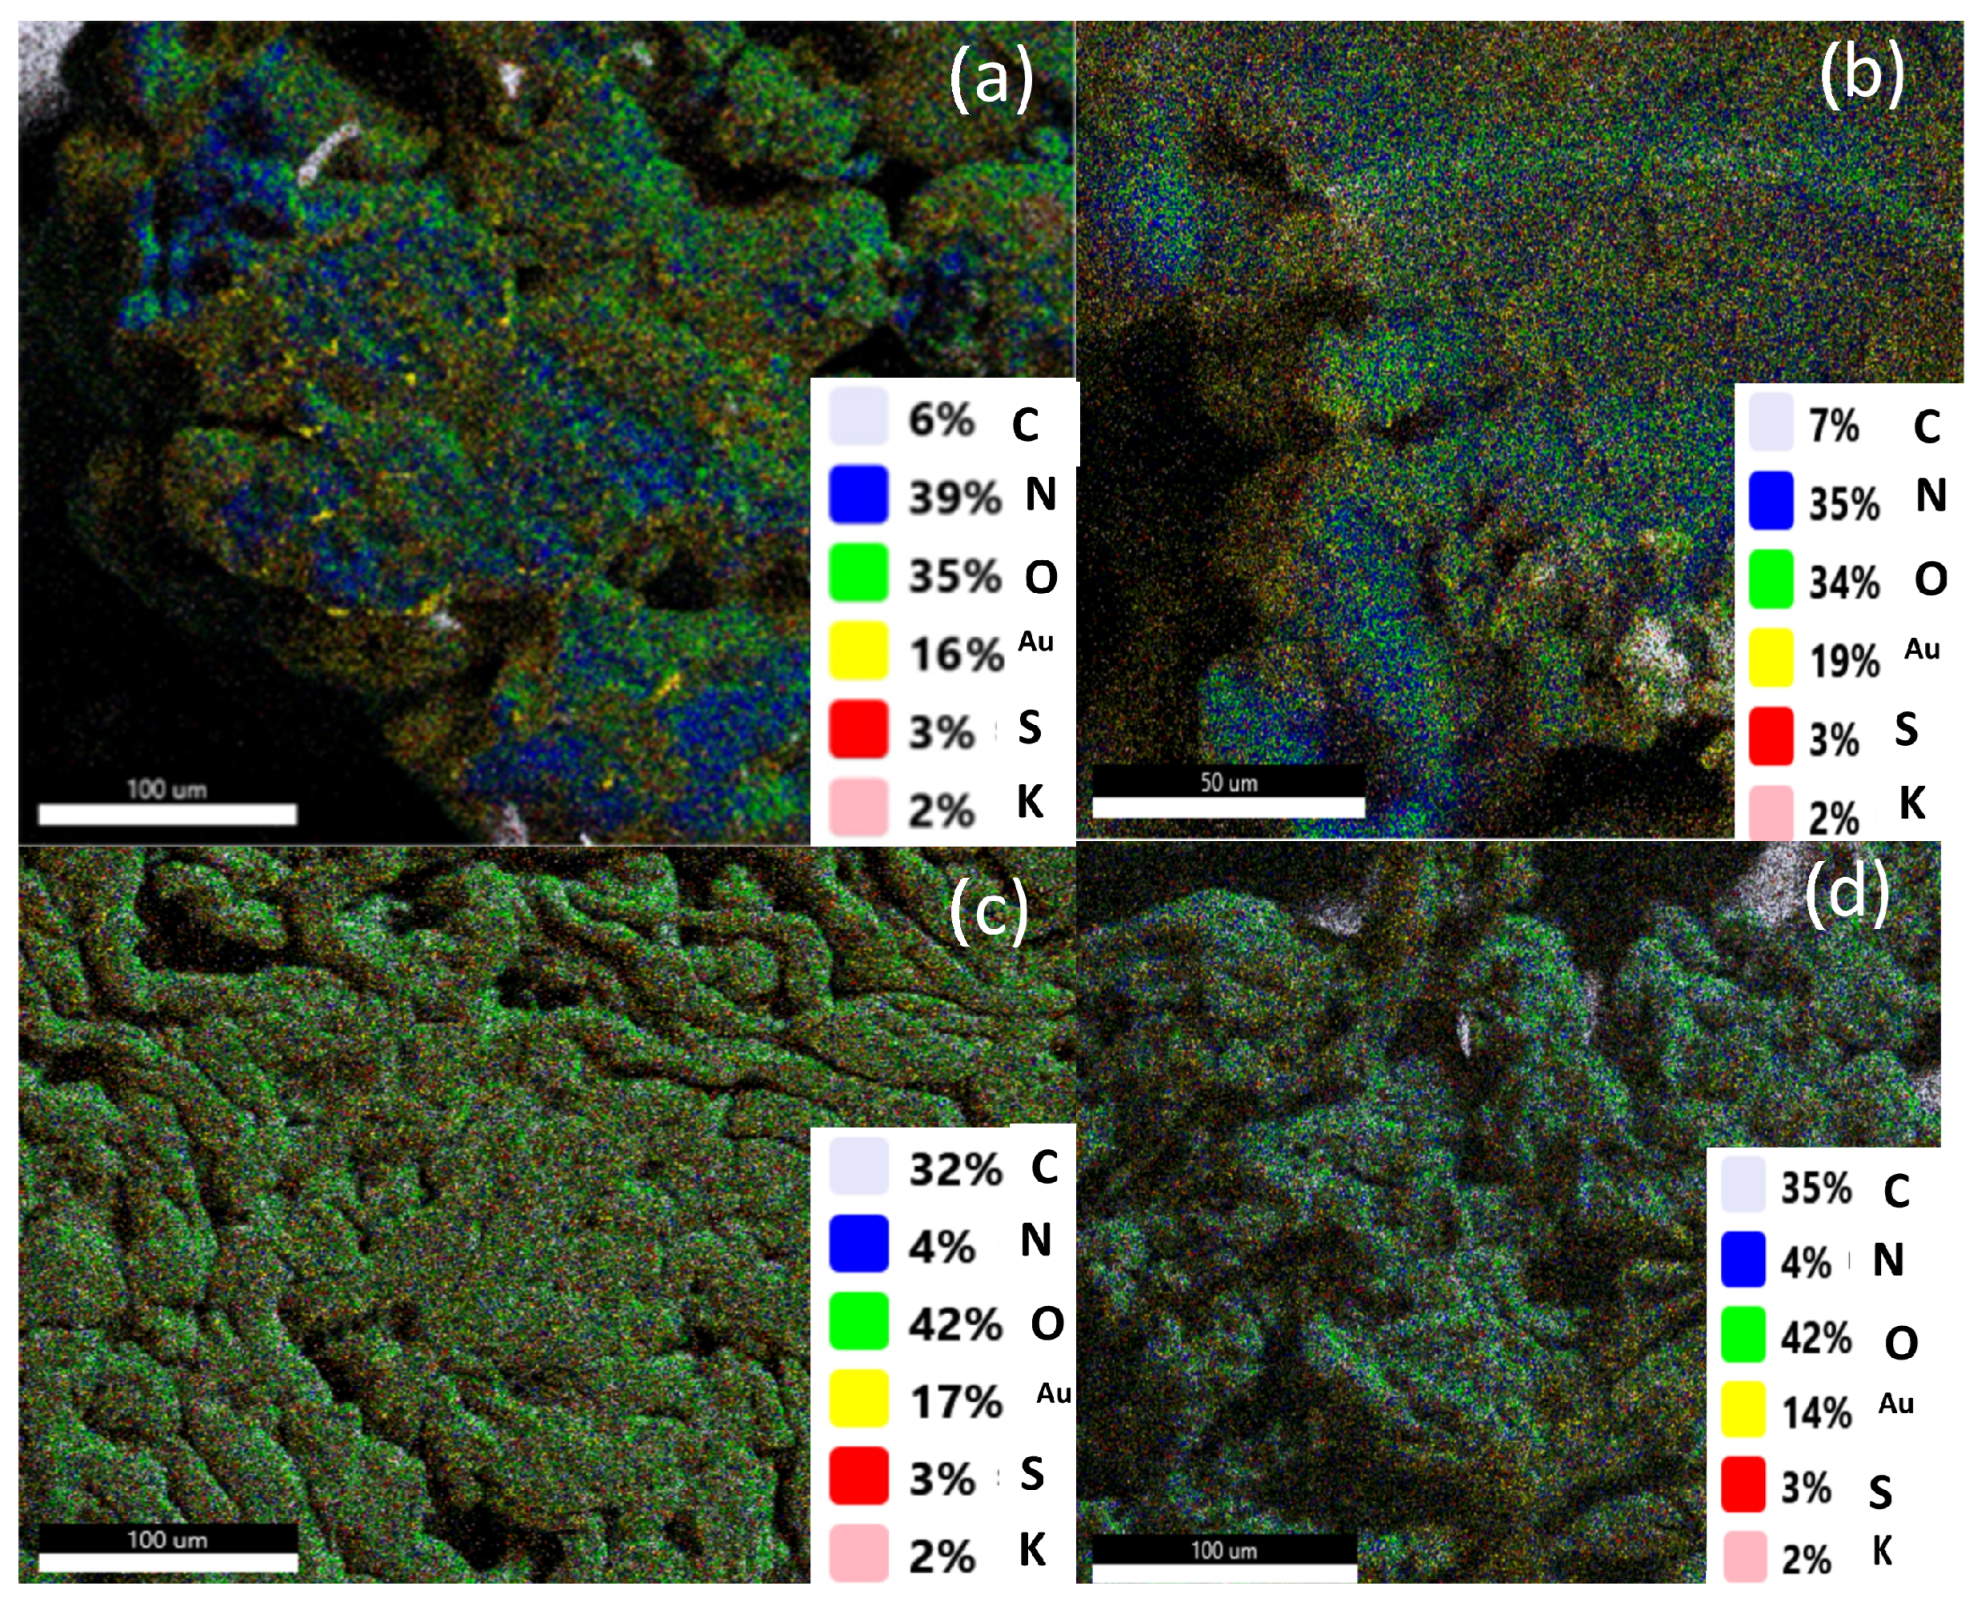
SEM-EDS
SEM-EDS measurements revealed the presence of sulphur, uniformly dispersed over the entire surface of the samples prepared using KNO
3. In all samples, the sulphur concentration is similar, at the level of 3 wt. % (
Figure 5 and
Figure A1). It should be noted that cellulose nitrates cannot be differentiated from AN using SEM-EDS, as both contain the same types of distinguishable atoms (carbon atoms are present in the adhesive film attaching the sample to the holder and, as such, are not investigated). In
Figure 5, EDS results are presented for the transition of an electron from the L to the K level in an atom (K
α line); in the designation, e.g., “C K”, the letter K denotes this line.
3.3. Determination of Pseudo-Activation Energy
The pseudo-activation energies of decomposition (EAs) for the investigated samples were determined using the Kissinger and Ozawa methods (
Table 2), using ignition/explosion temperature measurements (
Figure A2,
Figure A3,
Figure A4,
Figure A5,
Figure A6,
Figure A7,
Figure A8,
Figure A9,
Figure A10,
Figure A11,
Figure A12 and
Figure A13). Data analysis indicates that the addition of NC-KNO
3 to the respective materials significantly increases their thermal resistance. The most pronounced changes were observed for the NC sample, whose activation energy was 122 kJ/mol (Kissinger) and 123 kJ/mol (Ozawa), while for the KNO
3 sample, these values increased to 269 kJ/mol and 263 kJ/mol, respectively. This indicates a considerable enhancement of the thermal stability of the system in the presence of the oxidising agent.
A similar trend, although less pronounced, was observed for the MNC and ANNC samples, where the EA values also increased, further confirming the stabilising effect of the additive. For example, the MNC sample showed an activation energy of 110 kJ/mol (Kissinger) and 131 kJ/mol (Ozawa), while for MNC-KNO3, these values increased to 125 kJ/mol and 126 kJ/mol, respectively. For the ANNC sample, the EA values rose from 88 kJ/mol and 92 kJ/mol to 111 kJ/mol and 114 kJ/mol for ANNC-KNO3, respectively.
However, samples containing ANMNC exhibit noticeably lower activation energy values, suggesting that the modifications applied reduce the thermal stability of the material and facilitate its decomposition. For ANMNC, the values were 77 kJ/mol (Kissinger) and 82 kJ/mol (Ozawa), while for ANMNC-KNO3, a moderate increase was recorded, reaching 88 kJ/mol and 92 kJ/mol.
3.4. Impact and Friction Sensitivity Results
Reference ANFO mixtures formulated with ground ammonium nitrate exhibited high friction thresholds (>360 N) and slightly lower impact sensitivity (40 J).
In samples with NC, the presence of ammonium nitrate consistently increased impact sensitivity, regardless of its form. This suggests that the oxidising agent plays a key role in facilitating the initiation of the reaction [
22]. Conventional NC was more sensitive to impact than MNC (
Table 3, full experimental data are given in
Table A1,
Table A2,
Table A3 and
Table A4); in turn, MNC showed a higher sensitivity to friction, which can be linked to its finer particle size and greater surface reactivity [
23]. These distinctions became less pronounced in mixtures with AN, indicating the dominant influence of the oxidising agent.
NC synthesised with nitric acid exhibited lower mechanical sensitivity than NC prepared using potassium nitrate, a trend that also extended to AN–NC mixtures. This implies that the esterification method significantly affects both the material and the composite behaviour. The inclusion of diesel oil reduced both impact and friction sensitivity in all samples, likely by improving homogeneity and mitigating localised heating.
4. Discussion
The method of coating ammonium nitrate with various types of nitrocellulose, presented in the literature and investigated in this work, raises questions in terms of efficacy and the final product. Issues with the complete dissolution of nitrocellulose in acetone were already observed at the solution preparation stage. These issues were particularly pronounced in the case of materials obtained by in situ synthesis of nitric acid (potassium nitrate/sulphuric acid route). This may be caused by the presence of residual cellulose sulphate, as SEM-EDS analyses revealed that in all cases of the samples prepared using KNO3, sulphur appeared as small precipitates on the sample surface, indicating the co-precipitation of cellulose sulphate.
Another issue of the proposed coating process is tied to its resource consumption, i.e., the need to use high volumes of solvents (on average, 150 to 200 mL of acetone and 200 to 300 mL of hexane were used for 0.5 g of nitrocellulose). While not critical, reducing the use of solvents or using them in a closed loop needs to be considered before any industrial scale implementations could be feasible.
The final product of the process, which should be NC-coated AN, is not reliably obtained. In turn, our investigations (SEM, Raman spectroscopy) have shown that the degree of coating is limited: no core–shell structure is produced and, in some cases, AN appears to be deposited onto NC rather than the opposite.
Raman spectroscopy confirmed the presence of NC on the surface of AN in all samples (characteristic NC band at 1128 cm−1). Samples with microcrystalline nitrocellulose (MNC) showed narrower bands, suggesting a higher degree of structural order. SEM images demonstrated the absence of the expected core–shell structure, which was the intended goal of the process. Furthermore, the observations reveal a reverse effect: instead of uniform encapsulation of ammonium nitrate particles, uncontrolled deposition of the ammonium salt occurs on the nitrocellulose surface. This layer inversion suggests improper coating kinetics or unsuitable physicochemical conditions, leading to system destabilization.
In terms of pseudo-activation energy, it is worth noting that the use of the KNO3/H2SO4 mixture results in higher EA values than in the case of HNO3/H2SO4, regardless of the type of cellulose used and of the follow-up processing of the cellulose nitrate sample (e.g., addition of AN and fuel oil). In conjunction with other analyses, this indicates the presence of residual cellulose sulphate in the samples produced via the KNO3/H2SO4 route rather than significant deviations in nitrogen content of the samples. The addition of AN resulted in a decrease in pseudo-activation energy, largely due to the shift of the oxygen balance of the system towards more positive values (NC exhibits a negative oxygen balance value, dependent on its nitrogen content) and the relatively facile decomposition of AN. Conversely, the addition of the auxiliary fuel (diesel oil) yielded an increase in pseudo-activation energy values, due to both its strongly negative oxygen balance and limited reactivity.
Ground AN is typically insensitive to friction (>360 N) and has marginal impact sensitivity (40–50 J). In turn, the four types of cellulose nitrate samples (NC and MNC produced traditionally and using the KNO3/H2SO4 mixture) are mildly sensitive to friction (with the exception of MNC showing relatively high sensitivity) and relatively sensitive to impact. As expected, introducing AN into the cellulose nitrate samples gives a minor decrease in impact and friction sensitivity, while the addition of diesel oil gives a more significant decrease of sensitivity. The aberrantly high sensitivity of MNC is likely caused by its regular microstructure translating into increased hardness, compared with the fibrillar structure of NC. The loss of sensitivity upon addition of AN is tied to the relative softness of AN (Mohs hardness of approx. 4) and its highly porous structure, affording many pathways for mechanical relaxation, while the liquid state of diesel oil makes it an effective damper for mechanical strain. The influence of the esterification method was evident; i.e., nitrocellulose synthesised using nitric acid was less sensitive than that prepared with potassium nitrate.
5. Conclusions
The method of coating AN with NC or MNC is a highly interesting advancement; however, due to its very early technological state, it is not without issues. The most relevant limitation of the process is the control over the microstructure of the final product (i.e., unreliability of producing the desired core–shell structures), while the issues of resource consumption (use of large solvent volumes per unit mass of the product) also need to be addressed prior to scaling up the process and implementing it as a technology.
An important aspect of the process is the choice of mixture used to conduct the esterification of cellulose, with the KNO3/H2SO4 mixture affording better process control, but requiring adjustments of the process due to the incomplete removal of cellulose sulphate from NC-KNO3 and MNC-KNO3 samples.
In terms of EM formulation design, the use of AN and diesel oil appears to be a favourable choice, as it translates into reduced mechanical sensitivity of the cellulose nitrate, while being expected to provide a significant increase in energetic performance, when compared to traditional ANFO-type EMs. This makes the NC-coated AN technology a promising one that needs to be further developed in the future.
Author Contributions
Conceptualisation: T.J.; Methodology: M.F., T.J., K.B. and A.S.; Investigation: M.F., K.B. and A.S.; Validation: T.J. and A.S.; Formal analysis: M.F. and T.J.; Data curation: M.F., T.J. and A.S.; Writing—original draft: M.F., T.J. and A.S.; Writing—review and editing: M.F., T.J., K.B. and A.S.; Visualisation: M.F.; Supervision: T.J. All authors have read and agreed to the published version of the manuscript.
Funding
M.F. acknowledges the National Science Centre’s PRELUDIUM-BIS grant no. 2020/39/O/ST5/03293. T.J. acknowledges the pro-quality grant no. 04/040/RGJ25/0299 from the Rector of the Silesian University of Technology. A.S. acknowledges the pro-quality grant no. 04/040/RGJ25/0300 from the Rector of the Silesian University of Technology.
Institutional Review Board Statement
Not applicable.
Informed Consent Statement
Not applicable.
Data Availability Statement
The original contributions presented in this study are included in the article. Further inquiries can be directed to the corresponding author.
Conflicts of Interest
The authors declare no conflicts of interest.
Appendix A
Figure A1.
EDS-SEM analysis of cellulose nitrate samples: (a) ANNC-KNO3; (b) ANMNC-KNO3; (c) NC-KNO3; (d) MNC-KNO3.
Figure A1.
EDS-SEM analysis of cellulose nitrate samples: (a) ANNC-KNO3; (b) ANMNC-KNO3; (c) NC-KNO3; (d) MNC-KNO3.
Table A1.
Impact sensitivity raw results for various compositions. N and Z denote the lack of initiation and the initiation of the tested sample, respectively, at a given stimulus for a given repetition (up to 6). Green denotes the final sensitivity value, as listed in
Table 3.
Table A1.
Impact sensitivity raw results for various compositions. N and Z denote the lack of initiation and the initiation of the tested sample, respectively, at a given stimulus for a given repetition (up to 6). Green denotes the final sensitivity value, as listed in
Table 3.
| Impact [J] | NC | NC-KNO3 | ANNC | ANNC-KNO3 | ANNC-D | ANNC-KNO3-D |
|---|
| 10 | N | N | N | N | N | N |
| 15 | NNNNNN | N | N | N | N | N |
| 20 | NNNNNZ | N | N | N | N | N |
| 25 | Z | N | NNNNNN | N | N | N |
| 30 | NZ | NNNNNNN | NNNZ | NNNNNN | N | N |
| 35 | NNZ | NZ | NNNZ | NNNNNZ | NNNNNN | N |
| 40 | NZ | NNNZ | NZ | NZ | NNZ | NNNNNN |
| 50 | Z | NNNNZ | Z | Z | NNZ | NNNZ |
Table A2.
Impact sensitivity raw results for ANMNC- and MNC-based compositions. N and Z denote the lack of initiation and the initiation of the tested sample, respectively, at a given stimulus for a given repetition (up to 6). Green denotes the final sensitivity value, as listed in
Table 3.
Table A2.
Impact sensitivity raw results for ANMNC- and MNC-based compositions. N and Z denote the lack of initiation and the initiation of the tested sample, respectively, at a given stimulus for a given repetition (up to 6). Green denotes the final sensitivity value, as listed in
Table 3.
| Impact [J] | MNC | MNC-KNO3 | ANMNC | ANMNC-KNO3 | ANMNC-D | ANMNC-KNO3-D |
|---|
| 10 | N | N | N | N | N | N |
| 15 | N | N | N | N | N | N |
| 20 | NNNNNN | N | N | N | N | N |
| 25 | NNNZ | NNNNNN | N | N | N | N |
| 30 | NNNNNZ | NZ | NNNNNN | N | NNNNNN | N |
| 35 | Z | NNNNNZ | NNZ | NNNNNN | NNZ | N |
| 40 | Z | NNZ | NZ | NNNNNZ | NNZ | NNNNNN |
| 50 | Z | Z | Z | NZ | Z | NNNZ |
Table A3.
Friction sensitivity raw results for NC-based samples. N and Z denote the lack of initiation and the nitiation of the tested sample, respectively, at a given stimulus for a given repetition (up to 6). Green denotes the final sensitivity value, as listed in
Table 3.
Table A3.
Friction sensitivity raw results for NC-based samples. N and Z denote the lack of initiation and the nitiation of the tested sample, respectively, at a given stimulus for a given repetition (up to 6). Green denotes the final sensitivity value, as listed in
Table 3.
| Friction [N] | NC | NC-KNO3 | ANNC | ANNC-KNO3 | ANNC-D | ANNC-KNO3-D |
|---|
| 360 | NNZ | NNNNZ | NZ | NZ | NNZ | NNNNNZ |
| 324 | NNNNNZ | NNNNNNZ | NZ | NNNNZ | NNNNZ | NNNNNN |
| 288 | NNNNZ | NNNNNN | NNNNZ | NNNNNZ | NNNNNN | |
| 252 | NNNNNN | | NNNNNN | NNNNNN | | |
Table A4.
Friction sensitivity raw results for MNC-based samples. N and Z denote the lack of initiation and the initiation of the tested sample, respectively, at a given stimulus for a given repetition (up to 6). Green denotes the final sensitivity value, as listed in
Table 3.
Table A4.
Friction sensitivity raw results for MNC-based samples. N and Z denote the lack of initiation and the initiation of the tested sample, respectively, at a given stimulus for a given repetition (up to 6). Green denotes the final sensitivity value, as listed in
Table 3.
| Friction [N] | MNC | MNC-KNO3 | ANMNC | ANMNC-KNO3 | ANMNC-D | ANMNC-KNO3-D |
|---|
| 360 | NZ | NNZ | NZ | NNNZ | NNNZ | NNNNZ |
| 324 | NZ | NNNZ | NNNZ | NZ | NNNZ | NNZ |
| 288 | NZ | NNZ | NNZ | NNNNNN | NNNNZ | NNNNNN |
| 252 | Z | NNNNNN | NNNNZ | | NNNNNN | |
| 216 | NNZ | | NNNNNN | | | |
| 180 | Z | | | | | |
| 144 | NNNZ | | | | | |
| 128 | NNNNNZ | | | | | |
| 120 | NNNNNN | | | | | |
Figure A2.
Ignition/explosion thermograms (n = 5) recorded for NC samples at heating rates of 5–20 K/min. Curves recorded at different heating rates are colour-coded.
Figure A2.
Ignition/explosion thermograms (n = 5) recorded for NC samples at heating rates of 5–20 K/min. Curves recorded at different heating rates are colour-coded.
Figure A3.
Ignition/explosion thermograms (n = 5) recorded for NC-KNO3 samples at heating rates of 5–20 K/min. Curves recorded at different heating rates are colour-coded.
Figure A3.
Ignition/explosion thermograms (n = 5) recorded for NC-KNO3 samples at heating rates of 5–20 K/min. Curves recorded at different heating rates are colour-coded.
Figure A4.
Ignition/explosion thermograms (n = 5) recorded for MNC samples at heating rates of 5–20 K/min. Curves recorded at different heating rates are colour-coded.
Figure A4.
Ignition/explosion thermograms (n = 5) recorded for MNC samples at heating rates of 5–20 K/min. Curves recorded at different heating rates are colour-coded.
Figure A5.
Ignition/explosion thermograms (n = 5) recorded for MNC-KNO3 samples at heating rates of 5–20 K/min. Curves recorded at different heating rates are colour-coded.
Figure A5.
Ignition/explosion thermograms (n = 5) recorded for MNC-KNO3 samples at heating rates of 5–20 K/min. Curves recorded at different heating rates are colour-coded.
Figure A6.
Ignition/explosion thermograms (n = 5) recorded for ANNC samples at heating rates of 5–20 K/min. Curves recorded at different heating rates are colour-coded.
Figure A6.
Ignition/explosion thermograms (n = 5) recorded for ANNC samples at heating rates of 5–20 K/min. Curves recorded at different heating rates are colour-coded.
Figure A7.
Ignition/explosion thermograms (n = 5) recorded for ANNC-KNO3 samples at heating rates of 5–20 K/min. Curves recorded at different heating rates are colour-coded.
Figure A7.
Ignition/explosion thermograms (n = 5) recorded for ANNC-KNO3 samples at heating rates of 5–20 K/min. Curves recorded at different heating rates are colour-coded.
Figure A8.
Ignition/explosion thermograms (n = 5) recorded for ANMNC samples at heating rates of 5–20 K/min. Curves recorded at different heating rates are colour-coded.
Figure A8.
Ignition/explosion thermograms (n = 5) recorded for ANMNC samples at heating rates of 5–20 K/min. Curves recorded at different heating rates are colour-coded.
Figure A9.
Ignition/explosion thermograms (n = 5) recorded for ANMNC-KNO3 samples at heating rates of 5–20 K/min. Curves recorded at different heating rates are colour-coded.
Figure A9.
Ignition/explosion thermograms (n = 5) recorded for ANMNC-KNO3 samples at heating rates of 5–20 K/min. Curves recorded at different heating rates are colour-coded.
Figure A10.
Ignition/explosion thermograms (n = 5) recorded for ANNC-D samples at heating rates of 5–20 K/min. Curves recorded at different heating rates are colour-coded.
Figure A10.
Ignition/explosion thermograms (n = 5) recorded for ANNC-D samples at heating rates of 5–20 K/min. Curves recorded at different heating rates are colour-coded.
Figure A11.
Ignition/explosion thermograms (n = 5) recorded for ANNC-KNO3-D samples at heating rates of 5–20 K/min. Curves recorded at different heating rates are colour-coded.
Figure A11.
Ignition/explosion thermograms (n = 5) recorded for ANNC-KNO3-D samples at heating rates of 5–20 K/min. Curves recorded at different heating rates are colour-coded.
Figure A12.
Ignition/explosion thermograms (n = 5) recorded for ANMNC-D samples at heating rates of 5–20 K/min. Curves recorded at different heating rates are colour-coded.
Figure A12.
Ignition/explosion thermograms (n = 5) recorded for ANMNC-D samples at heating rates of 5–20 K/min. Curves recorded at different heating rates are colour-coded.
Figure A13.
Ignition/explosion thermograms (n = 5) recorded for ANMNC-KNO3-D samples at heating rates of 5–20 K/min. Curves recorded at different heating rates are colour-coded.
Figure A13.
Ignition/explosion thermograms (n = 5) recorded for ANMNC-KNO3-D samples at heating rates of 5–20 K/min. Curves recorded at different heating rates are colour-coded.
References
- Cotrina-Teatino, M.A.; Marquina-Araujo, J.J.; Mamani-Quispe, J.N.; Gonzalez-Vasquez, J.A.; Arango-Retamozo, S.M.; Noriega-Vidal, E.M.; Donaires-Flores, T.; Quispe-Tello, R.L. Machine Learning Techniques for Predicting the Quantity of ANFO Used in Blasting a Bench in an Open Pit Mine. Math. Model. Eng. Probl. 2024, 11, 2625–2638. [Google Scholar] [CrossRef]
- Ali, F.; Roy, M.P.; Pingua, B.M.P.; Mukherjee, R.; Agarwal, L.; Singh, P.K. Utilization of Waste lubricant oil in fuel phase of ANFO explosives: Its field applications and environmental impact. Propellants Explos. Pyrotech. 2021, 46, 1397–1404. [Google Scholar] [CrossRef]
- Stramquist, D.; Wathen, B. Waste product in distillation for glycol product in ANFO explosives as replacement for fuel oils. Fuel Energy Abstr. 1997, 1, 19. [Google Scholar]
- Buczkowski, D. Explosive properties of mixtures of ammonium nitrate (V) and materials of plant origin–Danger of unintended explosion. Cent. Eur. J. Energetic Mater. 2014, 11, 115–127. [Google Scholar]
- Park, G.K.; Moon, J.H.; Shin, H.S.; Kim, S.W. Blast resistance capacities of structural panels subjected to shock-tube testing with ANFO explosive. Materials 2023, 16, 5274. [Google Scholar] [CrossRef] [PubMed]
- Uranchimeg, E.; Narantsetseg, M.; Purev, L. Modification of ANFO detonation parameters by biowaste addition. In Proceedings of the IOP Conference Series: Materials Science and Engineering; IOP Publishing: Bristol, UK, 2021; Volume 1019, p. 012040. [Google Scholar]
- Škrlec, V.; Sućeska, M.; Dobrilović, M.; Vincek, J. Detonability of Ammonium Nitrate Mixtures with the Addition of Organic Materials. Appl. Sci. 2024, 14, 1580. [Google Scholar] [CrossRef]
- Purhamadani, E.; Bagherpour, R. The role of different explosives in reducing energy and emissions in mining comminution for sustainable improvement. Energy 2024, 310, 133233. [Google Scholar] [CrossRef]
- binti Samsuri, A.; binti Jamal, S.H.; binti Rusly, S.N.A.; binti Ariff, H.; Latif, N.S.A. Key attributes of nitrocellulose-based energetic materials and recent developments. Heliyon 2024, 11, e41282. [Google Scholar]
- Sabatini, J.J.; Johnson, E.C. A short review of nitric esters and their role in energetic materials. ACS Omega 2021, 6, 11813–11821. [Google Scholar] [CrossRef]
- Santos, D.; Iop, G.D.; Bizzi, C.A.; Mello, P.A.; Mesko, M.F.; Balbinot, F.P.; Flores, E.M. A single step ultrasound-assisted nitrocellulose synthesis from microcrystalline cellulose. Ultrason. Sonochem. 2021, 72, 105453. [Google Scholar] [CrossRef] [PubMed]
- Fabin, M.; Jarosz, T. 9.1 Synthesis and research of micro-nitrocellulose as an additive for non-ideal high-energy materials. In Eyec Monograph© 2023 Faculty of Chemical and Process Engineering; Warsaw University of Technology: Warsaw, Poland, 2023; p. 56. [Google Scholar]
- Abdelaziz, A.; Trache, D.; Tarchoun, A.F.; Boukeciat, H.; Pal, Y.; Thakur, S.; Pang, W.; Klapötke, T.M. Synergistic effect of nitrocellulose coating on structural and reactivity stabilization of ammonium nitrate oxidizer. Def. Technol. 2025, 43, 35–43. [Google Scholar] [CrossRef]
- Eslami, A.; Hosseini, S.; Shariaty, S. Stabilization of ammonium azide particles through its microencapsulation with some organic coating agents. Powder Technol. 2011, 208, 137–143. [Google Scholar] [CrossRef]
- Kissinger, H.E. Reaction kinetics in differential thermal analysis. Anal. Chem. 1957, 29, 1702–1706. [Google Scholar] [CrossRef]
- Ozawa, T. A new method of analyzing thermogravimetric data. Bull. Chem. Soc. Jpn. 1965, 38, 1881–1886. [Google Scholar] [CrossRef]
- EN 13631-3:2005; Explosives for Civil Uses-High Explosives-Part 3: Determination of Sensitiveness to Friction of Explosives. European Committee for Standardization: Brussels, Belgium, 2005.
- EN 13631-4:2002; Explosives for Civil Uses. High Explosives-Part 4: Determination of Sensitiveness to Impact of Explosives. European Committee for Standardization: Brussels, Belgium, 2002.
- Neves, A.; Friedel, R.; Callapez, M.E.; Swank, S.D. Safeguarding our dentistry heritage: A study of the history and conservation of nineteenth–twentieth century dentures. Herit. Sci. 2023, 11, 142. [Google Scholar] [CrossRef]
- Okada, K.; Saito, Y.; Akiyoshi, M.; Endo, T.; Matsunaga, T. Preparation and characterization of nitrocellulose nanofiber. Propellants Explos. Pyrotech. 2021, 46, 962–968. [Google Scholar] [CrossRef]
- Wu, H.B.; Chan, M.N.; Chan, C.K. FTIR characterization of polymorphic transformation of ammonium nitrate. Aerosol Sci. Technol. 2007, 41, 581–588. [Google Scholar] [CrossRef]
- Vyazovkin, S.; Burnham, A.K.; Criado, J.M.; Pérez-Maqueda, L.A.; Popescu, C.; Sbirrazzuoli, N. ICTAC Kinetics Committee recommendations for performing kinetic computations on thermal analysis data. Thermochim. Acta 2011, 520, 1–19. [Google Scholar] [CrossRef]
- Sikder, A.; Sikder, N. A review of advanced high performance, insensitive and thermally stable energetic materials emerging for military and space applications. J. Hazard. Mater. 2004, 112, 1–15. [Google Scholar] [CrossRef] [PubMed]
| Disclaimer/Publisher’s Note: The statements, opinions and data contained in all publications are solely those of the individual author(s) and contributor(s) and not of MDPI and/or the editor(s). MDPI and/or the editor(s) disclaim responsibility for any injury to people or property resulting from any ideas, methods, instructions or products referred to in the content. |
© 2025 by the authors. Licensee MDPI, Basel, Switzerland. This article is an open access article distributed under the terms and conditions of the Creative Commons Attribution (CC BY) license (https://creativecommons.org/licenses/by/4.0/).


