Abstract
This article presents research and a discussion on the proper use of filtration in optical measurements. Measurements were taken using a Werth multisensory machine using a Werth Zoom optical sensor. During optical measurements, the filtration option can be used. The manufacturer defines filters as “Dust”. They allow the machine operator to define the appropriate size depending on the type of inclusions or artifacts created in the production process. They can occur in processes such as punching on presses or production in the injection molding process of plastics. The presented research results and statistical analyses confirm the assumptions regarding the validity of using filters and their values. The use of filters with a higher value significantly affects the obtained results and forces the machine user to make a reasonable choice.
1. Introduction
In optical measurements, filtration is used. It allows the measurement to be optimized in a sense by bypassing the edge areas that were created as a result of material flow during the manufacturing process. Filtration is one of the methods that allows for obtaining results by cutting off this so-called noise.
Many authors have discussed the topic of filtration in measurements using coordinate machines, as well as in 3D scanning measurements. They note that there is no single method suitable for all measurement tasks; therefore, in practice, several filtration methods are combined in order to solve problems [1,2,3]. The influence of filtration in optical measurements is rarely addressed in the literature, because the issues of contour filtration and contour analysis in optical measurements in general are relatively new.
Xian-Feng Han, in [4], draws attention to the importance of removing noise and outliers from a point cloud while preserving its features, especially its fine details. Although there are several existing studies on point cloud filtering, it is believed that filtering the raw point cloud, which is a key step in the point cloud processing process, remains a difficult task. In another publication, Bešić [5] describes a method for filtering a point cloud, which is used to estimate the shape deviation of the object under study. This type of calculation on the original noisy laser scanning data gives large overestimations of these parameters.
Filtering is a process widely used in signal and image processing that aims to reduce the influence of noise in the data and, in other cases, to sharpen edges [6]. Filtration is a tool that can affect the results obtained. It depends on the user of the optical system, who defines the filtration value during measurement. Other factors, such as errors from the systems used, also affect the results. These errors can come from the device design itself and from the optical systems used. Some optical defects, such as aberrations, cause image distortions. These include astigmatism, distortion, field curvature, and chromatic and spherical aberration [7,8,9,10]. Some of them depend largely on the properties of the material from which they were made, and some depend on the manufacturing process. No lens—and, therefore, no optical machine—is perfect. Their manufacturing processes are accompanied by variability; this has an impact on the quality of the manufactured products and indirectly on the size of errors from the optics.
Considering the fact that filtration is a very important aspect and its selection should not be made ad hoc, the authors decided to conduct test studies on a selected part used in production at Lear Corporation. These studies aimed to help determine the validity of using filtration in optical measurements, as well as its appropriate selection. The selection of the “Dust” filter is a relatively new subject. After consulting the machine supplier, the authors obtained information that the issue of filtration had not been studied in sufficient detail. Users of machines equipped with the Werth Zoom sensor receive information about the possibility of using filtration during training. However, they do not receive a clear declaration of what filter values are safe for the user. If we use a filter of 50 or greater, when we measure a regular hexagon, we will obtain a circle, which is not true. Safety in this context means a filter value that will not significantly affect the measurement result.
Customer requirements for cars and their equipment are constantly increasing. In addition to safety, special attention is paid to travel comfort. To this end, car manufacturers are trying to implement newer and newer solutions that allow them to present their products as more attractive compared to the competition. Lear Corporation is a supplier of seat comfort systems for premium-class cars. One of the elements of seat comfort is the seat adjustment system. There are several elements in this system, but one of the most important is the valve. It controls the seat adjustment depending on the needs and expectations of the traveler. Such a valve is equipped with many elements that cooperate with each other, which are to ensure long-term use of the seat comfort system during the product life cycle.
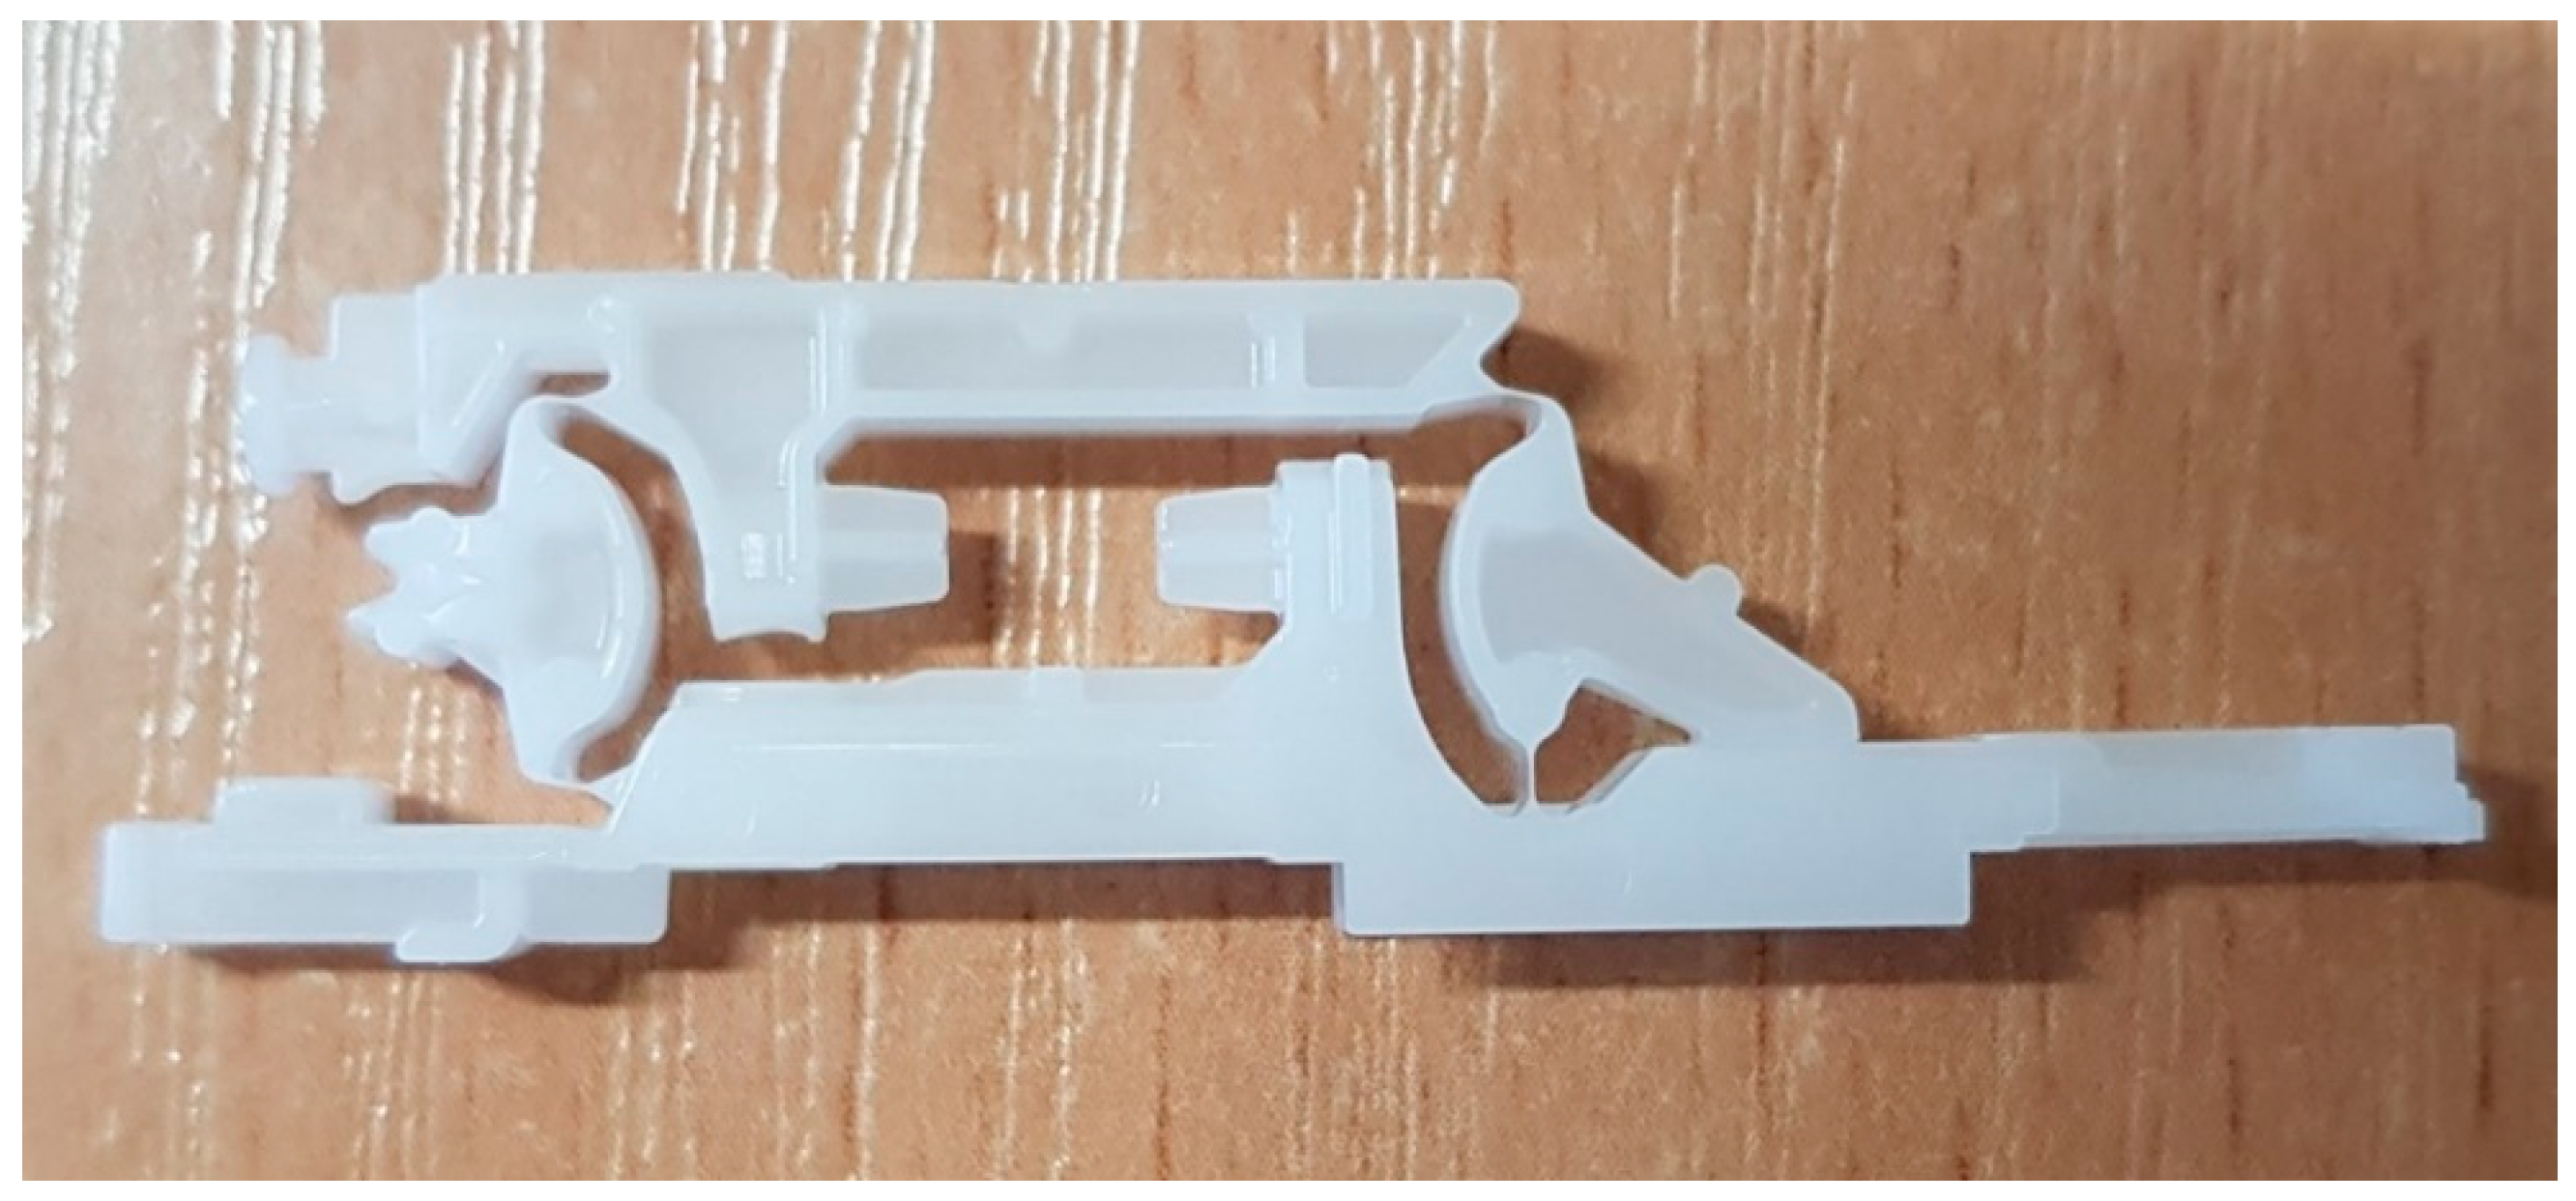
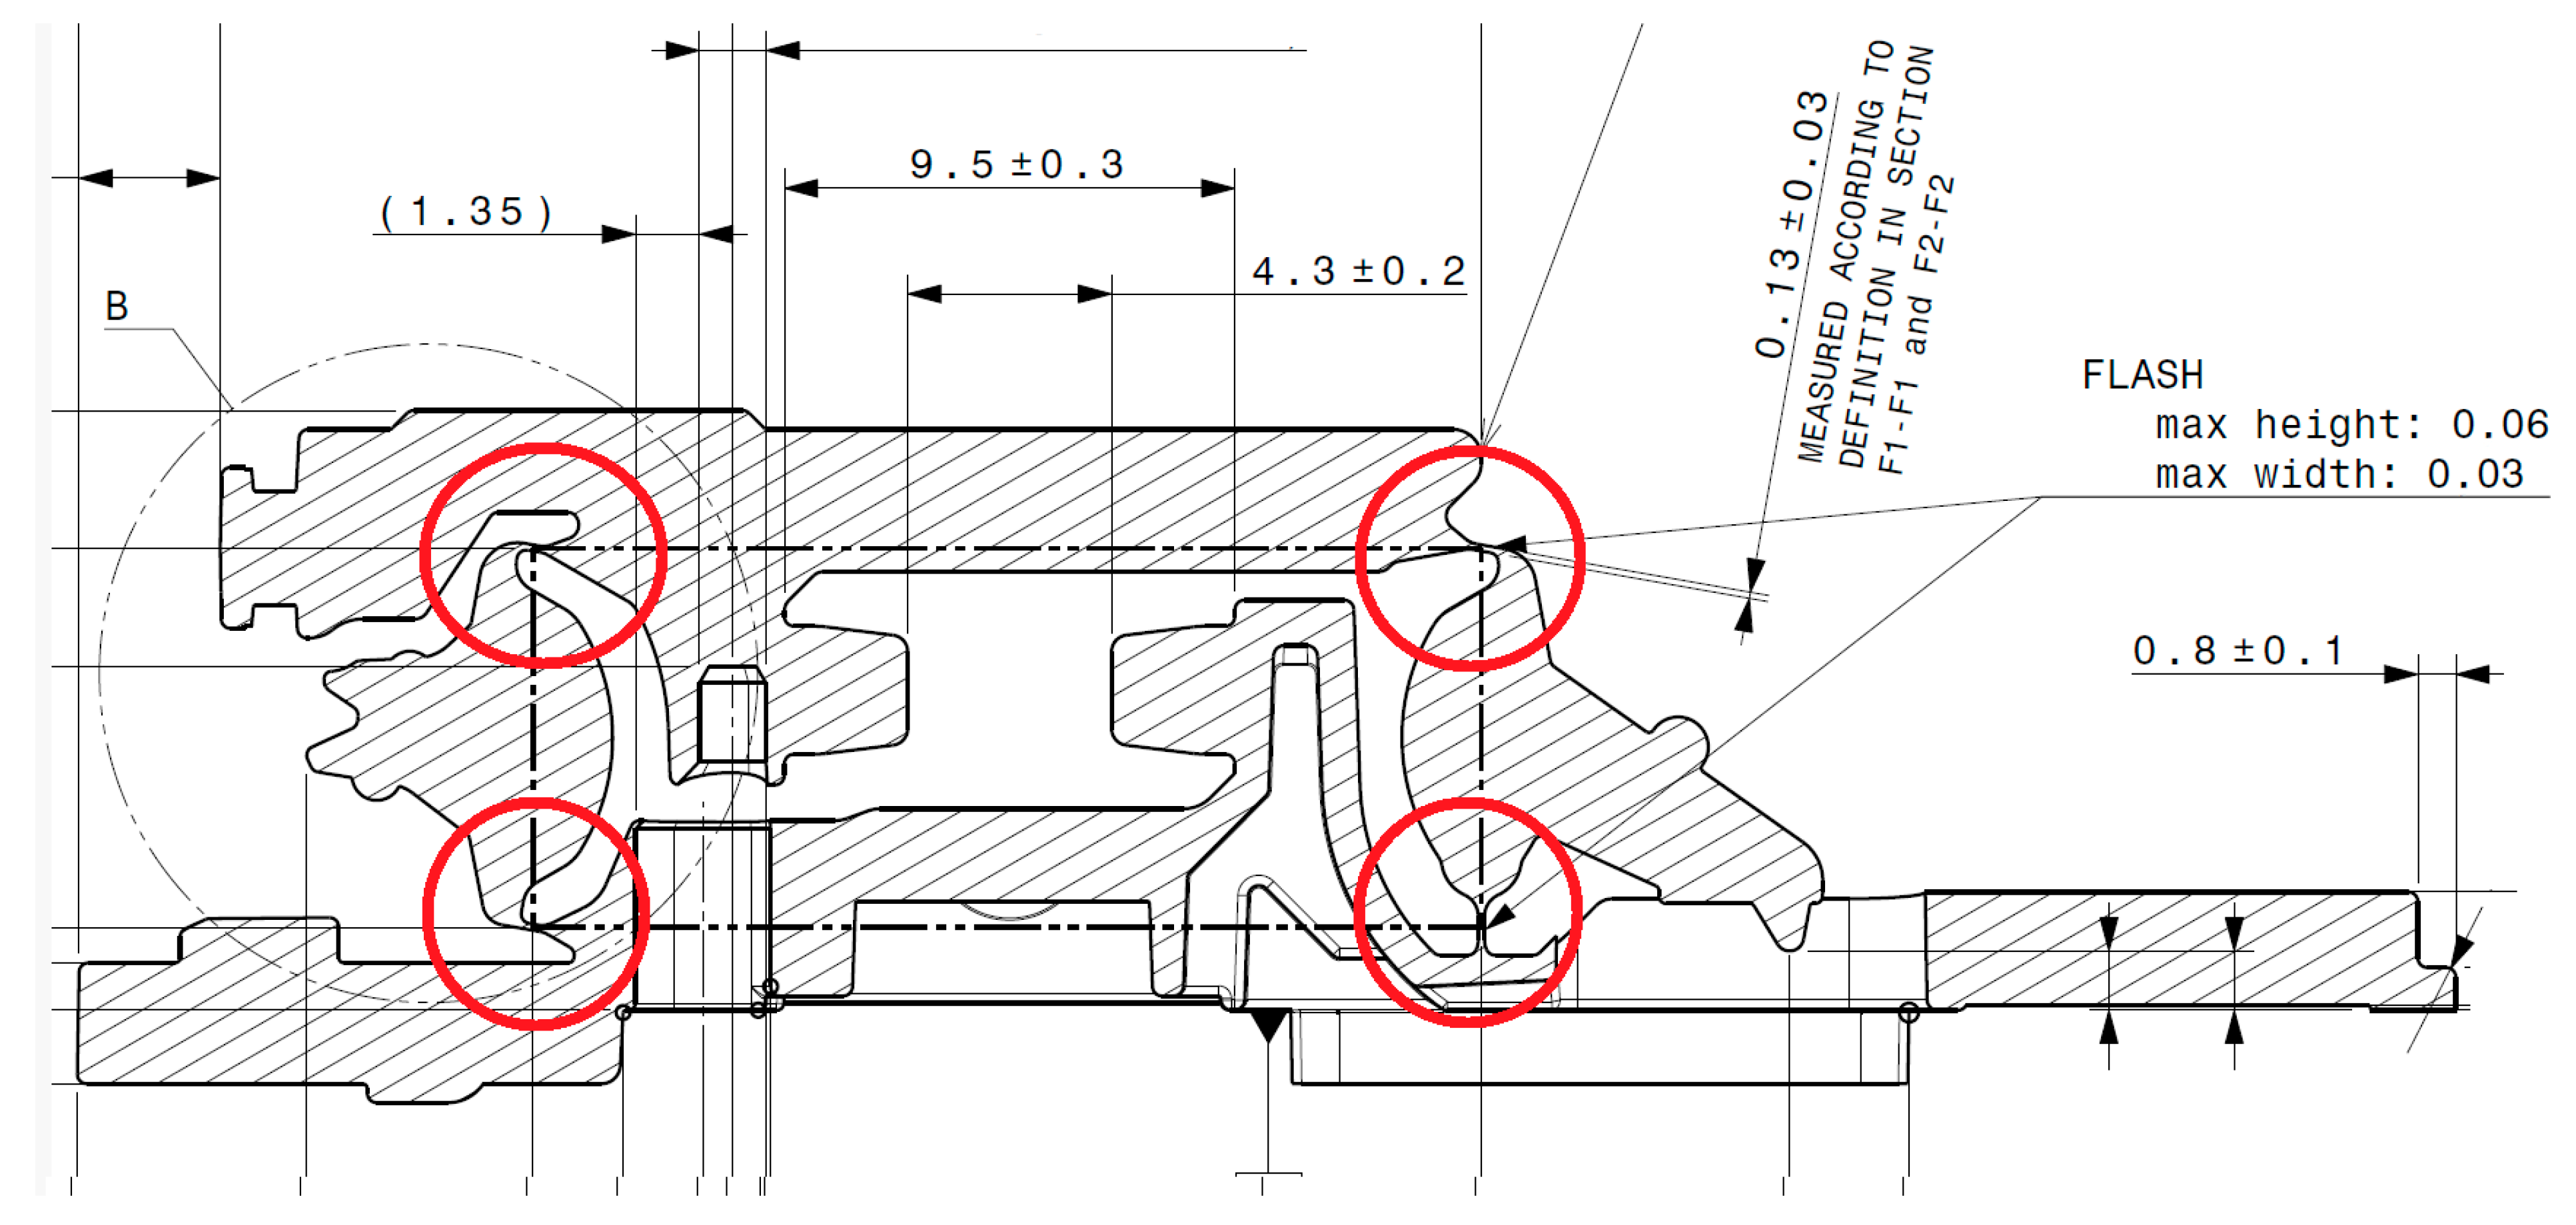
The main element of the valve, apart from the control plate, is the actuator, shown in Figure 1. Its task in the valve is to open and close the air channel, by means of which the position of individual seat elements is changed. The key parameter subject to control is the thickness of the hinges. They are marked with a red circle in Figure 2. This thickness determines the durability of the hinge throughout the product life cycle. The actuator is made of polyoxymethylene, and in thin places, such as the hinge, there are overhangs and flashes; the specification for this hinge is 0.13 ± 0.03 mm.
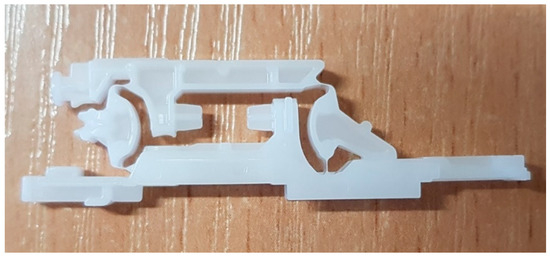
Figure 1.
Actuator.
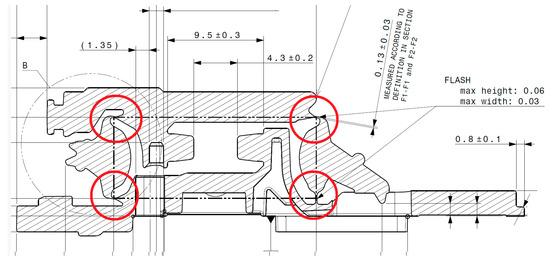
Figure 2.
Actuator—the detail under analysis (hinge thickness) is marked with a red circle.
There are many problems during measurement and the processing of results. These are the issues of cutting off noise from the material. The elements are inclusions and flashes created during the manufacturing process. Flashes created as a result of the manufacturing process cannot be included in the dimensioning process because it introduces an error that can cause results outside the specification to eliminate the product from use, while results below the lower tolerance can shorten the life of the component and thus shorten the life of the entire valve, causing the impossibility of adjustment by the user.
Due to the limited access of contact systems, hinge measurements can be performed using different optical systems. Standard microscopes require the operator to define measurement boundary points, based on which the product geometry is dimensioned. In the process of manufacturing plastic components, flashes and overflows appear. They can cause a lack of assembly or functionality of the part or an assembly containing such an element.
The main problem that the authors of this article have undertaken to solve is the appropriate selection of filtration parameters that will ensure the proper elimination of measurement noise from inclusions and flashes. Obtaining reliable results while eliminating inclusions is a compromise. On the one hand, the use of appropriate filtration allows for the elimination of noise, and on the other hand, results are obtained that present the actual level of quality of parts made in the injection process. These results are very important and helpful for people setting process parameters.
2. Materials and Methods
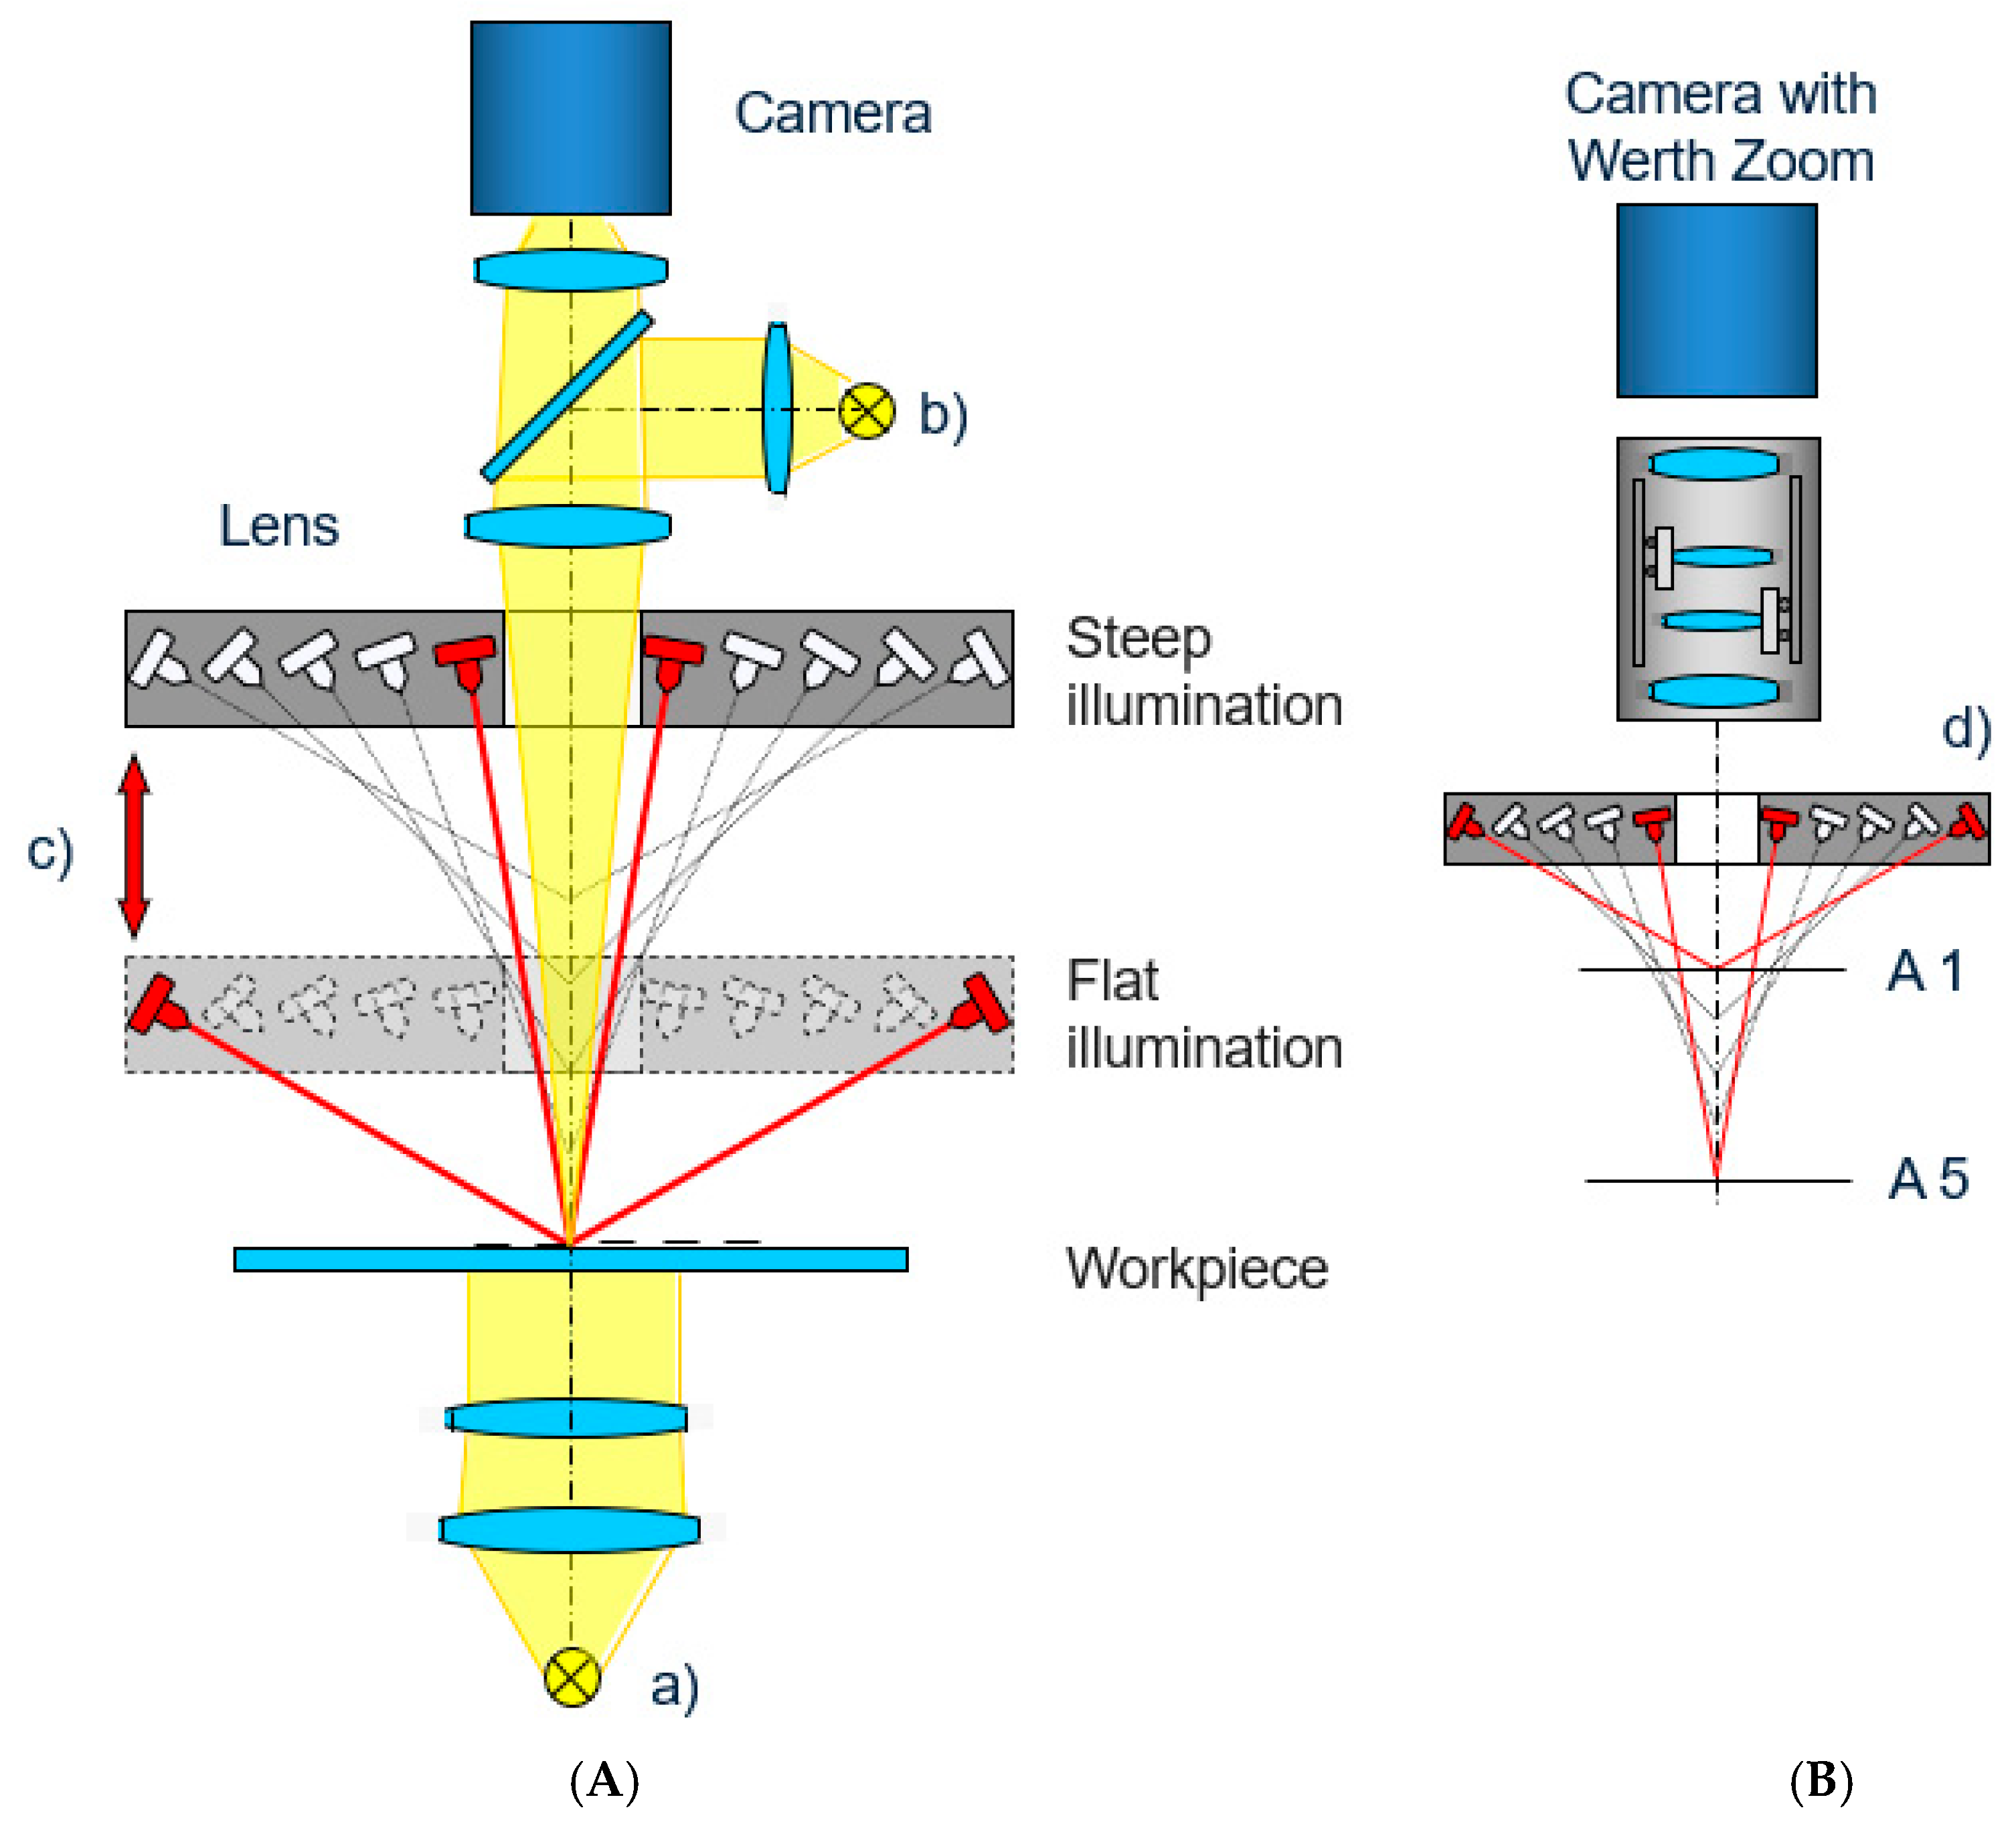
The Werth Scope Check multisensor machine was used for these measurements (Werth Messtechnik GmbH, Giessen, Germany). Multisensory machines use different sensors, which actually increases the range of their measurement capabilities. They combine the advantages of tactile and contactless measuring systems. The principle of operation and the benefits resulting from the use of such a solution are described in [11,12,13]. Examples of the use of multisensory coordinate measuring machines in industrial practice are described in [14]. In systems of this type, contact measurements can be used to determine reference points or to measure dimensions with narrow tolerance zones, while optical methods are used to inspect small products and to accelerate measurement processes [15]. A sensor based on image analysis was used in this study of the influence of filtration. The machine used for the measurements uses variable-focal-length optics (Werth Zoom) with an optical magnification range from 0.68 to 6.8 and a variable working distance. A diagram of the variable working distance is shown in Figure 3, while a view of the Werth Zoom optical sensor used is shown in Figure 4 [16]. For this sensor, the manufacturer specifies the permissible sampling errors according to VDI/VDE 2617 part 6.2, as follows:

Figure 3.
Views of the image acquisition sensor design: (A) standard zoom with a fixed working distance:, lighting types: (a)—transmitted light, (b)—bright field incident light integrated into the lens, (c)—dark field incident light ring, adjustable height for lenses with a fixed working distance, (d)—dark field incident light ring in combination with Werth Zoom; (B) Werth Zoom with a variable working distance. A1 and A5 represent different working distances.
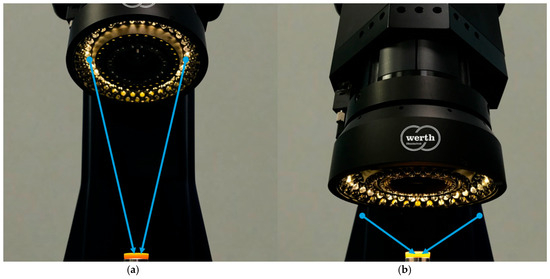
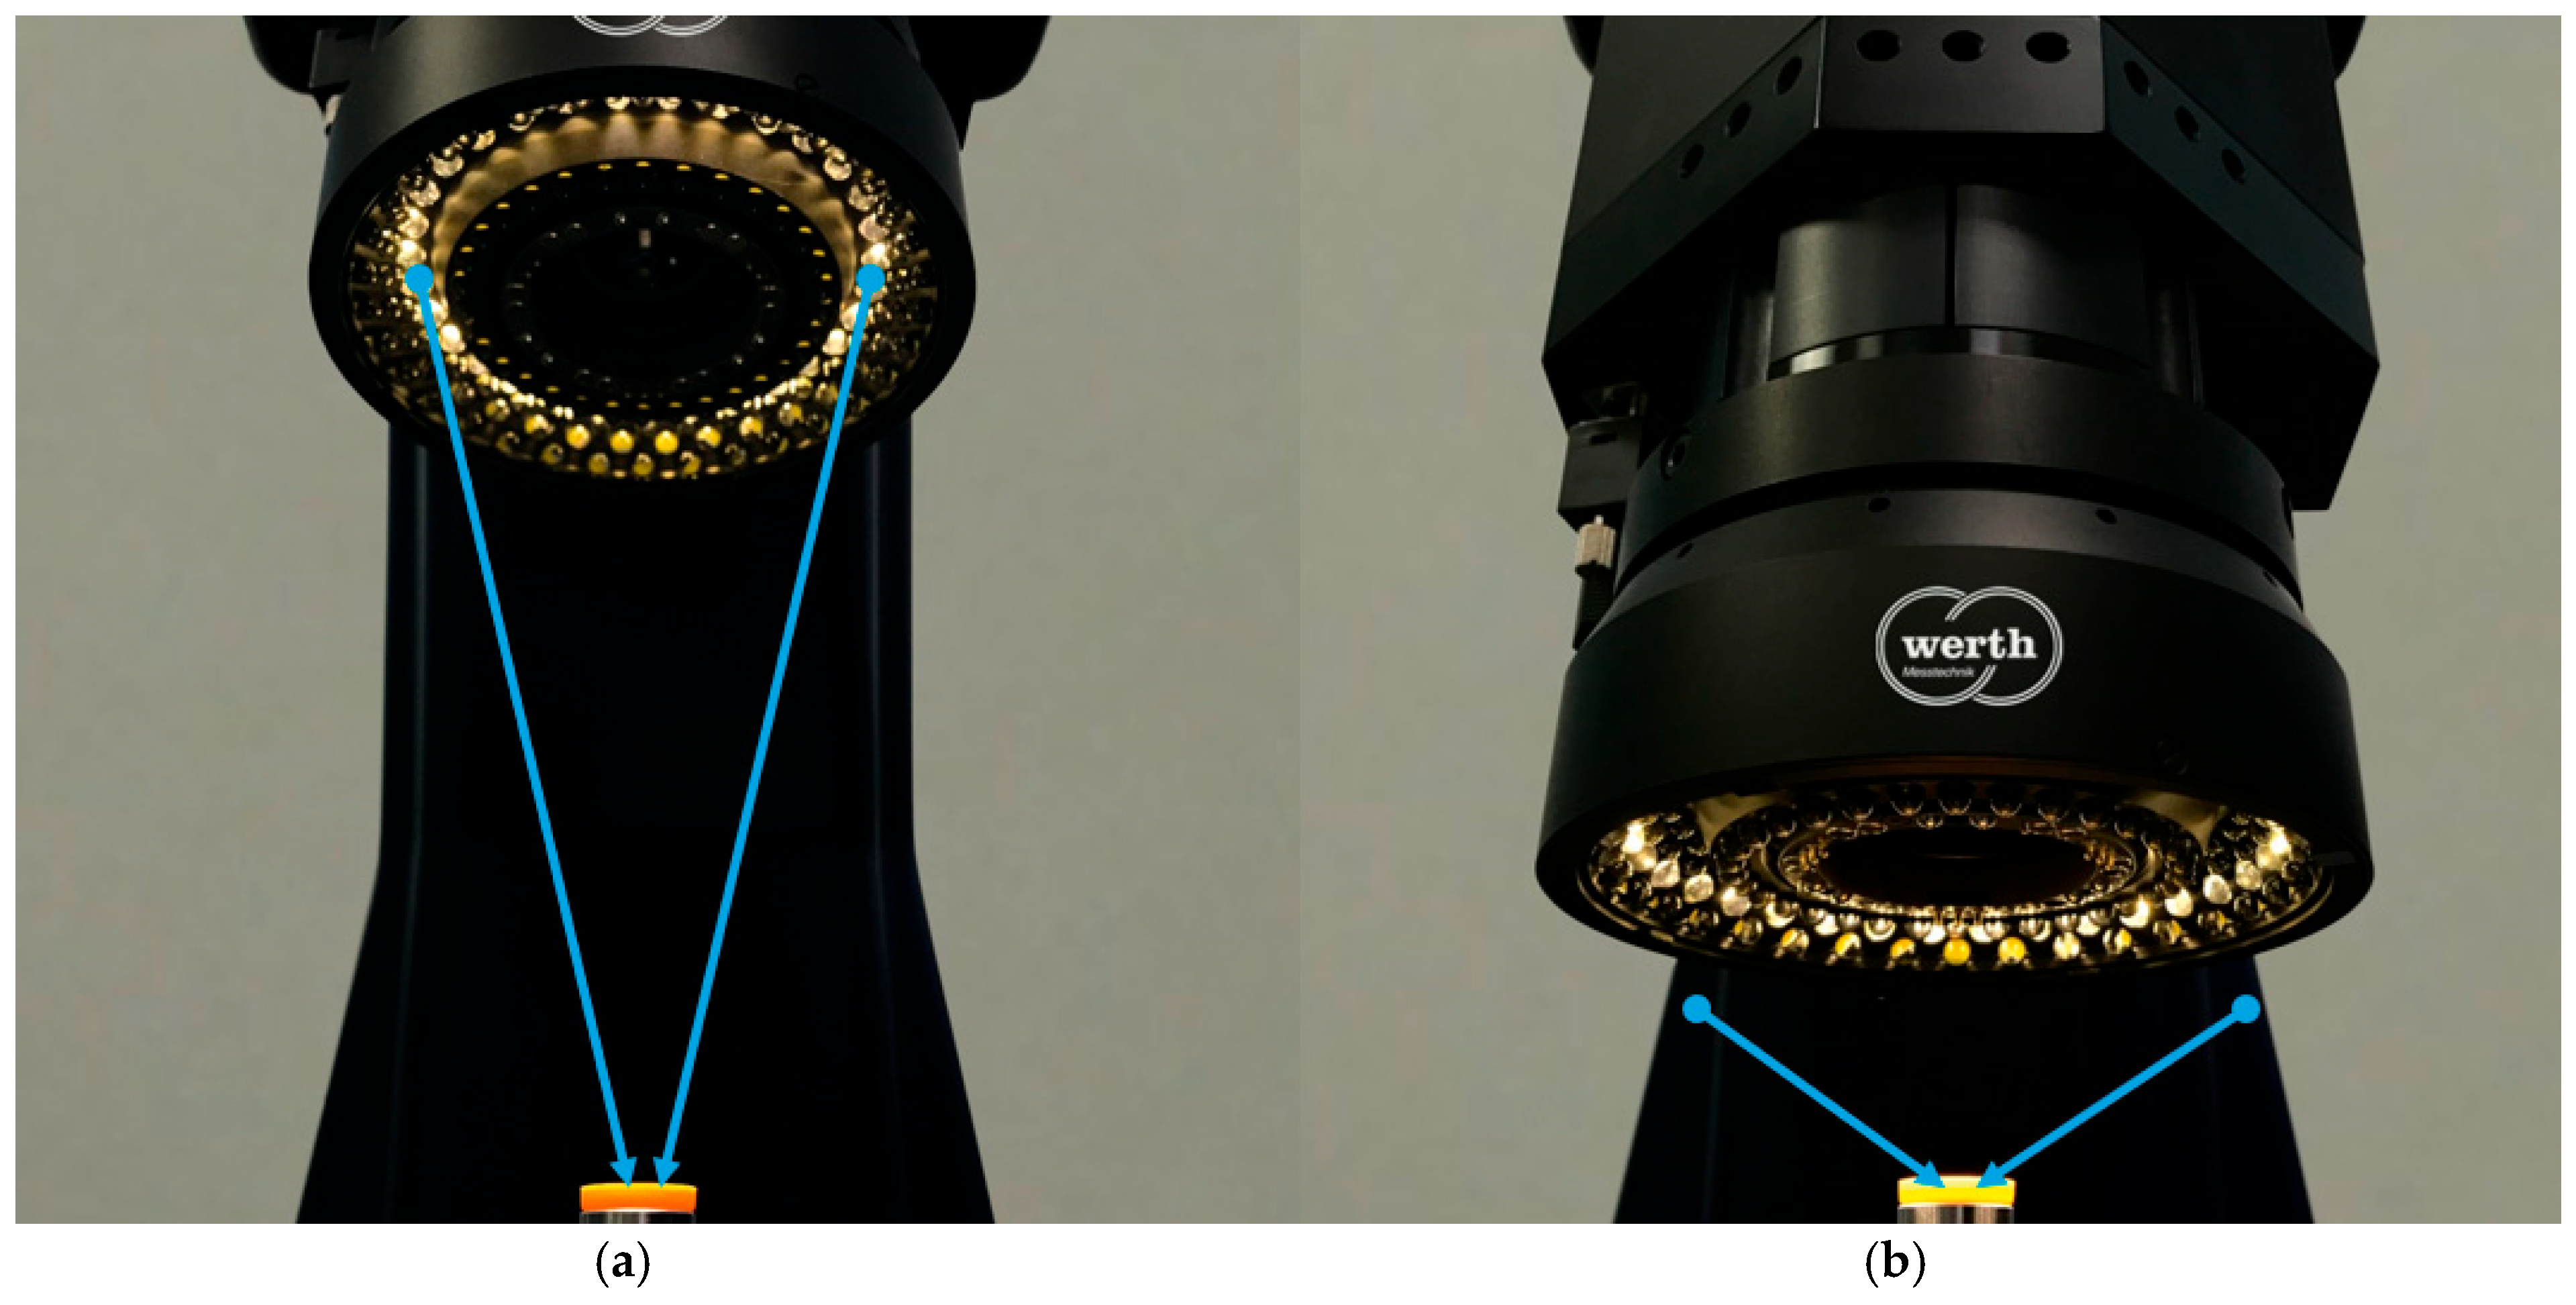
Figure 4.
Views of the working distance of the Werth Zoom optical sensor used: (a) 220 mm; (b) 37 mm.
- (a)
- For measurement without the participation of drives, i.e., measurement in the image (on static):
- ➢
- PS/PF 2D xy (OS): 1.1 µm.
- (b)
- For measurement with travel, i.e., with the participation of the machine drives (on transmission):
- ➢
- PS/PF 1Dxy (OT): 1.1 µm;
- ➢
- PS/PF 2Dxy (OT): 1.5 µm;
- ➢
- PS/PF 1Dz (OT): 2.5 µm.
Error studies were performed for measurements using the standard window and the highest magnification without an additional lens. In the above notation, PS denotes the error in the measurement of a dimension (Probing Size), for example, the diameter of a reference circle, and PF (Probing Form) denotes the deviation in the shape of the same circle.
The aim of this research using filtration is to assess the effect of the filter size on the measurement result. The use of an appropriate filter, correct interpretation, and the final result depend on the person measuring, who determines the size of the filter used in the measurements. In order to address the emerging measurement problems on the part of both the supplier and the customer, research for various filtration applications was started. For the conducted research, different filter sizes were used with the values 0, 5, 10, and 20. The filters used in the measurements are called “Dust” in the program.
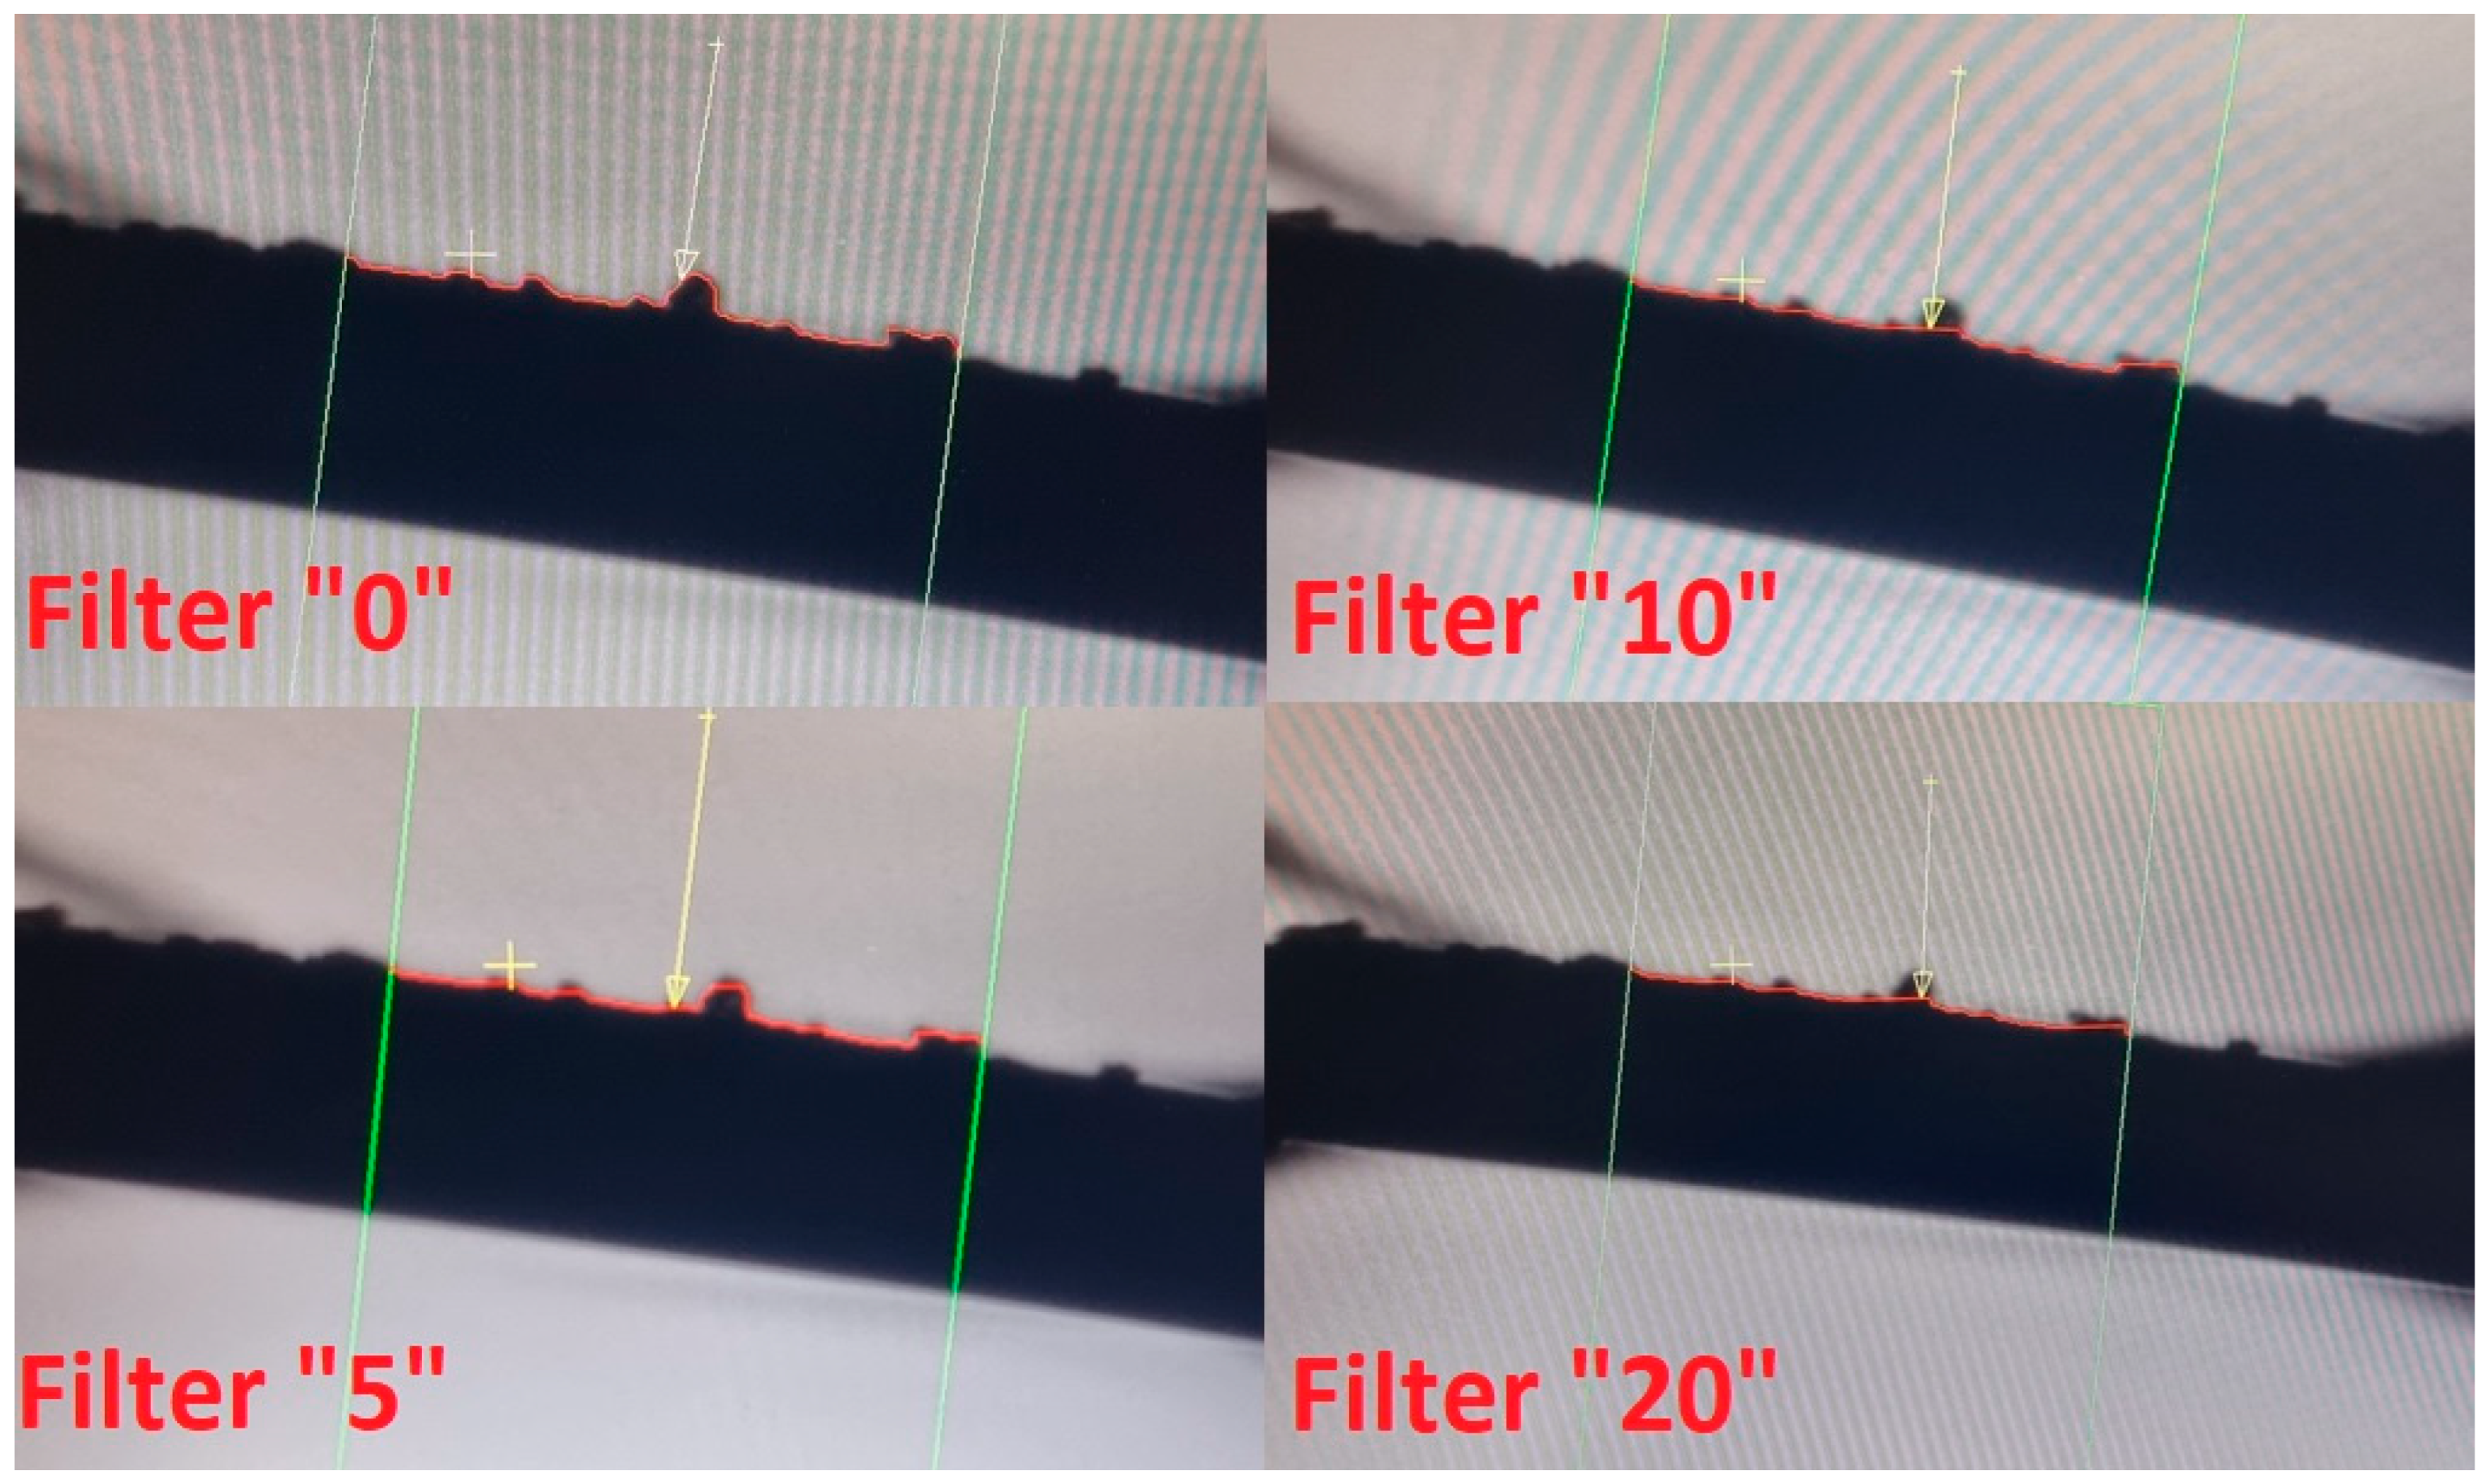
A filter with a value of “0” does not affect the measurement result, because the edge of the measured element is outlined in accordance with the actual state. With filters greater than zero, this outline is increasingly deeper into the material. Increasing the filter means that visible flashes and spouts are not taken into account during the measurement. A view of the change in the edge of the measured object using appropriate filter sizes is shown in Figure 5. As can be seen in the figure, filters with values of “10” and “20” already have a visible effect, but how this effect translates into the measured value is analyzed in this article. What filters should be used so as not to distort reality? This question also appears in the discussion and analysis of this problem. The entire analysis is intended to answer what size filters can be used in such cases and whether the selected filters reflect the actual image of the measured contour.

Figure 5.
Edge correction view with applied filters.
In modern multisensory machines, all light sources can be controlled automatically using measuring software. The brightness can be controlled using light reflected from an object. This enables practical use in measuring the surfaces of different materials [6]. In the measurements performed, an optical magnification of 6.8 and transmitted illumination with an intensity of 50% were used. The use of a lower intensity causes underexposure of the image, while the use of a higher intensity causes overexposure of the image.
In this study, measurements were taken in a single cross-section in order to observe the variability between the results for different filters. The position of the measurement window was determined based on the coordinate system built on the part, not the machine. This approach ensured the repeatability of the measurement, which is particularly important for parts of such small dimensions. Filtration is an increasingly popular tool enabling measurements from materials that leave flashes during the manufacturing process. This applies to plastic and composite products, which, due to their properties, are more often used not only by car manufacturers but also in other material goods. These include all types of household appliances, electronics, and even sports equipment for both amateurs and professional athletes. During the tests, care was taken to minimize the impact of the environment. For this purpose, the temperature was kept within the acceptance limits, which were defined as 20 ± 0.5 °C. The samples were prepared and left for 24 h. This was to ensure stability, which is extremely important for plastics.
3. Results
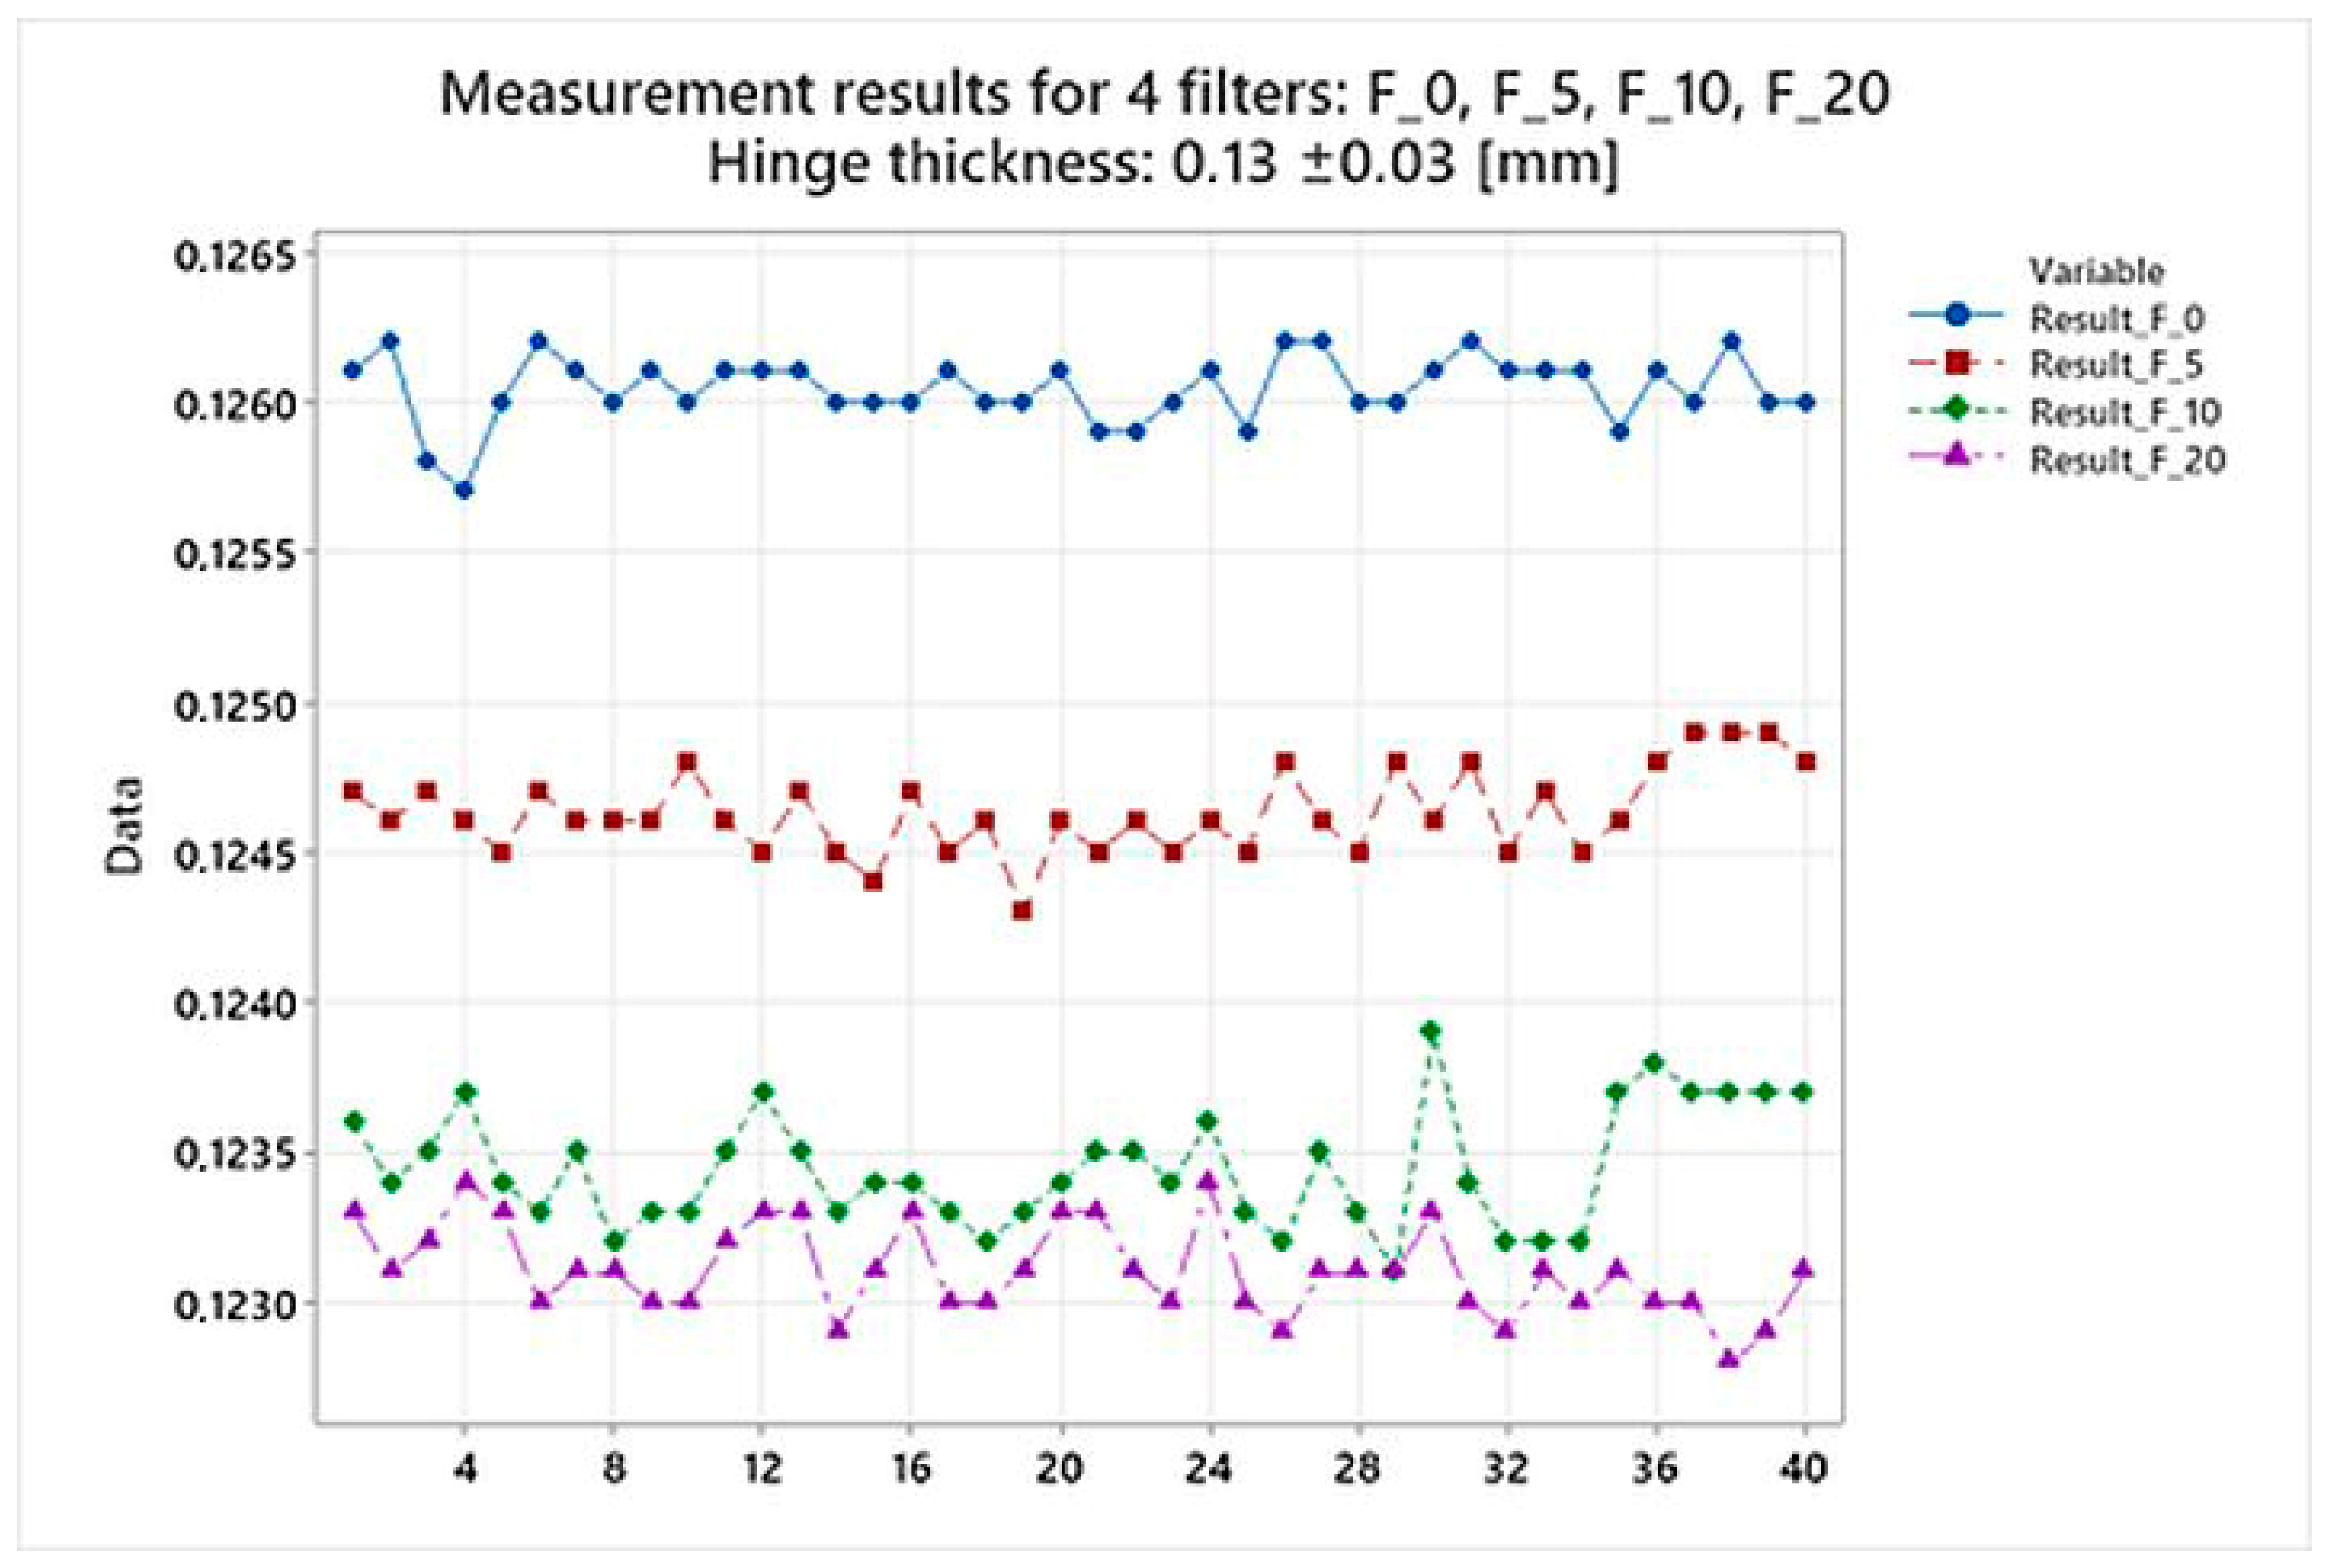
For each filter, 40 measurements of the hinge thickness were taken. For each filter used, a statistical analysis was performed in the Minitab 22.1 (64-bit) environment. The initial statistical analysis of the data included determining the basic statistical parameters presented in Table 1, as well as an analysis of variance planned later to verify the hypothesis of equality of variances for each of the analyzed factors, which were the filters used. A graph was developed from the data, presenting the results for all four analyzed filters.

Table 1.
Preliminary statistical analysis of data. Results are in mm.
For each filter, a preliminary statistical analysis of the data was performed. Basic statistical parameters were determined. The results are presented in Table 1, and the graphical interpretation is shown in Figure 6 and Figure 7.
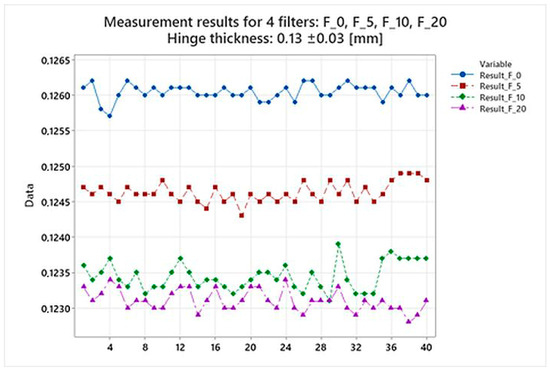
Figure 6.
Comparison of results for four filters used during measurements.
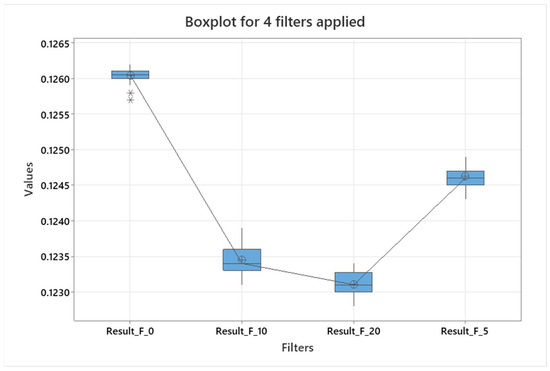
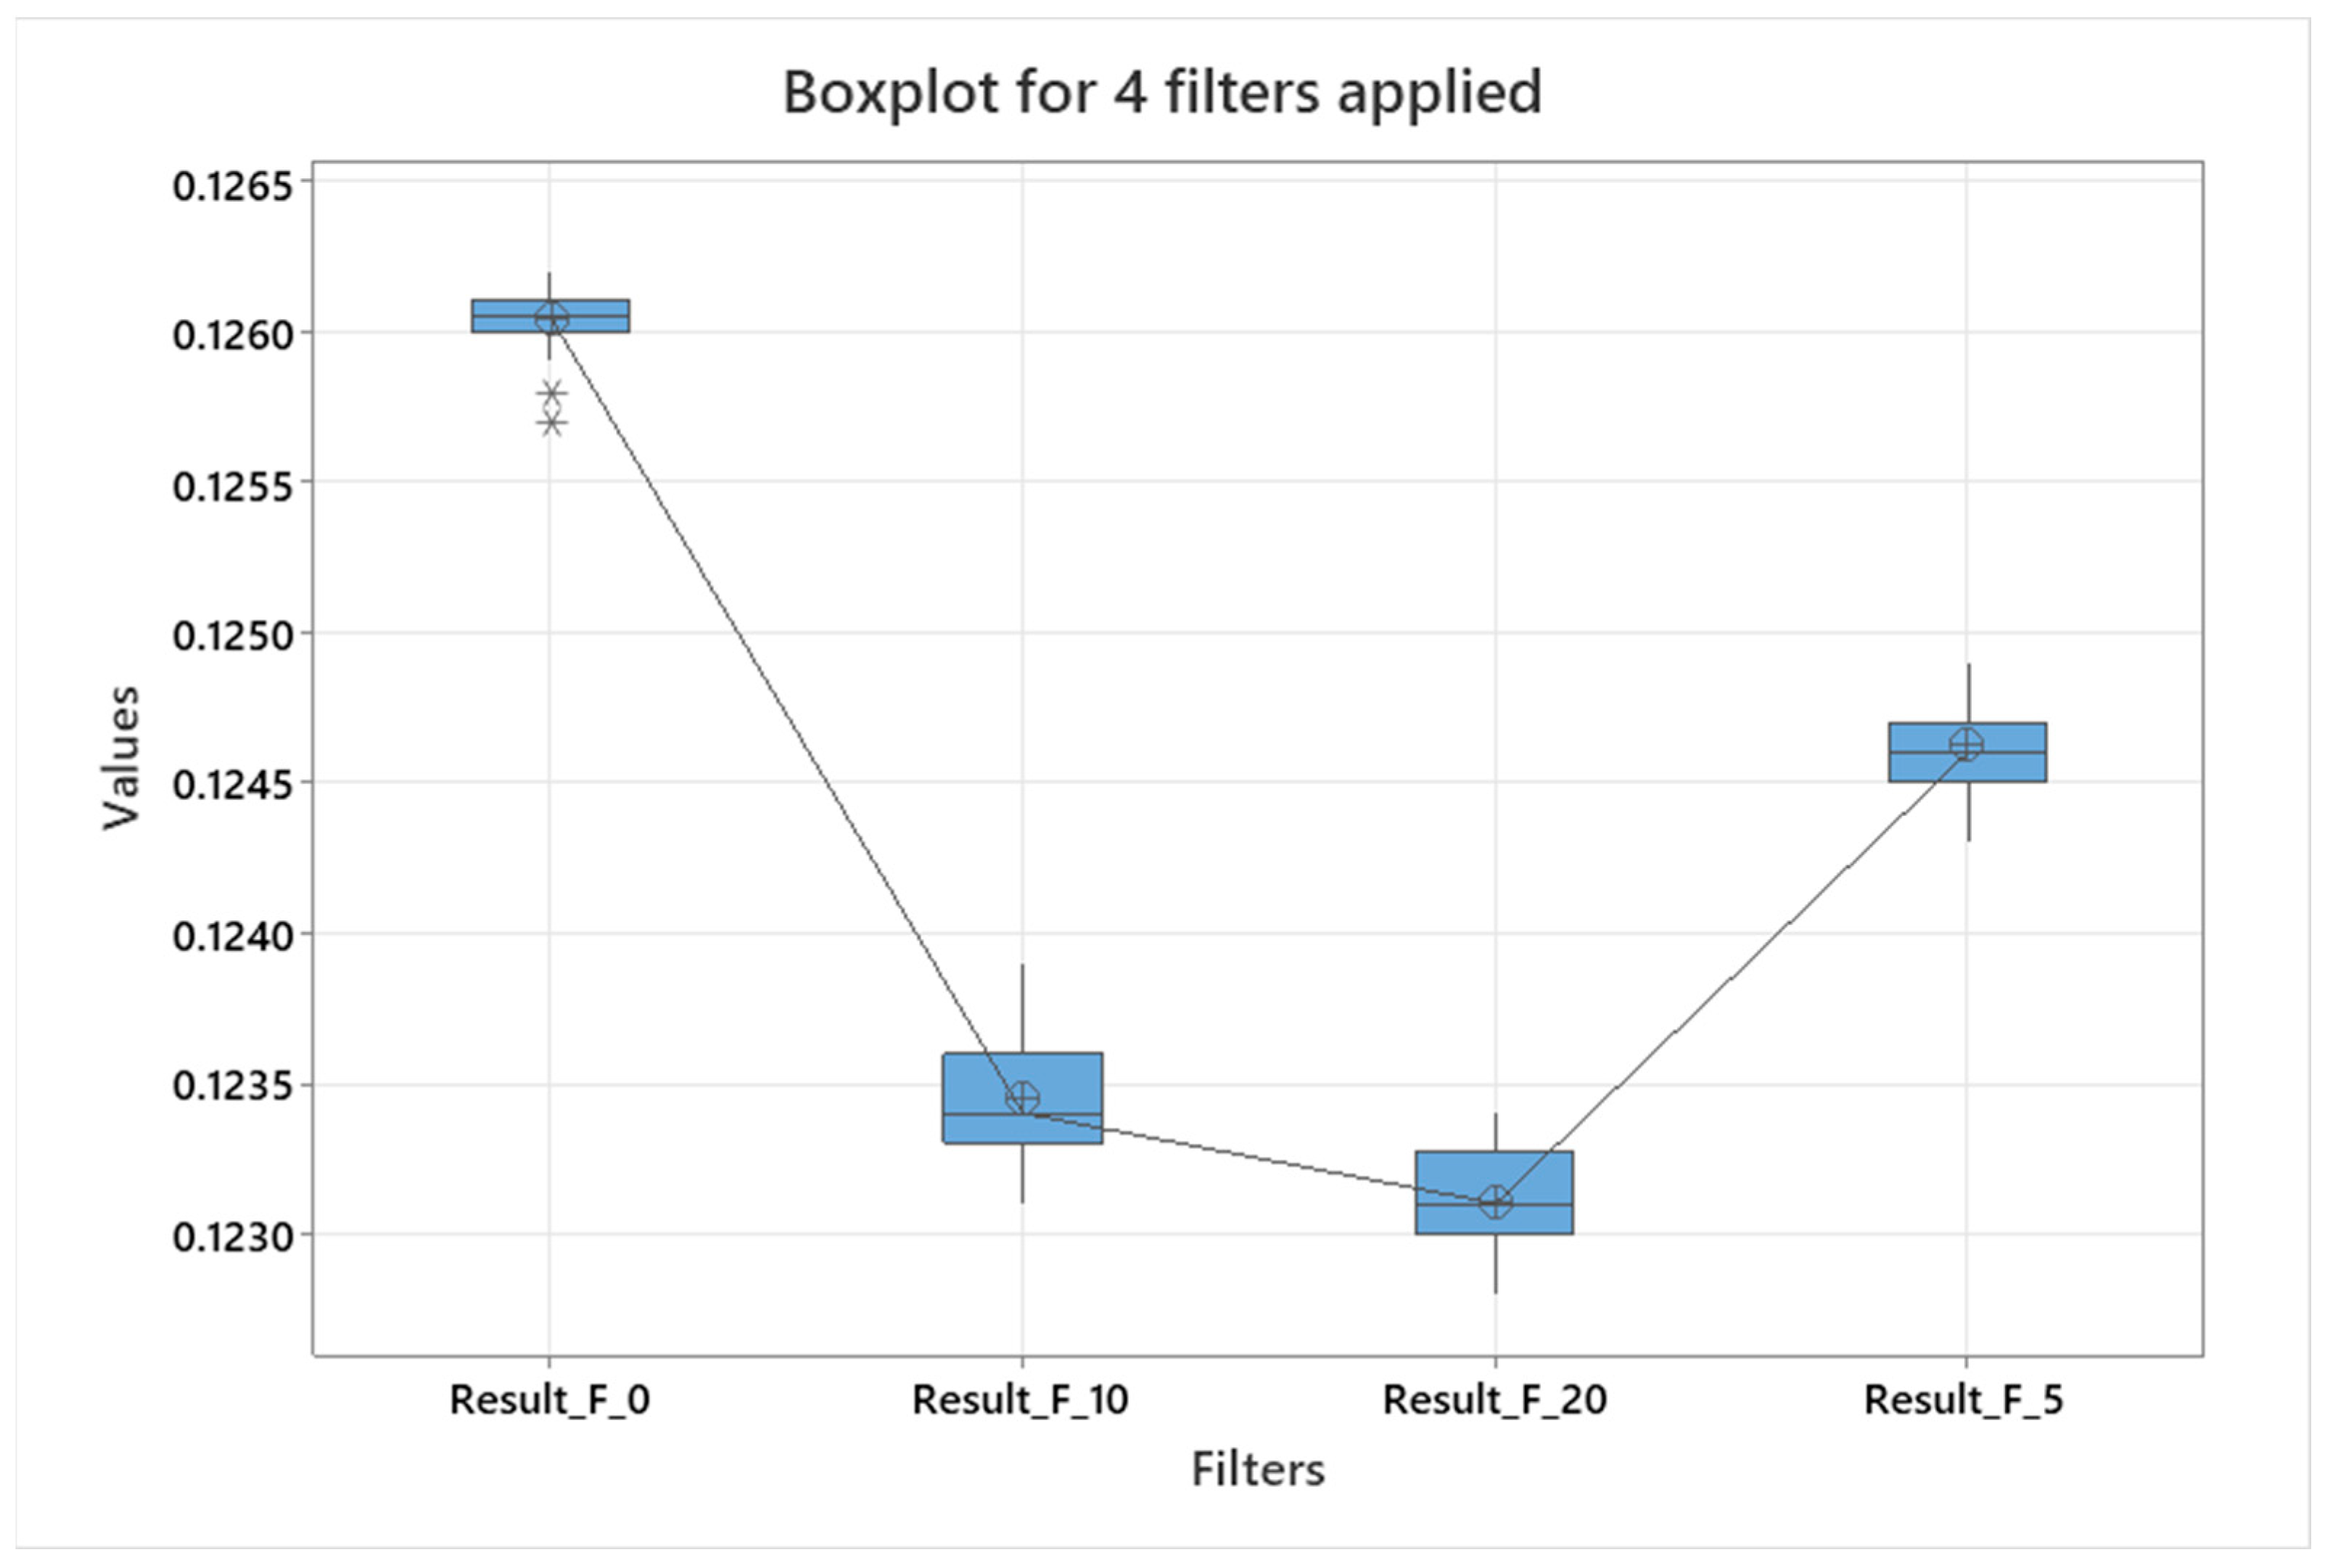
Figure 7.
Boxplot for applied filters. Stars indicate outliers.
The graph in Figure 6 shows the differences between the individual filters, which confirms that filtration affects the measurement results. By increasing the filter value, we obtain lower values from the measurements. Figure 7 leads to the same conclusion. This graph is a commonly known graph called a box with whiskers. It presents a comparison of data obtained from measurements for the filters used. From this graph, we can obtain information about the location and dispersion of the data. For the first box, i.e., for the zero filter, we observe values that are outliers from the rest, which are not visible for the remaining boxes corresponding to filters 10, 20, and 5. In addition, we can see that the median for filters 0 and 5 is in the middle position, while for filters 10 and 20, the median is shifted towards the first quartile.
4. Discussion
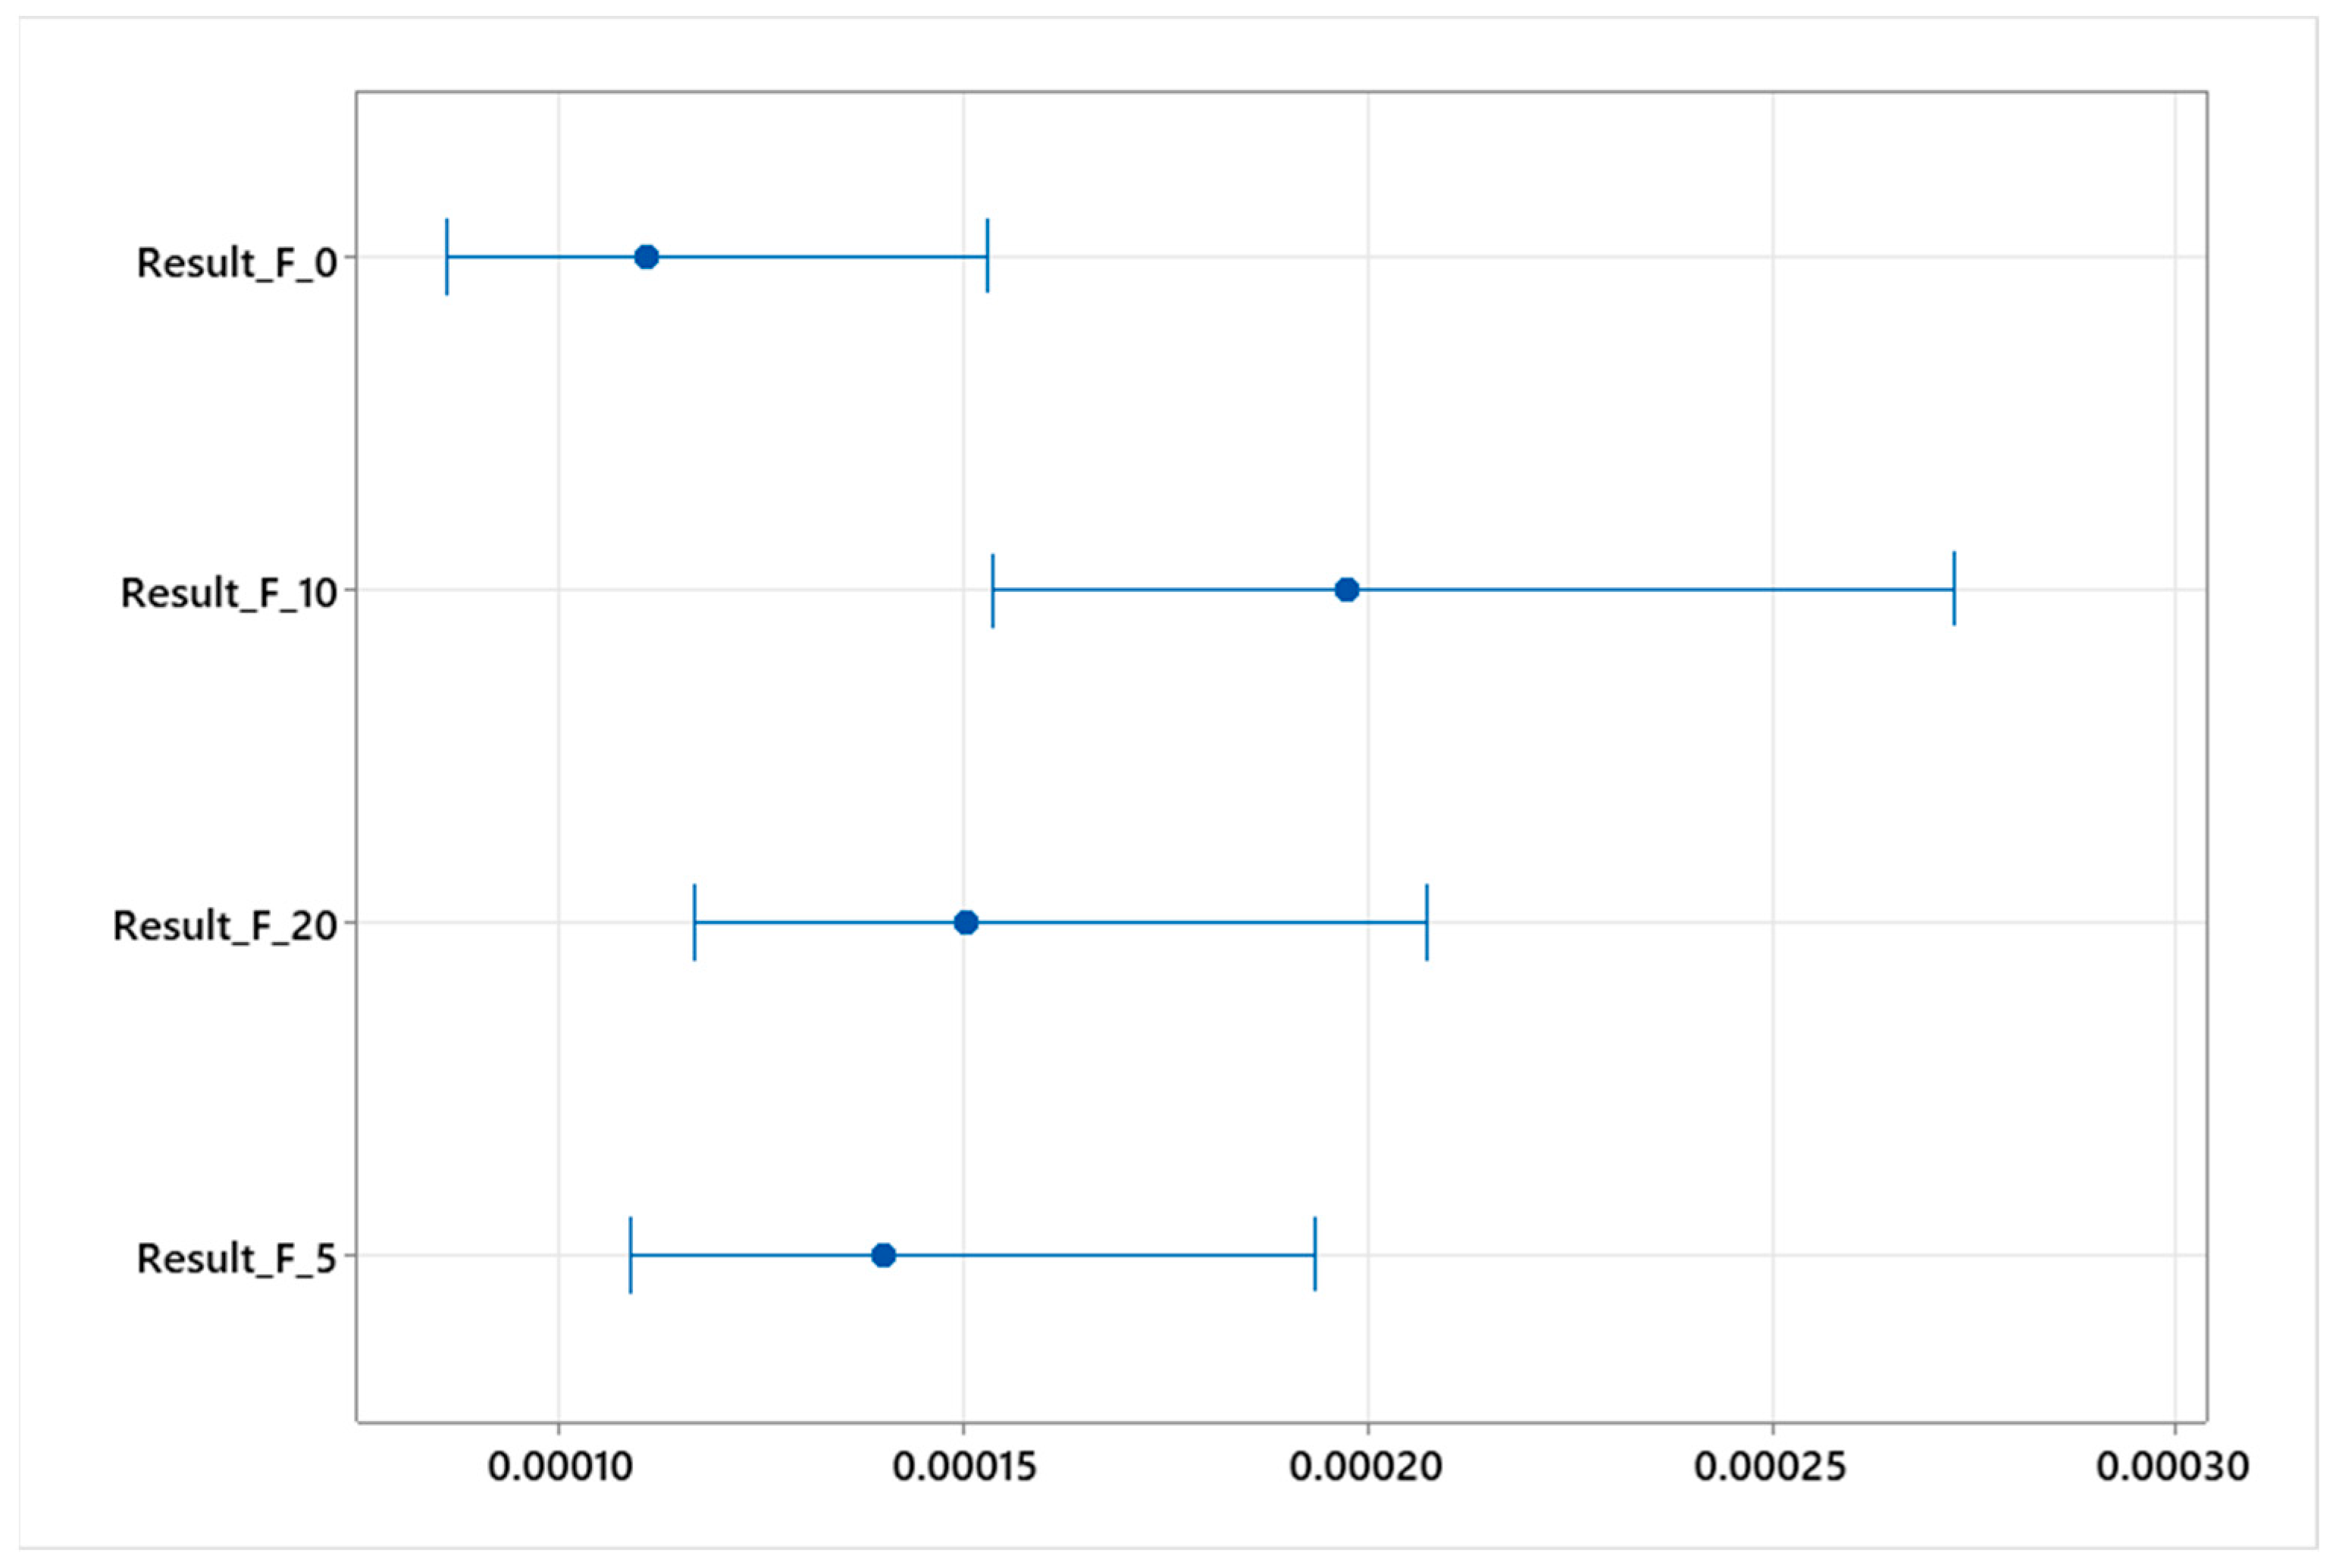
The initial statistical analysis included the identification of outliers. Basic descriptive parameters were determined, as shown in Table 1. The statistical analysis is presented in Figure 7. Using the multiple comparison test and Bartlett’s test [17,18] for parameters subject to a normal distribution, a statistically significant difference was found at the significance level of α = 0.05 between the variances at the analyzed levels of the studied factor: multiple comparison test—p-posttest = 0.004, Bartlett’s test—p-posttest = 0.004 (Figure 8).
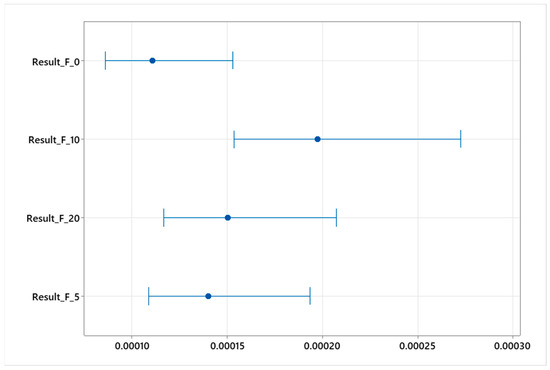
Figure 8.
Graphical interpretation of the multiple comparison test.
The classic tool for assessing the influence of a selected factor on the behavior of the result parameter is the analysis of variance (ANOVA). The use of this analysis requires meeting certain assumptions, i.e., randomization, equality of variances, and normality of residuals. In a situation where these assumptions are not met, an alternative to one-factor ANOVA is the Welch test or the nonparametric Kruskal–Wallis test (the so-called distribution-free ANOVA) [18,19].
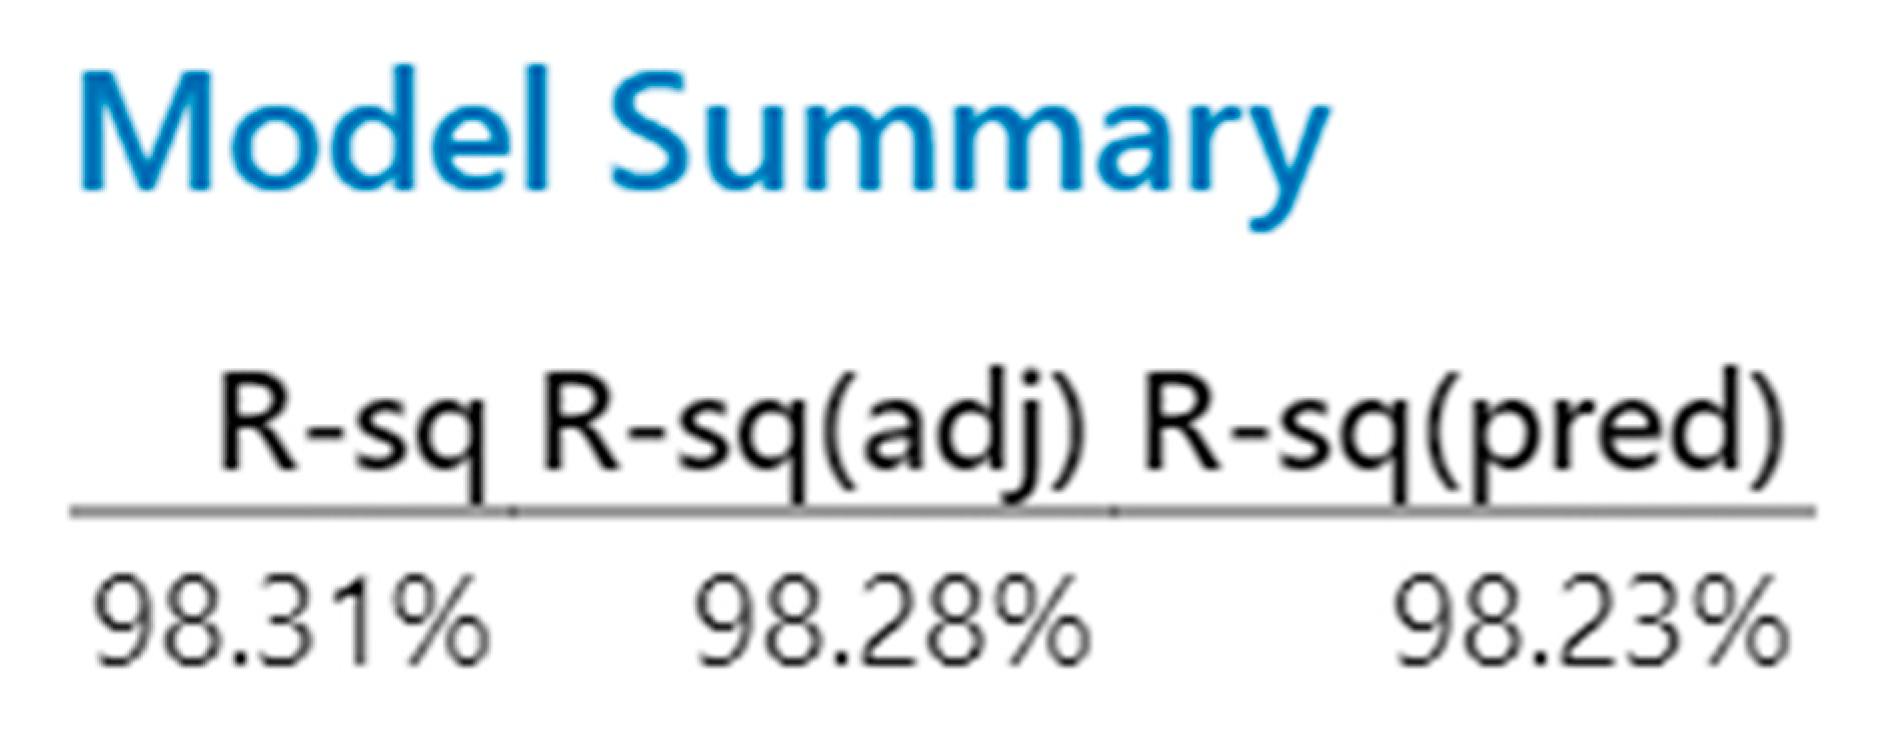
Due to the lack of equality of variances found at the levels of the analyzed factor (which were the filters used: “0”, “5”, “10”, and “20”), the Welch test [20] was used to assess the impact of filtering on the expected assessment result. If the Welch test indicates that there is a significant difference between the levels of the analyzed factor (filters), the Games–Howell multiple comparison test can be used to determine between which levels a statistically significant difference is observed [17]. Through this test, we rejected the hypothesis of equality of mean values at the analyzed levels of the tested factor in favor of the alternative hypothesis that there is a statistically significant difference between at least two levels (p-posttest = 0.000). The very high coefficient of determination, R2 = 98.31%, is also noteworthy and is presented below (Figure 9).

Figure 9.
Determination coefficient result.
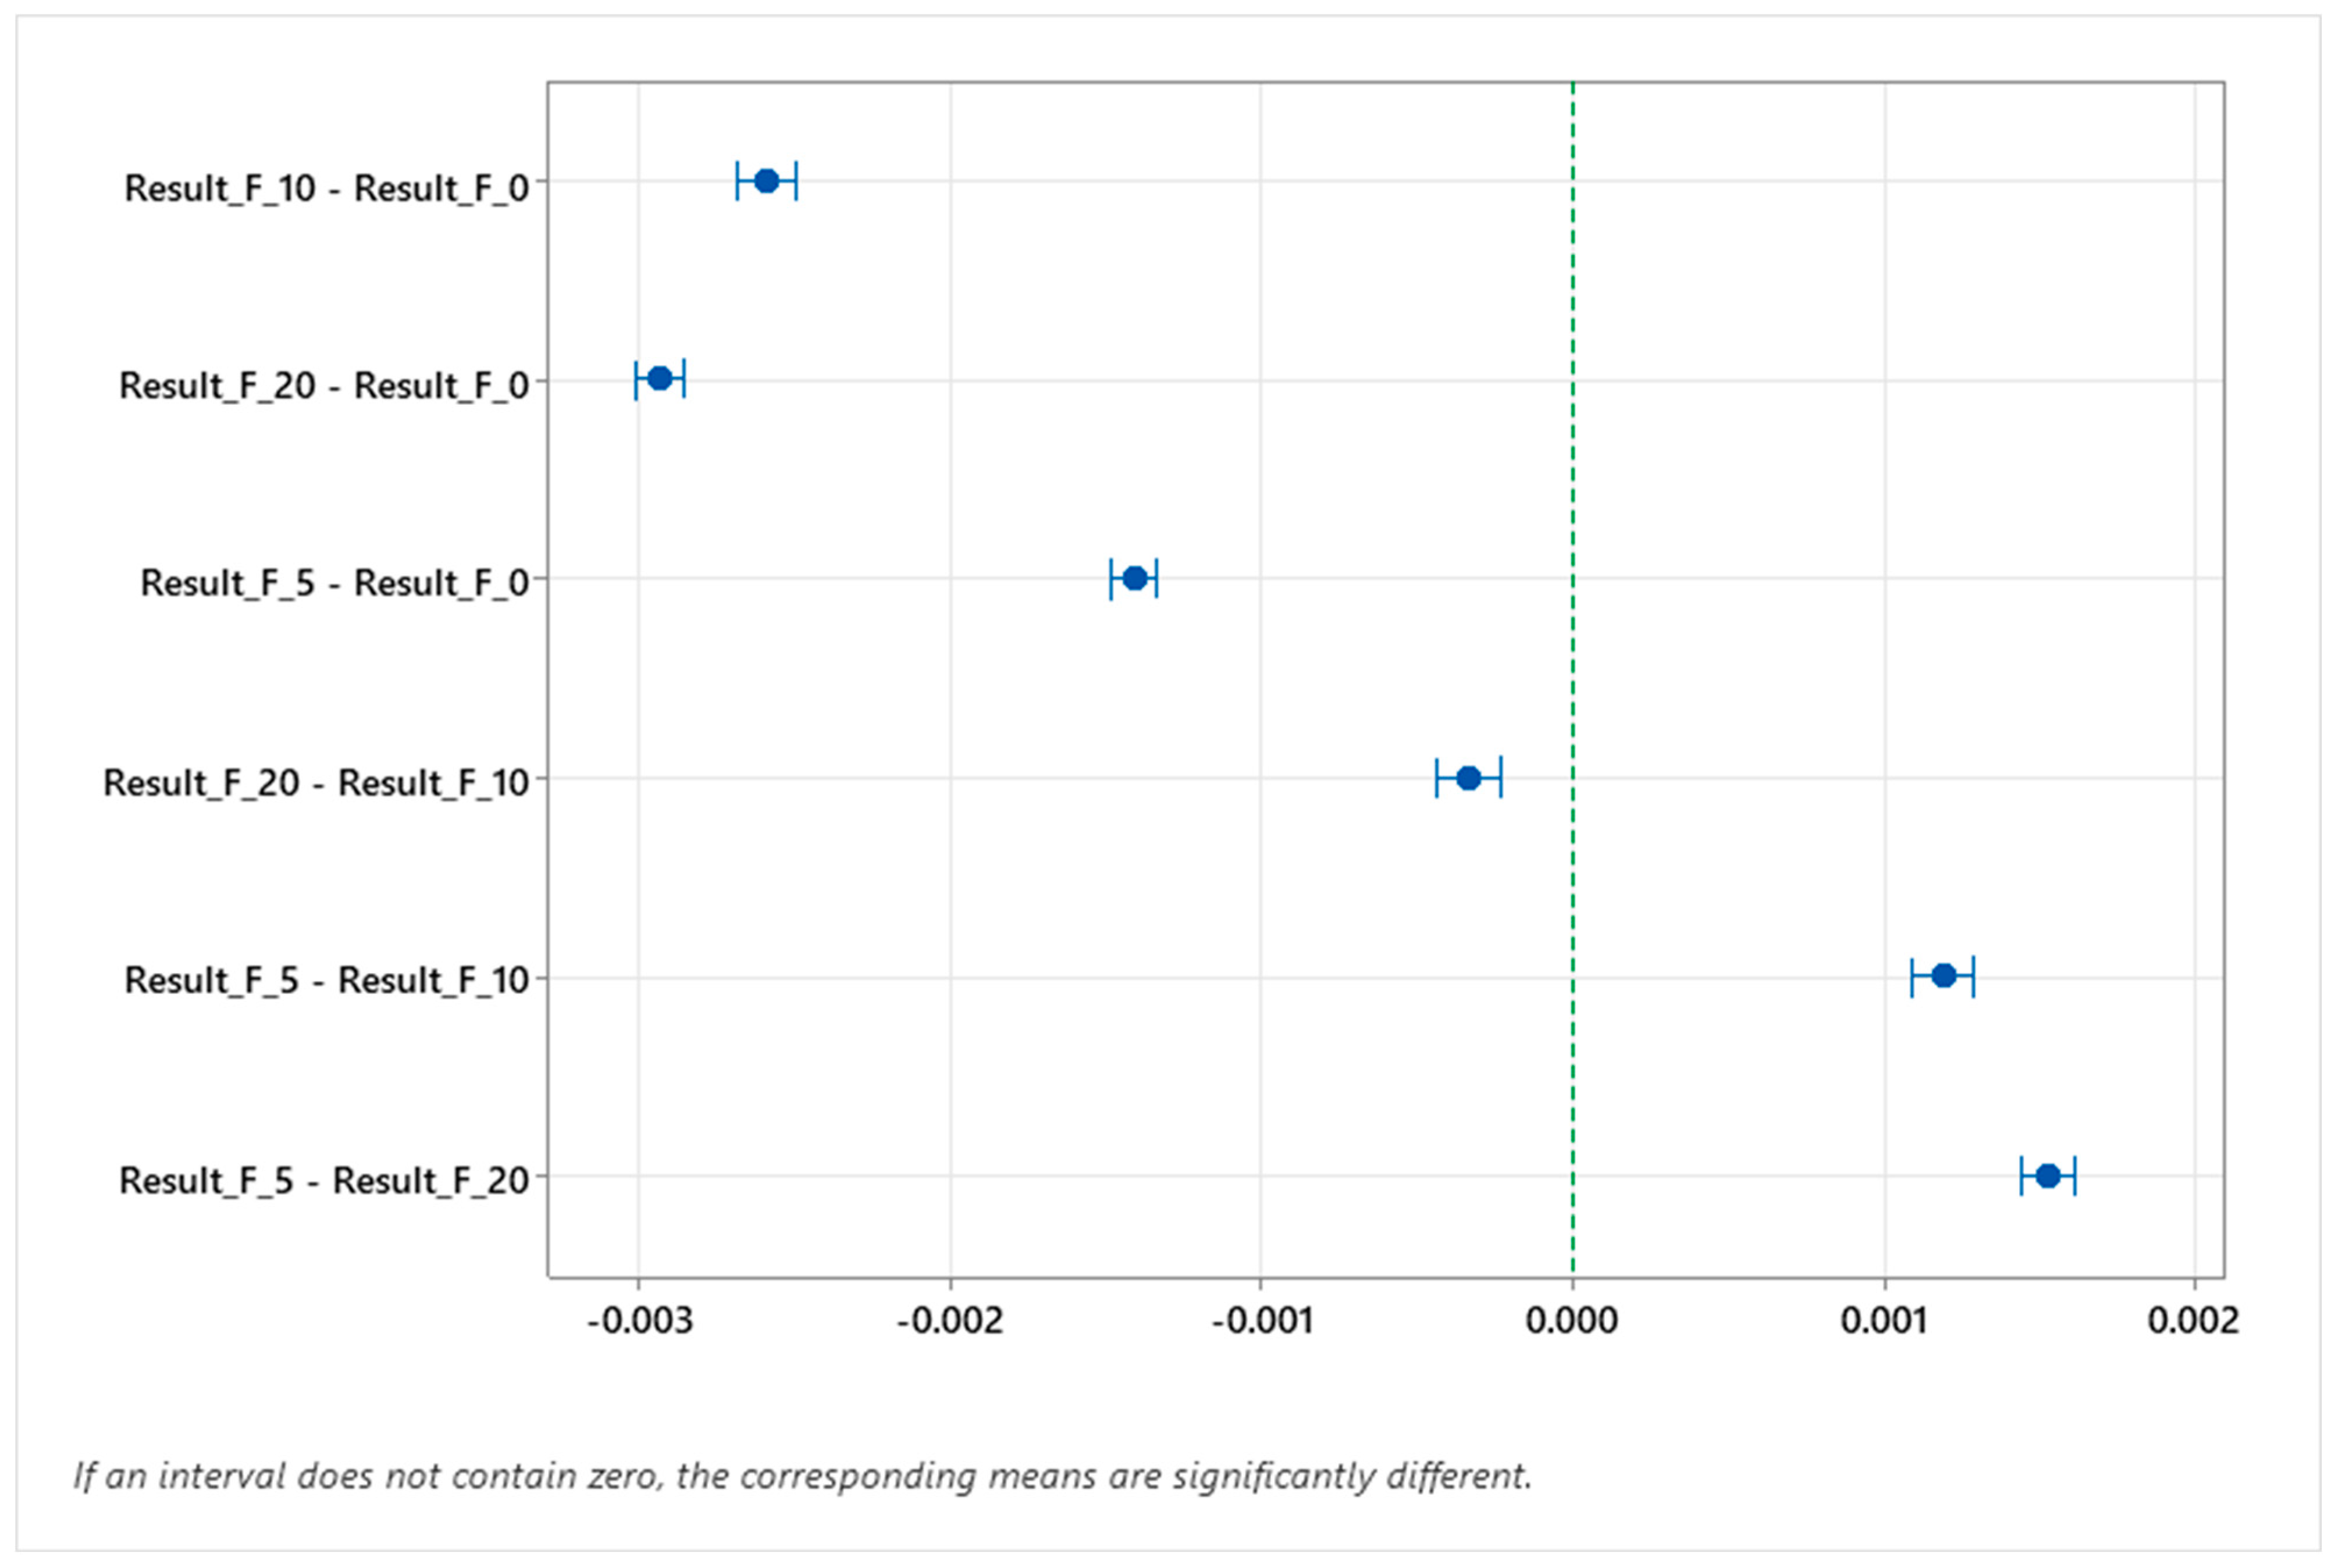
In view of the rejection of the hypothesis of equality of mean values at the analyzed filtering levels, the Games–Howell multiple comparison test (post hoc test) was performed to identify the significance of differences between the means for each pair of filtering levels. At the significance level of α = 0.05, there was a statistically significant difference between each pair of filtering levels (Figure 10).
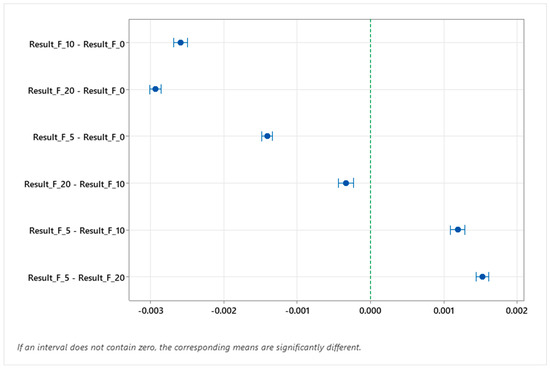
Figure 10.
Games–Howell multiple comparison test.
The analyses and results obtained clearly show that the use of filters with higher values cuts off the noise to a much greater extent than the assumed need. The use of filters with values of “5” or “10” gives a real answer as to the value of the measured characteristic and does not distort the actual values. This is a compromise between the benefits and losses obtained from the use of the filtration value.
5. Conclusions
The obtained measurement results allowed for a series of statistical analyses to be carried out, which confirmed the assumptions regarding the reliability of the results obtained using optical systems with variable-focal-length optics and a variable working distance. The optical sensor in the multisensory machine used for measurements showed how significant an impact the use of inappropriate filter sizes can have. The use of a filter has a significant impact on the measurement results; therefore, before using a filter, the user should carefully consider to what extent they want to obtain reliable results reflecting the real image of the measured detail. A compromise must be found between the benefits and losses resulting from the use of an inappropriate filter.
The conducted study confirmed that filtration is one of the elements that influences the distortion of reality. This fact means that the machine user should analyze the validity of using filtration or balance the benefits of its use. This does not mean that filtration is unnecessary. On the contrary, it is a very useful tool, allowing for measurements and the separation of noise generated in the manufacturing process. The plastic injection process is a complicated manufacturing process, much more difficult than the steel manufacturing process. This conclusion is boldly put, because plastics are more susceptible to the influence of temperature and shrinkage during the process. Post-production processing is also a difficulty, because it is not possible to carry out corrections by means of mechanical processing, unlike for parts manufactured from steel. The use of filtration should be based on experience and tests, so as not to improve too much the real level of quality obtained in the original process.
The use of filtration with a value higher than “0” has an impact on the obtained results. In the conducted studies, it turned out that the use of filtration at the level of “5” or “10” allowed us to obtain results close to the real ones. In such a case, cutting off noise is a cosmetic procedure, because it does not interfere with the depth of the material but only corrects the measured edge. The use of filter values of “20” or more causes distortion of the real dimensions and thus negatively affects the adjustments and settings of machines in the process.
In addition to confirming the thesis regarding the influence of filtration, the tests carried out in this study also influenced the planning of the next experiment. The authors intend to conduct another study using “Dust” filters for details that will be subjected to calibration. Determining the reference value will provide a real reference for the values obtained from measurements using filtration. This will allow us to obtain information on the extent to which the algorithm used affects the actual measurement result.
Author Contributions
Conceptualization, W.Z. and A.G.; methodology, W.Z.; investigation, W.Z. and W.H.; data curation, W.Z. and W.H.; writing—original draft preparation, W.Z. and A.G.; writing—review and editing, W.Z., A.G. and J.A.S.; visualization, W.Z.; supervision, J.A.S. All authors have read and agreed to the published version of the manuscript.
Funding
This research was funded by the Polish Ministry of Education and Science, grant number DWD/4/25/2020.
Institutional Review Board Statement
Not applicable.
Informed Consent Statement
Not applicable.
Data Availability Statement
The raw data supporting the conclusions of this article will be made available by the authors on request.
Conflicts of Interest
Author Wiesław Zaborowski was employed by the company Lear Corporation Poland II, Sp.z o.o. The remaining authors declare that the research was conducted in the absence of any commercial or financial relationships that could be construed as a potential conflict of interest.
References
- Grechnikov, F.V.; Zakharov, O.V.; Kochetkov, A.V. Analysis of the applicability of filtration methods for coordinate measurements. MATEC Web Conf. 2018, 224, 01093. [Google Scholar] [CrossRef]
- Grechnikov, F.V.; Kochetkov, A.V.; Zakharov, O.V. Selection of Methods for Filtering the Signal when Measuring at Coordinate Measuring Machine. In Proceedings of the 14th International Scientific-Technical Conference APEIE, Novosibirsk, Russia, 2–6 October 2018. [Google Scholar]
- Kochetkov, A.V.; Zakharchenko, M.Y.; Troshin, A.A.; Zakharov, O.V. Selection of Filter Methods in the Analysis and Measured of Geometry and Surface Roughness. In Proceedings of the International Multi-Conference on Industrial Engineering and Modern Technologies, Vladivostok, Russia, 3–4 October 2020. [Google Scholar]
- Han, X.; Jin, J.S.; Wang, M.J.; Jiang, W.; Gao, L.; Xiao, L. A review of algorithms for filtering the 3D point cloud. Signal Process. Image Commun. 2017, 57, 103–112. [Google Scholar] [CrossRef]
- Bešić, I.; Van Gestel, N.; Kruth, J.-P.; Bleys, P.; Hodolić, J. Accuracy improvement of laser line scanning for feature measurements on CMM. Opt. Lasers Eng. 2011, 49, 1274–1280. [Google Scholar] [CrossRef]
- Hocken, R.J.; Pereira, H.P. Coordinate Measuring Machines and Systems, 2nd ed.; CRC Press, Taylor & Francis Group: Boca Raton, FL, USA, 2012. [Google Scholar]
- Hanc, T. Pomiary Optyczne; Wydawnictwa Naukowo-Techniczne: Warsaw, Poland, 1964. [Google Scholar]
- Adamaszek, Z. Optyka; Państwowe Wydawnictwo Naukowe: Warsaw, Poland, 2016. [Google Scholar]
- Hecht, E. Optyka; Państwowe Wydawnictwo Naukowe: Warsaw, Poland, 2012. [Google Scholar]
- Pluta, M. Mikroskopia Optyczna; Państwowe Wydawnictwo Naukowe: Warsaw, Poland, 1982. [Google Scholar]
- Christoph, R.; Neumann, H.J. Multisensor-Koordinatenmesstechnik; Süddeutscher Verlag: Munich, Germany, 2013. [Google Scholar]
- Hofmann, D. Vorlesung Optische Koordinatenmesstechnik. In Qualitätssicherung und Qualitätsmesstechnik; Steinbeis Transferzentrum: Gosheim, Germany, 2011. [Google Scholar]
- Harding, K. Handbook of Optical Dimensional Metrology; CRC Press: Boca Raton, FL, USA, 2013. [Google Scholar]
- Weckenmann, A.; Kraemer, P.; Hoffmann, J. Manufacturing Metrology—State of the art and prospects. In Proceedings of the 9th IMEKO TC14: International Symposium on Measurement and Quality Control (9th ISMQC), Chennai, India, 21–24 November 2007. [Google Scholar]
- Harmatys, W.; Gąska, A.; Gąska, P.; Gruza, M.; Jedynak, M.; Kobiela, K.; Marxer, M. Applicability Assessment of Different Materials for Standards Ensuring Comparability of Optical and Tactile Coordinate Measurements. Materials 2022, 15, 4128. [Google Scholar] [CrossRef]
- Available online: www.werth.de (accessed on 10 March 2025).
- Games, P.A.; Howell, J.F. Pairwise Multiple Comparison Procedures with Unequal N’s and/or Variances: A Monte Carlo Study. J. Educ. Behav. Stat. 1976, 1, 113–125. [Google Scholar]
- Montgomery, D.C. Introduction to Statistical Quality Control, 8th ed.; John Wiley & Sons Inc.: Hoboken, NJ, USA, 2019. [Google Scholar]
- Levin, I.R. Statistics for Management, 4th ed.; Prentice-Hall, Inc.: Englewood Cliffs, NJ, USA, 1987. [Google Scholar]
- Welch, B.L. On the comparison of several mean values: An alternative approach. Biometrica 1951, 38, 330–336. [Google Scholar] [CrossRef]
Disclaimer/Publisher’s Note: The statements, opinions and data contained in all publications are solely those of the individual author(s) and contributor(s) and not of MDPI and/or the editor(s). MDPI and/or the editor(s) disclaim responsibility for any injury to people or property resulting from any ideas, methods, instructions or products referred to in the content. |
© 2025 by the authors. Licensee MDPI, Basel, Switzerland. This article is an open access article distributed under the terms and conditions of the Creative Commons Attribution (CC BY) license (https://creativecommons.org/licenses/by/4.0/).