Article

Numerical Simulation of Slope Excavation and Stability Under Earthquakes in Cataclastic Loose Rock Mass of Hydropower Station on Lancang River

College of Environment and Civil Engineering, Chengdu University of Technology, Chengdu 610059, China
*
Author to whom correspondence should be addressed.
Appl. Sci. 2025, 15(13), 7480; https://doi.org/10.3390/app15137480
Submission received: 27 April 2025 / Revised: 1 June 2025 / Accepted: 6 June 2025 / Published: 3 July 2025
(This article belongs to the Section Civil Engineering)

Abstract

This study investigates the excavation of the cataclastic loose rock slope at the mixing plant on the right bank of the BDa Hydropower Station, which is situated in the upper reaches of Lancang River. The dominant structural plane of the cataclastic loose rock mass was obtained using unmanned aerial vehicle tilt photography and 3D point cloud technology. The actual 3D numerical model of the study area was developed using the 3DEC discrete element numerical simulation software. The excavation response characteristics and overall stability of the cataclastic loose rock slope were analyzed. The support effect was evaluated considering the preliminary shaft micropile and Macintosh reinforced mat as slope support measures, and the stability was assessed by applying seismic waves. The results showed the main deformation and failure area after slope cleaning excavation at the junction of the cataclastic loose rock mass and Qedl deposits in the shallow surface of the excavation face. Moreover, the maximum total displacement could reach 18.3 cm. Subsequently, the overall displacement of the slope was significantly reduced, and the maximum total displacement decreased to 2.78 cm. The support effect was significant. Under an earthquake load, the slope with support exhibited considerable displacement in the shallow surface of the excavation slope, with collapse deformation primarily occurring through shear failure.

1. Introduction

The growing demand for hydropower resources in China has led to the progressive expansion of hydropower infrastructure to regions with extremely complex geological conditions, such as the Qinghai–Tibet Plateau. The BDa Hydropower Station is situated in the southeastern region of the Qinghai–Tibet Plateau. The area is shaped by intense tectonic activity within the early crust and the unloading of rock masses caused by valley cutting. Hence, the shallow rock masses on the slopes of the dam site area and its surrounding areas are subjected to the dual effects of plateau freeze–thaw cycles and weathering erosion, which result in the formation and extensive distribution of large-scale cataclastic loose rock masses [1,2,3,4]. Owing to their fragmented and loose structural characteristics, these rock masses exhibit pronounced loose deformation and low self-stability, becoming unstable under external forces and posing a serious threat to the safety and integrity of engineering operations. During the construction of the Bda Hydropower Station, excavation activities associated with the original mixing station project and local collapse led to the disturbance of the SL12 (rock coding) cataclastic loose rock mass, affecting the construction of the hydropower station. Consequently, slope cleaning and excavation treatments became necessary to mitigated the associated risks. Conducting a stability analysis of the cataclastic loose rock slope is thus of practical importance, not only ensuring the safety of hydropower station construction but also providing a typical case for an understanding of the mechanical behavior of rock masses in similar geological environments.
To date, extensive research has been conducted on the distribution characteristics, genetic mechanisms, development laws, failure characteristics, seismic dynamic responses, and stability of cataclastic loose rock masses [5,6,7,8,9,10,11,12,13,14]. Singh [15] studied the strength characteristics of a cataclastic loose rock mass and evaluated its stability using empirical methods. Zou [16] and Huang [17] summarized the development and distribution characteristics, deformation and failure behavior, and formation mechanisms of cataclastic loose rock masses through a field investigation. Wu [18] introduced novel technologies and methods, such as 3D laser scanning and unmanned aerial vehicle (UAV) image measurement, to conduct in-depth research on the development characteristics, physical and mechanical parameters, deformation, and failure characteristics of cataclastic loose rock masses. Guo [19] used the finite element virtual power method to analyze the stability of broken loose rock slopes. Numerical simulations can replicate the deformation behavior and stability of slopes during excavation by incorporating the physical and mechanical properties of the rock and soil. This simulation method offers notable advantages, including flexibility, economy, and repeatability. Researchers have employed the discrete element simulation method to explore the potential deformation and failure process and the instability mode of rock–soil composite slopes under natural and seismic conditions [20,21,22,23,24,25]. Sitharam [26] used finite element numerical simulation software to calculate the excavation response characteristics of a cataclastic loose rock slope. However, the 3D discrete element numerical simulation of cataclastic loose rock masses in actual complex terrain is rare, especially for fractured loose rock slope excavation.
Therefore, this study integrates the slope cutting and excavation treatment plan proposed by the design unit. First, a 3D real-life model of the cataclastic loose rock slope in the study area is constructed using UAV oblique photography technology. Then, the 3DEC discrete element numerical simulation software is used to analyze the impact of slope cutting excavation on the stability of the cataclastic loose rock slopes in the mixing plant. The proposed support scheme involves reinforcing the slope with preliminary shaft micropiles and Macintosh reinforced mats. In addition, a numerical analysis is conducted to evaluate the support effect. The post-reinforcement stability of the slope is analyzed after the application of seismic waves. This approach provides a scientific basis for the effective treatment of cataclastic loose rock slopes in practical engineering applications.

2. General Situation

The SL12 cataclastic loose rock slope in the shallow slope layer of the study area is disorderly, stacked, broken, and cracked, showing a cataclastic loose structure. The diameter of the cataclastic rock blocks typically ranges from 0.2 m to 2 m. The maximum diameter of the cataclastic rock blocks at and above the middle elevation of the slope can exceed 3 m. The development thickness is approximately 3–25 m, the distribution area is approximately 136,200 m2, and the natural slope of the distribution area is between 30° and 45° (Figure 1a). Field investigations of the excavated tensile deformation and collapse area revealed the development of an extensive zone of toppling-deformed rock mass at the bottom of the cataclastic loose rock mass. The right section is intersected with Qedl deposits (residual deluvial block gravel mixed with silt) with a development thickness of approximately 1–20 m. Moreover, the tensile anchor plate used to support the pathway is washed out, and the deformation indicators in the tensile deformation zone are evident (Figure 1b). The measured maximum deformation crack width on top of the trailing edge of the tensile crack zone is approximately 50–70 cm, and the depth is approximately 1.0–1.5 m. The cracks generally exhibit an outward inclination relative to the slope face. The tensile cracks on the upstream and downstream sides of the slope along the river flow ultimately run through the excavated slope surface of the mixing plant. The width of the tensile cracks is 20–40 cm, and the cracks are large in localized areas, measuring 50–60 cm.
The predominant lithology of the research area is dacite, with occasional occurrences of diabase porphyry rock bodies. Figure 2 shows the lithology map of the geological strata in the study area. The engineering geological profile along the central axis of the cataclastic loose rock slope of the mixing plant is derived by analyzing the survey results (Figure 3). The deformation and failure modes of the local collapse section of the cataclastic loose rock slope of the mixing plant are summarized on the basis of the site geological survey and engineering geological profile (Figure 4).

3. Discrete Element Numerical Simulation

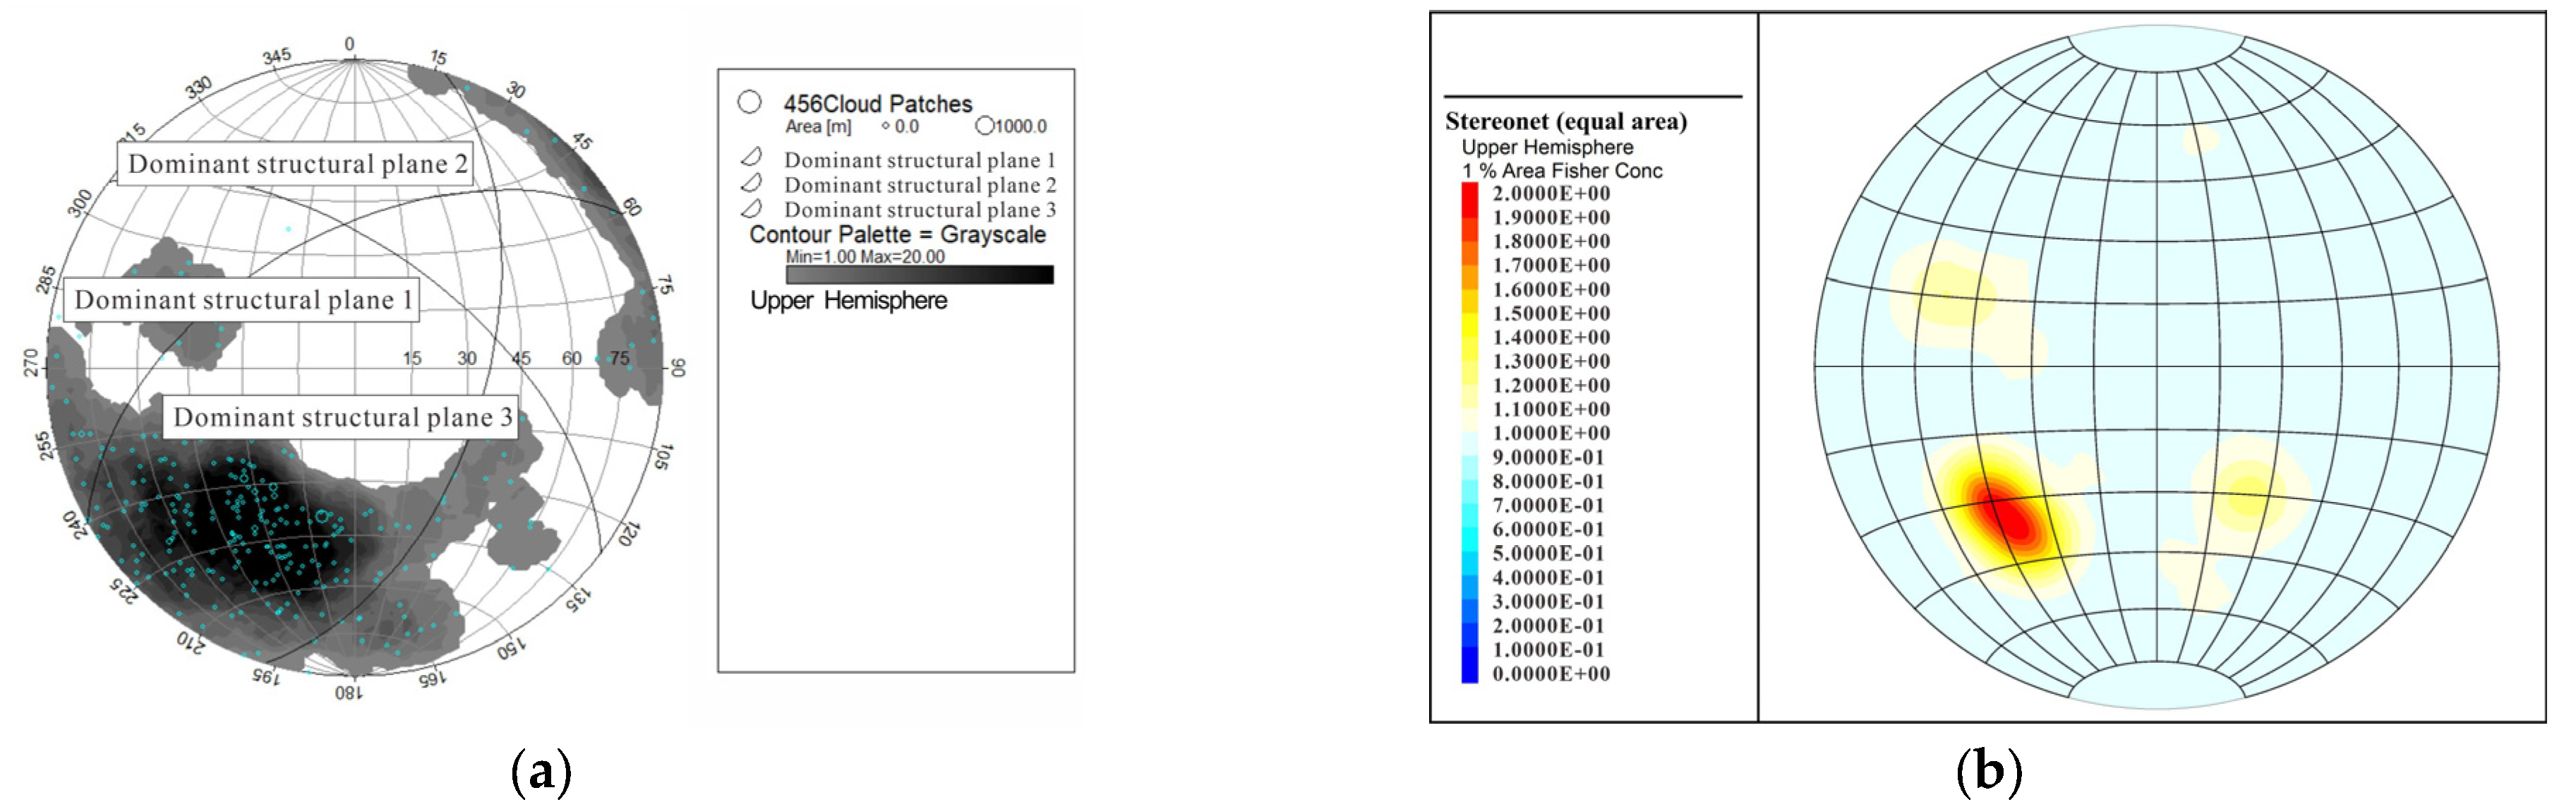
3.1. Interpretation of Dominant Structural Plane

The cataclastic loose rock mass of the SL12 unit, developed in the shallow layer of the slope, is affected by weathering unloading, freeze–thaw cycles, and other factors. As a result, the rock mass predominantly exhibits cataclastic, mosaic, and localized loose structures. The rock mass is highly fractured, and the structural plane is open in all directions. Therefore, the influence of the structural plane of the cataclastic loose rock mass must be considered in the numerical simulation. The image data collected by a UAV equipped with a high-resolution camera are used to analyze the cataclastic loose rock slope, and a 3D model of the slope is constructed [27,28]. Accordingly, 3D point cloud data are extracted, and the 3D point cloud is post-processed to interpret the dominant structural plane of the cataclastic loose rock mass in the study area [29,30]. As shown in Figure 5a, 456 3D point cloud discontinuities of cataclastic loose rock mass are finally identified, including three groups of the dominant structural plane.

3.2. DFN Discrete Fracture Network (DFN)

3.2.1. Division of Discrete Fractures

The random discrete fracture network (DFN) of the 3DEC discrete element numerical simulation software is used to simulate the structural plane of the cataclastic loose rock mass to fit the characteristics of structural fragmentation, the high development of joint fissures, and the opening of all structural planes. The comparison between the final DFN discontinuity isodensity map and the 3D point cloud-derived discontinuity isodensity map is illustrated in Figure 5.

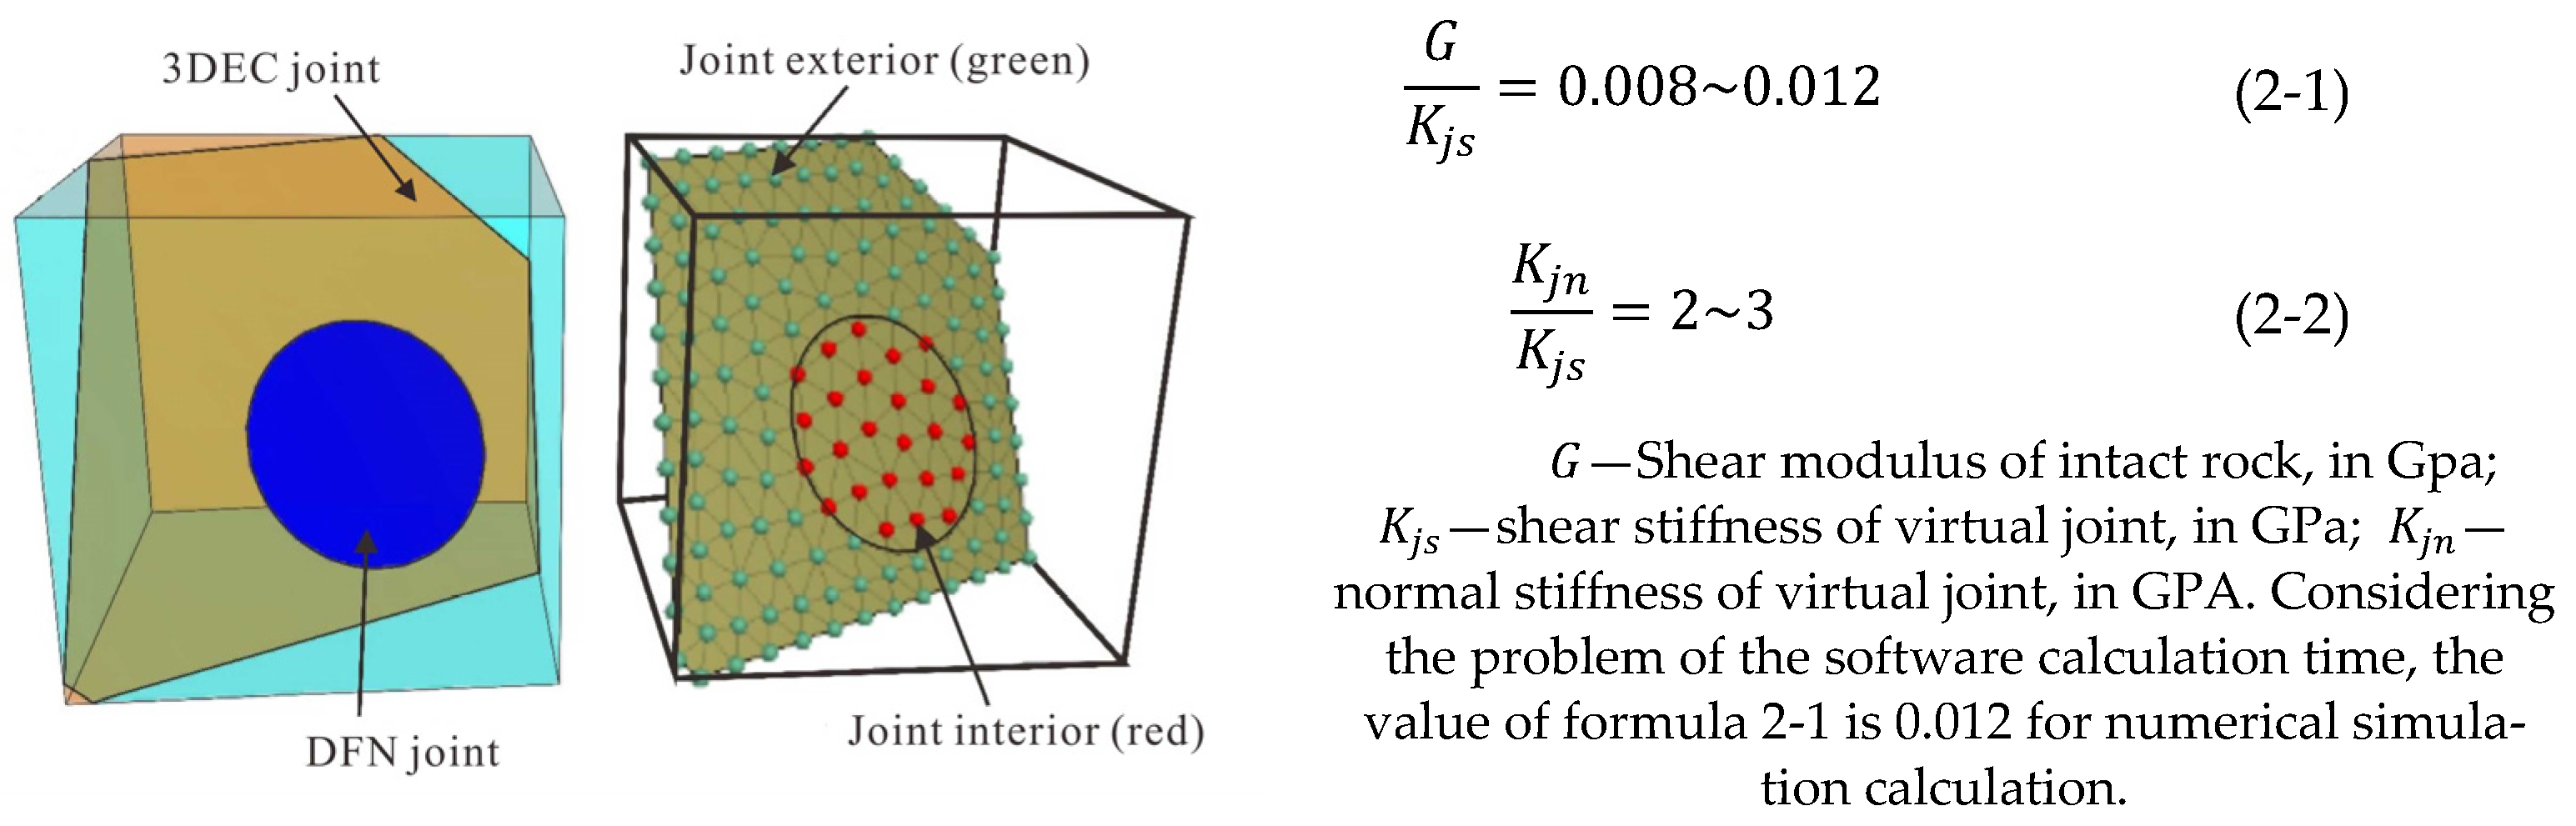
3.2.2. Discrete Fracture Assignment

The complete cutting of rock blocks cannot be achieved in some cases because of limitations in the DFN, where joint apertures are constrained by predefined parameter settings. For example, when the maximum diameter of the fracture set in the DFN is smaller than the geometric size of the rock block, the fracture cannot penetrate the entire block, and thus the block is only partially cut by the joint surface. Therefore, different parameters must be assigned inside and outside the DFN joint disc. The inner disc includes an actual DFN joint (Figure 6), which is directly assigned with the DFN joint parameters. The outer part of the disc is a virtual joint (Figure 6), and the virtual joint parameter assignment is calculated using reference formulas 2-1 and 2-2 (which are derived from empirical relationships). Thus, the properties of the external rock mass can be considered identical when the virtual joint parameter is provided and the joint is not added.

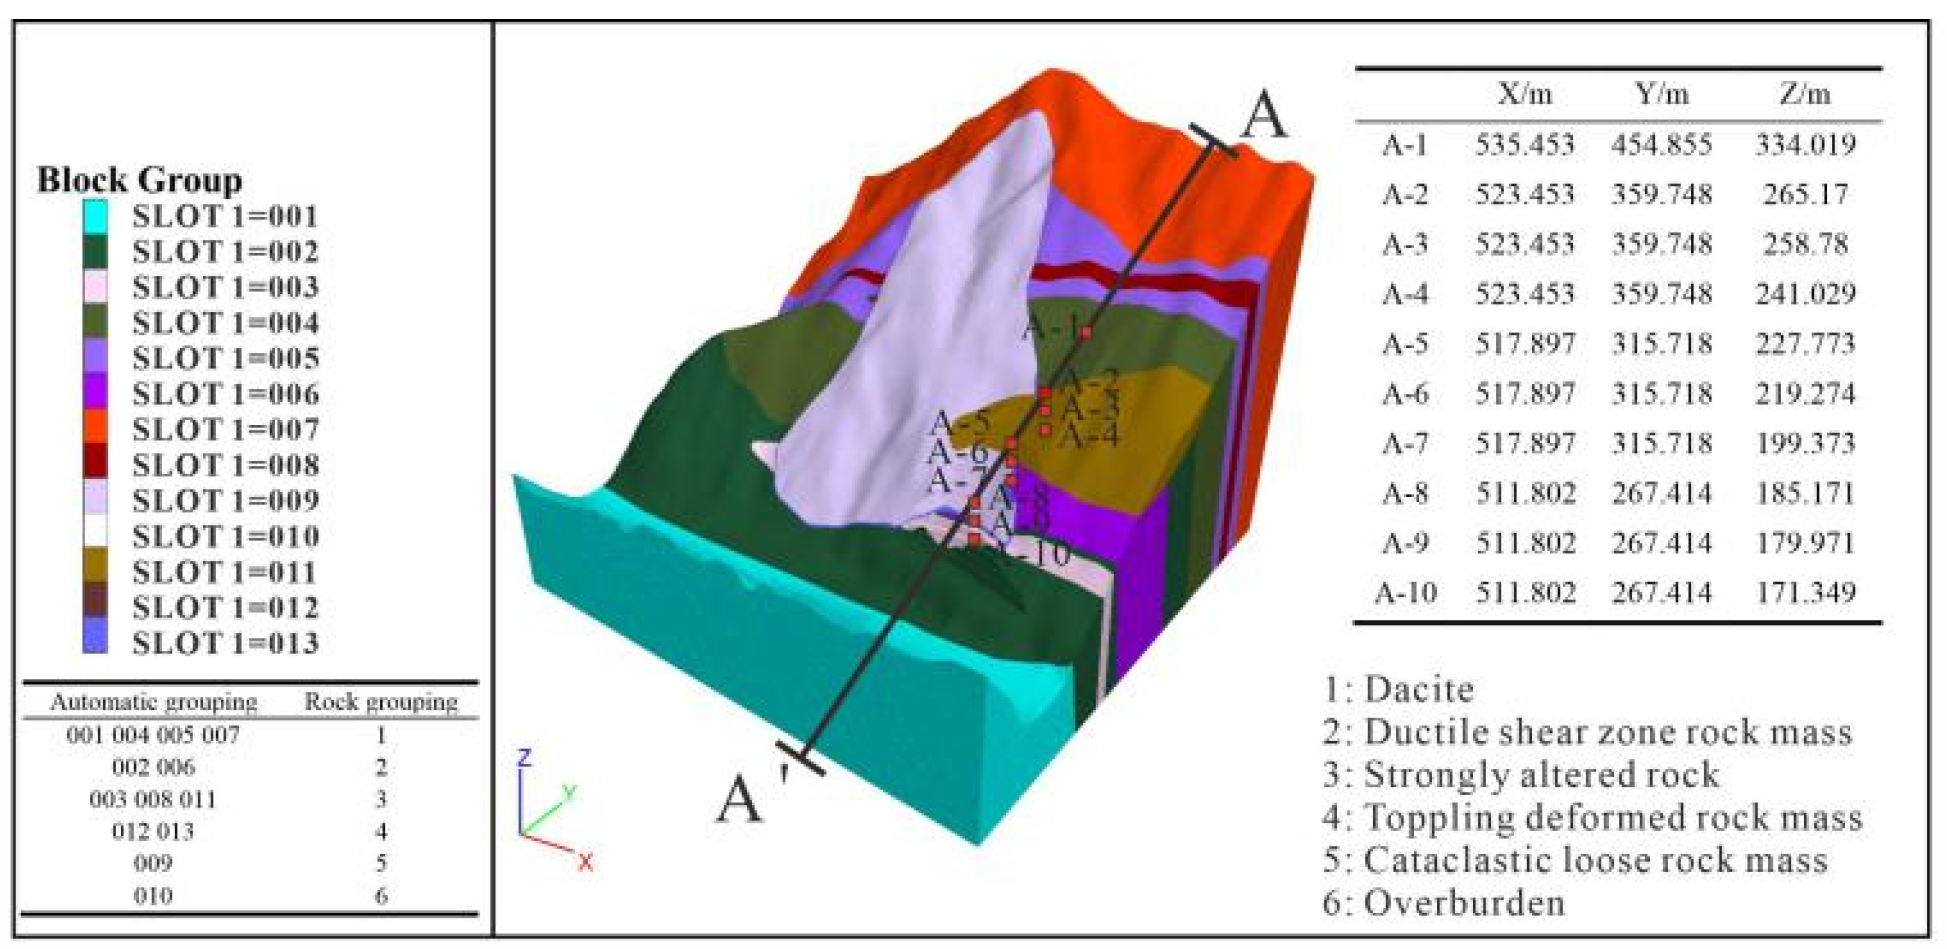
3.3. Excavation Line Layout and Model Establishment

Based on drilling data, on-site audit surveys, and other exploration data, a slope cutting and excavation method is proposed to control the slope collapse of the cataclastic loose rock mass of the mixing plant. The approach cuts the slope on the existing collapse platform, removing most of the unstable cataclastic loose rock mass and Qedl deposits with poor stability on the slope surface. Figure 7 shows the layout of the excavation line for slope-cutting treatment.
The 3D geological model of the SL12 cataclastic loose rock slope is developed using the 3D modeling software Rhino, combined with the UAV 3D model and engineering geological profile in the study area. The model is 700 m in the X direction, 700 m in the Y direction, and 595 m in the Z direction. The triangular mesh division model is adopted, where the minimum mesh width of the model is 5 m and the maximum mesh width is 30 m. Figure 8 shows the 3DEC slope-clearing excavation model and its rock mass grouping established according to the excavation line. Ten monitoring points are arranged, with the central axis of the excavation face as the section line (A–A′), to accurately analyze the stability of the cataclastic loose rock slope of the excavated mixing plant.

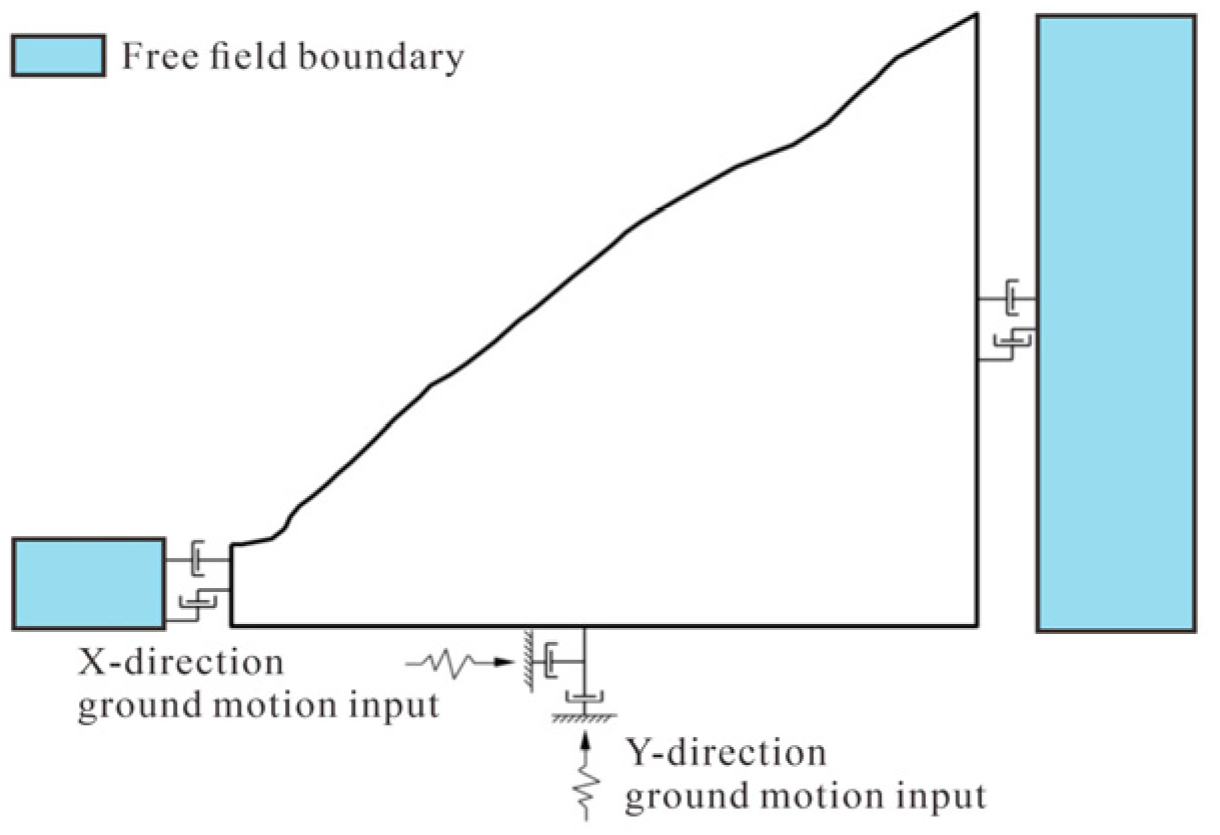
3.4. Boundary Conditions and Calculation Parameters

In static calculation, the slope top and slope surface are free-field boundaries, and normal velocity constraints are imposed on the bottom and surrounding surfaces of the model to fix it and limit its horizontal movement. The slope surface is allowed to deform naturally under vertical downward gravity. In seismic dynamic calculation, the setting of the boundary conditions greatly impacts the calculation results [31,32]. The bottom of the model is set as a non-reflecting boundary and the side of the model as a free-field boundary (Figure 9).
The predominant lithology of the study area is dacite. The Hoek–Brown constitutive model is used for dacite, altered rock, ductile shear zone rock masses, toppling-deformed rock masses, and cataclastic loose rock masses [33,34,35]. The Mohr–Coulomb constitutive model is used for residual slope deposits. The physical and mechanical parameters of the rock mass and the structural plane parameters calculated by the model are derived using the results of rock mechanics tests and the Hoek–Brown strength criterion (Table 1 and Table 2).

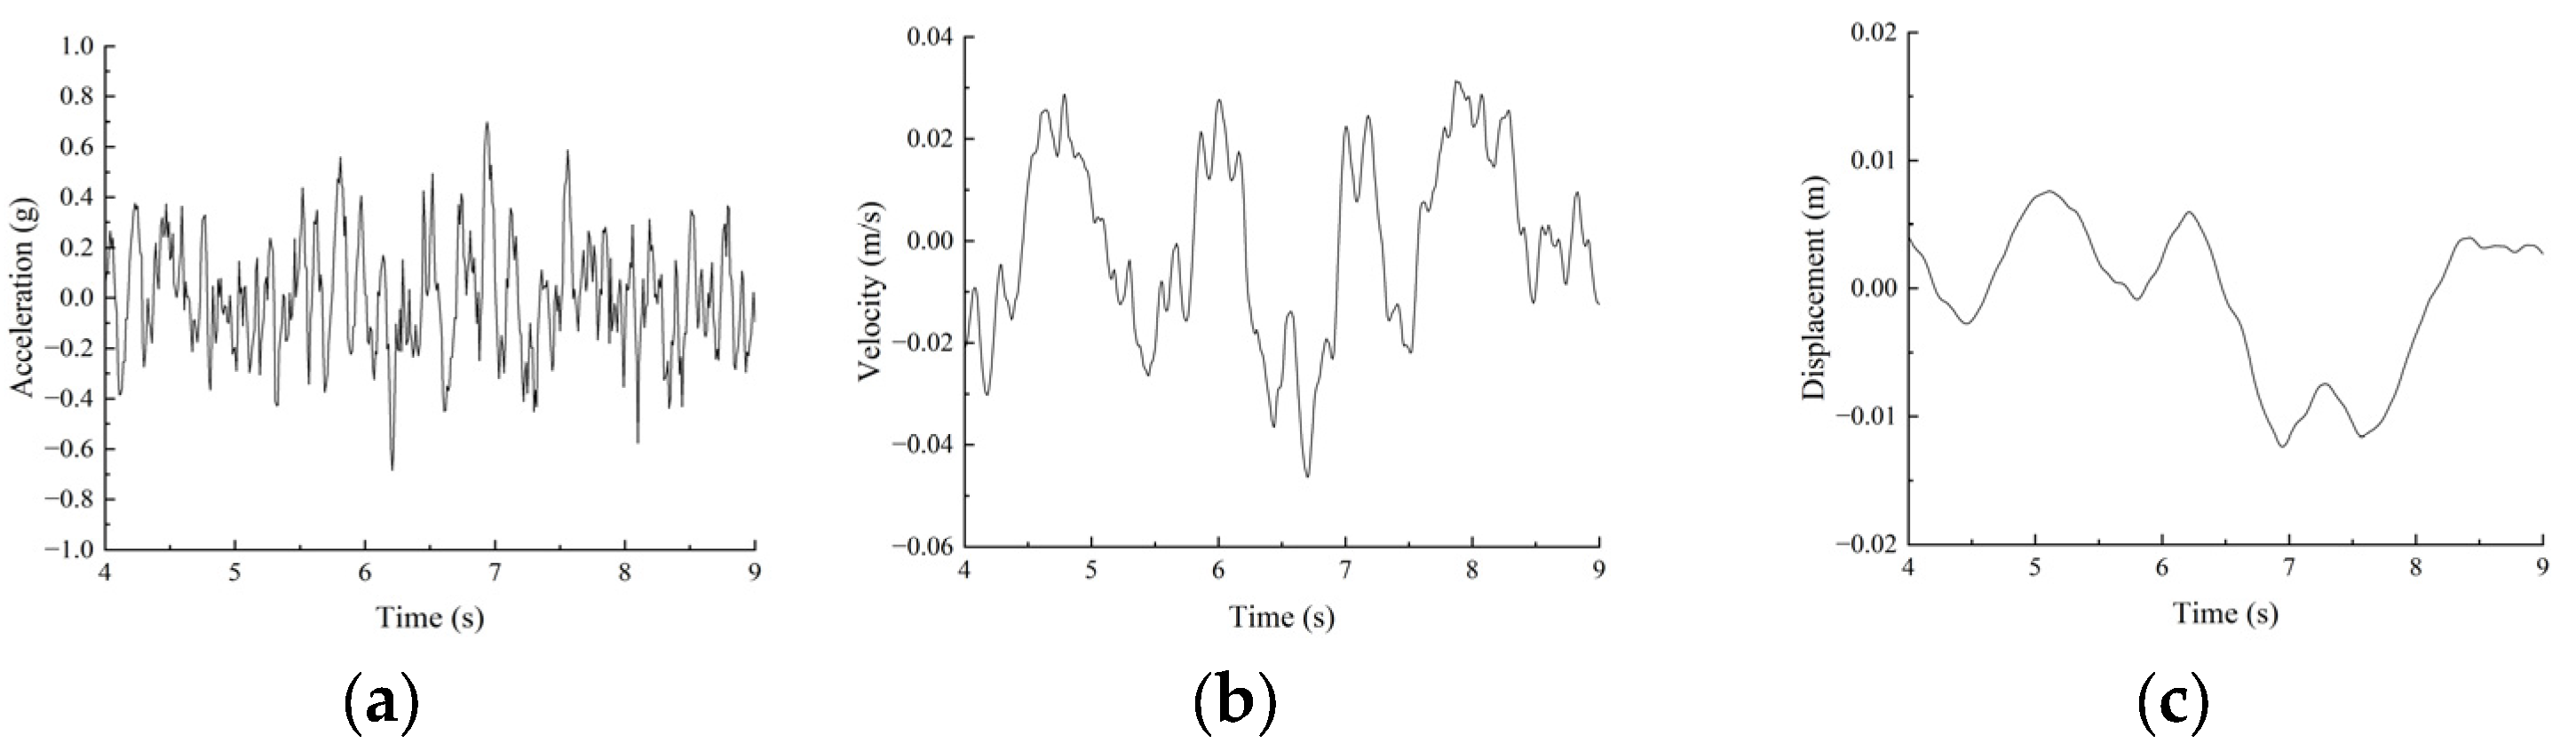
3.5. Selection of Seismic Wave

The special report on the seismic research and design of the BDa Hydropower Station, provided by the project designer, is considered. The site-related design response spectrum corresponding to 2% of the 100-year exceedance probability is used as the target spectrum for artificial seismic wave fitting. A horizontal seismic wave H and vertical seismic wave V are selected for this numerical simulation. The fourth to ninth seconds with large amplitudes (Figure 10 and Figure 11) are intercepted because the seismic wave duration is long. After baseline correction and filtering, the peak accelerations of the intercepted sections are 0.834 (H) and 0.669 g (V).

4. Analysis of Numerical Calculation Results of 3D Model for Excavation Response of Cataclastic Loose Rock Slope

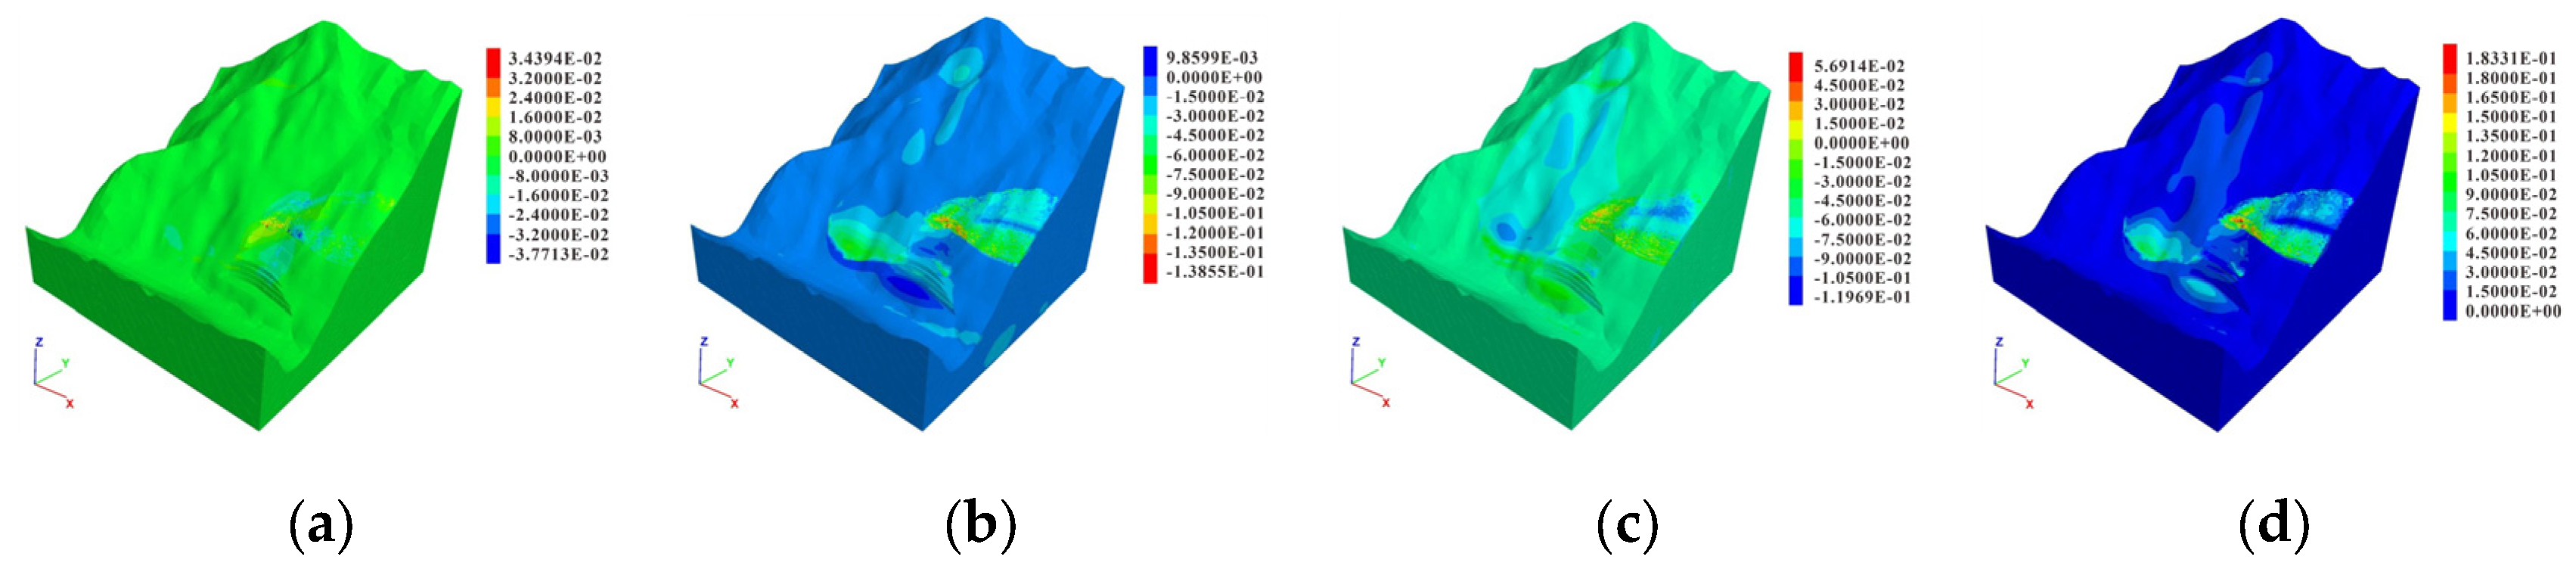
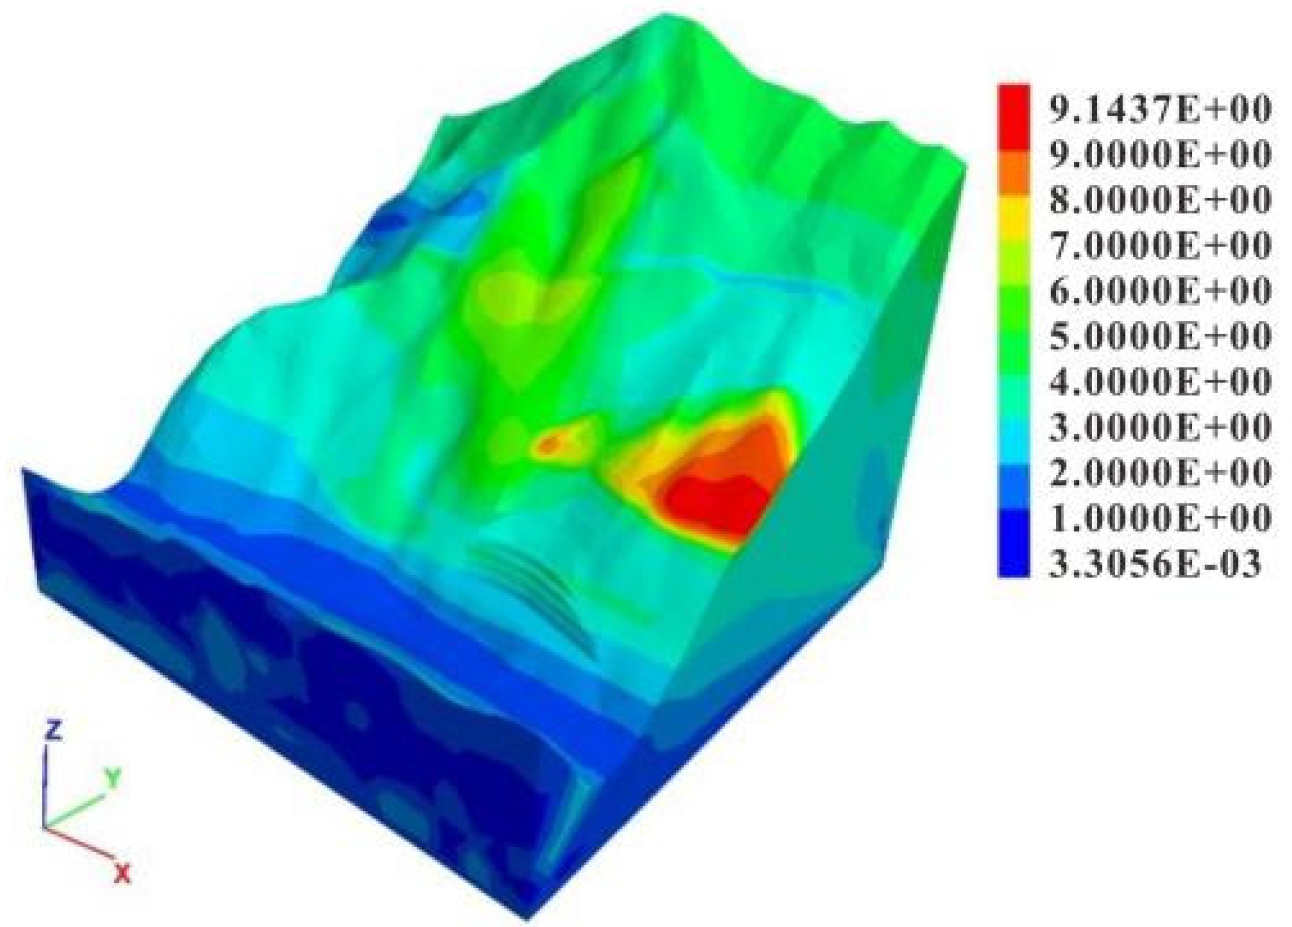
4.1. Analysis of Slope Displacement Field

As shown in Figure 12, after excavation, the intersection of the cataclastic loose rock mass on the excavation surface and the Qedl sediments shows a certain trend of collapse and failure, accompanied by large displacement. The upper displacement in the X direction is relatively small, as manifested by the cataclastic loose rock mass on both sides of the excavation face and the extrusion deformation of the Qedl sediments toward the central axis of the excavation face. The maximum displacement is 3.77 cm. In the Y direction, the maximum displacement to one side of the river valley is 13.86 cm and is concentrated in the Qedl sediments on the excavation face. In the Z direction, the maximum downward displacement is 11.97 cm, primarily resulting from the sliding of the Qedl sediments toward the free face. Some areas of the Qedl sediments on the excavation face exhibit upward displacement of 3.44 cm because of unloading rebound. In general, the scope affected by excavation is concentrated at the intersection of the cataclastic loose rock mass and Qedl sediments, and the excavation processes are affected by the low alteration zone. Thus, the slope expands to the surrounding areas.

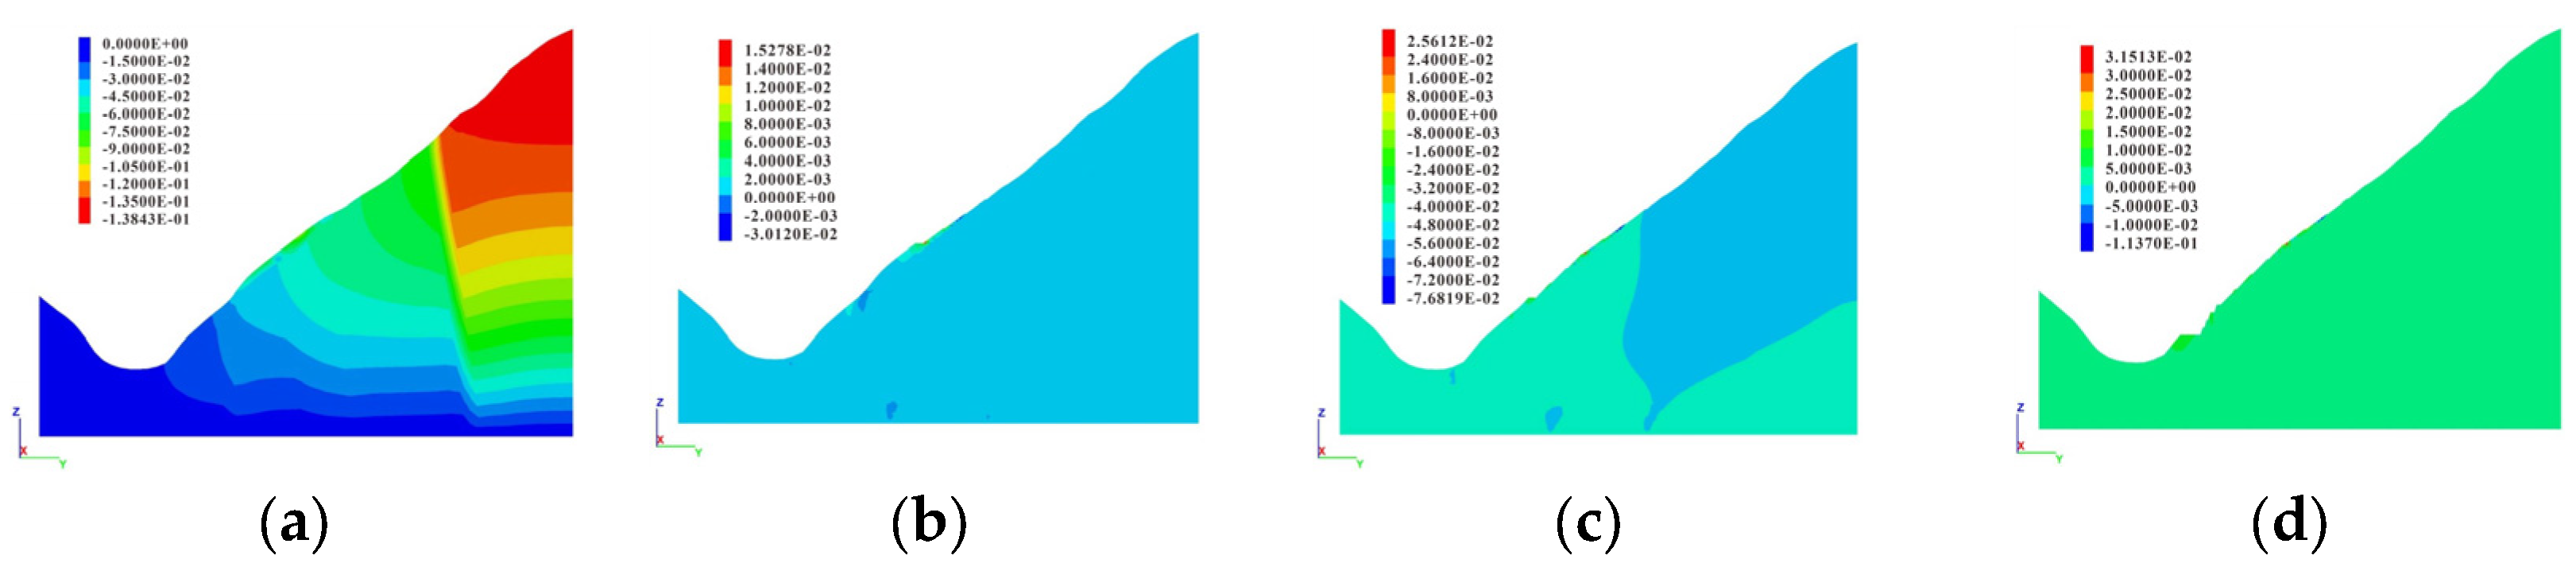
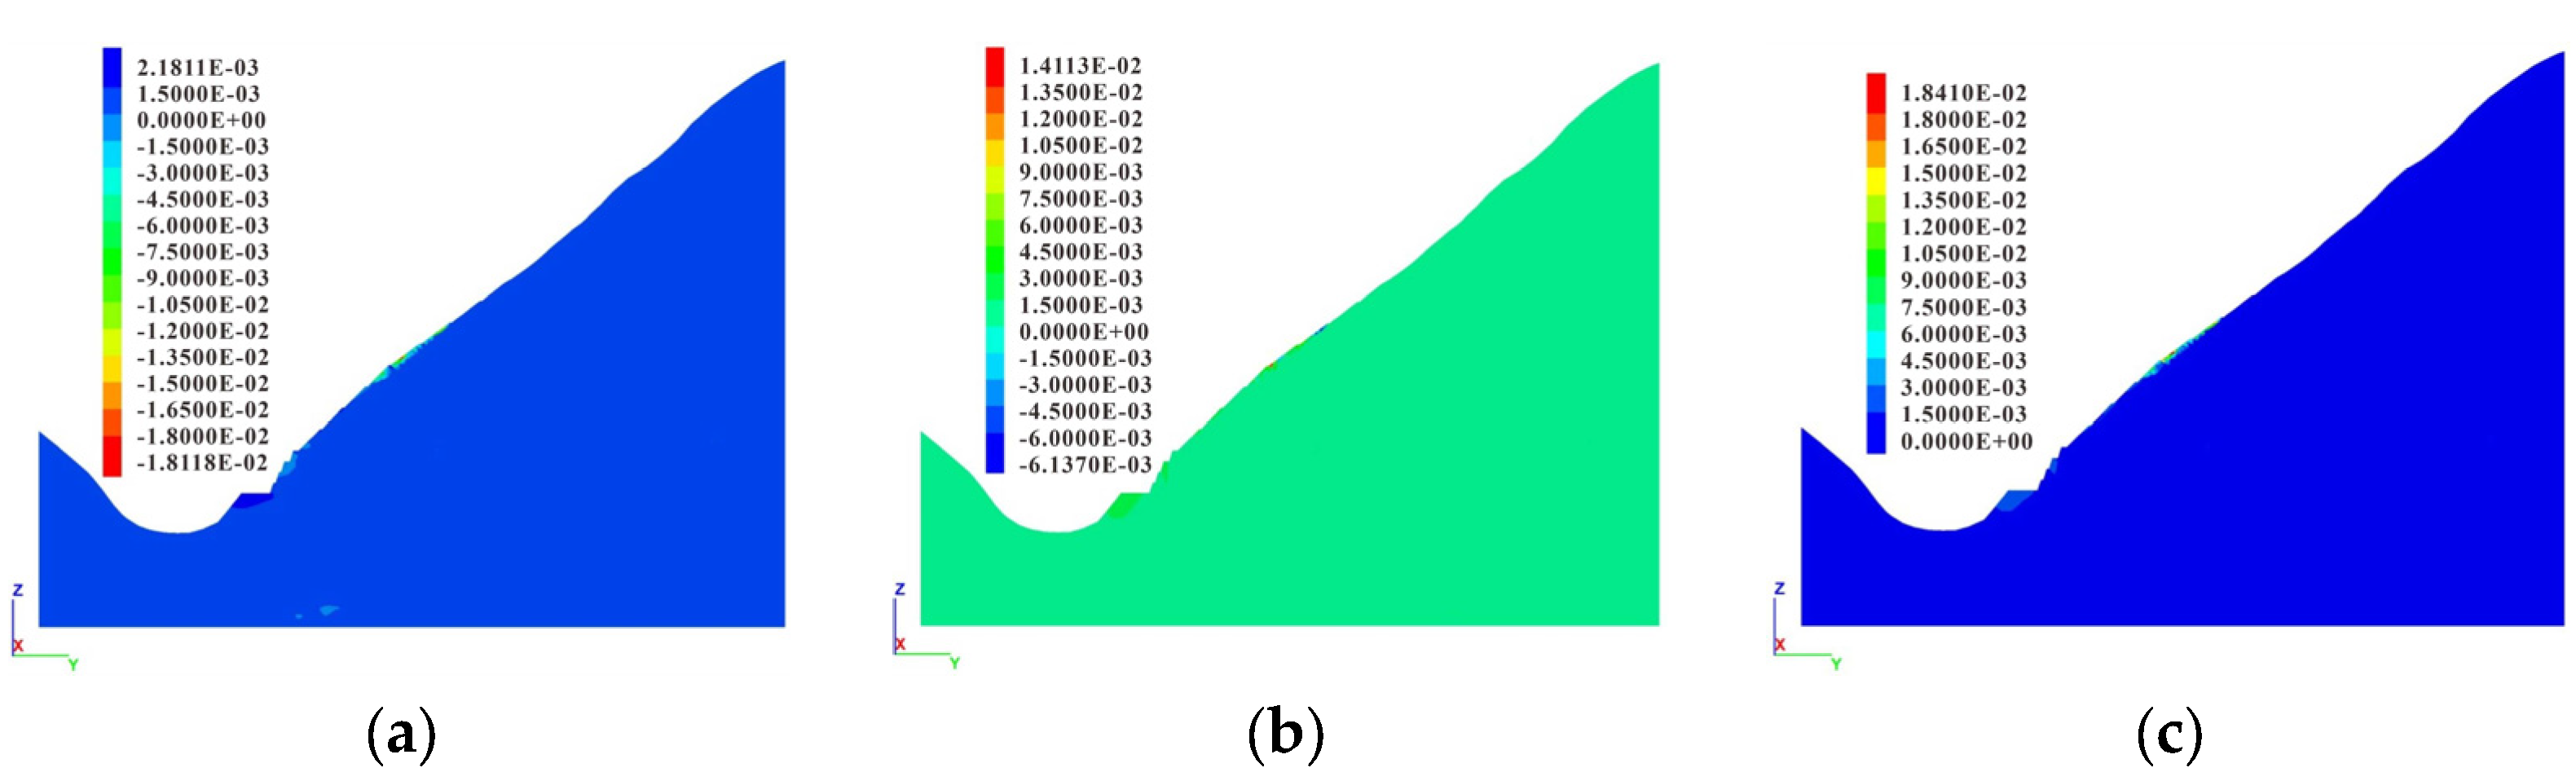
4.2. Displacement Field Analysis of Typical Section

4.2.1. Horizontal Displacement Characteristics

As shown in Figure 13, the cataclastic loose rock mass and Qedl sediments at the slope waist present a certain degree of displacement outside the slope in the Y direction during excavation because of their weak strength. With gradual excavation, the displacement increases continuously, reaching a maximum value of approximately 13.8 cm. From the first level to the third level of excavation, the slope and bottom of the excavation platform exhibit different degrees of unloading rebound.

4.2.2. Vertical Displacement Characteristics

As shown in Figure 14, vertical displacement during excavation at all levels is distributed at the cataclastic loose rock mass and Qedl sediments of the excavation face, with a maximum value of approximately −11.4 cm. Only a small area of the toppling-deformed rock mass at the lower region is disturbed. Different degrees of upward displacement are observed in some areas of the excavation slope and bottom because of the influence of the excavation unloading rebound effect.

4.2.3. Total Displacement Characteristics

As shown in Figure 15, the total displacement is mainly concentrated in the cataclastic loose rock mass on the excavation face and the area around the Qedl sediments. Moreover, the maximum cumulative displacement encompasses the cataclastic loose rock mass on the shallow surface to the slope surface, which is approximately 15.8 cm.

4.3. Characteristic Analysis of the Monitoring Points

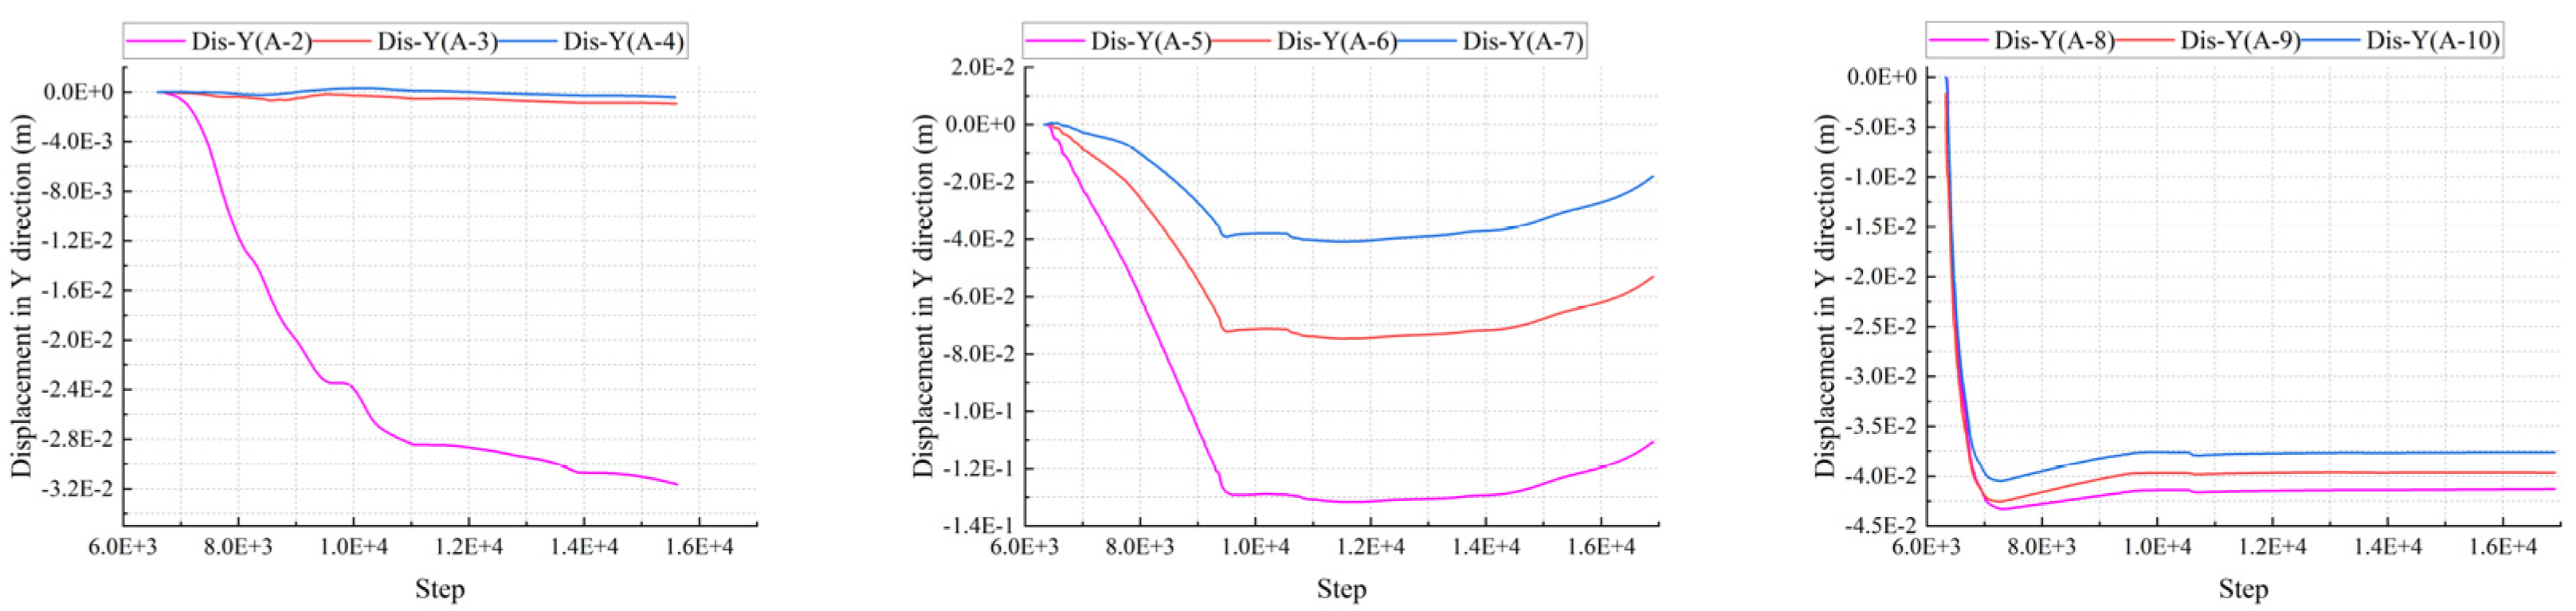
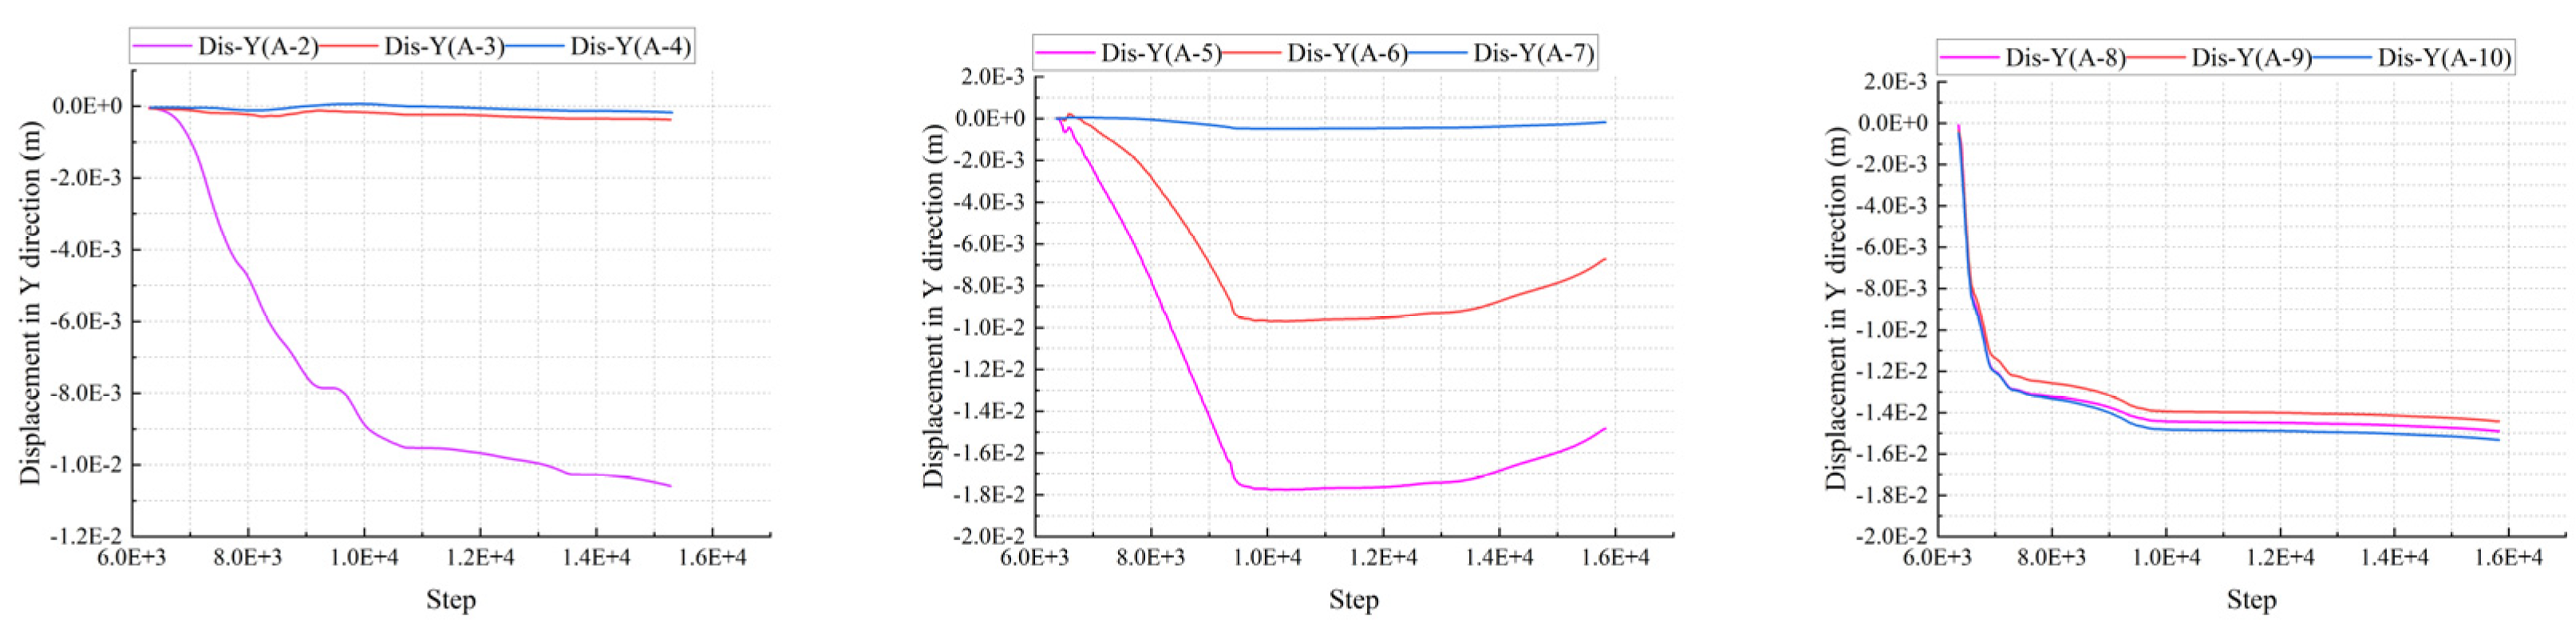
4.3.1. Displacement Monitoring Curve in Y Direction

As shown in Figure 16, the deformation of monitoring point A-2 increases sharply after excavation and then slowly increases, stabilizing at approximately 3.2 cm. The A-3 monitoring points are arranged at the interface between the Qedl sediments and the lower cataclastic loose rock mass. The A-4 monitoring points are arranged at the interface between the cataclastic loose rock mass and its lower toppling-deformed rock mass. The Y-direction displacement of the A-3 and A-4 monitoring points remains near 0 as the number of iteration steps increases in the excavation calculation. No change is observed in the Y-direction displacement trend of monitoring points A-5–7 in the middle of the excavation face. After excavation, the cumulative displacement of the monitoring points increases rapidly, and then the increase rate slows down and finally plateaus. The maximum displacement of the A-5 monitoring point on the slope surface is 13 cm. The Y-direction displacements of the A-8–10 monitoring points are nearly equal, measuring approximately 4 cm. This finding indicates that the cataclastic loose rock mass and its lower toppling-deformed rock mass near the front edge of the cataclastic loose rock mass in the middle and lower sections of the excavation face undergo deformation simultaneously because of the considerable height of the excavation beam and the high excavation slope ratio.

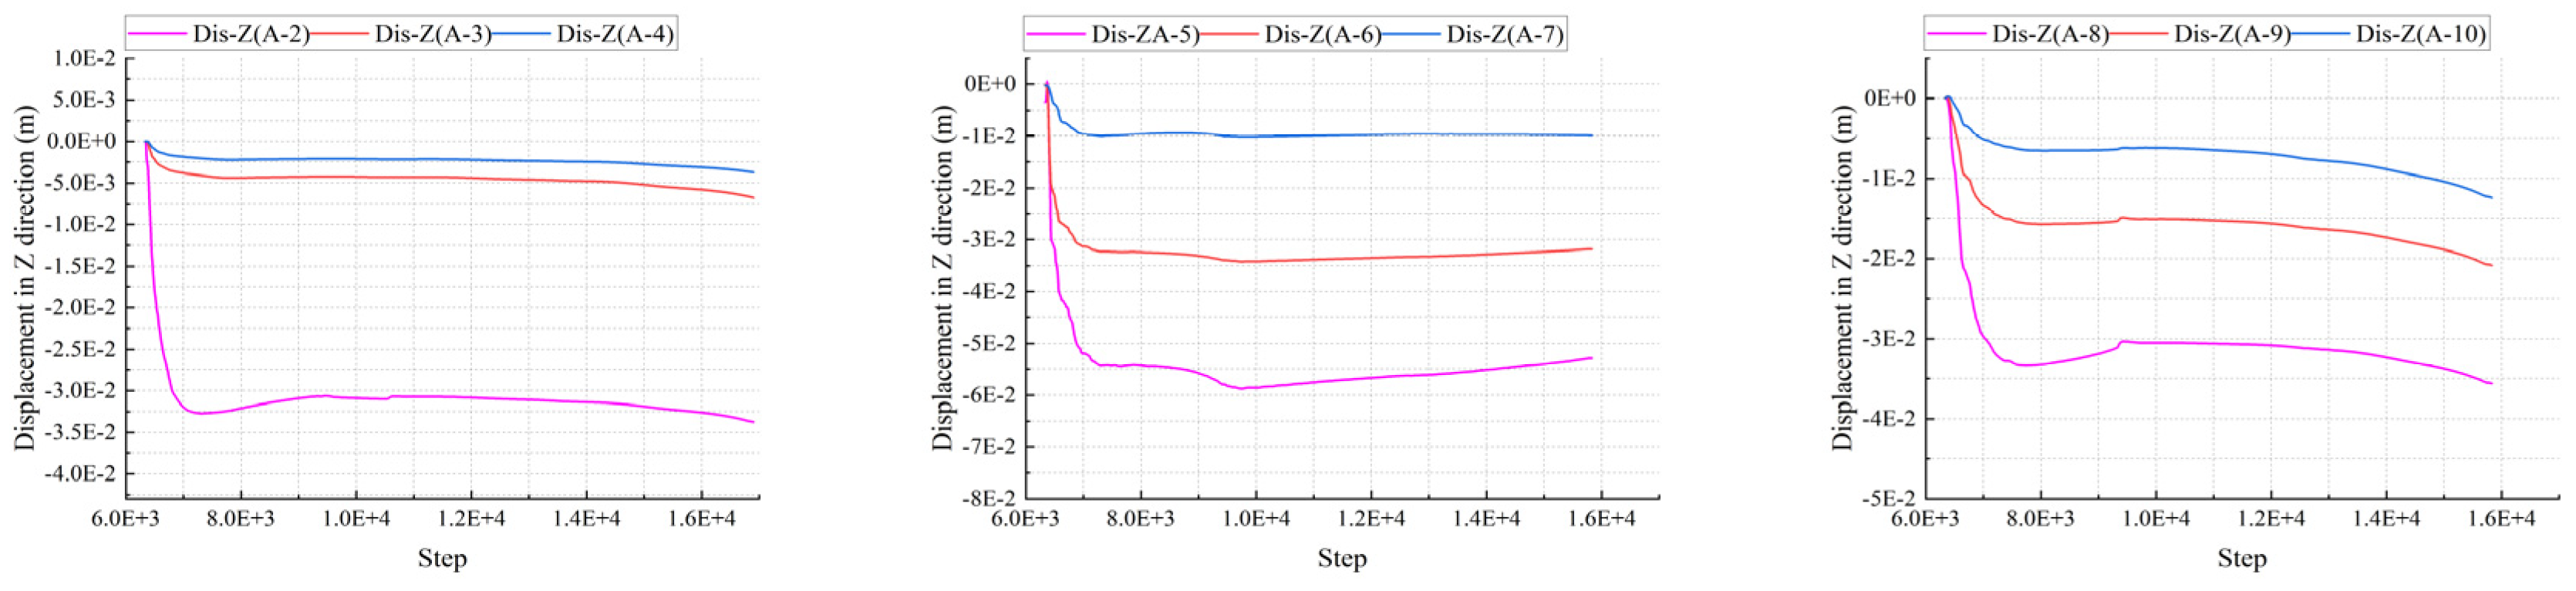
4.3.2. Displacement Monitoring Curve in Z Direction

As shown in Figure 17, the Z-direction displacement trends of the A-2–10 monitoring points exhibit a generally consistent pattern. The maximum displacement of the A-2 monitoring point in the middle and upper sections of the excavation face is approximately 3.5 cm, and the displacements recorded at the A-3 and A-4 monitoring points are approximately 0.5 cm. The curve of the A-5–7 monitoring points in the middle of the excavation face demonstrates that the Z-direction displacement at the intersection of the cataclastic loose rock mass and Qedl sediments is the largest, and the disturbance caused by excavation gradually decreases in the deep part of the slope. The curve of the A-8–10 monitoring points at the middle and lower sections of the excavation face increases abruptly, and then the cumulative displacement continues to increase slowly. This finding may be attributed to the proximity of the A-8–10 monitoring points to the slope toe, the low elevation, and the relatively good rock mass quality at the excavation face.

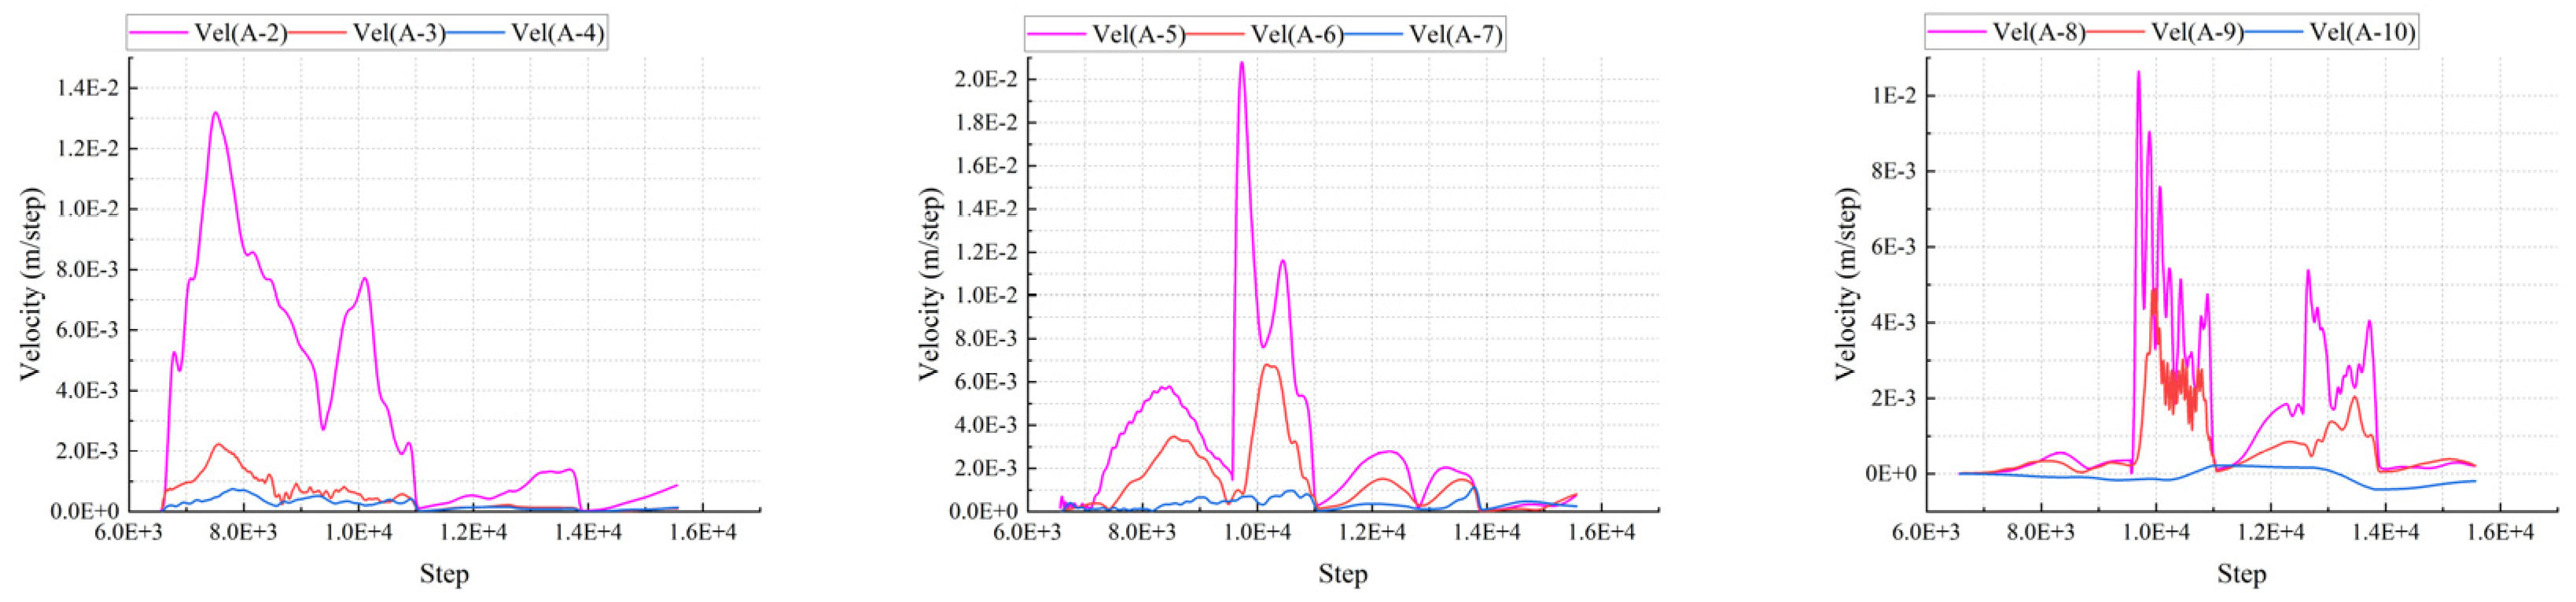
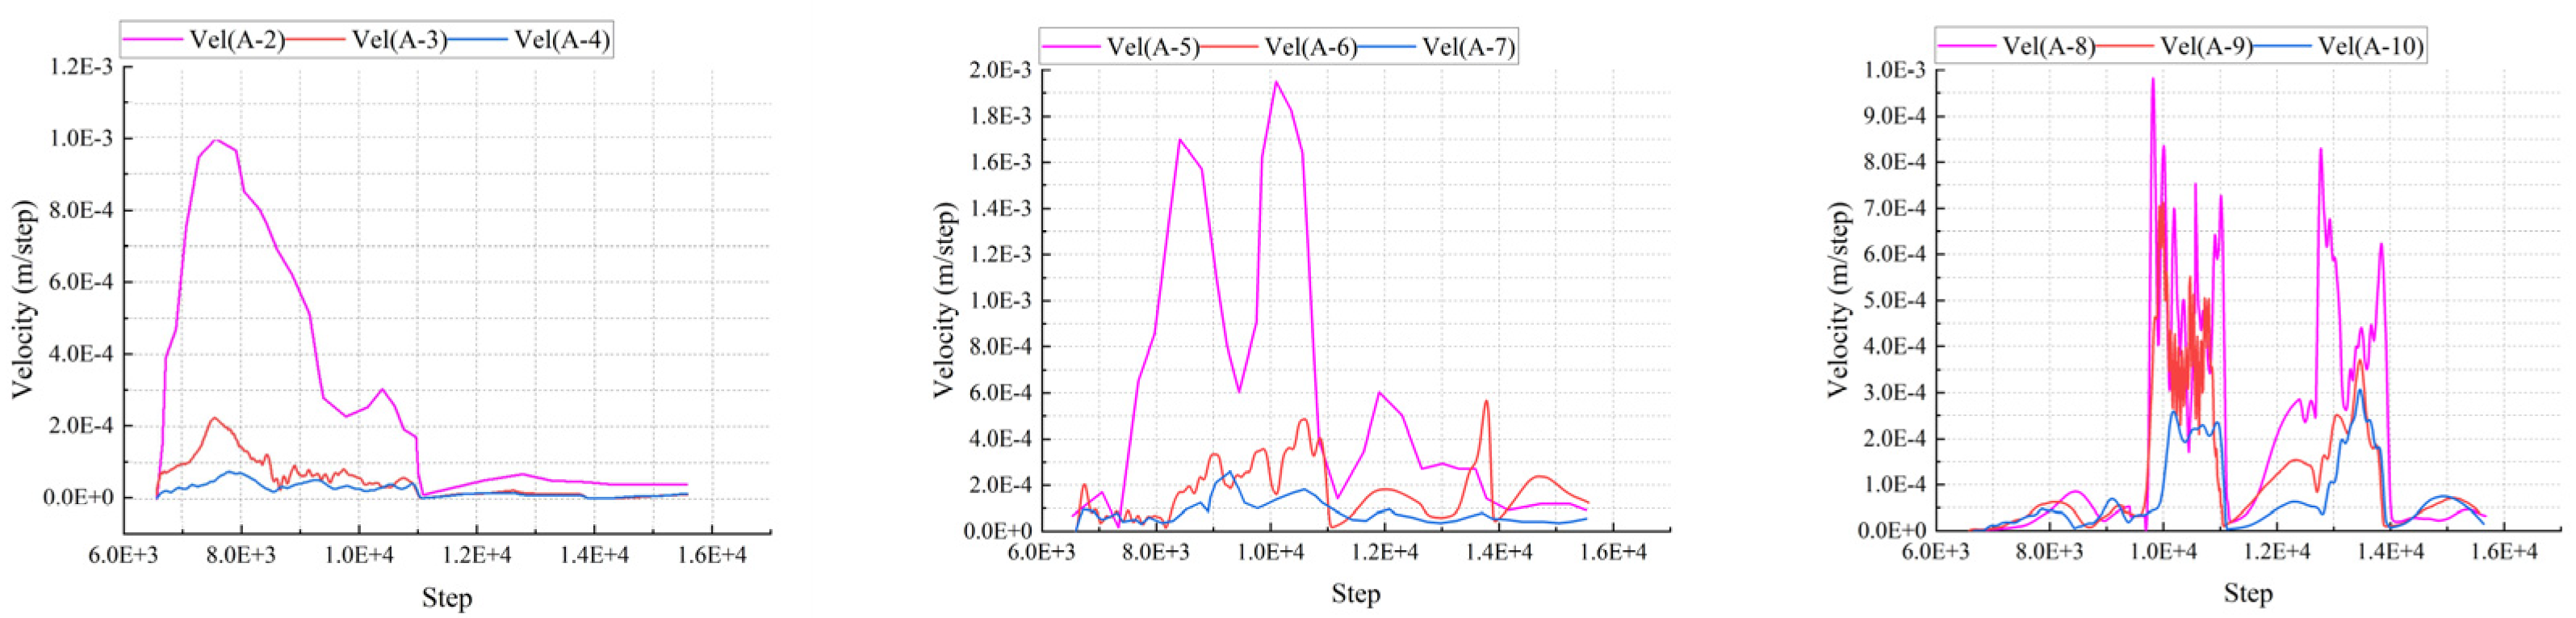
4.3.3. Deformation Rate Monitoring Curve

After slope excavation, the deformation rate of the A-2–10 monitoring points demonstrates a substantial change, and the peak value of the deformation rate is concentrated in the A-5–7 monitoring points at the intersection of the cataclastic loose rock mass in the middle of the excavation face and the Qedl sediments (Figure 18). The rate-monitoring curves of the A-2–10 exhibit a fluctuating increase and gradually decrease until plateauing and then reaching their respective peak values. The maximum value is approximately 2.0 × 10⁻² m/step. In general, the rate of each monitoring point decreases with increasing depth during excavation. This finding indicates that the cataclastic loose rock mass, Qedl sediments, and toppling-deformed rock mass near the shallow surface of the excavation face are disturbed and deformed during excavation. Furthermore, the rock mass with a low unloading degree in the deep part of the slope experiences minimal disturbance during excavation.

5. Analysis of Numerical Calculation Results on Support Effect for Fractured Loose Rock Slopes

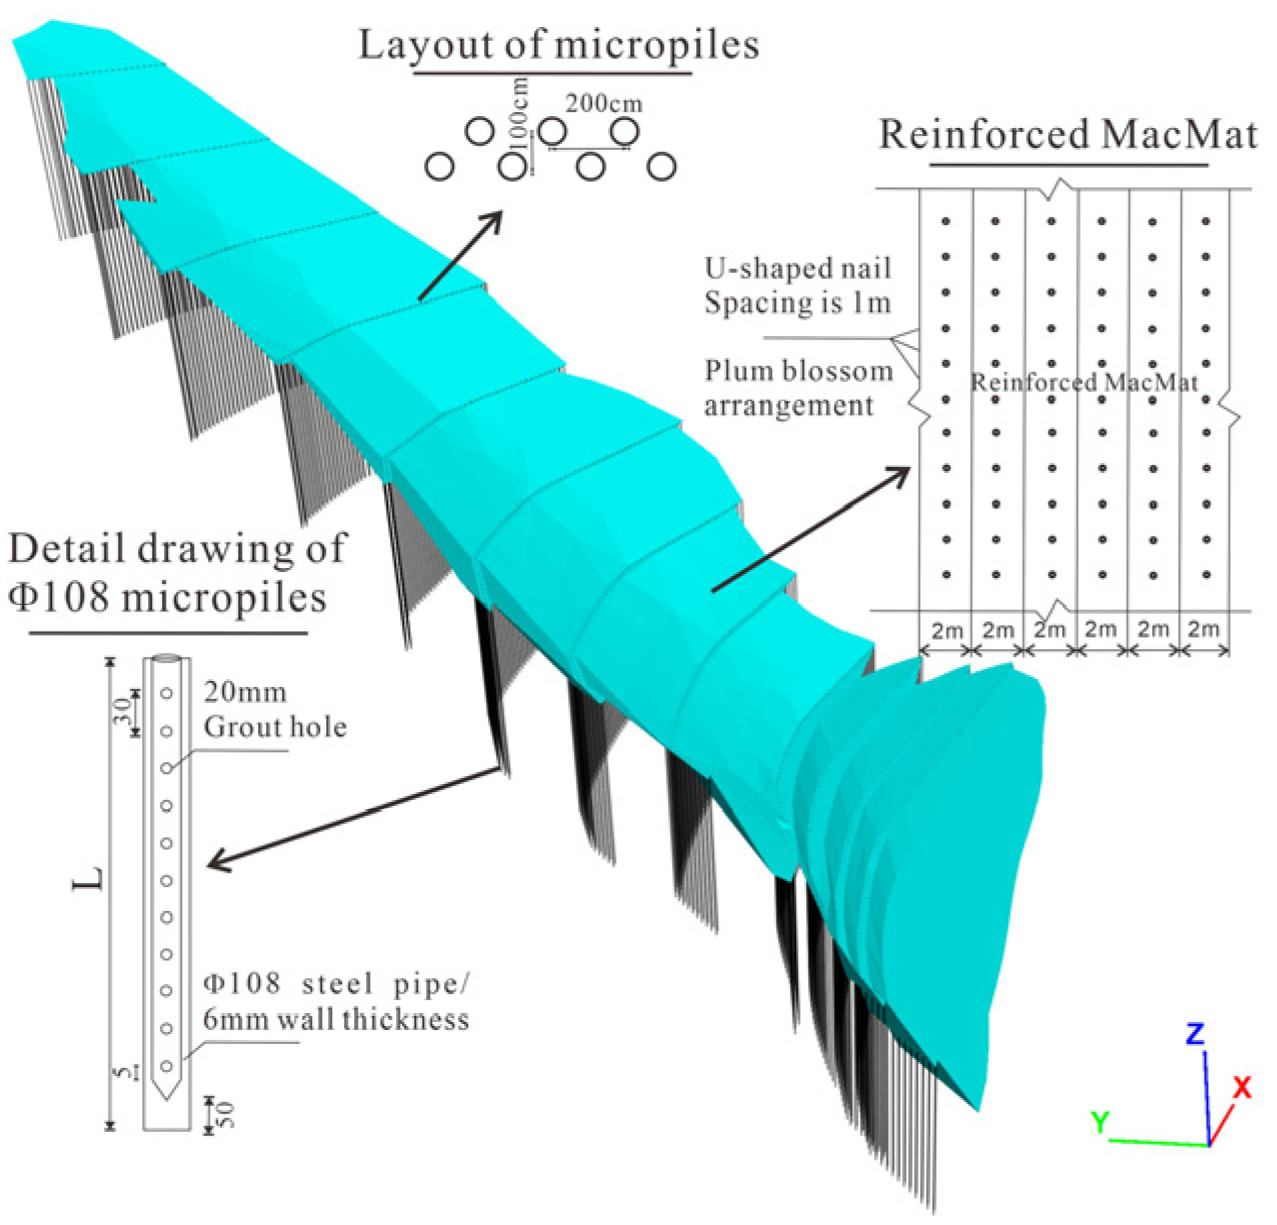
5.1. Design of Support Scheme for Excavation Slope

According to the Specifications for the Design of Highway Landslide Stabilization (JTG/T 3334-2018) and the Code for the Design of Slopes of Hydropower Projects (NB/T 10512-2021), the principle of “preliminary shaft, strengthening the waist and fixing the foot” is considered in the support scheme for the excavation treatment of the cataclastic loose rock slope of the mixing plant. The use of micropiles is proposed to strengthen the toe and top of the slope, and MacMat reinforcement is implemented to protect the surface of the slope and prevent local rockfall on the surface. This procedure is conducive to the subsequent greening treatment. The lock mouth micropile has a wall thickness of 6 mm and a diameter of 10.8 cm and is composed of three φ 25 reinforcing bars. The micropile is poured in an M30 cement mortar. Two rows of micropiles are set on the platform in a 9/12 m plum blossom arrangement and arranged with spacing of 2 m. The row spacing is 1 m, the rock entry position is ≥2 m, and the specific support design is as shown in Figure 19.
The engineering analogy method is selected to determine the mechanical parameters of the supporting structure. The values of the physical and mechanical parameters of the locking micropiles and reinforced MacMat are shown in Table 3.

5.2. Displacement Field Analysis After Slope Support

As shown in Figure 20, the maximum horizontal displacement of the slope in the Y direction near the excavation face after the implementation of the support measures decreases from 13.86 cm to 2.49 cm; the maximum vertical displacement in the Z direction decreases from 11.4 cm to 1.66 cm; and the maximum total displacement decreases from 18.3 cm to 2.78 cm. These findings indicate that the support effect is evident. However, in the right section of the Qedl sediments outside the excavation support slope surface and at the junction of the front edge of the cataclastic loose rock mass and the alteration zone SB2, the displacement value remains large because the rock mass parameter strength is low and no support treatment is carried out. Thus, special cleaning and support in the actual project are recommended.

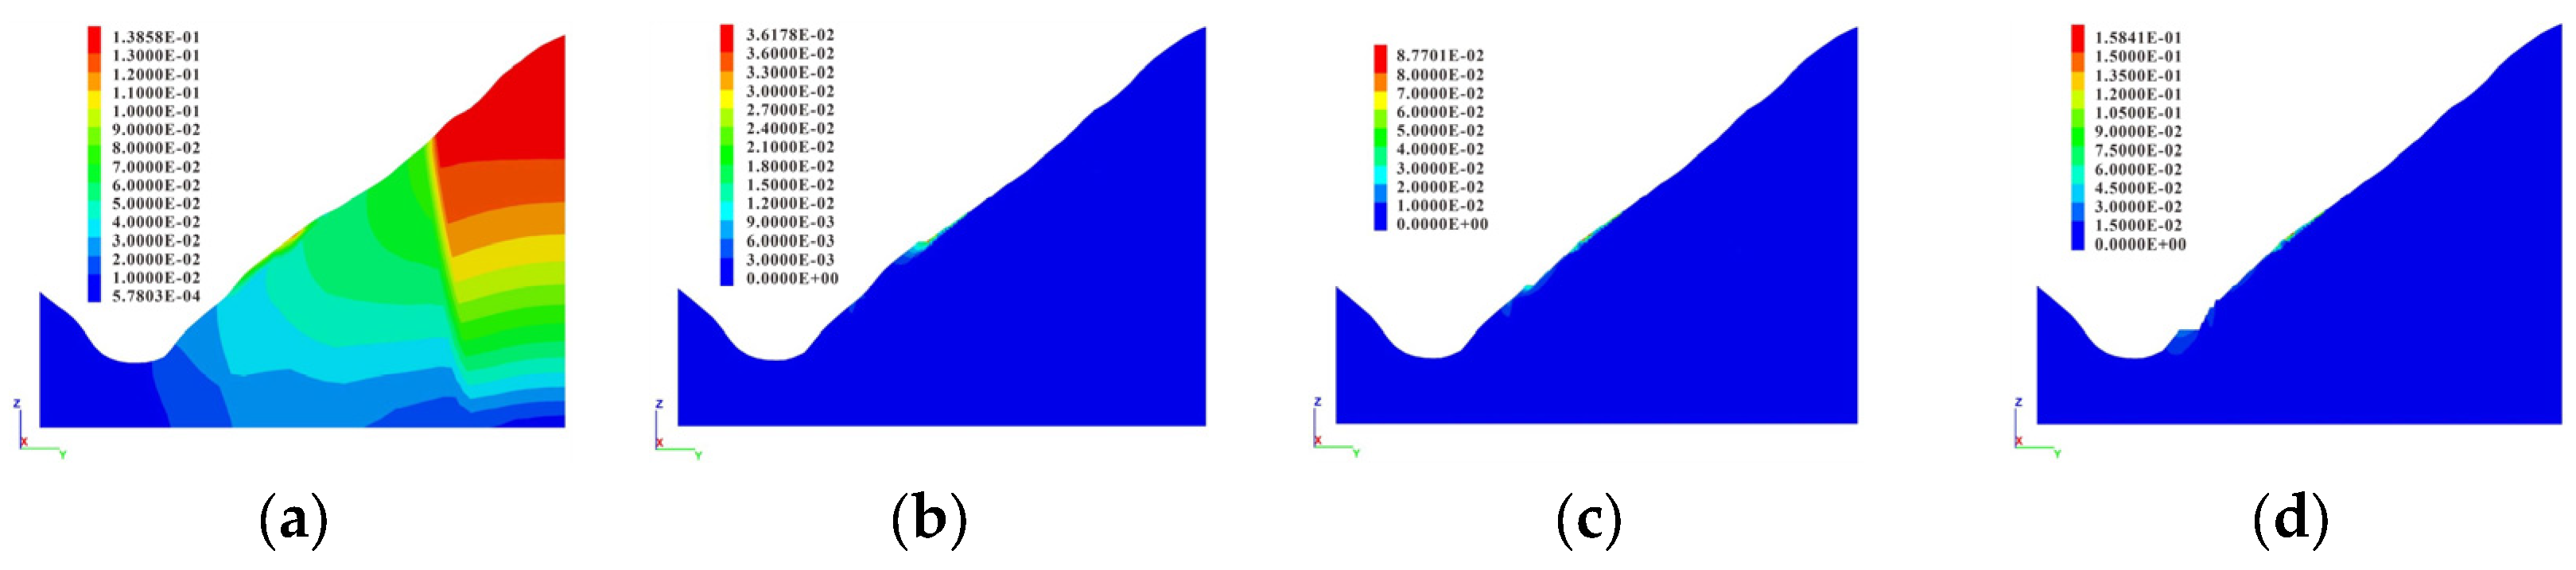
5.3. Typical Section Displacement Field Analysis After Slope Support

As shown in Figure 21, the distribution of the Y-direction horizontal displacement, Z-direction vertical displacement, and total displacement of the A–A′ section before and after the implementation of support measures essentially remains unchanged. However, the maximum displacement in the horizontal direction decreases by approximately 12 cm, the maximum displacement in the vertical direction decreases by approximately 10 cm, and the maximum total displacement decreases by approximately 14 cm after the implementation of the support measures. Their development ranges and depths are significantly reduced.

5.4. Characteristic Analysis of Monitoring Points After Implementation of Support Measures

5.4.1. Displacement Monitoring Curve in Y Direction

As shown in Figure 22, the trend of the Y-direction displacement monitoring curve before and after the implementation of the support measures essentially remains unchanged, but the cumulative displacement of A-2 decreases by approximately 2.1 cm, the cumulative displacement of A-5 decreases by approximately 10.2 cm, and the final displacement of A-8–10 in the Y direction decreases by approximately 2.8 cm.

5.4.2. Displacement Monitoring Curve in Z Direction

As shown in Figure 23, the trend of the displacement monitoring curve in the Z direction before and after the implementation of support remains essentially unchanged. However, the A-2 and A-3 monitoring points produce small vertical upward displacements because of the low strength and loose structure of the Qedl soil during support application. In addition, the installation of preliminary shaft micropiles induces the compaction of the surrounding soil and vertical upward displacement. The cumulative displacement of the A-5–7 monitoring points decreases by approximately 4.6 cm, and the final displacement of the A-8–10 monitoring points in the Z direction decreases by approximately 2.4 cm.

5.4.3. Deformation Rate Monitoring Curve

As shown in Figure 24, the trend of the deformation rate curve of each monitoring point before and after support remains essentially unchanged. However, the peak value of the deformation rate of each monitoring point after support exhibits a considerable decline, and it is only 10–50% of the maximum deformation rate prior to support.

6. Stability Analysis of Cataclastic Loose Rock Slope After Support Under Seismic Conditions

6.1. Analysis of Overall Stability of Slope

Following the installation of the slope support, the overall slope exhibits different degrees of displacement under seismic conditions (Figure 25). The maximum model displacement is localized at the right side of the Qedl sediment that did not undergo the cutting slope excavation treatment. The maximum displacement is approximately 9.14 m, and substantial collapse damage occurs. The displacement at the intersection of the left excavation slope section and the cataclastic loose rock mass is approximately 4.36 m, where the block collapse deformation failure of the cataclastic loose rock mass also occurs.

6.2. Displacement Field Analysis of Typical Section

Figure 26 illustrates that, under seismic conditions, the maximum total displacement of the A–A′ section of the cataclastic loose rock mass slope at the mixing plant is approximately 4.12 m after the implementation of support measures, mainly concentrated near the Qedl deposits of the excavation slope. After earthquake loading, the effect of the support measures gradually declines, and the Qedl sediment of the excavation slope collapses and undergoes deformation. However, the displacement at the junction of slightly weathered dacite in the deep part of the slope is small given that the preliminary shaft micropile (the rock entry position ≥ 2 m) serves as a support.
As shown in Figure 27, the total displacement trend of the monitoring points arranged on the A–A′ section is the same. Under the action of a seismic load, the displacement change in the early stage is small, but the deformation at the excavation slope increases sharply with increasing seismic peak values. The displacements of A2, A5, and A8 are large, and the displacement curve has no convergence trend with the seismic wave loading. This finding demonstrates that the total displacement increases toward the slope surface. Moreover, the maximum displacement of the rock block with partial instability and collapse on the slope surface can reach 4.12 m. The A4, A7, and A10 curves exhibit slight fluctuations, indicating that the total displacement increment at the junction of the deep excavation slope and the slightly weathered dacite is small. This finding is essentially consistent with the displacement distribution pattern shown in the total displacement nephogram of the A–A′ section.

6.3. Deformation Rate Analysis of Typical Section

The undisturbed state of the central axis section (A–A′) of the excavation slope is analyzed after the implementation of support measures, and the velocity nephogram is investigated after 1, 2, 3, 4, and 5 s of seismic wave loading application (Figure 28).
When the cataclastic loose rock mass slope of the mixing plant after the implementation of the support measures is not disturbed by external factors under self-weight stress, the slope is in a stable state, producing a negligible velocity (approximately 5.3 × 10⁻⁶ m/s) near the Qedl sediment of the excavation slope. The seismic wave loaded for 1 s gradually propagates from the bottom of the model to the upper slope surface. The bottom of the model is mostly affected by the seismic wave, and its velocity is approximately 0.87 m/s. When the seismic wave is loaded for 2 s, as the seismic wave is gradually transferred from the bottom to the inside of the slope, the slope interior begins to experience disturbance, the Qedl deformation rate of the shallow surface of the excavation slope with weak physical and mechanical strength gradually starts to increase, the supporting measures gradually fail, the excavation slope begins to collapse, and the maximum speed of some collapsed rocks is 1.19 m/s. When the seismic wave is loaded for 3–4 s, the internal cracks of the Qedl soil continue to expand, the collapse deformation dominated by shear failure is intensified, and the maximum velocity of some collapsed rock blocks can reach 2.39 m/s. When the seismic wave is loaded for 5 s, the cumulative deformation rate of the block at the collapse site reaches the maximum—approximately 3.11 m/s—and the supporting measures are completely ineffective.

7. Conclusions

Based on the excavation collapse phenomenon of the cataclastic loose rock slope at the mixing plant in an actual hydropower project, the excavation model of the cataclastic loose rock slope of the mixing plant is established, and a support scheme is designed. The following results are obtained after numerical calculation.
(1)
The cataclastic loose rock mass and Qedl sediment on the shallow surface of the excavation face exhibit the main deformation and failure areas after excavation. Moreover, unloading rebound occurs on the excavation slope and steps to varying degrees. The rock mass is likely to slide and deform to the free face along the interface between the cataclastic loose rock mass and the toppling-deformed rock mass at the lower part of the excavation face, greatly affecting the slope stability.
(2)
Adopting the method combining preliminary shaft micropiles and Macintosh reinforced pads is feasible and effective. Following the implementation of support measures, the maximum displacement value of the entire slope in the Y and Z directions near the excavation face is considerably reduced, along with the extent of its influence. Moreover, the peak rate of each monitoring point decreases remarkably, but the deformation and displacement at the intersection of the cataclastic loose rock mass and Qedl sediment must be monitored in the actual project.
(3)
Under a seismic load, the fractured loose rock slope of the mixing plant after support illustrates large displacement on the shallow surface of the excavation slope, and the collapse deformation is predominantly shear failure. The damage is concentrated near the Qedl sediment and cataclastic loose rock mass, and the supporting measures at these two places must be strengthened.
The support system comprising preliminary shaft micropiles and Macintosh reinforced pads integrates the mechanical advantages of structural reinforcement and ecological protection. Micropiles provide an anti-sliding force, while the Macintosh reinforced pads inhibit shallow erosion and promote vegetation restoration. During construction, the support system is implemented by installing the micropiles first, followed by the placement of the Macintosh reinforced pads. The pads are then covered with soil and drought-resistant plants to achieve rapid stability and long-term ecological benefits.

Author Contributions

W.L. methodology, investigation, writing—original draft, H.D. writing—review & editing, project administration, fund acquisition, S.T. methodology, software, data curation. All authors have read and agreed to the published version of the manuscript.

Funding

This research received no external funding.

Institutional Review Board Statement

Not applicable.

Informed Consent Statement

Not applicable.

Data Availability Statement

Data generated or analysed during this study are available from the corresponding author upon reasonable request.

Conflicts of Interest

The authors declare no conflict of interest.

References

  1. Hopkins, D.L. The implications of joint deformation in analyzing the properties and behavior of fractured rock masses, underground excavations, and faults. Int. J. Rock. Mech. Min. 2000, 37, 175–202. [Google Scholar] [CrossRef]
  2. Hatzor, Y.H.; Arzi, A.A.; Zaslavvsky, Y. Dynamic stability analysis of jointed rock slopes using the DDA method: King Herod’s Palace, Masada, Israel. Int. J. Rock. Mech. Min. 2004, 41, 813–832. [Google Scholar] [CrossRef]
  3. Wang, C.; Tanant, D.D.; Lilly, P.A. Numerical analysis of the stability of heavily jointed rock slopes using PFC2D. Int. J. Rock. Mech. Min. 2003, 40, 415–424. [Google Scholar] [CrossRef]
  4. Meng, Q.M. Analysis of xibang loose rock mass and slope stability in Xiaolongtan coal mine. J. Geol. Hazards Environ. Preserv. 1996, 37–43. [Google Scholar]
  5. Zheng, D.; Wang, Y.; Yao, Q.; Li, W.L. Cataclastic Loose Rock Mass on the Abutment Slope of a HydropowerStation: Development Characteristics and Excavation Deformation Response. J. Chang. River Sci. Res. Inst. 2019, 36, 50–56. [Google Scholar] [CrossRef]
  6. Wang, M.; Jiang, T.T. Study on Seepage and Stability Characteristics of Cataclastic and Relaxed Rock Mass Slope under the Snow Melting Condition. Pearl River 2019, 40, 56–61+88. [Google Scholar] [CrossRef]
  7. Liu, W.G. Analyzing Development Characteristicscauses to 1# Ripping Loose Rock Mass of Yagen Hydropower Station; Chengdu University of Technology: Chengdu, China, 2009. [Google Scholar]
  8. Jia, L.J. Stability Study to 2# Ripping Loose rock Massslope of Yagen Hydropower Station; Chengdu University of Technology: Chengdu, China, 2009. [Google Scholar]
  9. Xie, Y. Equivalent Research on Engineering Characteristics of Cataclastic Rockmass and its Engineering Application; Chengdu University of Technology: Chengdu, China, 2010. [Google Scholar]
  10. Hu, Y.F.; Shen, J.H.; Nie, D.X. Engineering Suitability Research on the Tension-slackened Rock Mass in Yagen Hydropower Station. J. Hydroelectr. Eng. 2011, 34, 28–30. [Google Scholar] [CrossRef]
  11. Han, W.F.; Chen, W.W. Study on Engineering Characteristics of the Dynamo-Relaxed Rockmass. Chin. J. Rock Mech. Eng. 2000, 26, 751–755. [Google Scholar]
  12. Wang, Z.Y.; Qi, W.; Men, Y.M.; Peng, J.B. Tectonic control on water hazards of coal mine in Henan Province. Coal Geol. Explor. 2004, 32, 48–53. [Google Scholar] [CrossRef]
  13. Yuan, Y. The Analysis of Genetic Mechanisms of Broken Loose Rock Mass and Stability on the left bank of the Middle Dam Area of a Hydroelectric Power Station in Lancang River; Chengdu University of Technology: Chengdu, China, 2016. [Google Scholar]
  14. Jiang, S.N. Research on Physical and Mechanical Properties and Damage Characteristics of Freeze-Thaw Rock in Alpine Mountain Regions—Taking the Dacite of a Proposed Hydropower Station Dam Area as an Example; Chengdu University of Technology: Chengdu, China, 2016. [Google Scholar]
  15. Singh, M.; Rao, K.S. Empirical methods to estimate the strength of jointed rock masses. Eng. Geol. 2005, 77, 127–137. [Google Scholar] [CrossRef]
  16. Zou, J. Development Characteristics and Stability Study on Cataclastic Loose Rock Mass in the Alpine Mountain Regions and Deep Valley; Chengdu University of Technology: Chengdu, China, 2016. [Google Scholar]
  17. Huang, P.; Zhang, M.; Qiao, P. Study on the Genetic Mechanism of Cataclastic Loose Rock Mass on the Lancang River Basin of the Qinghai -Tibet Plateau. Pearl Revier 2018, 39, 44–53. [Google Scholar]
  18. Wu, S.Y.; Li, P.F.; Chen, Z.H. Study on the Engineering Characteristics of Cataclastic Relaxed Rock Mass in High-cold Canyon. Chin. J. Undergr. Space Eng. 2018, 14, 1250–1257. [Google Scholar]
  19. Guo, L.N.; Cao, X.X.; Jia, H. Stability Analysis and Prevention of High Slope with Broken Loose Rock Mass. J. Water Resour. Archit. Eng. 2021, 19, 42–47+88. [Google Scholar] [CrossRef]
  20. Sembenelli, P. Secondary movements during excavations. In Proceedings of the 4th Congress of the International Society for Rock Mechanics, Montreux, Switzerland, 2–8 September 1979; pp. 397–400. [Google Scholar]
  21. Ugai, K. A method of calculation of total factor of safety of slopes by elasto-plastic FEM. Soils Found 1989, 29, 35–40. [Google Scholar] [CrossRef] [PubMed]
  22. Matsui, T.; San, K.C. Finite element slope stability analysis by shear strength reduction technique. Soils Found 1992, 32, 43–70. [Google Scholar] [CrossRef]
  23. Fang, G.; Wei, G.; Jun, T.J. Research on Deformation Stability of Soft Rock Slope under Excavation Based on FLAC3D. Appl. Mech. Mater. 2013, 275–277, 290–294. [Google Scholar] [CrossRef]
  24. Du, W.; Chen, X.; Cheng, L.L.; Jiang, H.; Wang, W. Parametric Analysis of Rock Mass during Excavation and Unloading of Rock Slope. J. Disaster Prev. Mitig. Eng. 2023, 43, 596–603. [Google Scholar] [CrossRef]
  25. Zhao, W.H.; Huang, R.Q.; Zhao, J.J. Rockfall Mechanism of Cataclastic Rock Mass and Influence of Back Wall Upon the Stability of Accumulation Under Strong Earthquake. J. Eng. Geol. 2011, 19, 205–212. [Google Scholar]
  26. Sitharam, T.G.; Latha, G.M. Simulation of excavations in jointed rock masses using a practical equivalent continuum approach. Int. J. Rock. Mech. Min. 2002, 39, 517–525. [Google Scholar] [CrossRef]
  27. Niu, Y. Study on the Method of Rapid Identification of Perilous Rock Mass by 3D Laser Scanning; Chengdu University of Technology: Chengdu, China, 2020. [Google Scholar]
  28. Ning, H. Recognition and Information Extraction of Rock Mass Structural Plane Based on 3D Laser Scanning; Chengdu University of Technology: Chengdu, China, 2020. [Google Scholar]
  29. Sha, P.; Kong, D.H.; Wang, S.L. Identification of Rockmass Discontinuities and 3D Discrete Element Modeling of High Slope Based on Unmanned Aerial Vehicle Photogrammetry. J. Eng. Geol. 2022, 30, 1658–1668. [Google Scholar] [CrossRef]
  30. Du, P.; Xu, Y.; Guo, Y. Assessing loess landslide volume using high-precision UAV-derived DEM: A case study of the 15 March 2019 landslide in Zaoling Township, Xiangning County in North China. Nat. Hazards Res. 2023, 3, 640–645. [Google Scholar] [CrossRef]
  31. Li, L.Q.; Ju, N.P.; Zhang, S. Seismic wave propagation characteristic and its effects on the failure of steep jointed anti-dip rock slope. Landslides 2019, 16, 105–123. [Google Scholar] [CrossRef]
  32. Zheng, Y.; Wang, R.Q.; Chen, C.X. Dynamic analysis of anti-dip bedding rock slopes reinforced by prestressed cables using discrete element method. Eng. Anal. Bound. Elem. 2021, 130, 79–93. [Google Scholar] [CrossRef]
  33. Sheng, J.; Li, X.D. Determination of mechanical parameters of rock mass based on Hoek Brown strength criterion. Min. Technol. 2009, 9, 12–14+33. [Google Scholar] [CrossRef]
  34. Shi, X.; Zhao, D.J.; Song, S.Y. Face stability analysis of the circular tunnels in fractured rock masses based on the nonlinear Hoek-Brown failure criterion. Chin. J. Rock Mech. Eng. 2020, 39, 3359–3366. [Google Scholar] [CrossRef]
  35. Tian, M.L. HOEK-BROWN Criterion Parameter Optimization and Its Applications in Engineering; Shandong University of Science and Technology: Qingdao, China, 2018. [Google Scholar]
Figure 1. On-site study area. (a) Cataclastic loose rock mass (SL12). (b) Tensile deformation zone.
Applsci 15 07480 g001
Figure 2. Distribution of lithology in the study area.
Applsci 15 07480 g002
Figure 3. Slope in the central axis section of the study area.
Applsci 15 07480 g003
Figure 4. Schematic of slope sliding tensile failure.
Applsci 15 07480 g004
Figure 5. Comparison of equal density of the structural plane. (a) Point cloud recognition (b) DFN partition.
Applsci 15 07480 g005
Figure 6. DFN disc joint assignment.
Applsci 15 07480 g006
Figure 7. Plane layout of excavation line.
Applsci 15 07480 g007
Figure 8. The 3DEC 3D excavation model and monitoring point layout.
Applsci 15 07480 g008
Figure 9. Boundary conditions.
Applsci 15 07480 g009
Figure 10. Time history curve of the horizontal seismic wave H. (a) Acceleration (b) Velocity (c) Displacement.
Applsci 15 07480 g010
Figure 11. Time history curve of vertical seismic wave V. (a) Acceleration (b) Velocity (c) Displacement.
Applsci 15 07480 g011
Figure 12. Displacement nephogram after slope excavation (unit: cm). (a) X direction (b) Y direction (c) Z direction (d) Total displacement.
Applsci 15 07480 g012
Figure 13. Horizontal displacement nephogram of the A–A′ section (unit: cm). (a) Natural state (b) Primary excavation (c) Secondary excavation (d) Three-stage excavation.
Applsci 15 07480 g013
Figure 14. Vertical displacement nephogram of the A–A′ section (unit: cm). (a) Natural state (b) Primary excavation (c) Secondary excavation (d) Three-stage excavation.
Applsci 15 07480 g014
Figure 15. Total displacement nephogram of the A–A′ section (unit: cm). (a) Natural state (b) Primary excavation (c) Secondary excavation (d) Three-stage excavation.
Applsci 15 07480 g015
Figure 16. Displacement monitoring curve in Y direction.
Applsci 15 07480 g016
Figure 17. Displacement monitoring curve in the Z direction.
Applsci 15 07480 g017
Figure 18. Deformation rate monitoring curve.
Applsci 15 07480 g018
Figure 19. Schematic diagram of the support.
Applsci 15 07480 g019
Figure 20. Nephogram of overall displacement after the implementation of support measures (unit: cm). (a) Horizontal direction (b) Vertical direction (c) Overall total displacement.
Applsci 15 07480 g020
Figure 21. Displacement nephogram of A–A′ section after the implementation of support measures (unit: cm). (a) Horizontal direction (b) Vertical direction (c) Overall total displacement.
Applsci 15 07480 g021
Figure 22. Displacement monitoring curve in Y direction.
Applsci 15 07480 g022
Figure 23. Displacement monitoring curve in the Z direction.
Applsci 15 07480 g023
Figure 24. Deformation rate monitoring curve.
Applsci 15 07480 g024
Figure 25. Nephogram of total displacement under seismic conditions (unit: m).
Applsci 15 07480 g025
Figure 26. Nephogram of total displacement of section A–A′ after 5 s of seismic loading (unit: m).
Applsci 15 07480 g026
Figure 27. Total displacement curves of monitoring points.
Applsci 15 07480 g027
Figure 28. Time history velocity nephogram of the A–A′ section after seismic wave loading (unit: m/s). (a) 0 s (b) 1 s (c) 2 s (d) 3 s (e) 4 s (f) 5 s.
Applsci 15 07480 g028
Table 1. Rock mass calculation parameters.
Stratum LithologyUnit WeightCohesionInternal Friction
Angle
Elastic ModulusPoisson’s RatioTensile Strength
γ (KN/m3) C (MPa) φ (°) E (GPa) μ σ t
Slightly weathered dacite26.81.250.228.380.221.6
Weakly unloaded dacite26.40.4637.712.520.251.15
Strongly unloaded dacite26.30.332.490.290.5
Cataclastic loose rock mass25.50.11285.150.350.18
Ductile shear zone26.20.4134.709.310.260.7
Strongly altered rock26.80.0821.820.380.01
Residual slope deposit21.990.0724.9910.4/
Table 2. Rock mass discontinuity calculation parameters.
Structural Plane TypeShear Strength
f′c′ (MPa)
RigidStructural plane with filling0.600.15
Unfilled structural plane0.550.10
WeakRock block and debris0.550.15
Cuttings with mud0.400.05
Mud mixed with rock debris0.350.04
Compression shear mylonite0.600.25
Weak interlayer0.250.05
Table 3. Calculation of physical and mechanical parameters for preliminary shaft micropiles.
Supporting StructureStructural ModelElastic ModulusTensile StrengthPoisson’s Ratio
(GPa)(Gpa/kN/m)
Preliminary shaft micropilesPile280.40.25
Reinforced MacMatShell10300.3
Disclaimer/Publisher’s Note: The statements, opinions and data contained in all publications are solely those of the individual author(s) and contributor(s) and not of MDPI and/or the editor(s). MDPI and/or the editor(s) disclaim responsibility for any injury to people or property resulting from any ideas, methods, instructions or products referred to in the content.

