Article

A Study of the Flexural Performance of Fiber-Reinforced Anchored Shotcrete Single-Layer Lining in a Hard Rock Tunnel Based on the Thickness Ratio

1
China Merchants Chongqing Communications Technology Research & Design Institute Co., Ltd., Chongqing 400060, China
2
School of Civil Engineering, Chongqing University, Chongqing 400044, China
*
Author to whom correspondence should be addressed.
Appl. Sci. 2025, 15(13), 7473; https://doi.org/10.3390/app15137473
Submission received: 20 May 2025 / Revised: 20 June 2025 / Accepted: 2 July 2025 / Published: 3 July 2025

Abstract

Aiming at the unclear bearing mechanism of the single-layer lining structure of high-performance fiber shotcrete under layered construction in the hard rock section of a highway tunnel, this paper studies the effect of different thickness ratios under layered construction on the flexural performance of the single-layer lining structure. Six types of thickness ratio specimens were subjected to a four-point bending test. The tests employed 3D digital image correlation technology to record and analyze the deformation and failure process of the specimens, and the calculation method of single-layer lining flexural stiffness was modified. The results indicate that the flexural ultimate load of the specimens is achieved at a thickness ratio of 2, which is 20.9% higher compared to a thickness ratio of 0. Layered construction affects the failure mode of the specimens. All specimens exhibit mixed-mode failure. However, with the increase in the thickness ratio, the percentage of flexural failure cracks gradually increases. Under layered construction, the reduction in the effective bending stiffness of fiber shotcrete beams becomes more pronounced as the thickness ratio increases. Based on these findings, the interface influence factor is proposed, and the flexural stiffness is corrected using composite beam theory.

1. Introduction

As an important part of modern transportation network construction, the structural safety and durability of tunnel engineering are directly related to the service life and operational safety of the project [1]. The lining structure, as the main load-bearing component of the tunnel, has an important influence on the overall stability of the tunnel in terms of its mechanical properties. In recent years, tunnels have developed in the direction of deeper and longer [2], and composite lining is widely used in China [3]. The scope of the application of single-layer lining is limited by materials and construction technology; however, in recent years, with the rapid progress of materials and construction technology, the advantages of its construction simplicity and economic efficiency have been given full attention, and single-layer lining has gradually become a hotspot for research. However, how thick the single-layer lining is greatly affects how well it can bend, and the way stress is spread and how it fails can vary a lot with different thicknesses. At present, the research on the effect of the thickness ratio of single-layer lining on its flexural performance is still insufficient, which limits its optimized design and safe application under complex engineering conditions.
Concrete stacked beams, which are a common structural form, have been extensively studied by scholars both domestically and internationally regarding the factors that influence their flexural properties. The mechanical properties of concrete stacked beams are affected by their own material properties and structural configuration (fiber [4,5,6,7,8,9,10], aggregate [11,12,13], mineral admixture [14,15,16,17,18], splicing [19,20]) multifaceted coupling and the mixing of a certain amount of fibers and silica fume, and selecting the appropriate aggregate and structural construction can help to improve the flexural properties and stiffness of concrete beams. Zhou [21,22] analyzes the force characteristics of a multi-layer lining structure under interlayer action. There exists radial anti-slip action between layers of multi-layer shotcrete, which can form an integral bearing structure when composed of stacked lining. Deng [23] quantitatively determined the integrity of the structure with strong interlayer adhesion but did not establish the mechanical relationship between the external loads and each stacked layer. Xie et al. [24,25,26,27] carried out a study on the effect of interlayer composite action on the synergistic performance of concrete composite beams in bending and fatigue performance, and the results show that the interface debonding will reduce the synergistic performance of concrete beams, and the interfacial factor should be introduced into the study of the bending performance of concrete beams. Feng [28] found that the bonding properties of the materials between the two layers of concrete can increase the synergistic force of the structure, resulting in a class of composite load-bearing structures that improve the utilization of concrete. Some scholars have utilized the higher-order shear deformation theory [29] and Winkler theory [30,31] to carry out the basic theoretical study on the bending performance of stacked beams and found that the interlayer modulus and the thickness ratio affect the bending performance of the concrete beams, but there is a lack of detailed experimental studies on the thickness ratio. On the basis of two-layer concrete laminated beams, different composite materials (wood-concrete laminated beams [32], UHPC-NC laminated beams [33], rubber–concrete laminated beams [34], ECC–concrete laminated beams [35,36,37,38], reinforced bamboo–concrete laminated beams [39]) are used to study the bending performance, fatigue performance, flexural stiffness, and optimum distribution height of concrete beams. Performance, fatigue performance, and optimum distribution height are important factors, and the study showed that the height of the concrete layer of different materials significantly affects the bending performance of concrete beams, but there is no study on the effect of different concrete layer thickness ratios on the bending performance of concrete beams with the same material.
Currently, research on the performance of concrete stacked beams is still in its developmental stage, with studies primarily focusing on the impact of various concrete material factors. Research on concrete layering mainly concentrates on the optimal thickness distribution under the composite effect of different materials and the deformation and stress characteristics of the overall lining, considering interlayer effects. However, there is limited research on the impact of different thickness ratios on the bending performance of shotcrete. Single-layer lining is a support structure that effectively transfers shear force between layers, so it is important to study how layering impacts the strength of the structure. The thickness ratio of the different layers of the same concrete material is one of the key factors in the construction and affects the effectiveness of the support of the entire lining structure. On this basis, this study aims to investigate the flexural performance of single-layer lining under different thickness ratios by means of experimental research, combined with 3D-DIC technology, using high-performance fiber shotcrete, to reveal the influence of the law of the thickness ratio on the damage mode of the lining. The calculation of the bending stiffness of single-layer lining concrete beams is corrected by combining the theory of stacked beams, and the optimized design of the thickness ratio is proposed to provide a theoretical basis for the safe application of single-layer lining in tunnel engineering.

2. Materials and Methods

2.1. Test Materials

The concrete used in the test is C35 high-performance fiber shotcrete, and the ratio and basic physical and mechanical properties of the concrete are shown in Table 1. Fiber is polypropylene crude fiber; fiber-specific material parameters are shown in Table 2. Cement is Ordinary Portland cement P.O 42.5, and silica fume is SF85-R silica fume. The coarse aggregate grading range is 5–10 mm, the apparent density is 2700 kg/m3, the bulk density is 1530 kg/m3, the crushing index is 10%, and the mud content is 0.4%. The apparent density of fine aggregate was 2700 kg/m3, the bulk density was 1720 kg/m3, the fineness modulus was 2.9, and the mud content was 1.5%. The basic mechanical property parameters of concrete are tested accordingly, as shown in Table 3. All the indexes meet the “Technical specification for application of sprayed concrete” [40]. The process of shotcrete preparation is shown in Figure 1.

2.2. Test Methods

For specimen preparation, a mold of 450 mm × 350 mm × 120mm was used. According to “Test Methods of Cement and Concrete for Highway Engineering” [41], the size of the specimen is 400 mm × 100 mm × 100 mm. Secondary lining [42,43], as a structural form that needs to meet support and long-term durability, generally requires thicker concrete thicknesses. A total of 6 working conditions are adopted in the test, as shown in Table 4, with 3 specimens for each working condition. The total thickness of the specimen is 100 mm, and the initial spraying thickness and re-spraying thickness are calculated according to the different thickness ratios λ h . After 3 days of curing, it was cut according to different initial spray thicknesses to form smooth concrete beams. These beams were then placed into molds, and the second layer of concrete was sprayed at the site. It was cut after another 3 days of maintenance, and finally, the specimens with different thickness ratios for the working conditions were formed after being placed in a standard curing room for 28 days of curing. The surface of the specimen was uniformly coated with a white matte coating. After the coating dried, the surface of the specimen was marked with a marker to ensure that the specimen had sufficient contrast from the beginning to the end of loading, and the preparation process is shown in Figure 2.
In accordance with the “Technical specification for application of sprayed concrete” [40], the flexural performance of fiber shotcrete beams was tested using the four-point bending method. The four-point bending test is conducted by a mechanical universal testing machine, and the whole process is loaded by displacement control, with a loading rate of 0.05 mm/min. The fiber shotcrete beam specimen is placed on two metal supports, with a distance of 300 mm between the bottom supports and 100 mm between the upper loading points. Displacement sensors are installed in the span of the fiber shotcrete beam, and a high-definition camera is used for video recording of the whole process, allowing for real-time observation of the mechanical test and damage process. The real-time observation of the mechanical testing and damage process of the four-point bending test was realized. The range of the displacement transducer in the span of the rock sample is 25 mm, the resolution is 0.1 mm, and the accuracy is 0.8%. We adjusted the position of the fiber-sprayed concrete beam before loading to ensure the accuracy of the support and loading point. The test process is shown in Figure 3.

3. Test Results and Analysis

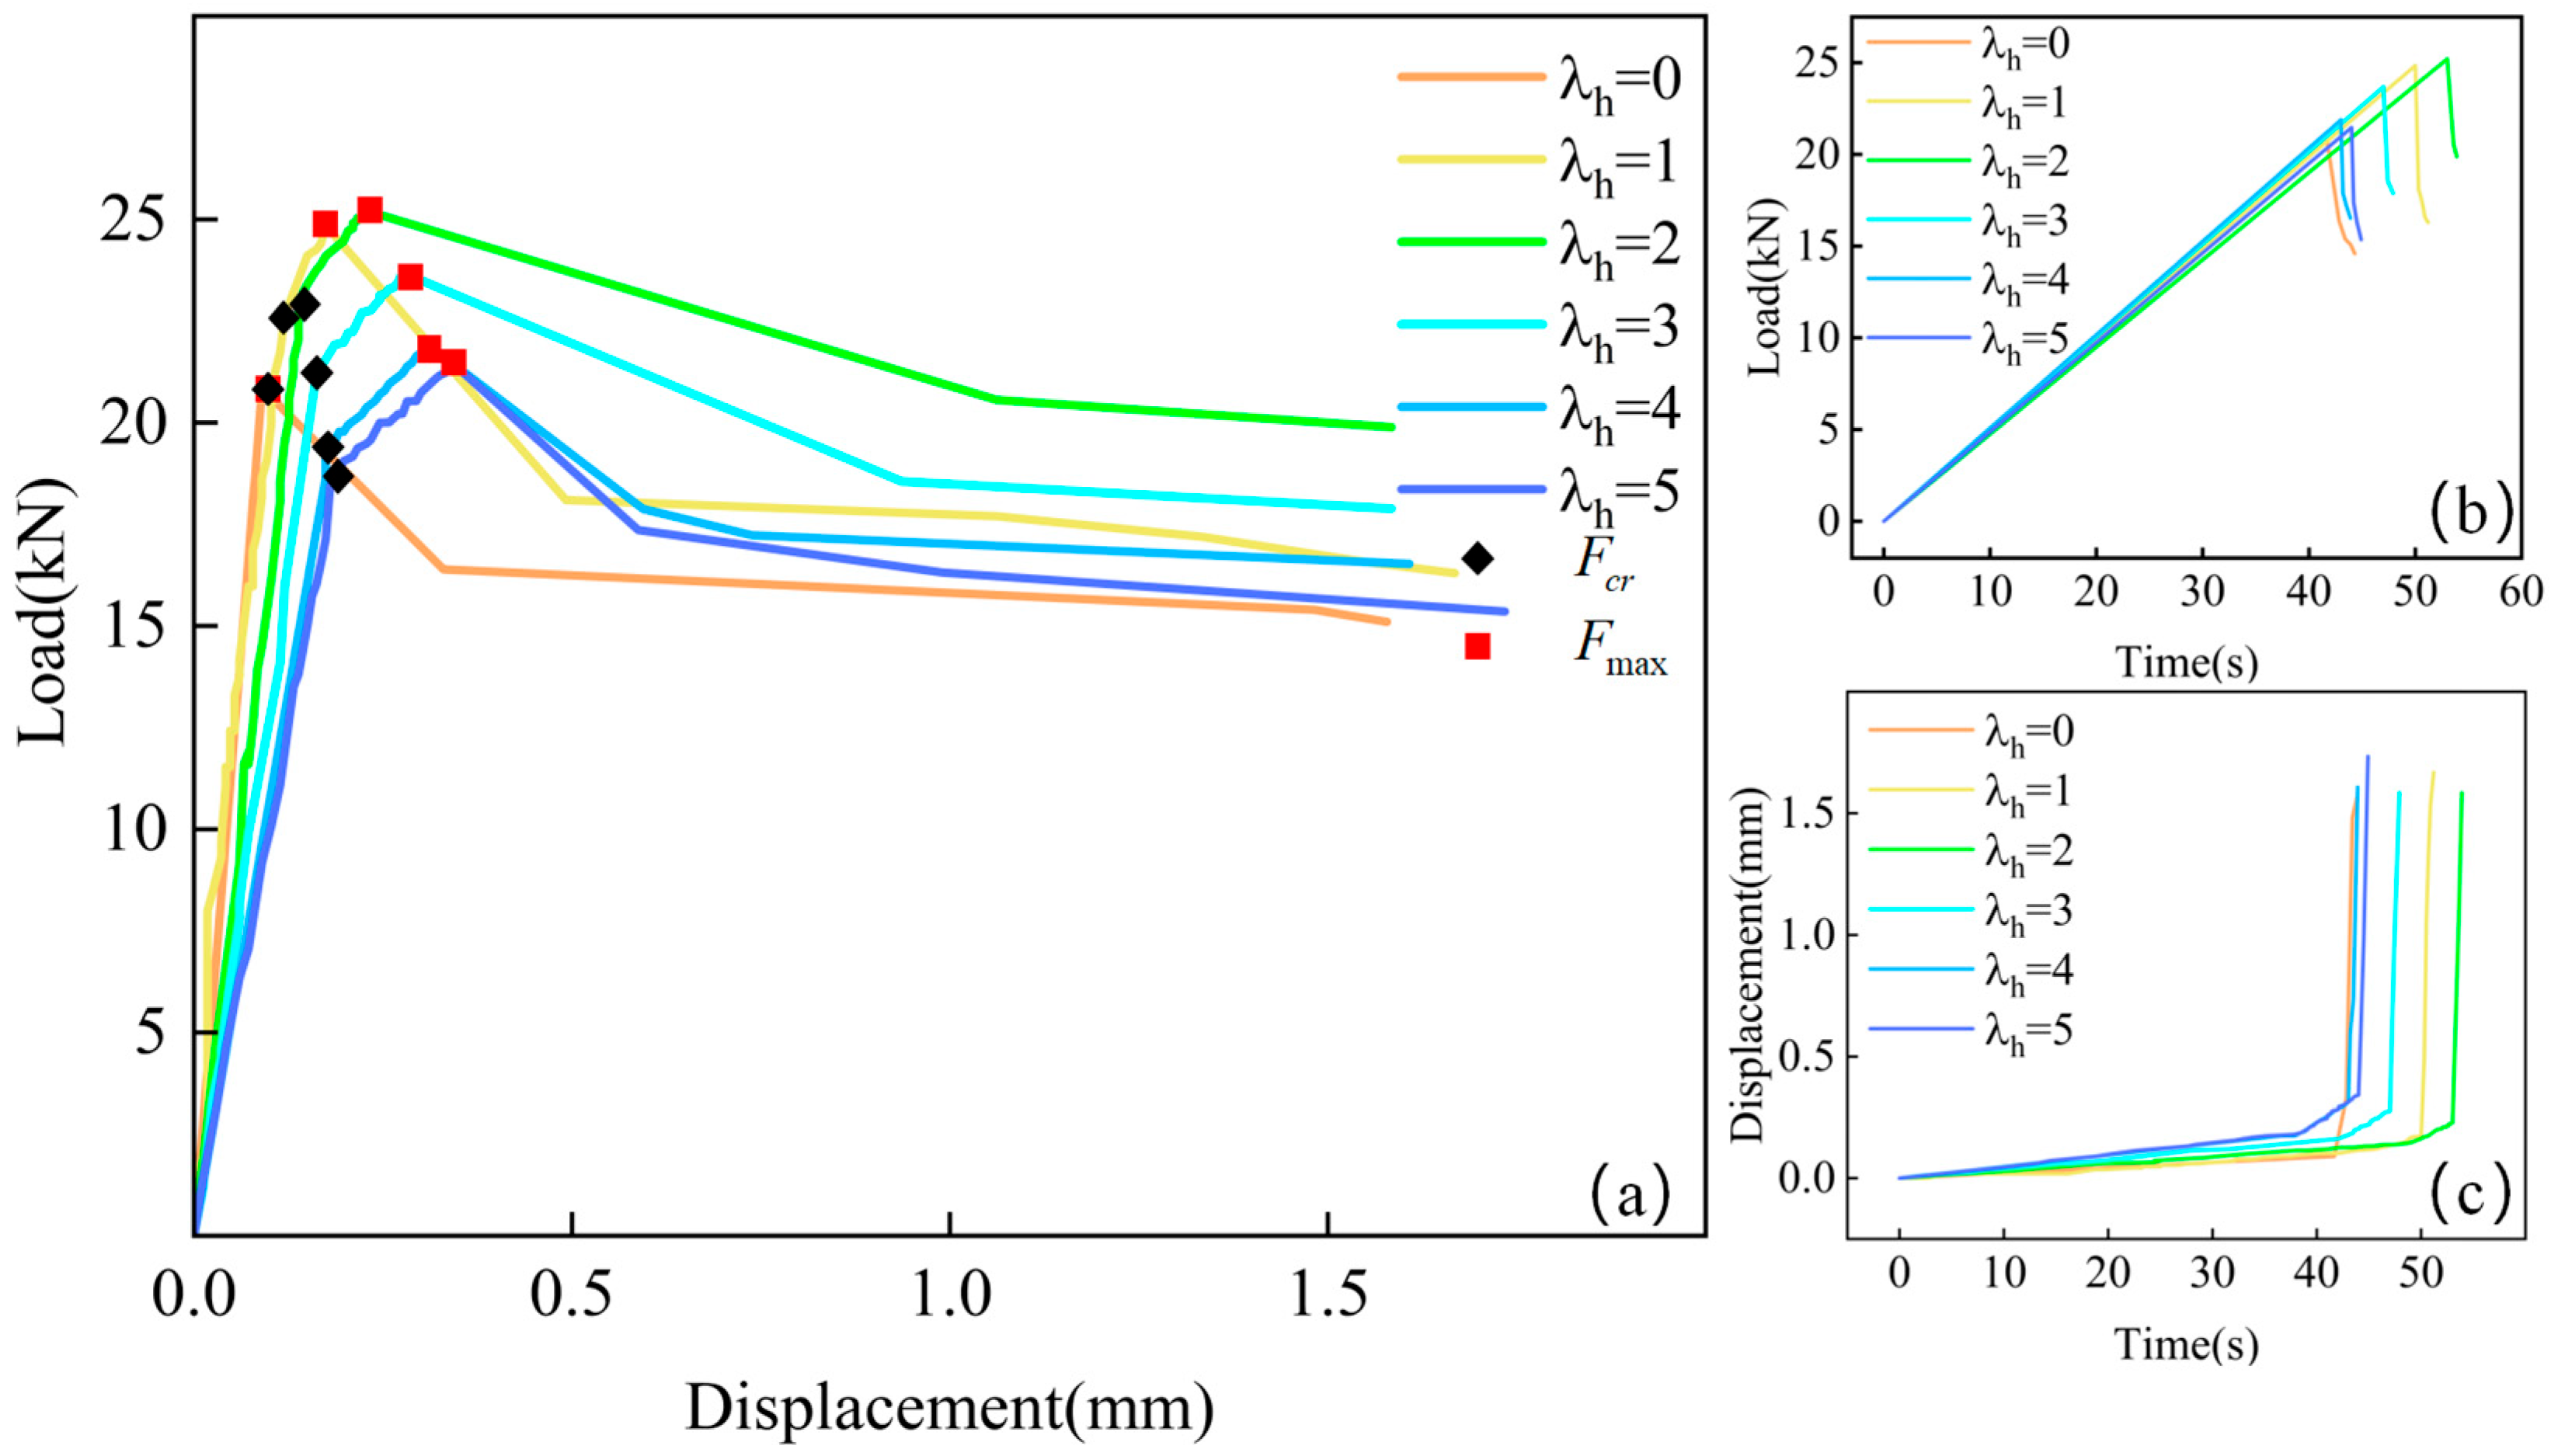
3.1. Axial Load–Displacement Curves Analysis

Figure 4 displays the axial load–displacement curves of the specimens during the four-point bending test. From the axial load–displacement curves, we can see that the fiber shotcrete beams with different thickness ratios bend less than 0.7 mm before getting damaged. In Figure 4b,c, we can see that the fiber shotcrete beams with the thickness ratio λ h = 0 first reach a maximum load of 20.85 kN after a flexible phase; then, the bending increases quickly, and the samples break in a brittle way. The fiber-reinforced shotcrete beams with thickness ratios λ h = 1 , 5 showed a slight increase in the deflection rate after the elastic stage. They then entered the crack stable propagation stage, where the load reached its maximum value. The specimen failed, with a rapid increase in deflection, which belongs to ductile fracture.
The crack formation threshold σ c r is the bending strength of the specimen at the point of initial crack generation. It reflects the elastic limit of the specimen and its ability to resist bending at the point of first crack formation, which is calculated by Equation (1).
σ c r = F c r L b h 2
In the formula, σ c r is the crack formation threshold of the specimen, MPa; F c r is the load of the specimen to produce the initial crack, N; and L, b, and h are the span, width, and height of the specimen, respectively, mm.
Peak flexural tensile strength σ max is the flexural tensile strength corresponding to the peak load that a specimen can withstand before a fracture occurs. σ max reflects the maximum stress that the specimen can withstand during the bending test. It is an important parameter for assessing the performance and reliability of the specimen, as calculated by Equation (2).
σ max = F max L b h 2
In the formula, σ max is the peak flexural tensile strength of the specimen, MPa, and F max is the peak load applied to the specimen during loading, N.
The test results are shown in Table 5.

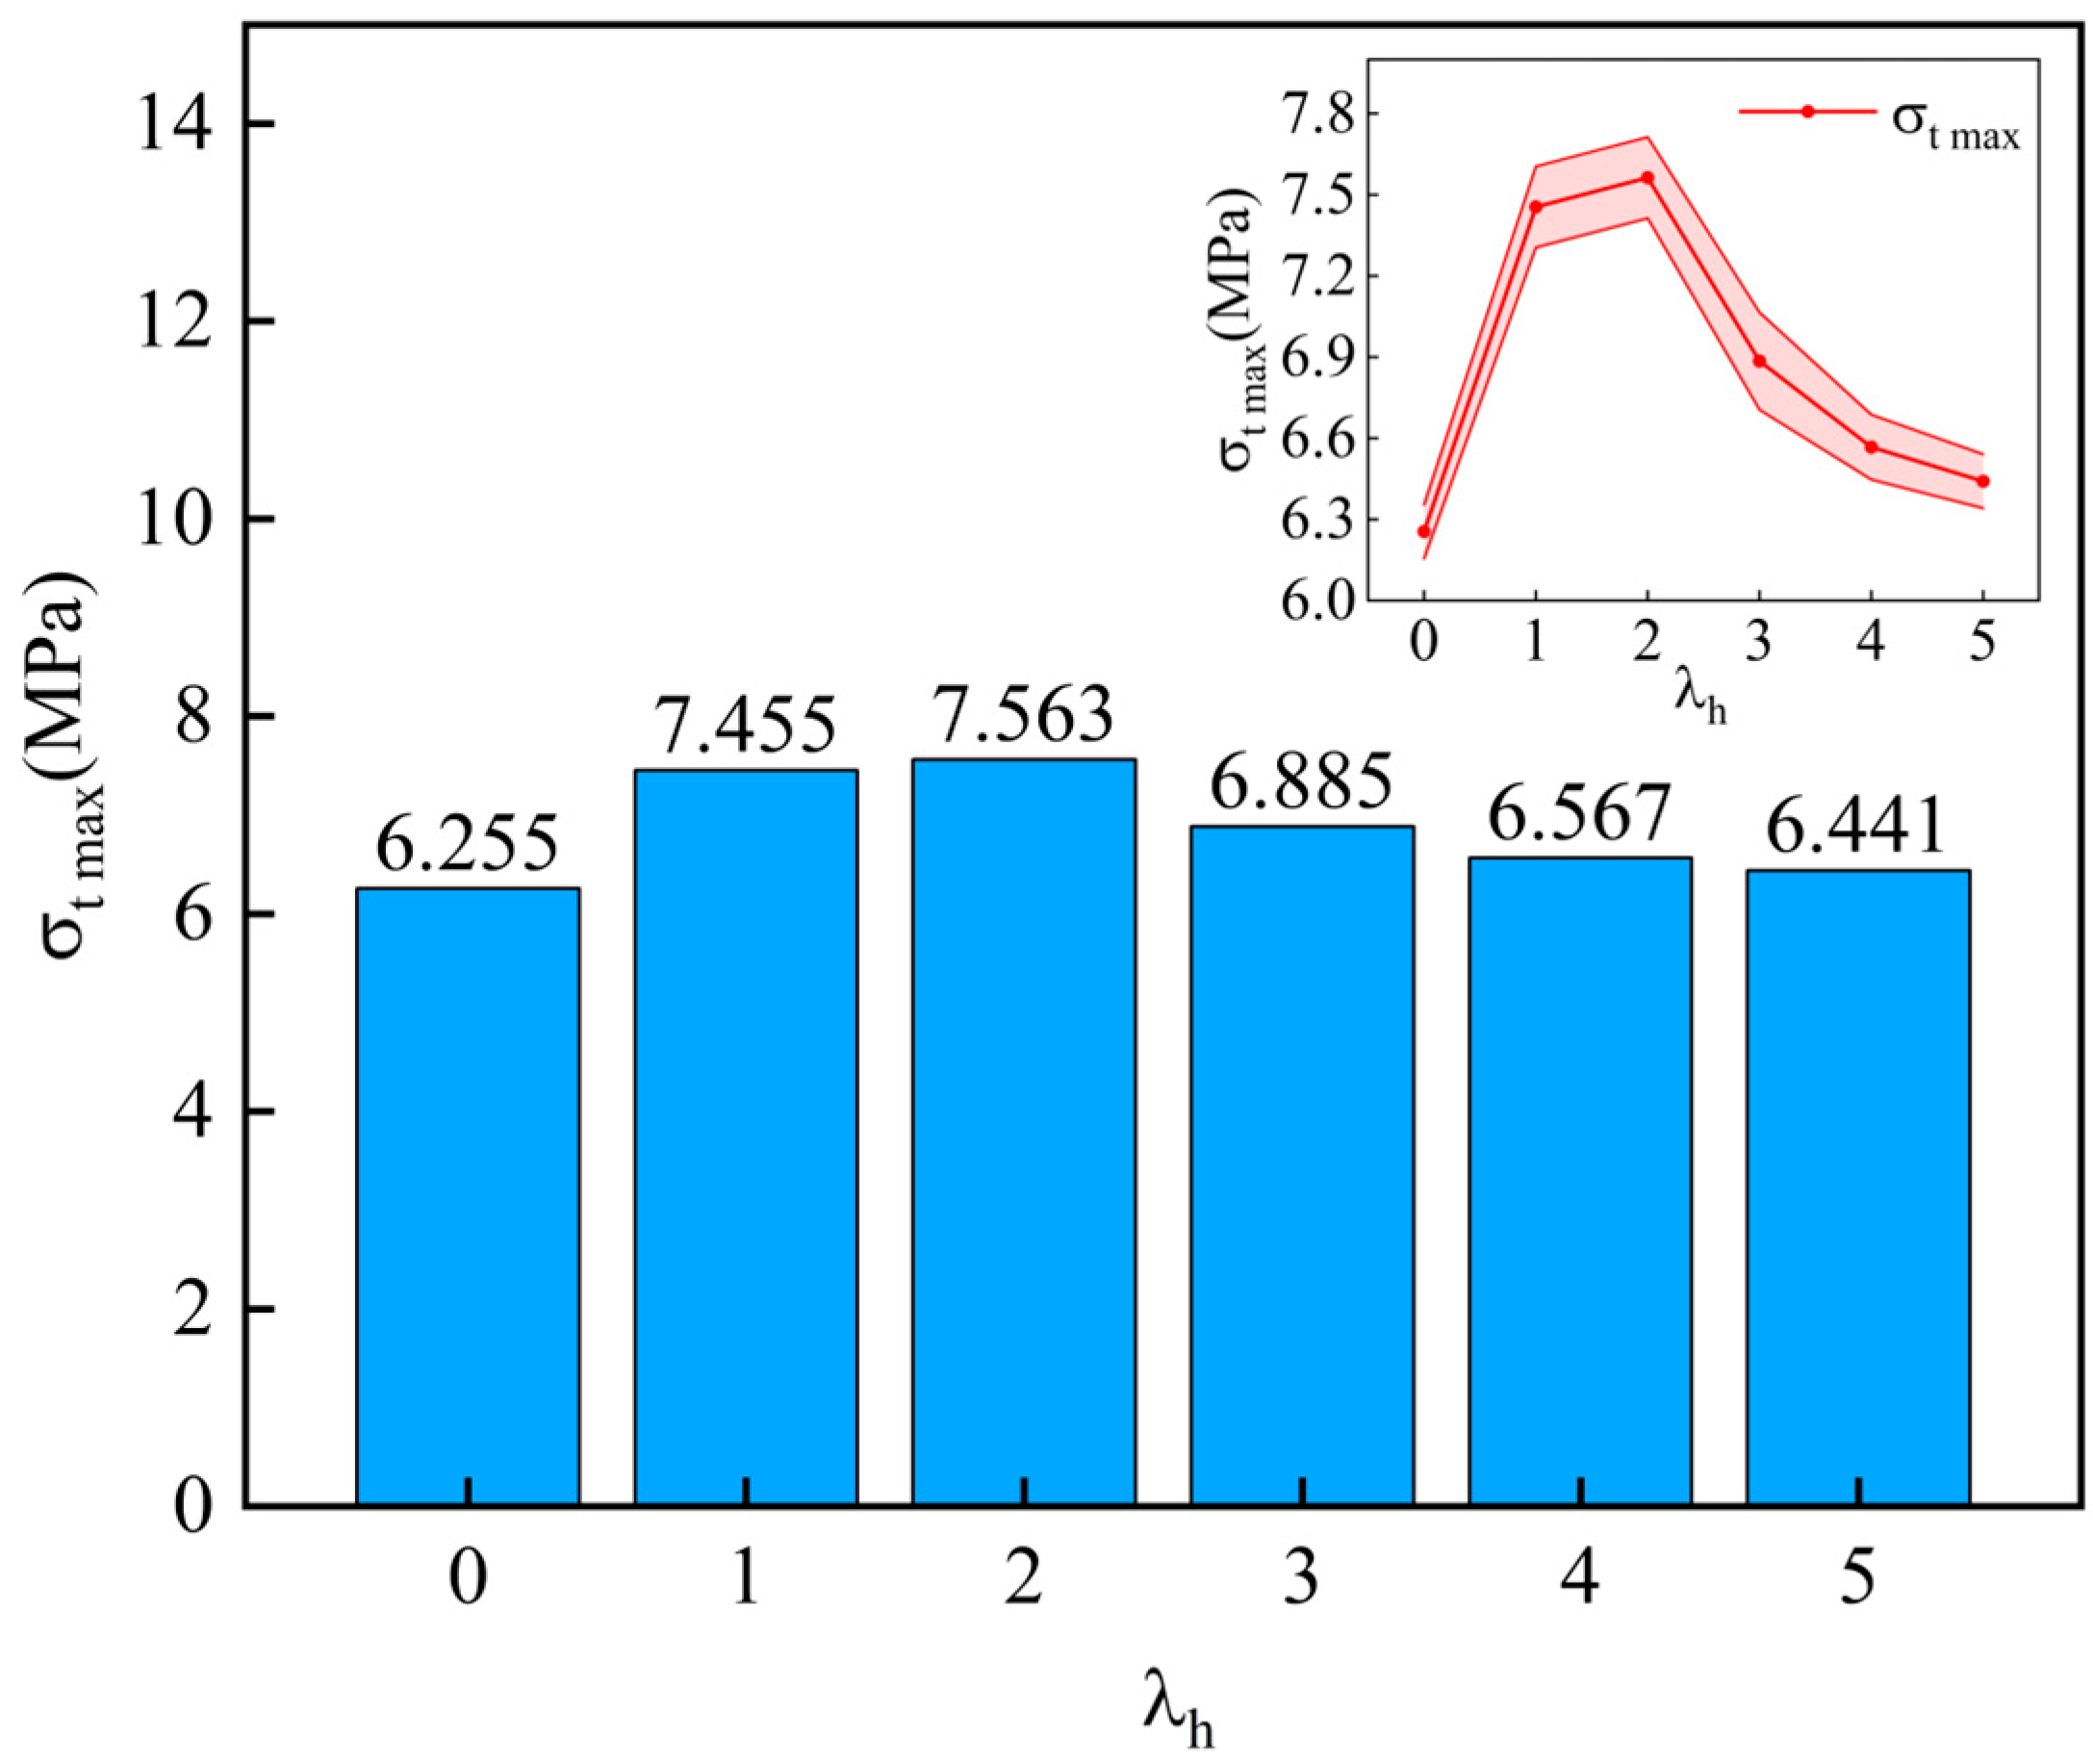
3.2. Flexural Performance Analysis

Four-point bending tests were performed on the specimens, and the flexural tensile strength at various thickness ratios is shown in Figure 5. The top right corner shows the error bar chart of parallel experiments under different working conditions.
As can be seen in Figure 5, the flexural tensile strengths of the specimens with different thickness ratios show a general trend of first increasing and then decreasing. They increase from 6.255 MPa for the thickness ratio λ h = 0 to 7.563 MPa for the thickness ratio λ h = 2 . The thickness ratio λ h = 0 is the base group without the interface effect. When the interface is in the middle of the sample, different working conditions cause the interface (weak surface [21,44]) to move down, reducing the height of the area that can stretch and increasing the height of the area that is being compressed, leading to more compressive stress; the friction at the interface increases, providing more resistance, and along with the adhesive force, it helps support the load. Stress optimization is maximized at the thickness ratio λ h = 2 , which is manifested in the maximum flexural tensile strength. The flexural tensile strength decreases from 7.563 MPa at the thickness ratio λ h = 2 to 6.441 MPa at the thickness ratio λ h = 5 . The main reason is that due to the further downward movement of the interfacial interface (weak surface), the interfacial shear stress increases significantly, and the slippage effect appears at the beginning. This results in a reduction in the cooperative deformation capacity between different layers and even the occurrence of interfacial detachment, which leads to the gradual reduction in the flexural tensile strength of the fiber-sprayed concrete beams.
The flexural tensile strength of the specimens with different thickness ratios shows a general trend of increasing and then decreasing, but the flexural tensile strength of the specimens with other thickness ratios is still increased compared to the benchmark group with the thickness ratio λ h = 0 . Among them, compared with the thickness ratio λ h = 0 of 6.255 MPa, the flexural tensile strengths of the thickness ratio λ h = 1 , 2 , 3 , 4 , 5 were 7.455 MPa, 7.563 MPa, 6.855 MPa, 6.567 MPa, and 6.441 MPa, which increased by 19.2%, 20.9%, 10.1%, 5%, and 3%, respectively, compared with that of the thickness ratio λ h = 0 . It can be seen that the layered construction has a greater effect on its structural flexural tensile strength, different layered interface locations have different effects on its flexural tensile strength, and the optimum thickness ratio is λ h = 2 , which is 20.9% higher than the baseline group.

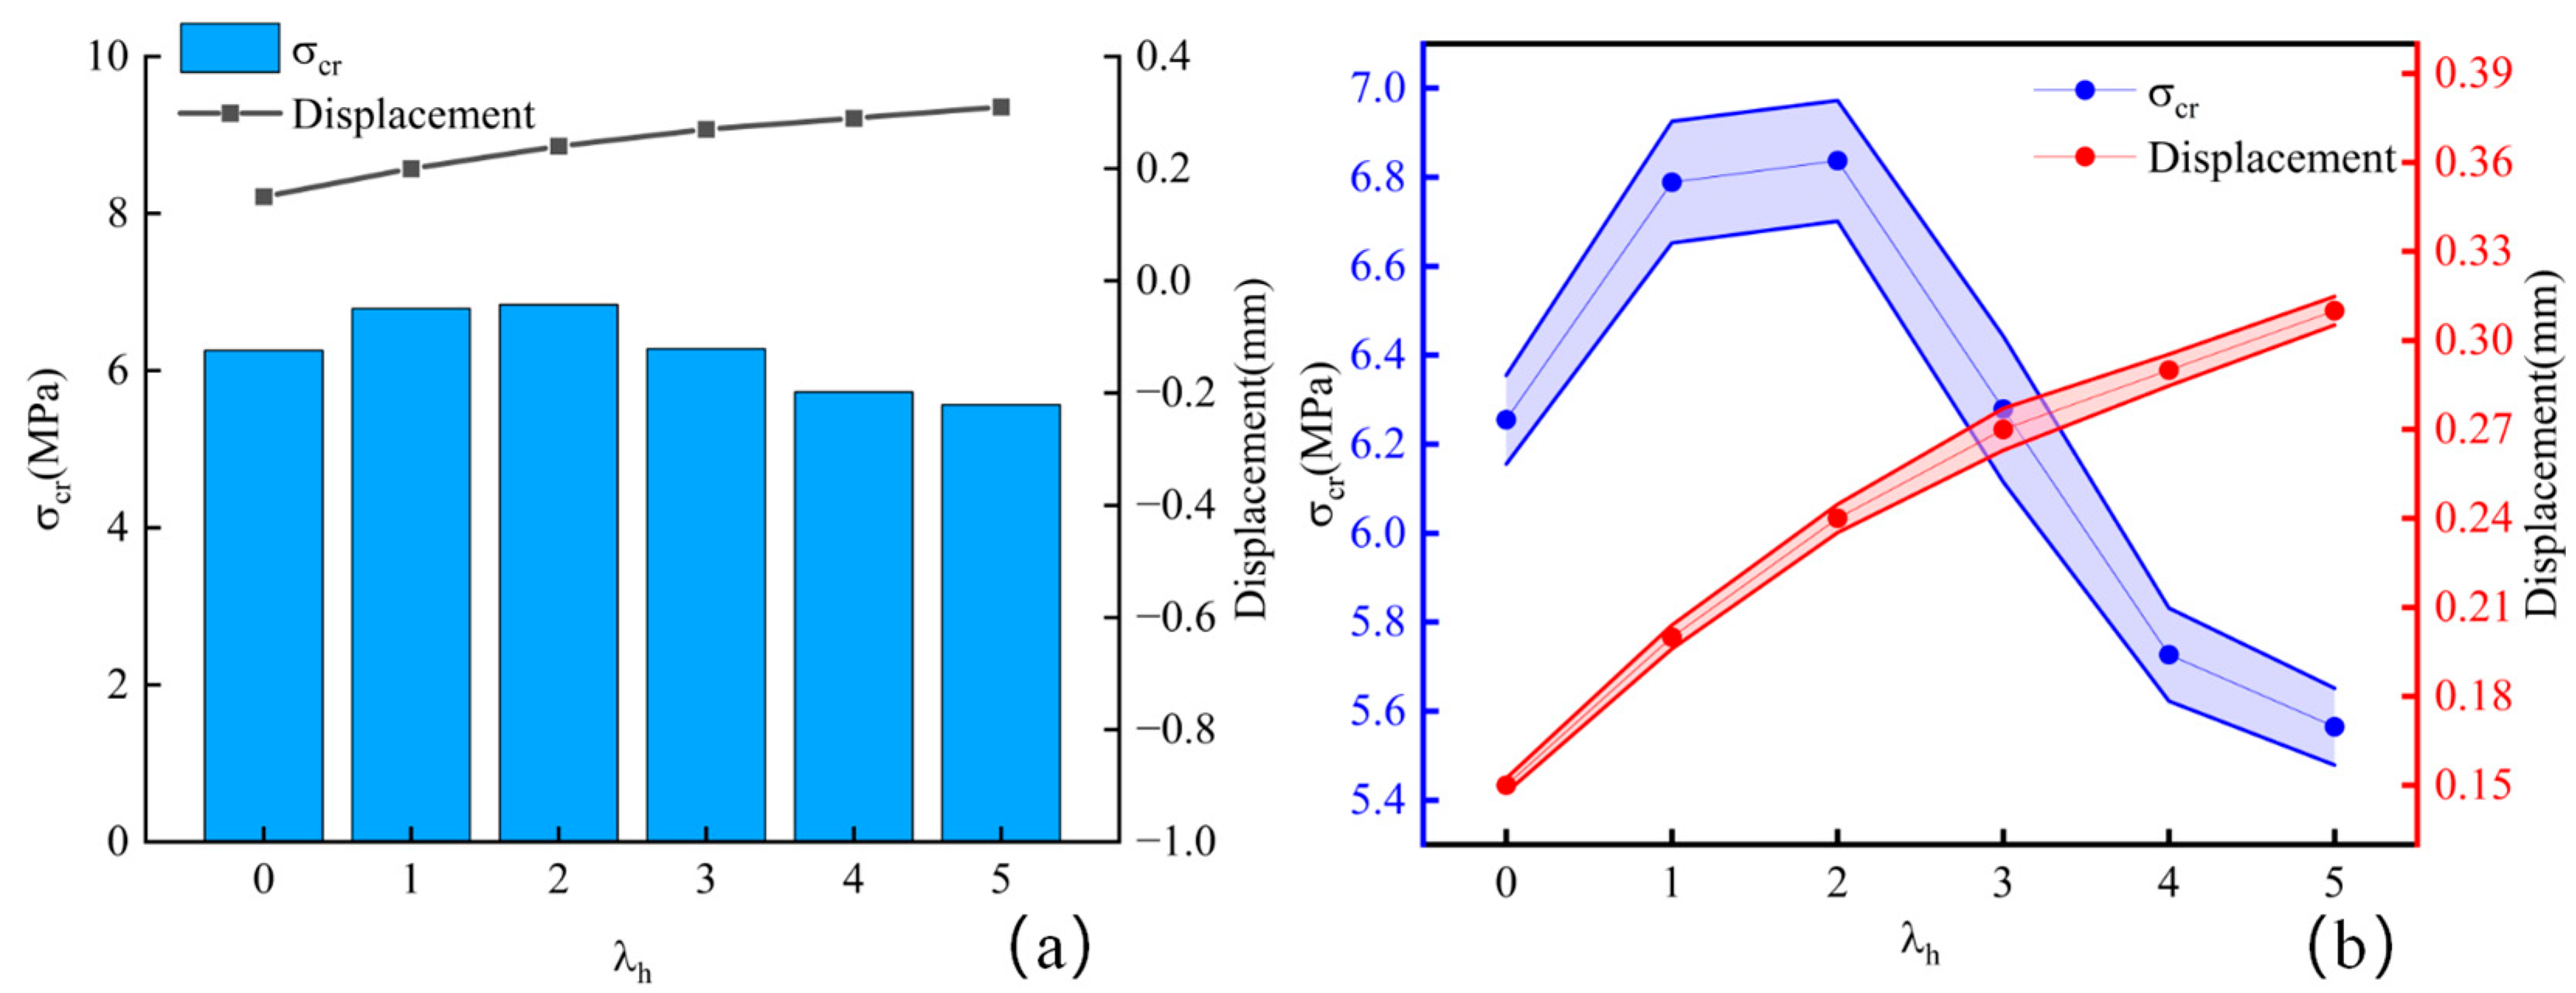
3.3. Cracking Stress Analysis

Figure 6a shows the crack formation threshold σ c r and its axial displacement profile for fiber shotcrete beams with different thickness ratios during the loading of the four-point bending test. Figure 6b shows the error bar chart of the parallel experiment σ c r and its axial displacement under different working conditions.
Figure 6 reveals a general trend of an increasing crack formation threshold σ c r under different thickness ratios, followed by a subsequent decrease. The crack formation threshold increases from 6.255 MPa for the thickness ratio λ h = 0 to 6.837 MPa for the thickness ratio λ h = 2 and then decreases to 5.565 MPa for the thickness ratio λ h = 5 . The axial displacement shows a gradually increasing trend, and the deflection increases from 0.15 mm for the thickness ratio λ h = 0 to 0.31 mm for the thickness ratio λ h = 5 . The deformation coordination ability from thickness ratios λ h = 0 2 is better, and with the increase in the thickness ratios, the crack formation threshold increases and the deflection is slow. After that, with an increase in the thickness ratio, the crack formation threshold increases, and deflection is slow. Thereafter, with the increase in the thickness ratio, the load decreases while the deflection increases, and the deformation coordination ability becomes worse gradually. The main reason is that the existence of interfaces affects the height distribution of the compression and tension layers of the fiber-sprayed concrete beam. The heights of the compressive and tensile layers of the structure are basically the same under to thickness ratios λ h = 0 2 , which can fully utilize the load-carrying capacity of the beam. With the increase in the thickness ratio, the thickness of the compression layer of the fiber-sprayed concrete beam increases gradually, and the thickness of the tensile layer becomes thinner, which cannot play a good role in the structural load-bearing capacity.

3.4. Flexural Toughness Analysis

In this paper, ASTM-1609 [45] is used to evaluate the flexural toughness of high-performance fiber shotcrete. The standard takes the energy absorption value of the specimen to reach the specified deflection and the corresponding equivalent flexural strength ratio as the toughness index of the evaluated specimen. The energy absorption value of the specimen is characterized by the area of the load–deflection curve in the corresponding deflection range. The calculation of each evaluation index is shown in Equations (3) and (4).
f 600 D = p 600 D l b d 2 ,   f 150 D = p 150 D l b d 2
In the formula, f 600 D and f 150 D represent the residual strength of the specimen when the mid-span deflection reaches l / 600 and l / 150 , respectively.
T 600 D = 0 l / 600 p δ d δ ,   T 150 D = 0 l / 150 p δ d δ
In the formula, T 600 D and T 150 D represent the energy absorbed by the specimen when the mid-span deflection reaches l / 600 and l / 150 , respectively.
Since, in this test, the specimen has been damaged before the mid-span deflection reaches l / 150 , which belongs to small bending damage, only the residual strength of the specimen at l / 600 deflection is calculated, and the energy absorption value is used to measure the ductility of the concrete specimen and the energy absorption capacity. The calculation results are shown in Figure 7.
As can be seen in Figure 7, the f 600 D and T 600 D of the specimens with different thickness ratios show an increasing and then decreasing trend, reaching maximum values of 13.5 MPa and 19.9 N∙M at a thickness ratio of λ h = 2 . The f 600 D of the specimens with different thickness ratios are 10.8 MPa, 11.7 MPa, 13.5 MPa, 12.4 MPa, 11.2 MPa, and 10.9 MPa, respectively, and the f 600 D of the specimens with different thickness ratios are 8.3%, 25.0%, 14.8%, 3.7%, and 0.9%, respectively, as compared to the thickness ratio of zero. The T 600 D of the specimens with different thickness ratios were 16.1N∙m, 17.7N∙m, 19.9N∙m, 18.5N∙m, 17.5N∙m, and 16.5N∙m, respectively, which were increased by 9.9%, 23.6%, 14.9%, 8.7%, and 2.5% compared to the thickness ratios of 0. The main reason for this is that the bond between the layers contributes to the toughness of the specimens under the layered concrete structure. The crack development passes through the layered position of the specimen, and the interlayer bond prevents crack development, which in turn improves the flexural toughness of the specimen. When the thickness ratio is too large, the stress at the delamination interface is higher under the same load, and the resulting stress concentration leads to more rapid interlayer damage, which in turn leads to a reduction in the flexural toughness of the specimen.

4. Analysis of the Damage Pattern of Fiber Shotcrete Laminated Beams Based on the Thickness Ratio

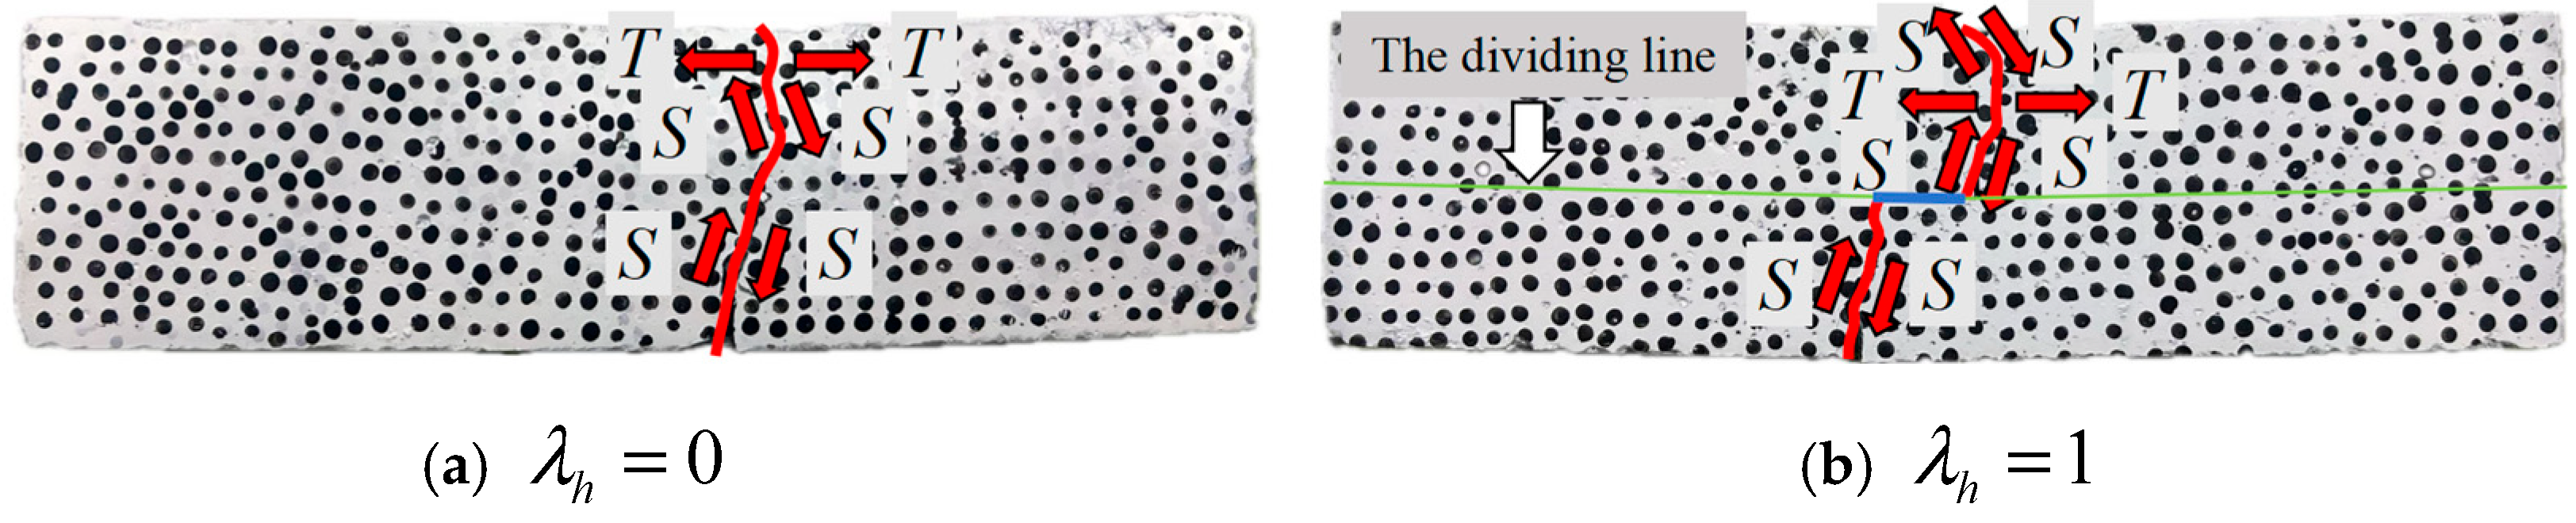
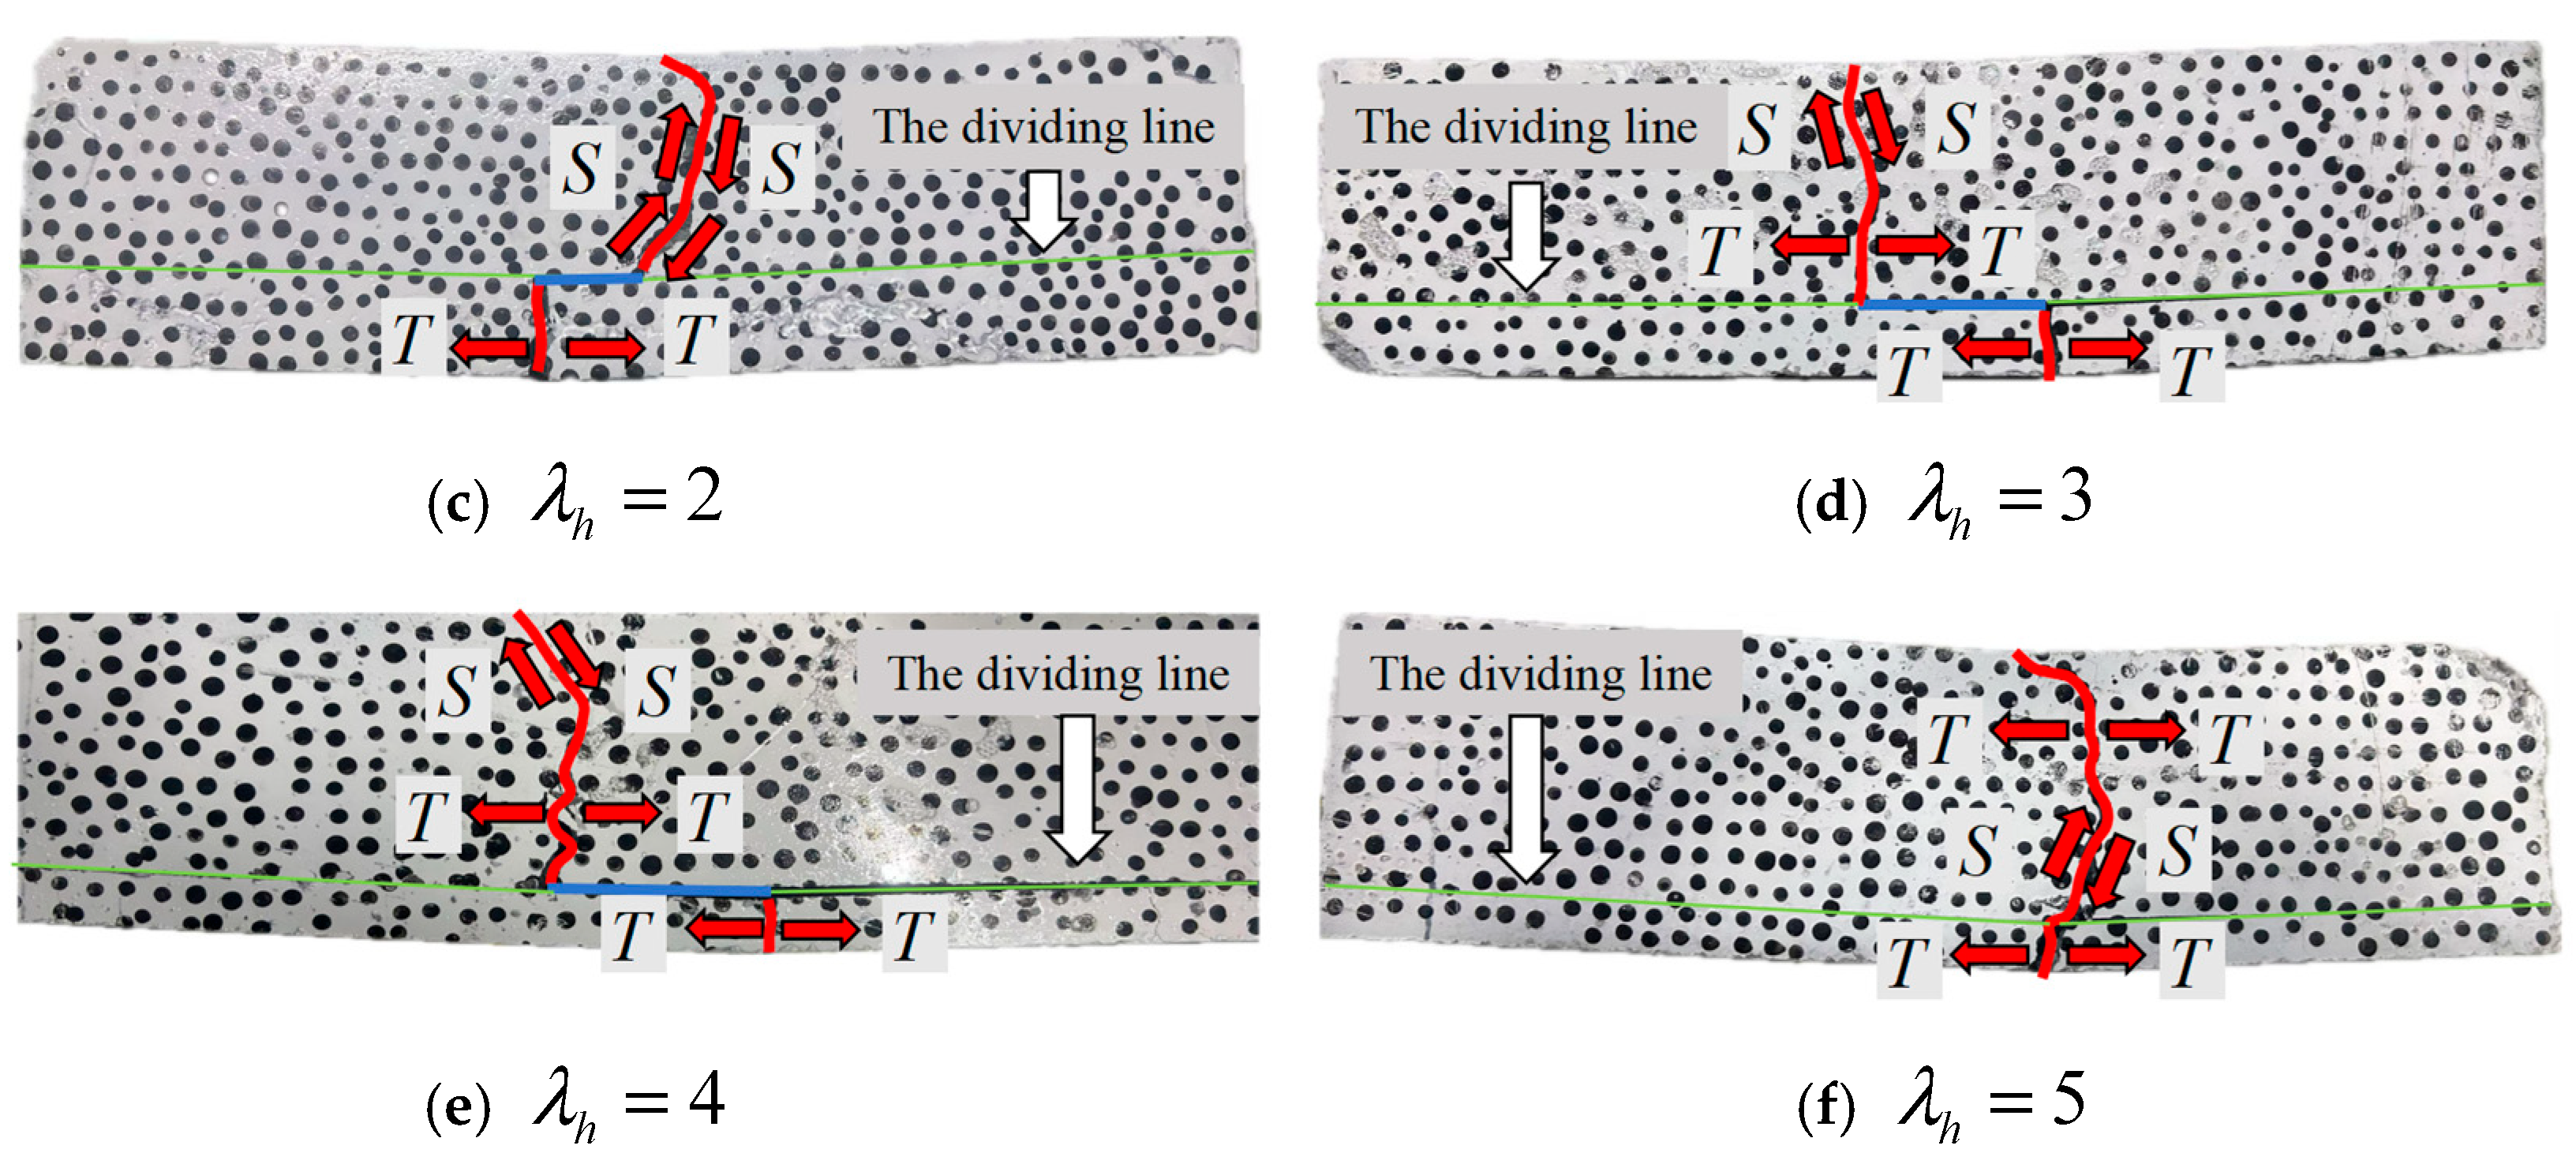
4.1. Macroscopic Damage Pattern of Fiber Shotcrete Laminated Beams Based on the Thickness Ratio

In the four-point bending test of concrete, the failure modes of fiber shotcrete beams were classified into shear failure, flexural failure, and mixed-mode failure based on the type of damage cracks [46,47] as shown in Figure 8. In order to investigate the failure modes of fiber shotcrete beams at different thickness ratios, the cracks of the final rupture of the specimens were sketched as shown in Figure 9, where S denotes shear failure and T denotes flexural failure.
In Figure 9, we can see that the cracks in the damaged fiber shotcrete samples at each thickness ratio include vertical bending cracks and slanted shear cracks, indicating a mixed-mode failure. This defect happens because the bending moment and shear force acting together on the fiber shotcrete beams significantly contribute to the damage of the samples. The percentage of flexural failure increases gradually with the increase in the thickness ratio, which is caused by the tensile stress of concrete exceeding its tensile strength when the fiber shotcrete beams are subjected to bending moments, and the layered construction reduces the tensile properties of fiber shotcrete beams. The test indicates that the location of the split interface in the concrete stacked beams affects the failure mode of fiber shotcrete beams, and the damage type of the first layer of fiber shotcrete at λ h = 0 and λ h = 1 is mixed-mode failure. While fiber shotcrete beams are layered and the first layer of concrete is thinner ( λ h = 2 5 ), the first layer of fiber shotcrete cracks are vertical upward-bending cracks, and the failure mode is a flexural failure. This is due to the fact that after the thickness ratio increases, the first layer of fiber shotcrete is thinner, the shear span ratio is larger, and the flexural failure is dominant.
Under the upper load of the four-point bending test, cracks in the test members mainly appeared in the middle of the fiber-sprayed concrete beams. Compared to the thickness ratio λ h = 0 (single-layer fiber-sprayed concrete beams), when the two-layer fiber-sprayed concrete beams at other thickness ratios were damaged, the crack development showed a significant change at the parting interface, and when the crack developed upward, it would be horizontally deflected at the parting interface, which would lead to a greater release of fracture energy. The main reason for this is that the shear stresses carried at the concrete beam parting interface are provided by friction, and the lower the position of the parting interface, the higher the shear stresses carried, and when the crack develops to the concrete parting interface, the release of larger forces leads to an increase in the offset distance. In particular, at thickness ratios λ h = 1 to the thickness ratio λ h = 4 , the horizontal offset distance of cracks at the interfaces increases with the increase in the thickness ratio; at the thickness ratio λ h = 5 , the offset distance of cracks at the interfaces is smaller, which is mainly due to the fact that the thickness of the first layer of concrete is too thin, which results in the structural load-bearing capacity being provided by the second layer of concrete almost exclusively, and the crack damage morphology is close to that of the thickness ratio λ h = 0 .
The final damage pattern of concrete at thickness ratios λ h = 3 5 shows that interfacial detachment of different layers of concrete occurs at the interface. This phenomenon occurs mainly because the first layer of concrete is too thin, resulting in the failure of the interfacial interface (weak surface) to provide sufficient bond, which reduces the synergistic deformation capacity between the two layers of concrete and ultimately leads to interfacial detachment.

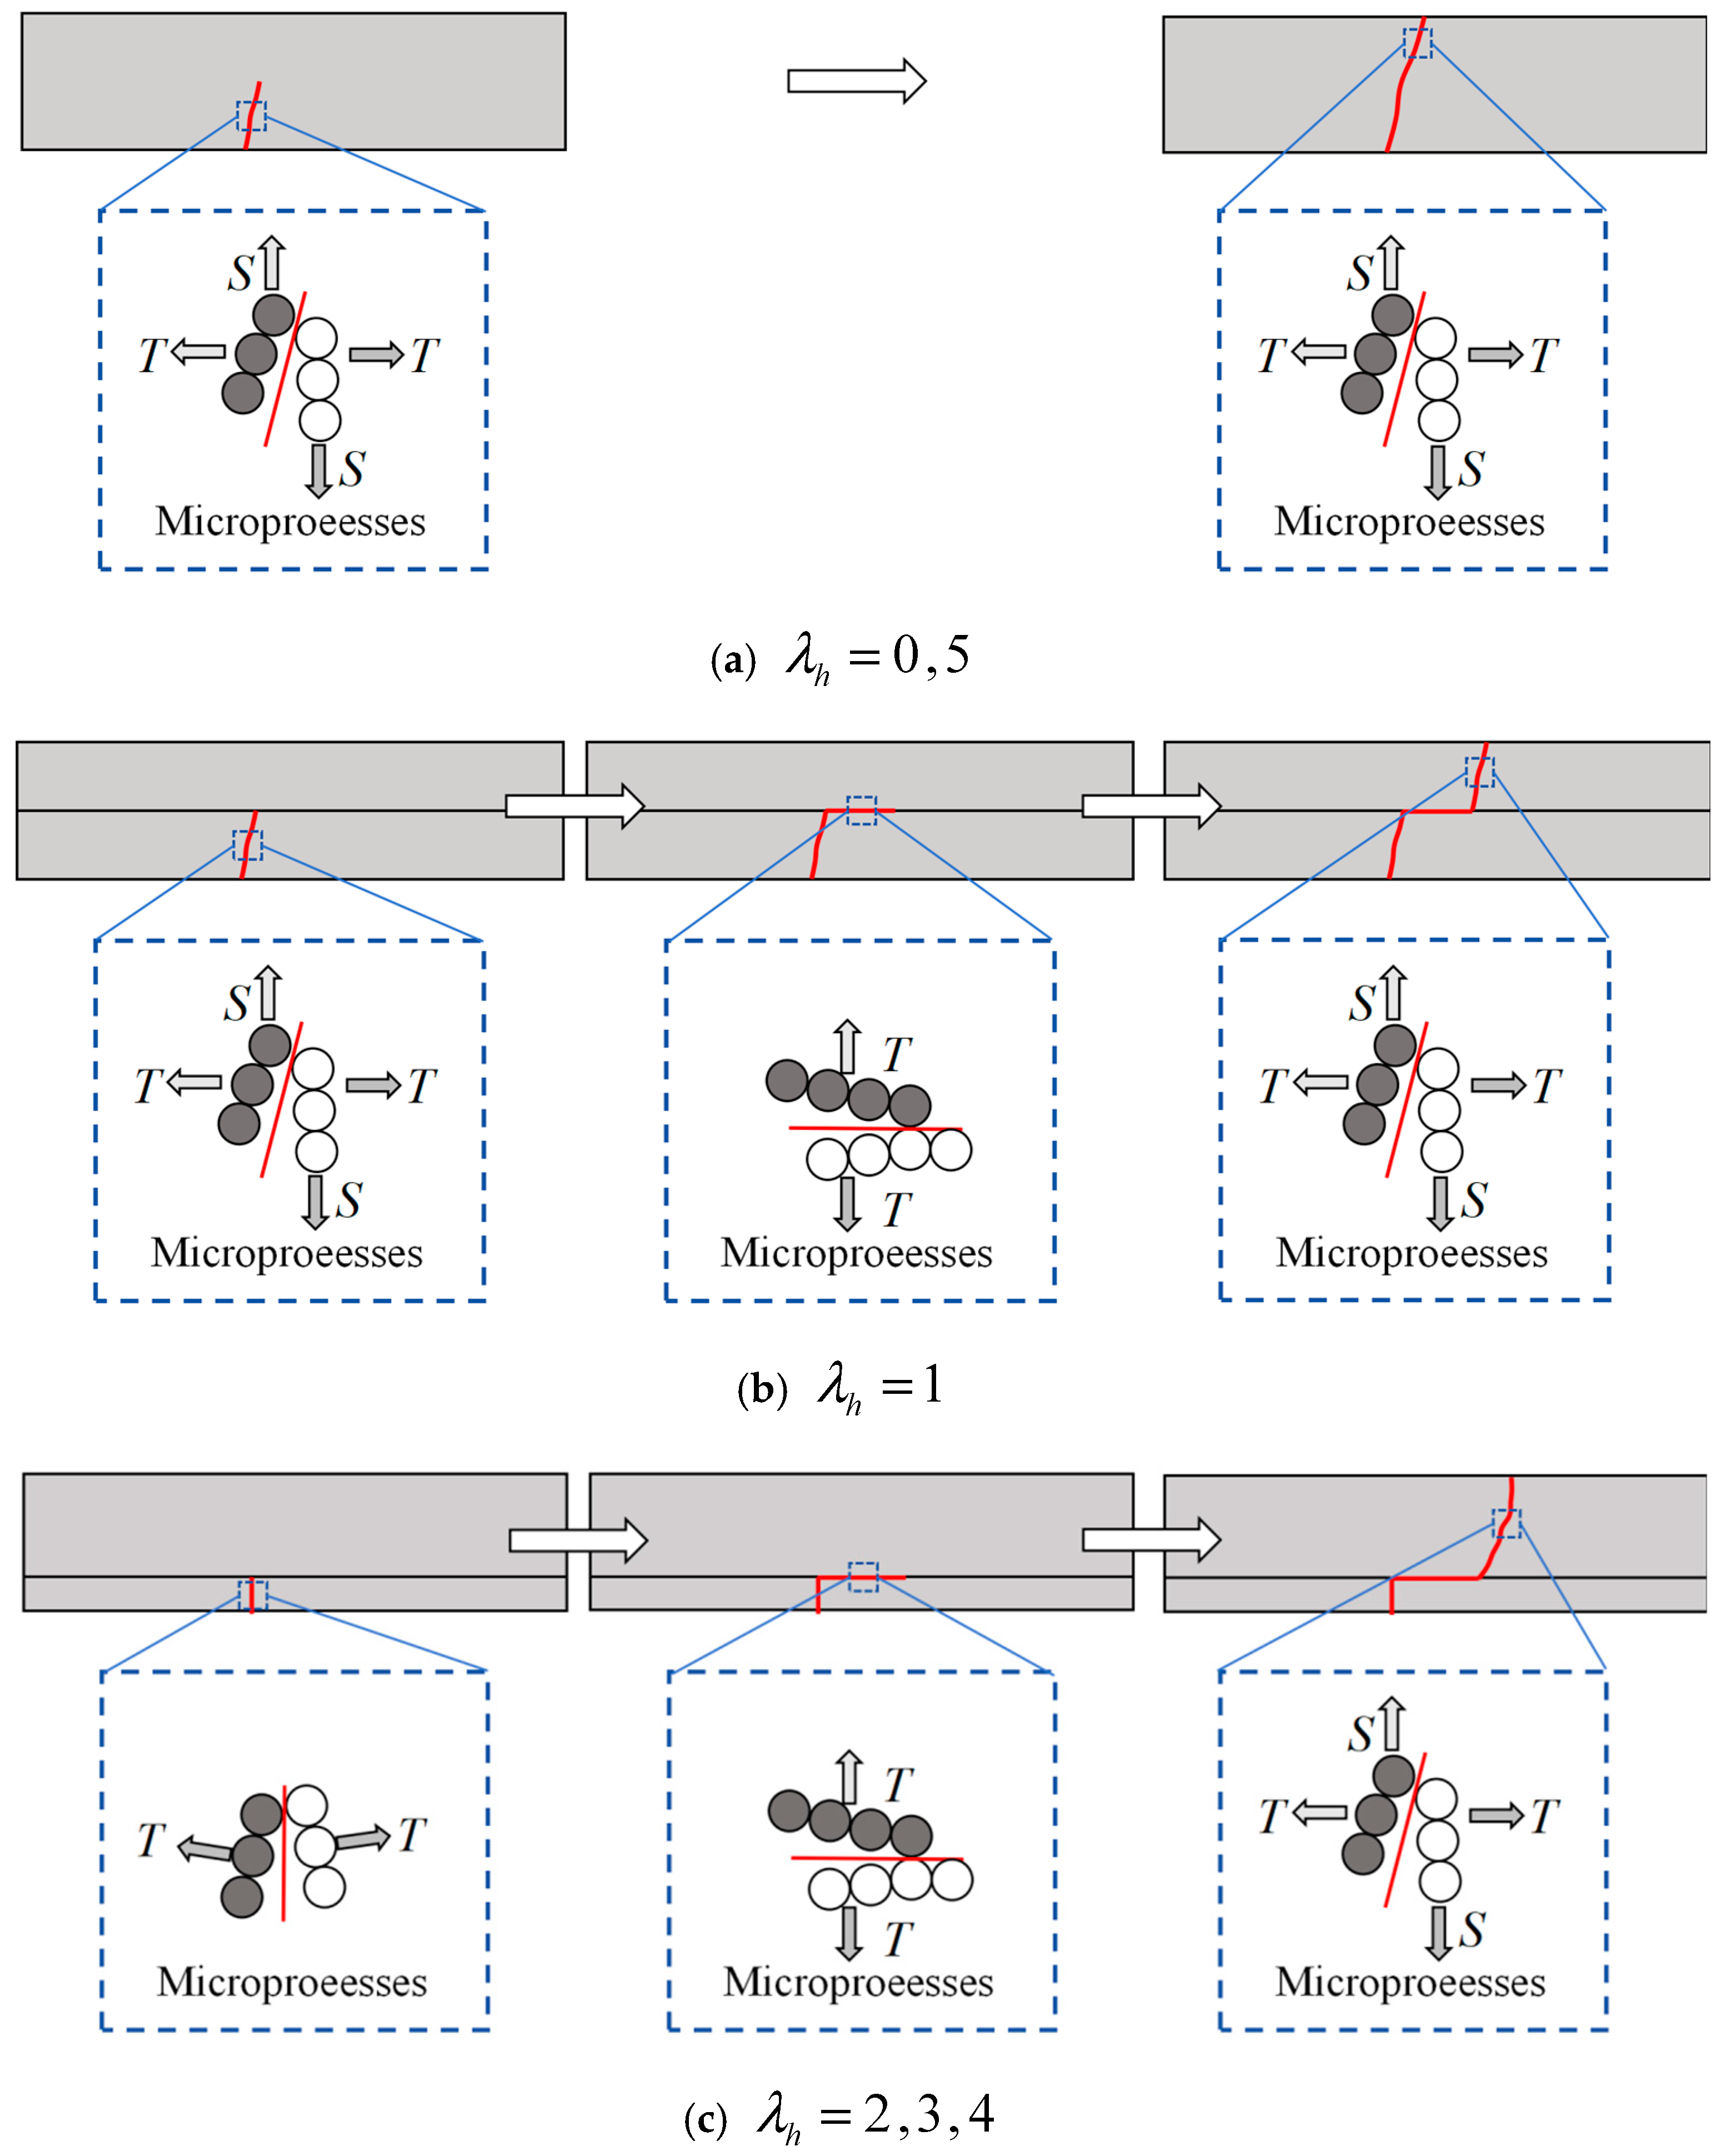
4.2. Microscopic Damage Patterns of Fiber Shotcrete Stacked Beams Based on the Thickness Ratio

The four-point bending test was conducted on the specimen, and the accumulated microstrain and microdamage inside the specimen gradually developed into macroscopic cracks during the loading process. In order to investigate the development of internal cracks in fiber shotcrete specimens under different thickness ratios when subjected to stress, the fracture development of specimens under different thickness ratios was analyzed by DIC. The photos collected by a 4K HD camera were imported into Vic-2d 7 version software for processing, and the maximum principal strain evolution characteristics during the pre-peak period of specimens with different thickness ratios were taken, as shown in Figure 10.
As can be seen in Figure 10, the strain field characteristics of the thickness ratio λ h = 0 specimen are obviously different from those of the thickness ratio λ h = 1 5 specimen. The maximum principal strains of the specimens with different thickness ratios are concentrated at the two ends of the bottom crack. However, the upper limit of the maximum principal strain of the specimen with the thickness ratio λ h = 0 is obviously higher than that of the specimen with the thickness ratio λ h = 1 5 . And, the latter shows an obvious crack extension trajectory in the pre-peak stage, and the load–deflection curve also shows a decrease in the local slope drop. This indicates that, when the concrete is not delaminated, the crack nucleation occurs closer to the peak strength moment, leading to sudden failure of the specimen. As delamination appears, the specimen turns into progressive damage, making it easier to identify the damage characteristics of the specimen.

4.3. Thickness Ratio-Based Damage Mechanism of Fiber Shotcrete Stacked Beams

Combined with the macroscopic failure mode of fiber shotcrete beams and DIC cloud diagrams, the crack expansion of fiber shotcrete beams mainly goes through three stages: the initial generation of cracks, crossing the interfacial interface, and running through the whole structure. The damage process of fiber shotcrete beams with different thickness ratios behaved differently, as shown in Figure 11.
The thickness ratio λ h = 0 (unstratified) specimen is a mixed bending–shear failure in the four-point bending test, and the crack does not undergo a stage of crossing the interface due to the absence of the interface. The presence of internal fibers in the specimen causes the crack not to develop vertically upwards but to show some inclination during the whole process from the generation of the crack at the crack to its penetration through the specimen. Compared with the thickness ratio λ h = 0 (unstratified) specimens, for the thickness ratio λ h = 1 specimens, the cracks developed across the interfaces with a sudden change because the interfaces are the weak surfaces of the structure, the bond is not enough, the shear capacity is weak, and the cracks changed transversely when they developed to the interfaces. For the thickness ratio λ h = 2 , 3 , 4 specimen, at the beginning of the crack for the vertical upward flexural failure, the first layer of concrete is thin, the first layer of the concrete shear span ratio is large, and the bending moment dominates the damage. The crack then undergoes the stage of crossing the interfacial interface, with a transverse abrupt change, and then the crack runs through the whole specimen. Mixed bending and shear damage was observed at the time of cracking across the second layer of concrete. In the thickness ratio λ h = 1 to the thickness ratio λ h = 5 , when the crack undergoes the stage of crossing the interface, the distance of transverse mutation of the crack increases with the increase in the thickness ratio. This is due to the fact that under the premise that the neutral axis is the centroid axis of the cross-section, the increase in the thickness ratio leads to the downward shift of the position of the interface, and the cross-section is located in the position where it is subjected to a greater shear stress, which leads to the greater transverse displacement of the crack during the damage.

5. Calculation of Fiber-Sprayed Concrete Stacked Beams with Flexural Stiffness Correction

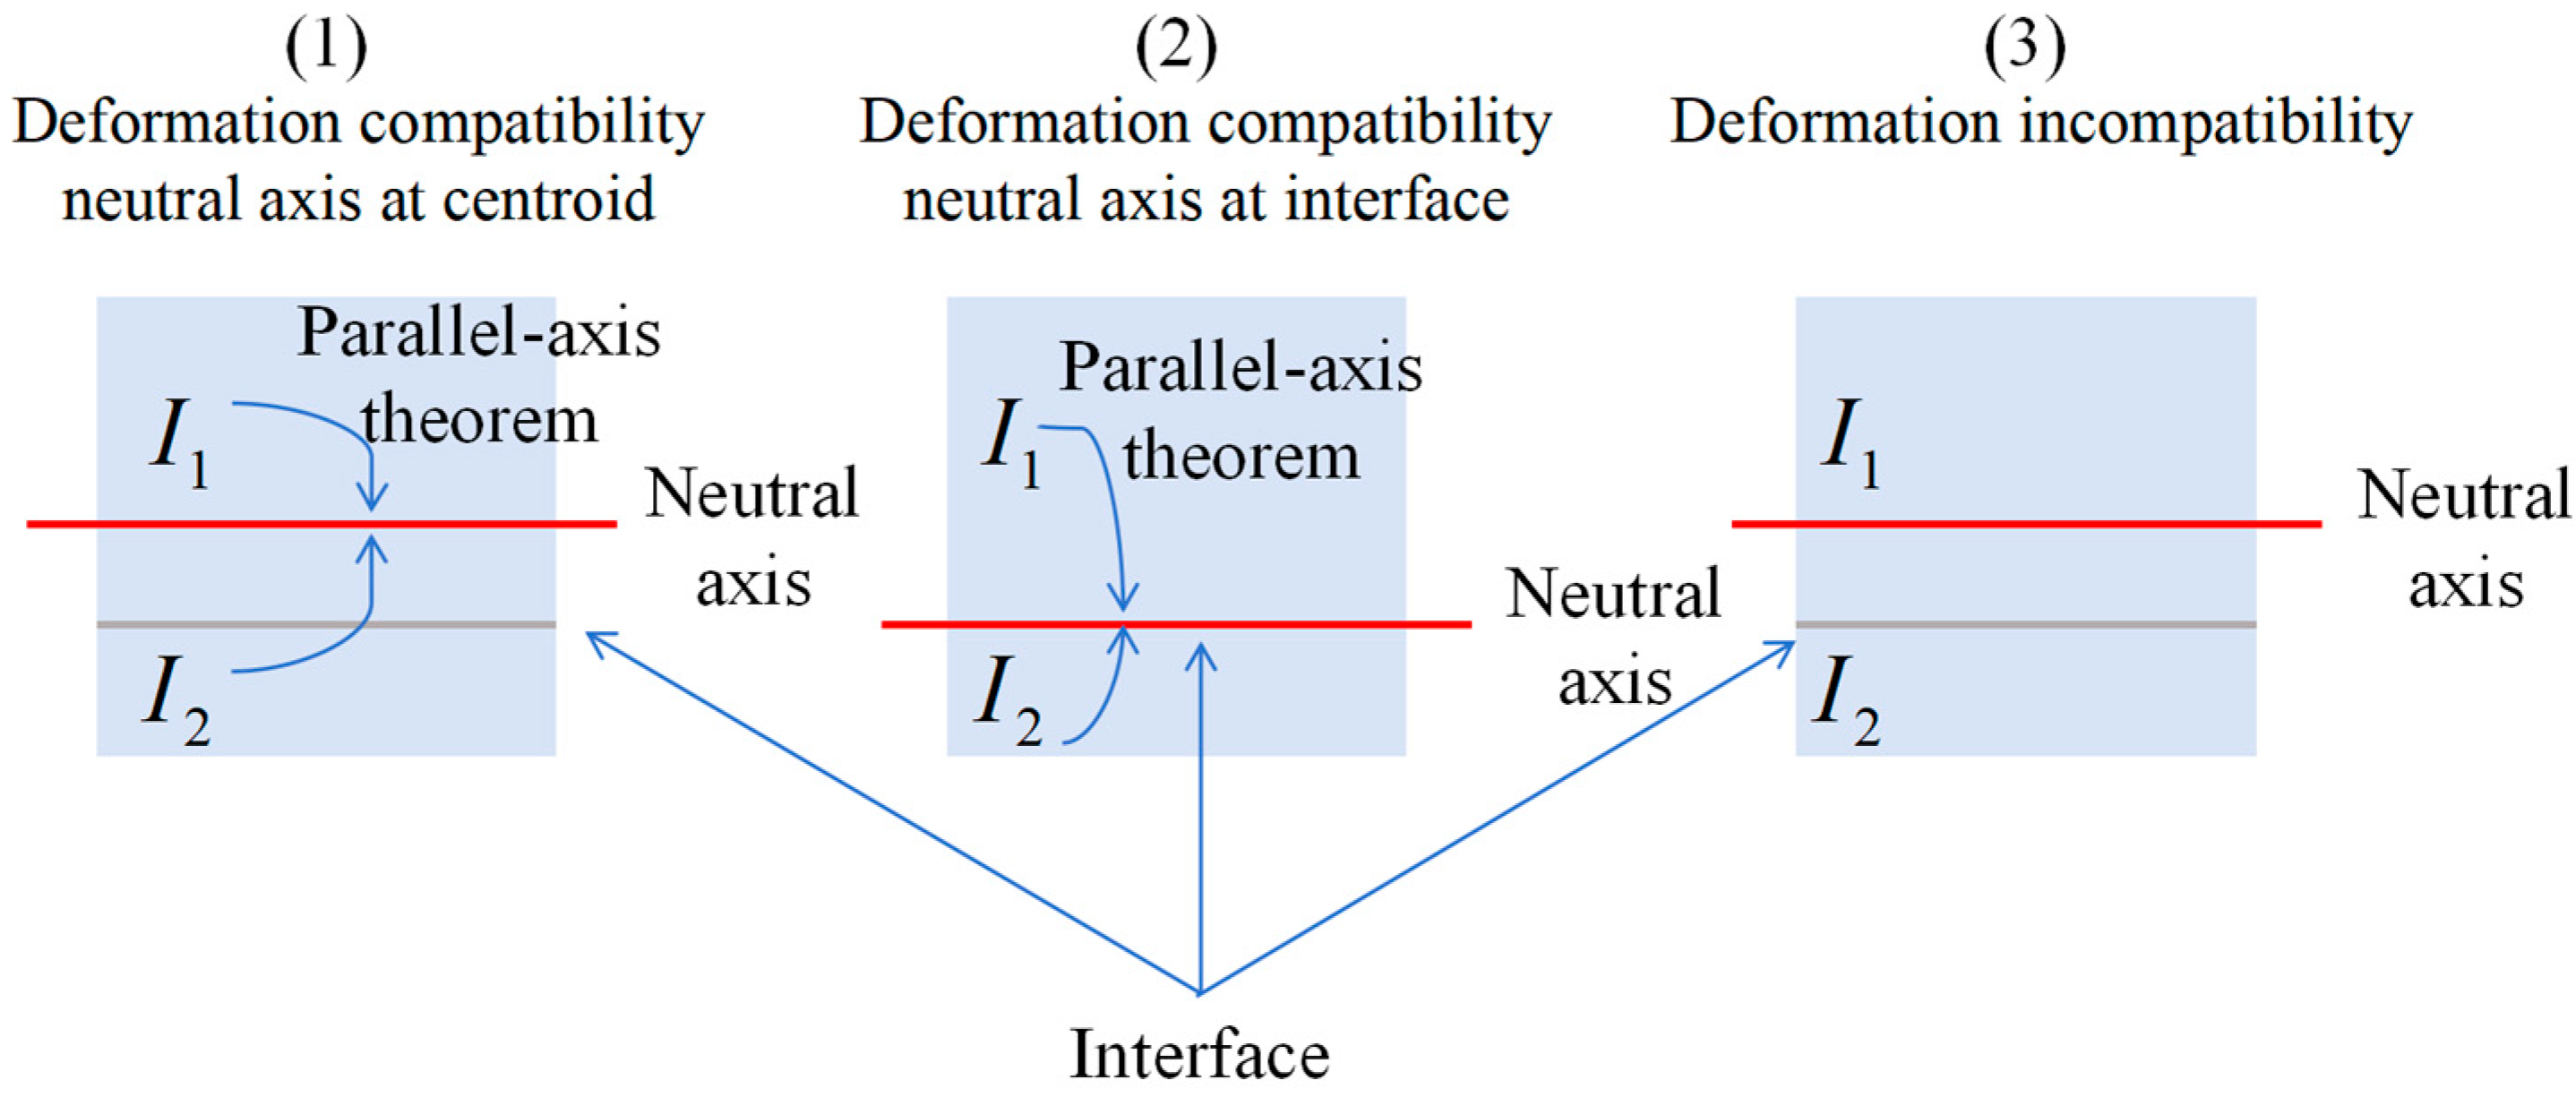
5.1. Theory of Fiber-Sprayed Concrete Stacked Beam Flexural Stiffness Calculation

For the fiber-sprayed concrete stacked beams, there are three existing assumptions for the calculation of the cross-sectional moment of inertia (second moment of area) of the beams, as shown in Figure 12. (1) Assuming that the whole fiber-sprayed concrete stacked beams are deformation-coordinated and the neutral axis remains in the middle position of the cross-section, the cross-sectional moment of inertia of the beams is corrected using the parallel axis theorem. (2) Assuming that the entire fiber-sprayed concrete stacked beam is deformation-coordinated and the neutral axis is at the interfacial position, the cross-sectional moment of inertia of the beam is corrected using the parallel axis theorem. (3) Assuming that the entire fiber shotcrete stacked beam is a delaminated structure without a bond, add the moments of inertia of the two parts of the section.
The moment of inertia of the beam section for different layers of the fiber shotcrete beam for its centroid axis is calculated as follows:
I x c = b h 3 12
In the formula, b and h are the width and height of the section, respectively, mm.
If the neutral axis position is not at the center of the form, the cross-section moment of inertia needs to be corrected using the parallel axis theorem, which is given by Equation (6) as follows:
I x = I x c + a 2 A
In the formula, a is the neutral axis offset distance relative to the centroid axis, mm. A is the cross-sectional area, mm2.
According to the test results, the material is C35 high-performance fiber shotcrete, and the modulus of elasticity E test results are all 29 GPa. Combined with Equations (3) and (4), the flexural stiffnesses under different assumptions are calculated, as shown in Table 6.

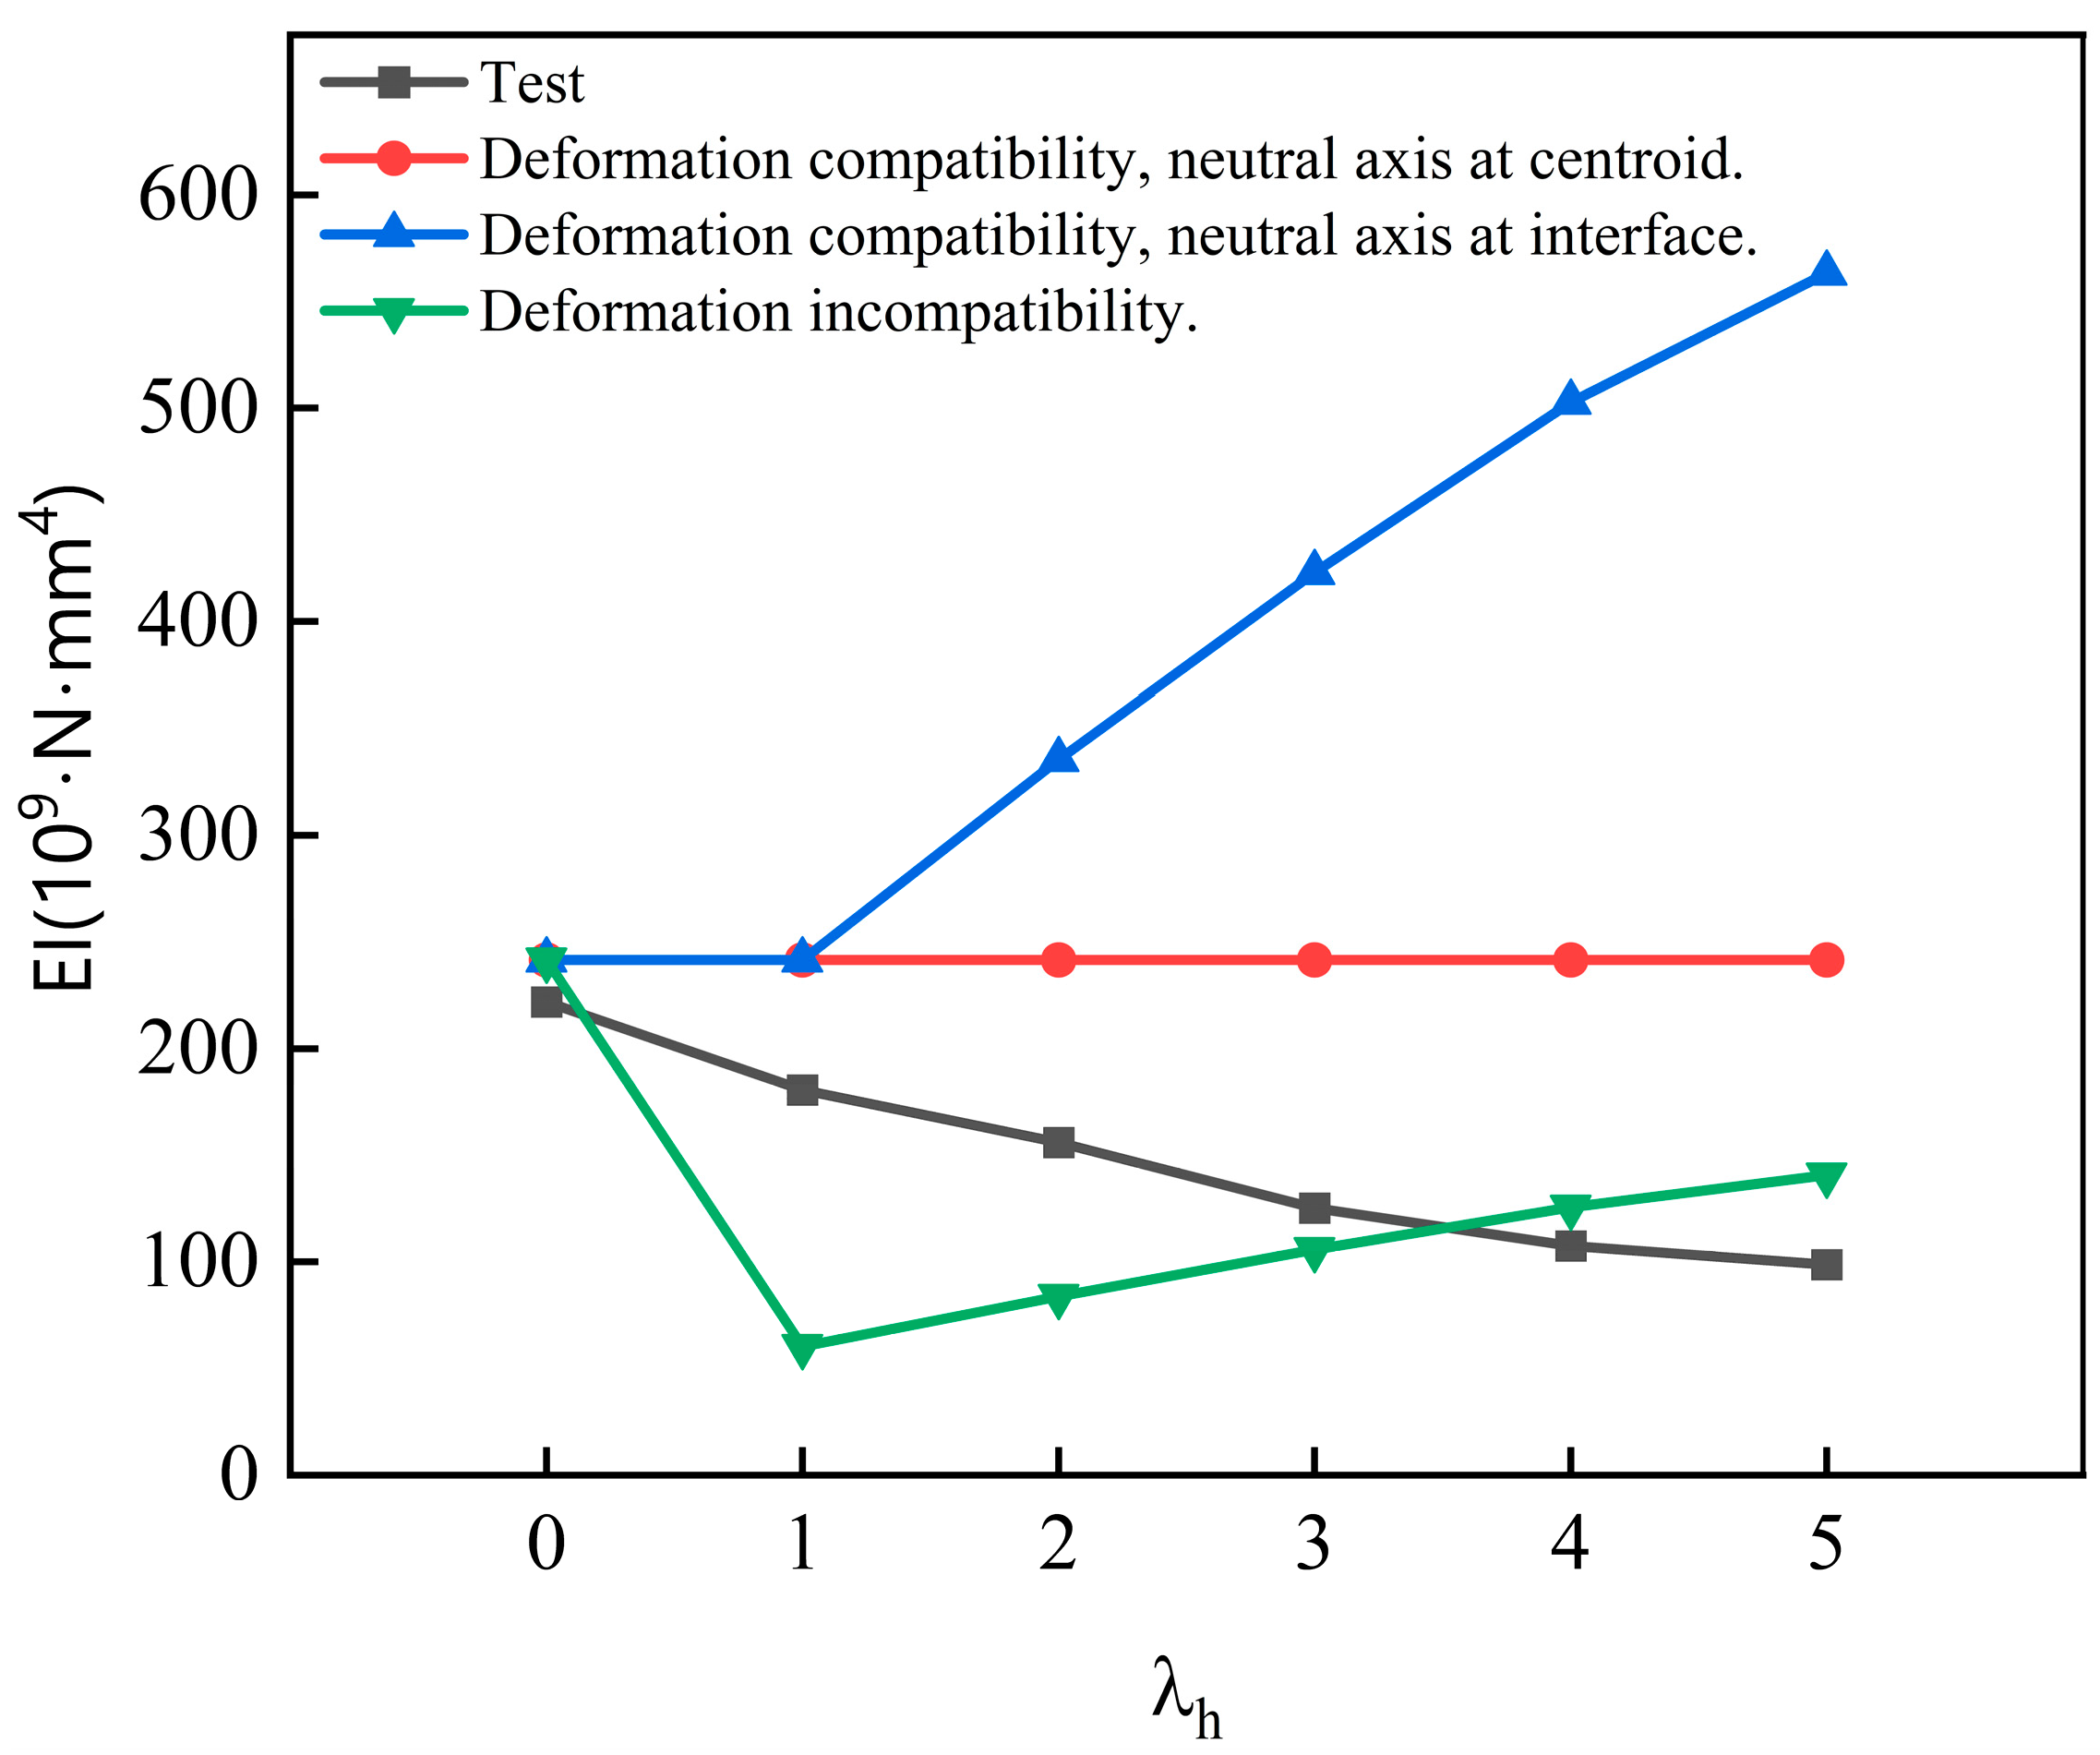
5.2. Comparative Analysis of the Flexural Stiffness Calculation Theory and the Test in This Paper

In four-point bending tests, fiber shotcrete beams usually exhibit typical flexural failure. For unstratified fiber shotcrete beams, friction does not have a direct effect on their performance due to the absence of interfacial interaction between different material layers. At this point, the calculation of the flexural load and stiffness of the beam can be directly based on the geometric properties and material properties of the beam, and the interlayer factor can be ignored. In the four-point bending test, the maximum bending moment usually occurs at the mid-span position with the following expression:
M = F L 6
In the formula, M is the bending moment at the mid-span position of the beam, N m m ; F is the load, N; and L is the span of the lower support, mm.
The deflection equation of a beam is the central equation that describes the deformation of a beam under a bending load, which is determined by the elastic modulus of the material and the geometric properties of the beam. The basic form of the bending equation is given below as follows:
d 2 y x d x 2 = M x E I
In the formula, y x is the deflection function of the beam, denoting the deflection of the beam at the location x , mm ; M x is the bending moment at location x , N mm ; and E I , is the beam flexural stiffness, N mm 4 .
Combining Equations (7) and (8), the effective flexural stiffness of fiber shotcrete beams in the four-point test is calculated as follows:
E I e f f = 23 F e f f L 3 648 δ e f f
In the formula, F is the elastic phase load, F e f f = F c r , N ; L is the span of the lower support, mm ; and δ e f f is the axial deflection at mid-span of the elastic phase, δ e f f = δ c r , mm .
Calculate the flexural stiffness of fiber shotcrete beams with different thickness ratios, as shown in Table 7.
The results of plotting the test and three assumptions for calculating the flexural stiffness are shown in Figure 13:
In Figure 13, the following can be seen:
Assumption 1:
The flexural stiffness is the same for each thickness ratio;
Assumption 2:
The flexural stiffness is lowest when the thickness ratio is 0 or 1, and then it increases with the thickness ratio;
Assumption 3:
The flexural stiffness is maximum when the thickness ratio is 0, minimum when the thickness ratio is 1, and then gradually increases, but they are all lower than the flexural stiffness when the thickness ratio is zero.
The trends of the results of the three hypothetical calculations are in conflict with the experimental results, and, therefore, the method of calculating the flexural stiffness of the stacked beams needs to be corrected.

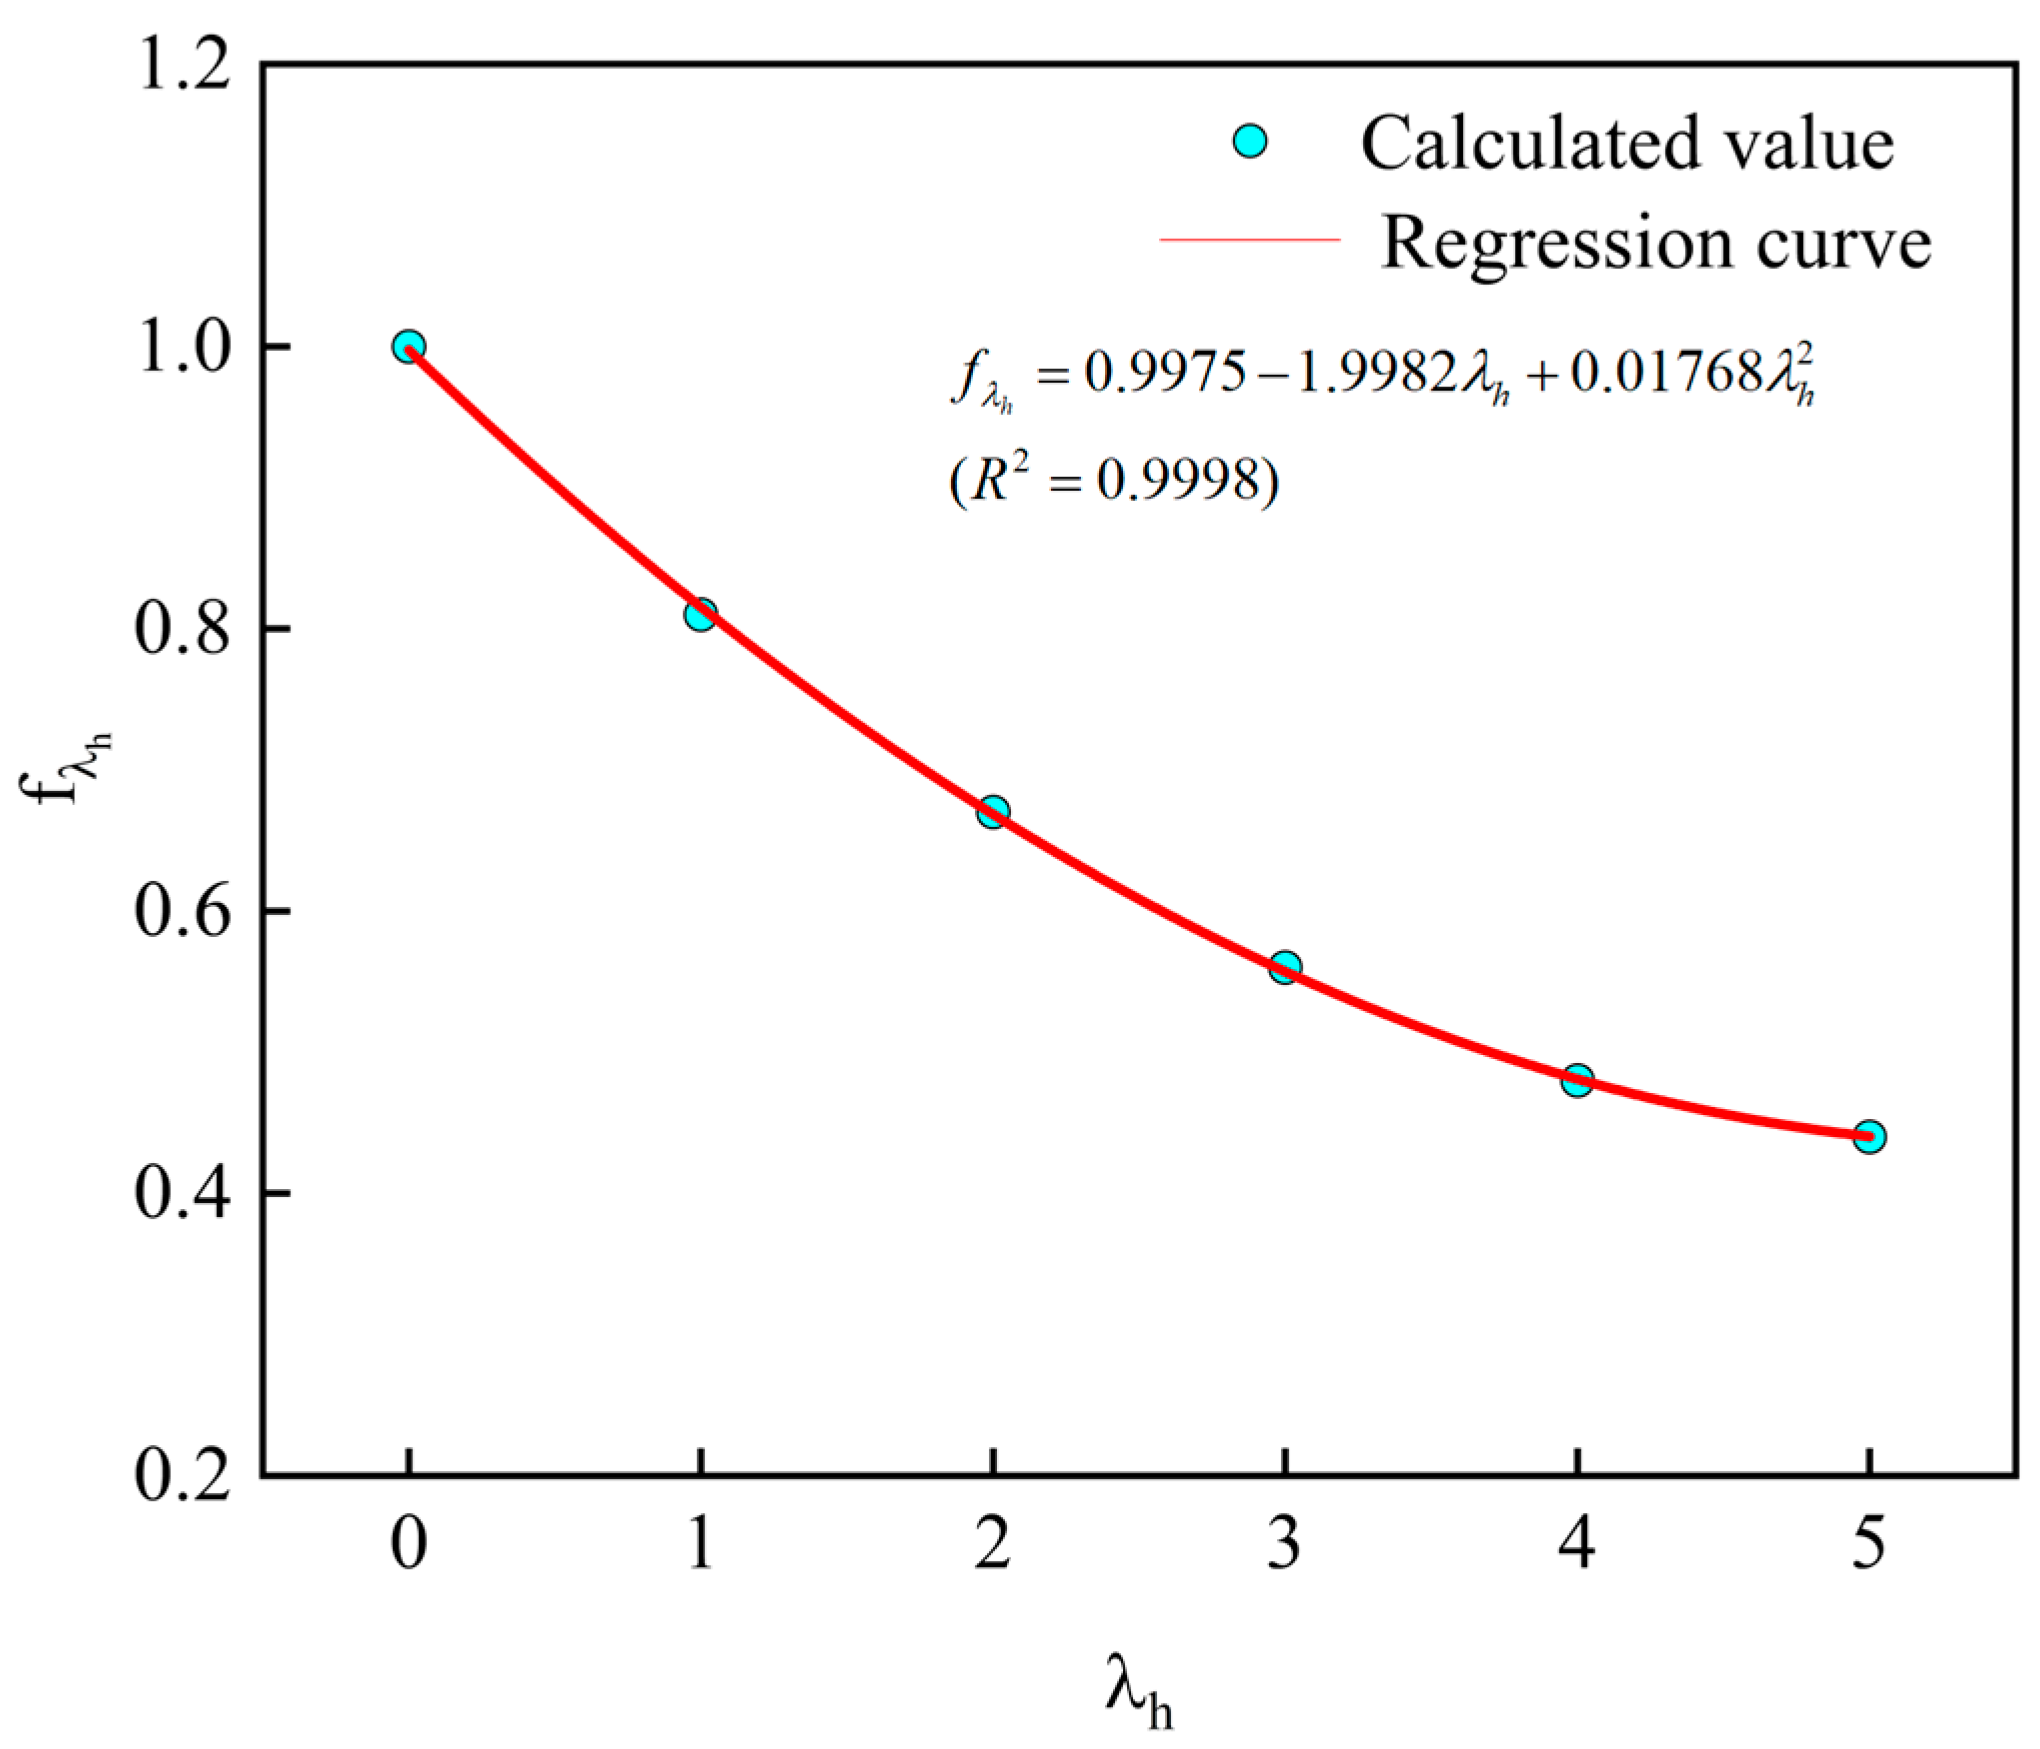
5.3. Modified Calculation of Fiber-Sprayed Concrete Stacked Beams Considering the Thickness Ratio

After fiber shotcrete beams are layered, the interface location may have an effect on the flexural performance of the beams. Slips may occur between layers of fiber shotcrete beams, and the interfacial friction can partially inhibit the slip between layers, thus reducing the losses caused by the slip. At the same time, delamination can also lead to changes in the stress distribution pattern of the beam, and crack retardation and plastic deformation sharing can vary with the location of the interface. Therefore, interface effects need to be incorporated into the calculation of flexural stiffness.
For this reason, the interface influence factor [48] about the location of the cross-section is introduced f λ h , where λ h = h 2 h 1 . Taking into account that the single-layer lining is a lining structure with sufficient transmission of shear forces between layers and coordinated deformation, the calculation of the flexural stiffness is corrected on the basis of the assumptions (1) (the fiber-sprayed concrete stacked beams are coordinated in deformation, and the neutral axis is located in the location of the center of the form), and the corrected flexural stiffness can be expressed as follows:
E I e f f = f λ h E I 0
In the formula, E I e f f is the effective stiffness of the stacked beam, N mm 4 , and f λ h is the coefficient of influence on the interface, f λ h = E I e f f E I 0 and λ h = h 2 h 1 .

5.4. Theoretical Verification of the Modified Theory of Laminated Beams

Taking the thickness ratio λ h = 0 as the base group, the interfacial influence factor under different thickness ratios is calculated using Table 7, as shown in Table 8.
The tests show that the effective flexural stiffness of the thickness ratio λ h = 1 to the thickness ratio λ h = 5 is lower than the thickness ratio λ h = 0 , indicating that the layered construction reduces the overall effective stiffness. With the downward shift of the interface position, the effective flexural stiffness of fiber shotcrete beams E I e f f gradually decreases, the interface influence factor f λ h decreases, the thickness ratio λ h = 5 is the lowest, and the interface influence factor f λ h is only 0.44. Excessive downward shifting of the interface will lead to interface slip, weakening the synergistic nature of the whole, aggravating the loss of stiffness, and ultimately decreasing the effective flexural stiffness.
In order to analyze the relationship between the thickness ratio of fiber shotcrete beams λ h and the interface influence factor f λ h , we performed a linear fitting of the experimental data using Origin 2024 version software, and the fitting results are shown in Figure 14. According to the fitting results, the following linear equation is obtained.
f λ h = 0.9975 0.19982 λ h + 0.01768 λ h 2
In the formula, f λ h denotes the interfacial influence factor, and λ h denotes the thickness ratio.
The fitted curve well describes the relationship between the thickness ratio and the interfacial influence factor. The fitting results show that there is a significant linear relationship between the trend of the interfacial influence factor and the thickness ratio at different thickness ratios.
Combining Equations (7), (10), and (11), the deflection-to-thickness ratio of the concrete span is calculated as follows:
δ = 23 F L 3 648 ( 0.9975 0.19982 λ h + 0.01768 λ h 2 ) E I 0 + δ c r a c k
In the formula, F is the elastic stage load, F = F c r , N, and δ c r a c k is the axial deflection at mid-span during the crack development stage, mm.
The mid-span deflections of fiber shotcrete beams with different thickness ratios are calculated, as shown in Figure 15a, and the linear fitting of the calculated results of the modified method to the experimental results is shown in Figure 15b, which shows that the error between the calculated results of the modified method and the experimental results is relatively small, and it proves that the formula can describe the relationship between the thickness ratios and the structural deflections very well.

6. Conclusions

In the design of hard rock single-layer lining tunnels, the flexural performance of the tunnel lining structure directly affects the safety, durability, and service life of the entire tunnel. This paper presents four-point bending tests of specimens with six different thickness ratios. The conclusions are as follows:
(1)
The flexural ultimate load values of the specimens first increase and then decrease as the thickness ratio increases. The maximum flexural ultimate load occurs when the thickness ratio is 2, with a 20.9% increase in flexural ultimate load compared to the thickness ratio of 0.
(2)
The flexural toughness of the specimens increases and then decreases with the increase in the thickness ratio. When the thickness ratio is 2, the flexural toughness of the specimen reaches its maximum, which is 25% higher compared to the thickness ratio of 0 (unstratified specimen).
(3)
Layered construction affects the failure mode of the shotcrete single-layer lining structure. At thickness ratios ranging from one to five, cracks develop with a transverse abrupt change at the parting interface. All shotcrete beams exhibit mixed-mode failure, with the proportion of flexural failure cracks increasing as the thickness ratio increases.
(4)
Layered construction will cause the effective bending stiffness of shotcrete beams to be reduced, and the larger the thickness ratio, the more obvious the reduction in the effective bending stiffness of shotcrete beams. On this basis, the interface influence coefficient is proposed, and the bending stiffness correction is carried out by combining the theory of stacked beams, which supplements the insufficiency of single-layer lining in the calculation of structural bending stiffness and can provide theoretical support for the calculation related to tunnel support.
The thickness ratio significantly impacts the flexural performance of fiber shotcrete beams. Reasonable control of the thickness ratio can optimize both the bending tensile strength and the bending stiffness. Combining the mechanical properties of concrete beams and the flexural stiffness correction method, it is recommended that the thickness ratio for single-layer lining tunnels be set between 1 and 2. Further research should focus on interface treatment technologies, such as increasing the roughness of the interface or applying adhesive to improve the interlayer cooperative deformation capacity, prevent interface detachment, and ensure structural stability.

Author Contributions

Conceptualization, M.W. and Z.Z.; methodology, Z.Z. and K.Z.; validation, M.W., M.X., X.H. and K.Z.; investigation, Z.Z., X.H. and P.C.; data curation, M.X., X.H., K.Z. and P.C.; writing—original draft preparation, M.W., Z.Z., M.X. and K.Z.; writing—review and editing, M.W., Z.Z., K.Z. and P.C.; project administration, M.W., Z.Z., X.H. and P.C.; funding acquisition, Z.Z. All authors have read and agreed to the published version of the manuscript.

Funding

This research is supported by the Fund of the National Engineering and Research Center for Mountainous Highways (the project No. is GSGZJ-2023-04) and the Natural Science Foundation of Chongqing (CSTB2022NSCQ–MSX0887).

Institutional Review Board Statement

Not applicable.

Informed Consent Statement

Not applicable.

Data Availability Statement

Data associated with this research are available and can be obtained by contacting the corresponding author upon reasonable request.

Acknowledgments

We want to express our thanks to the authors whose publications we cited and the efficient editor.

Conflicts of Interest

Mengjun Wu, Xuebing Hu, and Peng Cao were employed by China Merchants Chongqing Communications Technology Research & Design Institute Co., Ltd. The remaining authors declare that the research was conducted in the absence of any commercial or financial relationships that could be construed as a potential conflict of interest.

References

  1. Zucca, M.; Valente, M. On the Limitations of Decoupled Approach for the Seismic Behaviour Evaluation of Shallow Multi-Propped Underground Structures Embedded in Granular Soils. Eng. Struct. 2020, 211, 110497. [Google Scholar] [CrossRef]
  2. Xu, L.; Wang, S.; Zhang, J. Research on Key Technologies of TGP Advance Geological Prediction Data Collection. Prog. Geophys. 2020, 35, 1618–1625. [Google Scholar]
  3. Zhao, D.; Yu, Y.; Zhao, W.Q. Research on the Target Reliability Index of Railway Tunnel Lining. J. Railway Eng. Soc. 2015, 32, 51–56. [Google Scholar]
  4. Li, S.; Chen, W.; Hu, J.; Zhang, D.; Chen, L. Flexural Behavior of Unbonded Prestressed Concrete Composite Beams Manufactured with Glass-Fiber-Reinforced Lightweight Aggregate Concrete and Conventional Concrete. Iran. J. Sci. Technol., Trans. Civ. Eng. 2023, 48, 2031–2047. [Google Scholar] [CrossRef]
  5. Chunxiang, Q.; Patnaikuni, I. Properties of High-Strength Steel Fiber-Reinforced Concrete Beams in Bending. Cem. Concr. Compos. 1999, 21, 73–81. [Google Scholar] [CrossRef]
  6. Yan, X.; Gao, Y.; Luo, Y.; Bi, Y.; Xie, Y. Effect of Different Steel Fiber Types on Mechanical Properties of Ultra-High Performance Concrete. IOP Conf. Ser. Mater. Sci. Eng. 2021, 1167, 012001. [Google Scholar] [CrossRef]
  7. Tang, C.W. An Extended Special Issue on Advances in High-Performance Fiber-Reinforced Concrete. Appl. Sci. 2023, 13, 10688. [Google Scholar] [CrossRef]
  8. Lifshitz Sherzer, G.; Ribakov, Y. Modeling Complex Material Interactions to Replicate and Uncover Mechanisms Driving the Performance of Steel Fiber-Reinforced Concrete Cylinders. Appl. Sci. 2025, 15, 3445. [Google Scholar] [CrossRef]
  9. Prieto, T.G.; Prieto, M.I.; Leal, A.; Ferrández, D. Mechanical Behavior of Carbon Fiber-Reinforced Concrete Structures After Structural Failure. Appl. Sci. 2025, 15, 1783. [Google Scholar] [CrossRef]
  10. Wang, Y.; Zhuang, X. Experimental Study on Mechanical Properties of Graded EPS–Steel Fiber-Reinforced Concrete. Appl. Sci. 2025, 15, 1980. [Google Scholar] [CrossRef]
  11. Abdulhameed, A.A.; Hason, M.M.; Sharba, A.A.K.; Hanoon, A.N.; Amran, M.; Magbool, H.M.; Gamil, Y. Experimental and Environmental Investigations of the Impacts of Wood Sawdust on the Performance of Reinforced Concrete Composite Beams. Case Stud. Constr. Mater. 2023, 19, e02550. [Google Scholar] [CrossRef]
  12. Gao, D.; Jing, J.; Chen, G.; Yang, L. Experimental Investigation on Flexural Behavior of Hybrid Fibers Reinforced Recycled Brick Aggregates Concrete. Constr. Build. Mater. 2019, 227, 116652. [Google Scholar] [CrossRef]
  13. Ramadan, R.; Jahami, A.; Khatib, J.; El-Hassan, H.; Elkordi, A. Improving Structural Performance of Reinforced Concrete Beams with Phragmites Australis Fiber and Waste Glass Additives. Appl. Sci. 2023, 13, 4206. [Google Scholar] [CrossRef]
  14. Mahmood, A.; Noman, M.T.; Pechočiaková, M.; Amor, N.; Petrů, M.; Abdelkader, M.; Militký, J.; Sozcu, S.; Hassan, S.Z.U. Geopolymers and Fiber-Reinforced Concrete Composites in Civil Engineering. Polymers 2021, 13, 2099. [Google Scholar] [CrossRef] [PubMed]
  15. Blikharskyy, Z.; Markiv, T.; Turba, Y.; Hunyak, O.; Blikharskyy, Y.; Selejdak, J. Mechanical and Fracture Properties of Air-Entrained FRC Containing Zeolitic Tuff. Appl. Sci. 2023, 13, 9164. [Google Scholar] [CrossRef]
  16. Lalinde, L.F.; Mellado, A.; Borrachero, M.V.; Monzó, J.; Payá, J. Durability of Glass Fiber Reinforced Cement (GRC) Containing a High Proportion of Pozzolans. Appl. Sci. 2022, 12, 3696. [Google Scholar] [CrossRef]
  17. Ahmad, J.; Zaid, O.; Pérez, C.L.-C.; Martínez-García, R.; López-Gayarre, F. Experimental Research on Mechanical and Permeability Properties of Nylon Fiber Reinforced Recycled Aggregate Concrete with Mineral Admixture. Appl. Sci. 2022, 12, 554. [Google Scholar] [CrossRef]
  18. Li, Z.; Zhao, J.; Geng, S.; Qiu, X.; Jiang, P.; Zhou, J.; Jia, S.; Yao, Z. Exploring the Effects of Cementitious Capillary Crystalline Waterproof Material on the Properties of Cement with/without Mineral Admixture: A Comparison of Rheology, Hydration Process, and Self-Healing Behavior. Constr. Build. Mater. 2025, 470, 140546. [Google Scholar] [CrossRef]
  19. Li, M.; Meng, F.; Zhang, L.; Wu, Q. Experimental and Numerical Study on Flexural Behavior of Prefabricated Bottom Slabs with Rabbeted Grouting Splicing Joints. Structures 2024, 70, 107755. [Google Scholar] [CrossRef]
  20. He, Q.; Wu, Y.; Hu, C.; Yang, K.; Yi, W. Experimental Study of the Two-Way Mechanical Behavior of Tightly Spliced Prestressed Reinforced Concrete Laminated Slab. J. Struct. Eng. 2025, 151, 04025063. [Google Scholar] [CrossRef]
  21. Zhou, P.; Wang, Z.; Lei, F. Experimental study on the stress characteristics of single-layer lining of steel fiber reinforced concrete tunnels considering interlayer effects. China Civ. Eng. J. 2019, 52, 116. [Google Scholar]
  22. Mitroulis, K.; Mellios, N.; Spyridis, P.; Bergmeister, K. Composite Action in Tunnel Linings by Use of Shear Connectors in Concrete Interfaces. In Life-Cycle of Structures and Infrastructure Systems; CRC Press: Boca Raton, FL, USA, 2023; pp. 2269–2276. [Google Scholar]
  23. Deng, Y.; Li, G.; Zhang, J.; Weng, S. Study on composite surface of waterproof single-layer lining by tests. J. Railway Sci. Eng. 2022, 19, 776. [Google Scholar]
  24. Xie, Y.Z.; Zhang, W.D.; Wu, X.; Ueda, T. Nonlinear Analysis of Full-Range Bending Process of Prefabricated and Cast-in-Place Concrete Composite Beams Considering Interface Debonding. Structures 2025, 74, 108588. [Google Scholar] [CrossRef]
  25. Xie, Y.Z.; Zhang, W.D.; Wu, X.; Ueda, T. Nonlinear Fatigue Analysis Model of Prefabricated Concrete Composite Beams with Wet Connection Considering Interface Debonding under Cyclic Loading. Eng. Struct. 2025, 328, 119741. [Google Scholar] [CrossRef]
  26. Su, J.; Bloodworth, A. Utilizing Composite Action to Achieve Lining Thickness Efficiency for Sprayed Concrete Lined (SCL) Tunnels. In Proceedings of the ITA-AITES World Tunnel Congress 2016 (WTC 2016), San Francisco, CA, USA, 22–28 April 2016; Society for Mining, Metallurgy and Exploration: Englewood, CO, USA, 2016; Volume 1, pp. 84–93. [Google Scholar]
  27. Deng, J.; Zhou, X.; Zhuang, Y.; Liu, L.; Bai, Y. Mechanical Characteristics of Lining Structure Considering the Contact Effect between Composite Lining Layers. Sci. Technol. Eng. 2023, 23, 9268–9278. [Google Scholar]
  28. Feng, X.; Lu, Y.; Lu, B.; Yuan, C.; Li, S. Mechanical Behavior of Composite Shell Lining Structures Based on Cohesion Models. KSCE J. Civ. Eng. 2024, 28, 5373–5383. [Google Scholar] [CrossRef]
  29. Özütok, A.; Madenci, E. Static Analysis of Laminated Composite Beams Based on Higher-Order Shear Deformation Theory by Using Mixed-Type Finite Element Method. Int. J. Mech. Sci. 2017, 130, 234–243. [Google Scholar] [CrossRef]
  30. Tan, Z. Solution to Bi-Layer Beams on Elastic Foundation. ACTA Mech. Sin.-Chin. Ed. 1997, 29, 751–754. [Google Scholar]
  31. Tan, Z.-m.; Guo, J.-j.; Chen, J.-l. Solutions of Double-Layer Plates with Two-Way Spring Interlayers on Elastic Foundations. Appl. Math. Mech. 2016, 37, 382–390. [Google Scholar]
  32. Shi, B.; Zhu, W.; Yang, H.; Liu, W.; Tao, H.; Ling, Z. Experimental and Theoretical Investigation of Prefabricated Timber-Concrete Composite Beams with and without Prestress. Eng. Struct. 2020, 204, 109901. [Google Scholar] [CrossRef]
  33. Zhang, Y.; Yang, Z.; Xie, T.; Yang, J. Flexural Behaviour and Cost Effectiveness of Layered UHPC-NC Composite Beams. Eng. Struct. 2022, 273, 115060. [Google Scholar] [CrossRef]
  34. Wang, Q.Y.; Zhu, H.; Yang, L.H. The Optimal Rubber Layer Height of Crumb Rubber Concrete Sandwich Beam. Indust. Construct. 2007, 37, 253–256. [Google Scholar]
  35. Zhang, J.; Leung, C.K.Y.; Cheung, Y.N. Flexural Performance of Layered ECC-Concrete Composite Beam. Compos. Sci. Technol. 2006, 66, 1501–1512. [Google Scholar] [CrossRef]
  36. Liu, H.; Xiao, J.; Ding, T. Flexural Performance of 3D-Printed Composite Beams with ECC and Recycled Fine Aggregate Concrete: Experimental and Numerical Analysis. Eng. Struct. 2023, 283, 115865. [Google Scholar] [CrossRef]
  37. Wang, H.L.; Shi, H.W.; Qian, P.L.; Bai, Y.L.; Liu, S.Z.; Yang, Z.Q. Flexural Behaviors of GFRP-Reinforced Engineered Cementitious Composite (ECC)-Concrete Composite Beams. Eng. Struct. 2025, 332120097, 120097. [Google Scholar] [CrossRef]
  38. Zaki, Y.; Abouhussien, A.; Hassan, A. Acoustic Emission Analysis of the Cracking Behavior in ECC-LWSCC Composites. Appl. Sci. 2025, 15, 594. [Google Scholar] [CrossRef]
  39. Yan, Z.; Wei, Y.; Du, H.; Chen, J.; Ding, M.; Li, G. Experimental and Theoretical Study on Flexural Performance of Reinforced Bamboo-Concrete Composite Beams. Eng. Struct. 2025, 325, 119503. [Google Scholar] [CrossRef]
  40. Xiamen City Construction Science Research Institute Group Co., Ltd.; Xiamen Tefang Construction Engineering Group Co., Ltd. JGJ/T 372-2016 Technical Specification for Application of Sprayed Concrete; China Architecture & Building Press: Beijing, China, 2016. [Google Scholar]
  41. Research Institute of Highway Ministry of Transport. Test Methods of Cement and Concrete for Highway Engineering; People’s Traffic Publishing House Co., Ltd.: Beijing, China, 2021. [Google Scholar]
  42. Norwegian Concrete Association. Sprayed Concrete for Rock Support: NB 7E; Norwegian Concrete Association: Oslo, Norway, 2024. [Google Scholar]
  43. Li, G.F. Application of Composite Lining Technology in Mining Method Tunnels. Shanxi Archit. 2022, 48, 162–164+179. [Google Scholar]
  44. Li, L.Y.; Yang, J.S.; Xie, Z.; Xue, J.; Zheng, J. Study on the Mechanical Characteristics of Tunnel Single-Layer Lining Structure Based on FLAC3D. J. Highway Transp. Res. Dev. 2019, 36, 74–82. [Google Scholar]
  45. ASTM C1609/C1609M-07; Standard Test Method for Flexural Performance of Fiber-Reinforced Concrete (Using Beam with Third-Point Loading). ASTM International: West Conshohocken, PA, USA, 2007.
  46. Wong, L.N.Y.; Einstein, H.H. Systematic Evaluation of Cracking Behavior in Specimens Containing Single Flaws under Uniaxial Compression. Int. J. Rock Mech. Min. Sci. 2009, 46, 239–249. [Google Scholar] [CrossRef]
  47. Fang, Q.; Liu, J.; Zhang, Y.; Qiang, Q. Finite Element Analysis of Failure Modes of Blast-Loaded R/C Beams. Eng. Mech. 2001, 18, 1–8. [Google Scholar]
  48. Xu, K.; Wang, W.; Zhang, L. The compressive strength and establishment its prediction model of concrete with recycled coarse aggregates from different sources. Mater. Rep. 2025, 39, 23110068-9. [Google Scholar]
Figure 1. Sprayed concrete preparation process.
Applsci 15 07473 g001
Figure 2. Specimen preparation.
Applsci 15 07473 g002
Figure 3. Experimental process.
Applsci 15 07473 g003
Figure 4. Axial load–displacement curves. (a) Axial load–displacement curves. (b) Axial load–time curves. (c) Axial displacement-time curves.
Applsci 15 07473 g004
Figure 5. Flexural tensile strength versus thickness ratio.
Applsci 15 07473 g005
Figure 6. Crack formation threshold and axial displacement. (a) Crack formation threshold and axial displacement. (b) The error bar chart.
Applsci 15 07473 g006
Figure 7. Flexural toughness.
Applsci 15 07473 g007
Figure 8. Concrete failure mode.
Applsci 15 07473 g008
Figure 9. Failure modes of fiber shotcrete beams with different thickness ratios (green, red, and blue lines represent the dividing line, the crack, and the transverse mutation, respectively).
Applsci 15 07473 g009aApplsci 15 07473 g009b
Figure 10. Main strain field.
Applsci 15 07473 g010aApplsci 15 07473 g010b
Figure 11. The failure mechanism of fiber shotcrete beams with different thickness ratios.
Applsci 15 07473 g011
Figure 12. Moment of inertia calculation assumptions.
Applsci 15 07473 g012
Figure 13. Calculation of flexural stiffness.
Applsci 15 07473 g013
Figure 14. Relationship between the thickness ratio and the interfacial influence factor.
Applsci 15 07473 g014
Figure 15. Comparison between the calculated results of the modified method and the test results. (a) The mid-span deflections of fiber shotcrete beams. (b) Linear fitting of the calculation results of the correction method and the experimental results.
Applsci 15 07473 g015
Table 1. C35 high-performance fiber-reinforced shotcrete mix proportion/(kg/m3).
FibroidCementGanister SandCoarse AggregateFine AggregateWater
TypologyDopant
PP fiber439436844914172
Table 2. Performance parameters of polypropylene crude fiber.
PerformanceTensile Strength/MPaElastic
Modulus
/GPa
Length/mmDiameter
/mm
Aspect RatioDensity
/ g c m 3
Poisson’s
Ratio
Norm5509300.837.50.950.22
Table 3. Basic mechanical properties of concrete.
TypologyIntensity
/ g cm 3
Uniaxial Compressive Strength
/ MPa
Elastic Modulus
/ GPa
Poisson’s Ratio
concrete2.541290.25
Table 4. Thickness ratio working conditions.
Working Condition λ h ( h 2 / h 1 ) Initial Spray Thickness/mmRe-Spray Thickness/mm
A101000
A215050
A3233.367.7
A432575
A542080
A6516.783.3
Table 5. Four-point bending test results.
Working Condition F c r /kN δ c r /mm F max /kN δ max /mm σ c r /MPa σ max /MPa
A120.850.0920.850.156.2556.255
A222.630.1224.850.226.7897.455
A322.790.1425.210.386.8377.563
A420.930.1622.950.466.2796.885
A519.090.1721.890.525.7276.567
A618.550.1821.170.575.5656.351
Table 6. Bending stiffness under different assumptions.
Working Condition λ h EI / N mm 4
Assumption (1)Assumption (2)Assumption (3)
A10241.67 × 109241.67 × 109241.67 × 109
A21241.67 × 109241.67 × 10960.42 × 109
A32241.67 × 109335.64 × 10983.91 × 109
A43241.67 × 109422.92 × 109105.73 × 109
A54241.67 × 109502.67 × 109125.67 × 109
A65241.67 × 109563.24 × 109140.81 × 109
Table 7. Calculation of flexural stiffness.
Working Condition λ h F e f f / k N δ e f f / m m Effective   Flexural   Stiffness ,   E I e f f / N m m 4
A1020.850.09222.01 × 109
A2122.630.12180.73 × 109
A3222.790.14156.00 × 109
A4320.930.16125.36 × 109
A5419.090.17107.62 × 109
A6518.550.1898.76 × 109
Table 8. Calculation of interfacial influence factor.
Working Condition λ h Effective   Flexural   Stiffness ,   E I e f f / N m m 4 f λ h
A10222.01 × 1091
A21180.73 × 1090.81
A32156.00 × 1090.70
A43125.36 × 1090.56
A54107.62 × 1090.46
A6598.76 × 1090.44
Disclaimer/Publisher’s Note: The statements, opinions and data contained in all publications are solely those of the individual author(s) and contributor(s) and not of MDPI and/or the editor(s). MDPI and/or the editor(s) disclaim responsibility for any injury to people or property resulting from any ideas, methods, instructions or products referred to in the content.

