Article

Load Weight Estimation in Electric Forklifts via DC–DC Converter Power Signal Analysis of the Electro-Hydraulic Lifting System

1
Centro de Energía UCSC, Universidad Católica de la Santísima Concepción, Concepción 4090541, Chile
2
Center for Energy Transition, Faculty of Engineering and Sciences, Universidad Adolfo Ibañez, Santiago 7941169, Chile
*
Author to whom correspondence should be addressed.
Appl. Sci. 2025, 15(13), 7470; https://doi.org/10.3390/app15137470
Submission received: 4 June 2025 / Revised: 27 June 2025 / Accepted: 27 June 2025 / Published: 3 July 2025

Abstract

Electric forklifts are increasingly adopted in industrial environments due to their energy efficiency, reduced emissions, and lower operating noise compared to combustion alternatives. This paper presents a novel methodology for estimating the transported load weight in electric forklifts based on the output power signal of the DC–DC converter driving the electro-hydraulic lifting system. The proposed method leverages non-intrusive measurements of voltage and current to compute the lifting power, lifting speed, and energy, also allowing the computation of the lifting efficiency. The analysis confirmed that lifting energy is not linearly correlated with transported weight but lifting efficiency can be reasonably approximated as a function of lifting power and lifting speed, subsequently allowing the estimation of the transported mass. Experimental validation using 53 lifting events demonstrated that the methodology can estimate load weight with a reasonable mean absolute percentage error of 10.6% and 6.4% when using linear or multivariable regression analysis, respectively. These results demonstrate that the approach is sufficiently accurate for practical applications such as triggering load warnings when the estimated mass exceeds predefined safety thresholds.

1. Introduction

The use of electric forklifts has shown significant growth in recent decades, primarily driven by the transition toward more sustainable and energy-efficient industrial solutions. Electric forklifts, by not relying on fossil fuels, offer a non-polluting alternative, with lower environmental impact and reduced long-term operational costs [1,2,3].
The research and analysis of electrically driven forklifts has been carried out based on different approaches. From a mechanical and modeling perspective, multibody simulation approaches have been validated for reproducing dynamic load conditions in forklifts, supporting virtual testing and structural design [4]. Moreover, predictive maintenance techniques using vibration-based diagnostics and machine learning are being applied to anticipate component failure and extend equipment lifespan [5]. At the interface between energy efficiency and load integrity, anti-slip fork attachments have been developed to reduce both energy usage and cargo damage, particularly under dynamic maneuvers [6].
To improve the performance and sustainability of electric forklifts, recent studies have focused on developing advanced energy recovery systems. For instance, in [7] a novel energy recovery system is proposed for heavy-duty electric forklifts, utilizing a hydraulic motor to recover energy during the lowering process. The simulation results demonstrated the feasibility and efficiency of the proposed system in reducing energy losses and managing system temperature. In [8], the authors developed an energy management strategy for electric forklifts equipped with electric lifting devices, replacing traditional hydraulic systems. Their approach resulted in a 46.7% reduction in fuel consumption and an 82.3% improvement in transmission efficiency. Furthermore, in [9] the impact of recovered energy from the forklift lifting system was explored, comparing different storage devices. By integrating an electro-hydraulic system with a high-efficiency energy storage unit, the overall energy efficiency of the forklift operation was significantly improved. The work described in [10] presents an energy recovery system based on double hydraulic motor–generators, achieving a regeneration efficiency of up to 74%, without affecting the boom control performance of the forklift.
Recent advancements in energy storage systems have significantly improved the performance and efficiency of electric forklifts [11]. A promising development is the integration of hybrid battery systems combining supercapacitors and lead–acid batteries [12,13], which enhances cycle life and economic benefits for industrial applications. The study presented in [2] describes the optimal sizing of a lithium-ion battery and supercapacitor hybrid energy storage system for forklifts, improving efficiency and battery lifespan in machines with frequent stop-and-go cycles. Additionally, hydrogen fuel cells paired with supercapacitors have been shown to provide extended autonomy and lifecycle benefits, making them a viable alternative to traditional battery systems [13].
From an operational safety perspective, the use of virtual reality for operator training has been shown to significantly reduce energy consumption in logistics environments while maintaining training effectiveness [14]. Other research lines focused on the center of gravity estimation of loaded forklifts to control the dynamic stability as means to prevent accidents under different operating conditions. An investigation about the relationship between the center of gravity and the risk of overturning in forklifts is presented in [15], where the authors derive a method for determining risk conditions by defining a stable region for the position of the center of gravity. A similar study is presented in [16] where the authors proposed an analytical method to assess the stability of counterbalanced forklifts when assembled with different equipment for load handling. Both studies highlight the importance of considering the overall center of gravity changes to maintain operational safety. The work described in [17] created a virtual prototype based on the longitudinal and lateral stability of an AGV forklift to estimate the positions of the center of gravity within a predefined safety zone. To prevent instability during the forklift operation, a real-time estimation method for the detection of changes in the height of the center of gravity is described in [18]. In [19] the authors evaluate a prototype to implement a detection system and a center of gravity correction mechanism to prevent loss of forklift balance. Considering the structural characteristics of counterbalanced forklifts, a research area focuses on the development of anti-rollover control strategies. These strategies are designed to enhance the stability and active safety of counterbalanced forklifts based on roll energy classifications [20], stable roll partitions [21], and model predictive control (MPC) [22], to name a few. Operational safety has also been improved by the development of autonomous forklifts capable of replacing human interaction in tasks requiring transport of hazardous objects or work in unknown environments [23,24,25]. Advances in computer vision and deep learning have also enabled highly accurate pallet detection and manipulation, facilitating autonomous or semi-autonomous operation [26]. Complementarily, indoor localization techniques combining UWB and IMU sensors have been proposed to enhance real-time traceability and route optimization [27].
The previous paragraphs indicatethat one of the primary concerns in the study of forklifts is their dynamic stability for safe operation. According to the Occupational Safety and Health Administration (OSHA), not exceeding the rated load capacity is crucial for ensuring safety, energy efficiency, and the durability of system components during load handling [28]. However in practical scenarios, the exact weight of the transported load is often unknown, so it is necessary to develop accurate methods for estimating this operational parameter. To the best of the authors’ knowledge, no publicly available research has focused on load estimation in forklift trucks, although there are some commercial patents addressing this critical issue. The patent [29] estimates the load carried by measuring the changes in the rolling circumference of the wheels caused by deformation under load by adding speed and distance sensors. In [30], electrical signals measured during the operation of a pallet truck are used to estimate the weight of the lifted load as a linear function of the energy consumed during a predefined time interval.
This literature review highlights both the importance of adopting electric forklifts to achieve sustainable operations and the significance of accurately determining forklift load weight not only for preventing accidents but also for enabling more effective vehicle control, thereby enhancing both operational safety and overall efficiency. This paper proposes a methodology for estimating the transported load using electrical variables supplied by the DC–DC converter to the DC motor that drives the hydraulic pump of the forklift lifting system. The results shows a mean absolute percentage error (MAPE) of 10.6% when comparing measured and estimated load (by linear regression) for 53 experimental tests. When multivariable regression is applied, the MAPE is reduced to 6.4%. These results demonstrate the efficacy of the proposed methodology by estimating load weight with a reasonable error sufficient for practical use cases. The approach provides a cost-effective and non-intrusive alternative to conventional load sensors while opening future research in the field of industrial automation, energy optimization, and safe operation of industrial electric forklifts.

2. Materials and Methods

This section details the equipment used during the experimental evaluations, including its technical specifications and an overview of the operating principles of the electric forklift used in the study. In addition, it provides a description of the components of the data acquisition system (DAQ) and an outline of the driving cycles implemented for experimental data collection.

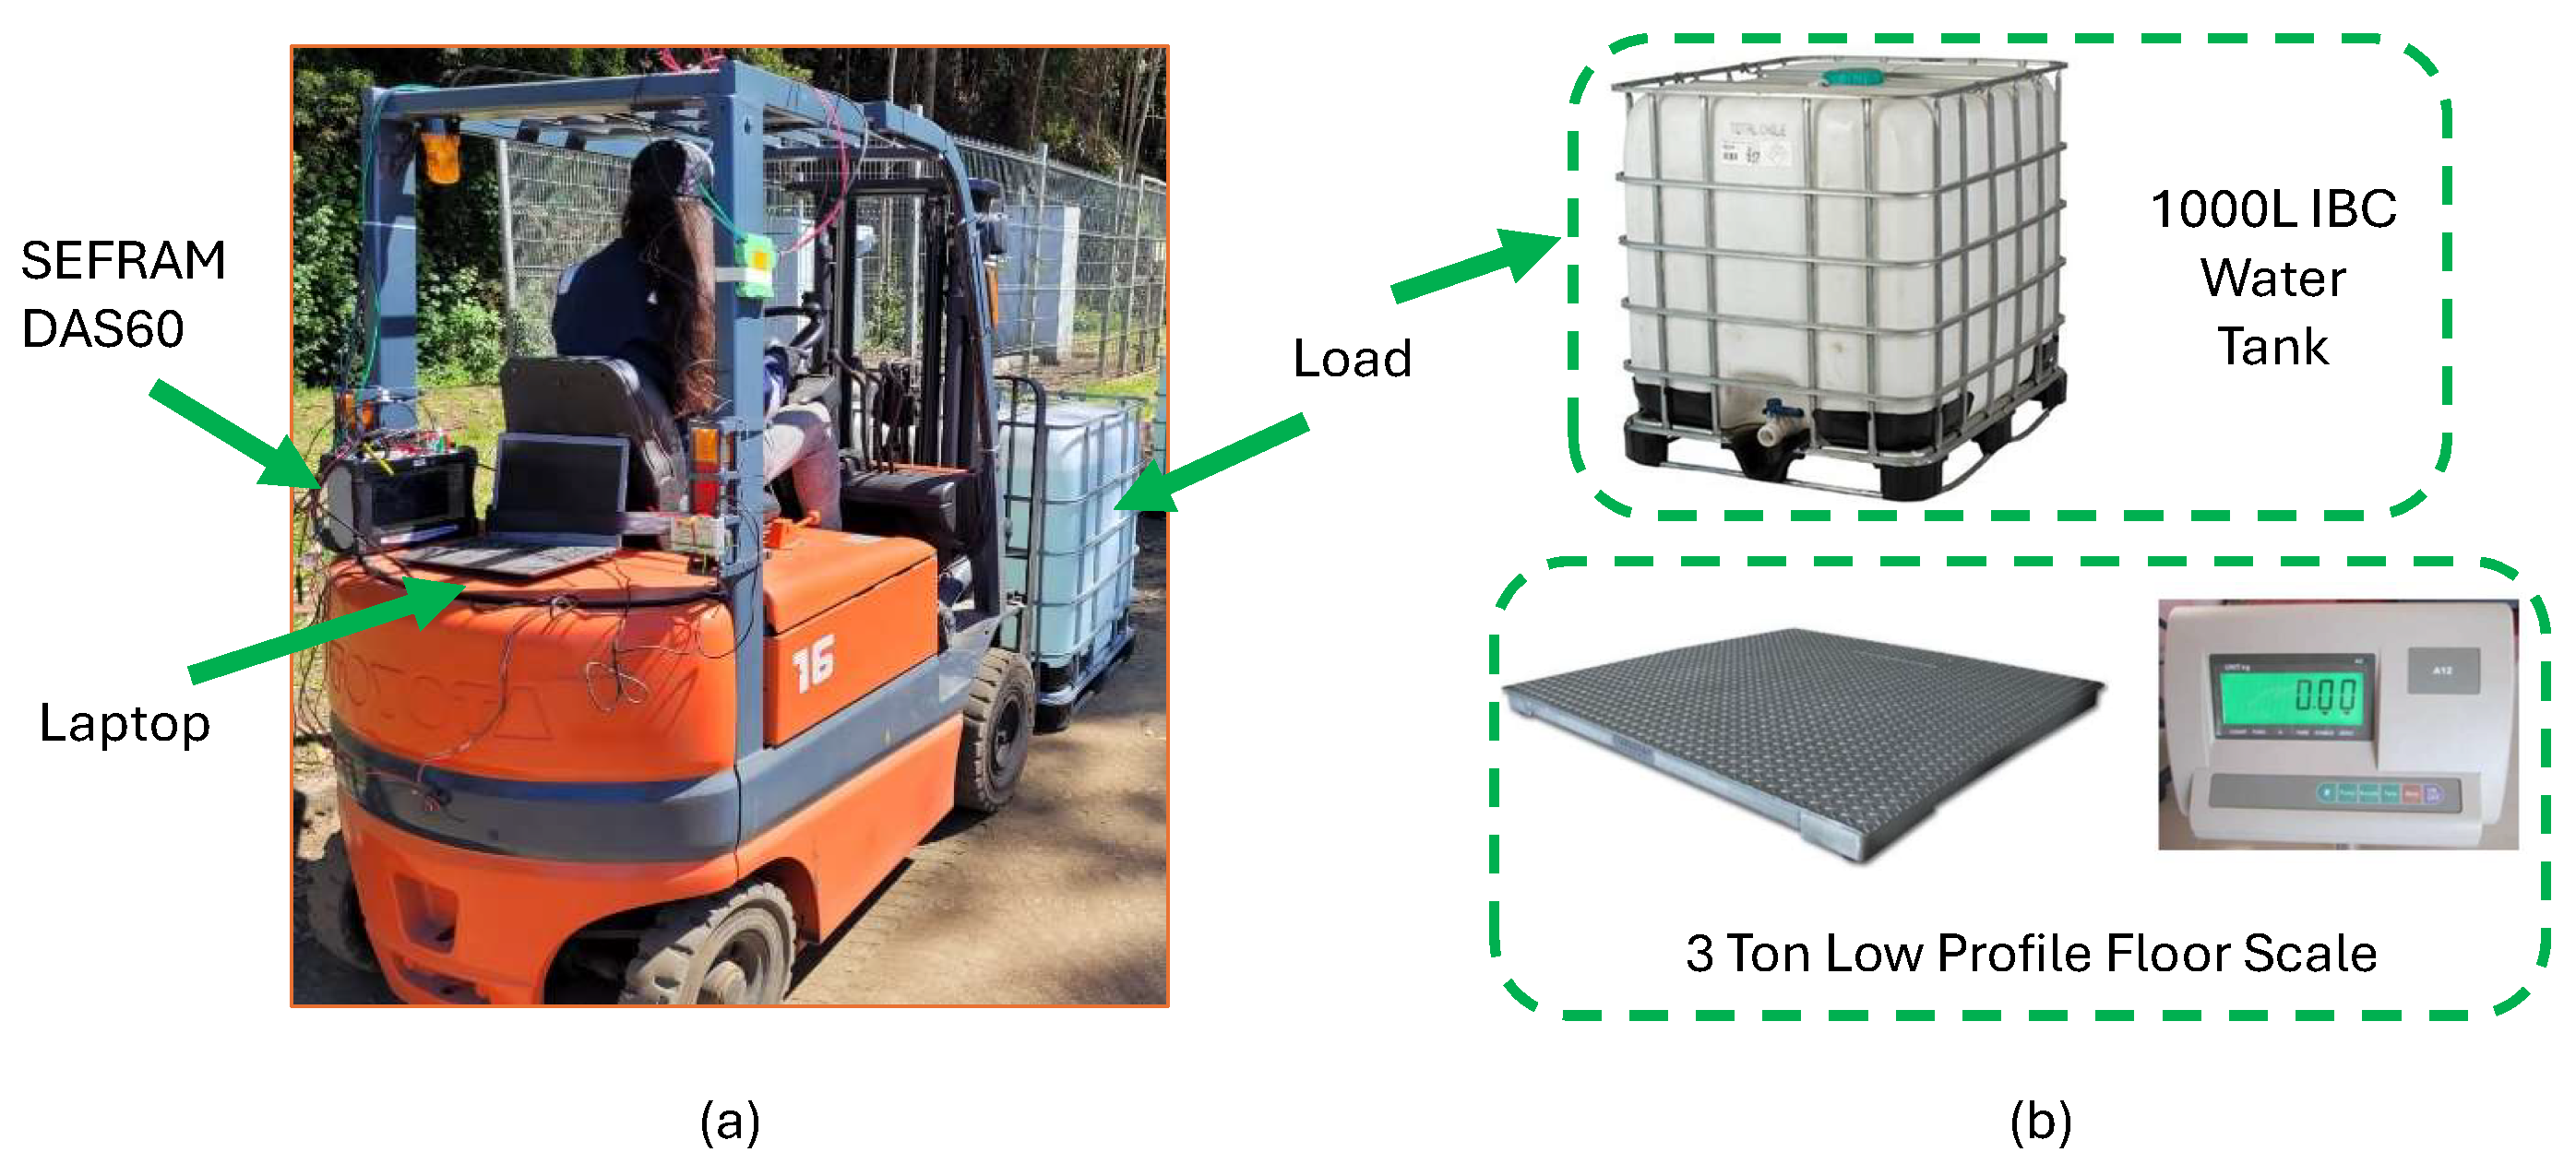
2.1. Experimental Setup

The forklift used for this study is an electrically powered industrial truck with a lead–acid battery pack for energy storage with a nominal voltage of 80 V and a capacity of 450 Ah. This machine handles loads up to 1.6 tons with a double mast structure that allows load lifting up to 3.5 m. The forklift system includes three main electric motors fed by dedicated DC–DC converters as shown in Figure 1. The traction motor (TM) is an 8.6 kW DC series motor that drives forward and reverse movement, providing the necessary torque for propulsion, and in the case of breaking sends energy back to the battery pack through its bidirectional DC–DC converter. The lift motor (LM) is a 13.0 kW DC series motor that supplies power to the positive displacement hydraulic pump, which provides the pressurized fluid needed to activate and control the lift, tilt, and side shift hydraulic cylinders. When the load is dropped, the hydraulic system liberates pressure through a relief valve and therefore does not regenerate energy back to the battery pack during the process. The power steering motor (PM) is a 1.0 kW permanent magnet DC motor that manages the power steering system through a hydraulic pump, facilitating maneuvering and precise control of the forklift. Figure 1 shows that the TM and LM are DC series motors, which is one of the types of self-excited DC motor configurations. In this configuration, the field winding is internally connected to the armature winding and stands out for its robust starting torque.
The three DC motors TM, LM, and PM are fed by buck (thyristor) DC–DC converters based on pulse width modulation (PWM). This switching control allows regulating and controlling the average voltage supplied to the motors by adjusting the duty cycle ratio. In this case the duty cycle of the three converters is fixed to 2.5 ms.
For data acquisition, the forklift was equipped with the recorder DAS60 (SEFRAM Instruments, Saint-Étienne, France). This recorder has 6 analog channels, which were configured with a sample frequency of 50 kHz to measure the voltages and currents directly from sensors installed between each DC–DC converter and DC motor. The three voltage buses were directly connected to the recorder by dedicated cables while the currents where measured by DC current sensors AEMC MR416 (AEMC Instruments, Dover, NH, USA), which can measure up to 600 A with a bandwidth of 30 kHz. This data acquisition system captures real-time information on key electrical variables, which are essential for analysis and further estimation of the transported load weight. Figure 2a shows the forklift used in the investigation, including the data acquisition system mounted in the back side of the machine. Figure 2b shows the complementary equipment used for load weight measurement.

2.2. Experimental Tests

To register the electrical variables of the forklift operation, the first step consists of the design of a driving circuit for experimental tests. This circuit is built based on VDI-2198 standard described in [31] and for this work considers different load weights during each cycle. Figure 3 shows a schematic diagram of the drive cycles performed to collect the experimental data. According to this figure, there are four points that define the driving cycle. Between P1 and P2 and P3 and P4, there is a straight distance of 30 m while between P2 and P3 and P4 and P1, there is a circular curve with a radius of 5 m. The cycle starts at P1 with the unloaded forklift moving forward to P2 where the forklift moves 2 additional meters to reach and then hold the load at a height of 0.2 m. Once loaded, the forklift reverses to P2 again to move forward to P3. At P3 the forklift stops for 3 s and then moves forward to P4. At this point, the forklift moves an additional 5 m where the load is lifted 2 m high. Then the load is lowered to 0.2 m in height and the forklift reverses to P4 again. At this point the forklift moves following the curve that connects P4 with P1, to immediately continue to P2. At P2 the load is dropped and the cycle continues again, passing points P3, P4, and P1, but with the forklift unloaded. After the unloaded drive, when the forklift is once again at P2, the evaluation continues, but with a higher load weight. To build a complete dataset, the driving cycle considering loading and unloading operations is repeated with the set of load weights shown in Table 1. A total of 11 load weights were evaluated covering 202.5 to 1202 kg. The different load levels were implemented with two IBC water tanks (see Figure 2b), allowing for gradual variance in weight by using water as the filling element. Each load weight was measured with a low-profile scale connected to a digital weight indicator (see Figure 2b) previous to each test performed.

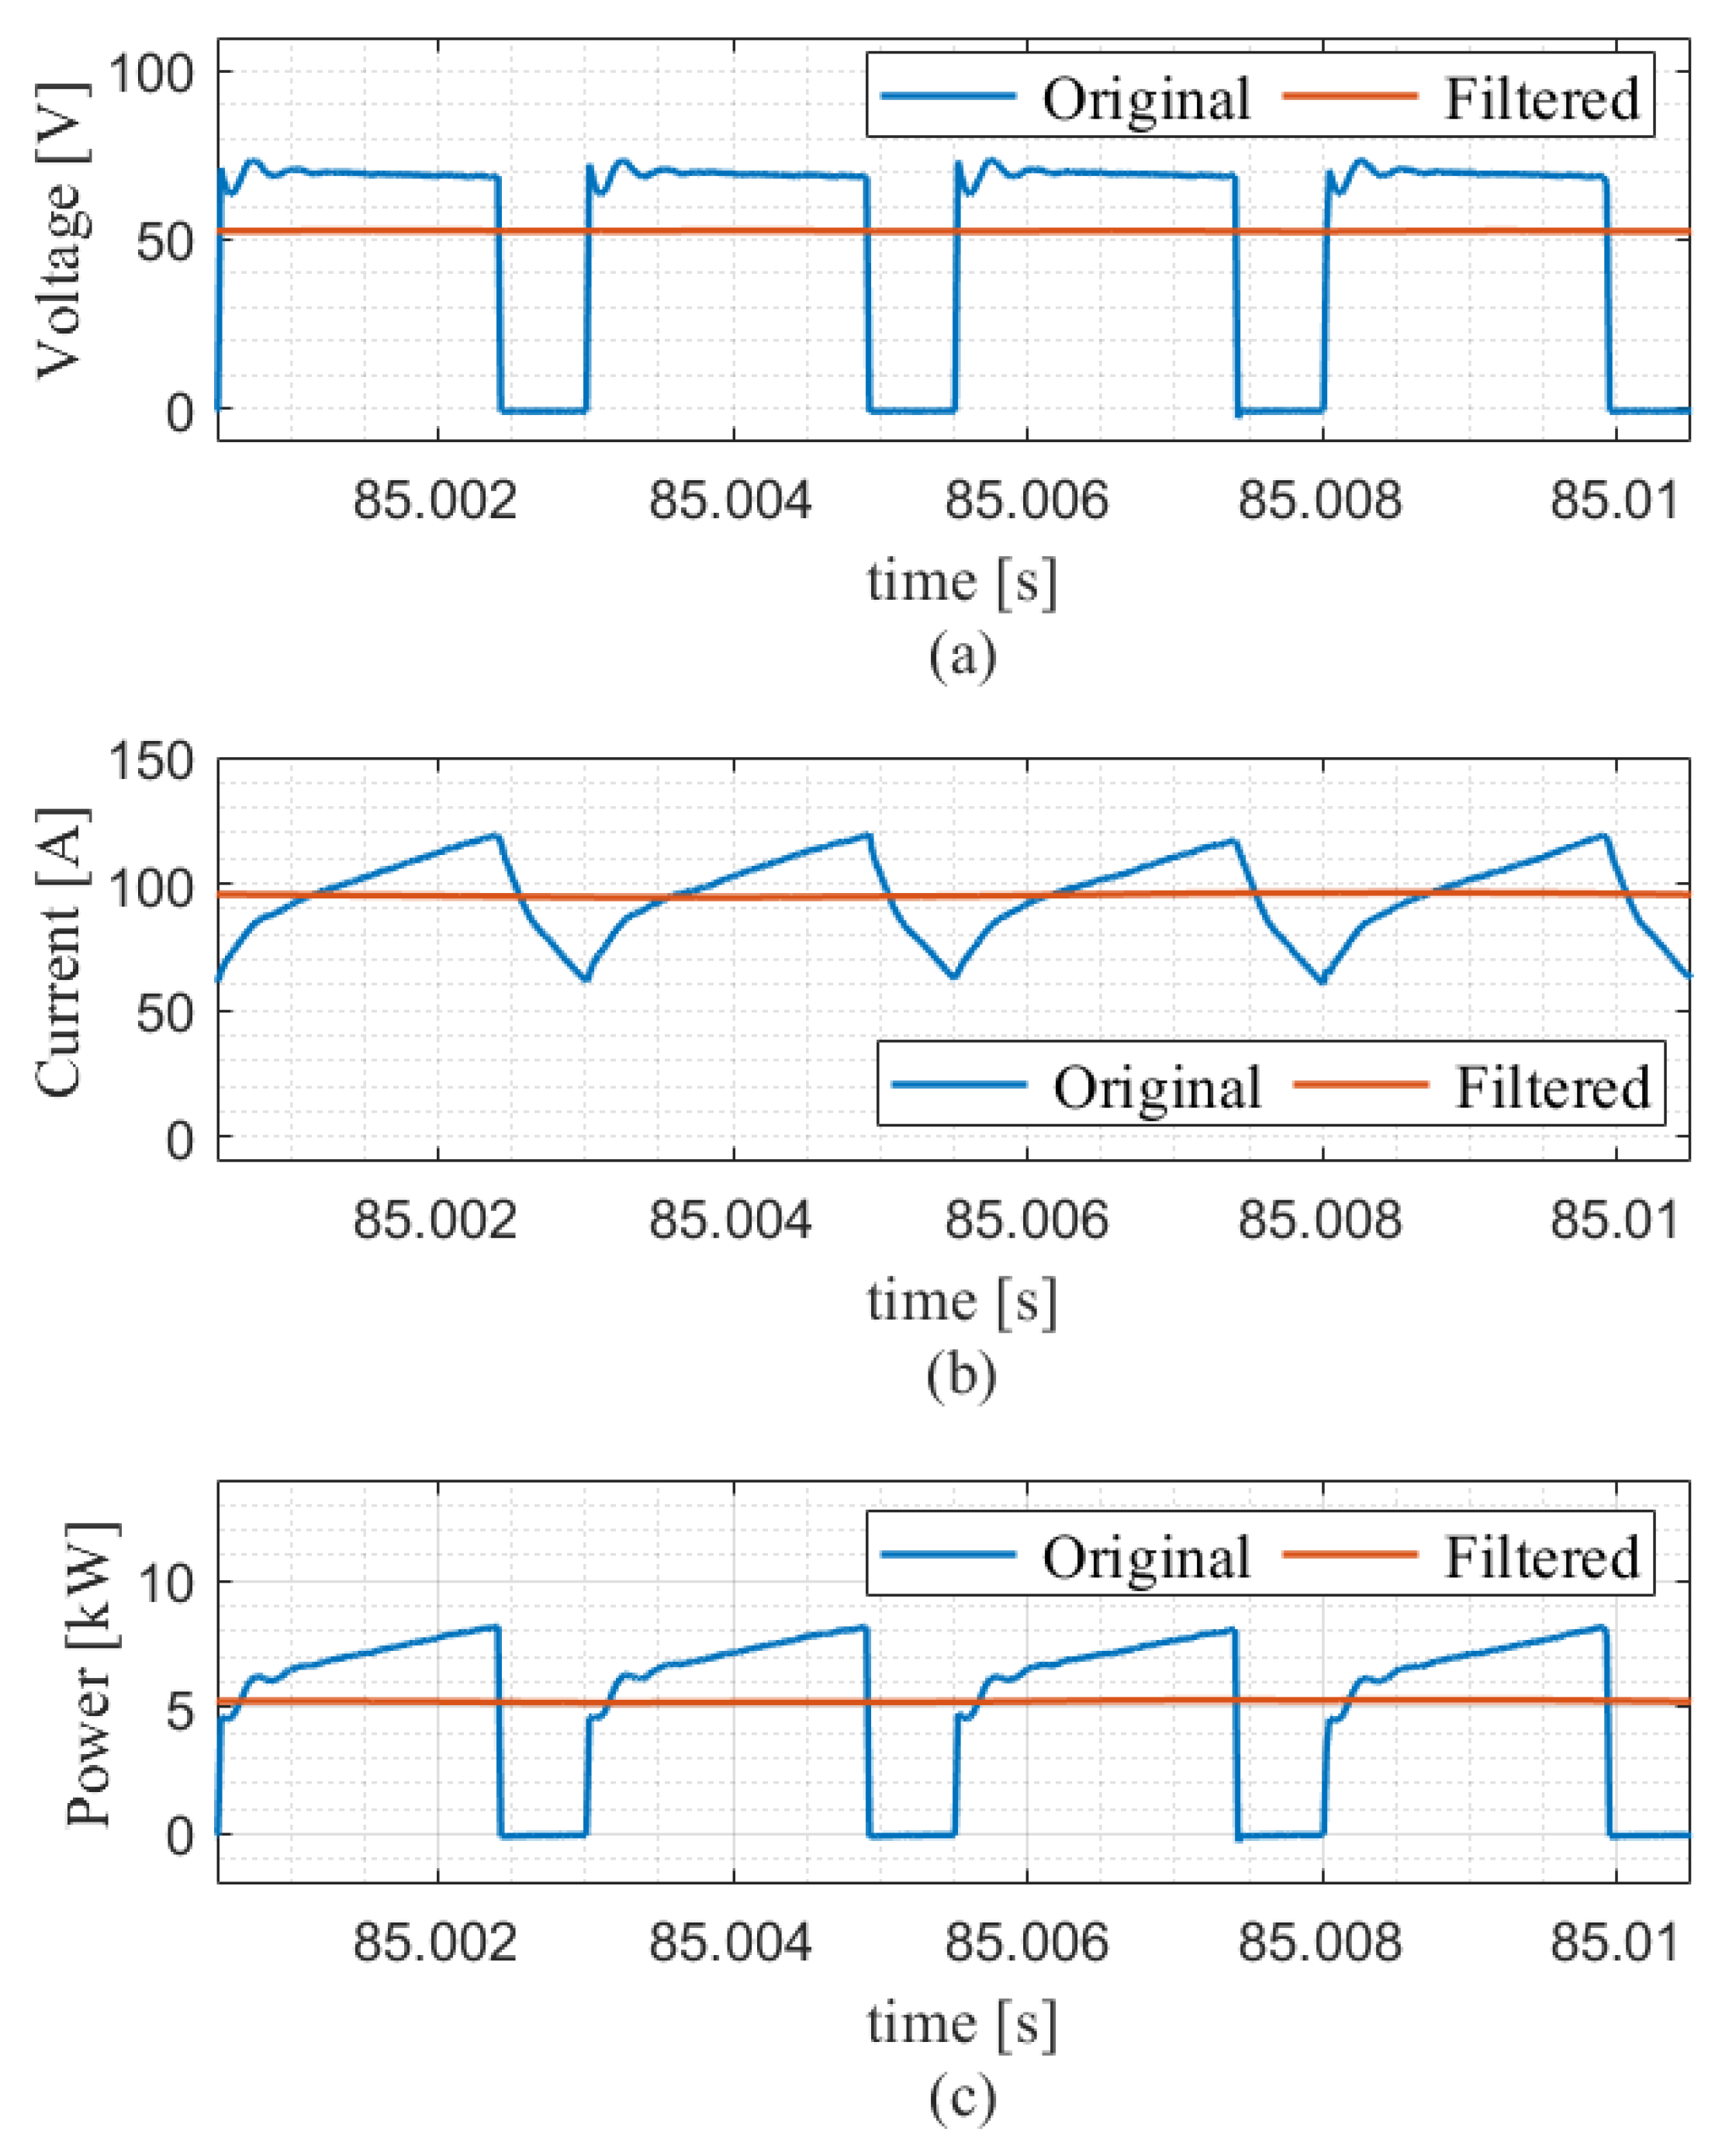
2.3. Data Conditioning

Once all the experimental tests were performed, the next step was the data conditioning. Figure 4 shows the resulting signals of voltage, current, and power before and after filtering during the lifting of a load weight of 500.5 kg. Figure 4a shows that voltage signal is modulated by pulses resulting in a sawtooth current waveform (Figure 4b) with continuous operation (current does not drop to zero). Figure 4a also shows that the DC–DC converter modulation has a period of 2.5 ms and for this example the duty cycle is around 80%. It should be noted that similar tests were performed (not shown) for the traction and power steering system showing the same modulation period for their corresponding DC–DC converters.
The power signal shown in the Figure 4c was obtained by direct multiplication of voltage and current. As expected, the resulting power signal exhibits an oscillatory waveform, with peak values reaching approximately 8.2 kW. Due to the oscillations observed across all signals, it was necessary to filter them all to get a representative value for easier interpretation. Specifically, a fifth-order Butterworth low-pass filter with a cutoff frequency of 125 Hz was implemented.
To better illustrate the effect of the selected low-pass filter, Figure 5 shows the voltage, current, and power signals over a full 20 s lifting cycle. This extended view complements the previous zoomed-in version (Figure 4) to observe that the filtered signals maintain a smooth and consistent profile, capturing the essential dynamics of the lifting process while eliminating high-frequency noise caused by high-frequency PWM switching. This figure confirms that the selected cutoff frequency preserves the slow-varying components relevant to mechanical motion of the lifting system. This filtering method ensures a robust and interpretable signal, suitable for further load estimation analysis.

3. Results

This section summarizes the results of the experimental data collected after the signal conditioning process described in the previous section.

3.1. Energy Boxplot

As mentioned in Section 1, the patent described in [30] proposes a methodology where the electrical energy is measured during the lifting operation of a pallet truck to estimate the weight of the lifted load based on a linear function of the energy consumed in the process. Considering this approach, in this section the first step is to visualize the relation between the demanded energy and the lifted weight for the electric forklift used in this study. It is important to note that, compared with the electric forklift, a pallet truck has a lower lifting capacity and is limited to lifting the load just enough to clear the floor, without the ability to stack or operate at height. Thus, electric forklifts are used in more demanding applications requiring vertical load movement and greater capacity, whereas pallet trucks are ideal for short-range, low-height material transport. Figure 6 presents a boxplot showing the energy demanded by the LM (in kWs or equivalently kJ) during the load lifting process performed by the electric forklift, as a function of the lifted weight (in kg). Each box illustrates the variability in energy demand for a specific weight, highlighting the median (red line), interquartile range (box limits), and extreme values (whiskers). Although there is a general trend of increasing energy consumption with increasing weight, the relationship is not linear. There are weight ranges where energy demanded shows high dispersion or even decreases compared to the previous weight level. Specifically, for weights above 800 kg, energy consumption does not follow a clear increasing pattern. Overall, the figure indicates that there is no direct linear relationship between the lifted weight and the energy demanded, highlighting the need for a more detailed analysis.
To clarify this behavior, Figure 7 shows LM power demand plots during vertical lifting of 800.5 kg, 1002.5 kg, and 1202.0 kg loads, each raised to a height of 2 m. This figure provides deeper insight into the power demand dynamics during lifting operations at higher load levels. By examining the instantaneous power profiles, it is possible to identify fluctuations, peak values, and the overall energy demanded by the LM, that may explain the non-linear relationship observed between energy consumption and lifted weight in Figure 6. Figure 7 displays the instantaneous demanded power in kW as a function of time in s, along with the total energy consumed (E) during the lifting process. This figure shows that the energy required to lift the load depends not only on the weight but also on the lifting time (or lifting speed). In subplot (b), the 1002.5 kg load is lifted more quickly, resulting in a peak power around ~10 kW and lower total energy consumption of 93.1 kJ. In contrast, subplot (a) shows a lower peak power (~8.3 kW) but with a higher energy demand of 107.1 kJ due to a higher lifting time commanded by the operator. Figure 7c shows the highest peak power (up to 12 kW) but with the longer lifting time, indicating that the higher demanded energy (140.0 kJ) is mainly due to the higher load weight lifted (1202.0 kg). These plots support the conclusion that lifting speed commanded by the operator greatly influences the efficiency of the electro-hydraulic lifting system governed by the LM. A faster lifting speed may reduce the energy required even for higher load weights (as shown in Figure 7b), which explains the non-linear relationship between load weight and energy consumption observed in Figure 6. Therefore, lifting speed significantly influences the overall energy performance (i.e., energy efficiency) and should be considered in any load weight estimation strategy.

3.2. Lifting Energy and Efficiency

This section presents the methodology and results related to the evaluation of the energy efficiency during the load lifting process in the electric forklift. Figure 8 provides a detailed overview of the energy conversion architecture involved in the lifting system, including the measurement points for voltage and current signals captured by the D&Q equipment, as well as the energy transformation stages—from the buck converter output to mechanical lifting via the electro-hydraulic system. The schematic highlights the flow of energy through main components such as the DC motor, hydraulic pump, piping, lifting cylinders, mast, and fork. This representation also clarifies the use of electrical power (voltage × current) as a reliable indicator that integrates the net effect of all intermediate conversion efficiencies. The positioning of the sensing equipment ensures that measurements reflect the electrical input to the motor, which drives the entire lifting subsystem.
Energy losses across the electro-hydraulic lifting system significantly affect the overall efficiency of the load-lifting process. The brushed DC motor used in the forklift typically exhibits moderate efficiency, ranging between 80 and 85%, meaning that most of the electrical input is successfully converted into mechanical energy to drive the hydraulic gear pump. However, the subsequent conversion of mechanical to hydraulic energy introduces further losses. Hydraulic gear pumps have an overall efficiency ranging from 60 to 90%, which depends on the operating pressure and speed. When operating at low pressure and low speed, a gear pump has an inefficient operation [9]. Once hydraulic energy is transmitted through the piping to the lifting cylinders, additional losses occur. Hydraulic cylinder efficiency can reach approximately 90% (particularly at operating speeds above 0.05 m/s), with losses due to friction in seals and guide elements. Finally, more significant mechanical losses take place in the mast assembly, including friction in sliding elements, the fork carriage, chains, bearings, and the dead weight of the fork structure itself. Combined, these losses contribute to a significant reduction in the total energy transferred from the electrical input to effective vertical lifting motion. The overall lifting efficiency, denoted as η l , can be approximated by the product of the efficiencies at each stage of the energy conversion chain:
η l η motor · η hyd · η cyl · η mech
Here, η motor refers to the DC motor efficiency, η hyd accounts for losses in the hydraulic pump, piping, and valves, η cyl represents the efficiency of the lifting cylinder, and η mech corresponds to mechanical losses in the mast assembly. For aged equipment, assuming η motor = 0.80 , η hyd = 0.60 , η cyl = 0.90 , and η mech = 0.40 , the overall lifting efficiency is estimated as follows:
η l 0.80 × 0.60 × 0.90 × 0.40 = 0.1728
This implies that only about 17.3% of the electrical power input is ultimately converted into useful mechanical lifting work, with the remaining energy lost throughout the conversion chain.
Now, considering the measured data, the lifting efficiency can be defined as the ratio between the potential energy of the load ( E p l ) and the electrical energy consumed ( E e l ) during the lifting operation.
The potential energy was computed using the classical mechanical expression:
E p l = m · g · h
where m is the mass of the load (in kilograms), g = 9.81 m / s 2 is the gravitational acceleration, and h = 2 m is the lifting height, which remained constant in all tests.
The electrical energy consumed ( E e l ) during each lifting cycle was measured using a high-resolution data acquisition system that recorded voltage and current signals throughout the operation. These signals were subsequently processed and filtered to remove high-frequency transients. This signal conditioning ensured accurate computation of E e l , as well as the extraction of representative values of average and median electric lifting power—denoted as P el-avg and P el-med , respectively—derived from the instantaneous power profiles of the lifting motor captured during each test.
To assess the relationship between lifting efficiency and electrical behavior, a total of 55 tests were initially considered, as summarized in Table 1. However, two tests (one corresponding to load weight of 1002.5 kg and other to 1100.0 kg) were excluded from the analysis due to their classification as outliers. As a result, the final dataset included 53 lifting tests conducted under varying load conditions. For each test, the lifting efficiency was computed as follows:
η l = E p l E e l
Table 2 shows the lifting test results, including average and median power ( P e l a v g and P e l m e d , respectively), electrical and potential energy ( E e l and E p l , respectively), and calculated lifting efficiency η l .
Figure 9 shows the lifting efficiency as function of both P e l a v g and P e l m e d . This figure shows that the lifting efficiency ranges from approximately 7% to 25%, and tends to increase with higher power levels. This trend suggests that, among the different sources of losses, the hydraulic gear pump is the only component whose efficiency can improve with increased power due to reduced relative leakage at higher pressures and speeds [9]. In contrast, losses in the DC motor and mechanical components are generally expected to rise with greater power demand, making their contribution to efficiency relatively constant or decreasing. Therefore, the observed increase in overall efficiency with power is likely driven by the behavior of the hydraulic subsystem under varying load conditions.
Two correlation analyses were performed to examine the relationship between lifting efficiency and electrical power demand. Figure 9a shows the results using the mean electrical power P e l a v g , where a moderate linear correlation was observed ( R 2 = 0.756 ). However, as shown in Figure 9b, when the median electrical power P e l m e d was used instead, the linear relationship improved significantly ( R 2 = 0.832 ).
These findings suggest that the median power is a more robust indicator of the power demand during lifting, as it is less affected by local fluctuations and transients commonly present in raw power signals. The analysis further reveals that the underlying data distribution is asymmetric, making the median a more reliable measure of central tendency than the mean, which can be skewed by extreme values and thus provide a distorted representation.
In addition to the previous analyses, a third correlation study was conducted, this time using a multidimensional approach. In this case, both the median electrical power ( P el med ) and the average lifting speed ( V l a v g ) were considered as explanatory variables to improve the estimation of lifting efficiency. The variable V l a v g was computed as the ratio between the fixed lifting height and the effective lifting time extracted from the instantaneous power signals. Specifically, the lifting time is defined as the interval starting when the power signal rises from zero (as the LM starts lifting the load) and ending when power signal falls back to zero as the LM stops. This approach provides a richer representation of the lifting dynamics and enables the integration of kinematic and electrical information to enhance model accuracy. The V l a v g values for each lifting event are shown in Table 2, and do not require any additional physical sensors for their computation.
Figure 10 shows the results of the third correlation analysis using a multidimensional regression surface. The blue markers represent the measured lifting efficiency values ( η l ) as a function of the median lifting power ( P e l m e d ) and the average lifting speed ( V l-avg ). A second-order polynomial surface was fitted to the data, capturing the non-linear interactions between the two variables. The resulting regression model is expressed as follows:
η ^ l = a 0 + a 1 x + a 2 y + a 3 x 2 + a 4 x y + a 5 y 2
where x = P e l m e d and y = V l a v g . Table 3 lists the numerical values of the regression coefficients a n corresponding to the second-order polynomial model shown in Equation (3). These coefficients were obtained through a least squares fitting procedure using the experimental dataset of 53 lifting events.
The fitted model yielded an adjusted coefficient of determination of R adj 2 = 0.9326 , indicating excellent agreement between the predicted and actual efficiency values. These results confirm that incorporating both electrical and kinematic variables leads to a significantly more accurate and robust characterization of the lifting efficiency.

3.3. Estimation of Load Weight

This section presents a methodology for estimating the transported load weight in an electric forklift based on the electrical power measured at the lifting motor. The proposed approach leverages the relationships previously established between lifting power, lifting efficiency, and load weight.
The estimation process follows these steps:
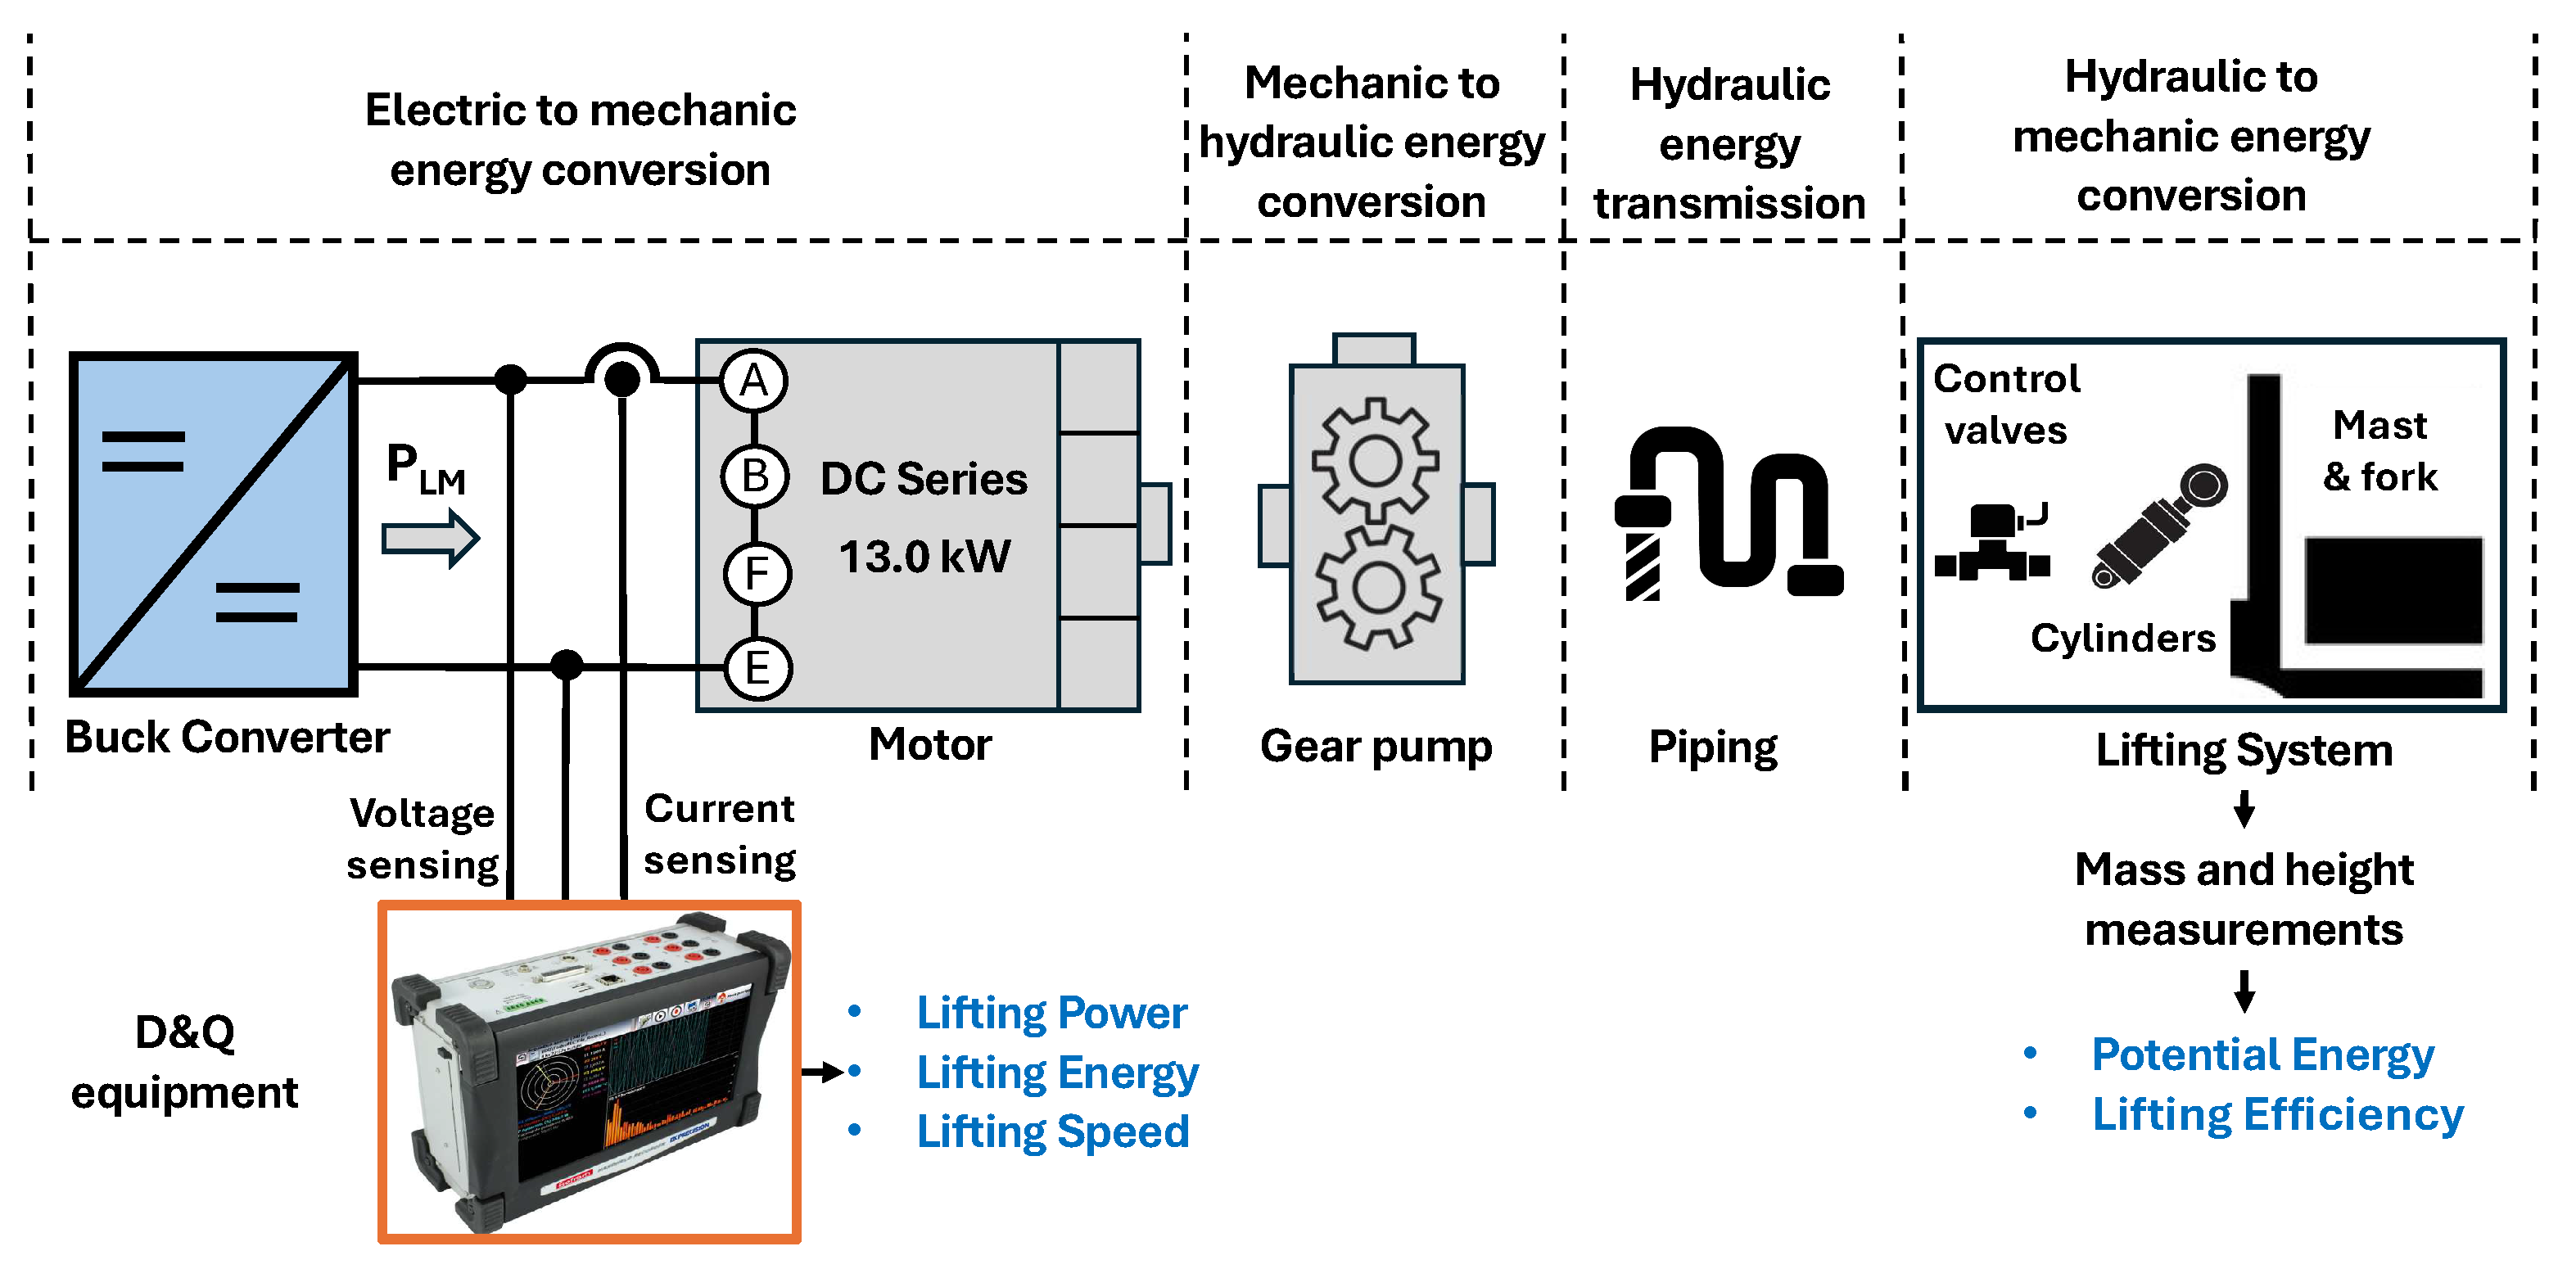
  • Measurement of lifting power and energy: The instantaneous power at the lifting motor is recorded during the lifting cycle. From this signal, three important variables are extracted: the electrical lifting energy ( E e l ), the median electric lifting power ( P el-med ), and the average lifting speed ( V l-avg ). These metrics are required inputs for the following stages.
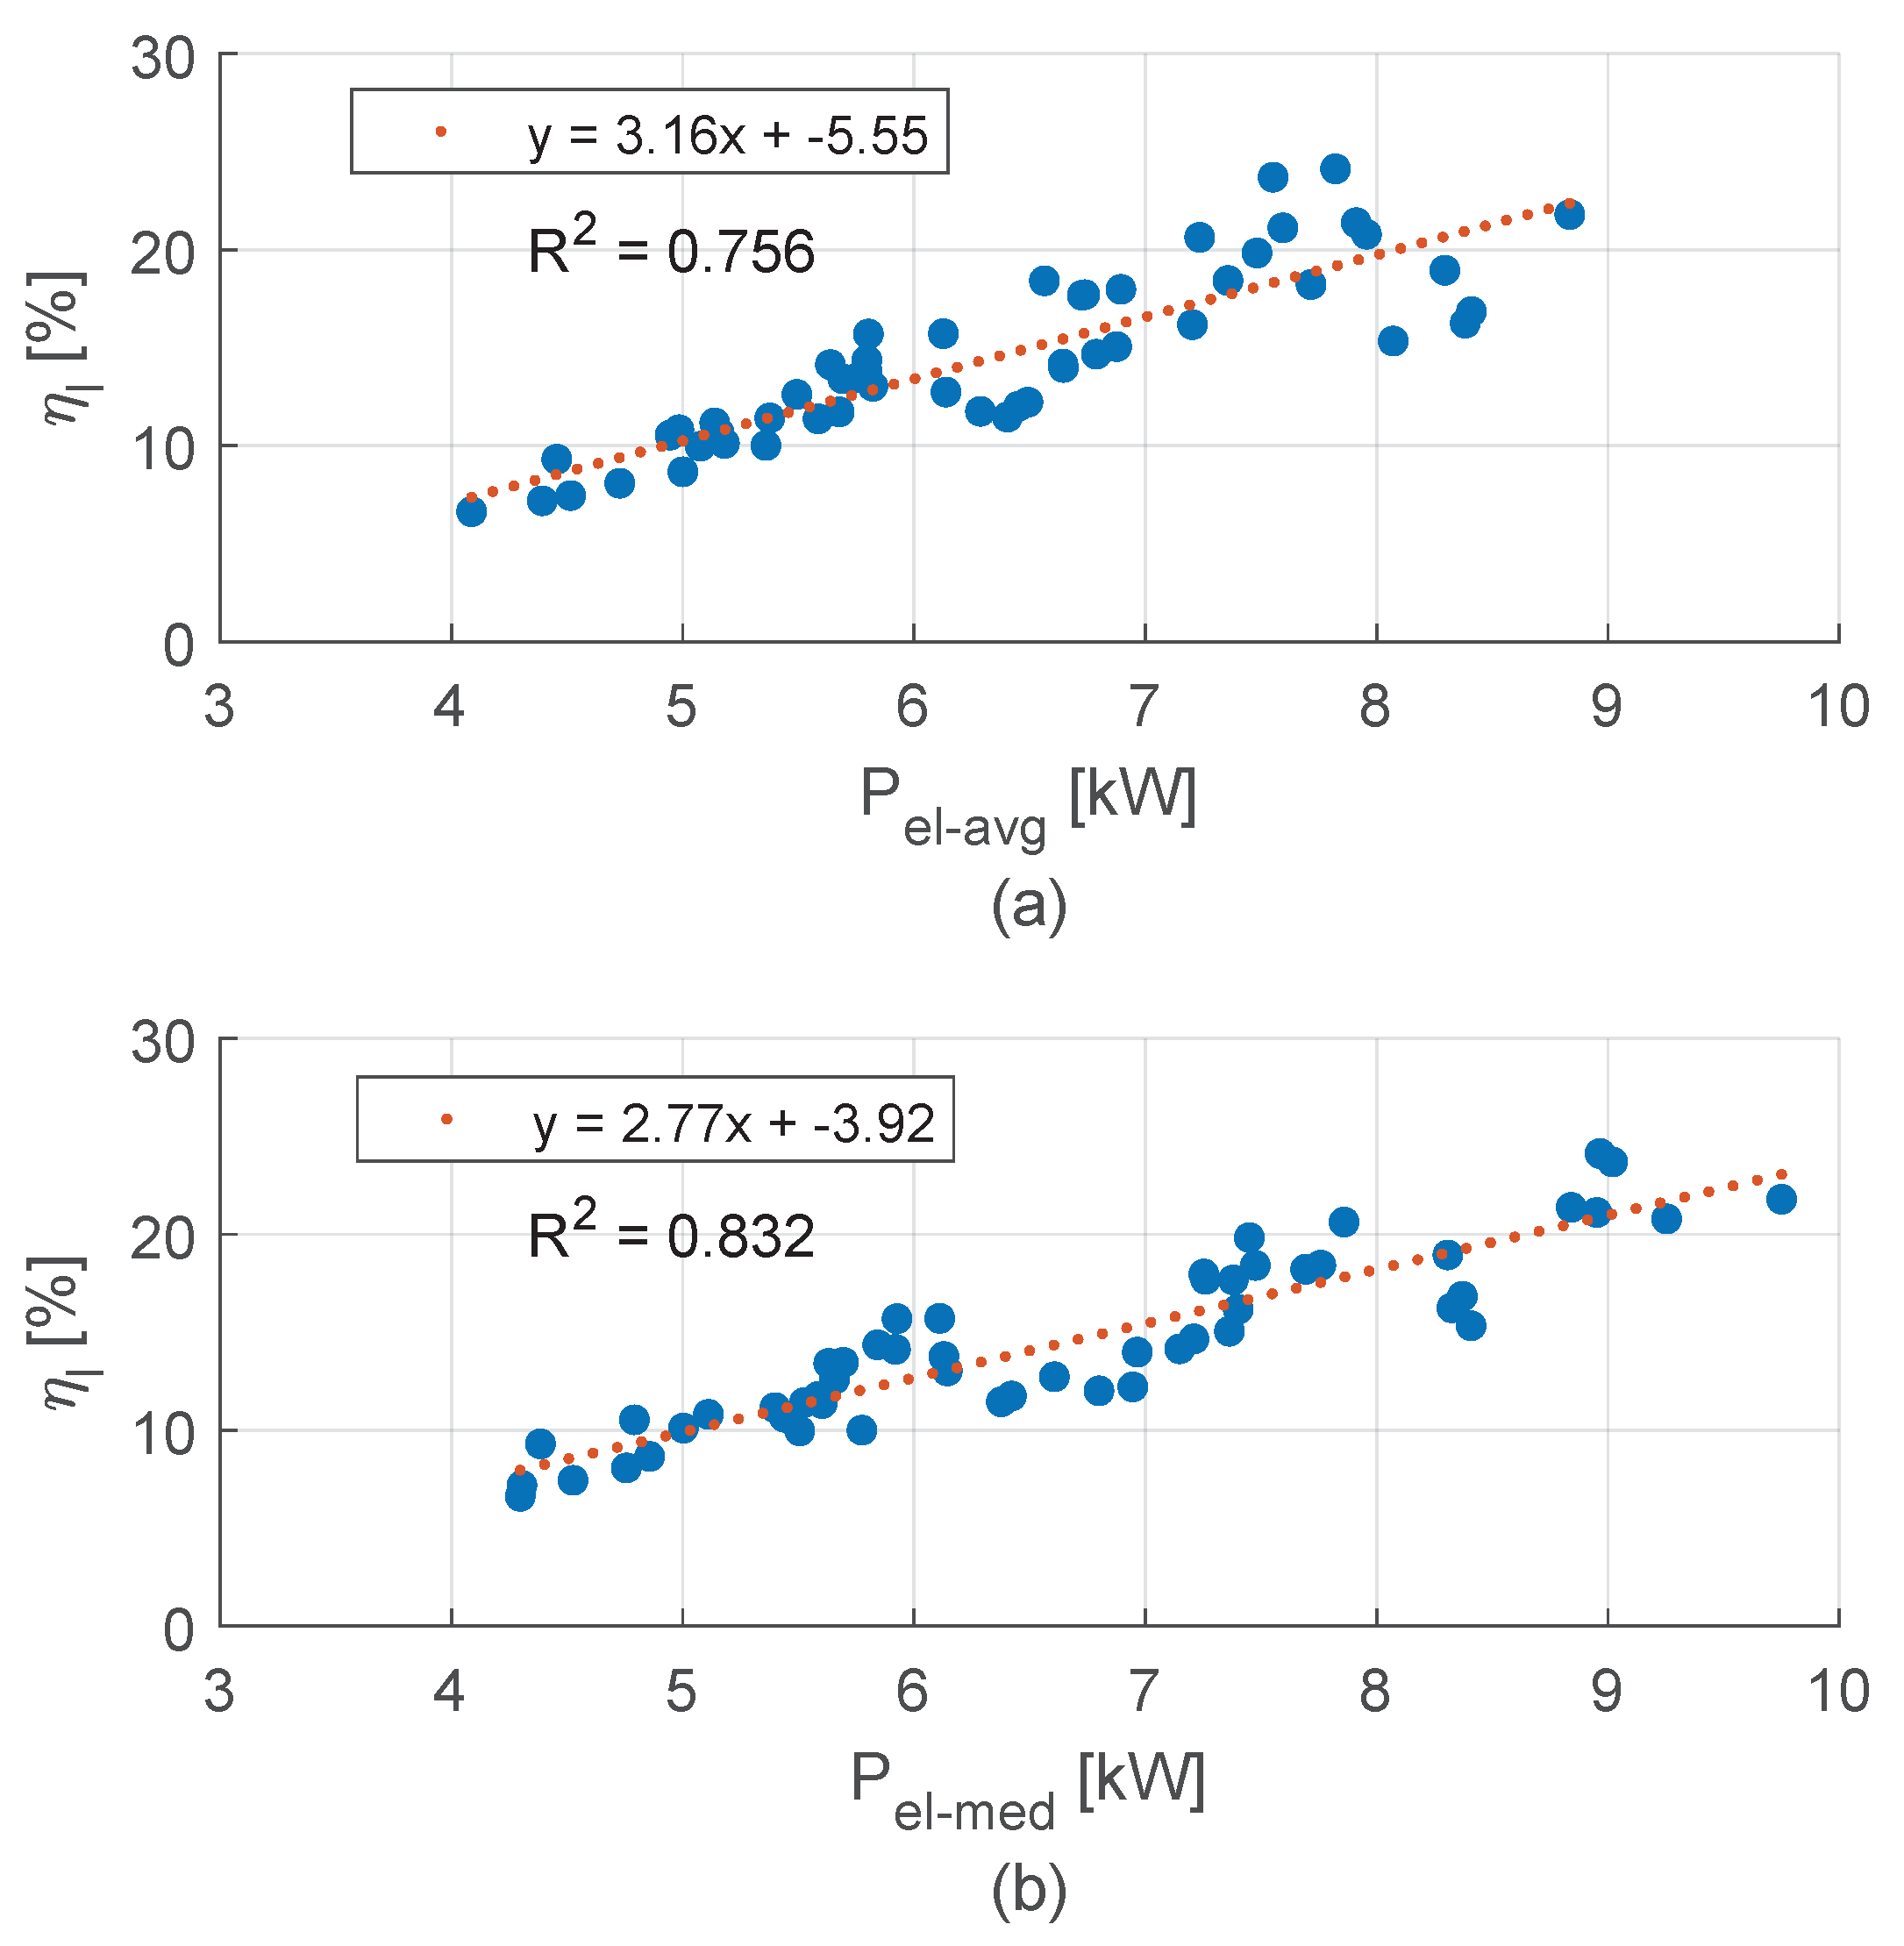
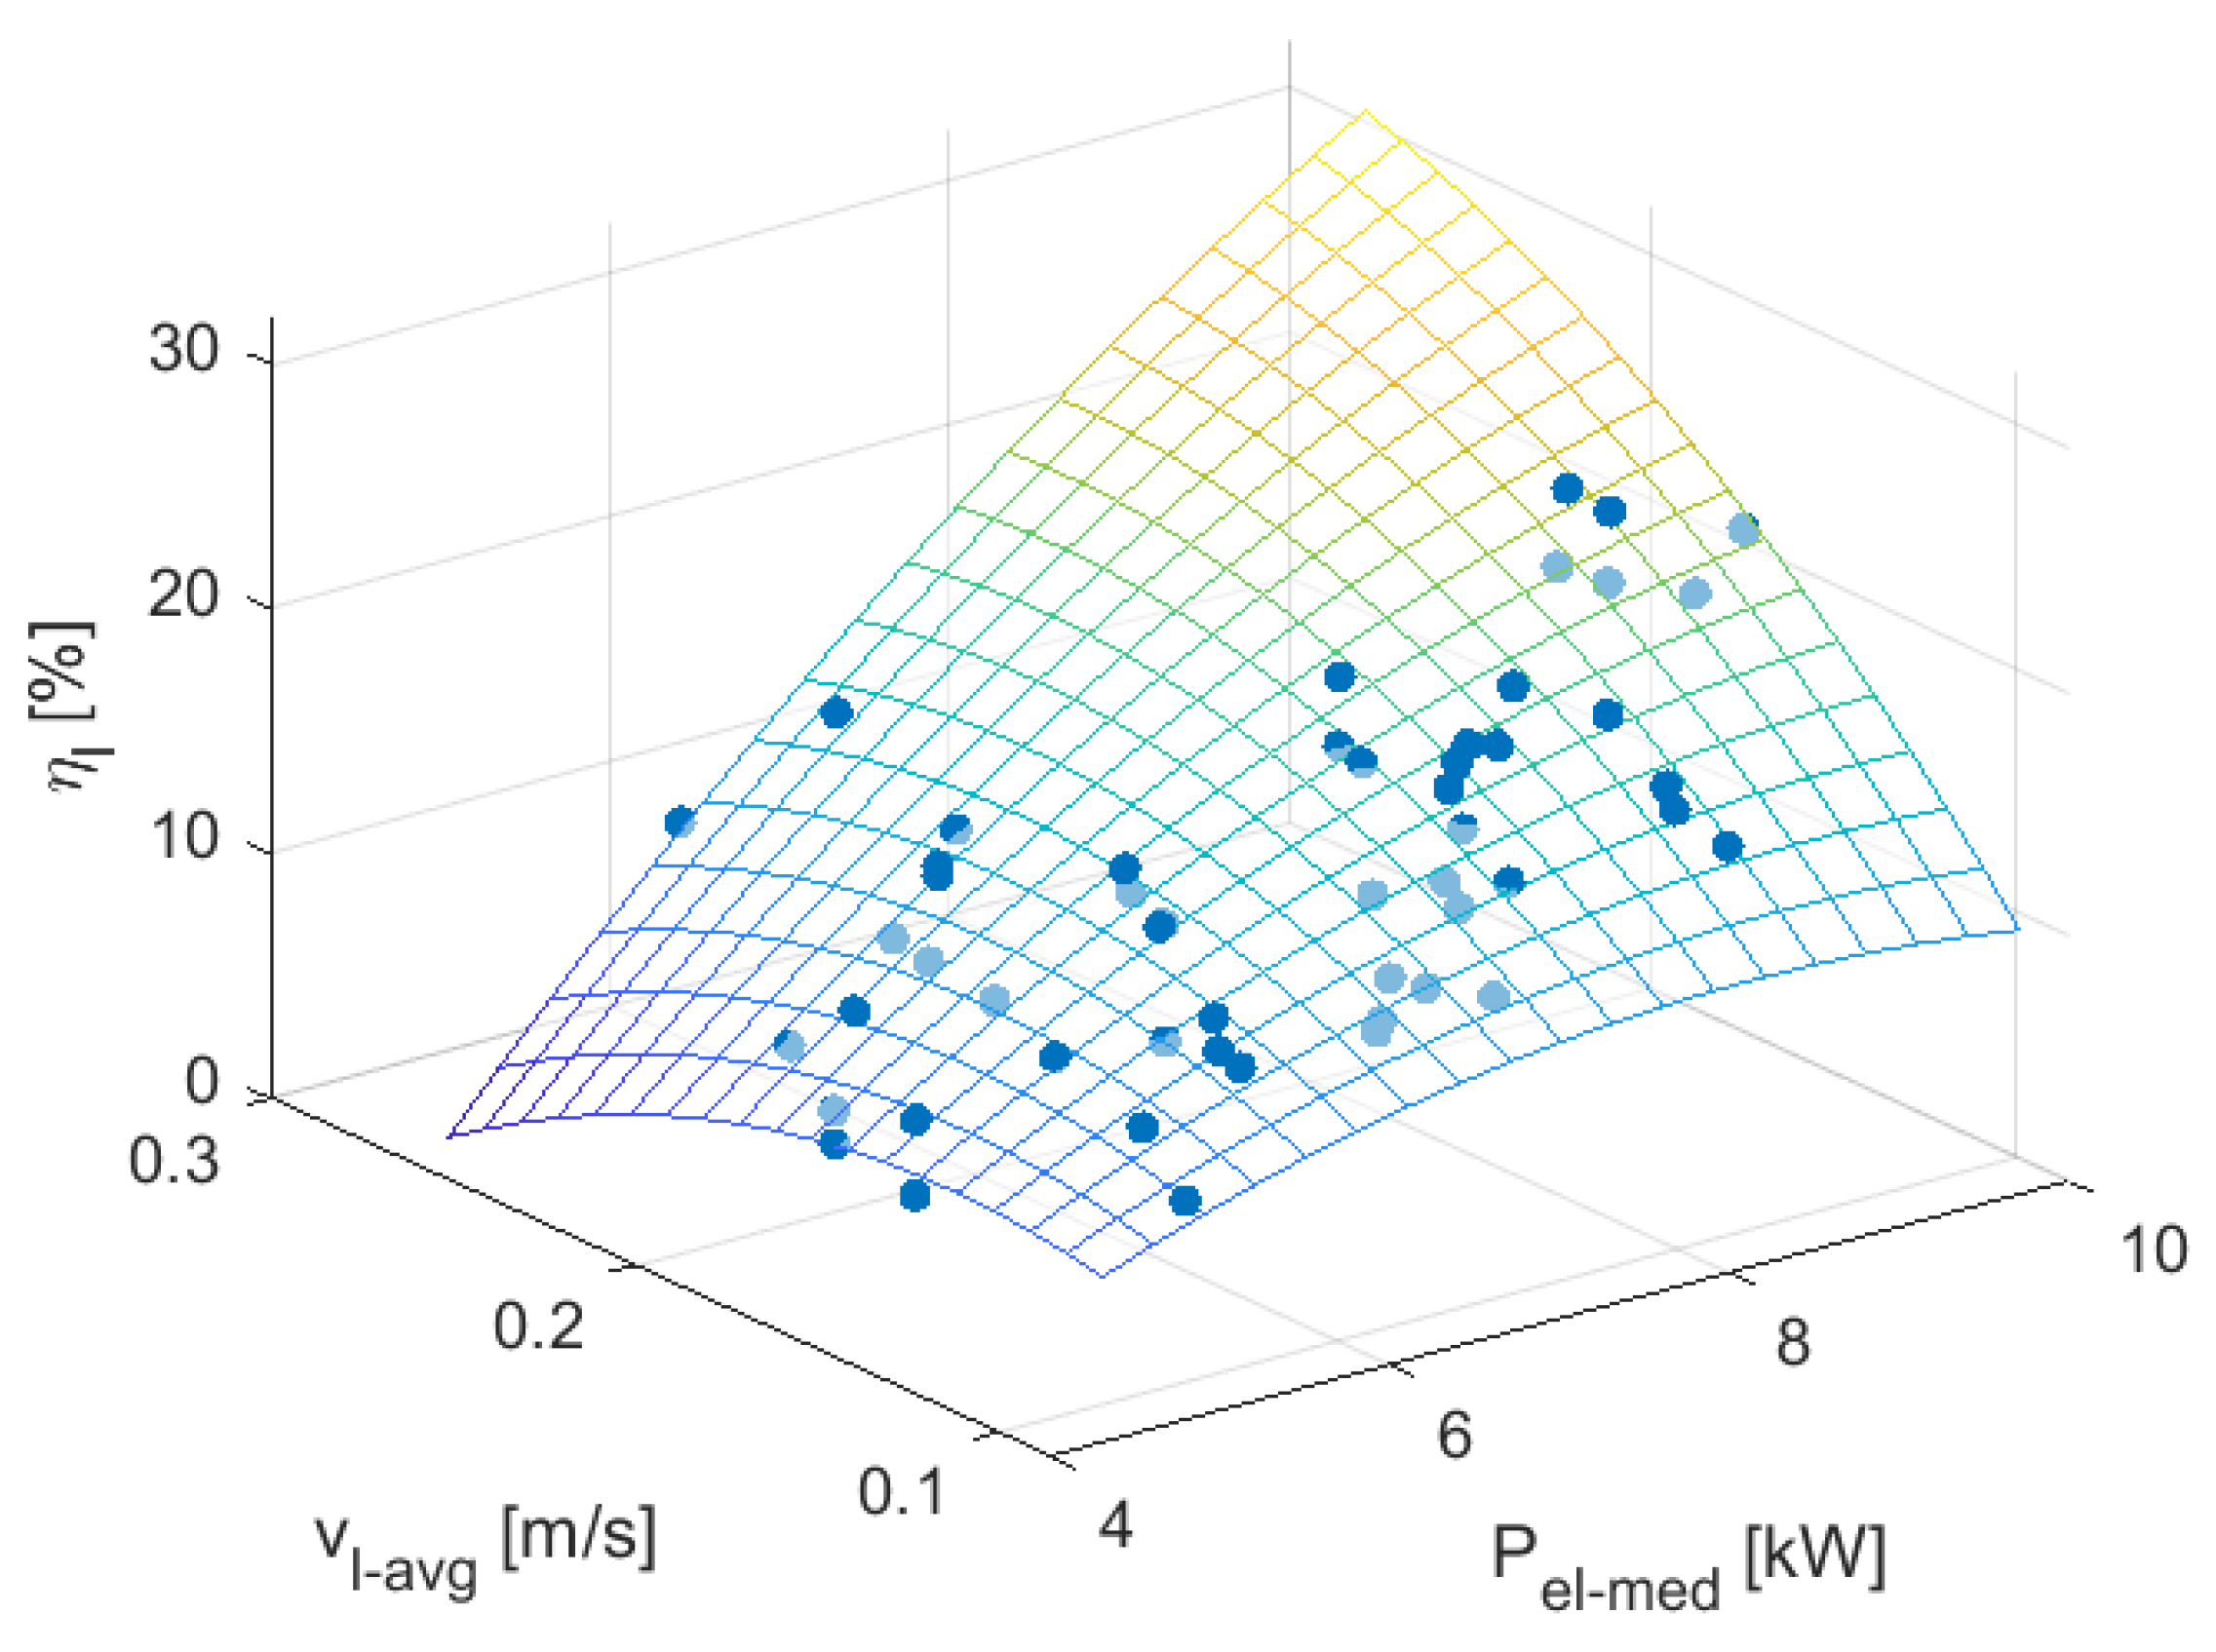
  • Estimation of lifting efficiency: The lifting efficiency is estimated using either the linear or the multivariable regression model derived in the previous section. In the linear case, efficiency is expressed as a function of the median lifting power only. In contrast, the multivariable model incorporates both the median lifting power and the average lifting speed to capture the combined effect of electrical and kinematic variables. When the linear approximation is used, the following model is applied:
    η l ^ = a · P el-med + b
    where a and b are regression coefficients obtained from the empirical data. In this case a = 2.77 b = −3.92.
    In the case of the multivariable approximation, the following model is applied:
    η ^ l = a 0 + a 1 P e l m e d + a 2 V l a v g + a 3 P e l m e d 2 + a 4 P e l m e d V l a v g + a 5 V l a v g 2
    where Table 3 shows the numerical values of the regression coefficients a n .
  • Estimation of potential energy: The estimated potential energy ( E ^ p l ) is then computed by rearranging the definition of lifting efficiency:
    E ^ p l = η l ^ · E e l
    where E e l is the electrical energy measured during the lifting cycle (step 1).
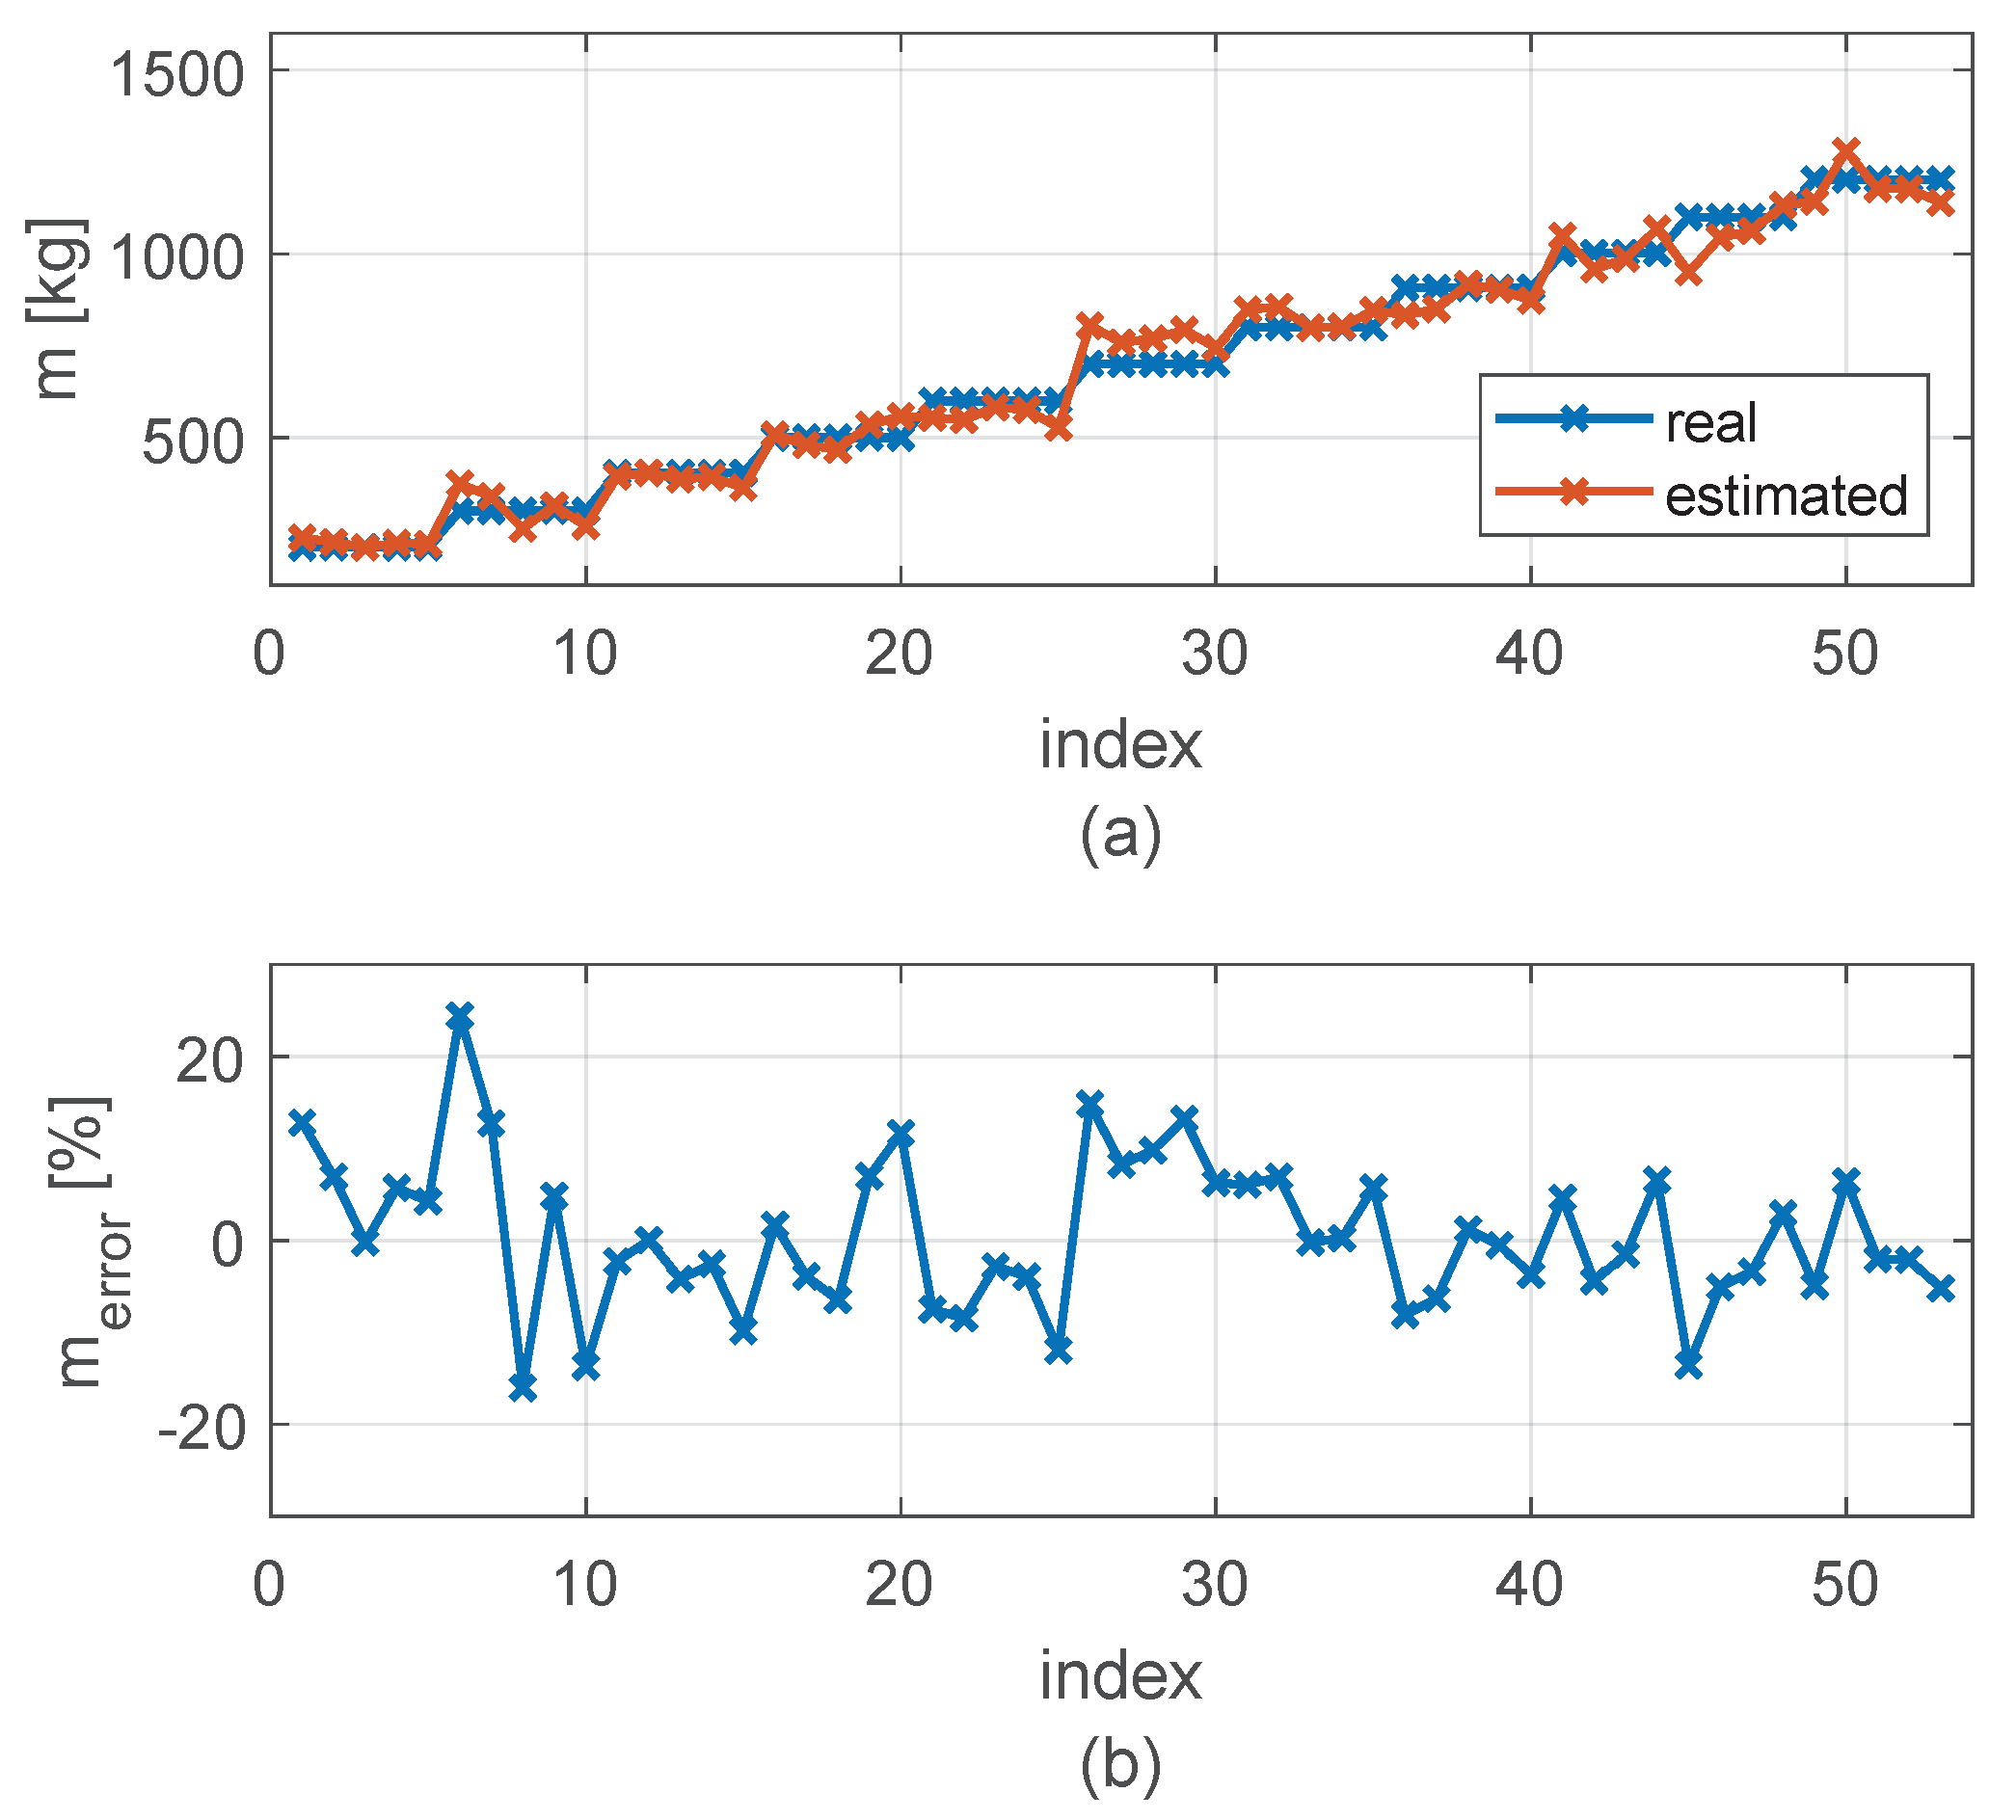
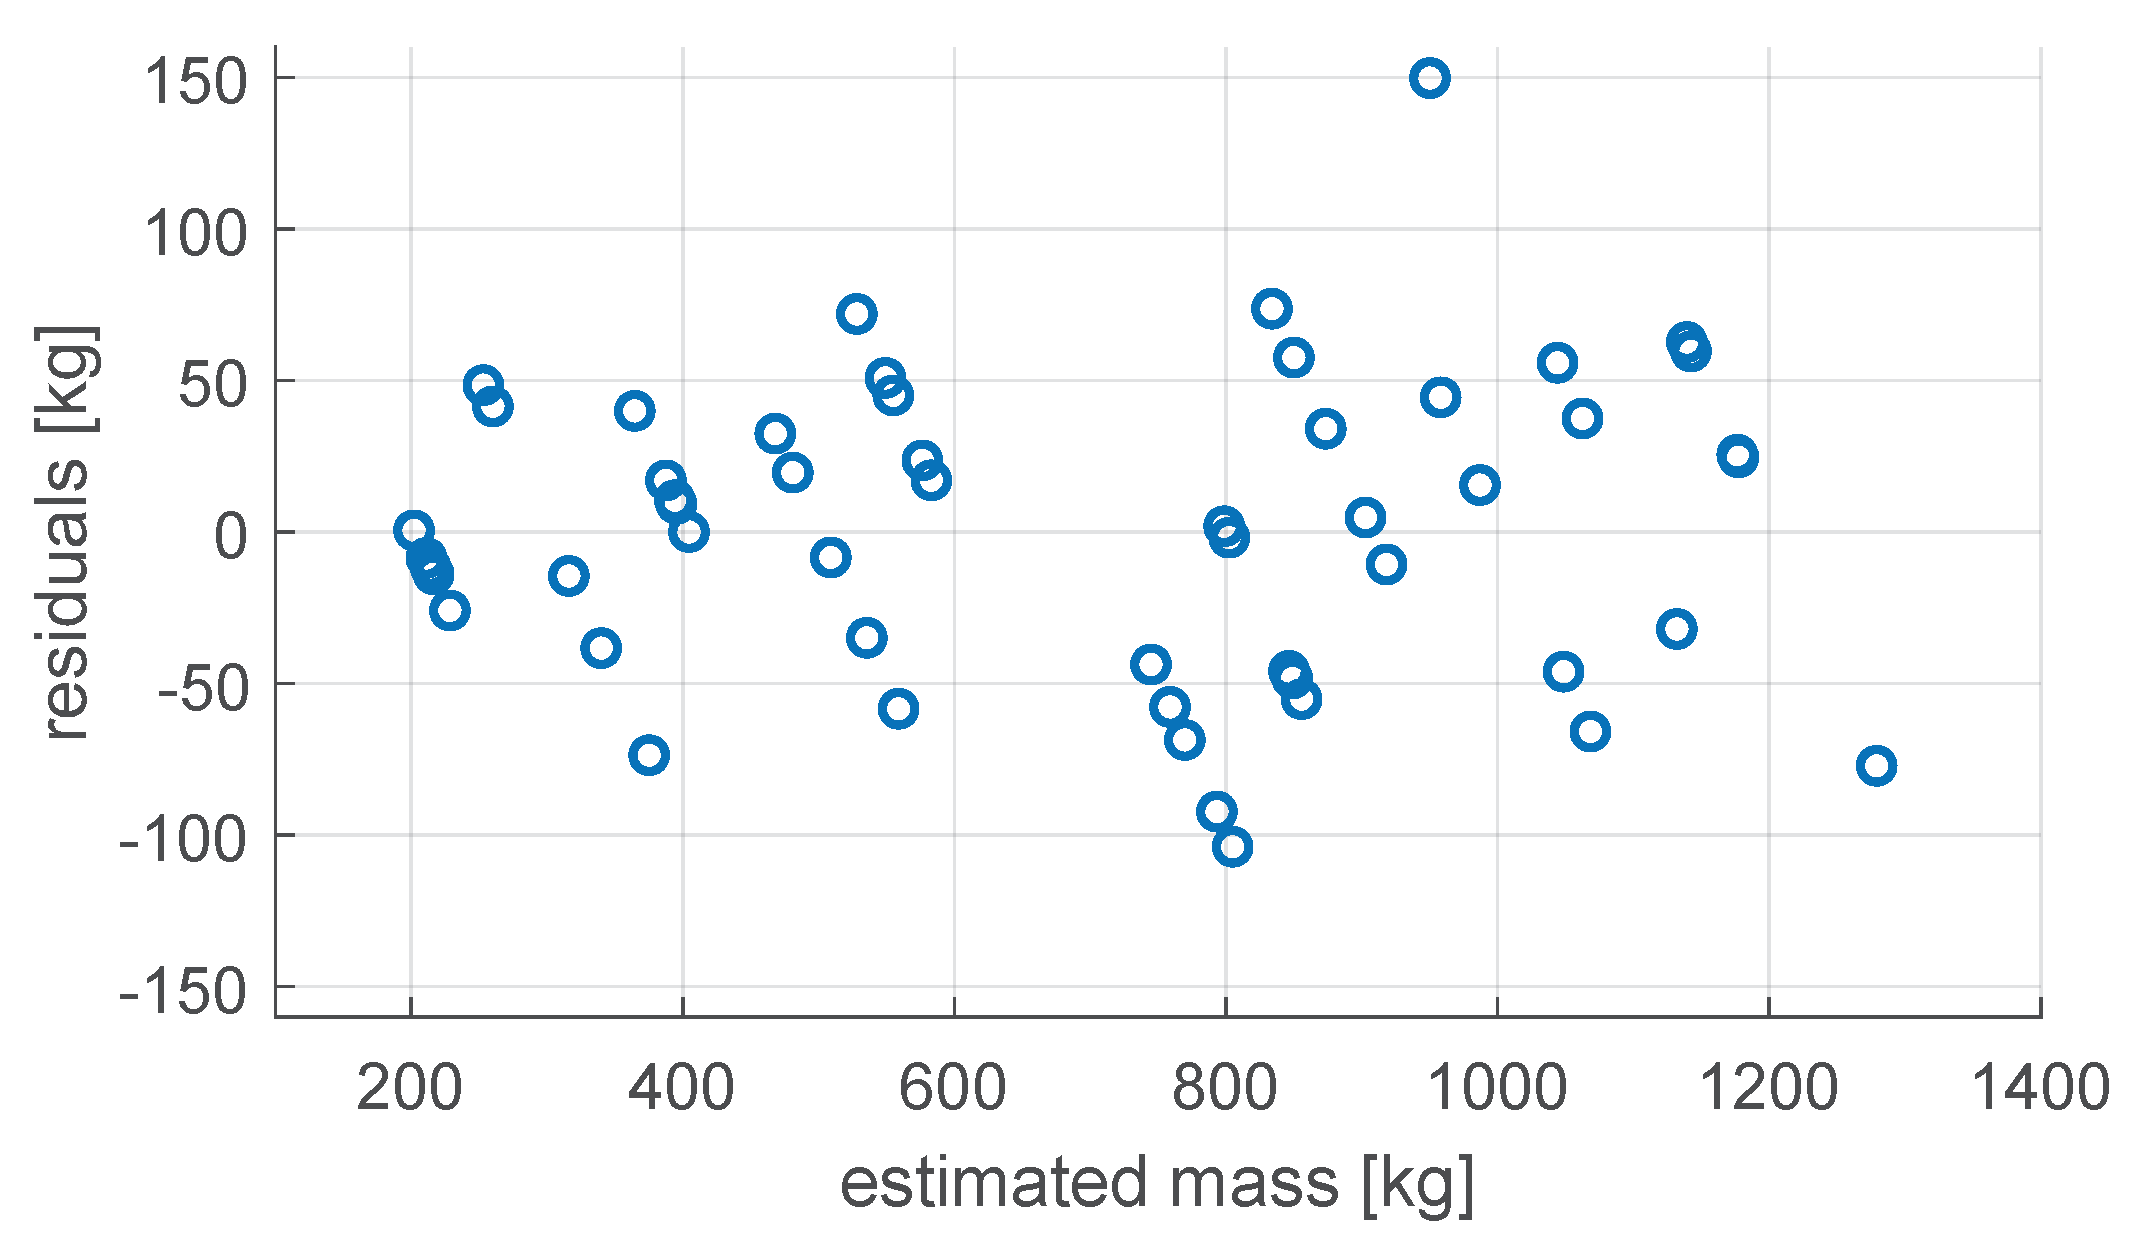
  • Estimation of transported mass: From the estimated potential energy, the estimated transported mass ( m ^ ) is derived using the gravitational energy equation:
    m ^ = E ^ p l g · h
    where h is the fixed lifting height used in step 1 ( h = 2 m in this case).
Initially, a linear approximation model was used to estimate the lifting efficiency as a function of the median electrical power. Figure 11a presents a comparison between the actual transported mass and the estimated mass for each lifting event indexed from 0 to 53, indicating that the estimated values closely follow the real data across various load conditions. Figure 11b displays the percentage error for each test case, revealing a generally consistent performance.
The results confirm that the methodology is effective for indirect estimation of the transported load using only electrical power signals. The maximum error reached nearly +26%, indicating overestimation for a load weight of 1202 kg, while the minimum estimation error observed was approximately −0.23% (underestimation) for a real load of 500.5 kg. The mean absolute percentage error (MAPE) was 10.6%, demonstrating that the method provides sufficiently accurate results for practical applications, without requiring physical load sensors. The MAPE is calculated as follows:
MAPE = 100 n i = 1 n m ^ i m i m i
where m ^ i is the estimated mass, m i is the actual mass, and n is the total number of lifting events evaluated.
While the single-variable approach yielded satisfactory results, its accuracy was limited by the inherent variability of the lifting conditions. To address this issue, a second, more accurate model was developed using a multivariable regression that incorporates both the median electrical power and the average lifting speed. Figure 12a presents a comparison between the actual transported mass and the estimated mass for each lifting event indexed from 0 to 53, indicating that the estimated values closely follow the real data across various load conditions. Figure 12b displays the percentage error for each test case, revealing a generally consistent performance.
This multidimensional approach significantly improved estimation performance, providing a more robust and accurate characterization of the lifting efficiency under diverse operating conditions. The maximum error reached nearly +24.43%, indicating overestimation for a load weight of 301.5 kg (index 6), while the minimum estimation error observed was approximately +0.0055% (underestimation) for a real load of 404.5 kg (index 12). The mean absolute percentage error (MAPE) was 6.4%, demonstrating that the method provides improved accuracy for practical applications, without requiring physical load sensors.
To assess potential overfitting of the multivariate regression model and evaluate key assumptions such as unbiasedness, homoscedasticity, and independence of errors, a residual analysis is conducted. Figure 13 presents the plot of residuals versus fitted mass values. The results show no discernible patterns or funnel-shaped dispersion, indicating that the variance in the residuals remains close to constant across the prediction range. Additionally, the mean of the residuals is 0.7 kg, which is close to zero, further supporting the assumption of an unbiased model and suggesting that overfitting is not a concern in this case.

4. Discussion

The proposed methodology for estimating the transported load in electric forklifts using electrical variables from the lifting motor has demonstrated promising results, with an MAPE of 10.6% in the case of linear regression and 6.4% in the case of multivariable regression. However, the estimation error exhibits significant variability across the tested events. This variability highlights the need for further refinement to improve the consistency and reliability of the estimations under different operational conditions.
It is important to emphasize that this study represents an initial step toward a novel research direction focused on sensorless load estimation in electro-hydraulic lifting systems. Unlike traditional approaches that rely on invasive, high-cost, and fragile load sensors installed on the forks, this method offers a non-intrusive and scalable alternative based solely on power signal analysis.
It is also important to mention certain considerations in the present study regarding battery and ambient temperature conditions, which may introduce variability in the results. It is well known that temperature affects the battery’s state of charge (SOC) and, consequently, the available voltage level. However, this is not expected to significantly impact the performance of the proposed estimation method. Although SOC variations do influence battery voltage, our methodology does not rely on voltage as a standalone variable. Instead, it uses electrical power—calculated as the product of voltage and current—as the primary input. For a given power demand from the lifting load, a decrease in SOC may lower the voltage, but this is inherently compensated by a corresponding increase in current. While increased current (and temperature) may slightly reduce the efficiency of the electric motor, the dominant energy losses in electro-hydraulic systems are typically mechanical rather than electrical. Therefore, the estimation methodology can be considered sufficiently robust to temperature and SOC fluctuations.
Additionally, the estimation accuracy may be influenced by operator behavior, such as inconsistent lifting speeds or partial load lifts, which introduce variability in power demand that is not necessarily related to the transported mass. While our method assumes quasi-static lifting conditions to maintain a strong correlation between electrical power and lifted weight, deviations from this assumption—such as fast or interrupted lifting maneuvers—can degrade estimation performance.
Although the current level of accuracy does not support high-precision applications, it is sufficient for enabling practical functionalities such as the activation of load warnings. For instance, the system could generate alerts when the estimated load exceeds a defined threshold—such as 75% of the forklift’s nominal capacity—helping prevent unsafe operating conditions and improving operator awareness without requiring additional instrumentation. It should be noted that the second-order multivariable model significantly reduces estimation error under higher load conditions, where accurate weight monitoring is most critical. This makes the approach particularly valuable for enhancing operational safety during heavy-duty tasks. Additionally, Table 4 provides a comparison between the proposed power-based method and traditional pressure-sensor-based load estimation techniques. The table outlines key trade-offs in terms of measurement accuracy, system complexity, and ease of integration, highlighting the practical advantages of the proposed approach in real-world applications.
Future work may focus on enhancing the accuracy of the proposed method by incorporating additional variables such as instantaneous lifting speed and hydraulic pressure. These variables can be obtained through non-invasive means and would offer complementary insights to more precisely characterize the dynamic behavior of the lifting system, enabling the integration of both electrical and kinematic effects. Furthermore, the integration of observers and physics-based models of the electro-hydraulic subsystem may significantly improve the robustness of the estimation, enabling adaptive algorithms capable of compensating for variations in operating conditions or mechanical wear.

5. Conclusions

This work presents a novel methodology for estimating the transported load in electric forklifts by analyzing the electrical power signals of the lifting motor within an electro-hydraulic system. The proposed approach relies on measuring the electrical energy, median power, and average speed during lifting operations, from which the lifting efficiency and potential energy are estimated, ultimately allowing inference of the transported mass.
Experimental validation using 53 lifting events demonstrated that the methodology can estimate load weight with a reasonable error sufficient for practical use cases, such as the activation of warnings when the estimated load exceeds safety thresholds, providing a cost-effective and non-intrusive alternative to conventional load sensors.
The results also highlight the importance of selecting robust signal descriptors—such as the median power—over conventional mean values, particularly in the presence of asymmetric data distribution. Moreover, the analysis confirmed that lifting energy is not linearly correlated with transported weight but lifting efficiency can be reasonably approximated as a function of lifting power.
The integration of average lifting speed as an additional explanatory variable in a second-order regression model significantly improved the estimation performance compared to the single-variable linear approach. By combining electrical and kinematic information, the multidimensional model captured more accurately the dynamics of the lifting process, particularly under higher load conditions. This enhancement was reflected in a higher adjusted coefficient of determination ( R adj 2 = 0.9326 ), confirming that the inclusion of kinematic variables can substantially improve the reliability of load estimation without requiring additional instrumentation.
This research lays the foundation for a line of investigation in intelligent monitoring and control of electro-hydraulic systems. Future work will focus on improving estimation accuracy by incorporating additional non-invasive variables, such as instantaneous lifting speed or hydraulic pressure, and by integrating physical models and observers to enhance system robustness and adaptability under varying operating conditions.

Author Contributions

Conceptualization, G.R. and S.V.; methodology, G.R. and J.P.A.; software J.P.A. and C.M.; validation, J.P.A., C.M. and G.R.; formal analysis, G.R., S.V., R.L. and R.B.; investigation, G.R., J.P.A. and S.V.; writing—original draft preparation, G.R., J.P.A., R.L., S.V. and R.B.; writing—review and editing, G.R., S.V., R.L. and R.B.; visualization, G.R., J.P.A., C.M., R.L., S.V. and R.B.; supervision, G.R.; project administration, G.R.; funding acquisition, G.R. All authors have read and agreed to the published version of the manuscript.

Funding

This work was funded by the National Agency for Research and Development ANID through projects Ingeniería 2030 (ING222010004) and project Fondef ID23I10148, and by the Universidad Católica de lo Santísima Concepción through project FAA2024.

Institutional Review Board Statement

Not applicable.

Informed Consent Statement

Not applicable.

Data Availability Statement

Data is contained within the article.

Conflicts of Interest

The authors declare no conflicts of interest.

References

  1. Artal-Sevil, J.S.; Bernal-Agustín, J.; Dufo-López, R.; Domínguez-Navarro, J.A. Forklifts, automated guided vehicles, and horizontal order pickers in industrial environments. Energy management of an active hybrid power system based on batteries, PEM fuel cells, and ultracapacitors. Renew. Energy Power Qual. J. 2017, 1, 859–864. [Google Scholar] [CrossRef]
  2. Paul, T.; Mesbahi, T.; Durand, S.; Flieller, D.; Uhring, W. Sizing of lithium-ion battery/supercapacitor hybrid energy storage system for forklift vehicle. Energies 2020, 13, 4518. [Google Scholar] [CrossRef]
  3. Pedrazzi, S.; Morini, E.; Nasti, M.; Pizzileo, S.; Allesina, G. Green hydrogen powered forklifts in industrial transport: Case study of an Italian fruit and vegetable market. Int. J. Heat Technol. 2022, 40, 145–150. [Google Scholar] [CrossRef]
  4. Martini, A.; Bonelli, G.P.; Rivola, A. Virtual Testing of Counterbalance Forklift Trucks: Implementation and Experimental Validation of a Numerical Multibody Model. Machines 2020, 8, 26. [Google Scholar] [CrossRef]
  5. Lee, J.G.; Kim, Y.S.; Lee, J.H. Preventing Forklift Front-End Failures: Predicting the Weight Centers of Heavy Objects, Remaining Useful Life Prediction under Abnormal Conditions, and Failure Diagnosis Based on Alarm Rules. Sensors 2023, 23, 7706. [Google Scholar] [CrossRef]
  6. Zajac, P.; Dragasius, E.; Roik, T. Energy Consumption When Transporting Pallet Loads Using a Forklift with an Anti Slip Pad Preventing Damage. Energies 2021, 14, 8423. [Google Scholar] [CrossRef]
  7. Gong, W. Simulation study on energy recovery system of heavy electric forklift. In Proceedings of the SPIE—The International Society for Optical Engineering, Chongqing, China, 7–9 July 2023; Volume 12923, p. 129230L. [Google Scholar] [CrossRef]
  8. Wang, L.; Zhao, D.; Wang, Y.; Wang, L.; Li, Y.; Du, M.; Chen, H. Energy management strategy development of a forklift with electric lifting device. Energy 2017, 128, 435–446. [Google Scholar] [CrossRef]
  9. Minav, T.; Virtanen, A.; Laurila, L.; Pyrhonen, J. Storage of energy recovered from an industrial forklift. Autom. Constr. 2012, 22, 506–515. [Google Scholar] [CrossRef]
  10. Shengjie, F.; Chen, H.; Haoling, R.; Tianliang, L.; Cheng, M.; Chen, Q. Potential Energy Recovery System for Electric Heavy Forklift Based on Double Hydraulic Motor-Generators. Appl. Sci. 2020, 10, 3996. [Google Scholar] [CrossRef]
  11. Liu, P.; Wang, Y.; Zhang, Z.; Zhang, O.; Lun, F. Research Summary on Energy Saving Technology of Forklift Lifting System. In Proceedings of the 5th International Conference on Electromechanical Control Technology and Transportation (ICECTT), Nanchang, China, 15–17 May 2020; Institute of Electrical and Electronics Engineers Inc.: Piscataway, NJ, USA, 2020; pp. 62–65. [Google Scholar] [CrossRef]
  12. Conte, M.; Genovese, A.; Ortenzi, F.; Vellucci, F. Hybrid battery-supercapacitor storage for an electric forklift: A life-cycle cost assessment. J. Appl. Electrochem. 2014, 44, 523–532. [Google Scholar] [CrossRef]
  13. Dezza, F.; Musolino, V.; Piegari, L.; Rizzo, R. Hybrid battery–supercapacitor system for full electric forklifts. IET Electr. Syst. Transp. 2019, 9, 16–23. [Google Scholar] [CrossRef]
  14. Kierzkowski, A.; Kisiel, T.; Restel, F. Method of Reducing Energy Consumption during Forklift Operator Training in Cargo Terminals Utilizing Virtual Reality. Energies 2024, 17, 1153. [Google Scholar] [CrossRef]
  15. Kasahara, M.; Mori, Y. Relation between overturn and the center of gravity of a forklift truck. In Proceedings of the 56th Annual Conference Society of Instrument and Control Engineers of Japan (SICE), Kanazawa, Japan, 19–22 September 2017. [Google Scholar] [CrossRef]
  16. Vita, L.; Gattamelata, D. Analytical Method for Assessing Stability of a Counterbalanced Forklift Truck Assembled with Interchangeable Equipment. Appl. Sci. 2023, 13, 1206. [Google Scholar] [CrossRef]
  17. Berdiev, A.; Bahadirov, G.; Dong, Z.; Xuelin, W. Dynamic analysis of the AGV Forklift. In Proceedings of the 2022 2nd International Conference on Electronic Information Engineering and Computer Technology (EIECT), Yan’an, China, 28–30 October 2022; pp. 269–275. [Google Scholar] [CrossRef]
  18. Huang, X.; Wang, J. Real-time estimation of center of gravity position for lightweight vehicles using combined AKF-EKF method. IEEE Trans. Veh. Technol. 2014, 63, 4221–4231. [Google Scholar] [CrossRef]
  19. Sarker, A.; Amin, S.A.; Tamzid, S.M.T.H.; Chisty, N.A. Design and implementation of a forklift with dynamic stability. In Proceedings of the 2017 IEEE Region 10 Humanitarian Technology Conference (R10-HTC), Dhaka, Bangladesh, 21–23 December 2017; pp. 658–663. [Google Scholar] [CrossRef]
  20. Xia, G.; Li, J.; Tang, X.; Zhang, Y.; Zhao, L.; Wang, S. Anti-Rollover Control of a Counterbalance Forklift Based on Roll Energy Classification. Proc. Inst. Mech. Eng. Part C J. Mech. Eng. Sci. 2022, 236, 5796–5814. [Google Scholar] [CrossRef]
  21. Xia, G.; Xia, Y.; Tang, X.; Zhao, L.; Hu, J. Anti-Rollover Control Based on Stable Zone Partition of Counterbalanced Forklift Trucks. Int. J. Automot. Technol. 2021, 22, 1529–1543. [Google Scholar] [CrossRef]
  22. Xia, G.; Li, J.; Tang, X.; Zhang, Y.; Hu, J. Anti-Rollover of the Counterbalanced Forklift Truck Based on Model Predictive Control. J. Mech. Sci. Technol. 2021, 35, 1909–1921. [Google Scholar] [CrossRef]
  23. Choi, M.; Ahn, S.; Seo, J.O. VR-Based Investigation of Forklift Operator Situation Awareness for Preventing Collision Accidents. Accid. Anal. Prev. 2020, 136, 105404. [Google Scholar] [CrossRef]
  24. Abdellatif, M.; Shoeir, M.; Talaat, O.; Gabalah, M.; Elbably, M.; Saleh, S. Design of an Autonomous Forklift Using Kinect. MATEC Web Conf. 2018, 153, 1–5. [Google Scholar] [CrossRef]
  25. Mohammadpour, M.; Kelouwani, S.; Gaudreau, M.-A.; Zeghmi, L.; Amamou, A.; Bahmanabadi, H.; Allani, B.; Graba, M. Energy-efficient motion planning of an autonomous forklift using deep neural networks and kinetic model. Expert Syst. Appl. 2023, 237, 121623. [Google Scholar] [CrossRef]
  26. Ren, L.; Zhang, Z.; Zhang, W.; Li, K.; He, Z. Small Object Detection and Intelligent Loading Based on YOLOv5 for Unmanned Forklifts. Appl. Sci. 2021, 11, 10607. [Google Scholar] [CrossRef]
  27. Motroni, A.; Michelini, G.; Pazzaglia, P.; Tarasconi, A. A Real-Time Localization and Traceability System for Forklifts Based on Sensor Fusion of UWB and IMU. Sensors 2022, 22, 8437. [Google Scholar] [CrossRef]
  28. Occupational Safety and Health Administration (OSHA). Powered Industrial Trucks (Forklift) eTool. Available online: https://www.osha.gov/etools/powered-industrial-trucks/operating-forklift/load-handling (accessed on 1 October 2024).
  29. Hammerl, R. Vehicle Wheel Speed-Based Determination or Estimation of a Load Weight of a Load Carried by a Commercial Vehicle. U.S. Patent US2016041028 AA, 23 May 2017. [Google Scholar]
  30. Kretschmer, S. Procede Pour Determiner Le Poids D’Une Charge D’Un Chariot Elevateur. French Patent FR2972253A1, 17 May 2019. [Google Scholar]
  31. Zajac, P.; Rozic, T. Energy consumption of forklift versus standards, effects of their use and expectation. Energy 2021, 239, 122187. [Google Scholar] [CrossRef]
Figure 1. Schematic diagram of forklift power system.
Applsci 15 07470 g001
Figure 2. Experimental setup (a) forklift and D&Q equipment, (b) tank for variable load implementation, and scale for load weighing.
Applsci 15 07470 g002
Figure 3. Schematic of the driving cycle performed for experimental tests.
Applsci 15 07470 g003
Figure 4. Zoom of original and filtered signals during 500.5 kg lifting operation: (a) voltage, (b) current, (c) and power.
Applsci 15 07470 g004
Figure 5. Extended view of original and filtered signals during 500.5 kg lifting operation: (a) voltage, (b) current, (c) and power.
Applsci 15 07470 g005
Figure 6. Boxplot of the electric energy demanded by LM, as function of load weight during the lifting process.
Applsci 15 07470 g006
Figure 7. LM power plots for the cases of (a) 800.5 kg, (b) 1002.5 kg, and (c) 1202.0 kg.
Applsci 15 07470 g007
Figure 8. Detailed energy conversion architecture and measurement points of the lifting system.
Applsci 15 07470 g008
Figure 9. Dependence of lifting efficiency on the electrical power: (a) average lifting power, (b) median lifting power.
Applsci 15 07470 g009
Figure 10. Dependence of lifting efficiency on P e l m e d and V l a v g .
Applsci 15 07470 g010
Figure 11. Load weight estimation using linear approximation (a) real and estimated mass, (b) relative mass estimation error.
Applsci 15 07470 g011
Figure 12. Load weight estimation using multivariable regression: (a) real and estimated mass, (b) relative mass estimation error.
Applsci 15 07470 g012
Figure 13. Residual analysis for multivariable regression.
Applsci 15 07470 g013
Table 1. Number of tests and corresponding load weight.
Number of TestsLoad Weight (kg)
5202.5
5301.5
5404.5
5500.5
5600.0
5701.0
5800.5
5907.5
51002.5
51100.0
51202.0
Total: 55
Table 2. Summary of lifting test results including index, average and median power, electrical and potential energy, and calculated efficiency.
IndexLoad P el avg P el med E el E pl V l avg η l
[kg][kW][kW][kJ][kJ][m/s][%]
1 4.094.3059.88 0.13656.63
2 4.524.5353.31 0.16947.45
3202.54.394.3055.283.970.15897.19
4 5.365.7739.68 0.270110.01
5 4.734.7649.15 0.19248.08
6 5.085.5159.32 0.17119.97
7 5.165.4455.45 0.186010.67
8301.54.464.3863.525.910.14039.31
9 5.145.452.99 0.193911.16
10 4.944.7956.12 0.176210.54
11 4.985.1173.36 0.135910.81
12 5.645.9256.13 0.200914.13
13404.55.695.6359.157.930.192513.41
14 5.765.6958.91 0.195413.47
15 6.136.1150.48 0.242715.71
16 5.385.5386.02 0.125011.41
17 5.004.86113.28 0.08838.67
18500.55.185.0097.049.820.106810.12
19 5.806.1371.31 0.162613.77
20 5.826.1475.33 0.154613.03
21 5.495.6693.30 0.117812.61
22 5.805.8481.93 0.141514.36
23600.05.585.60103.5411.770.107911.37
24 5.685.59100.38 0.113111.72
25 5.805.9374.97 0.154815.70
26 6.456.80114.42 0.112812.02
27 6.296.42117.00 0.107511.75
28701.06.406.38119.9913.750.106711.46
29 6.656.9698.28 0.135213.99
30 6.146.61107.97 0.113712.73
31 6.496.95128.51 0.101012.22
32 6.797.21107.06 0.126814.66
33800.56.747.2688.6715.700.152017.71
34 6.897.2587.34 0.157917.98
35 6.647.15110.88 0.119814.16
36 6.567.4896.67 0.135818.41
37 6.737.38100.70 0.133617.68
38907.57.207.40110.0517.800.130916.17
39 6.887.36118.23 0.116315.05
40 7.487.4589.74 0.166819.83
41 7.598.9593.11 0.163121.12
42 7.367.76106.70 0.137918.43
431002.57.727.69107.9119.660.143018.22
44 7.918.8491.97 0.172021.38
45 7.237.86104.59 0.138320.63
46 7.559.0291.04 0.165923.70
471100.07.828.9789.4221.570.174924.13
48 7.969.25103.78 0.153320.79
49 8.078.41153.70 0.10515.34
50 8.839.75108.17 0.163321.79
511202.08.418.37140.0023.580.120116.84
52 8.388.32145.07 0.115616.25
53 8.298.31124.41 0.133318.95
Table 3. Regression coefficients for the second-order lifting efficiency polynomial model.
CoefficientValue
a 0 5.97
a 1 3.162
a 2 24.19
a 3 0.3457
a 4 28.54
a 5 386
Table 4. Comparison between conventional load estimation methods and the proposed power-based approach.
AspectPressure-Sensor-Based MethodLoad-Cell-Based MethodPower-Based Method (This Work)
Measurement AccuracyHigh accuracy due to direct measurement of hydraulic pressureVery high accuracy; direct force measurementModerate accuracy; depends on correlation between power and efficiency
Installation ComplexityRequires invasive installation into the hydraulic circuit; may require fluid disconnectionRequires mechanical integration into the lifting mechanism or forksNon-intrusive; could use existing voltage and current signals
System IntegrationNeeds additional hardware, wiring, and calibration proceduresMay require structural adaptation and dedicated interface circuitsEasily integrates with existing forklift control/monitoring systems
Cost and MaintenanceHigher cost due to sensor exposure to hydraulic environment and periodic recalibrationHigh cost; sensitive to mechanical wearLow cost; no extra sensors required
Scalability and ReplicabilityLimited by system-specific hydraulic architectureLimited by forklift model and structural variationsHighly scalable and replicable across forklift models with electric drive
Disclaimer/Publisher’s Note: The statements, opinions and data contained in all publications are solely those of the individual author(s) and contributor(s) and not of MDPI and/or the editor(s). MDPI and/or the editor(s) disclaim responsibility for any injury to people or property resulting from any ideas, methods, instructions or products referred to in the content.

