1. Introduction
The Chinese mitten crab (Eriocheir sinensis), also known as the hairy crab or freshwater crab, is one of the traditional Chinese aquatic treasures. Chinese mitten crabs cultured in Yangcheng Lake and other lakes are favored by people because of their excellent quality. However, in recent years, some unscrupulous traders have used “bathing crabs” to pass off inferior products as well-known lake products, which not only harmed the rights and interests of consumers, but also constituted a serious infringement on the brand of aquatic products. Accurate and efficient identification of the geographic origin of Chinese mitten crab has become a growing concern for researchers, which is of great significance for the assessment and management of aquatic resources.
In order to reliably determine the geographical source of the Chinese mitten crab, researchers have proposed many methods, mainly divided into two categories: traditional methods of identification and those based on deep learning.
The traditional methods mainly include morphological index identification and biochemical indicator identification, and so on. The morphological index identification method [
1] mainly starts from the influence of water quality and food composition of the geographic origin on the external morphology of Chinese mitten crabs such as body length, body color, tooth spacing, pereiopod length, and other internal organ morphology and other indexes, and then determines the influence of different production environments on the morphological and physiological indexes of Chinese mitten crabs. However, this method often suffers from the problems of low detection efficiency and inaccurate detection results, and also requires a high level of experience for the inspectors, which is not favorable for the extension of the method. In addition, the biochemical index identification method based on biological indexes, the proportion of edible parts and nutrient composition, the element fingerprint identification method for identifying trace elements [
2], and the electronic nose (tongue) identification method for detecting nitrogen compounds and non-nitrogen compounds as well as volatile substances are all common methods for identifying the geographic origin of Chinese mitten crab. For example, the Sr isotopic composition of the shells of Chinese mitten crabs can serve as a good geographic indicator because the 87Sr/86Sr ratios of the crabs are similar to the ratios in the water in which they grow [
3]. Yin et al. used a laser stripping technique combined with a multi-receiver inductively coupled plasma mass spectrometer (ICP-MS) to achieve an accurate determination of the geographic origin of Chinese mitten crabs by analyzing the strontium isotope composition of crab shells [
4]. By conducting a multi-mineral fingerprinting analysis of the Chinese mitten crab in Yangcheng Lake throughout its annual cultivation cycle, Xue et al. [
5,
6] found that it takes a long time for the fingerprint characteristics of mineral elements to stabilize. By using the Agilent 7500ce ICP-MS for a comparative analysis of multi-mineral elements in authentic crabs and those cultured for one month under controlled “bathing” conditions, they discovered significant differences in the profiles of 11 elements between the authentic and the cultured crabs, both before and after the bathing process. This finding serves as a foundation for verifying the origin of Chinese mitten crabs from Yangcheng Lake.
Traditional methods are time-consuming, subject to significant human subjectivity, highly dependent on specialized expertise, and unsuitable for large-scale, rapid traceability applications. With the development of machine learning technology and image processing technology, there have been more choices for aquatic product monitoring and classification, and there are also more and more methods for aquatic product identification [
7,
8,
9,
10,
11]. Among them, convolutional neural networks have great advantages in image feature extraction and classification. Traditional classification methods can only distinguish some low-dimensional features, while neural networks can extract and recognize high-dimensional features. It has shown good performance and broad application prospects in the task of aquatic product classification and recognition [
12,
13,
14,
15,
16,
17]. Yuan et al. [
18] adopted the detection and identification method of fish in the electronic monitoring data based on the improved Yolov8 commercial fishing vessels; the backbone network used the GCBlock structure to model remote dependencies in order to increase the feature extraction ability. The new convolution method of GSConv is used on the Neck side to reduce the amount of model computation. The results showed that the model can quickly and accurately complete the detection and identification of fish in the electronic monitoring data of commercial fishing vessels at a lower cost. Chunhui Zhang et al. [
19] proposed an improved BIAS-YOLO network based on the YOLOv5 network, which was used to automatically detect different kinds of fish. Based on the original YOLOv5 network, the Spatial Pyramid Pooling (SPP) module is improved, and the idea of spatial bias is introduced, so that the information of the whole image can be fully utilized. Experiments show that the BIAS-YOLO algorithm is improved by 3.1% on the mAP@0.5 compared with the YOLOv5 network. Based on the study of the characteristics of fish acoustic scattering, Du et al. [
20] extracted the singular value features of wavelet packet coefficients, temporal centroid features, and discrete cosine transform coefficient features of the fish acoustic scattering signals from the perspective of collaborative fusion of multi-directional acoustic scattering data, and made decisions on the extracted features through SVM, and finally obtained the final classification results of fish through the collaborative fusion method. Zhang et al. [
21] proposed a method for detecting fish in static photos using the YOLOv4 architecture and attention system with multi-scale feature combinations. This method is a deep learning-based object detection method specifically designed for underwater environments. Some researchers also combine machine learning and computer vision techniques with methods such as using multi-class support vector machines for classification, using probabilistic background models for real-time fish detection in images with complex backgrounds, and modeling biological features for fish classification. For example, Ju et al. [
22] model utilized an improved version of the AlexNet model, which features object-based soft attention and transfer learning.
Convolutional neural networks are an effective method for target detection and classification of aquatic products. It can automatically extract image features, process target objects of different sizes and shapes, and train through backpropagation algorithms to gradually improve the accuracy of the model. However, there are two problems with the detection and recognition methods of commercial hairy crabs based on convolutional neural networks: First, the detection and recognition accuracy were low in real-world scenarios, which hindered the fine-grained species classification of hairy crabs. Second, models with high detection and recognition accuracy have higher costs and consume more computing resources. There is relatively little research on how to efficiently complete commercial hairy crab detection and recognition at lower costs in real-world scenarios.
To address the aforementioned limitations in the hairy crab classification task, this paper proposes a two-stage identification methodology that synergistically combines an enhanced YOLOv10n object detector with an improved IGINC classification model reconstructed from GoogleNet.
The main contributions of this article are summarized as follows:
- (1)
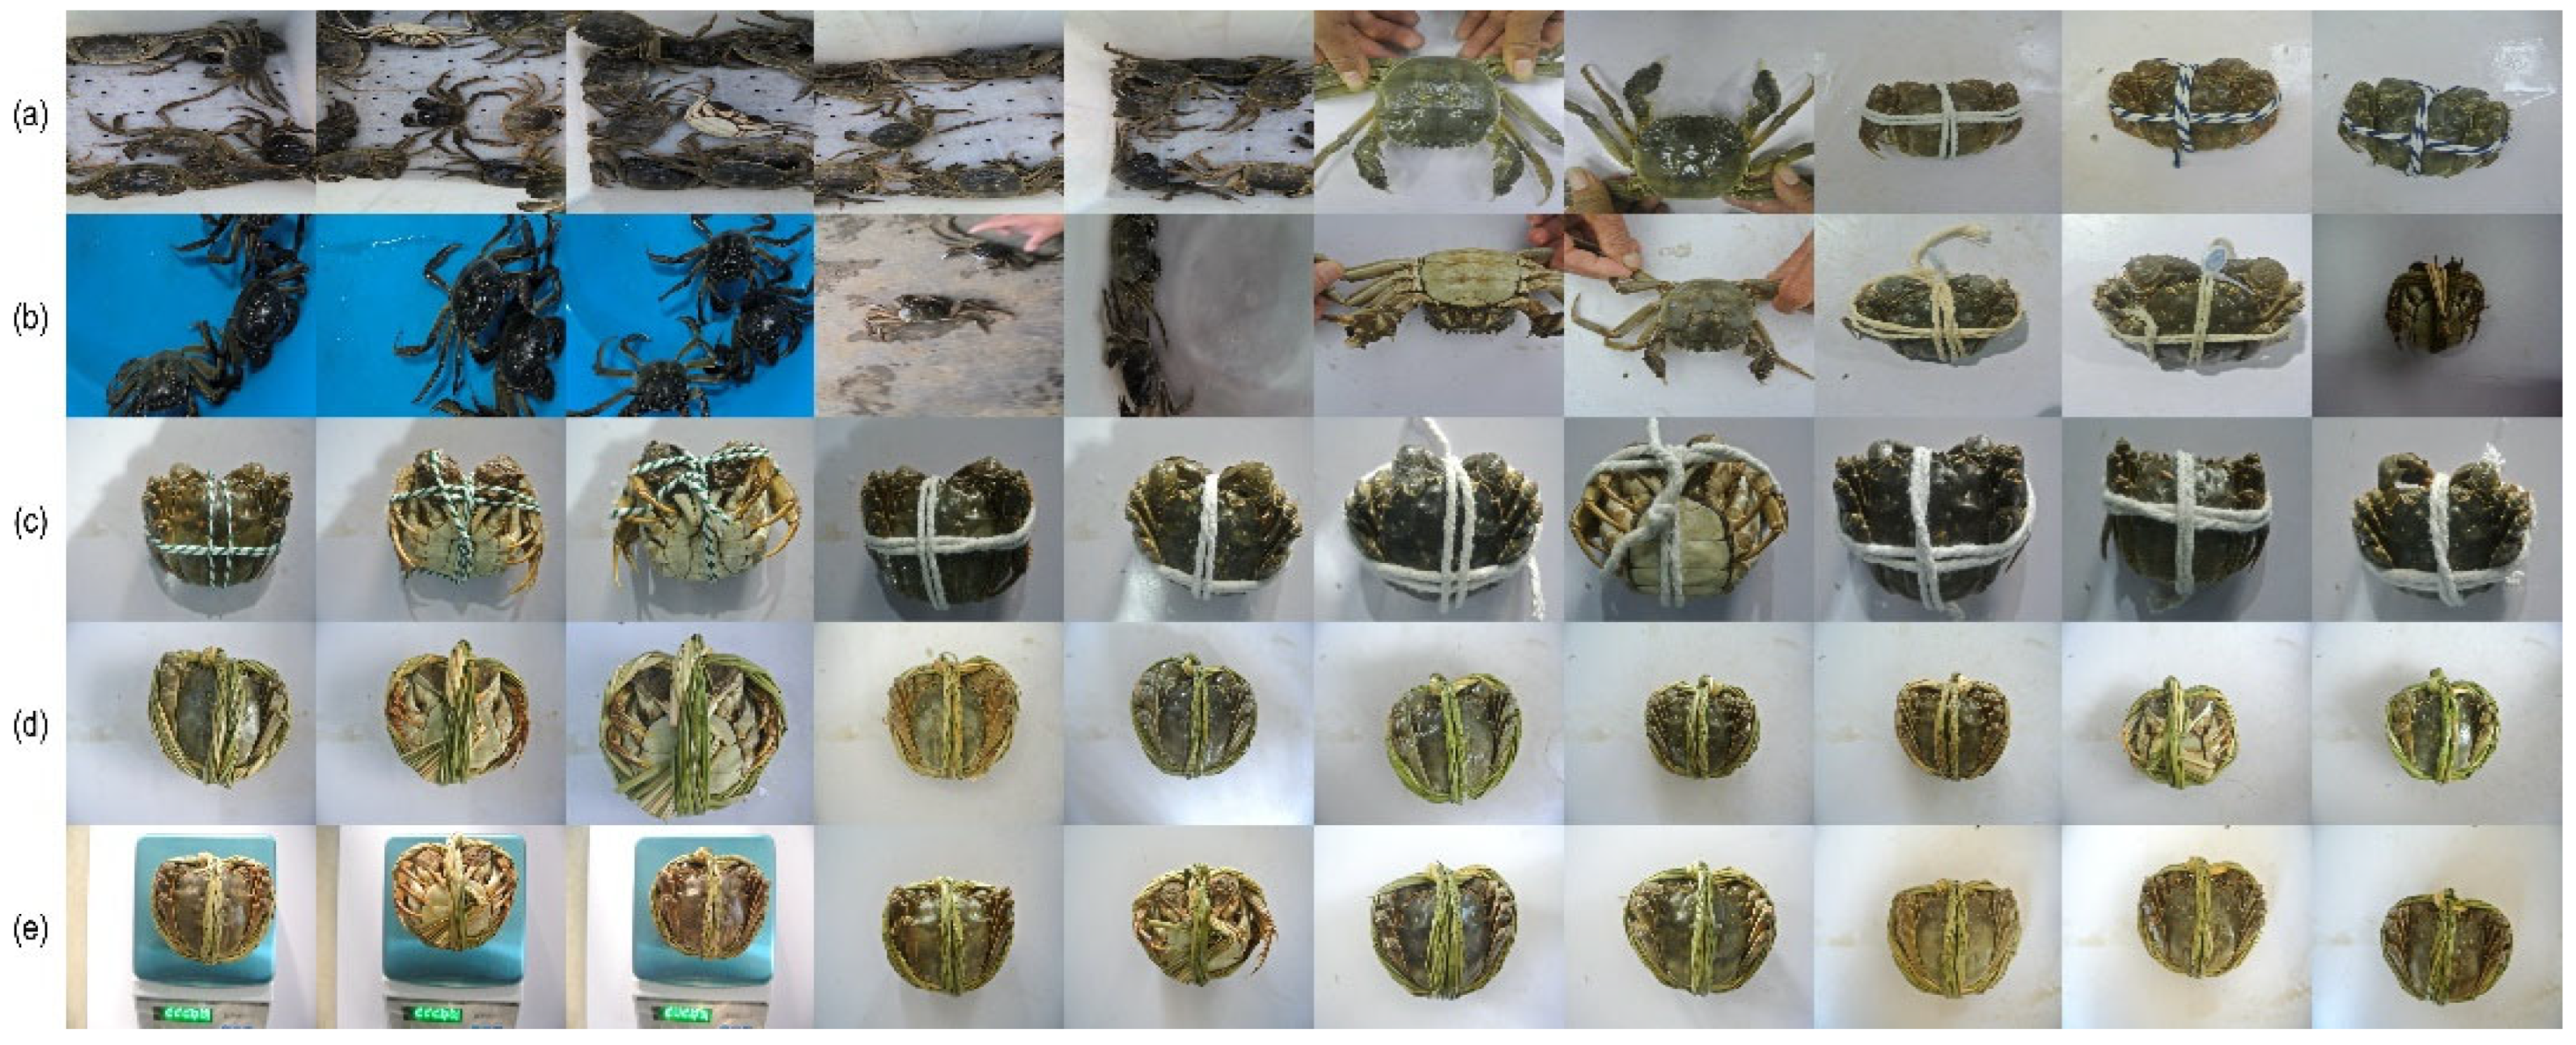
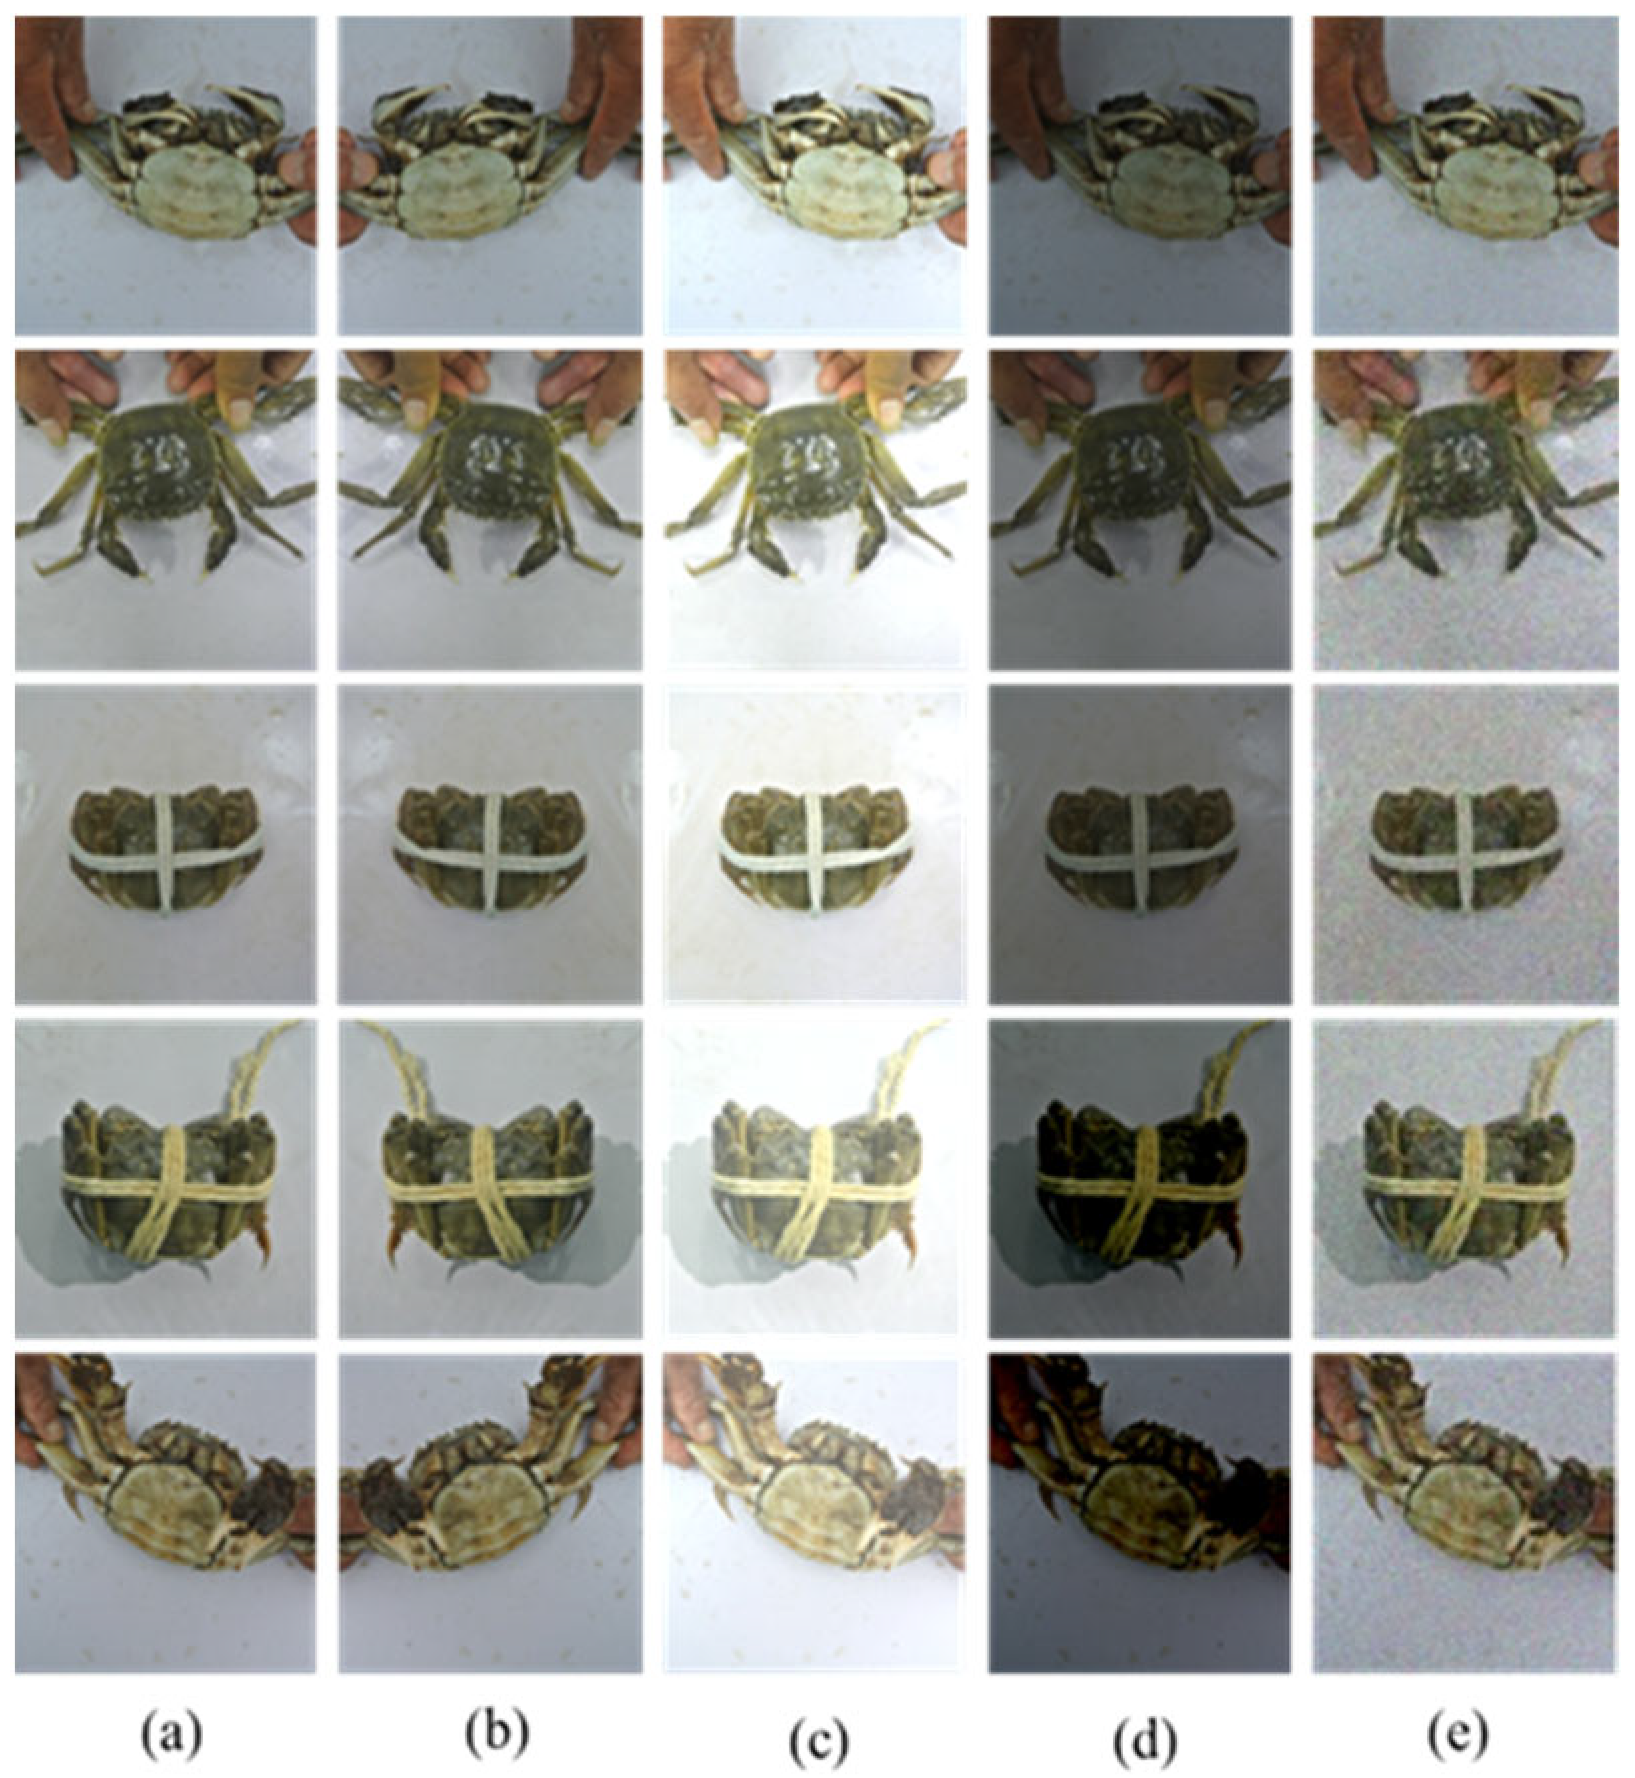
A large image dataset labeled with the geographical origin of Chinese mitten crab has been established. This dataset contains multiple forms of hairy crabs from different origins, different lighting conditions, different angles (dorsal and ventral), and whether they are bundled or not.
- (2)
A two-stage model is proposed for the traceability of Chinese mitten crabs. The first stage employs an improved YOLOv10n [
23] detector that integrates ODConv modules in the backbone, a SlimNeck structure in the neck, and the LSCD detection head. These enhancements improve the detection accuracy of crabs under diverse conditions while significantly reducing computational complexity.
- (3)
In the second stage, a customized IGINC classification model based on GoogleNet is used to classify the detected crabs. By incorporating AC.B and an SE attention mechanism, the model achieves robust and precise identification of the breeding origin, even in visually complex scenes, thereby enhancing traceability and consumer protection.
The other parts of the article are organized as follows: The
Section 2 discusses the proposed method in detail. In the
Section 3, we designed ablation experiments and model comparison experiments for the proposed model, verifying the accuracy and stability of the entire detection model. In the
Section 4, the experimental results were analyzed and discussed.
2. Materials and Methods
In order to better trace the geographical origin of Chinese mitten crabs, we have analyzed the existing images before designing the algorithm model, and found the following three characteristics:
- (a)
Due to the limited research on the biological appearance characteristics of crabs, it is impossible to identify the species of crabs by directly marking the characteristic points of crabs through pictures.
- (b)
The data comes from live crabs, which were photographed in two main forms, unbundled and bundled, and the characteristics varied greatly between the two forms. In the unbundled state, human hands are required to restrain to get more stable data, and the picture contains invalid information such as human hands, and it is easy to lack part of the crab’s leg. The rope will cover most of the crab’s appearance when it is tied, and there is also a nameplate with crab information in the picture, so it is also included in the picture.
- (c)
Wild environments present complex backgrounds (e.g., vegetation, sediment), dynamic lighting, and natural occlusions, leading to partial limb loss in crab images.
Based on the above three characteristics, this paper proposes a two-stage detection and classification framework for geographical origin identification of Chinese mitten crabs.
2.1. Overall Architecture
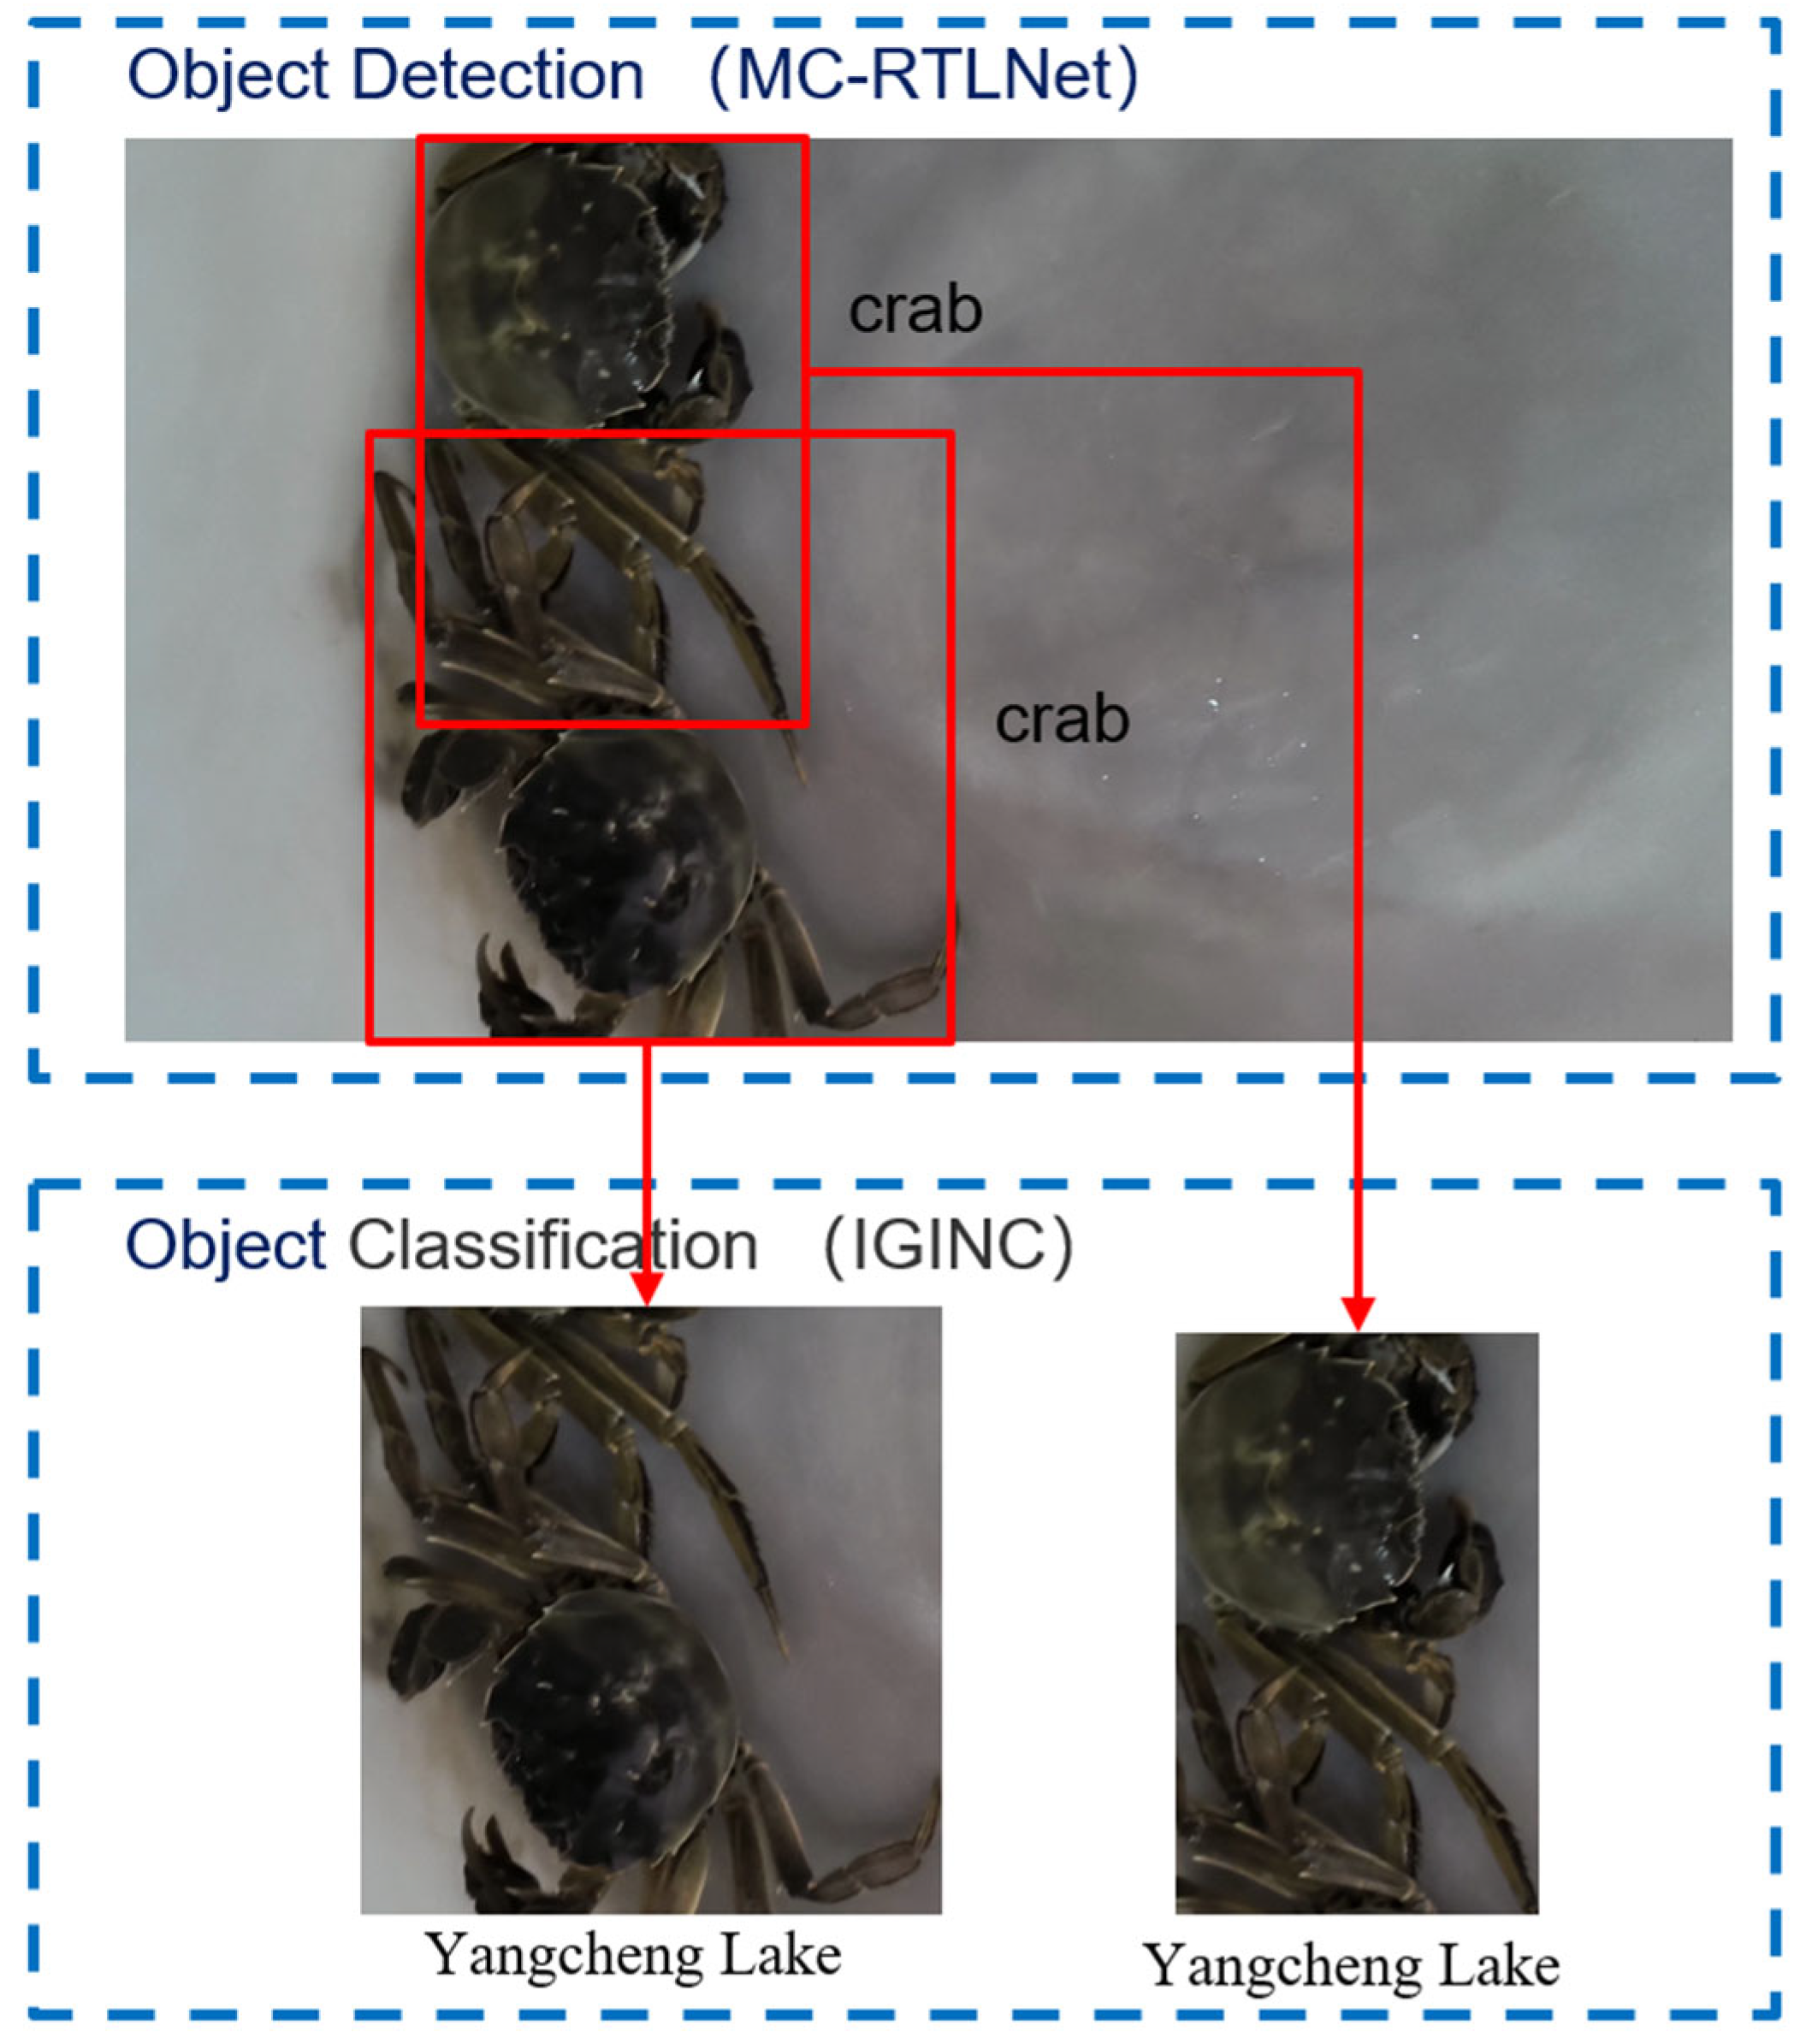
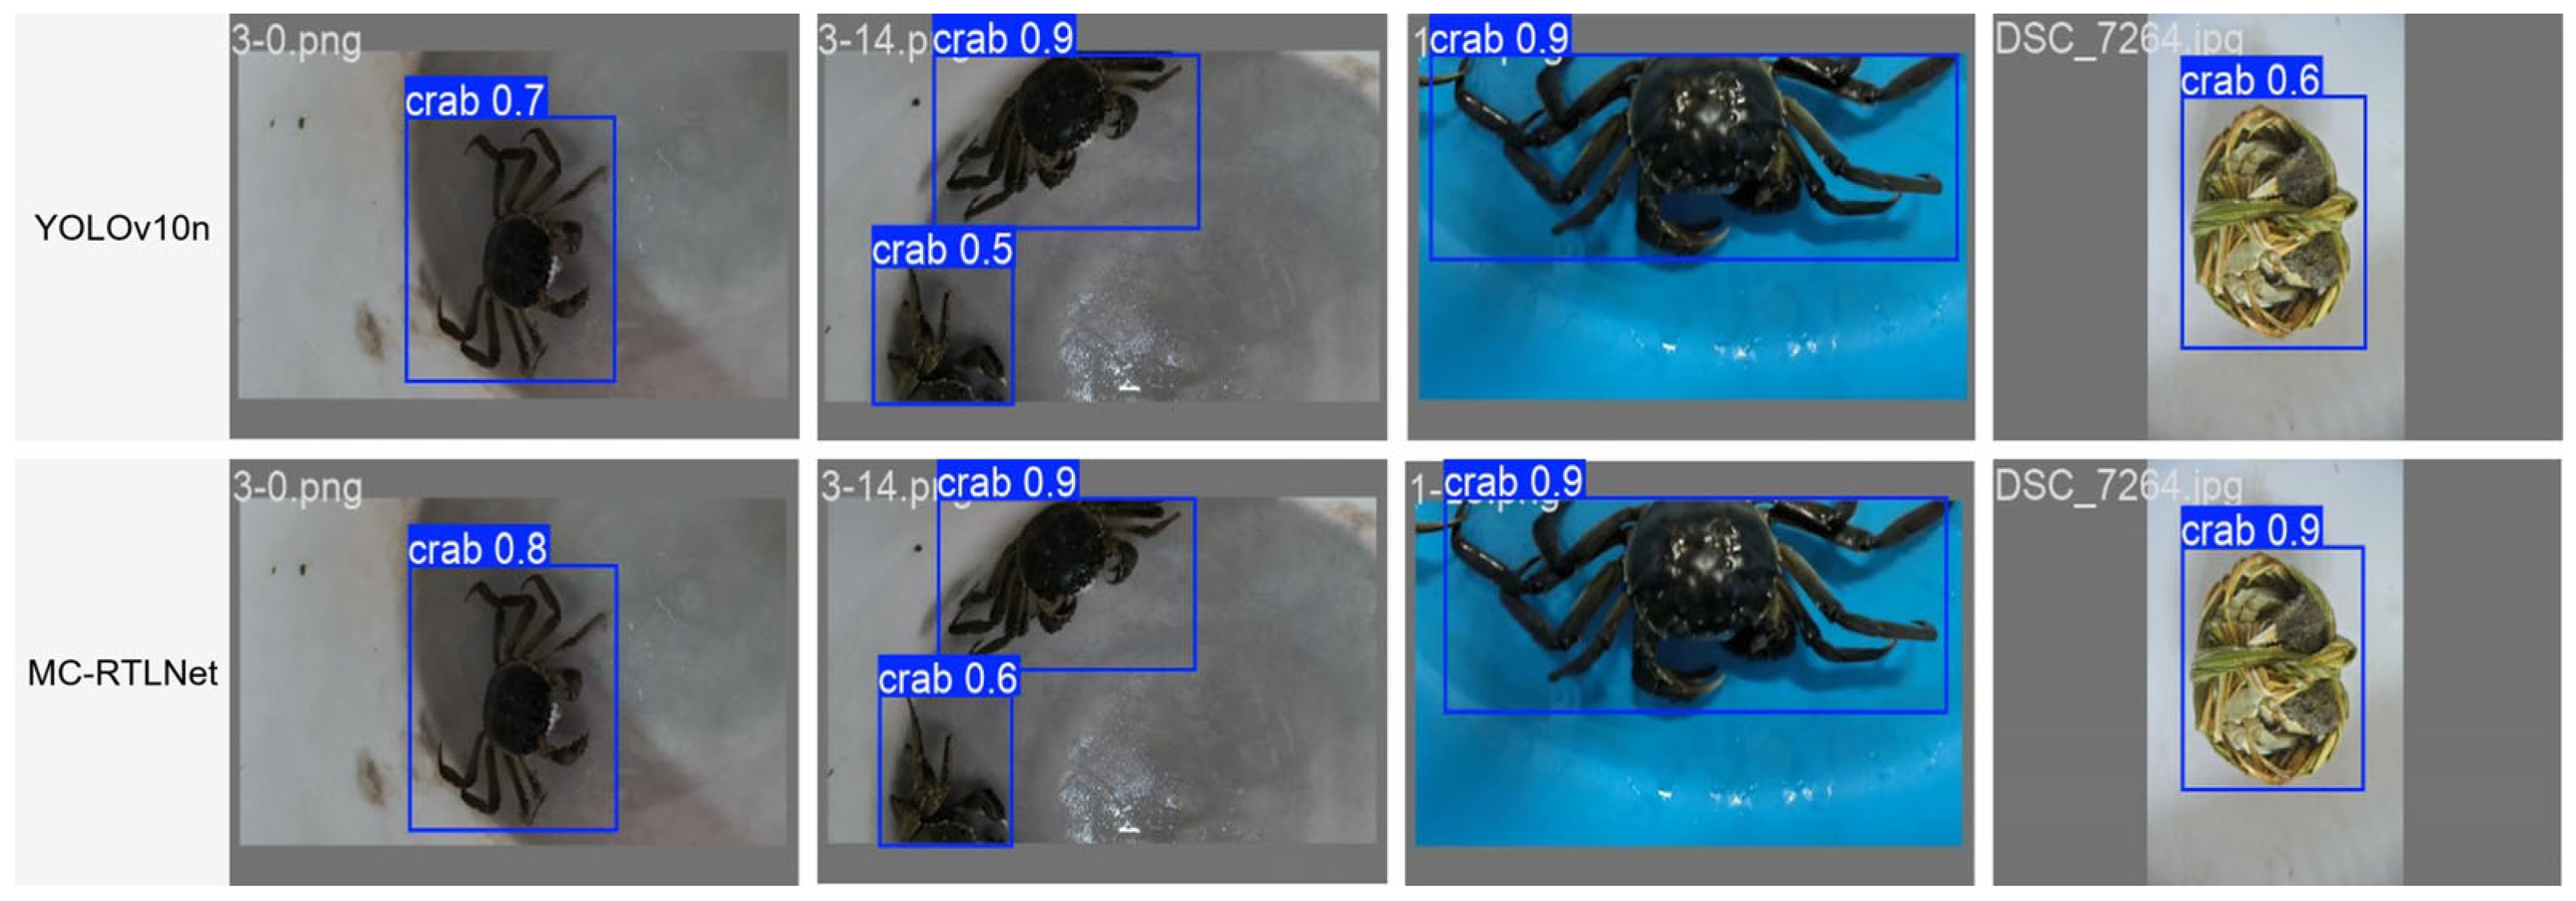
Figure 1 illustrates the overall two-stage architecture of the proposed origin traceability system for Chinese mitten crabs. The system consists of two main modules. (1) Object Detection Stage: The input image is first passed into the object detection module, MC-RTLNet, which is built upon an improved YOLOv10n architecture. It integrates ODConv, SlimNeck, and LSCD Head. This module is designed to accurately detect the presence and locations of Chinese mitten crabs in complex aquaculture environments. The output of this stage is a set of cropped image regions, each containing a single crab. (2) Classification Stage: The cropped crab images are then fed into the classification module. This module employs a customized IGINC classifier, which is based on the Inception architecture of GoogleNet and further incorporates AC.B and SE modules. These enhancements improve the model’s ability to extract discriminative features relevant to geographic origin identification.
The two modules are trained independently, offering two major advantages: first, each stage can utilize task-specific datasets tailored to either detection or classification; second, the decoupled structure allows for targeted optimization based on the distinct complexity and feature characteristics of the two tasks. This modular framework effectively combines the robustness of object detection with the fine-grained capability of origin classification, while also providing greater flexibility and adaptability for real-world deployment.
2.2. Detection Model MC-RTLNet
2.2.1. YOLOv10n Model Introduction
YOLOv10 is the latest technological achievement in the field of target detection and represents an important breakthrough in the balance of efficiency and accuracy for the YOLO family of algorithms. Through a consistent dual allocation strategy, YOLOv10 eliminates the reliance on non-maximal suppression training, thus optimizing the redundancy problem of traditional YOLO [
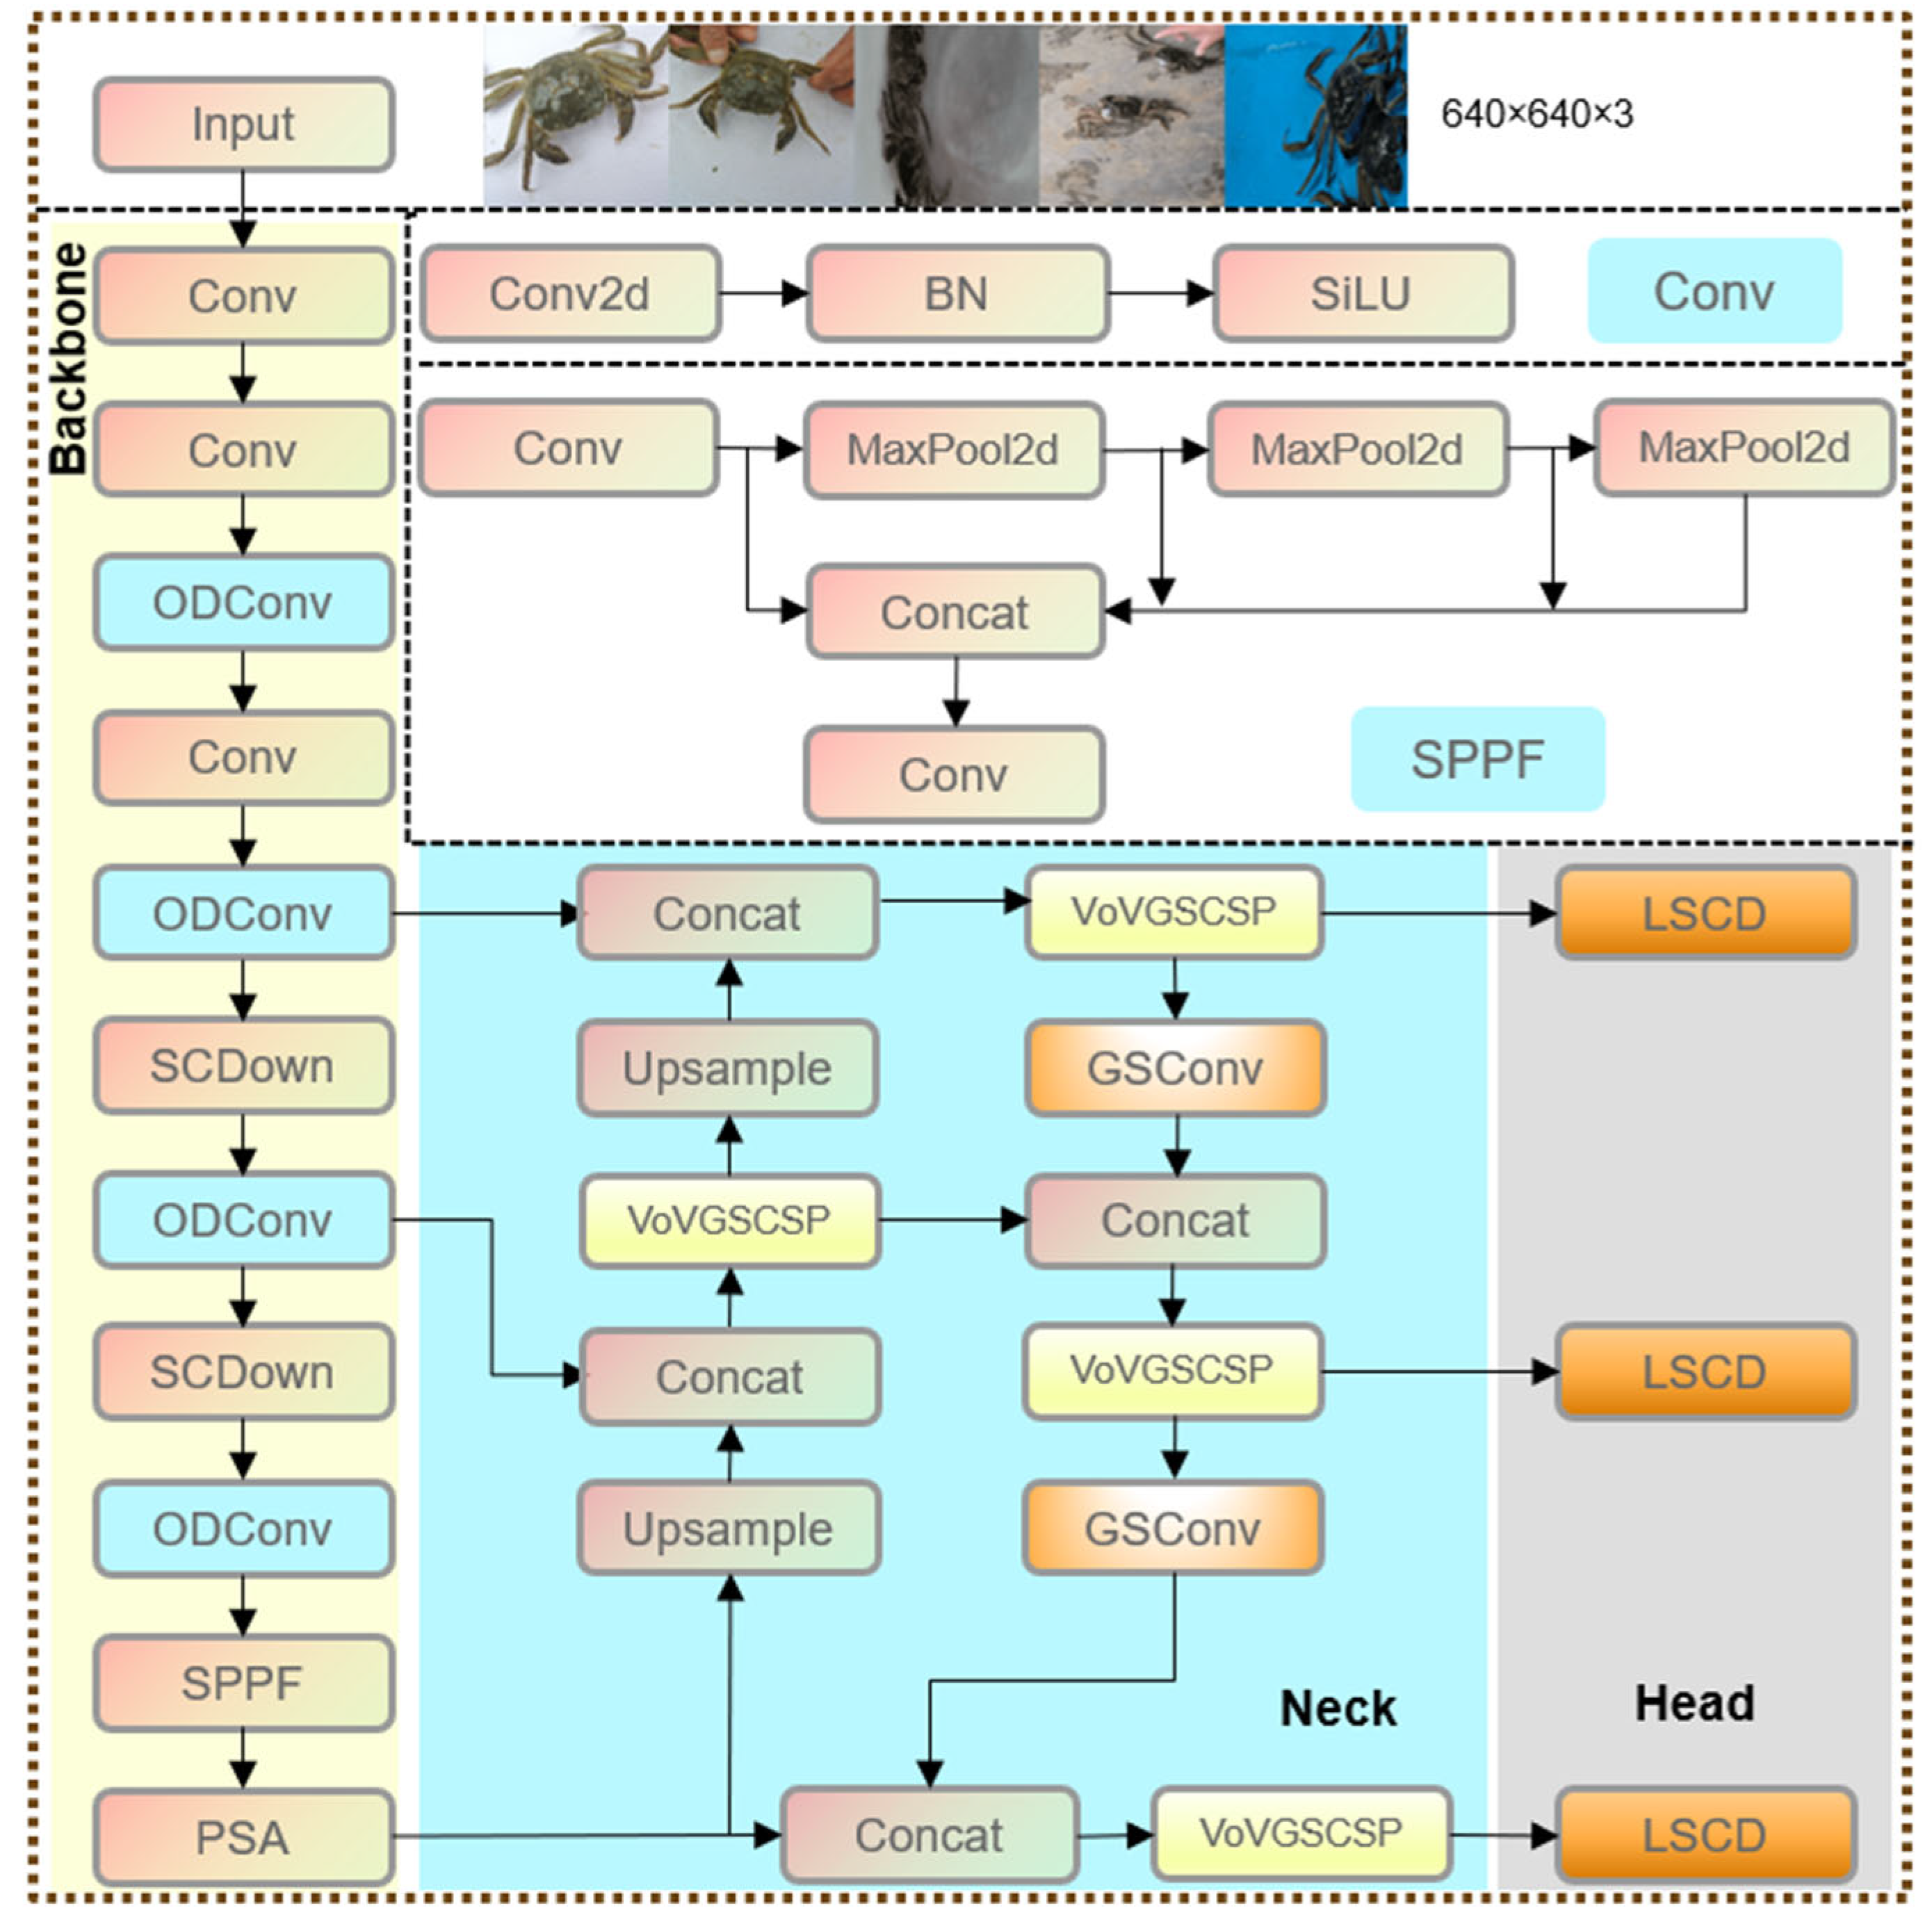
24] models for multi-target detection. This strategy optimizes one-to-one and one-to-many detection heads in the training phase and uses only one-to-one detection heads in the inference phase, which significantly improves inference efficiency. The model adopts an overall efficiency-accuracy-driven design, including a lightweight classification head, spatial-channel-discrete downsampling (SCDown), and intrinsic rank-based modules. The SCDown module implements highly efficient feature downsampling, and the PSA module enhances the performance of global information extraction through the partial self-attention mechanism while reducing the computational overhead. YOLOv10 performs well on the COCO dataset and not only maintains high detection accuracy in complex scenarios, but also has lightweight features for embedded device deployment.
YOLOv10 consists of four parts: Input, Backbone, Neck, and Head. The input part improves the model’s generalization ability through data enhancement (e.g., HSV enhancement, image panning, scaling, flipping, and mosaic enhancement). The backbone part adds new SCDown, C2fUIB, and PSA modules to optimize feature extraction. The Neck part adopts the classic FPN and PANet structures to achieve multi-scale feature fusion. The Head part combines one-to-one and one-to-many detection heads for lightweight target detection tasks. YOLOv10 is available in six versions to meet the needs of different scenarios. Among them, YOLOv10n, as a lightweight version, is ideal for embedded device deployment and small target detection tasks.
Based on the above advantages, this paper uses the target detection model based on YOLOv10n and improves it for the actual needs of crab traceability. The improved YOLOv10n network architecture is shown in
Figure 2.
2.2.2. ODConv Module in the Backbone Network
In order to enhance the ability of YOLOv10n to extract features from crab images under complex backgrounds, this paper introduces the Omni-dimensional Dynamic Convolution module. Convolution is a core operation in convolutional neural networks (CNNs), widely used for extracting local image features such as edges, textures, and shapes. It works by sliding a small matrix, the convolution kernel, over the input and performing element-wise multiplication and summation within local regions. Unlike traditional convolution with fixed weights, ODConv uses a multi-dimensional attention mechanism to achieve dynamic weighting along the spatial, input channel, output channel, and kernel levels, thereby adaptively adjusting the convolution operation.
The input feature map
x ∊
R C×H×W is first processed through Global Average Pooling (GAP) to produce a channel-wise descriptor of length
C. This descriptor is then passed through a Fully Connected (FC) layer and ReLU activation for dimension reduction. Subsequently, it is forwarded into four parallel attention branches to generate dynamic weights: α
s for spatial, α
c for input channels, α
f for output channels, and α
w for kernel-level attention. These weights are applied to the convolution kernels via element-wise multiplication to enable dynamic adjustment in multiple dimensions, thereby enhancing the expressiveness and adaptability of the convolution operation. The structure of the ODConv module is shown in
Figure 3.
The convolution output of ODConv is given by
where
Wi is the i-th convolution kernel and ∗ denotes the convolution operation. X and
Y represent the input and output feature maps, respectively. α
si, α
ci, α
fi, and α
wi are attention weights applied at the spatial, input channel, output channel, and kernel levels. The introduction of these four types of attention enables the model to adaptively adjust each convolution kernel, allowing it to capture target details more precisely while suppressing background interference.
After incorporating the ODConv module, the network is not only able to adaptively adjust the convolution kernel parameters based on the global image features but also to balance the complementary information among the spatial, channel, and kernel dimensions during dynamic weighting. This substantially enhances the network’s focus on target features. In crab images with complex backgrounds, ODConv effectively suppresses interference from cluttered background information, thereby enabling the model to extract the primary crab features (such as shell texture and morphology) with greater precision, while also improving robustness in recognizing local details (such as overlapping crab legs). Compared with traditional static convolution and conventional dynamic convolution, ODConv—even when employing a single-kernel design—achieves performance comparable to that of multi-kernel dynamic convolution, while significantly reducing the number of parameters and computational cost, thereby greatly enhancing overall computational efficiency.
2.2.3. SlimNeck Module in the Neck Network
To enhance the model’s ability to extract crucial features of crabs under complex backgrounds while reducing computational complexity, a lightweight SlimNeck module is proposed [
25]. This module replaces the standard convolution and C2f components in the original neck with a hybrid convolution module (GSConv) and a cross-stage partial network module (VoVGSCSP), achieving efficient feature fusion. The original neck network fuses multi-scale features to restore spatial details lost during downsampling and to retain high-level semantic information, but this also increases model complexity. To address this, GSConv is employed, which combines Standard Convolution (SC), Depthwise Separable Convolution (DSC), and Shuffle operations. The Shuffle operation transfers the rich information from SC to various parts of DSC, effectively compensating for the limited representation capability of DSC while leveraging its efficiency.
Figure 4 illustrates the architectural design of the GSConv module, which is composed of two parallel branches: a standard convolution and a depthwise convolution (DWConv). The outputs of both branches are concatenated along the channel dimension to enhance feature diversity. Subsequently, a channel shuffle operation is applied to rearrange and mix the channel-wise information, promoting better interaction between different feature groups.
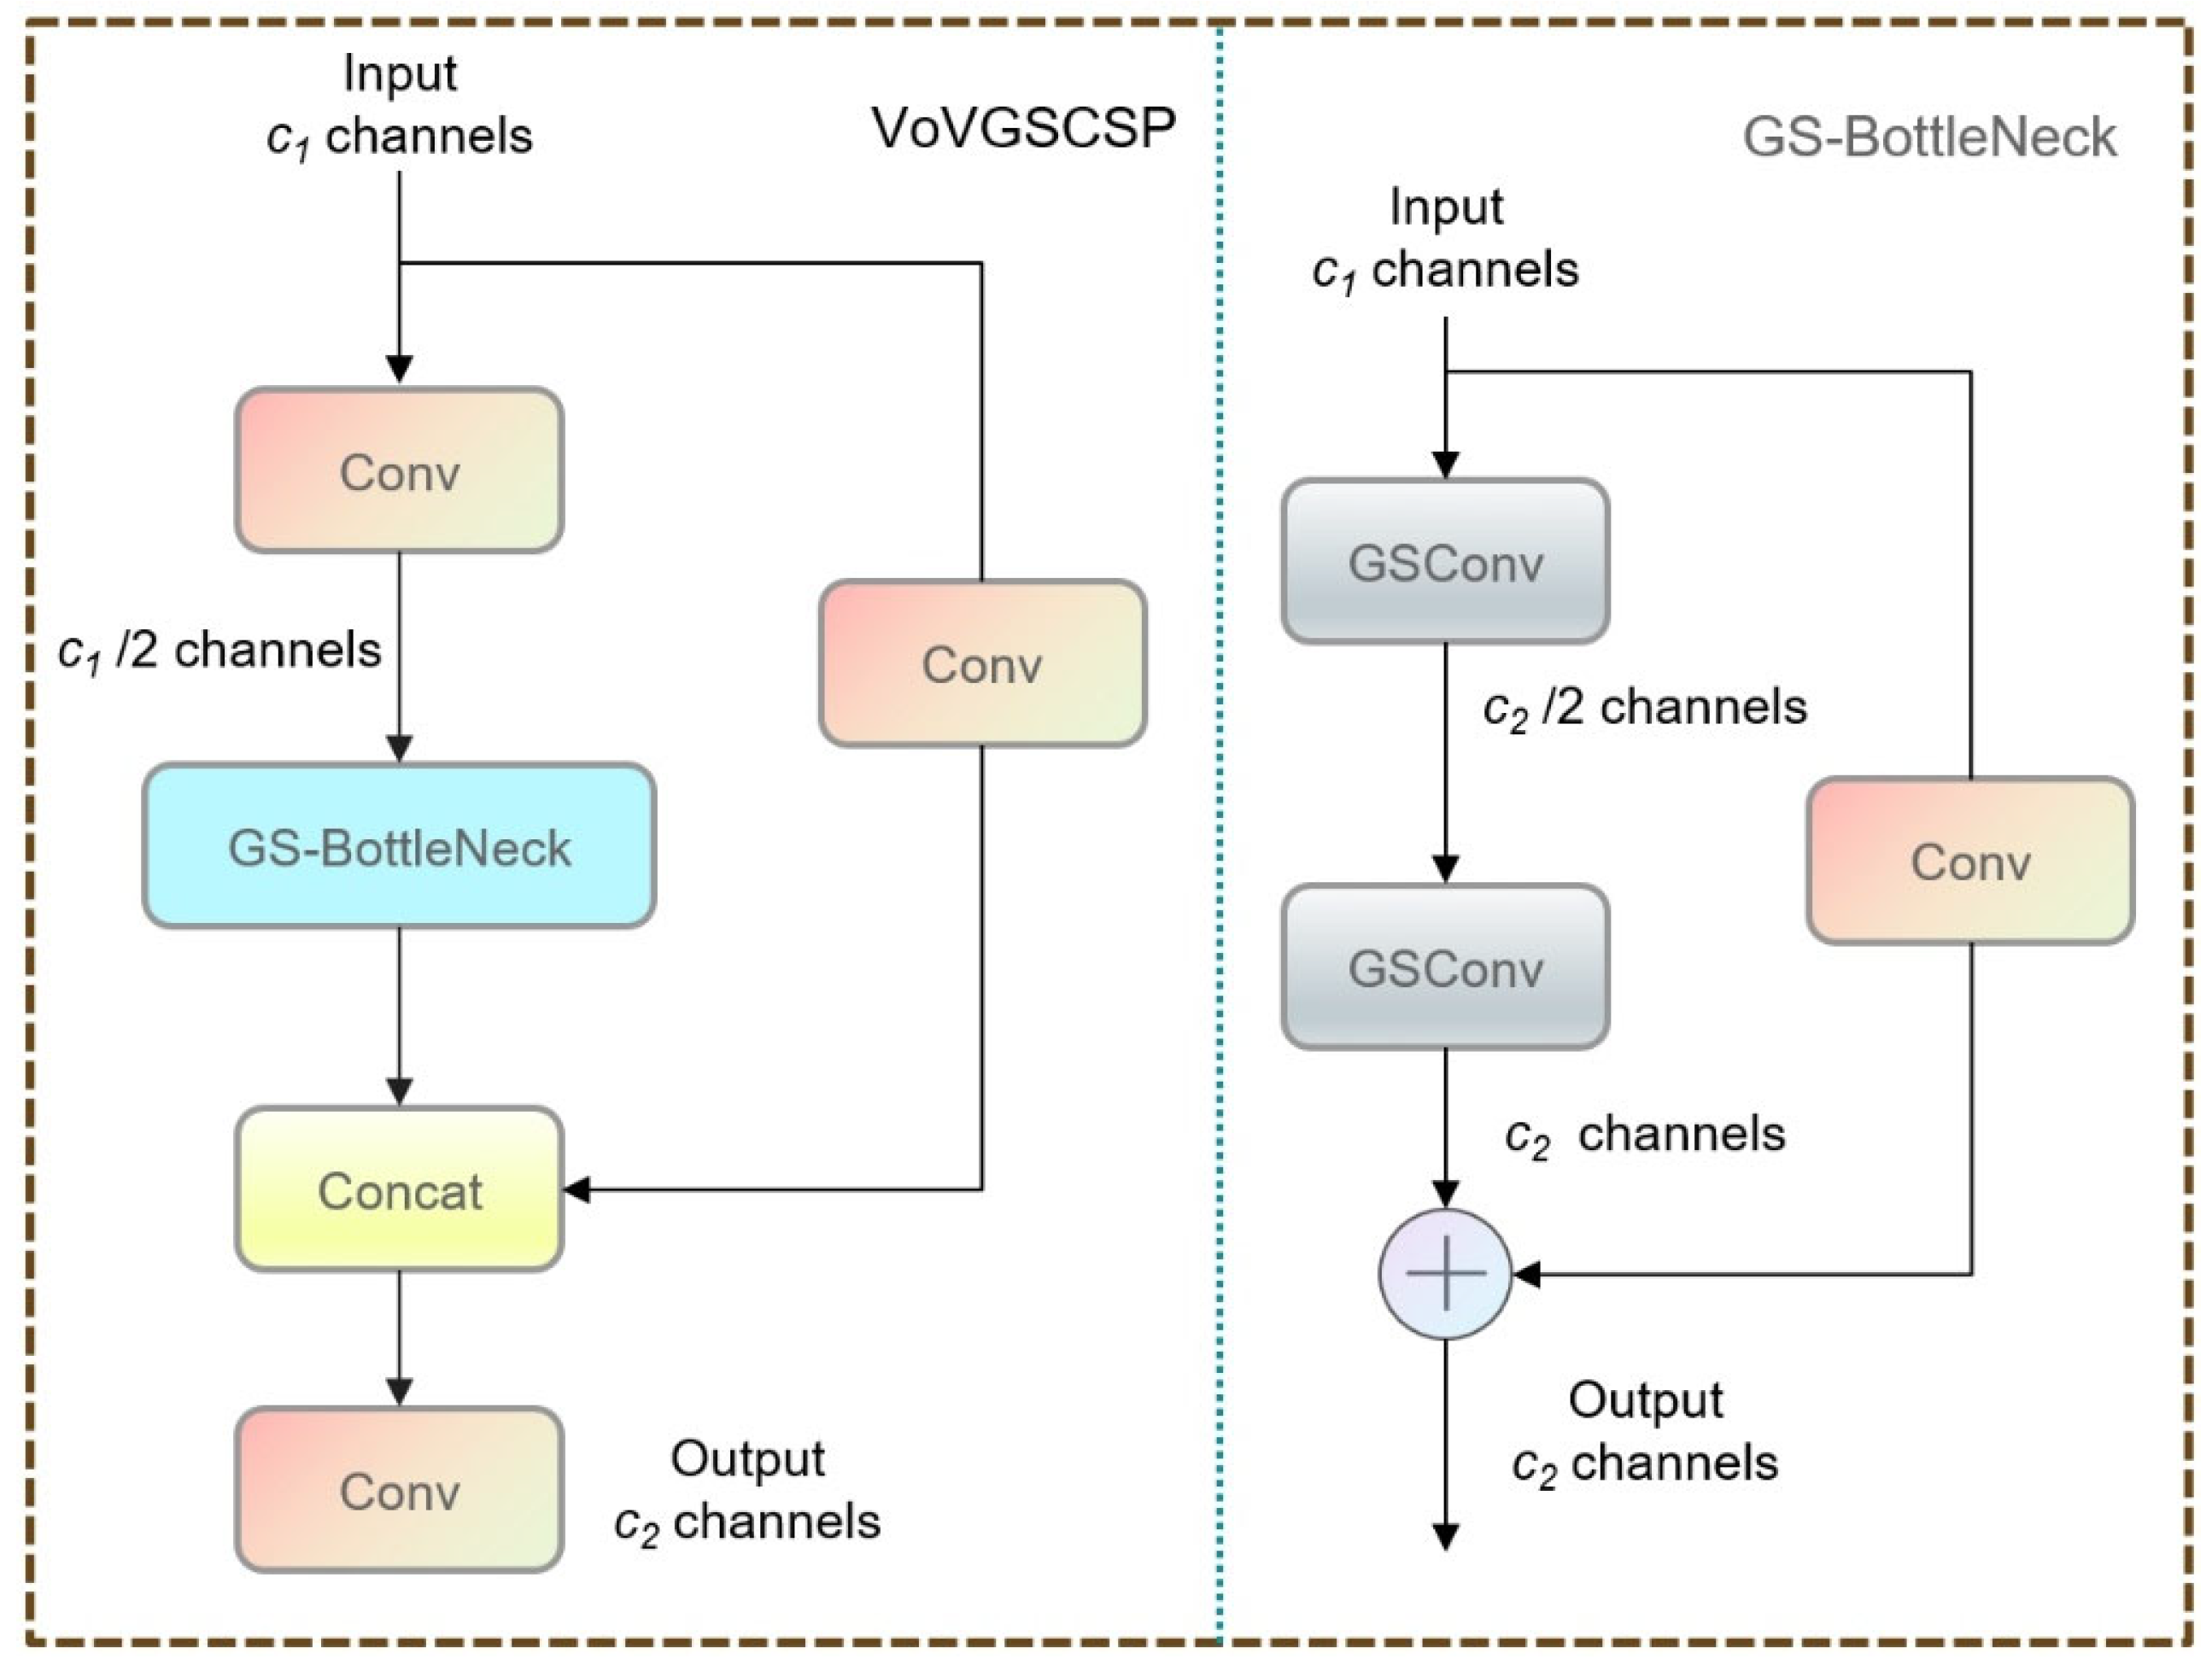
Figure 5 shows the architecture of the VoVGSCSP module. It begins with an input of
c1 channels, which is first reduced to
c1/2 through a Conv layer and then processed by a GS-Bottleneck module. In parallel, the original input passes through another Conv layer. The outputs of both branches are concatenated, followed by a final Conv layer that produces the output with
c2 channels. This design effectively integrates lightweight feature extraction with residual information flow, improving both representation and computational efficiency.
By incorporating the SlimNeck module, the network not only achieves a significant reduction in the number of parameters and computational load but also enhances the efficiency of feature extraction and fusion.
2.2.4. Lightweight Detection Head
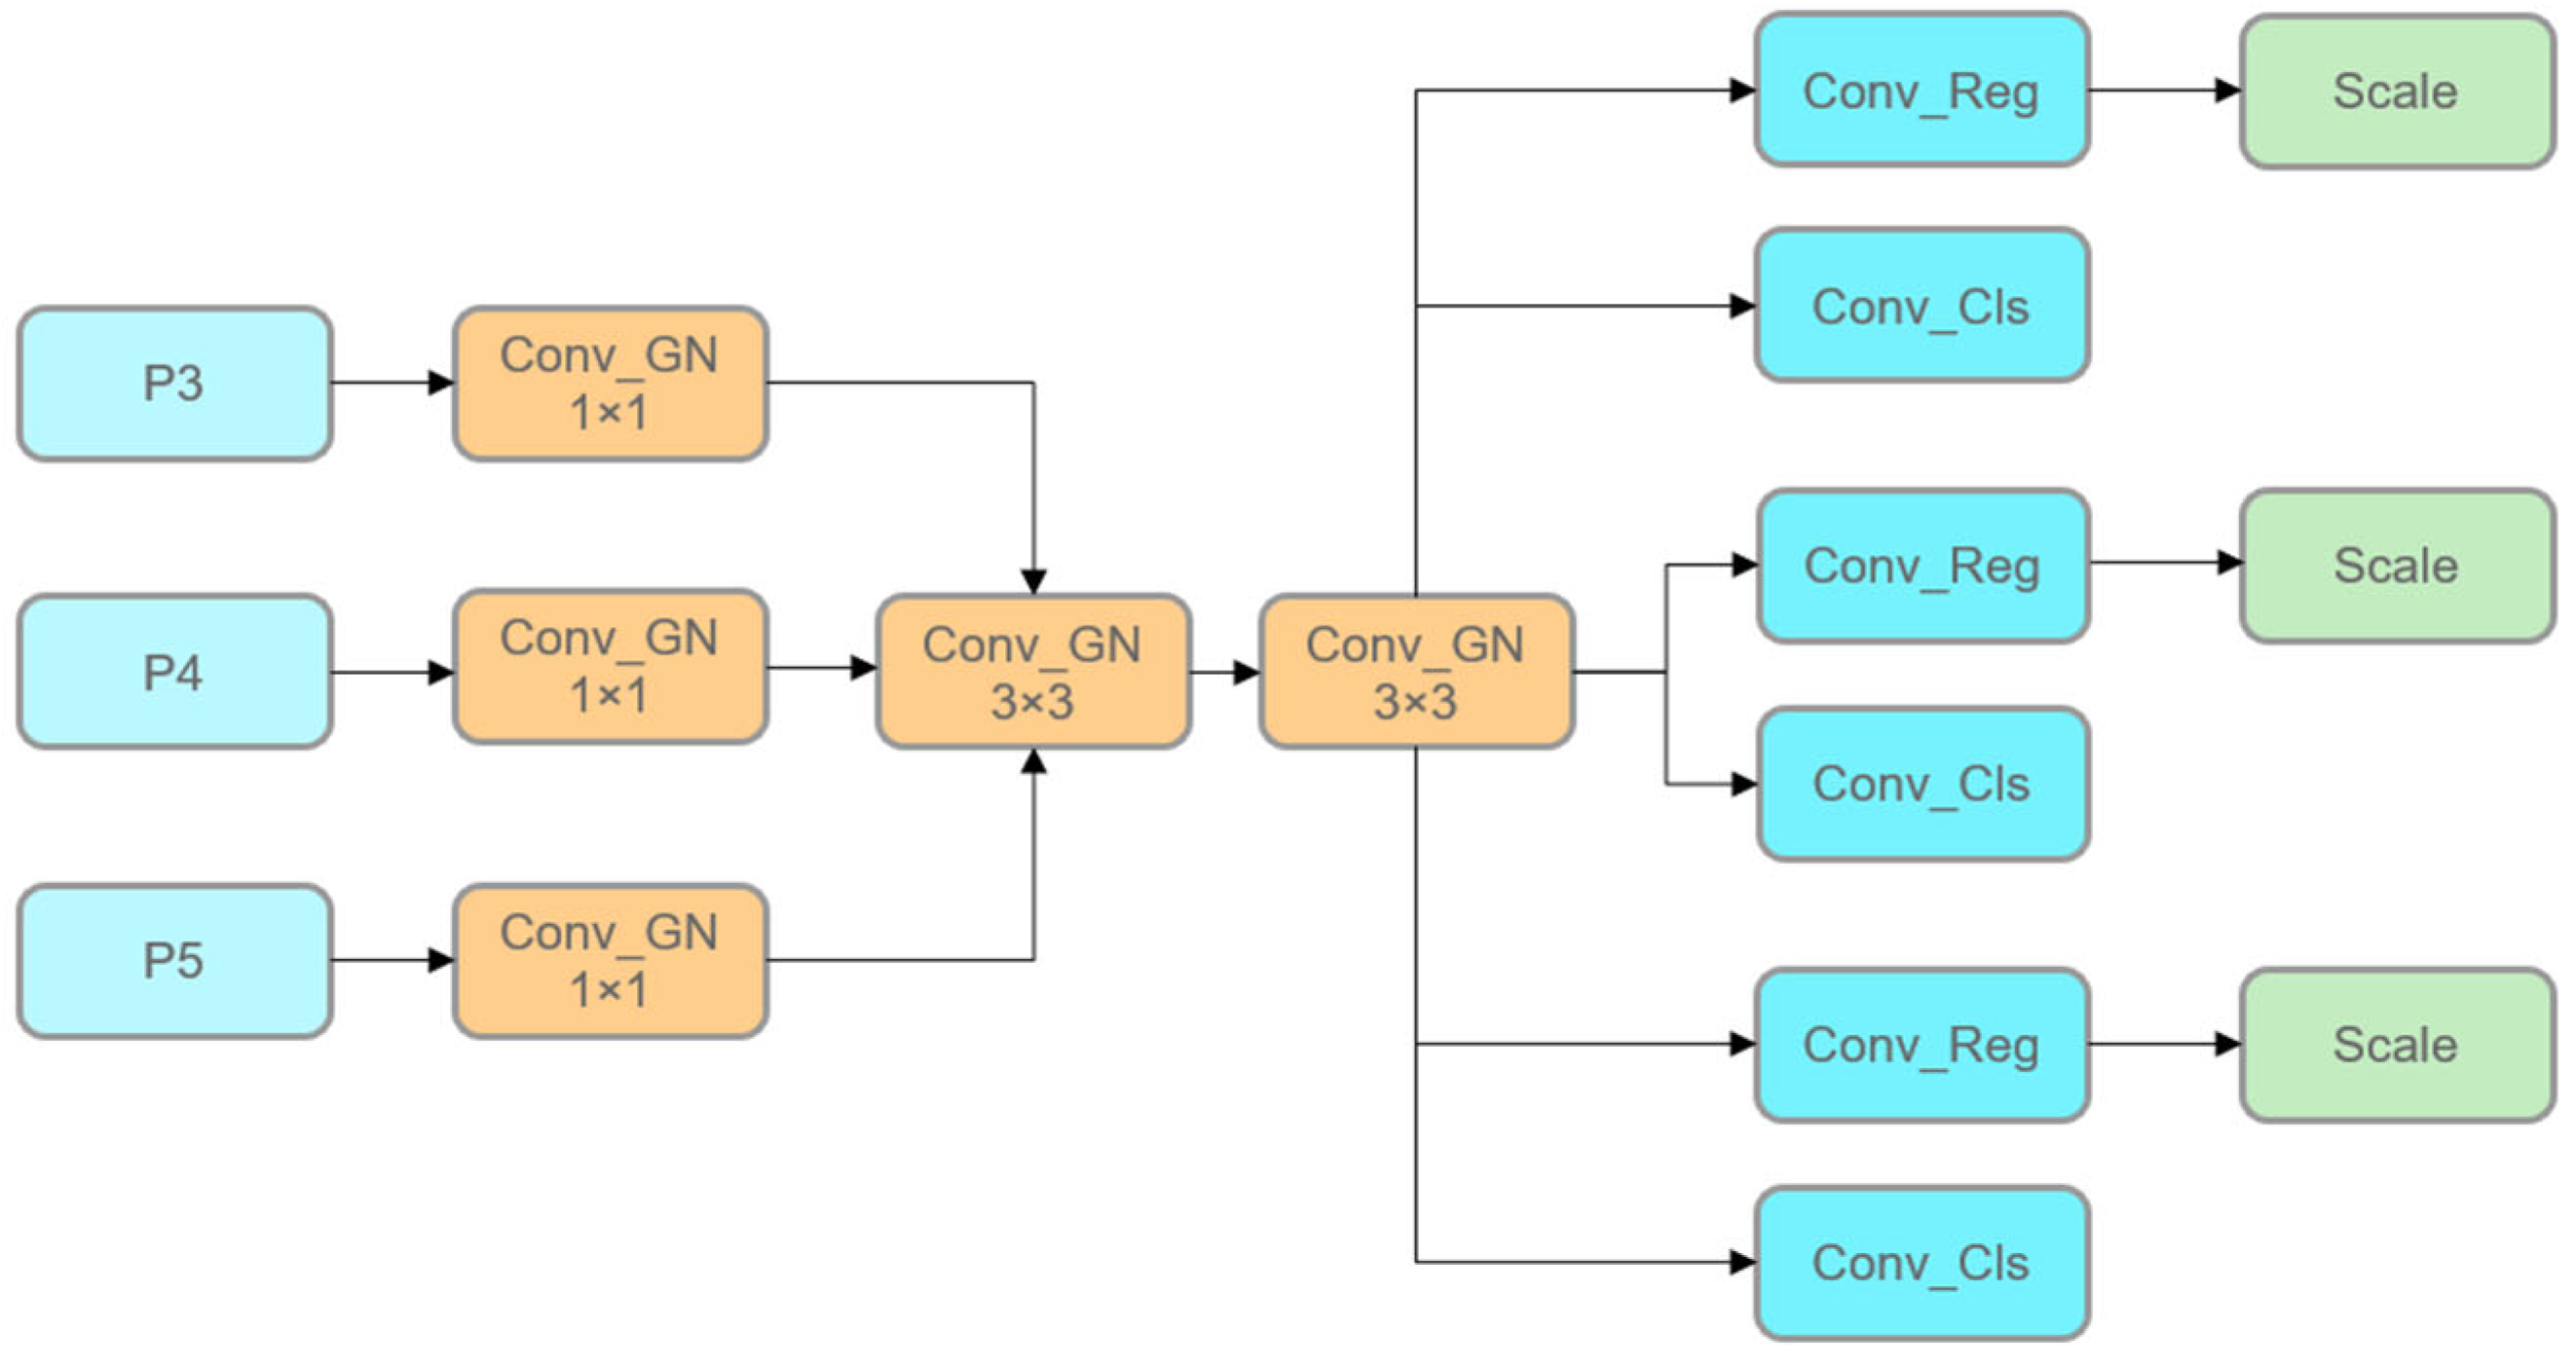
In the LSCD lightweight detection head, the three feature layers (P3, P4, and P5) output from the neck first enter the branches of the detection head, which are used to process targets at different scales. Each branch adjusts the channel number size and performs a normalization operation to unify the channel numbers of the feature layers into an intermediate channel number by means of a 1 × 1 convolutional layer and a Group Normalization (GN) module. This step not only significantly reduces the computational complexity, but also provides a stable feature distribution through the GN, improves the training convergence speed, and provides a consistent and standardized input feature representation for the subsequent shared convolution module. The tuned feature layers are pooled into a shared 3 × 3 convolutional GN module that uniformly extracts multi-scale features. With the shared convolutional weights and the normalization operation of GN, the model is able to effectively reduce the number of parameters and computational cost while maintaining the accuracy and effectiveness of feature extraction. This design further enhances the integration of multi-scale features and ensures the efficient performance of the lightweight model.
The features extracted by the shared convolution finally enter the classification branch and the regression branch for decoupling. The classification branch uses a 1×1 convolutional layer to predict the category probability and learns the features for the classification task through independent convolutional weights. The regression branch predicts the coordinate offset of the bounding box through a 1 × 1 convolutional layer and introduces a scale layer to dynamically adjust the target scale to adapt to different sizes of the detection targets. The structure of the LSCD is shown in
Figure 6.
The modular design of the LSCD detection head combines Group Normalization with convolutional operations to reduce computational resource requirements while maintaining the ability to optimize independently for classification and localization tasks. This structure not only improves the effectiveness of feature extraction and multi-scale integration, but also achieves fast and accurate target detection in edge computing environments. For the crab traceability system, this design can efficiently detect crab targets of different sizes and provide stable and reliable basic data support for traceability.
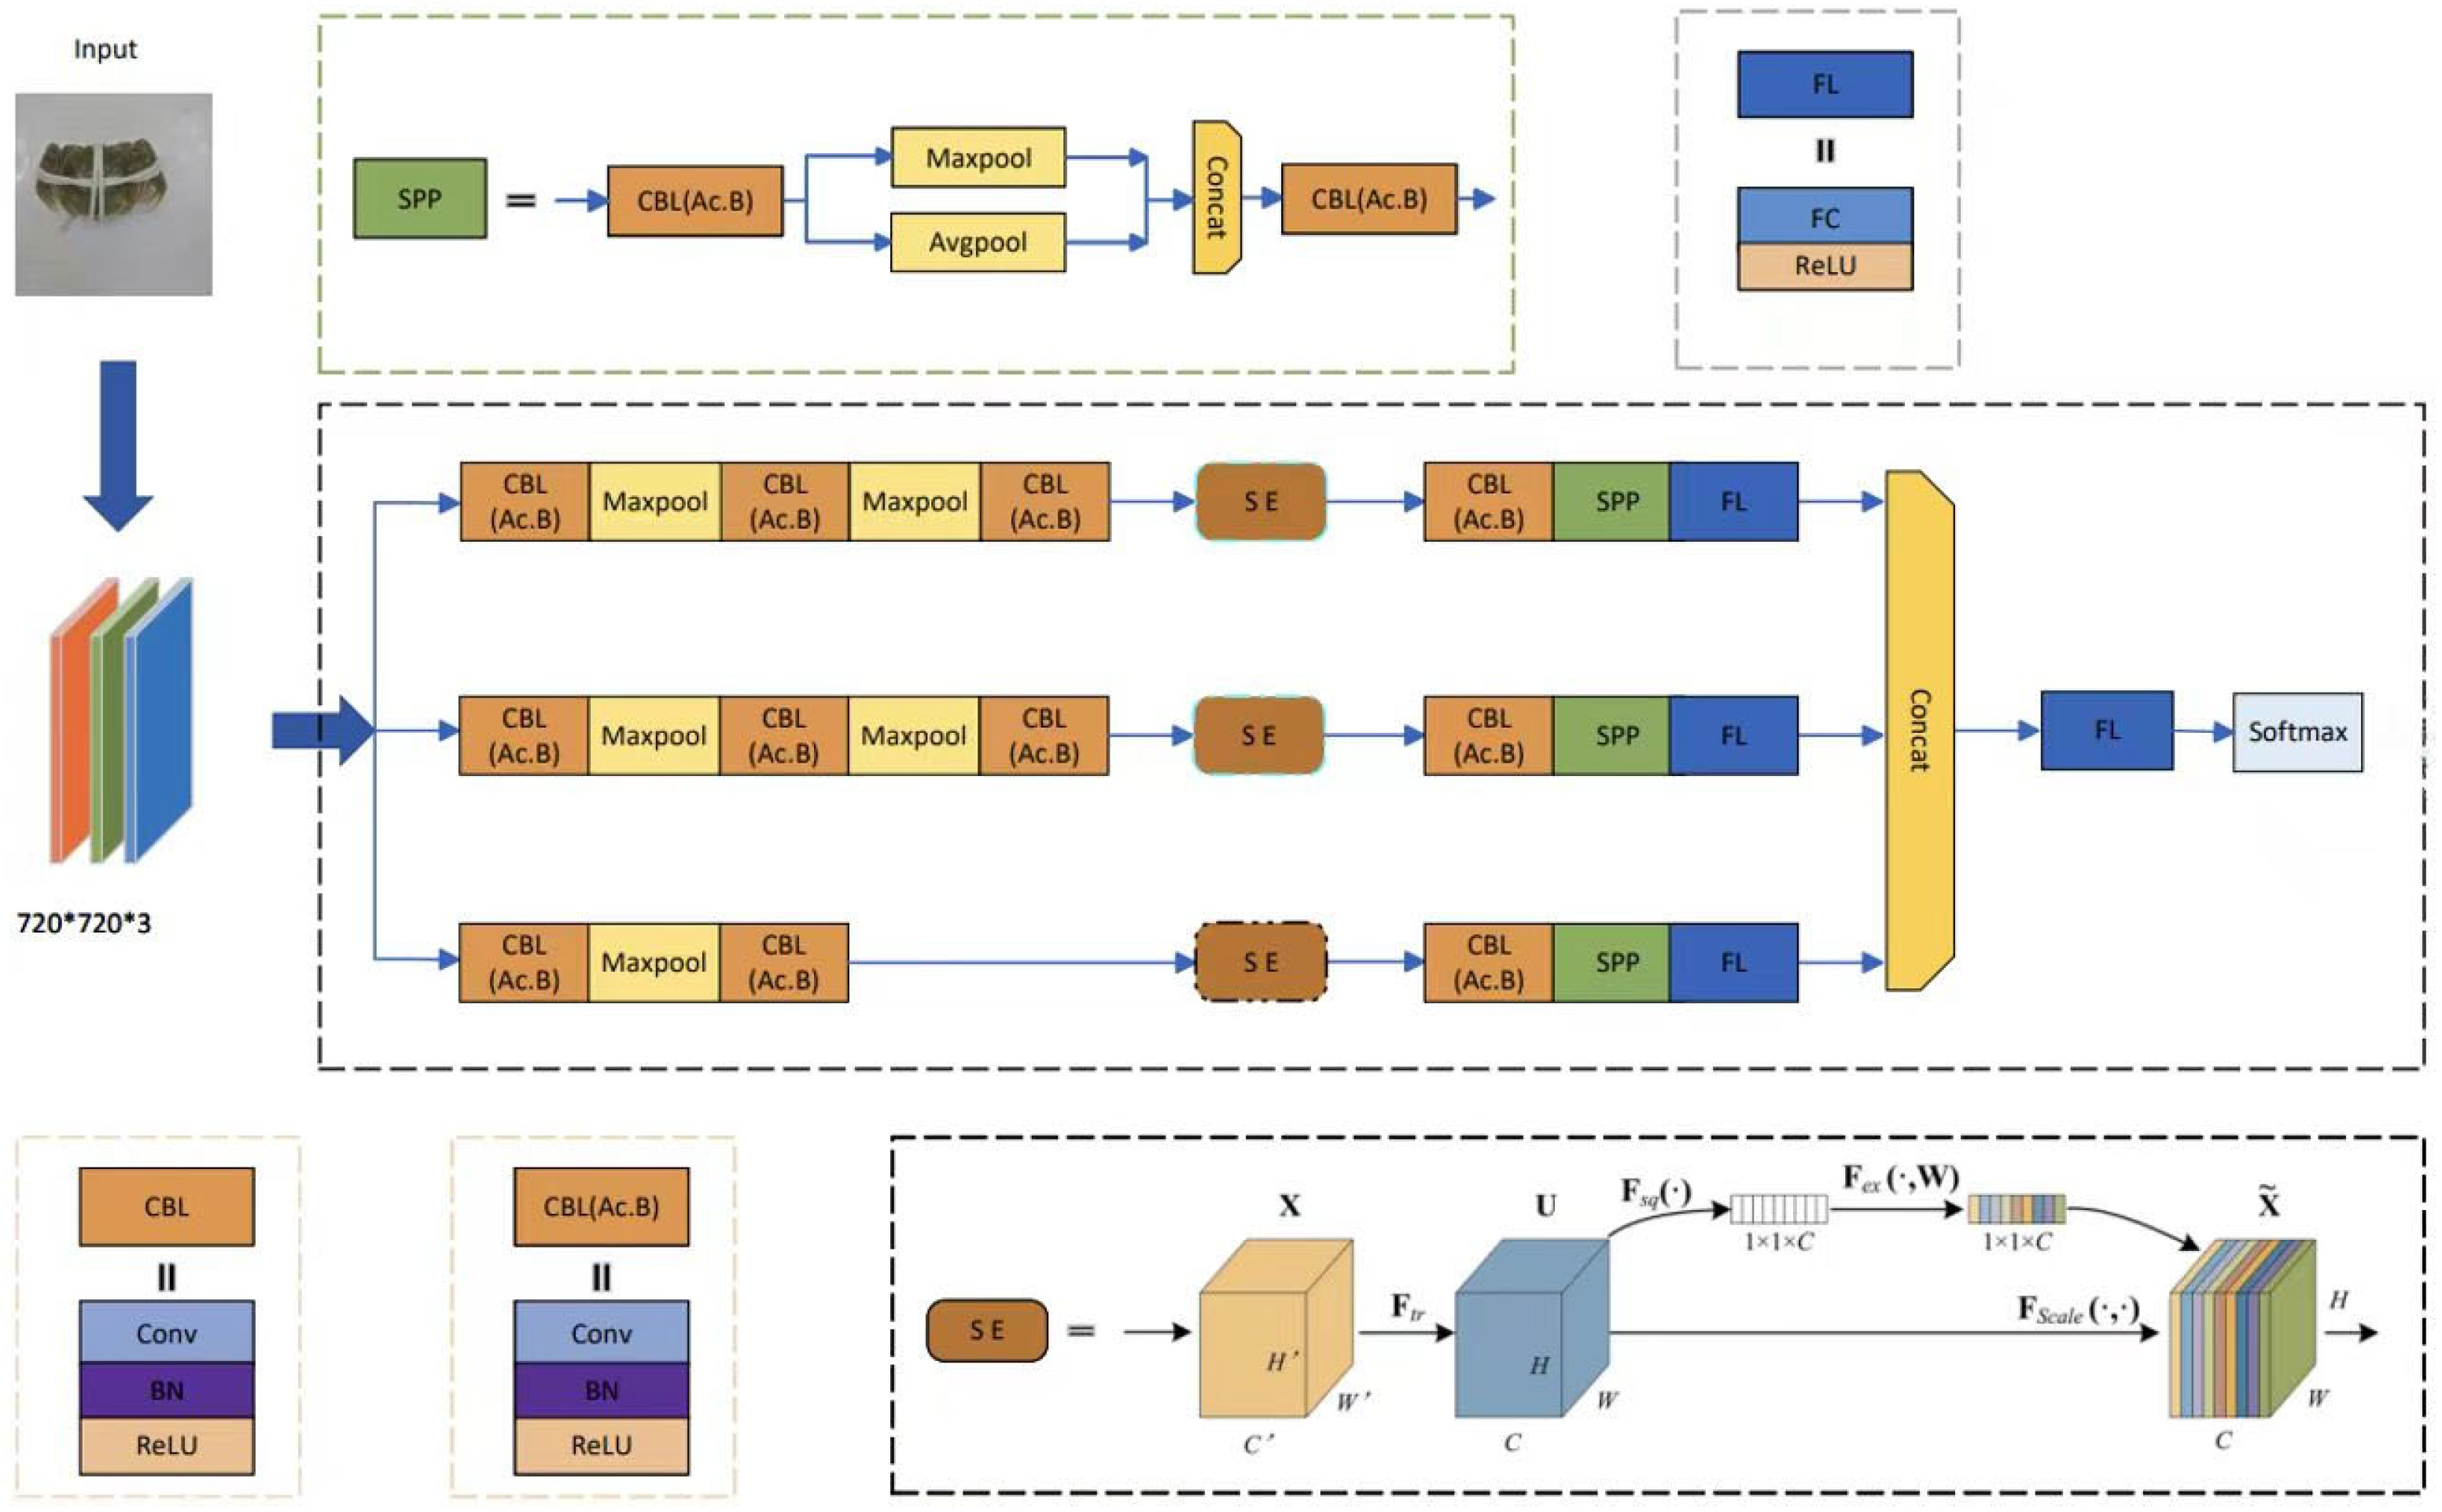
2.3. Classification Model IGINC
We first construct a CNN model with three parallel lines based on the Inception module of GoogleNet, as the basic architecture of the IGINC model. In each branch, we refer to the structure of the VGG16 model. The Inception module of GoogleNet is an important innovation in the field of deep learning, which is a deep convolutional neural network structure proposed by Google researchers. The basic idea of the Inception module is to improve the performance of the network by designing a wider network structure. This module typically includes multiple parallel convolution paths, each using a different size of convolution kernel. The outputs of these paths will be concatenated together to form a wider feature map. In GoogleNet, the Inception module uses convolution kernels of different sizes (such as 1 × 1, 3 × 3, 5 × 5, etc.), and also introduces pooling layers and 1×1 convolution layers to reduce dimensionality and computational complexity. Its advantage lies in its ability to effectively improve the network’s representation ability and computational efficiency. By using various convolution kernels of different sizes, the Inception module can capture more diverse feature information, thereby improving the accuracy of the network. At the same time, by designing the network structure reasonably and using 1 × 1 convolutional layers, the Inception module can effectively reduce the computational load and parameter count, thereby accelerating the training and inference process of the network.
Then, for the infrastructure of the proposed IGINC model, we designed the convolutional kernels of the CBL modules in each branch network. The AC.B module is used to replace the existing basic convolution to improve the network’s feature extraction ability. In addition, the SE attention mechanism module is introduced into the residual structure of the network to extract more detailed information such as feature positions, thereby improving the overall performance of the network. Meanwhile, a Batch Normalization (BN) layer was added between the convolution and activation to accelerate convergence and reduce model overfitting. Finally, we connect the fully connected layers of each branch together and obtain the final prediction result through the Softmax function. The structure diagram of the IGINC model is shown in
Figure 7.
2.3.1. Asymmetric Convolution Blocks
Inspired by Acnet, the AC. B convolution block is used in the IGINC model to replace the basic convolutions in the original CBL. As shown in
Figure 8, the AC. B consists of three parallel layers with kernel sizes of 3 × 3, 1 × 3, and 3 × 1. The 3 × 3 kernel is a regular convolution that can extract basic features from Chinese mitten crab images. The other two kernels are used to extract horizontal and vertical features, as well as position and rotation features. Therefore, the improved network has a stronger feature extraction ability for Chinese mitten crabs.
According to the superposition principle in convolutional operations, the designed AC. B module can directly replace the convolutional kernels in the existing network, and after feature extraction of the image, it can be stacked according to the operation method in Formula (2).
where,
I represents input, and
K1 and
K2 are two convolution kernels that are compatible in size. The purpose of combining
K1 and
K2 is to fuse directional or shape-specific features (e.g., horizontal, vertical, and spatial patterns). “⊕” represents a fusion of kernels into an equivalent kernel, based on the linearity of convolution.
Similar to conventional convolutional neural networks, each layer is normalized in batches as a branch, and then the outputs of the three branches are fused into branch as AC. B’s output. At this point, we can use the same configuration as the original model for network training without adjusting any additional hyperparameters.
2.3.2. Attention Mechanism
SE attention mechanism is a technique used to improve the performance of deep learning models, especially in convolutional neural networks. It helps the model adaptively adjust the importance of each channel by explicitly modeling the dependency relationship between input feature channels. The core idea of the SE attention mechanism includes two main steps, which are Squeeze and Excitation.
For Squeeze, each channel of the input feature map is compressed into a channel descriptor by performing a global average pooling operation, which reflects the spatial average response of each channel. For excitation, two fully connected layers (the first layer reduces the number of channels and the second layer restores the number of channels) and a sigmoid activation function are used to learn the weights of each channel. These weights are used to readjust the response of each channel in the input feature map.
In the IGINC model proposed in this article, we attempt to add SE at different positions. Through this approach, the SE attention mechanism enables the model to adaptively focus on the most important feature channels for the classification task of Chinese mitten crabs, thereby improving the model’s representation ability and performance. The SE module has relatively fewer parameters, thus achieving a balance between performance and computational overhead.
4. Conclusions
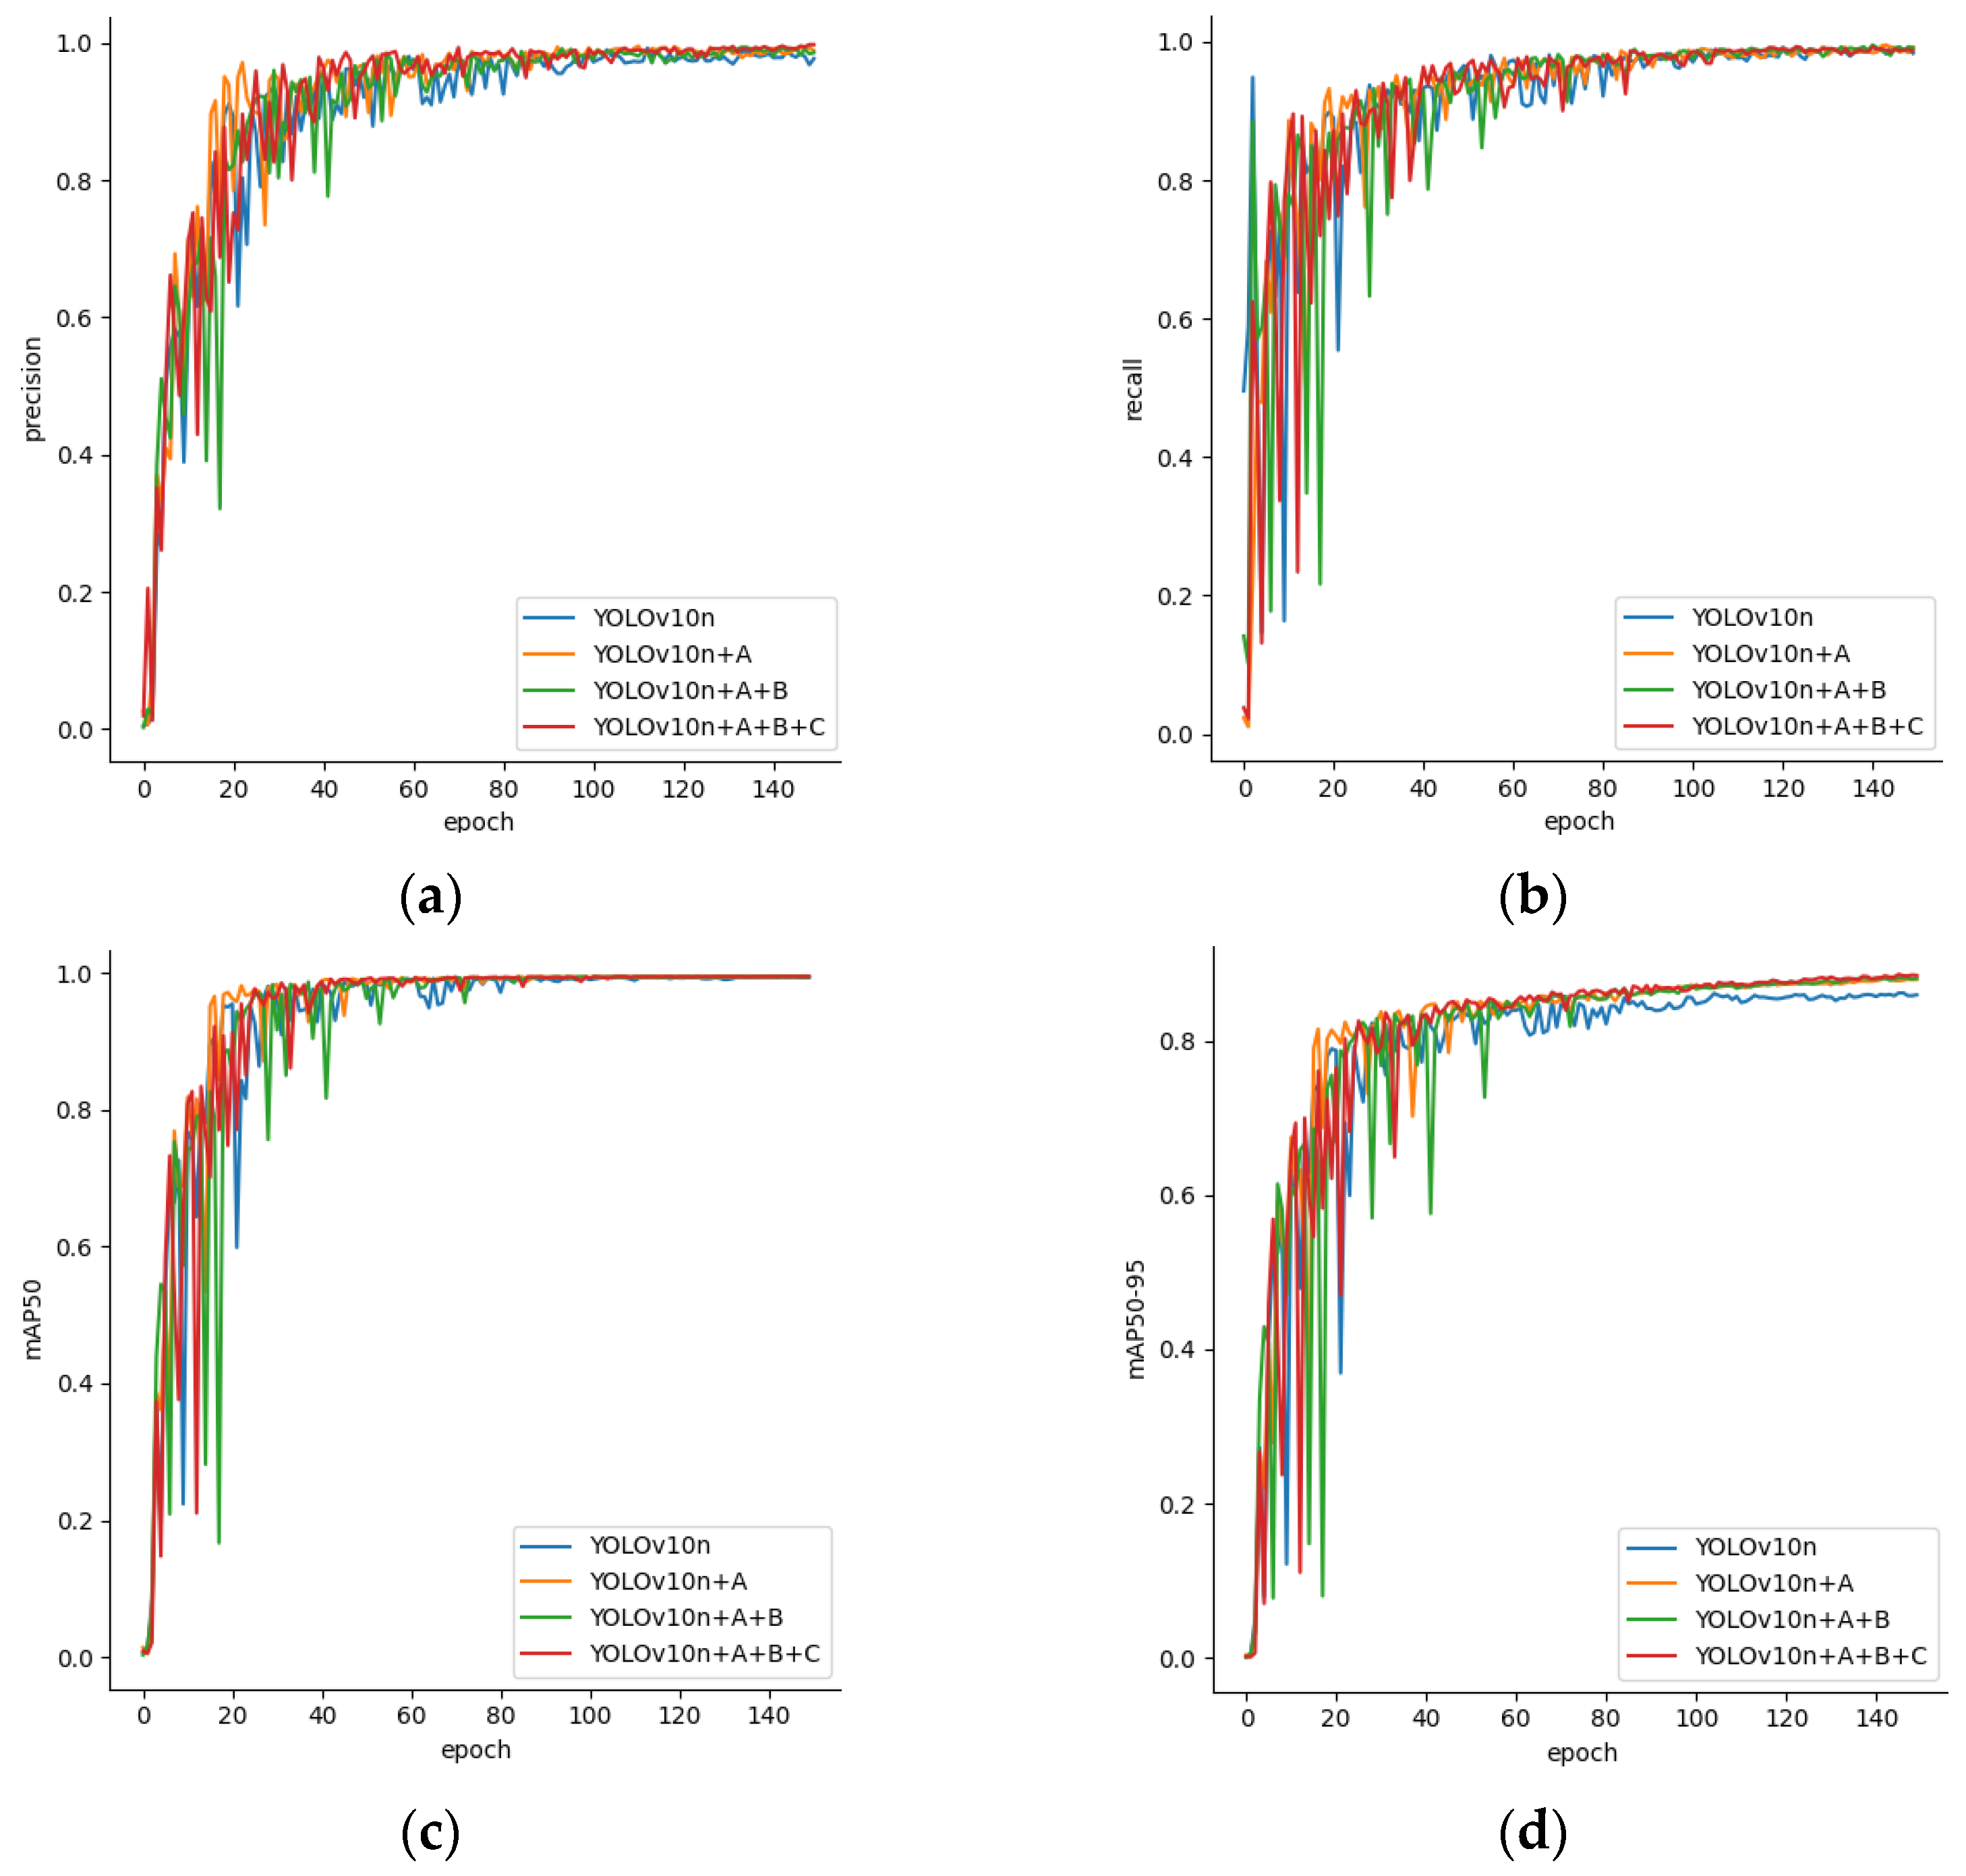
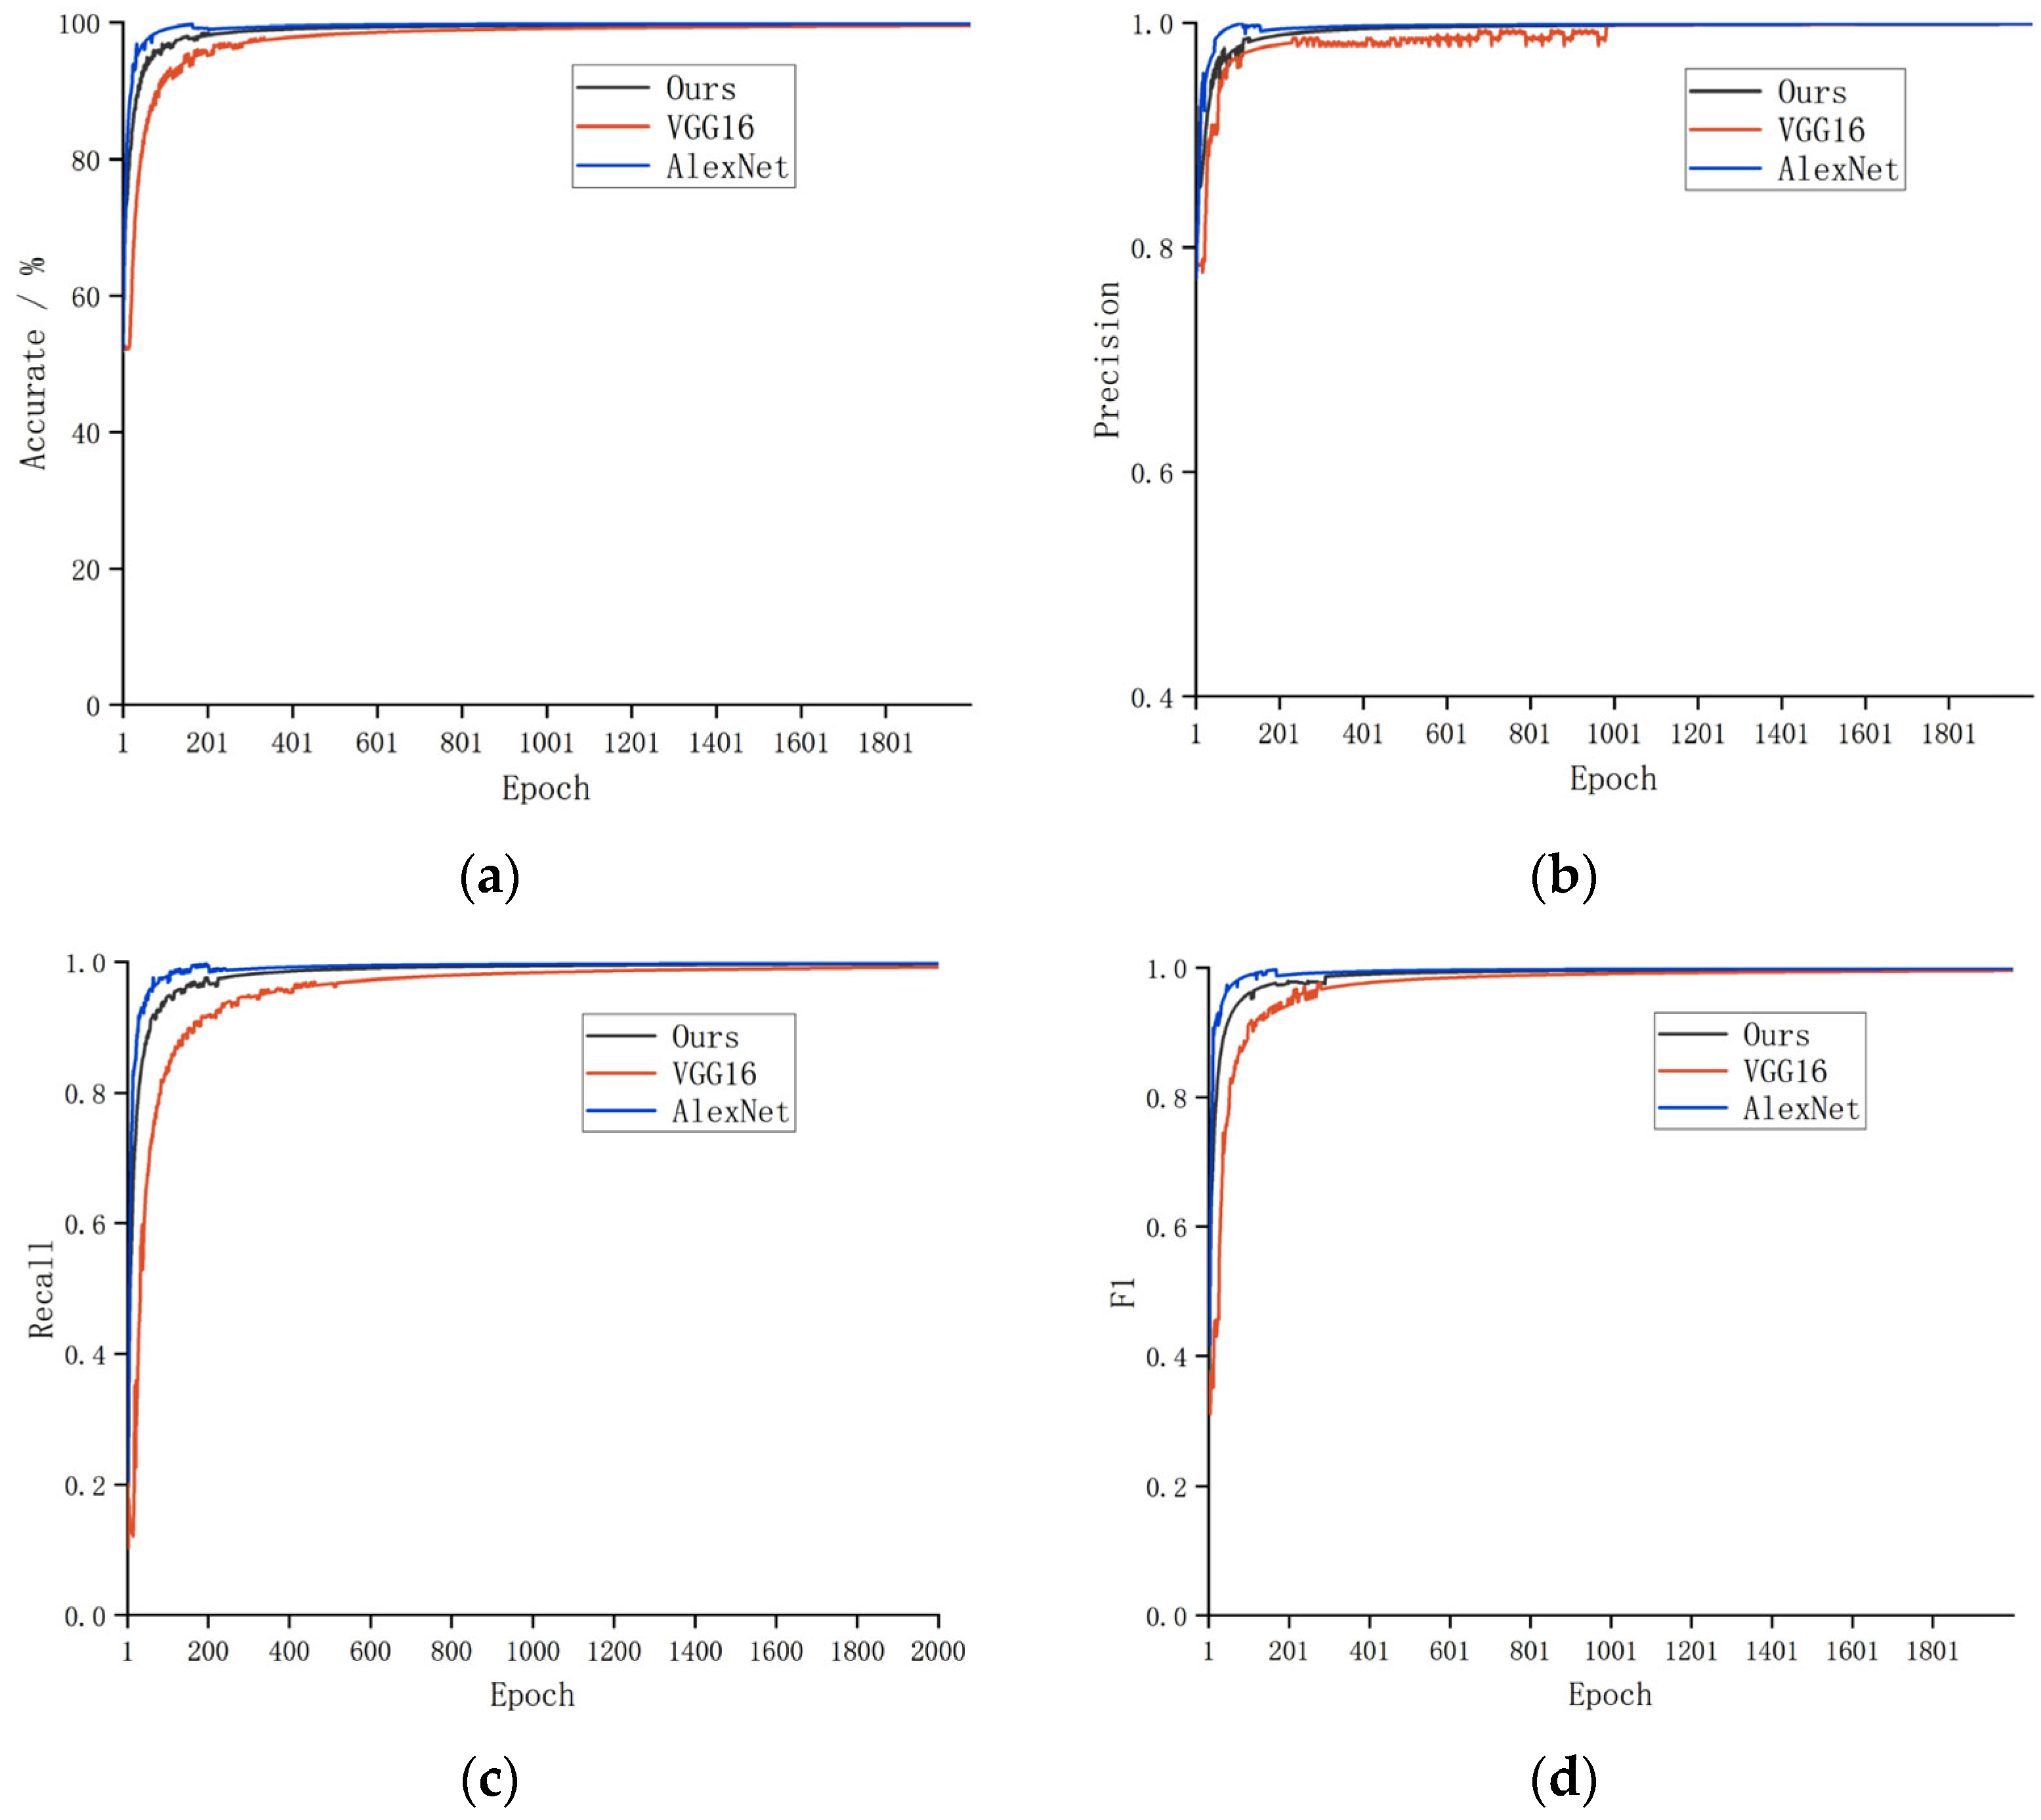
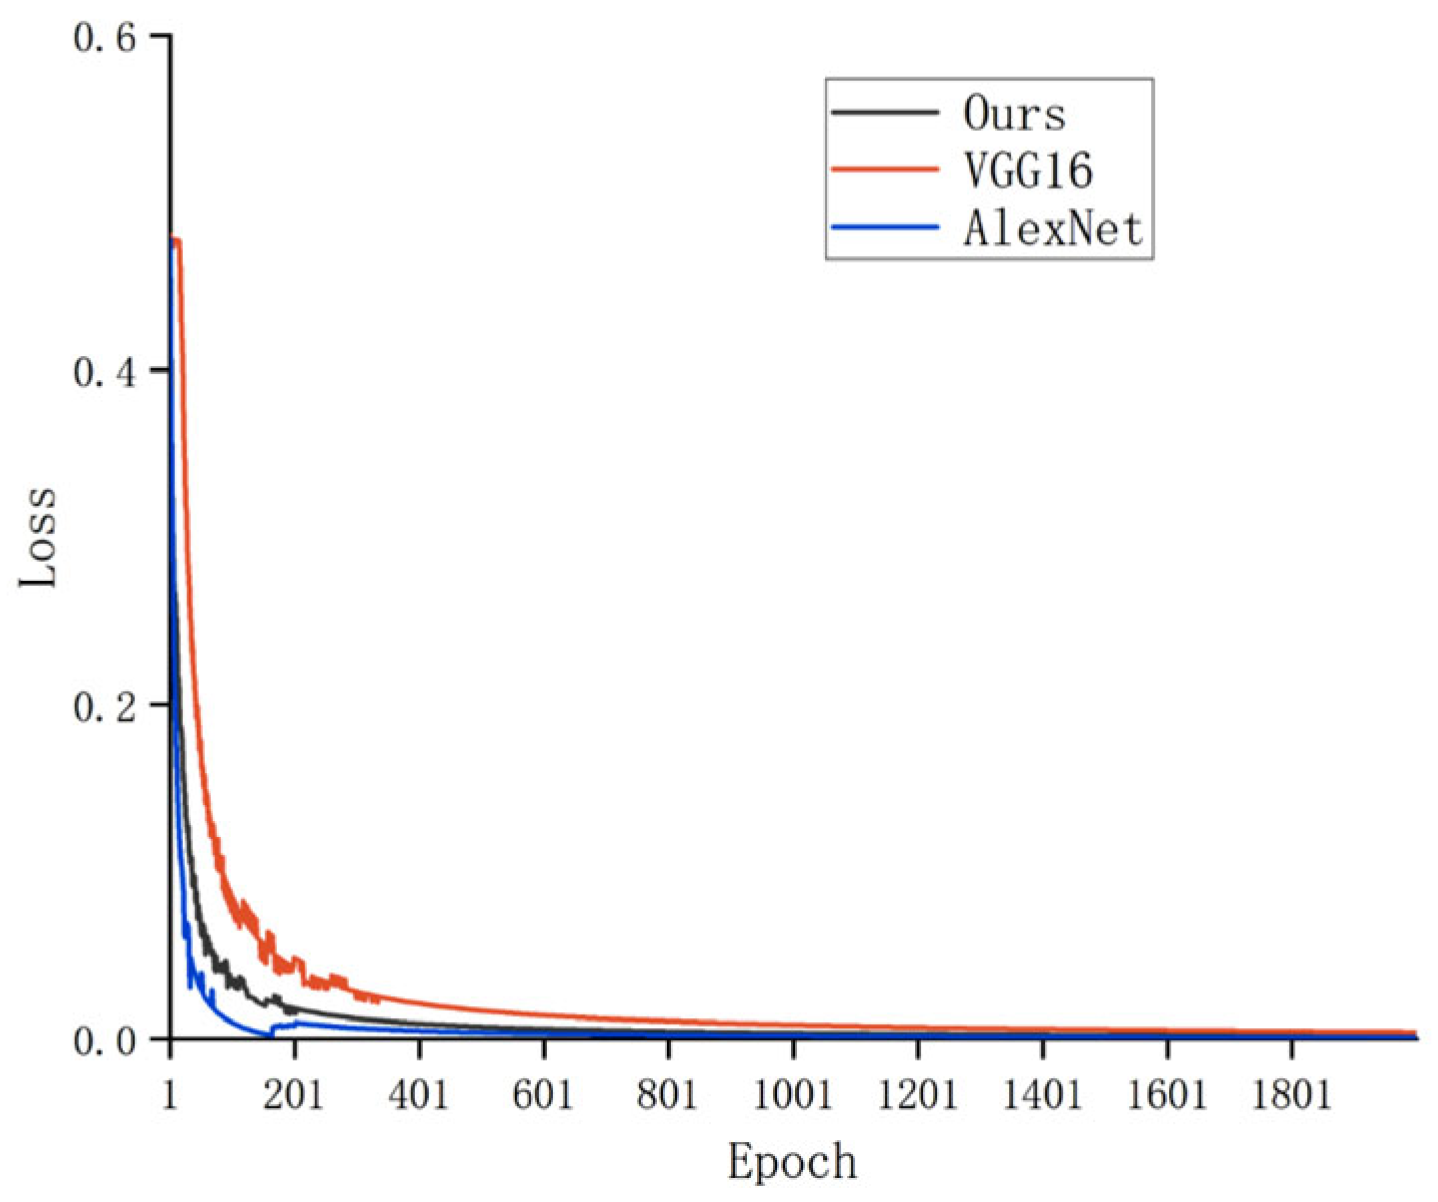
To address the challenge of accurately tracing the geographical origin of Chinese mitten crabs during the breeding and distribution processes, this paper proposes a two-stage traceability framework that integrates an improved YOLOv10n object detection model with a lightweight IGINC classification model optimized from GoogleNet. In the detection stage, a YOLOv10n-based architecture enhanced with ODConv, SlimNeck, and LSCD modules is employed to efficiently locate crab targets under complex backgrounds and multi-scale conditions. In the classification stage, an IGINC model based on GoogleNet is designed, incorporating asymmetric convolution (AC.B) and channel attention (SE) modules to achieve robust origin classification under diverse environmental variations. Experimental results show that the proposed detector achieves an mAP50 of 99.5% and mAP50–95 of 88.5% while running at 309 FPS, with a 35.3% reduction in GFLOPs. The IGINC classifier achieves 93.7% accuracy using only 17.4% of VGG16’s parameters and 40% of AlexNet’s.
Unlike traditional origin traceability methods based on morphological traits or elemental fingerprinting, this approach leverages deep learning to achieve more efficient and automated identification, providing strong technical support for crab quality control and market supervision. While the proposed two-stage framework achieves high accuracy and efficiency, it still has some limitations. The current model is trained on a dataset captured under controlled conditions and may require adaptation when applied to fully underwater or highly dynamic environments. Additionally, the system is currently designed for post-harvest identification. In future work, we plan to extend the framework to support real-time underwater crab recognition and expand the dataset to cover more farming areas and seasonal variations.


