Article

Sustainable Preservation of Historical Temples Through Ventilation Airflow Dynamics and Environmental Analysis Using Computational Fluid Dynamics

by
Mongkol Kaewbumrung
1,
Chalermpol Plengsa-Ard
2 and
Wasan Palasai
3,*
1
Department of Mechanical Engineering, Faculty of Engineering and Architecture, Rajamangala University of Technology Suvarnabhumi, Phranakhon Si Ayutthaya 13000, Thailand
2
Department of Mechanical Engineering, Faculty of Engineering, Kasetsart University, Bangkok 10900, Thailand
3
Department of Mechanical Engineering, Faculty of Engineering, Princess of Naradhiwas University, Narathiwat 96000, Thailand
*
Author to whom correspondence should be addressed.
Appl. Sci. 2025, 15(13), 7466; https://doi.org/10.3390/app15137466
Submission received: 10 June 2025 / Revised: 27 June 2025 / Accepted: 1 July 2025 / Published: 3 July 2025

Abstract

Preserving heritage sites is a complex challenge that requires multidisciplinary approaches, combining scientific accuracy with cultural and historical sensitivity. In alignment with UNESCO’s conservation guidelines, this study investigated the airflow dynamics and wind-induced structural effects within ancient architecture using advanced computational fluid dynamics (CFD). The study site was the Na Phra Meru Historical Temple in Ayutthaya, Thailand, where the shear stress transport k ω turbulence model was applied to analyze distinctive airflow patterns. A high-precision 3D computational domain was developed using Faro focus laser scanning technology, with the CFD results being validated based on onsite experimental data. The findings provided critical insights into the temple’s ventilation behavior, revealing strong correlations between turbulence characteristics, wind speed, temperature, and relative humidity. Notably, the small slit windows generated complex flow mixing, producing a large internal recirculation zone spanning approximately 70% of the central interior space. In addition to airflow distribution, the study evaluated the aerodynamic forces and rotational moments acting on the structure based on five prevailing wind directions. Based on these results, winds from the east and northeast generated the highest aerodynamic loads and rotational stresses, particularly in the lateral and vertical directions. Overall, the findings highlighted the critical role of airflow and wind-induced forces in the deterioration and long-term stability of heritage buildings. The study demonstrated the value of integrating CFD, environmental data, and structural analysis to bridge the gap between conservation science and engineering practice. Future work will explore further the interactions between wall moisture and the multi-layered pigments in mural paintings to inform preservation practices.

1. Introduction

Current global warming exerts pervasive impacts on all terrestrial and marine ecosystems, atmospheric dynamics, and geological processes on the Earth, especially heritage, which has a long life span and must be preserved to appreciate historical context. Exposure to variations in the environment over long periods means that the rate of damage to historical objects can accelerate. In archaeology, there is a continuous effort to develop new methods and technologies for preservation and more precise restoration, including new protection techniques, materials compatible with original ones, and advanced equipment for monitoring damage. However, some projects can only be implemented in specific areas due to cultural, material, expertise, and location differences. Techniques such as lime plaster consolidation, commonly used in European heritage conservation, may be unsuitable for heritage structures in Ayutthaya due to differences in tropical climate, elevated humidity levels, and the unique composition of laterite and traditional clay-based materials characteristic of Thai temples. In Thailand, traditional architecture dates back to the early Ayutthaya period, over 600 years ago. Many materials used in these structures are organic and specific to local sources. For example, the original compounds used in the Ayutthaya era may differ from those in the Sukhothai era, even though they have been sourced from the same region. This variation explains why certain globally applied preservation techniques may not be suitable for heritage objects in the Ayutthaya area. Similarly, traditional buildings in Ayutthaya, while different within the same region, require a clear understanding of basic airflow behavior before taking the next steps in conservation. Although published research from other areas may not be entirely applicable, it can provide a foundation for adapting conservation methods to suit specific purposes.
The managers of heritage sites worldwide are well aware of the problem of global warming as a world issue to be addressed in preserving heritage, with UNESCO recommending reducing potential sources of deterioration [1]. Annual publications provide valuable insights into the progression of research in heritage science and gaining more understanding of the aggressiveness of rainfall erosivity that must be combatted as an environmental hazard [2]. Mechanisms were developed to investigate the erosion impact of wind-blown sand by establishing meteorological observation equipment, with the results of the research showing that velocity was the main cause of wind-induced erosion [3]. A wind tunnel was used to examine the wind pressure distribution in the gothic-style Notre Dame Cathedral in Paris, to help describe the complexity of the building structure regarding its aerodynamic characteristics [4]. Decadal rainfall variability was reported to significantly influence moist thermodynamic behavior, affecting humidity fluctuations [5]. Unsteady moisture levels can lead to the degradation of cultural heritage buildings [6]. In addition, extreme temperatures, whether excessively cold or hot, can induce cracking and accelerate the degradation of long-serving materials [7]. Consequently, climate change and air pollution cause natural erosion, exacerbating the deterioration rate in heritage buildings [8,9]. Relevant to the current situation, where most damage has been related to humidity, non-destructive microwave techniques have been developed elsewhere for quantifying and eliminating moisture in cultural heritage monuments; based on evaluation of the damage, there have been promising results from experimental testing [10].
Biodeterioration and biodegradation are caused by excessively high levels of moisture in the air that building materials absorb and accumulate both internally and on surfaces [11]. One crucial challenge associated with conservation at the Na Phra Meru Historical Temple in Ayutthaya, Thailand, is to identify the microbes involved in the biodeterioration process, since moist and wet surfaces can encourage and support fungal growth, especially in the crypt, in addition to the poor ventilation system and the complexity of the interior and exterior architecture [12]. Controlling biodeterioration of cultural heritage objects using biocides has been investigated, and various procedures have been developed [13]. Historical objects are endangered by degradation procedures originating from physical, chemical, and biological weathering agents. UV and gamma radiation also accelerate the fungal biodeterioration of wall-construction materials such as concrete [14]. Hence, a microbiological monitoring protocol for conservation is critical to guarantee that all processes are being well monitored because factors, such as air movement, lead to increased temperature and the accumulation of contaminated sediments [15]. The weathering process should be analyzed in detail to protect historical objects using suitable restoration cleaning techniques [16].
It is challenging to understand the dynamics of accumulated moisture and airflow in a heritage building, as much of the detail is not visible to the naked eye because of the unique architecture in each country based on local traditions. Consequently, the study of computational fluid dynamics (CFD) simulation has been investigated on outdoor urban structures using an idealized building array [17]. Similar work was carried out on the indoor microclimatic conditions for the conservation of a church in Italy, where the description provided by the CFD and Building Energy Simulations (BES) showed that the variation in indoor temperature was affected by the season [18]. The seasonal variation from the summer monsoon rainfall associated with the El Niño oscillation was studied regionally and temporally in India and confirmed that the variation corresponded to the variability of monsoon troughs and depressions. Furthermore, climate change globally is the source of seasonal variation, with major differences in methodology due to specific environmental factors [19]. These rapid fluctuations, caused by seasonal changes to the air becoming too dry, will induce the risk of delamination and deterioration of materials inside the building and in mural paintings [20]. Additionally, extreme temperatures pose great danger to heritage building structures, potentially leading to the formation of cracks, scaling of surfaces, condensation issues, and eventually, to structural collapse. Such detailed analysis involving CFD and a digital twin platform showed that improving the location of the heater would result in a 62.9% reduction in damage to a heritage building [21]. A case study on intelligent digital twin platforms in China was applied to address disparities among indoor air quality assessment, prediction, and control. The findings indicated that most air quality issues arose during the early morning hours of winter. The system was very effective in the prompt prediction of these issues and in issuing control signals for adjusting occupied spaces that exceeded predetermined healthy thresholds [22]. Studying airflow behavior in building and ventilation systems is becoming increasingly important for scientists because global warming is becoming more and more associated with conservation. A deep understanding of flow structures is vital to forecast the next generation of approaches in preventive conservation. A couple of numerical and experimental studies have investigated natural ventilation in historic residential buildings using CFD, where all the examined scenarios had potential for energy conservation across seasons, particularly in spring, with cross ventilation emerging as the most effective strategy [23].
The current study explored airflow behavior within the ancient ventilation system of the Na Phra Meru Historical Temple (Wat Na Phra Meru) situated near the Ayutthaya Historical Park, Thailand. Previous research did not fully capture the complexity of airflow within this unique architectural structure, leaving gaps in our understanding that are crucial for archaeologists to fill in formulating effective preventive conservation strategies [17,18,23]. The current research study aimed to analyze the recirculation zones formed by different wind directions, focusing on their role in moisture accumulation and uniformity. Additionally, this study examined the distribution of air properties to evaluate airflow patterns and their environmental impact within the Temple. CFD simulations were used to achieve this, incorporating local boundary conditions obtained from onsite measurements. The accuracy of the simulations was validated using academic test cases and experimental field data. The findings from this study should enhance scientific understanding of airflow dynamics in historical structures by providing insights that can inform the improvement of ventilation systems within the ordination hall. Furthermore, the results should help to identify potential risks of deterioration within the Temple, supporting the development of more effective conservation measures. The conservation plan workflow is illustrated in Figure 1, highlighting the critical role of CFD in steps 4 and 6, serving as a key tool for developing sustainable conservation strategies.
This study focused on numerical analysis of the Na Phra Meru Historical Temple, near a river in central Thailand, as depicted in Figure 2. The Temple is being directly impacted by humidity due to evaporation from the river throughout the year. Sustainable preservation and conservation planning require a good understanding of the air current flow behavior within and around the Temple. From a historical perspective, the Temple was chosen for this study because it is one of the few that has remained intact, having escaped destruction during past conflicts since 1767.
The details of historic antiques are described in Figure 3.

2. Historic Building Geometry for Simulation

Thailand’s heritage sites are governed by national legal protocols and UNESCO guidelines, requiring strict adherence to minimize potential damage during research activities. Although the Na Phra Meru Historical Temple is not officially listed as a part of the UNESCO Heritage area, its proximity to a recognized heritage area necessitates compliance with UNESCO protocols to ensure its preservation and proper care. We utilized FARO focus laser scanning technology, Focus3D with 250,000 points/s, and a measurement tolerance of within ±2 mm. The scanning procedure scanned outside and inside the main ordination hall without affecting the heritage building [24,25] and took 4 days to complete. The 3D surface and solid volume were produced using the ANSYS SpaceClain and ANSYS Design Modeler version 2024R1, as shown in Figure 4. To overcome the limitation of very complex traditional ancient Thai architecture, we cut out the more elaborate details for simplification. However, the principal dimensions and details were retained.

3. Methodology and Mathematical Formulations

The previous section discussed the problem formulation and developing the detailed 3D model of the heritage building, including unique architectural features and interior spaces. Accuracy in representing the building’s layout involved including windows, doors, corridors, and other openings. This section discusses onsite measurement and the initial and boundary conditions, flow physical properties, turbulence modeling, solver selection, and the numerical setting.

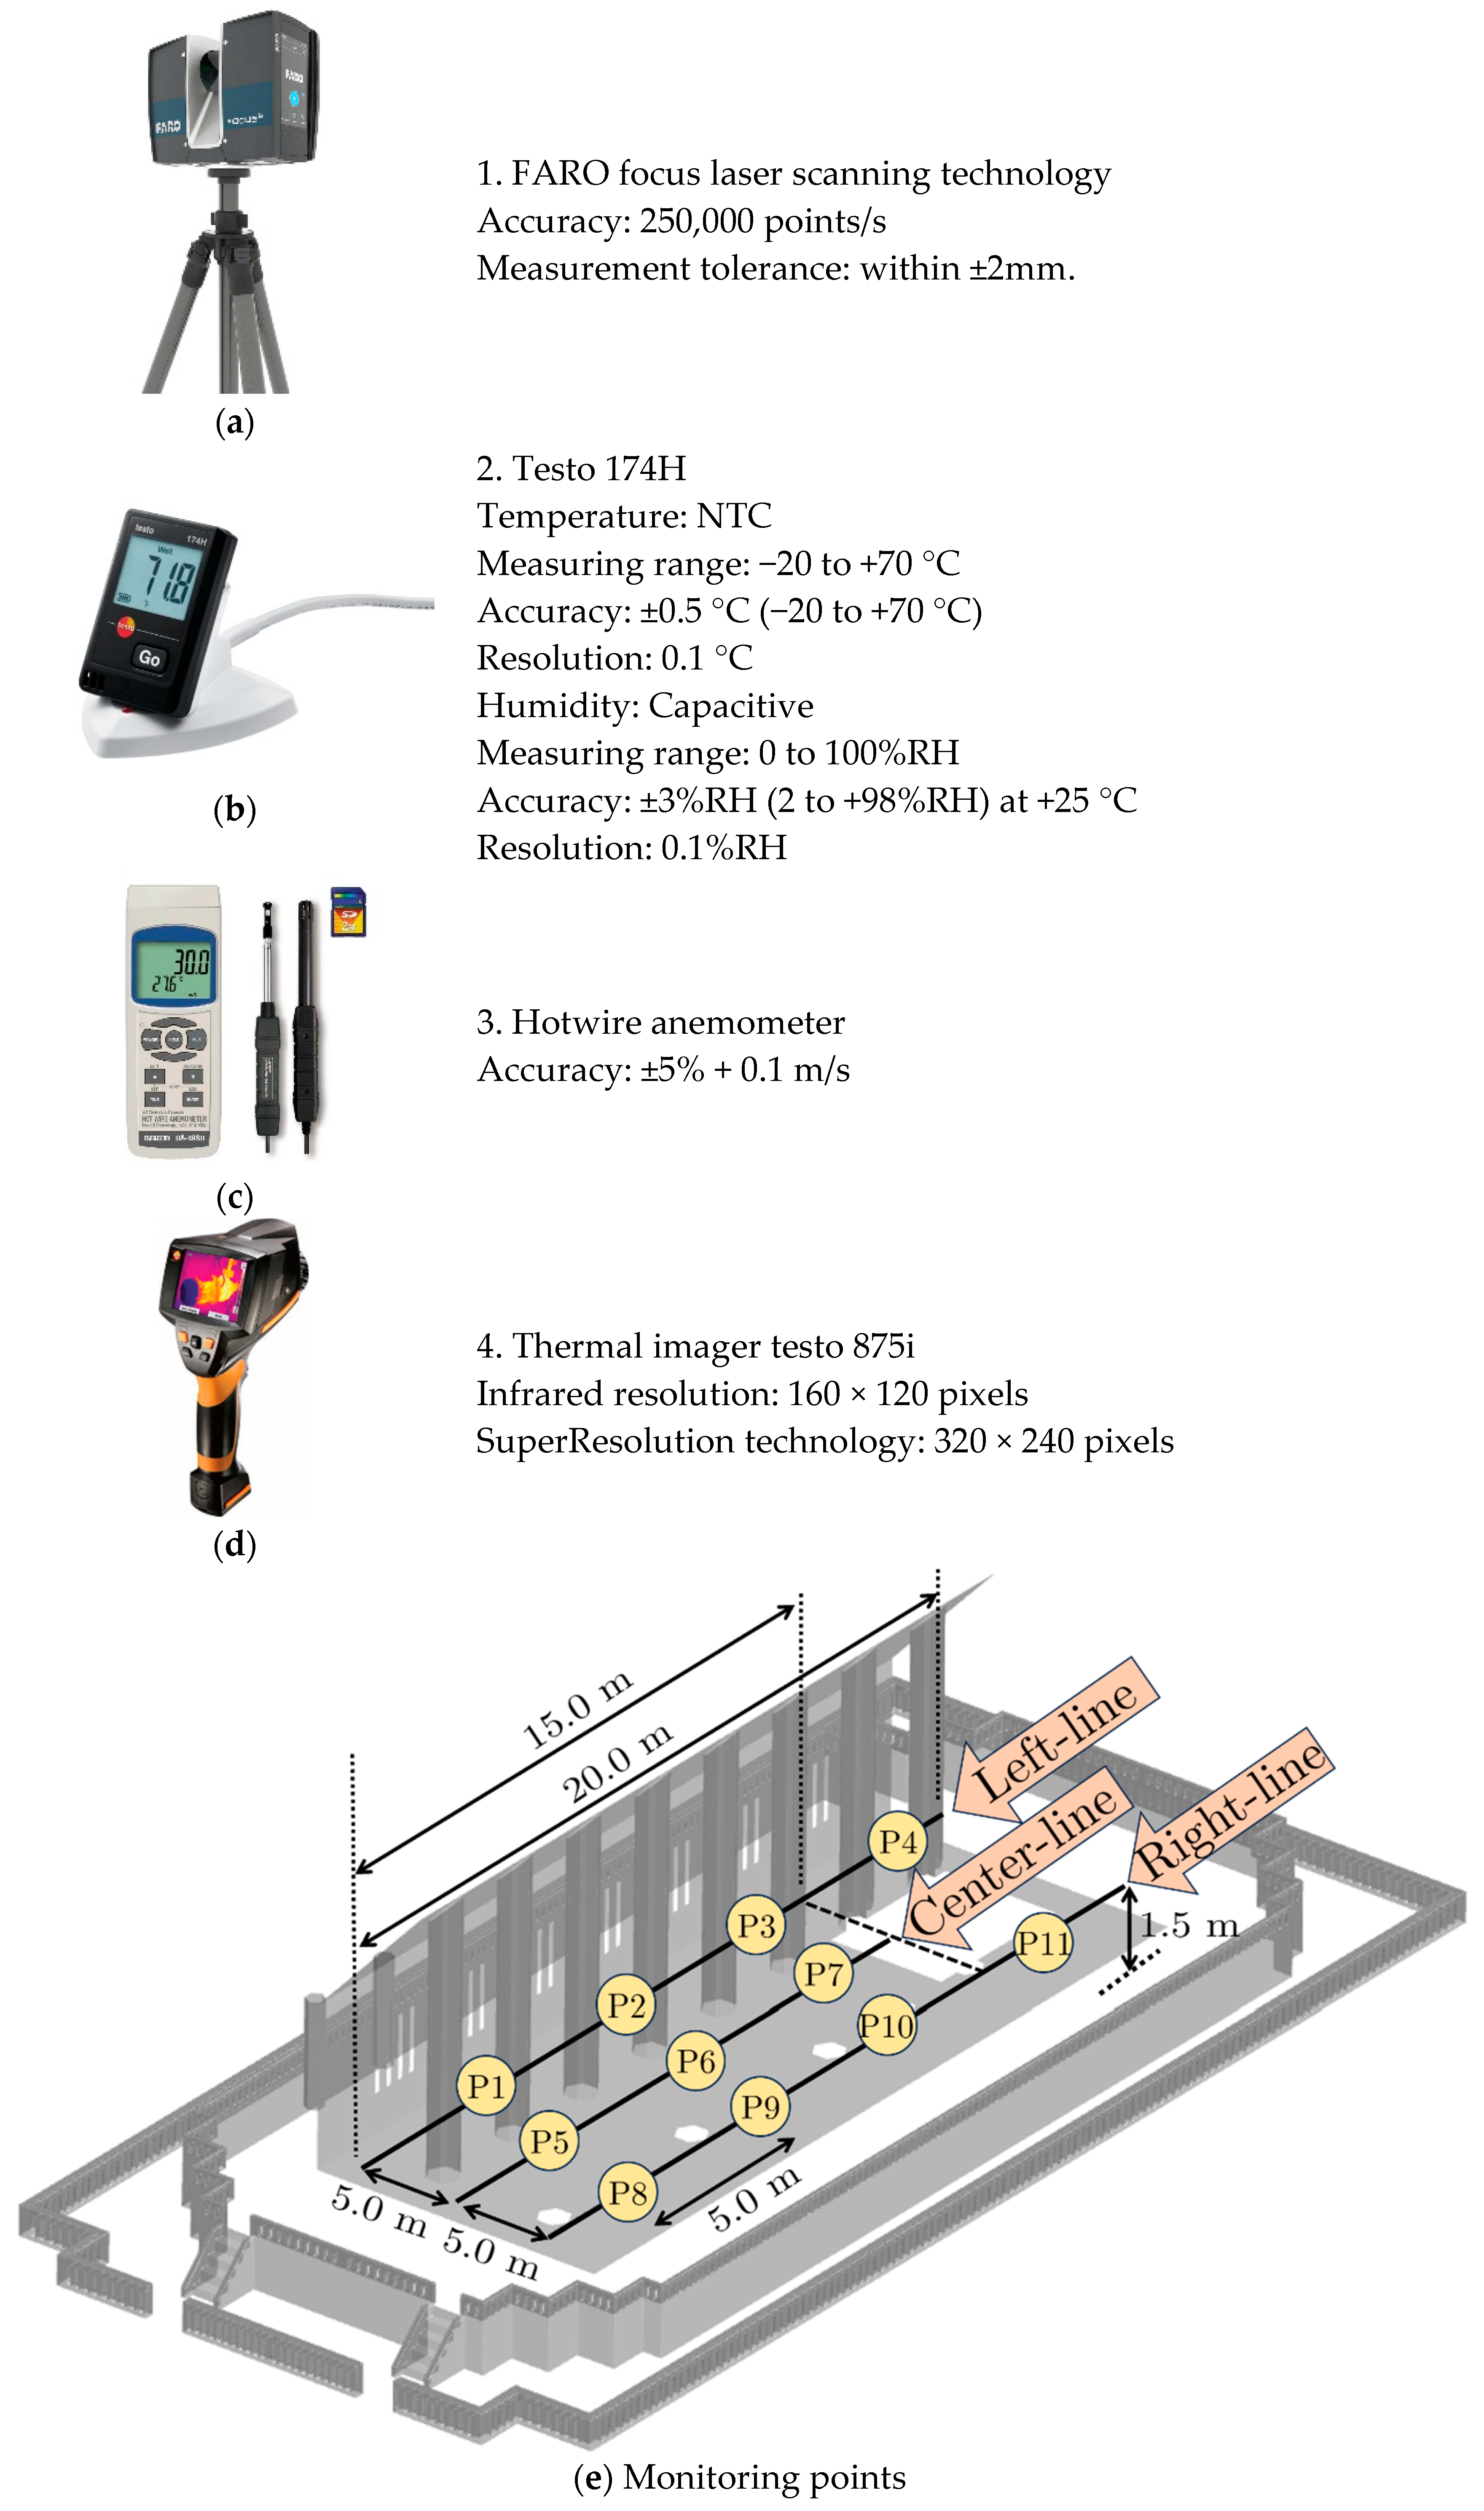
3.1. Onsite Measurement for Realistic Boundary Conditions

Microclimatic conditions (air velocity, temperature, and relative humidity) were measured to use the actual climatic conditions during the reference periods. Due to the popularity of the Na Phra Meru Historical Temple, which attracts over a thousand tourists daily, it was impractical to close the entire site for an extended period to conduct experiments. Consequently, we received authorization to temporarily restrict access only to the installation points for the duration of the study, with a limited time frame of just 3 h. The monitoring process was conducted across four different periods, beginning on 9 August 2024, from 8:00 to 11:00 AM. Data for velocity, temperature, and relative humidity were recorded at 15 min intervals during the 3 h to establish boundary conditions and validate the results. The measurement points and equipment used in this onsite monitoring, along with their accuracy and tolerance levels, are illustrated in Figure 5.
The measurement data for air velocity, temperature, humidity, and thermal heat flux are presented in Table 1 under Case 1 (Validation). Additional cases represent scenarios designed to explore flow behavior within the heritage building. The average values derived from the measurement data were utilized. It was assumed that all aerodynamic properties remained uniform and constant across the incoming plane, which served as the inlet boundary condition.

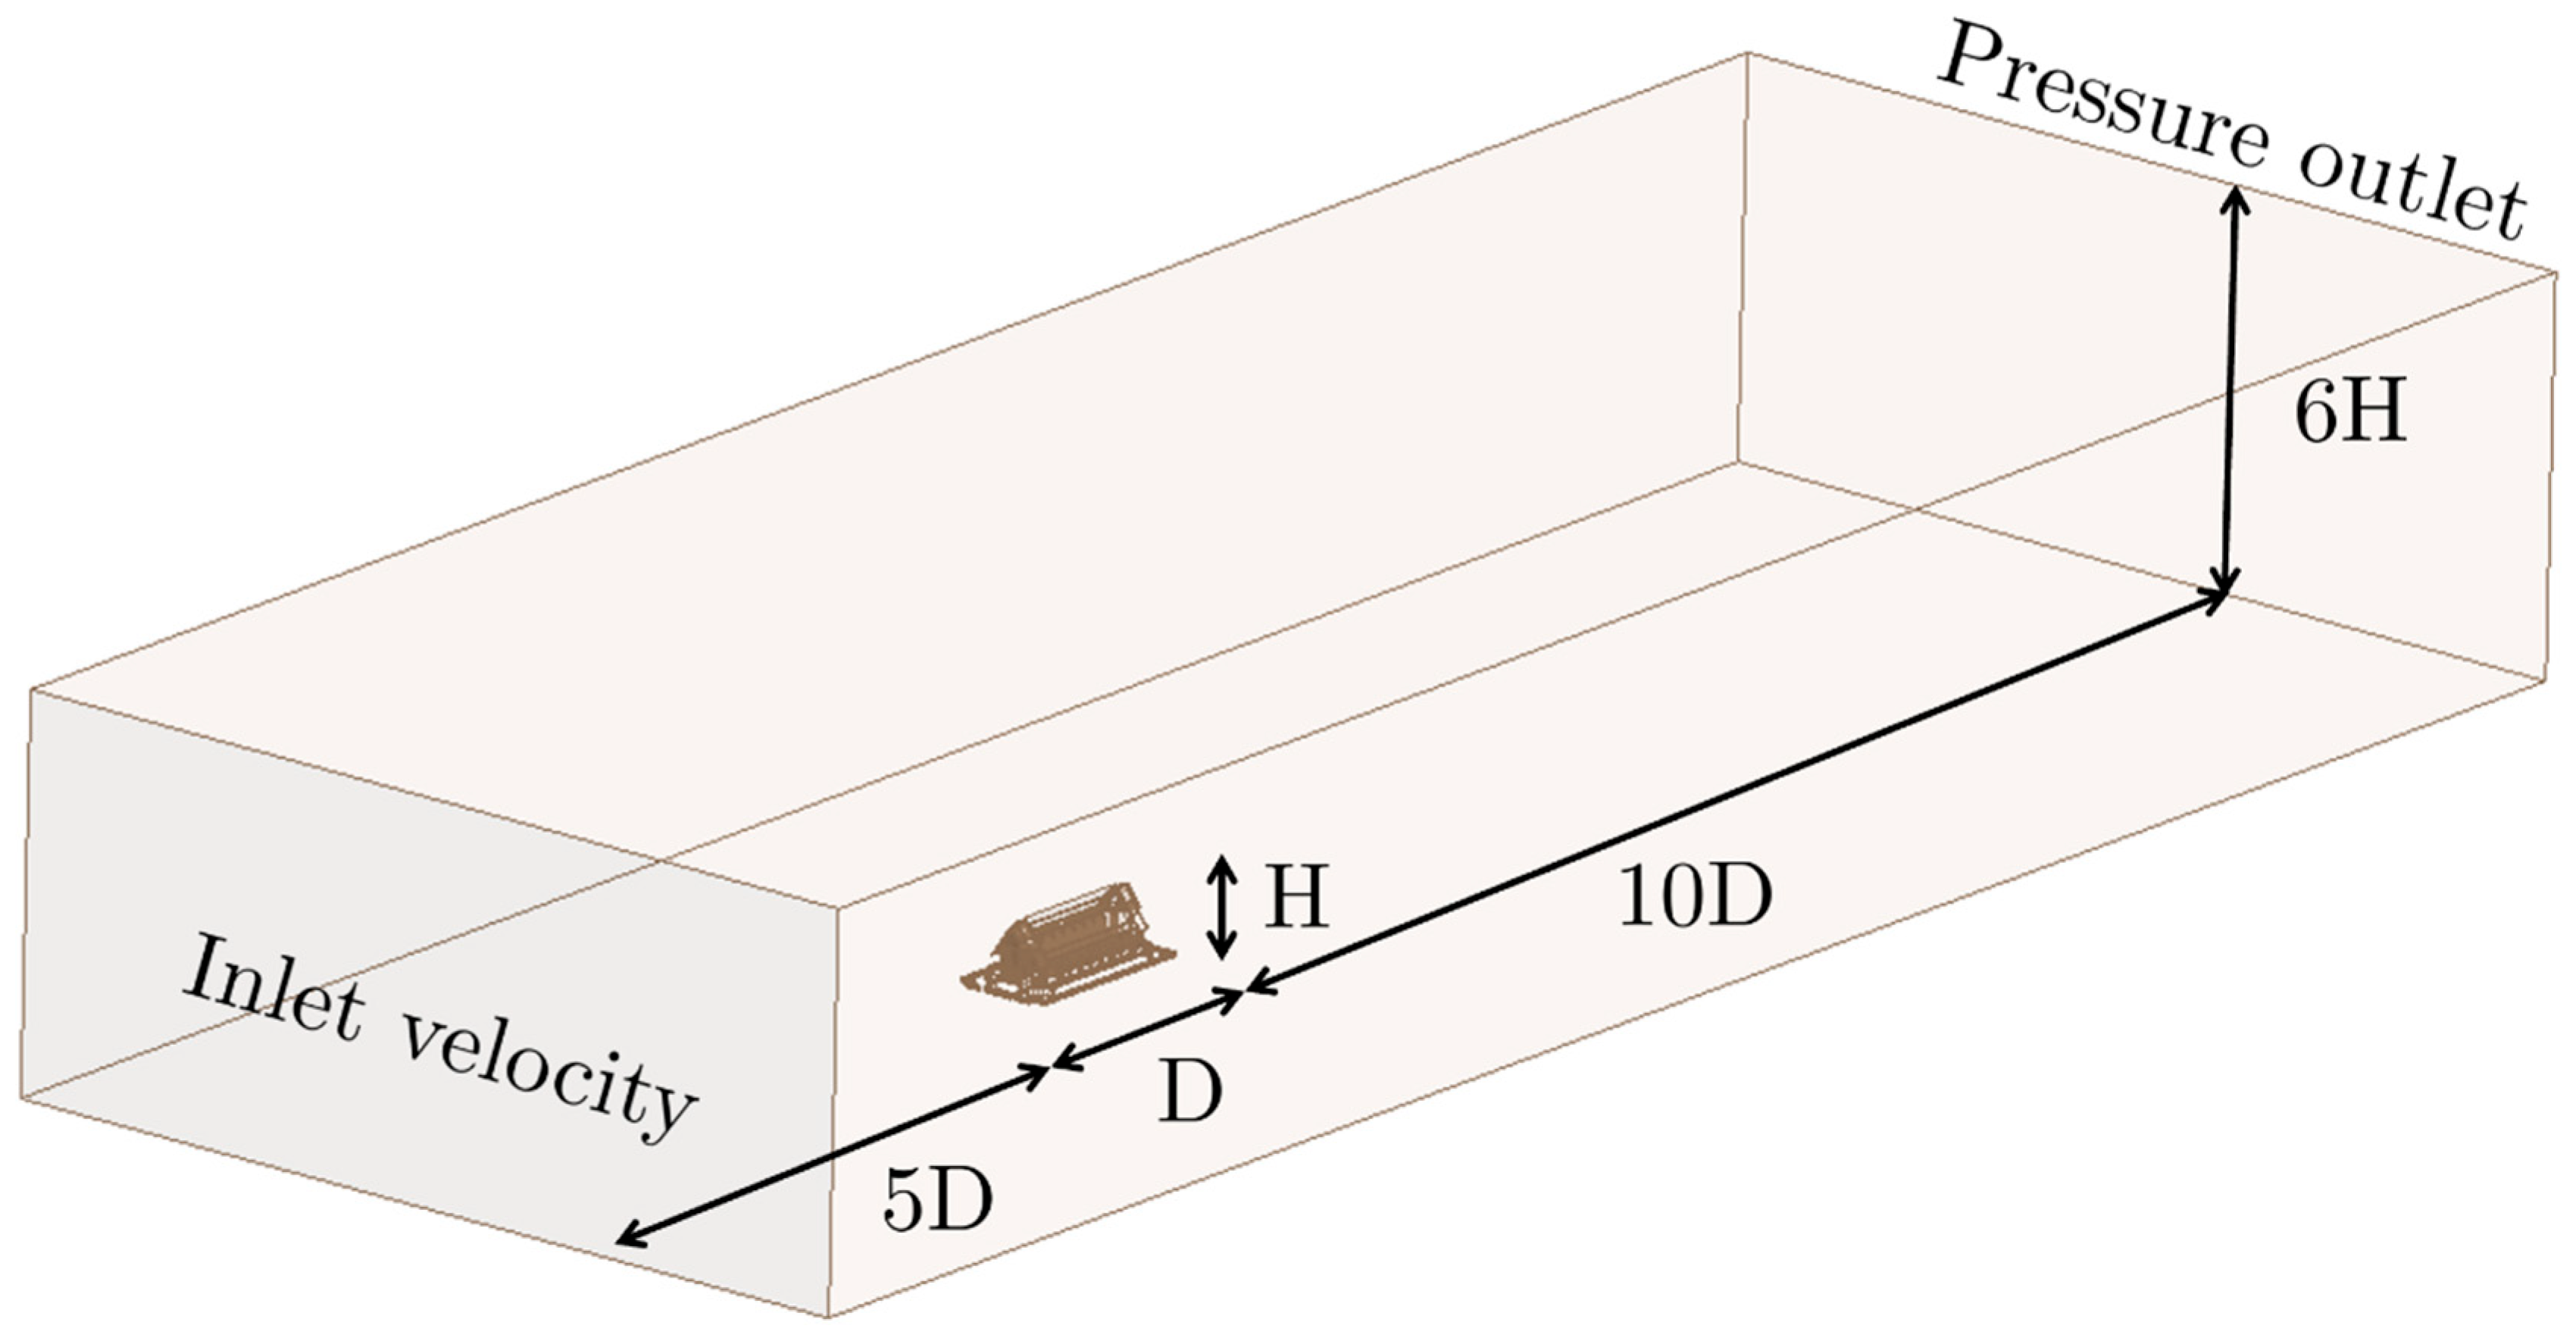
3.2. Computational Boundary Condition

The accuracy of CFD simulations is influenced not only by grid resolution and numerical settings but also critically by the initial and boundary conditions. This study established boundary conditions based on measurements taken within the main ordination hall to ensure a realistic representation of the physical environment. Figure 6 provides details on the sizing of the computational domain, designed following standard guidelines and recommendations [26,27,28,29]. The domain was set with an upstream length of 5D to account for the incoming flow, a downstream length of 10D to allow for full wake development, and a height of 6H for adequate vertical resolution. However, these dimensions were slightly adjusted based on the availability of computational resources or to address solution instability during simulations. This practical approach enhanced the reliability and applicability of the simulation results.

3.3. Airflow Physics and Turbulence Modeling

The complexity and non-symmetry of the building led to the airflow behavior being more chaotic and fluctuating, as well as a coupling between heat transfer and muti-species of moisture. The mathematical formulation of the flow consisted of the conservation of mass, conservation of momentum, conservation of energy, and conservation of species, respectively. The equation is described in the following subsection.

3.3.1. Transport Equations for Shear Stress Transport Turbulence Model

The shear stress transport (SST) model has been widely used in many applications and building airflow simulations [27,30,31,32,33,34]. The transport equation is also different based on our inclusion of the species transport to represent the moisture distribution in the stupa. The Reynolds-averaged Navier–Stokes equation was used to describe the fluid flow, with turbulence kinetic energy (TKE, k) and the turbulence-specific dissipation rate (SDR, ω) used to represent the flow behavior. The set of steady-state equations is shown below:
ρ U = 0
ρ U U = p + U + U T 2 3 U I
x i ρ k U i = x j μ + μ t σ k k x j + Φ k Ψ k
x i ρ ω U i = x j μ + μ t σ ω ω x j + Φ ω Ψ ω + D ω
U ρ E + p = j h i J j
All the equation constants in Equations (1)–(5) can be found the ANSYS Fluent Theory guide [35].

3.3.2. Species Transport Equations

Humidity is the concentration of water vapor in the air depending on the temperature and pressure of the system of interest. The transport of moisture occurs via convection and binary diffusion in the air. The governing transport equation was:
ρ U Y i = ρ D i , m + 1.428 μ t Y i D T , i T T i + R i
where R i is the net rate of production species i, J i is the diffusion flux of species i.
In this study, we considered the flow to be fully turbulent with interaction of the species. The air was set to the primary species, with moisture as the secondary species, coupled with turbulence interaction during air movement. The net rate of production of species and the diffusion flux of species can be written as:
J i = ρ D i , m + 1.428 μ t Y i D T , i T T
H = i = 1 n h i J i
where D i , m is the mass diffusion coefficient for species i in the mixture, Y i is the mass fraction of species i, D T , i is the thermal diffusion coefficient, T is the temperature (K), and μ t is the turbulent viscosity.

3.3.3. Thermal Diffusion Coefficient

The thermal diffusion coefficient is the critical parameter used to calculate the moisture diffusion in the air, which can be defined as an empirically based composition-dependent expression derived as:
D T , i = 2.59 × 10 7 T 0.659 M w , i 0.511 X i i = 1 N M w , i 0.511 X i Y i i = 1 N M w , i 0.511 X i i = 1 N M w , i 0.489 X i
where M w is the molecular weight, X is the mole fraction.
All the equation coefficients were based on the default recommendations in the ANSYS Fluent Theory guide [35]; however, future research should improve the specific accuracy based on local flow behavior.

3.3.4. Turbulence Boundary Conditions

To meet the requirement of faster convergence during the calculation to solve the set of nonlinear partial differential equations representing the flow physics, all turbulence parameters at the inlet boundary were calculated based on theoretical formulations and recommendations provided in the ANSYS Fluent User’s Guide [35], as set out in Equations (10)–(13).
Turbulence   kinetic   energy   k = 3 2 U I 2
Specific   turbulence   dissipation   rate     ω = 0.09 0.25 k l
Turbulence   intensity     l = 0.09 3 / 4 k 3 / 2 ε
Turbulence   dissipation   rate     ε = 0.09 k 3 / 4 l
where U is the mean flow velocity, I is the turbulence intensity. ω is the specific turbulence dissipation rate, l is the turbulence length scale, and ε is the turbulence dissipation rate.

3.3.5. Environment of Wind Direction Methodology

To meet the requirements for assessing the environmental impact of airflow inside the main ordination hall, we analyzed wind direction data obtained from the Thai Meteorological Department, specifically focusing on wind rose data from Ayutthaya province (Figure 7). The analysis revealed that throughout the year, the wind predominantly flowed from specific directions, which allowed us to identify representative cases. Based on this information, we selected the top-five wind directions for our investigation: south (S = 180°), south-southeast (SSE = 157.5°), east (E = 90°), northeast (NE = 45°), and north (N = 0°). These directions represented the primary wind patterns affecting the region and ensured a comprehensive understanding of the airflow dynamics in the Temple. To simplify the simulation and focus on the primary objectives, we assumed a constant wind velocity for all cases, based on measured values from our experimental setup. This approach ensured uniform boundary conditions and facilitated the comparison of flow behavior under similar conditions. Additionally, the atmospheric boundary layer was neglected in the simulation, as the Temple’s geometry and airflow within the enclosed hall were the primary factors influencing internal ventilation and including the atmospheric boundary layer would have added complexity without substantially impacting the localized airflow patterns within the Temple that were the focus of this study. These assumptions and selections provided a streamlined yet reliable framework for investigating the environmental impact of flow behavior inside the ordination hall, while maintaining alignment with real-world wind conditions in Ayutthaya province.

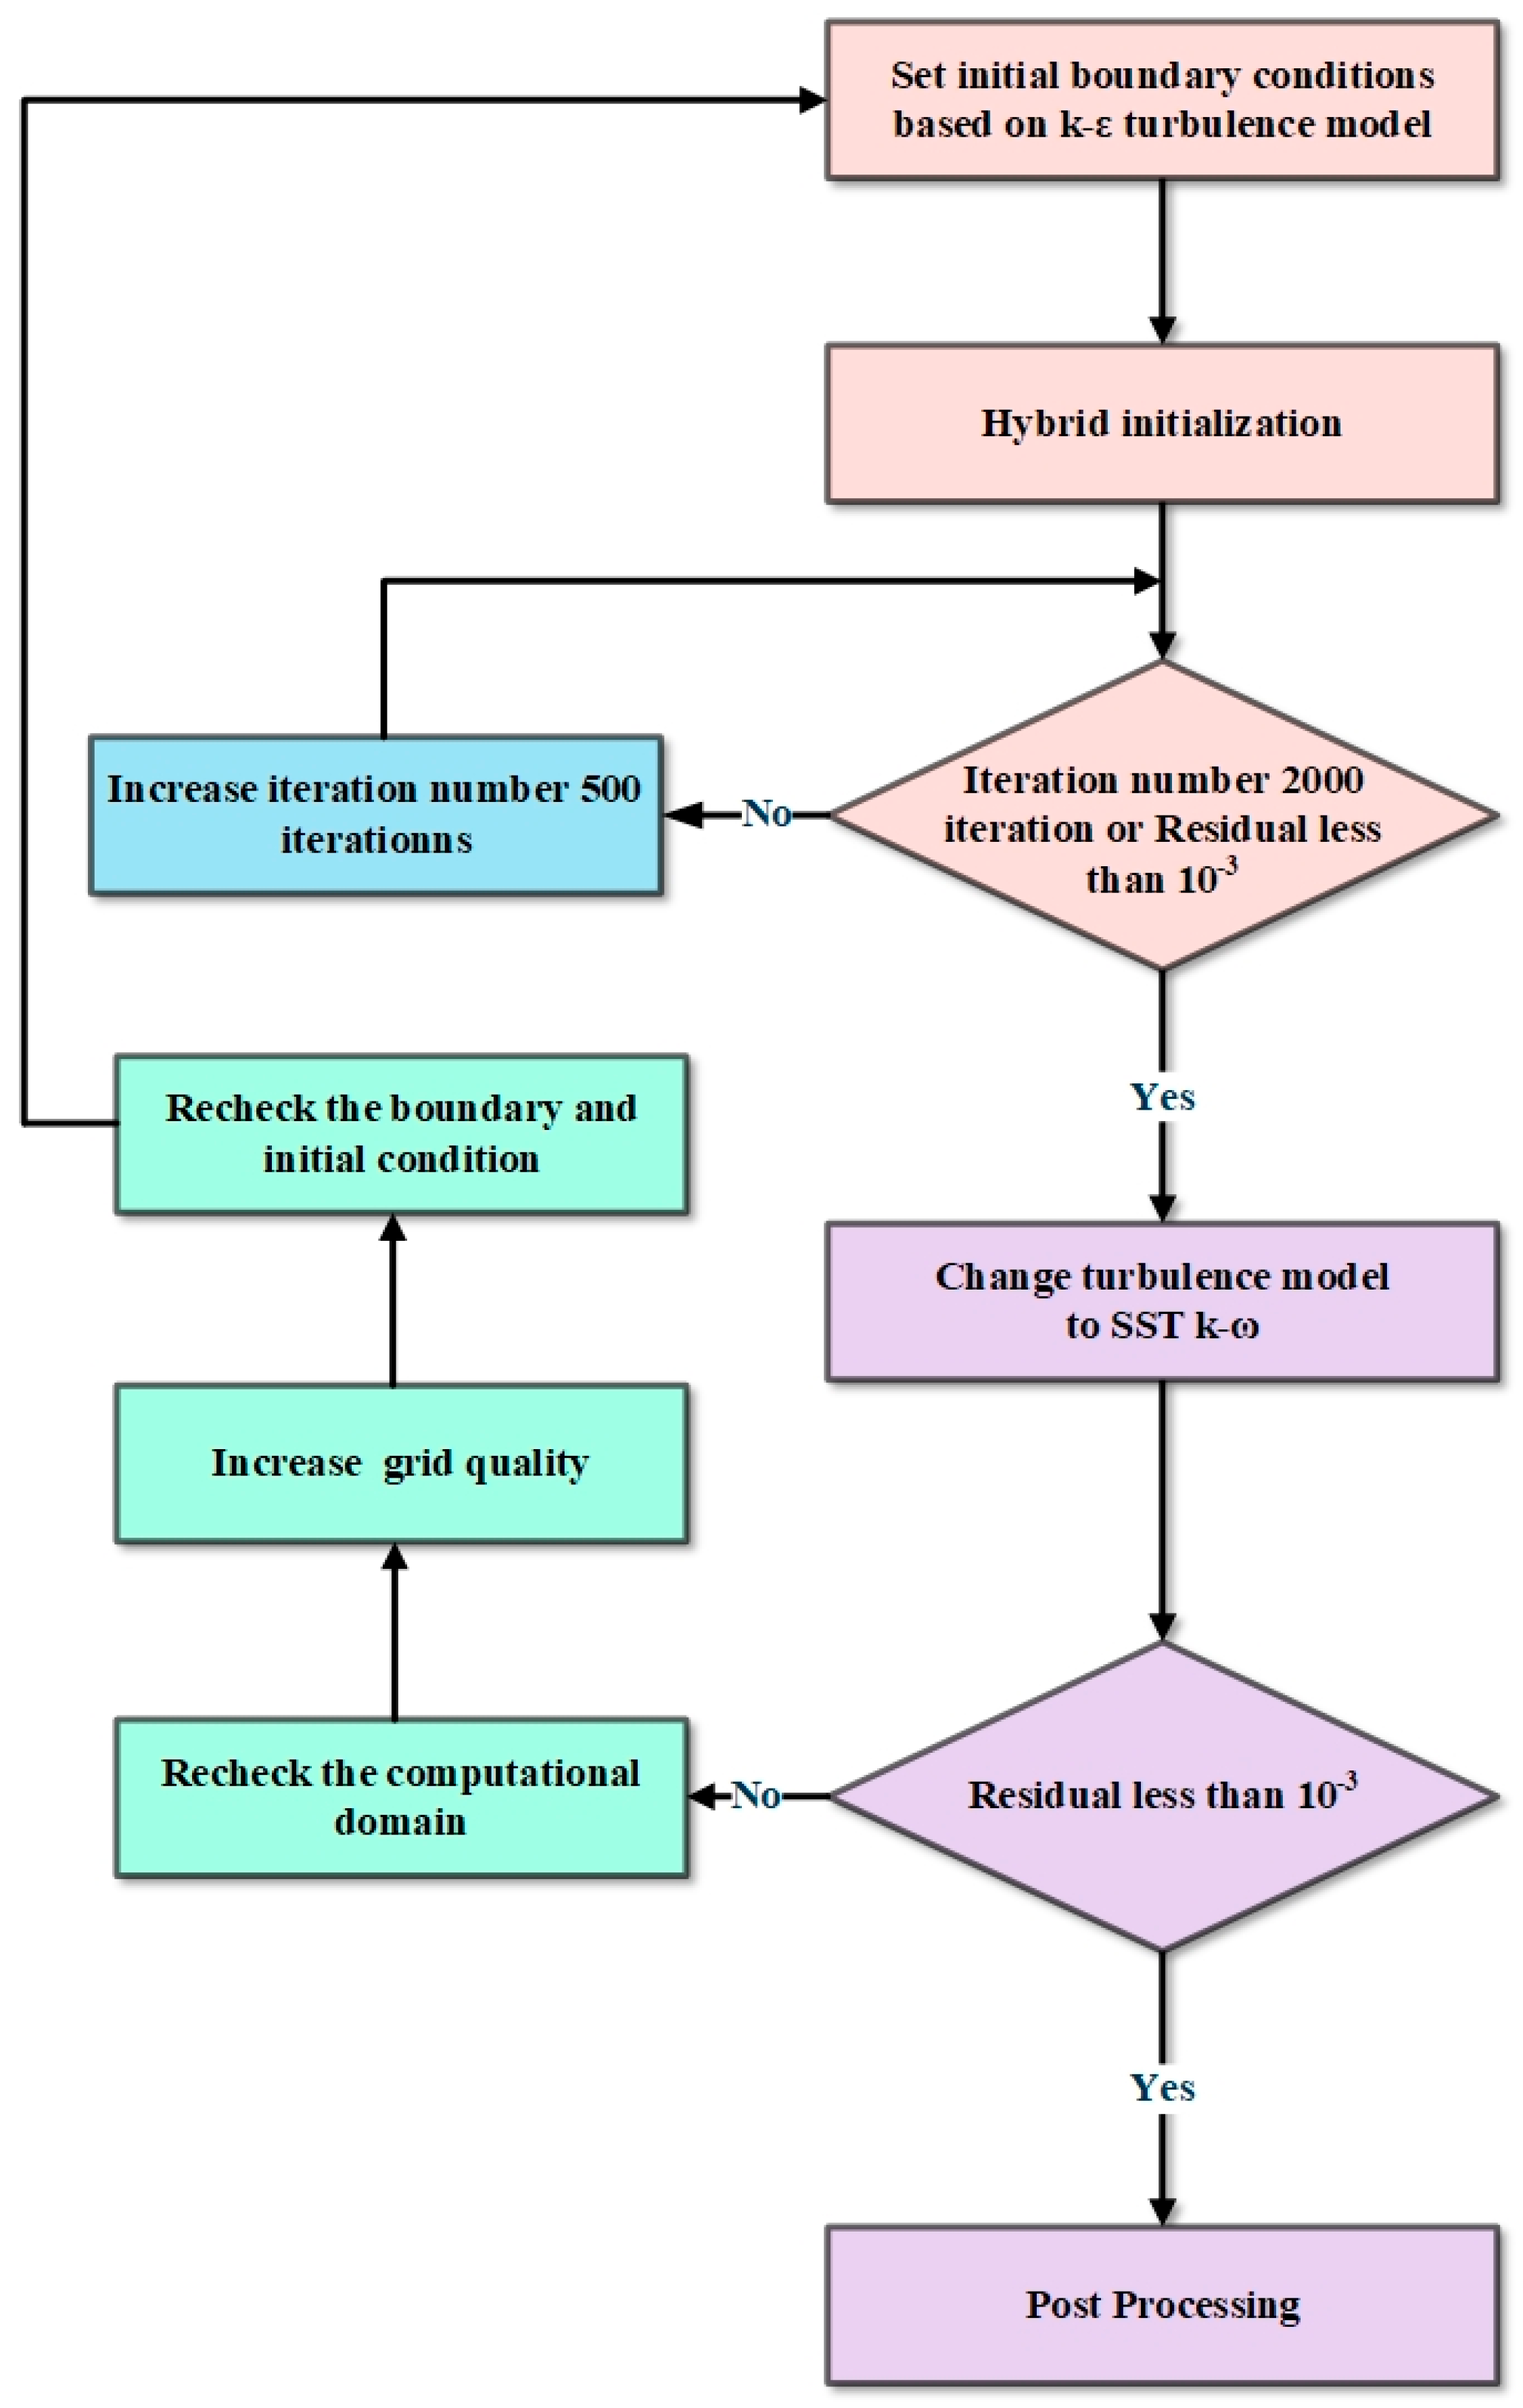
3.3.6. Solution Initialization for Flow Analysis

The solution initialization process began with applying the standard k-ε (STD) turbulence model using first-order numerical discretization. As discussed in the previous section, turbulence boundary conditions were applied to establish the initial simulation environment. The first simulation was run for 2000 iterations or until the solution residuals converged to less than 10−3. Following this initial phase, the turbulence model was switched to the SST model, utilizing second-order numerical discretization to ensure higher accuracy. This transition ensured that the solutions maintained consistency and achieved the desired level of accuracy for detailed analysis. The complete solution initialization workflow is illustrated in Figure 8, while Table 2 summarizes the grid number and Table 3 summarizes the numerical settings applied during each simulation stage.

4. Solution Methodology

The first step in designing the indoor microclimatic behavior was in the main ordination hall. The 3D model was developed using the ANSYS Fluent 2024R1 commercial software solving the set of equations in the simulation, as described in Section 3. Numerical discretization uses the finite volume method based on the cell center for flow simulation. This section describes the simulation setting, including grid independence analysis and the mathematical setting.

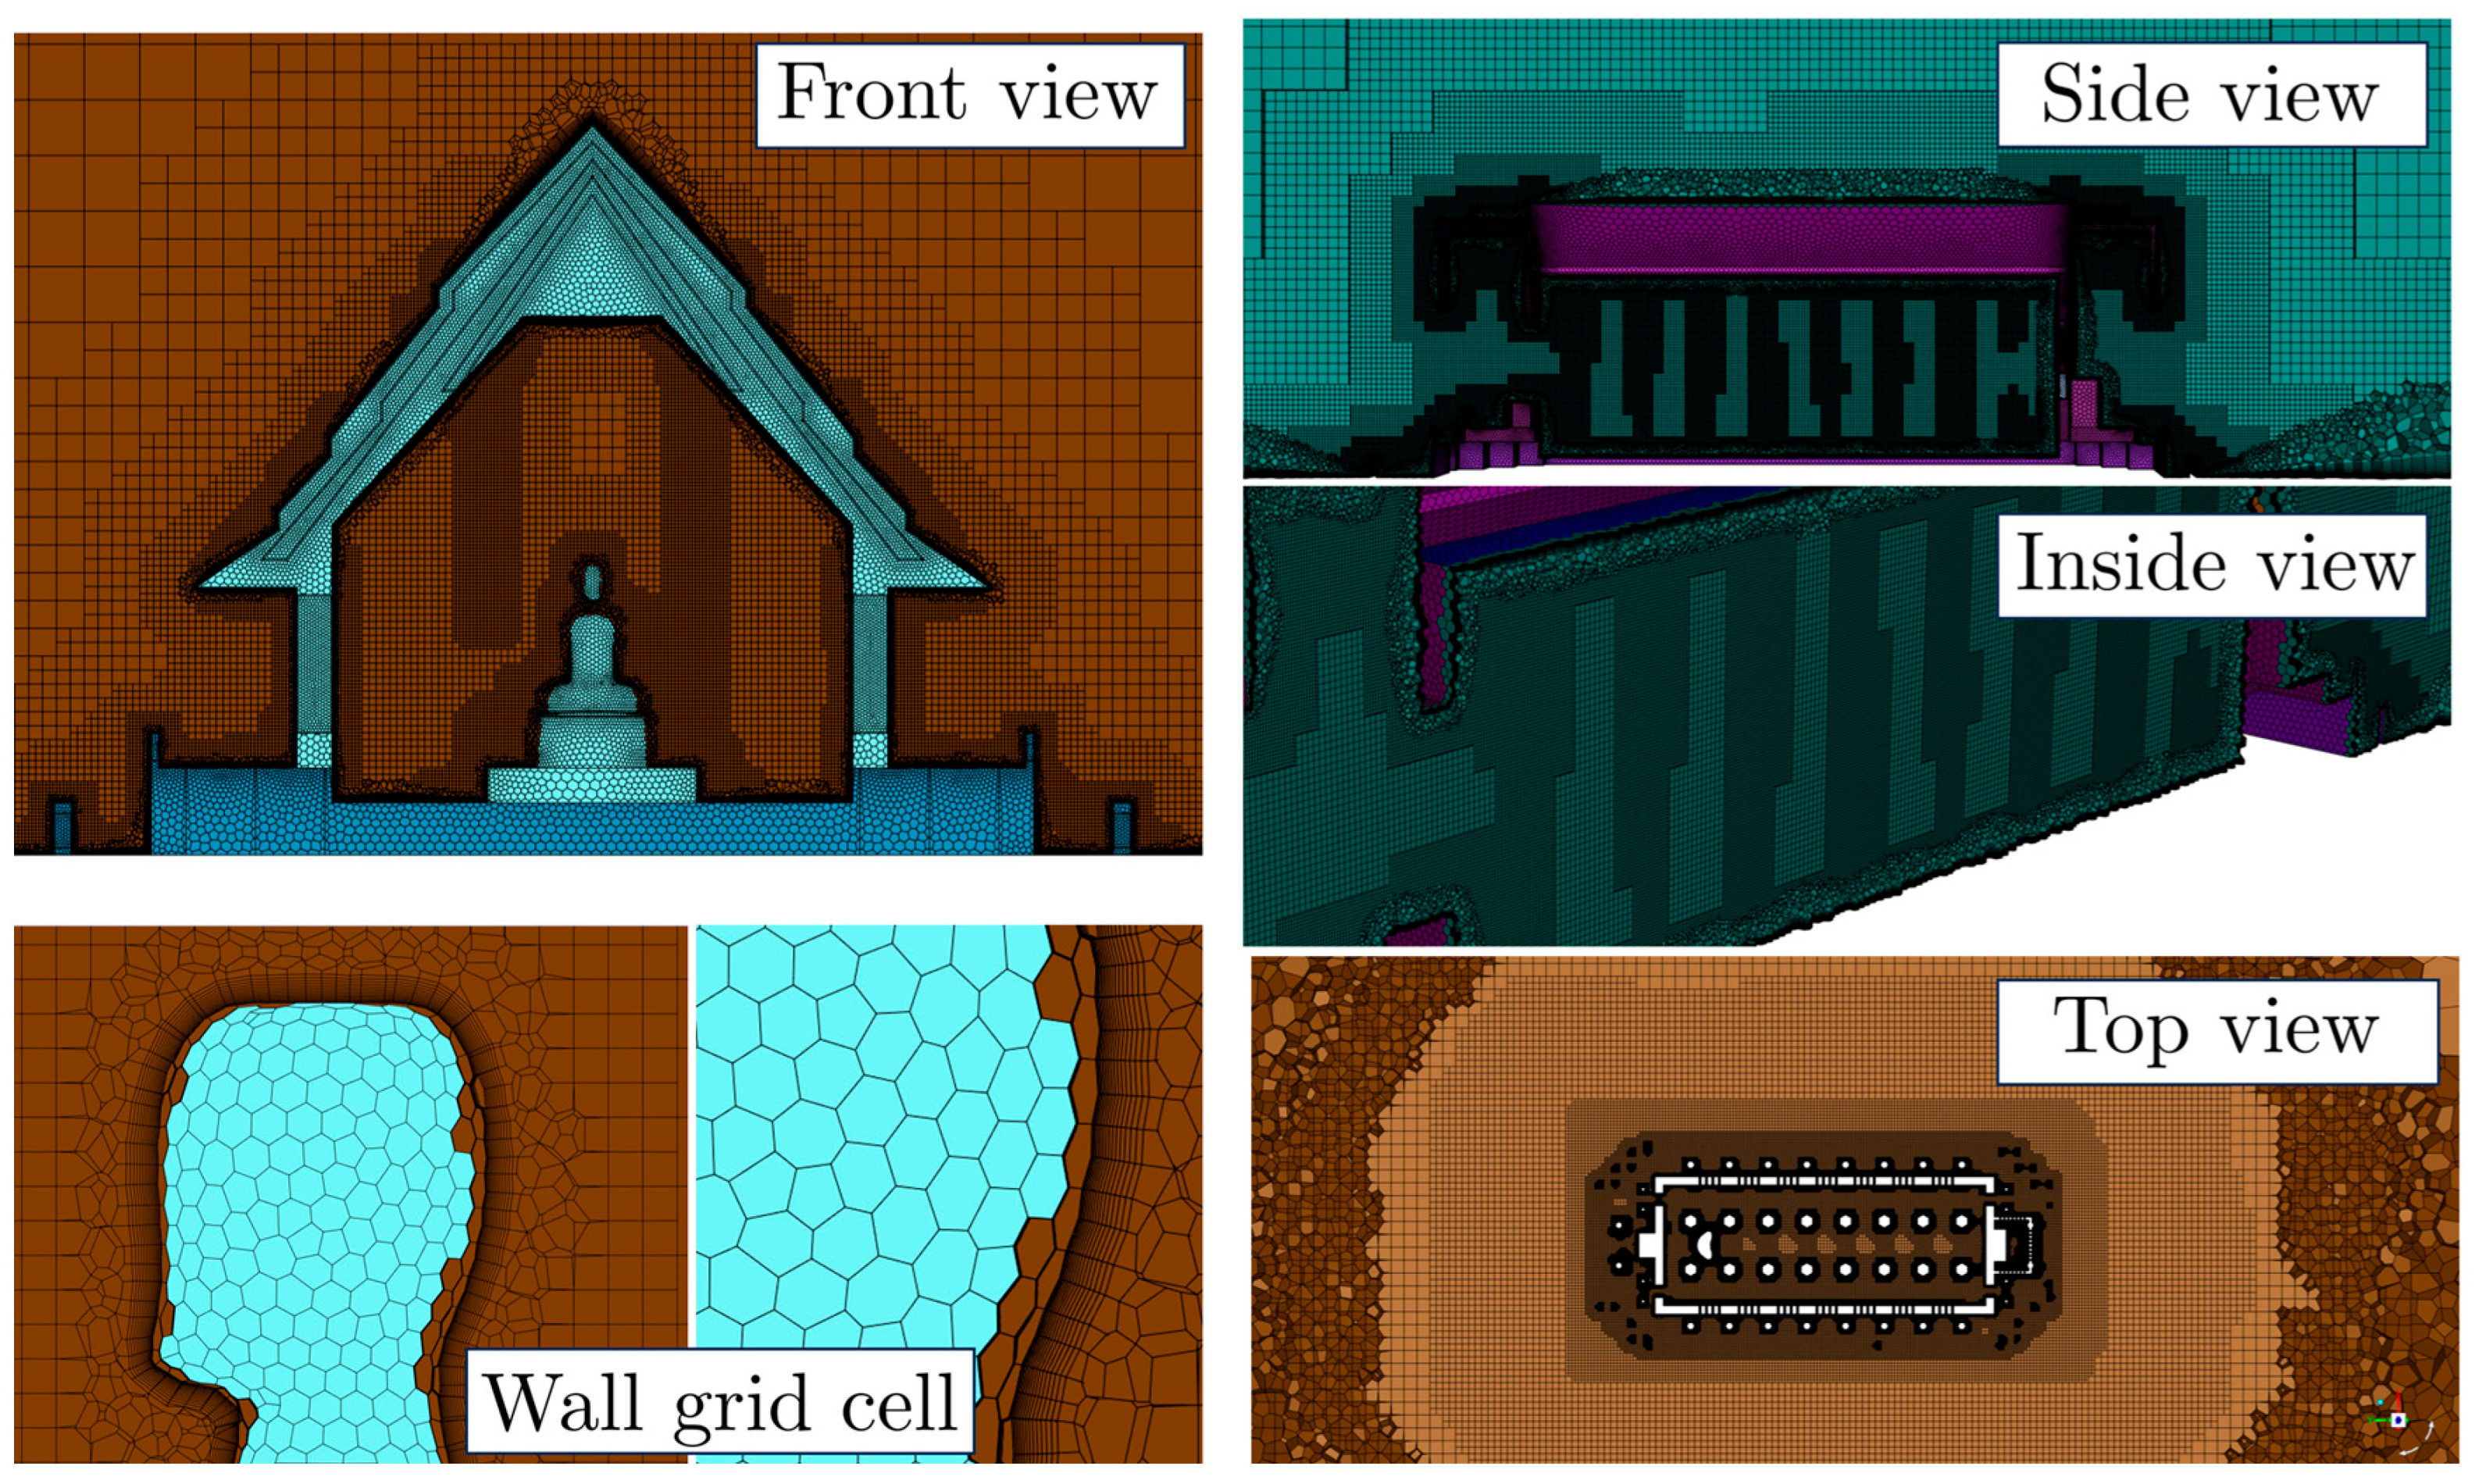
4.1. Grid Generation

A computational mesh was generated for the building geometry and to optimize the mesh density to capture flow details while minimizing computational resources. This study used MOSAIC meshing technology to represent the control volume for numerical computation [26]. The grid consisted of poly-prism elements near the wall to more accurately capture the heat transfer under wall y+ less than 1 and polyhedral transition elements to connect the cartesian hex elements for the hold computational domain. The grid generation used ANSYS Fluent 2024R1 to create a high-quality hybrid meshing with 32 CPU cores for parallel computation.

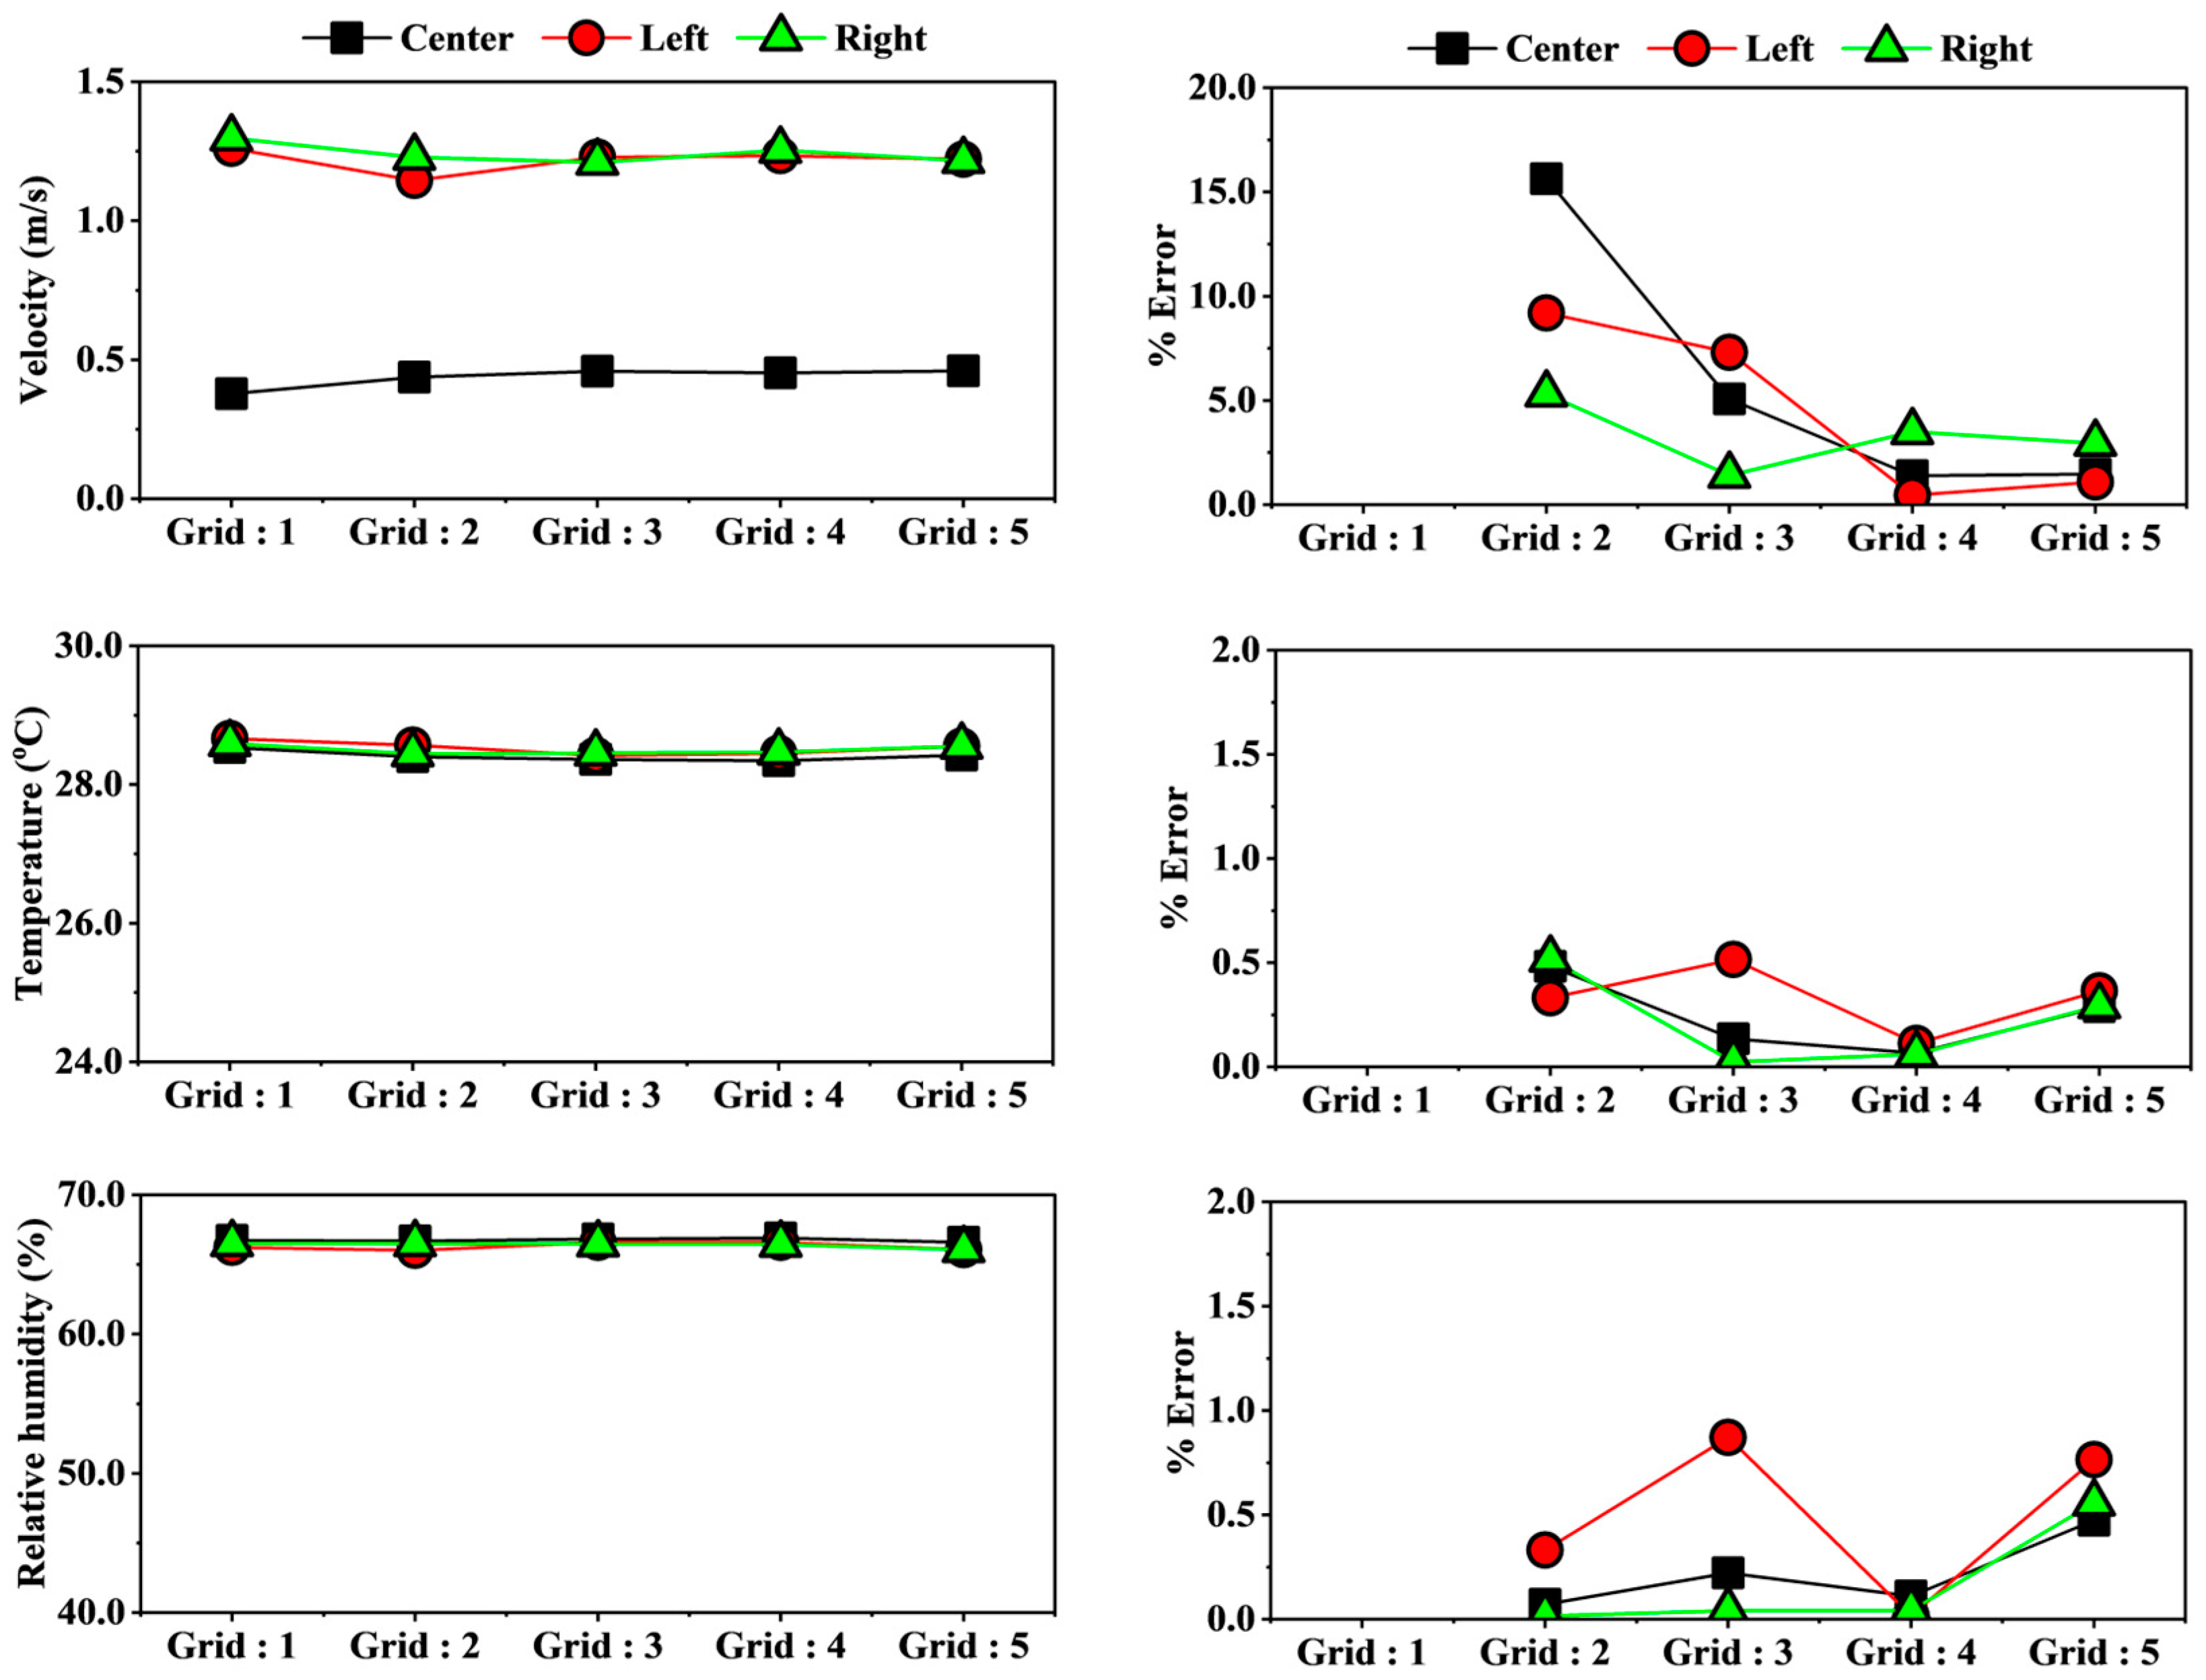
4.2. Grid Independence Analysis

The simulations were conducted using the time-averaged technique with the SST turbulence model to analyze the flow field. Five grid configurations were tested to evaluate the impact of grid size on the simulation results, as illustrated in Figure 9. The grid independence test was conducted using averages of three key parameters (velocity, temperature, and humidity) to ensure that the simulation results were not dependent on grid resolution. As shown in Figure 5, the center, left, and right lines were divided into 200 points to accurately measure the flow characteristics. A systematic grid independence study was performed to minimize errors caused by grid variation. Based on this analysis, Grid Case 4 was selected for all subsequent simulations, as it had less than 5% variation compared to finer grids. This selection guaranteed a balance between computational efficiency and solution accuracy, ensuring reliable final results.
Table 2 and Figure 9 present the use of PolyHex core grids for flow analysis, as recommended by ANSYS Inc. [26]. The preliminary results revealed that there were minimal fluctuations in temperature and humidity throughout the grid independence analysis, as shown in Figure 9. However, there were notable variations in velocity in the initial grid size, which progressively diminished as the grid resolution improved. The solution fluctuations stabilized, ultimately achieving less than a 5% variation in results compared to finer grids, ensuring accuracy and reliability for the selected grid size. The final grid size and grid distribution in the specific section plane are shown in Figure 10.

4.3. Numerical Setting

The numerical settings play a critical role in ensuring solution accuracy and convergence, as discussed in Section 3. The standard k ε turbulence model was used with first-order numerical discretization for solution initialization. After achieving convergence at this stage, the simulation transitioned to the SST k ω turbulence model with second-order numerical discretization. This approach ensured the highest possible accuracy for the final solution, while maintaining numerical stability throughout the simulation process. These numerical settings aligned with other research methodologies [27], providing a reliable framework for achieving precise and consistent results.

4.4. Validation Study

The results obtained from the grid independence analysis were used to validate the simulation against measurement data for the validation study. As shown in Figure 11, the findings confirmed that the chosen grid type, numerical settings, boundary conditions, and initial conditions were appropriate and reliable for the subsequent investigation. This study developed two validation cases based on (1) academic testing and (2) onsite validation testing—shown in Table 2 as Case 1 (Validation). The academic testing served as a benchmark for assessing the accuracy of the numerical model, while the onsite validation ensured that the model performed effectively under real-world conditions. These complementary approaches verified the robustness and suitability of the computational framework for further analysis.

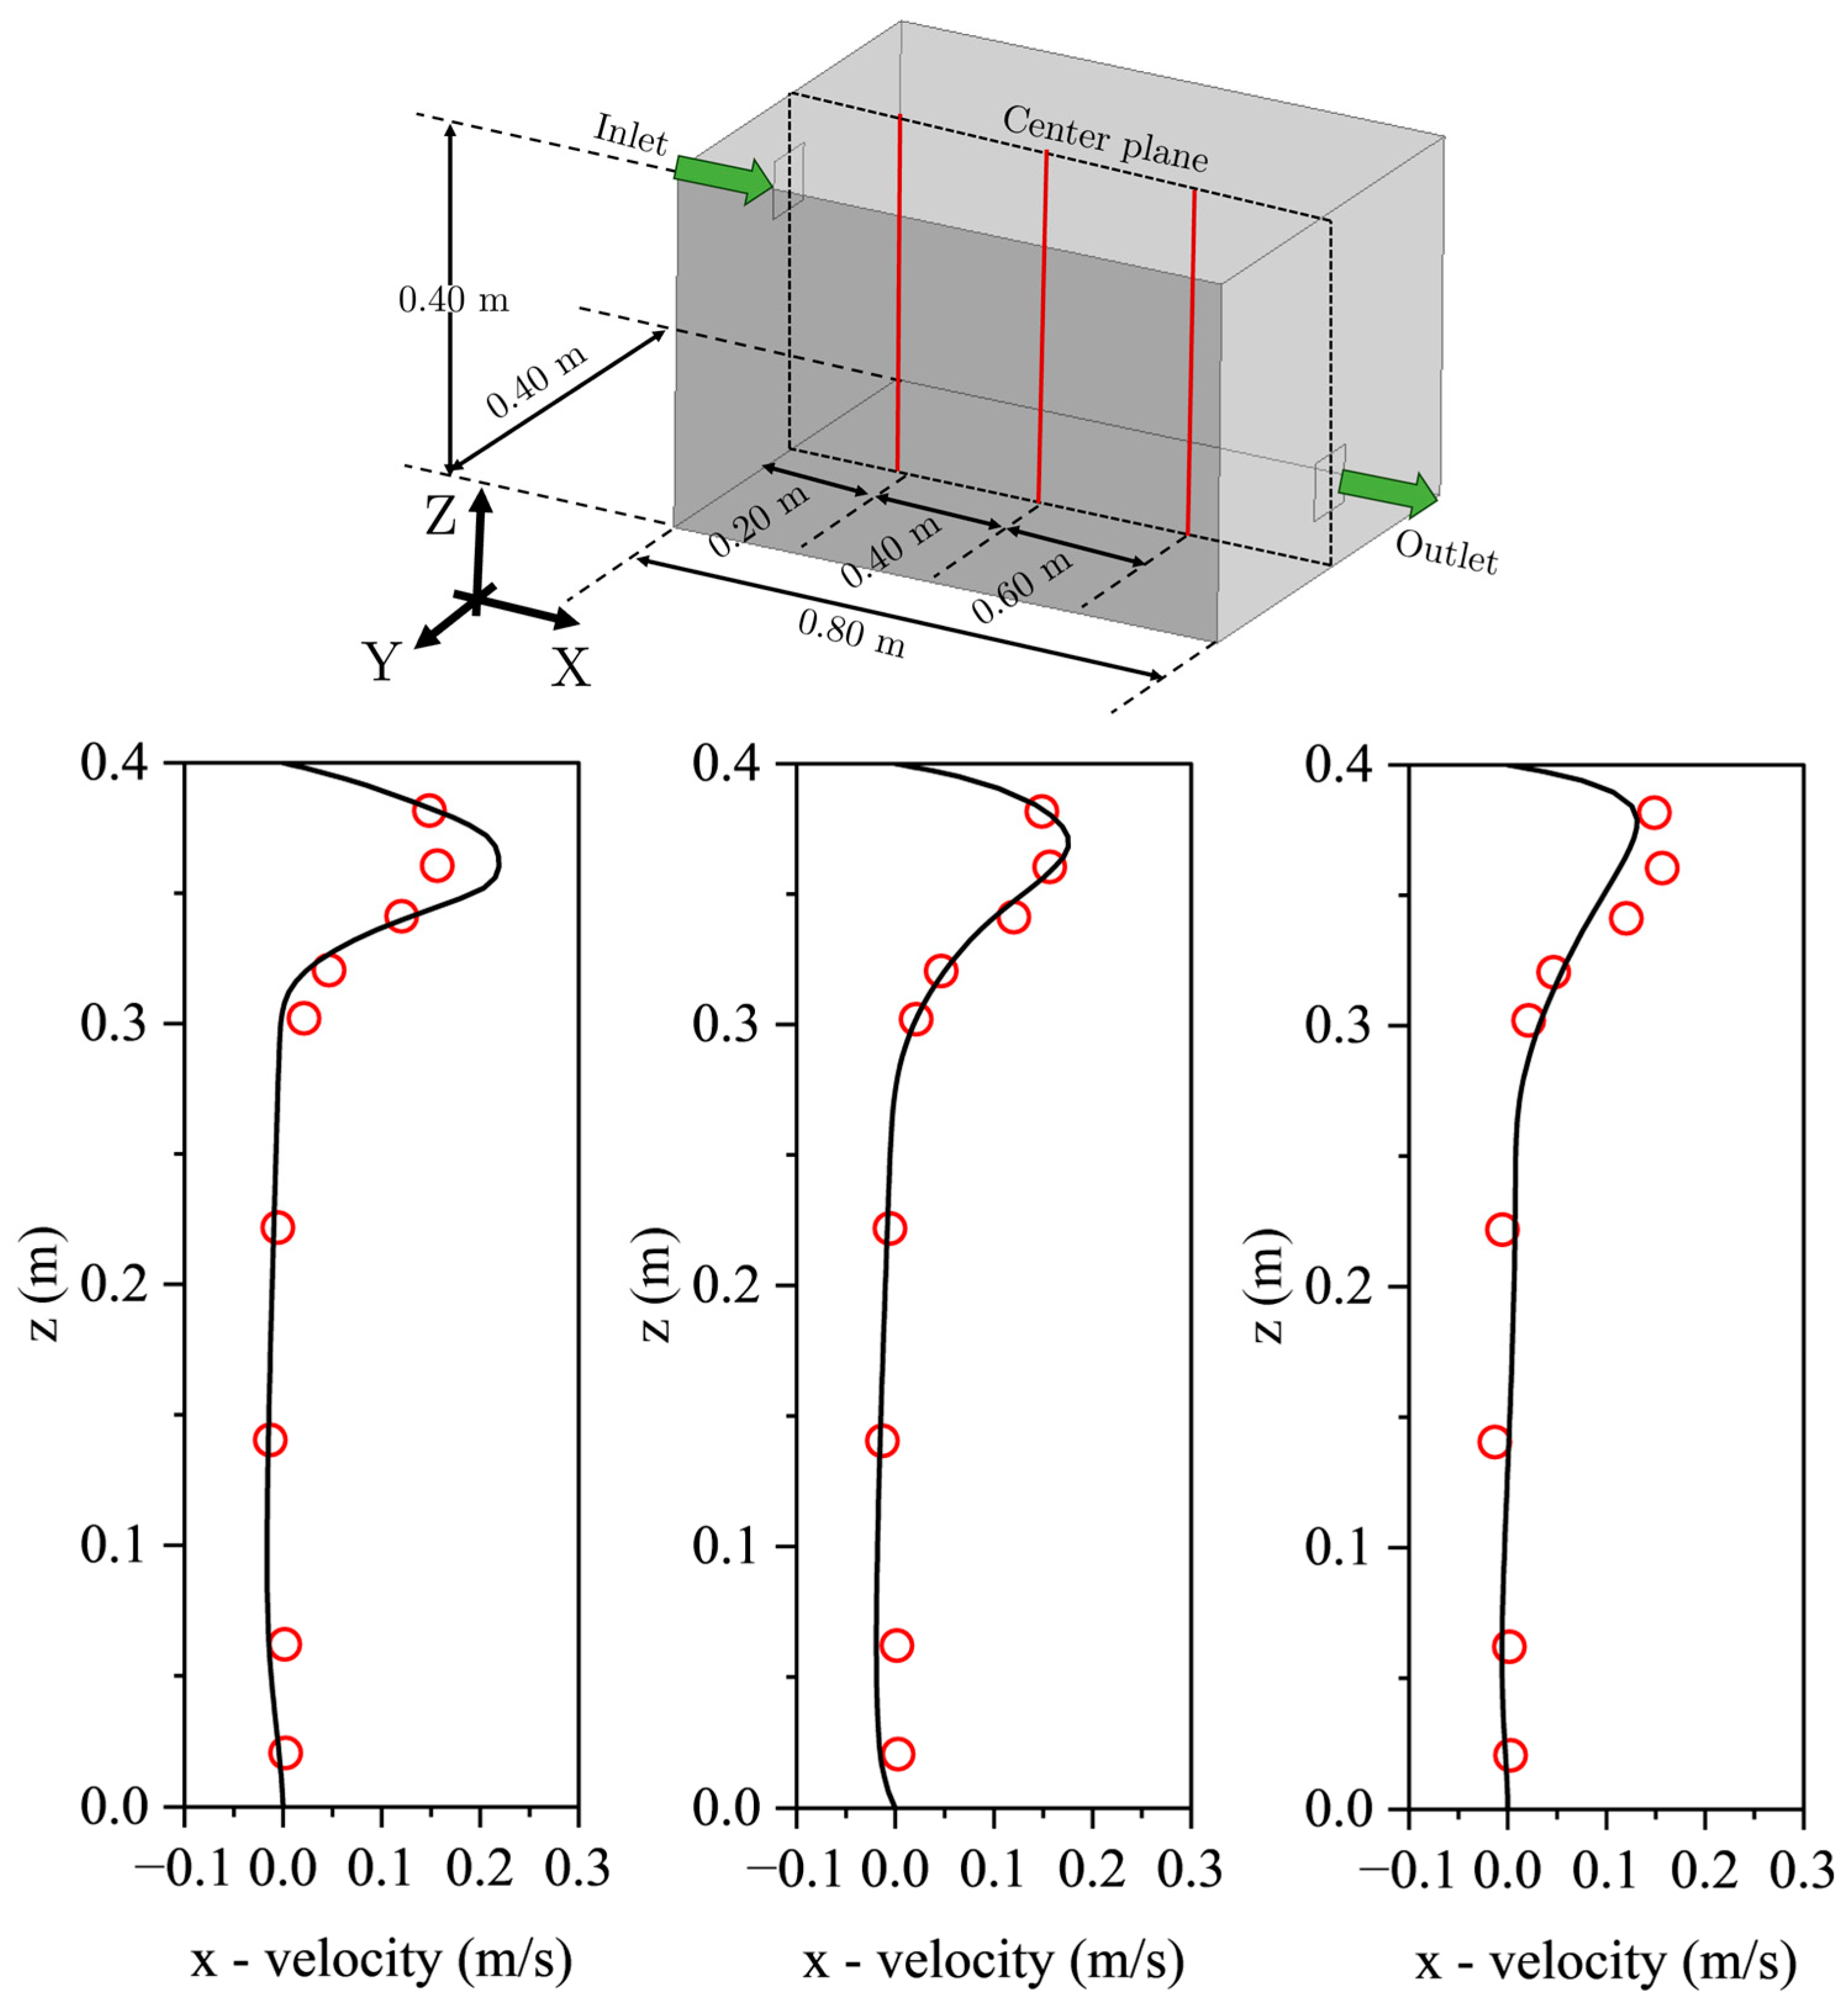
4.4.1. Academic Test Case

In this study, the turbulence model, boundary conditions, and grid type were carefully selected and validated using the methodology proposed by Chen et al. [28], which served as a benchmark for the academic test case. As shown in Figure 11, the chosen numerical settings accurately replicated the expected physical behavior of airflow dynamics. This validation ensured that the selected turbulence model and boundary conditions were suitable for the specific conditions of the Na Phra Meru Historical Temple, confirming the reliability of the CFD approach for studying complex airflow and ventilation within heritage structures. These findings provided a solid foundation for applying advanced CFD techniques in heritage conservation, ensuring the robustness and accuracy of the simulation setup.

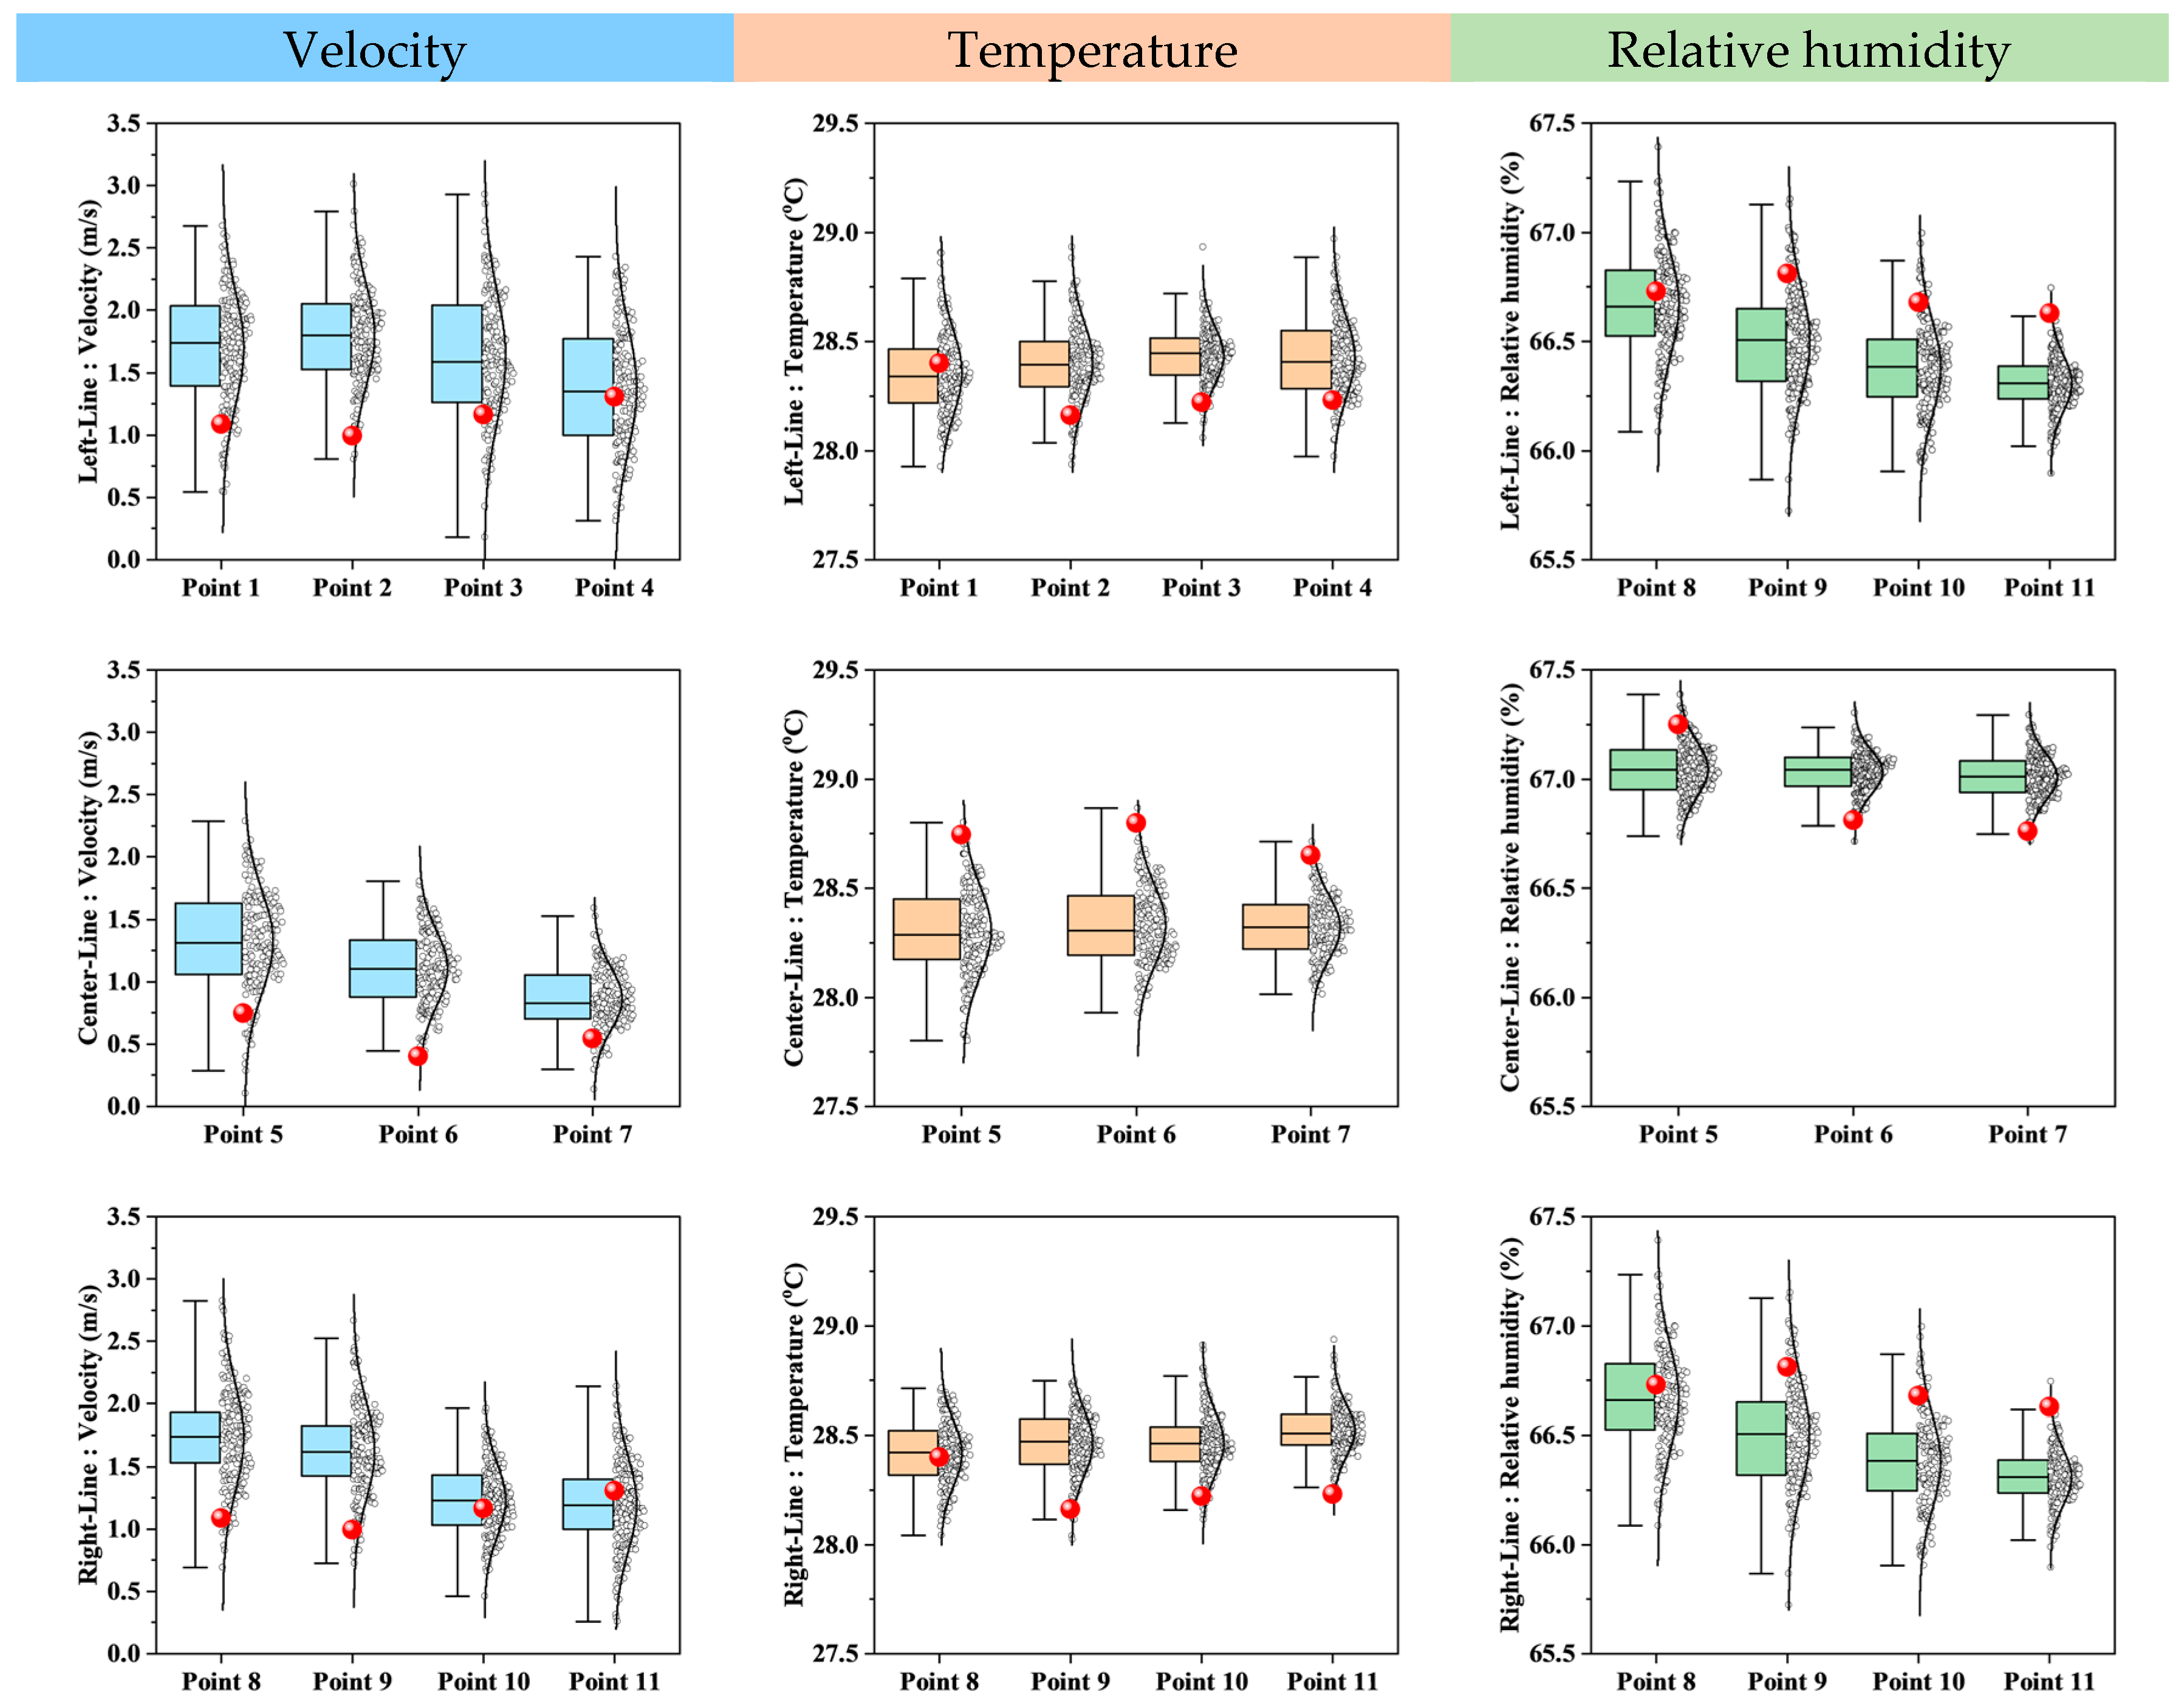
4.4.2. Onsite Validation Test Case

For the onsite experiment, 11 measurement points were selected, as shown in Figure 5, to record velocity, humidity, and temperature, ensuring consistency in flow characteristics. The results are presented in Figure 12 that compares the measurement data with the CFD simulation results over a 3 h period on 9 August 2024, from 8:00 to 11:00 AM, with data collected at 15 min intervals. The comparison revealed a strong agreement between the CFD predictions and experimental measurements, confirming the accuracy and reliability of the simulation model, making it well-suited for the next phase of parameter variation studies.

5. Results

This section is divided into seven parts. The first part investigates the effects of inlet airflow velocity magnitude and direction on the flow structure within the ordination hall. The second part examines the distributions of temperature, humidity, and TKE, offering insights into the spatial variation of these critical air properties throughout the building. The third part analyzes the fluctuation behavior of these parameters using the UI to assess the consistency of the airflow properties in different hall regions. The fourth part focuses on the role of the small slit windows and their influence on natural ventilation within the ordination hall. The fifth part applies statistical correlation analysis to explore the relationships between turbulence characteristics (TKE and the turbulence dissipation rate) and key airflow parameters (temperature, velocity, and humidity). The sixth part discusses the impact of aerodynamic forces on structural integrity and the potential risk of building damage. Finally, the seventh part presents the key findings related to aerodynamic moments and their implications for structural stability.

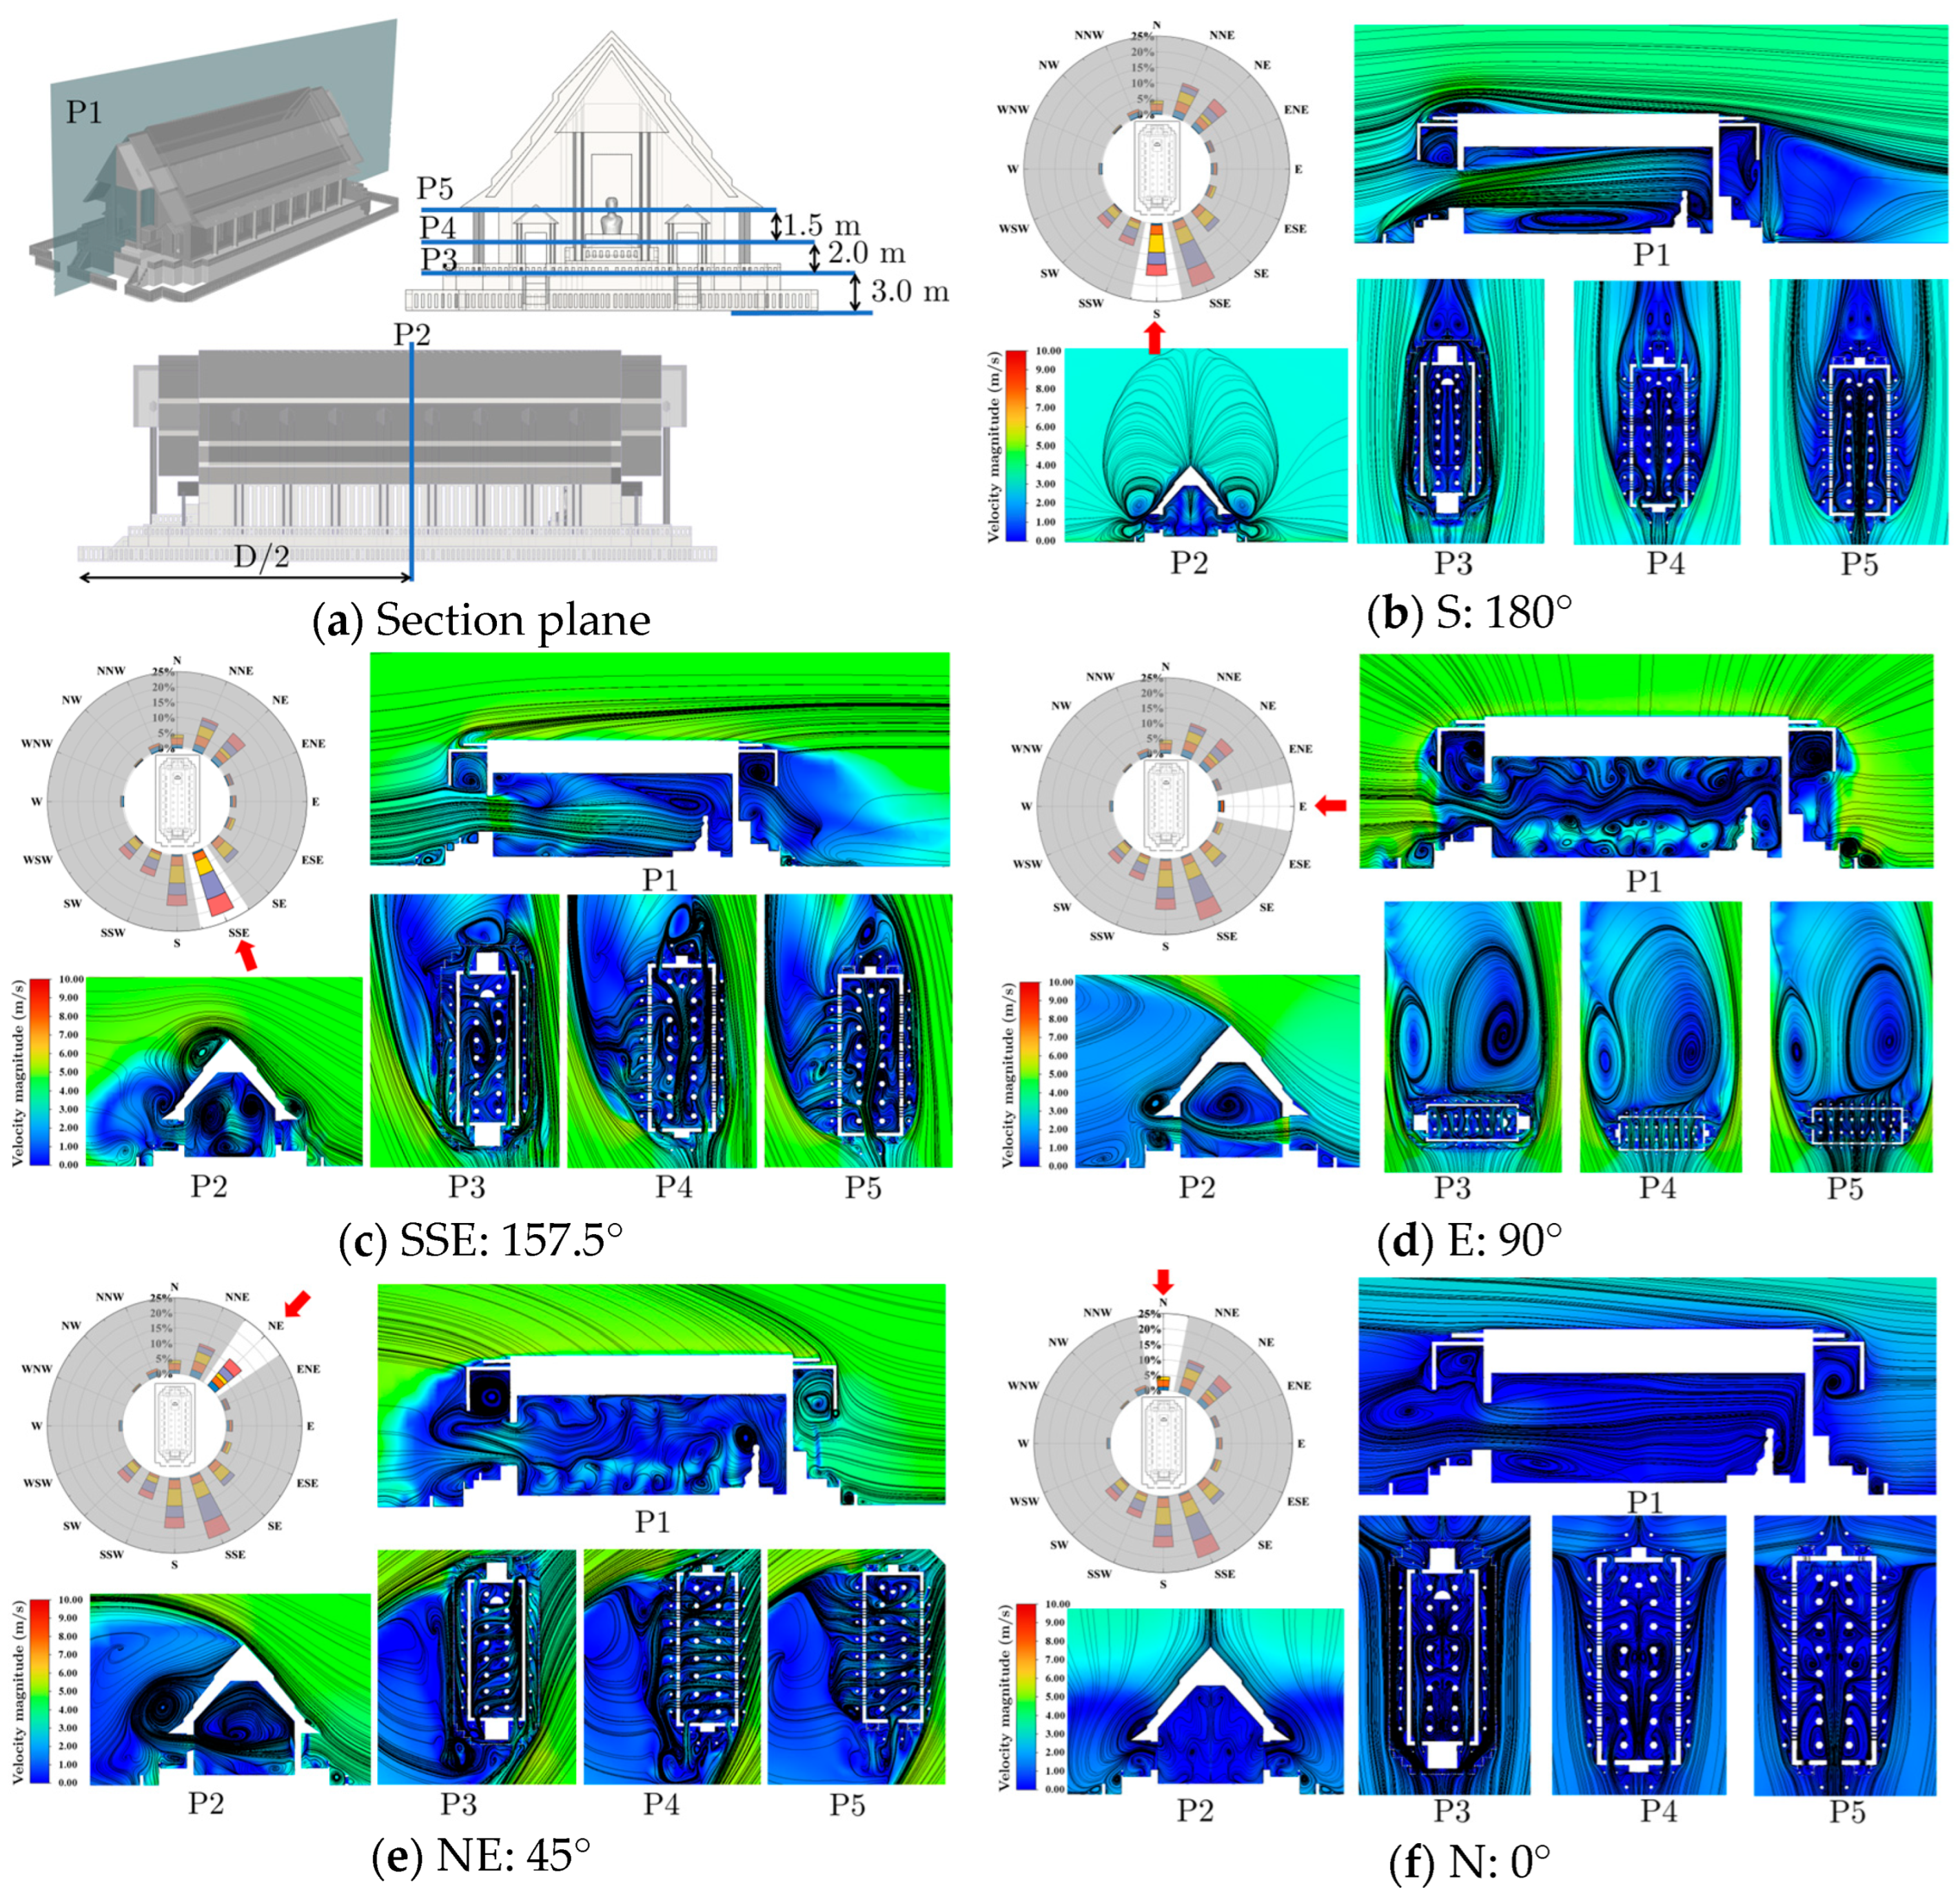
5.1. Flow Behavior and Recirculation Analysis of the Na Phra Meru Historical Temple

Five primary airflow directions were selected based on meteorological data to simplify the complexity of the case study, ensuring comprehensive and practical evaluation outcomes for preventive conservation and visitor comfort. The results are presented in Figure 13 and revealed complex velocity distributions and distinct recirculation zones across five sectional planes inside and outside the building. All examined cases involved considerable complexity due to multiple recirculation zones, particularly when the airflow direction was not aligned with the main entrance. Figure 13b illustrates the scenario in which the incoming airflow direction was perpendicular to the main entrance of the building, demonstrating the formation of a large recirculation zone in the lower part of the structure. Notably, as the angle of incoming airflow direction increased, the airflow patterns within the building became increasingly more complex. This complexity was characterized by the emergence of multiple recirculation zones, as clearly depicted in Figure 13c–e. Such findings underscored the influence of airflow direction on the internal ventilation dynamics, highlighting the necessity for careful consideration of airflow orientation in heritage conservation strategies.
Notably, Figure 13d illustrates how airflow entering through the multiple slit windows created several smaller recirculation zones within the interior, subsequently generating a larger recirculation region near the ceiling. Externally, major recirculation zones were consistently observed. However, there was no indication that these external vortices re-entered the building, likely due to the internal outflow functioning as a barrier preventing reverse airflow penetration. This observation emphasized the complex interactions between internal and external airflow patterns, underscoring the importance of accounting for these factors in effective conservation planning.
The second major finding, previously unnoticed, is clearly shown in Figure 13f, demonstrating that the airflow approaching from the side opposite the main entrance initially moved past the building and then induced airflow into the building’s interior, due to a coupling effect. This observation challenged earlier assumptions that airflow from behind the building would not greatly influence indoor conditions, as this side lacked substantial openings such as large windows or doors. Previously, it was assumed that airflow from the rear would not enter directly into the building. However, our study identified a new and important airflow pattern. Air from behind temporarily stagnated near the rear wall, then accelerated around the building and finally entered through the main entrance. This newly identified airflow behavior has important implications for moisture control. If a lagoon or other moisture source exists behind the building, humidity from that area could be drawn inside, increasing indoor humidity and potentially causing damage to building materials. This finding has advanced scientific knowledge by emphasizing the importance of thoroughly examining airflow from all directions and highlighting the need to reconsider existing airflow management practices to protect historical buildings against moisture-related deterioration.

5.2. Air Property Distribution in the Temple

In the previous section, we identified airflow patterns within the temple that had a major influence on the indoor environmental conditions. This section further validates that hypothesis by examining the detailed distribution of key air properties. In heritage preservation, it is crucial to identify areas of reduced airflow and prominent recirculation zones because stagnant air conditions may cause moisture retention or excessive dryness that accelerates material deterioration. Figure 14 illustrates the temperature, relative humidity, and TKE distribution across the selected sectional planes shown in Figure 13a. This analysis indicated that the incoming airflow absorbed heat from the wall surfaces and circulated it through the building. This circulation elevated temperatures and reduced humidity levels in the central interior regions. Figure 14 demonstrates explicitly that airflow aligned directly with the main entrance resulted in notable heat accumulation at the center compared to other airflow scenarios. In addition, this alignment corresponded to lower humidity and lower TKE values. In contrast, regions near the walls had lower temperatures and higher humidity levels that promoted moisture accumulation on building surfaces. Persistent moisture conditions near walls create favorable conditions for fungal growth and pose a risk to historical materials [29,30,31].
The TKE measures the intensity of airflow turbulence and indicates how much energy is available for air mixing and ventilation. Higher TKE values usually correspond to stronger airflow mixing, resulting in a more even distribution of temperature and humidity within a space [32,33]. However, the current study revealed relatively low TKE values near wall surfaces. Low TKE values in these areas indicates stagnant airflow and poor ventilation, which increase moisture accumulation and accelerate material deterioration. In contrast, regions with higher TKE values, such as the central interior of the building, experience more active airflow. This dynamic airflow helps to reduce moisture buildup but slightly elevates local temperatures.
A key finding from this study, clearly illustrated in Figure 15, was the confirmed deterioration of materials on the rear wall of the Buddha image area. The CFD analysis demonstrated that this area had much lower TKE values, indicating weak airflow mixing and inadequate ventilation, leading to stagnant air and increased moisture retention. This finding closely matched historical observations of material damage on the building’s rear wall, a deterioration issue previously unresolved in conservation studies. However, now, the current research has provided a clear scientific explanation based on the detailed airflow analysis. This discovery is important because it justifies prioritizing conservation efforts in zones highly prone to moisture-related damage. Additionally, the results have validated existing conservation concerns, providing robust scientific support for integrating effective airflow management into future preservation plans. These insights could serve as a foundation for developing standardized guidelines, substantially enhancing archaeological and historical structures’ long-term protection and conservation.

5.3. Fluctuation in Environmental Behavior in Temple

We analyzed five primary wind directions in order to understand how local turbulence in the wind direction affects airflow behavior inside the main ordination hall, as shown in Figure 7. We used the UI to measure how evenly the airflow was distributed within enclosed spaces [34]. High UI values indicate consistent airflow which helps to maintain stable temperature and humidity levels. A stable airflow prevents moisture accumulation and avoids excessively dry conditions. Both excessive moisture and overly dry environments can cause material deterioration. In contrast, low UI values suggest uneven airflow creating stagnation areas that lead to moisture buildup or dryness issues [35]. Moisture buildup can cause structural damage, mold growth, and poor indoor air quality that negatively impact the health of occupants [36]. Similarly, overly dry conditions can lead to cracking and weakening of historical materials. Therefore, ensuring uniform airflow distribution is essential for preserving historical buildings and maintaining suitable indoor conditions for long-term conservation [37]. Figure 16 illustrates the UI distribution on the section plane, demonstrating the variation in airflow uniformity.
Based on the UI analysis, important variations were identified in the environmental conditions throughout the building. The temperature and humidity were consistently highly uniform, with UI values exceeding 0.95. In contrast, the airflow velocity had greater variation, with UI values in the range 0.70–0.92, representing a substantial fluctuation of approximately 31.42%. The TKE values had even greater variation, with UI values in the range 0.19–0.87, reflecting an extreme difference of approximately 357.89%. These findings indicated that despite the presence of recirculation zones, the temperature and humidity conditions remained relatively stable inside the building. However, the recirculation zones had a major impact on airflow velocity uniformity and strongly influenced the turbulence levels, even though their effect on temperature and humidity was minimal. Fluctuations in air velocity and turbulence kinetic energy disrupt the consistency of indoor temperature and humidity. These variations lead to thermal gradients that cause repeated expansion and contraction of surface materials, increasing the likelihood of micro-cracks and long-term material fatigue. Moreover, zones with low airflow and high moisture levels, particularly where the relative humidity exceeds 70%, create conditions that support microbial activity, such as fungal growth. This accelerates the biological deterioration of wall surfaces, decorative pigments, and other vulnerable components of heritage structures [12,15]. Consequently, these UI results highlighted the critical importance of managing airflow velocity and turbulence to prevent deterioration. Effective airflow control strategies based on these findings should greatly improve the long-term preservation of historical structures, aligning conservation practices with sustainability goals [14].

5.4. Effect of Small Slits on Ordination Hall Air Ventilation

The previous discussion about airflow patterns in the ordination hall involved architectural designs developed during the late Ayutthaya period, approximately 520 years ago. Comparable architectural techniques have also been documented at historical sites dating from earlier periods, particularly in the 13th and 14th centuries, such as the Kamphaeng Phet Historical Park, the Si Satchanalai Historical Park, and the Sukhothai Historical Park. Notably, the latter is regarded as the historical birthplace of Thai civilization, as illustrated in Figure 17. These ancient architectural practices demonstrate the longstanding importance of airflow management within Thai temple architecture and reflect continuity in preservation approaches across successive historical periods. Ancient Thai architecture deliberately incorporated small wall openings known as slit windows to enhance ventilation. These architectural features improved internal airflow circulation while simultaneously serving aesthetic and spiritual purposes. Specifically, slit windows were strategically designed to allow natural light to enter, illuminating the Buddha image and creating a unique visual atmosphere that inspired spiritual reverence and devotion over several centuries. This intentional combination of natural lighting and airflow exemplifies the sophisticated integration of engineering principles with religious and symbolic considerations in historical temple design, offering critical insights for contemporary conservation strategies.
The flow patterns focusing on the observation plane under different wind conditions are illustrated in Figure 18, highlighting how airflow interacts with slit windows located at various positions around the building. The results demonstrated that slit windows play a major role in shaping indoor airflow behavior. They generate localized internal recirculation zones and contribute to air exchange between the inside and outside of the structure. notably, the results in Figure 18c also highlight a previously unnoticed protective function of the slit windows. The airflow exiting from the interior through these openings forms a distinct outward air layer that acts as a buffer. This layer separates the interior environment from the large external recirculation zones generated by wind flowing around the building. Rather than mixing, the outward airflow from the slit windows prevents the external recirculation air from entering the building, effectively shielding the interior. This self-protective mechanism emphasizes the importance of slit windows not only as ventilation features but also as passive barriers that help maintain indoor environmental stability. These insights should be very useful for informing conservation strategies to enhance the long-term protection of historical architecture.

5.5. Correlation of Aerodynamic Properties and Flow Characteristics

The previous section examined airflow structure and behavior through flow visualizations. This section uses statistical correlation analysis to explore the quantitative relationships between key flow properties, consisting of temperature, air velocity, relative humidity, and TKE. Understanding how these variables are interrelated is essential for identifying the underlying patterns that govern indoor environmental conditions. By examining these correlations, we aimed to determine which parameters most strongly influenced others and how they collectively contributed to airflow behavior within the building. Reference classifications widely used in engineering and ventilation studies are provided in Table 4 to interpret the strength of the correlations [38]. This approach should support more informed decision-making for climate control and conservation planning in heritage buildings.
Figure 19 presents the correlation coefficients for key airflow properties—air velocity, temperature, relative humidity (RH), and TKE—for five different wind directions (S, SSE, E, NE, and N). The main results from the numerical simulation were:
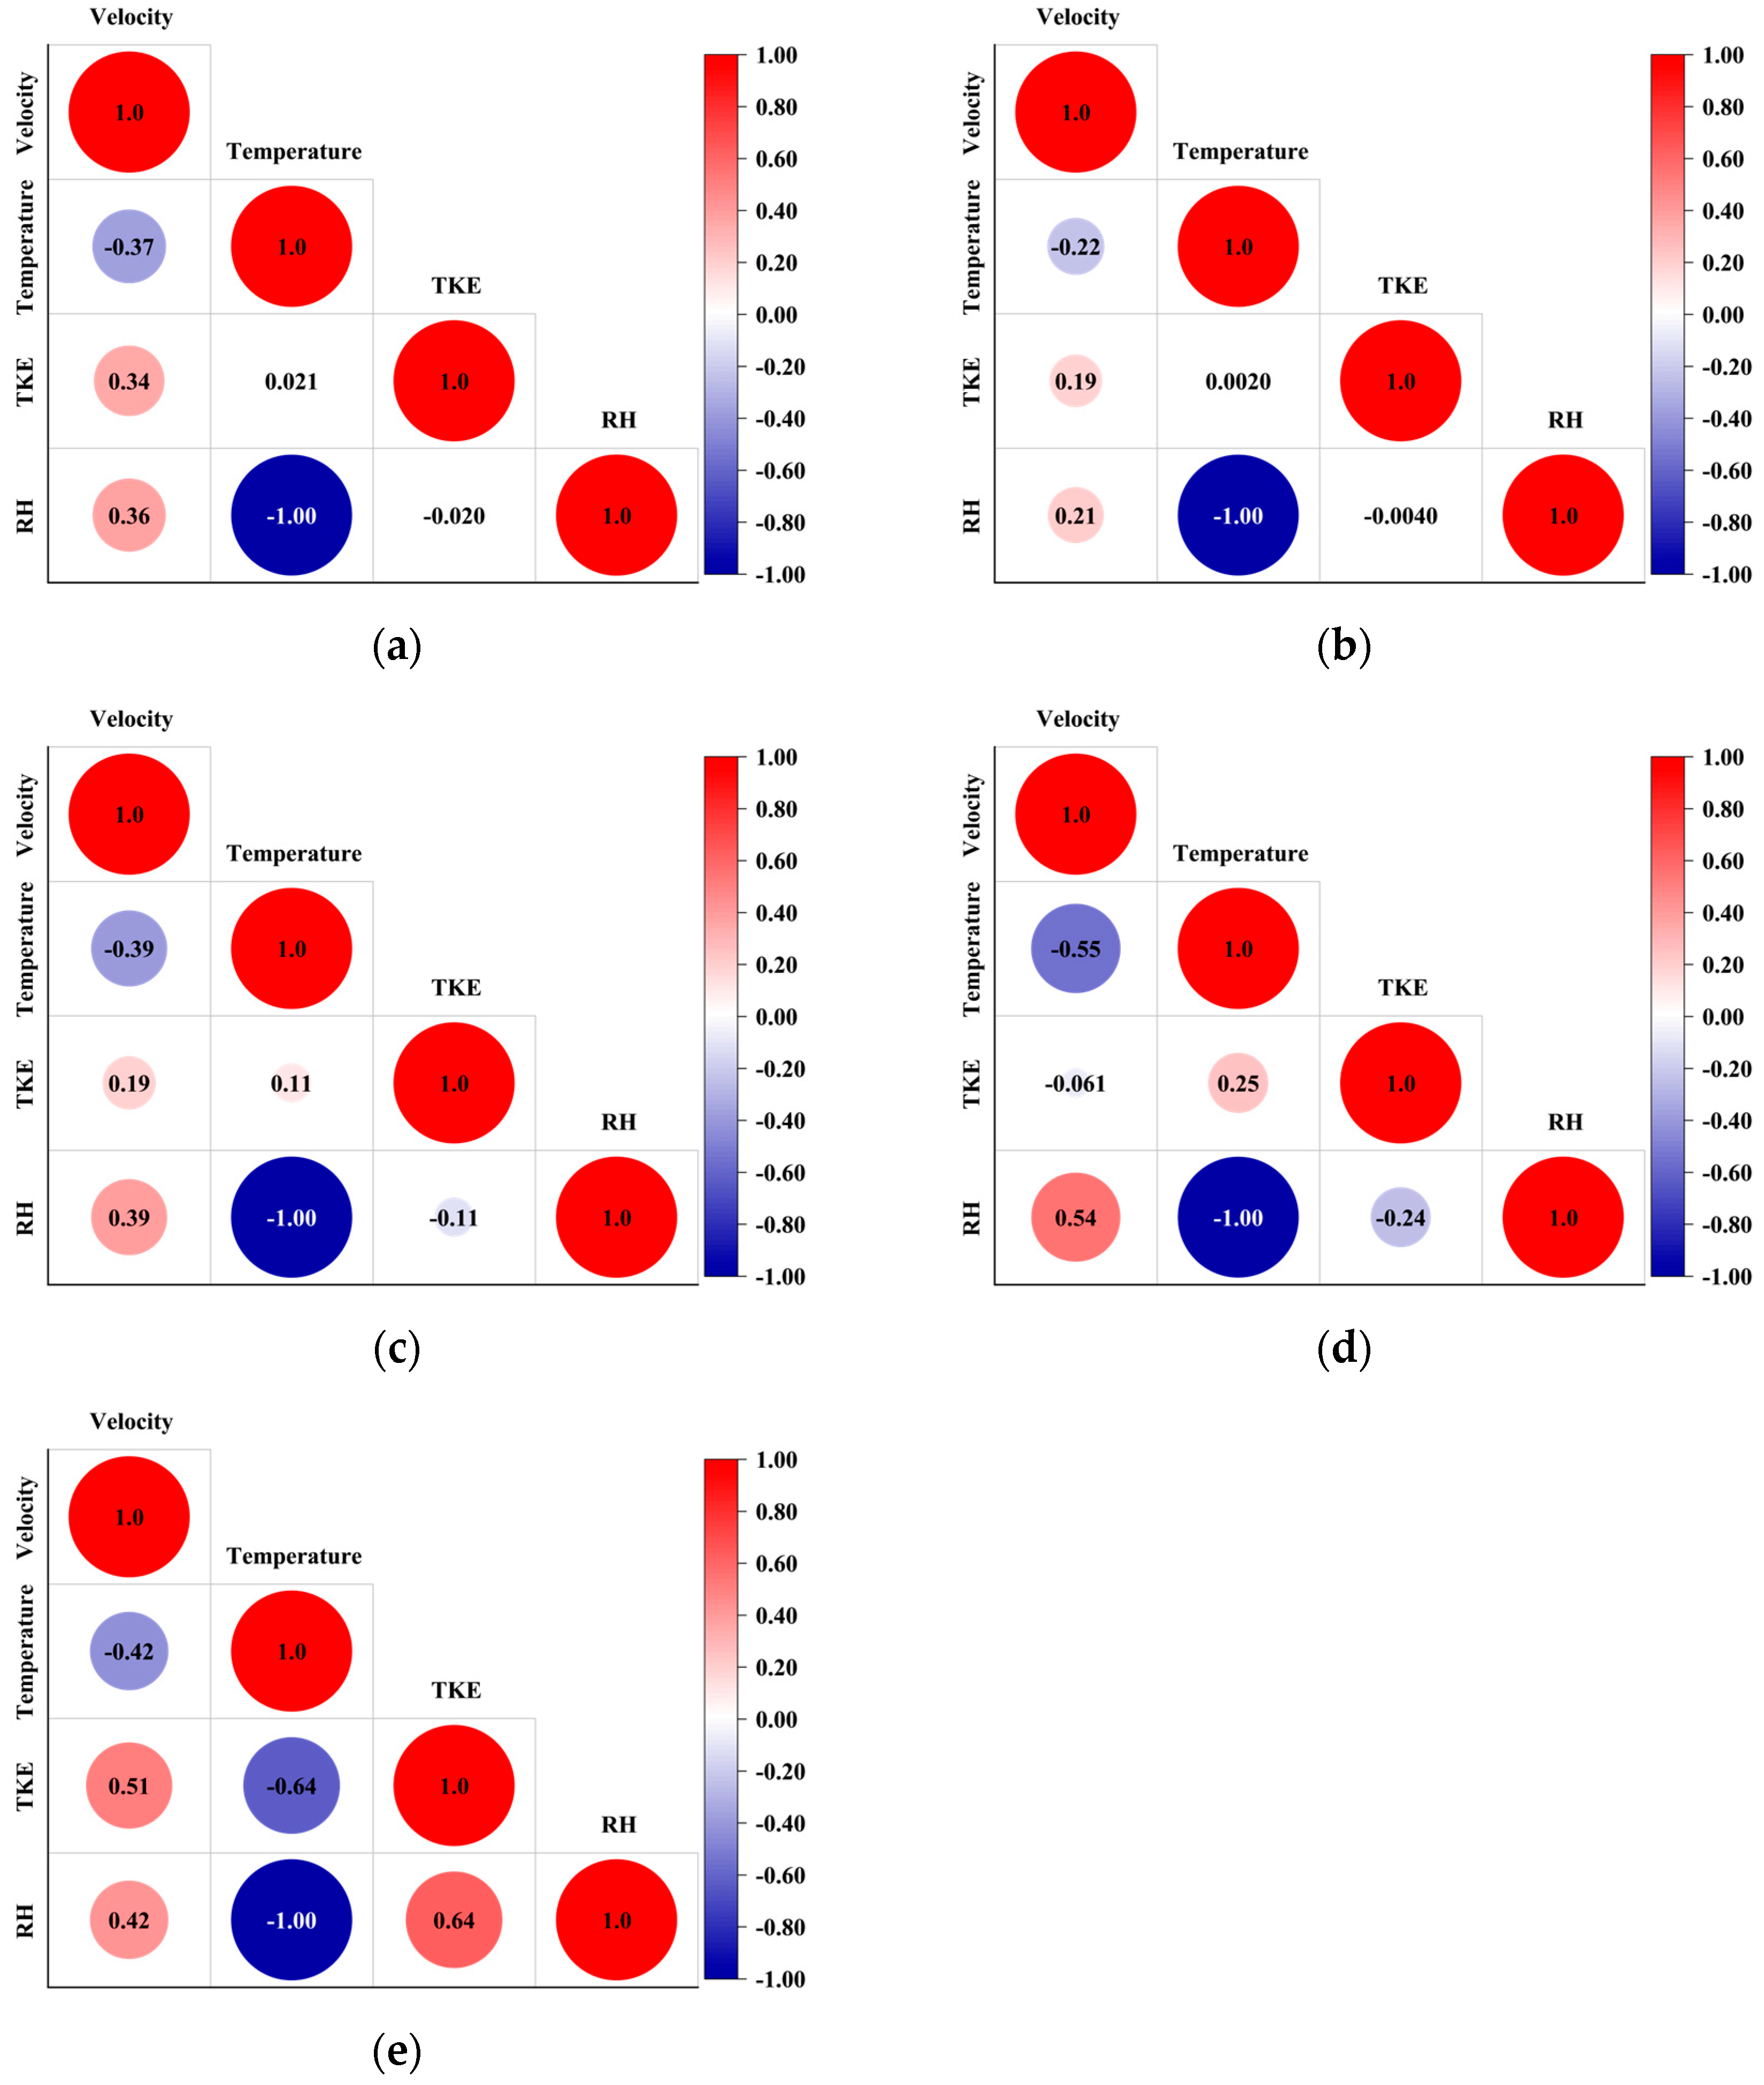
  • Velocity and Temperature: For all directions, there was a negative correlation between air velocity and temperature. The strongest negative correlation was for the northeast wind condition (NE = −0.55), indicating that higher air velocities were associated with lower temperatures.
  • Velocity and TKE: Correlation values between velocity and TKE were in the range −0.061 to 0.51. Depending on direction, this relationship was generally weak-to-moderate, with a strong positive response under north wind conditions (N = 0.51), indicating that a stronger airflow increased turbulence, especially from the north.
  • Velocity and Relative Humidity: There was a positive correlation between velocity and RH for all studied directions, ranging from 0.21 to 0.54. The strongest positive association was in the northeast wind direction (NE = 0.54), suggesting that a higher airflow can increased humidity mixing, potentially reducing localized moisture buildup.
  • Temperature and TKE: These correlations were generally weak and inconsistent, ranging from 0.002 to −0.64. The strongest inverse relationship was for north wind conditions (N = −0.64), suggesting that high turbulence may contribute to temperature reduction.
  • Temperature and RH: This relationship was strongly negative and remarkably consistent for all wind directions, with a value of −1.00 in each case. This suggested a perfectly inverse relationship—as the temperature increased, the relative humidity decreased—a well-established physical principle, confirming the reliability of the data.
  • TKE and RH: The relationship between TKE and RH was weak and varied with wind direction, ranging from −0.24 to 0.64. There was a moderate positive correlation for the north wind condition, indicating that increased turbulence may support humidity distribution in some cases, though the relationship was inconsistent across all scenarios.
These results revealed essential dependencies among the environmental variables under different wind conditions. The consistent inverse relationship between temperature and relative humidity is critical for managing internal moisture levels. At the same time, the moderate link between velocity and turbulence highlights the need to balance airflow strength to control both comfort and conservation risks. This analysis supported targeted environmental control and airflow design in heritage buildings to protect vulnerable materials and maintain indoor climate stability.

5.6. Aerodynamic Forces and Risk of Building Damage

Understanding the aerodynamic forces acting on historical structures is essential for evaluating the long-term impact of wind on building stability. Unlike modern buildings, heritage structures often lack built-in wind resistance, making them vulnerable to directional wind forces that may cause cumulative stress, cracking, material fatigue, or sudden failure. Therefore, analyzing the distribution and magnitude of wind-induced forces across different directions is vital to identifying areas at higher risk and developing informed conservation strategies. This section presents the results of aerodynamic force analysis under five main wind directions: S, SSE, E, NE, and N. These directions are consistent with Figure 4b. The forces were calculated on the wall of the Temple in three directions: X (across the width), Y (along the length), and Z (vertically). The bar chart in Figure 20 shows the relative distribution of aerodynamic forces acting on the building in these three directions. The results revealed that winds from the South (S) and North (N) strongly impacted the X-direction, contributing approximately 51.70% and 57.61% of the total force, respectively. This suggested there was considerable lateral pressure on the side walls of the building. In the Y-direction, the E wind produced the highest force ratio (91.01%), followed by the NE (63.35%), indicating strong drag forces acting along the length of the structure, which may affect long masonry walls or wooden beams. In the Z-direction, representing vertical pressure or uplift, the major contributions were from the SSE and N winds (38.33% and 41.09%, respectively). These forces should be of concern regarding potential uplift on the roof or weakening of upper wall sections. Considering the actual force values, the SSE direction had a large negative force in the X-direction (−5449.49 N), suggesting possible suction or reverse airflow near the side walls. In the Y-direction, the E wind produced the strongest force (25,616.18 N), aligning with the high ratio shown in the graph. In the Z-direction, the vertical force was the highest for SSE winds (8538.50 N), followed by NE winds (2283.91 N). These values should be of concern regarding the safety of roof elements and structural joints.
Several conclusions can be drawn from the combined analysis of both the percentage ratios and the actual force magnitudes. Lateral forces in the X-direction from S and N winds might cause stress on side walls and architectural features, such as slit windows, which are often more delicate. The E wind presented the highest structural risk along the Y-axis, especially for long unsupported walls. Finally, the SSE and NE wind directions were critical for vertical forces, where uplift might damage the roof structure or dislodge roof tiles over time. These key findings could be extended to support considering options and selecting conservation materials compatible with engineering requirements and heritage conservation regulations. By understanding the directional wind loads and airflow-induced stresses, future conservation planning should be able to more effectively integrate materials and structural solutions that ensure long-term stability, environmental compatibility, and compliance with preservation standards.

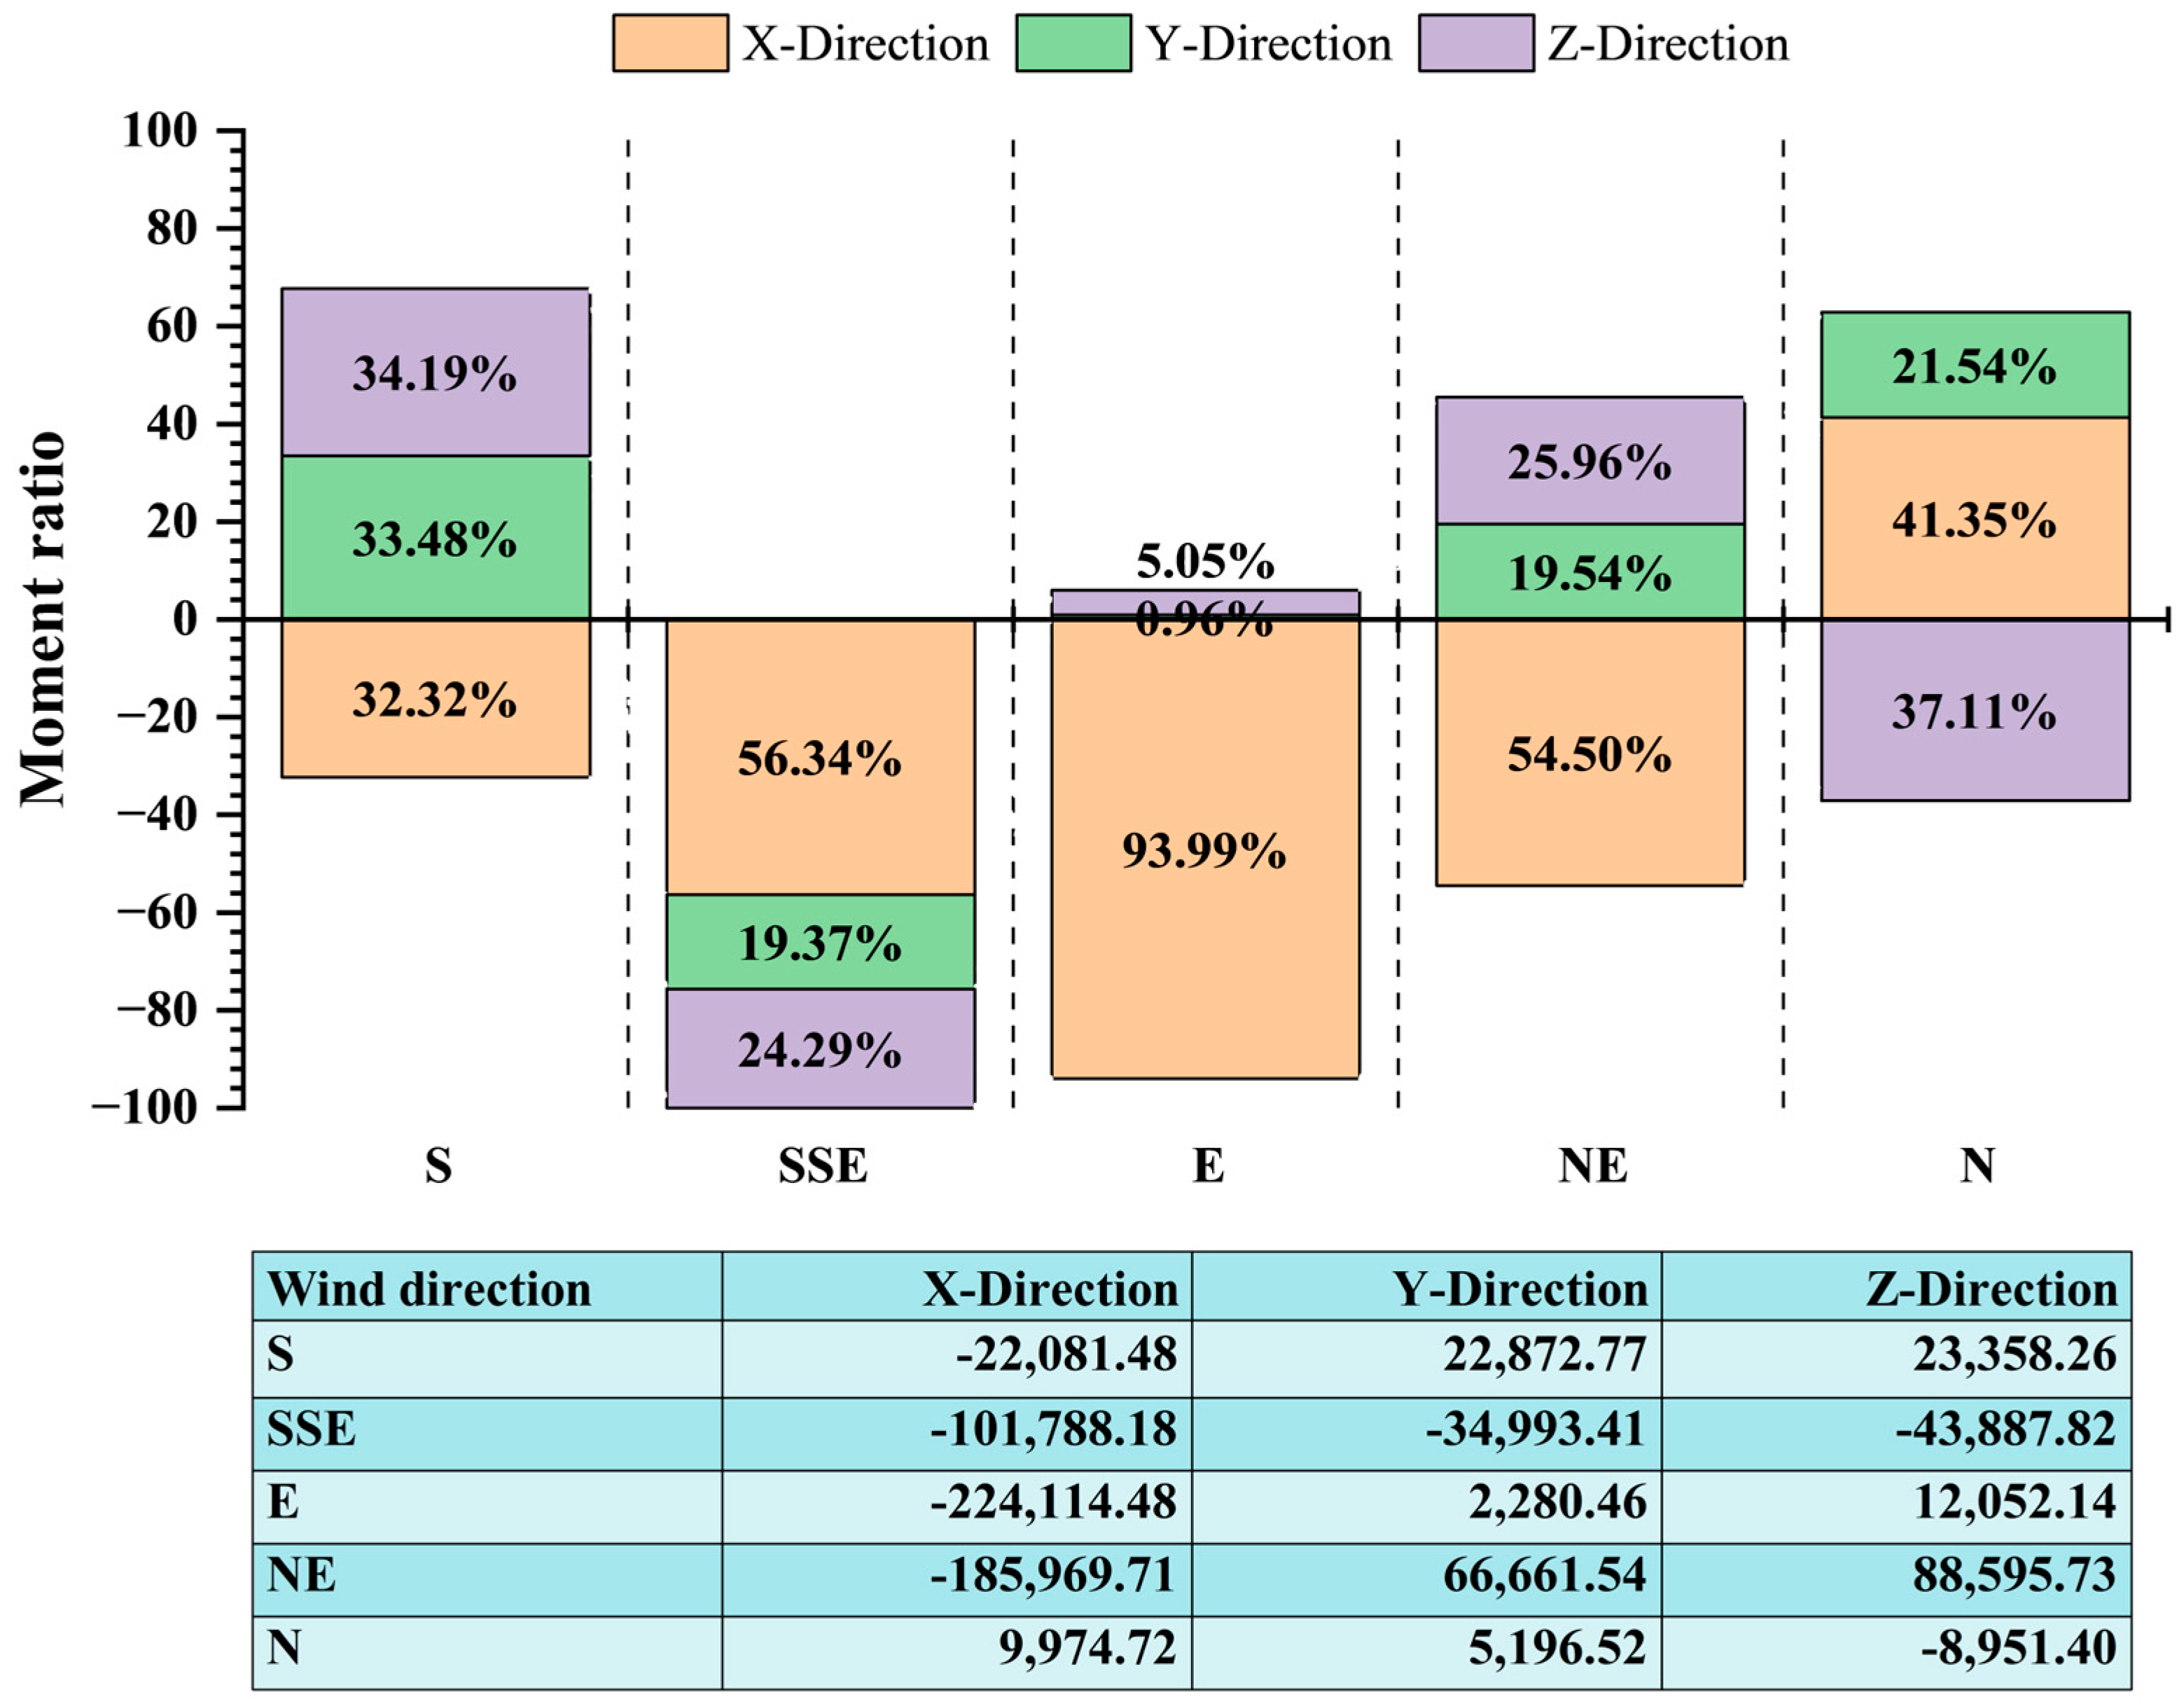
5.7. Aerodynamic Moment and Structural Stability Risk

Aerodynamic moments are vital in understanding how wind loads can cause rotation or twisting in historical structures. Unlike modern buildings, many heritage temples were not designed with reinforced elements that can resist torsion, uplift, or shear forces. Consequently, it is important to analyze aerodynamic moments in three main directions. This type of analysis helps to identify structural vulnerabilities that may affect the long-term stability and preservation of these culturally significant buildings.
The moment ratio graph in Figure 21 presents the percentage contribution of aerodynamic moments in three directions. The X direction, which represents horizontal rotation across the width of the building, had the highest moment ratio from the E wind (93.99%), followed by the SSE wind (56.34%) and the NE (54.50%). These results indicated that wind from these directions caused strong lateral rotational forces, which might place stress on side walls and column connections. In the Y direction, which corresponds to twisting along the length of the building, the highest moment ratios were from the S wind (33.48%) and the N wind (21.54%). These forces could introduce torque along long walls, leading to misalignment or fatigue in structural elements such as beams or load-bearing walls. The Z direction, which represents vertical torsion or uplift, was most influenced by the N wind (37.11%) and the S wind (34.19%), followed by the NE wind (25.96%). These vertical moments could cause deformation or displacement of the roof, particularly in buildings using traditional wooden frames or clay tiles.
The numerical values of the aerodynamic moments supported the trends shown in the graphical results of Figure 18. The E wind produced the highest moment in the X direction (−224,114.48 Nm), indicating a major risk to the lateral stability of the structure. The N wind generated the strongest moment in the Y direction (66,661.54 Nm) and the highest moment in the Z direction (88,595.73 Nm), revealing a critical vulnerability to vertical lift and longitudinal twisting. In addition, the SSE wind presented a complex risk, with a high lateral moment (−101,788.18 Nm) in the X direction and a substantial uplift moment (−43,887.82 Nm) in the Z direction. Based on these findings, the moment analysis clearly showed that winds from the E and NE directions posed the greatest aerodynamic threats to the Temple structure. These wind directions generated high rotational forces across all three axes and should be a priority in structural evaluation and reinforcement strategies. Understanding the distribution of aerodynamic moments is essential for developing effective conservation strategies. There should be careful assessment of structural elements sensitive to rotational forces, such as roof joints, ridge beams, wall corners, and projecting eaves, with subsequent reinforcement to prevent long-term deterioration. Addressing these directional wind-induced risks will help to improve the structural stability of the Temple, while preserving its historical and architectural value.

6. Conclusions

A comprehensive aerodynamic and environmental assessment was carried out of the Na Phra Meru Historical Temple. The research integrated high-resolution 3D laser scanning, computational grid validation, onsite measurements, and academic benchmarking to ensure accuracy and scientific credibility. The investigation began with validating airflow behavior and identifying recirculation zones under five prevailing wind directions. The main conclusions were as follows:
  • Internal airflow patterns were highly sensitive to wind direction, with distinct recirculation zones forming when the incoming wind was not aligned with the main entrance. This airflow behavior directly influenced temperature and humidity stability within the Temple, affecting the long-term preservation of materials.
  • In the analysis of the distribution of airflow properties, the spatial mapping of temperature, relative humidity, and turbulence kinetic energy (TKE) revealed that the central interior zone maintained relatively stable environmental conditions. However, there was increased moisture accumulation near wall surfaces, particularly in areas with low TKE. These conditions could encourage fungal growth and surface deterioration, consistent with observed physical damage on the rear wall of the Buddha image area.
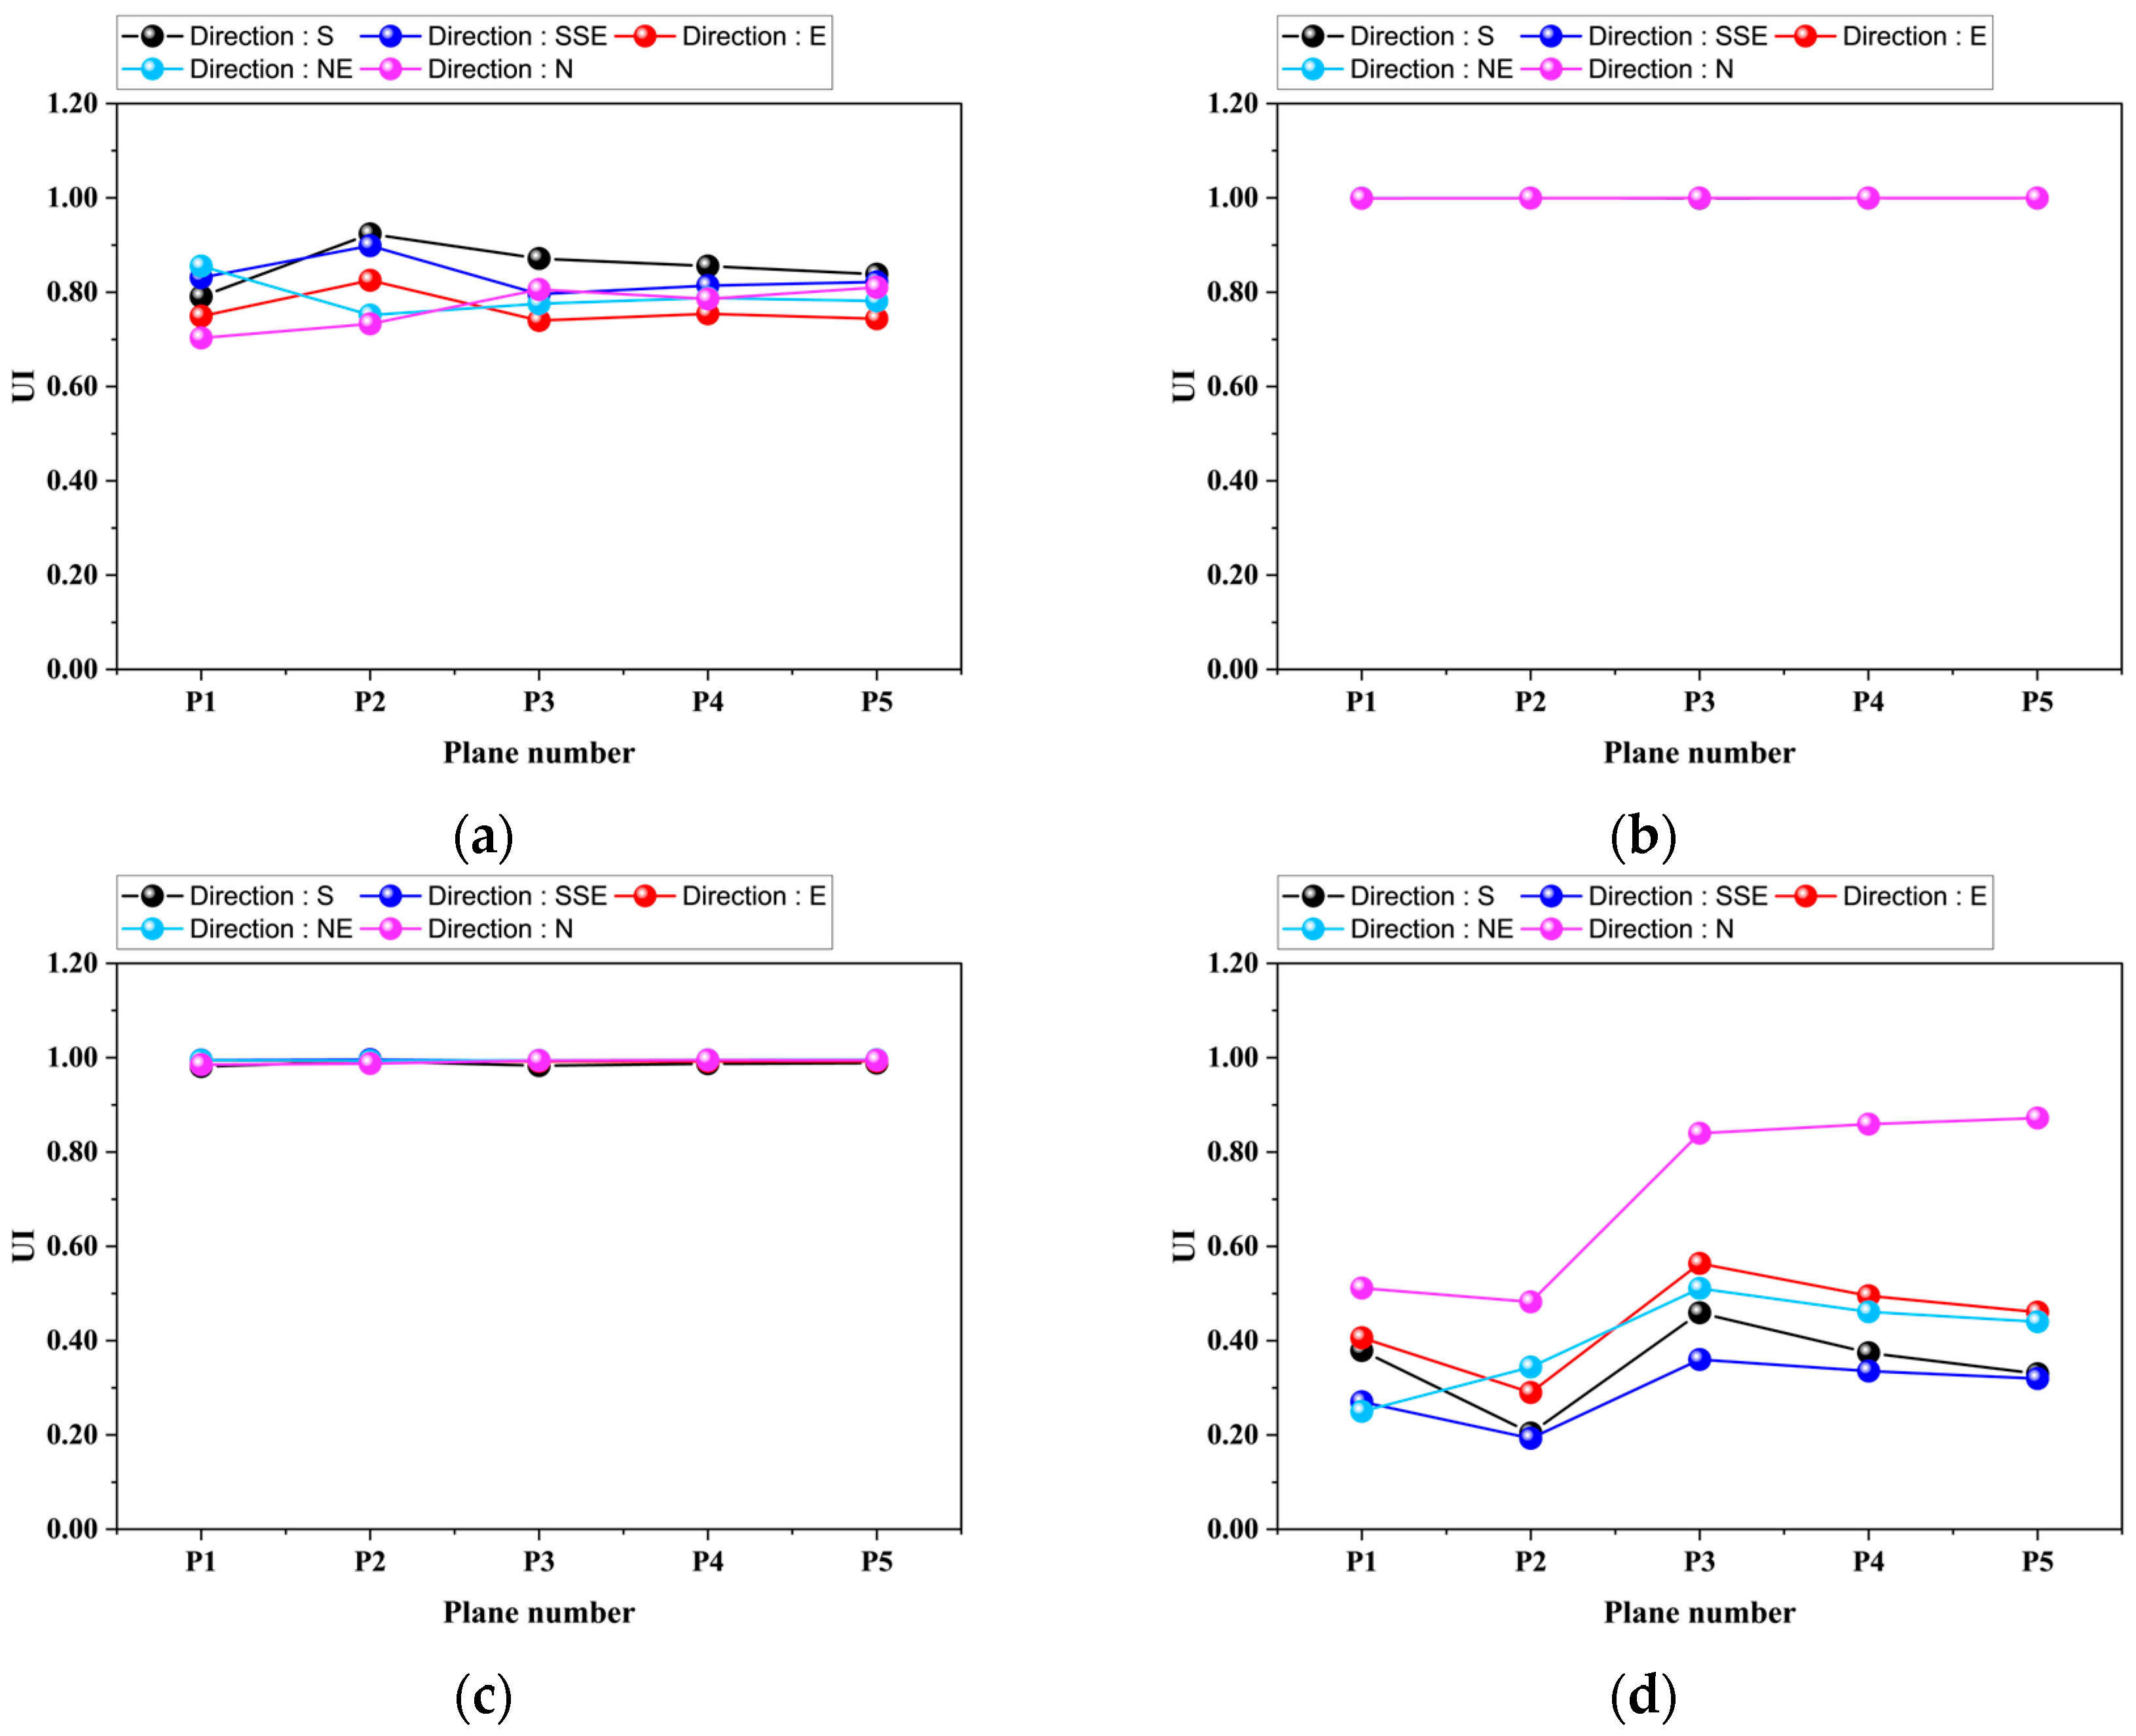
  • The assessment of airflow fluctuation using the UI provided further insight into microclimatic consistency. Temperature and humidity values were highly uniform, with UI values above 0.95. However, there was greater variability in velocity and TKE, especially in areas affected by recirculation zones. These fluctuations contributed to uneven heat and moisture distribution, possibly accelerating structural aging and material wear.
  • One of the study’s most notable findings was the identification of the role of the slit windows in natural ventilation. Contrary to prior assumptions, the airflow through these small architectural features did not merely escape but also formed a self-regulating outward air layer. This layer acted as a barrier that prevented external air from re-entering the building, helping to stabilize the indoor environment. This newly identified aerodynamic function has provided a deeper understanding of traditional Thai temple ventilation strategies.
  • Correlation analysis further confirmed the relationships among key environmental variables. There was a strong negative correlation between temperature and humidity and moderate correlations between velocity, TKE, and humidity. These quantitative relationships should provide a scientific foundation for developing improved microclimate management strategies in heritage buildings.
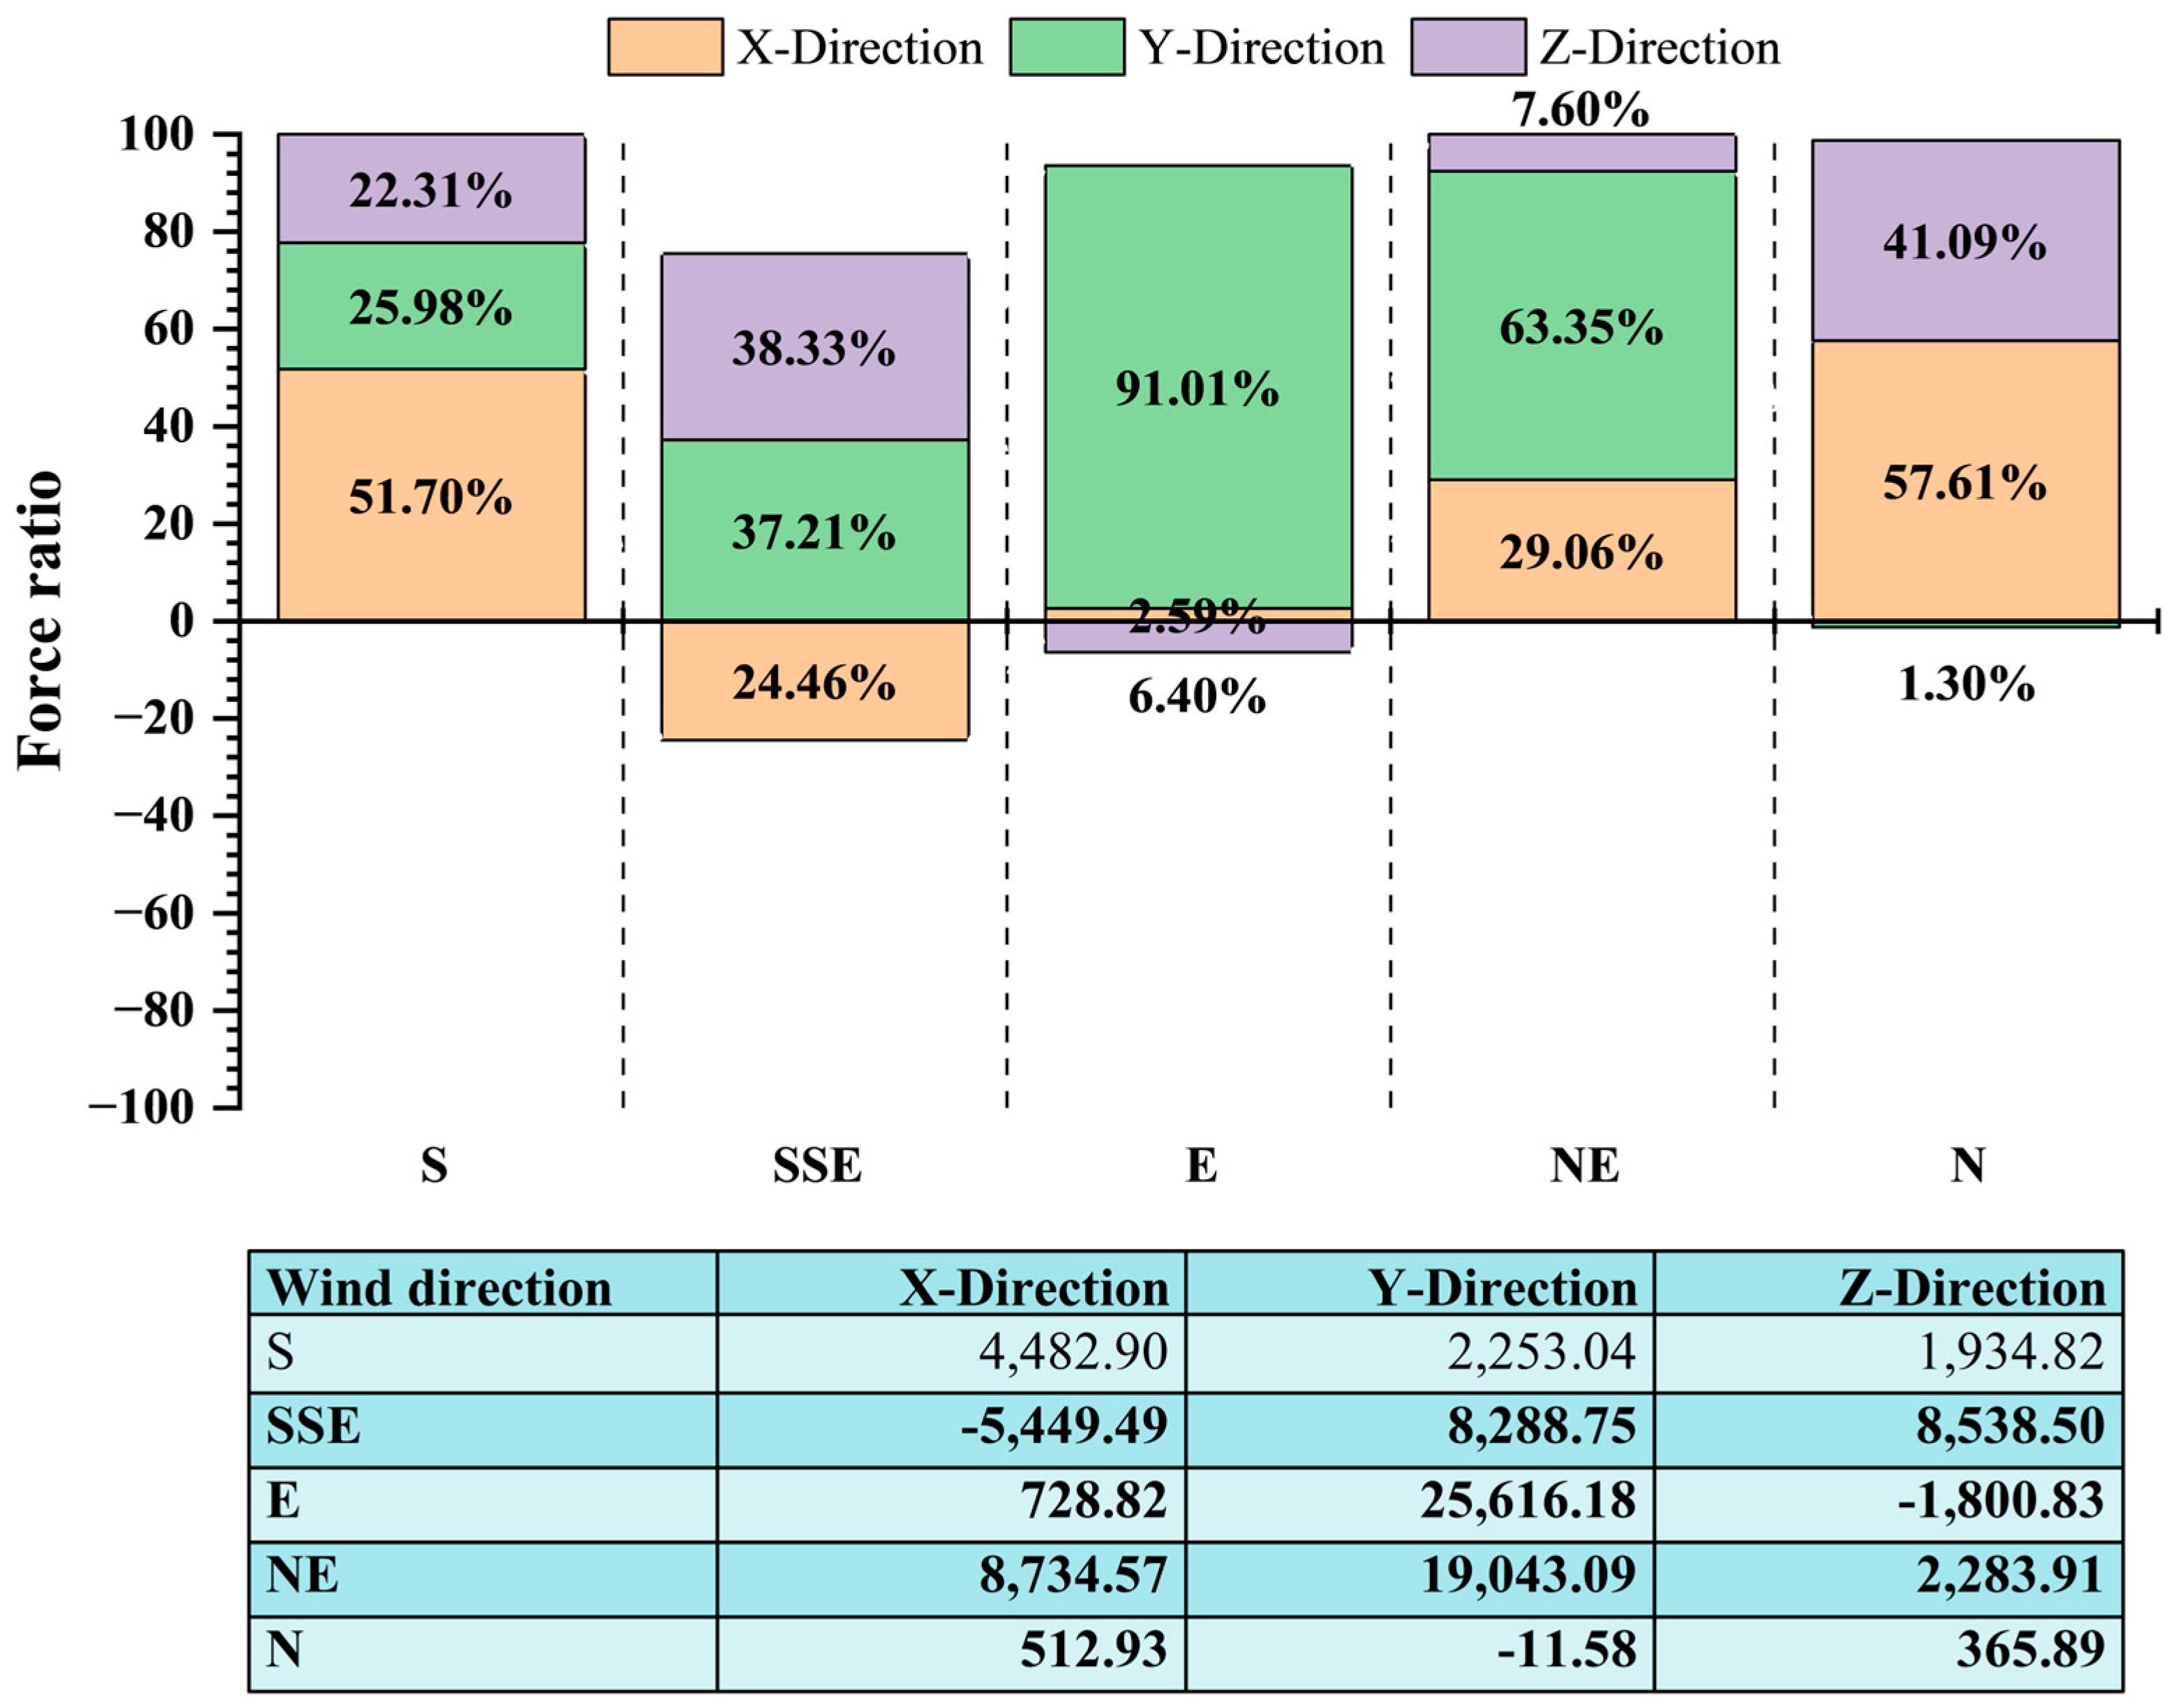
  • The analysis of aerodynamic forces revealed that wind direction had a marked impact on the magnitude and spatial distribution of force across the structure. The E and NE wind directions generated the highest loads, posing structural risks due to intense lateral pressure and potential uplift.
  • Finally, the moment analysis identified critical rotational stresses acting on the Temple. The E wind produced the largest rotational moment across the building width, while the NE wind was responsible for dominant moments in the length and vertical directions. These rotational effects highlighted the need to reinforce vulnerable structural components, including roof joints, ridge beams, wall corners, and projecting eaves, to reduce the risk of wind-induced fatigue.
This study provided novel scientific insights into the relationship between airflow behavior and structural vulnerability in a heritage context. The findings can be translated into actionable preservation strategies such as reinforcing roof joints and wall corners vulnerable to aerodynamic loads, improving natural ventilation through controlled use of slit windows, and selecting conservation materials compatible with high-moisture zones—all guided by engineering standards and aligned with UNESCO’s sustainable heritage management objectives.

Author Contributions

Conceptualization, M.K., C.P.-A. and W.P.; Methodology, M.K., C.P.-A. and W.P.; Software, M.K., C.P.-A. and W.P.; Validation, M.K., C.P.-A. and W.P.; Formal analysis, M.K., C.P.-A. and W.P.; Investigation, M.K., C.P.-A. and W.P.; Resources, M.K., C.P.-A. and W.P.; Data curation, M.K., C.P.-A. and W.P.; Writing—original draft, M.K., C.P.-A. and W.P.; Writing—review & editing, M.K., C.P.-A. and W.P.; Visualization, M.K., C.P.-A. and W.P.; Supervision, M.K. and W.P.; Project administration, M.K. and W.P.; Funding acquisition, M.K. and W.P. All authors have read and agreed to the published version of the manuscript.

Funding

The authors gratefully acknowledge the financial support from Rajamangala University of Technology Suvarnabhumi through the Frontier Research Scholarship Project (2024).

Institutional Review Board Statement

Not applicable.

Informed Consent Statement

Not applicable.

Data Availability Statement

The original contributions presented in this study are included in the article. Further inquiries can be directed to the corresponding authors.

Acknowledgments

The authors would like to express their sincere gratitude to the Ayutthaya Historical Park and the Fine Arts Department, Ministry of Culture, Thailand, for their kind support and official permission to access the study site. Their assistance in facilitating onsite measurements and providing essential historical and environmental information was instrumental to the successful completion of this research.

Conflicts of Interest

The authors declare no conflict of interest.

References

  1. World Heritage Centre. Climate Change and World Heritage. Available online: https://whc.unesco.org/en/climatechange/ (accessed on 9 June 2024).
  2. Diodato, N.; Ljungqvist, F.C.; Bellocchi, G. Historical predictability of rainfall erosivity: A reconstruction for monitoring extremes over Northern Italy (1500–2019). Npj Clim. Atmos. Sci. 2020, 3, 46. [Google Scholar] [CrossRef]
  3. Guo, Q.; Huang, J.; Pei, Q.; Zhang, B.; Zhan, H.; Zhang, H.; Richards, J.; Viles, H. Erosion Model for Wind-Blown Sand Flow at Earthen Sites in Arid Environment, Northwest China. Int. J. Archit. Herit. 2023, 19, 96–113. [Google Scholar] [CrossRef]
  4. Mannini, C.; Massai, T.; Panettieri, E.; Barni, N.; Giachetti, A.; Ferrucci, M.; Montemurro, M.; Vannucci, P. Experimental Study of the Wind Pressure Field on the Notre Dame Cathedral in Paris. Int. J. Archit. Herit. 2024, 18, 194–214. [Google Scholar] [CrossRef]
  5. Halder, S.; Parekh, A.; Chowdary, J.S.; Gnanaseelan, C. Dynamical and moist thermodynamical processes associated with Western Ghats rainfall decadal variability. Npj Clim. Atmos. Sci. 2022, 5, 8. [Google Scholar] [CrossRef]
  6. Metals, M.; Lesinskis, A.; Borodinecs, A.; Turauskis, K. Preliminary Study on Indoor Air Temperature and Moisture Behaviour in 13th-Century Churches in Latvia. Sustainability 2023, 15, 13965. [Google Scholar] [CrossRef]
  7. Liu, D.; Cao, K.; Tang, Y.; Zhang, J.; Meng, X.; Ao, T.; Zhang, H. Study on weathering corrosion characteristics of red sandstone of ancient buildings under the perspective of non-destructive testing. J. Build. Eng. 2024, 85, 108520. [Google Scholar] [CrossRef]
  8. Esteban-Cantillo, O.J.; Menendez, B.; Quesada, B. Climate change and air pollution impacts on cultural heritage building materials in Europe and Mexico. Sci. Total Environ. 2024, 921, 170945. [Google Scholar] [CrossRef]
  9. Zhao, B.; Han, W. Research on Measuring Methods and Influencing Factors of Spatial Damage Degree of Historic Sites: A Case Study of Three Ancient Cities in Shanxi, China. Buildings 2023, 13, 2957. [Google Scholar] [CrossRef]
  10. Rizou, M.E.; Marcelli, R.; Capoccia, G.; Proietti, E. Non-destructive microwave techniques for the quantification and elimination of moisture in cultural heritage monuments. J. Cult. Herit. 2024, 67, 270–276. [Google Scholar] [CrossRef]
  11. Sánchez Espinosa, K.C.; Rodríguez Davydenko, S.; Rojas Flores, T.I.; Fernández-González, M.; Almaguer, M. Xerophilic and cellulolytic fungi in the indoor air of houses in Havana. Int. Biodeterior. Biodegrad. 2024, 188, 105730. [Google Scholar] [CrossRef]
  12. Dyda, M.; Pyzik, A.; Wilkojc, E.; Kwiatkowska-Kopka, B.; Sklodowska, A. Bacterial and fungal diversity inside the medieval building constructed with sandstone plates and lime mortar as an example of the microbial colonization of a nutrient-limited extreme environment (Wawel royal castle, Krakow, Poland). Microorganisms 2019, 7, 416. [Google Scholar] [CrossRef]
  13. Kakakhel, M.A.; Wu, F.; Gu, J.D.; Feng, H.; Shah, K.; Wang, W. Controlling biodeterioration of cultural heritage objects with biocides: A review. Int. Biodeterior. Biodegrad. 2019, 143, 104721. [Google Scholar] [CrossRef]
  14. Chaudhuri, A.; Bhattacharyya, S.; Chakraborty, A.; Mukherjee, S.; Sudarshan, M.; Ghosh, C.K.; Chaudhuri, P. Inhibitory effect of UV and gamma radiation for fungal biodeterioration of concrete: A short-term study for sustainable conservation. J. Cult. Herit. 2024, 66, 316–325. [Google Scholar] [CrossRef]
  15. Martin-Pozas, T.; Fernandez-Cortes, A.; Cuezva, S.; Jurado, V.; Gonzalez-Pimentel, J.L.; Hermosin, B.; Ontañon, R.; Arias, P.; Cañaveras, J.C.; Sanchez-Moral, S.; et al. Microclimate, airborne particles, and microbiological monitoring protocol for conservation of rock-art caves: The case of the world-heritage site La Garma cave (Spain). J. Environ. Manag. 2024, 351, 119762. [Google Scholar] [CrossRef]
  16. Matoušková, E.; Kovářová, K.; Cihla, M.; Hodač, J. Monitoring biological degradation of historical stone using hyperspectral imaging. Eur. J. Remote Sens. 2024, 57, 2220565. [Google Scholar] [CrossRef]
  17. Chen, G.; Rong, L.; Zhang, G. Unsteady-state CFD simulations on the impacts of urban geometry on outdoor thermal comfort within idealized building arrays. Sustain. Cities Soc. 2021, 74, 103187. [Google Scholar] [CrossRef]
  18. Ascione, F.; De Rossi, F.; Iovane, T.; Mastellone, M. Microclimatic control of a fourteenth-century Church in Italy: The design of systems by experiments and simulations. Energy Build. 2023, 293, 113199. [Google Scholar] [CrossRef]
  19. Athira, K.S.; Roxy, M.K.; Dasgupta, P.; Saranya, J.S.; Singh, V.K.; Attada, R. Regional and temporal variability of Indian summer monsoon rainfall in relation to El Niño southern oscillation. Sci. Rep. 2023, 13, 12643. [Google Scholar] [CrossRef]
  20. Li, J.; Zhang, H.; Fan, Z.; He, X.; He, S.; Sun, M.; Ma, Y.; Fang, S.; Zhang, H.; Zhang, B. Investigation of the renewed diseases on murals at Mogao Grottoes. Herit. Sci. 2013, 1, 31. [Google Scholar] [CrossRef]
  21. Cheng, J.C.P.; Zhang, J.; Kwok, H.H.L.; Tong, J.C.K. Thermal performance improvement for residential heritage building preservation based on digital twins. J. Build. Eng. 2024, 82, 108283. [Google Scholar] [CrossRef]
  22. Qian, Y.; Leng, J.; Zhou, K.; Liu, Y. How to measure and control indoor air quality based on intelligent digital twin platforms: A case study in China. Build. Environ. 2024, 253, 111349. [Google Scholar] [CrossRef]
  23. Iskandar, L.; Bay-Sahin, E.; Martinez-Molina, A.; Toker Beeson, S. Evaluation of passive cooling through natural ventilation strategies in historic residential buildings using CFD simulations. Energy Build. 2024, 308, 114005. [Google Scholar] [CrossRef]
  24. Liu, J.; Azhar, S.; Willkens, D.; Li, B. Static Terrestrial Laser Scanning (TLS) for Heritage Building Information Modeling (HBIM): A Systematic Review. Virtual Worlds 2023, 2, 90–114. [Google Scholar] [CrossRef]
  25. Wang, W.; Hei, M.; Peng, F.; Li, J.; Chen, S.; Huang, Y.; Feng, Z. Development of “air-ground data fusion” based LiDAR method: Towards sustainable preservation and utilization of multiple-scaled historical blocks and buildings. Sustain. Cities Soc. 2023, 91, 104414. [Google Scholar] [CrossRef]
  26. Krishna, Z.; Gandhar, P.; Balasubramanyam Varghese, A.; ANSYS Inc.; Zore, K.; Sasanapuri, B.; Parkhi, G.; Varghese, A. Ansys mosaic poly-hexcore mesh for high-lift aircraft configuration. In Proceedings of the 21st Annual CFD Symposium, Bangalore, India, 1–11 September 2019. [Google Scholar]
  27. Sudirman, M.; van Hooff, T.; Gillmeier, S.; Blocken, B. Validation study of cross-ventilation in a realistic building geometry: RANS, SAS and LES. Build. Environ. 2025, 269, 112354. [Google Scholar] [CrossRef]
  28. Chen, F.; Yu, S.C.M.; Lai, A.C.K. Modeling particle distribution and deposition in indoor environments with a new drift-flux model. Atmos. Environ. 2006, 40, 357–367. [Google Scholar] [CrossRef]
  29. Caselli, E.; Pancaldi, S.; Baldisserotto, C.; Petrucci, F.; Impallaria, A.; Volpe, L.; D’Accolti, M.; Soffritti, I.; Coccagna, M.; Sassu, G.; et al. Characterization of biodegradation in a 17th century easel painting and potential for a biological approach. PLoS ONE 2018, 13, e0207630. [Google Scholar] [CrossRef]
  30. Vieto, S.; Escudero-Leyva, E.; Avendaño, R.; Rechnitzer, N.; Barrantes-Madrigal, M.D.; Conejo-Barboza, G.; Herrera-Sancho, O.A.; Chaverri, P.; Chavarría, M. Biodeterioration and cellulolytic activity by fungi isolated from a nineteenth-century painting at the National Theatre of Costa Rica. Fungal Biol. 2022, 126, 101–112. [Google Scholar] [CrossRef]
  31. Ma, W.; Wu, F.; He, D.; Li, J.; Zhang, Q.; Yang, X.; Gu, J.D.; Wang, W.; Feng, H. The biodeterioration outbreak in Dunhuang Mogao Grottoes analyzed for the microbial communities and the occurrence time by C-14 dating. Int. Biodeterior. Biodegrad. 2023, 178, 105533. [Google Scholar] [CrossRef]
  32. Menke, R.; Vasiljevi, N.; Mann, J.; Lundquist, J.K. Characterization of flow recirculation zones at the Perdigão site using multi-lidar measurements. Atmos. Chem. Phys. 2019, 19, 2713–2723. [Google Scholar] [CrossRef]
  33. Liu, J.; Wu, F.; Xiang, T.; Ma, W.; He, D.; Zhang, Q.; Wang, W.; Duan, Y.; Tian, T.; Feng, H. Differences of airborne and mural microorganisms in a 1500-year-old Xu Xianxiu’s Tomb, Taiyuan, China. Front. Microbiol. 2023, 14, 1253461. [Google Scholar] [CrossRef]
  34. Yang, G.; Yang, X.; Li, C.; Wei, X.; Lu, Z.; Zhang, C.; Wang, Q.; Wu, X. Numerical study on the uniform distribution of flow field of airflow dryer. Heliyon 2024, 10, e29439. [Google Scholar] [CrossRef] [PubMed]
  35. ANSYS Inc. ANSYS Fluent Theory Guide Turbulence Model; Ansys Inc.: Canonsburg, PA, USA, 2024. [Google Scholar]
  36. Newport Partners, LLC. Building Moisture and Durability Past, Present and Future Work. 2004. Available online: https://www.huduser.gov/publications/pdf/buildingmoistureanddurability.pdf (accessed on 14 May 2025).
  37. Hu, J.; Wang, Y.; Wang, D.; Du, H.; Fan, J.; Liu, Y.; Sun, X. Indices for dynamic evaluation of indoor humidity and thermal environment. Commun. Eng. 2023, 2, 59. [Google Scholar] [CrossRef]
  38. Chen, H.; Zhu, S.; Ye, T.; Miao, Y. Optimizing Urban Ventilation in Heritage Settings: A Computational Fluid Dynamics and Field Study in Zhao’an Old Town, Fujian. Buildings 2025, 15, 483. [Google Scholar] [CrossRef]
Figure 1. Workflow for sustainable conservation and preservation with CFD integration.
Applsci 15 07466 g001
Figure 2. Location of Na Phra Meru Historical Temple (Google Map, 14 May 2024).
Applsci 15 07466 g002
Figure 3. Na Phra Meru Historical Temple architecture: (a) landscape of main ordination hall, (b) main Buddha image in ordination hall, (c) inside main ordination hall, (d) top roof, and (e) carved wooden beams and ceiling adorned with wood carvings showing stars and the moon, (Photo 10 Jan 2024 by Mongkol Kaewbumrung).
Applsci 15 07466 g003aApplsci 15 07466 g003b
Figure 4. Details of computational domain: (a) point cloud of Na Phra Meru Historical Temple produced using FARO focus laser scanning technology, and (b) 3D solid model after surface finishing.
Applsci 15 07466 g004
Figure 5. Measurement equipment and locations for onsite experiments.
Applsci 15 07466 g005
Figure 6. Boundary conditions for flow analysis.
Applsci 15 07466 g006
Figure 7. Wind rose diagram for Ayutthaya province based on annual wind direction data from Thai Meteorological Department, 2024.
Applsci 15 07466 g007
Figure 8. Numerical simulation workflow.
Applsci 15 07466 g008
Figure 9. Grid independence study comparing different grid resolutions.
Applsci 15 07466 g009
Figure 10. MOSAIC meshing approach used in computational study.
Applsci 15 07466 g010
Figure 11. Comparison of current study with Chen et al. [28].
Applsci 15 07466 g011
Figure 12. Experimental data compared to current CFD (red dots represents CFD data).
Applsci 15 07466 g012
Figure 13. Computational simulation results from section plane.
Applsci 15 07466 g013
Figure 14. Air properties inside and outside the ordination hall.
Applsci 15 07466 g014
Figure 15. Deterioration on rear wall inside Temple (Photo 14 May 2025 by Mongkol Kaewbumrung).
Applsci 15 07466 g015
Figure 16. Uniformity index of air parameters in each vertical section: (a) velocity, (b) temperature, (c) relative humidity, and (d) turbulence kinetic energy.
Applsci 15 07466 g016
Figure 17. Historical architectural examples illustrating ventilation strategies through slit windows in prominent Thai heritage sites: (a) Srisutchanalai Historical Park, Si Satchanalai, Sukhothai province, Thailand (18 July 2022), (b) Wat Phra Si Rattana Mahathat Chaliang, Si Satchanalai, Sukhothai province, Thailand (18 July 2022), (c) Wat Nang Phaya, Srisutchanalai Historical Park, Sukhothai province, Thailand (18 July 2022), (d) Wat Phra Non, Kamphaeng Phet Historical Park, Kamphaeng Phet province, Thailand (19 July 2022). Photo by Mongkol Kaewbumrung.
Applsci 15 07466 g017
Figure 18. Streamline visualizations on observation plane illustrating flow structures under different wind directions: (a) SSE plane: 3 m, (b) SSE plane: 5 m, (c) E plane: 5 m and (d) Vertical section.
Applsci 15 07466 g018aApplsci 15 07466 g018b
Figure 19. Comparison of Pearson correlation coefficient values in center plane: (a) S, (b) SSE, (c) E, (d) NE, (e) N.
Applsci 15 07466 g019
Figure 20. Ratio and magnitude of aerodynamic forces (in newtons) acting in the X, Y, and Z directions on building walls under various wind conditions.
Applsci 15 07466 g020
Figure 21. Ratio and magnitude of aerodynamic forces (in Nm) acting in the X, Y, and Z directions on temple walls under various wind conditions.
Applsci 15 07466 g021
Table 1. Boundary conditions for each surface group.
Boundary SurfaceBoundary Condition TypeCase 1
(Validation)
Case 2Case 3
InletVelocity inlet
Temperature
Relative humidity
U0 = 2.93 m/s
T0 = 27.85 °C
%RH = 66.0%
U0 = 3.50 m/s
T0 = 27.85 °C
%RH = 66.0%
U0 = 5.50 m/s
T0 = 27.85 °C
%RH = 66.0%
OutletPressure outlet
Bottom wallNo-slip wall
Heat flux
q = 35 w/m2q = 35 w/m2q = 35 w/m2
RoofHeat fluxq = 40 w/m2q = 40 w/m2q = 40 w/m2
Table 2. Grid independence analysis.
PropertyGrid 1Grid 2Grid 3Grid 4Grid 5
Total5,736,5209,934,05310,935,49916,365,08721,505,898
Cartesian hex element1,408,485
24.55%
726,235
7.31%
838,697
7.67%
5,507,841
33.66%
5,442,178
25.31%
Polyhedral transition element1,164,269
20.30%
2,569,734
25.87%
2,831,350
25.89%
4,714,679
28.81%
3,409,531
15.85%
Poly prism element3,163,766
55.15%
6,638,084
66.82%
7,265,452
66.44%
6,142,567
37.53%
12,654,189
58.84%
Number of boundary layers510101015
Average Y+12<1<1<1<1
Peak memory (Gb)24.9239.3242.5759.8484.92
Table 3. Numerical settings.
Solution ControlMethod
Spatial discretization
PressureStandard
Momentum2nd Order upwind
Turbulence kinetic energy2nd Order upwind
Specific dissipation rate2nd Order upwind
All species2nd Order upwind
Energy2nd Order upwind
Multigrid
FlowF-cycle
Turbulence kinetic energyFlexible
Specific dissipation rateFlexible
All speciesFlexible
EnergyF-Cycle
Table 4. Classification of correlation strength based on correlation coefficient.
CorrelationCorrelation Level
−1.00 to −0.70Strong negative
−0.70 to −0.40Moderate negative
−0.40 to −0.10Weak negative
−0.10 to 0.10No correlation
0.10 to 0.40Weak positive
0.40 to 0.70Moderate positive
0.70 to 1.00Strong positive
Disclaimer/Publisher’s Note: The statements, opinions and data contained in all publications are solely those of the individual author(s) and contributor(s) and not of MDPI and/or the editor(s). MDPI and/or the editor(s) disclaim responsibility for any injury to people or property resulting from any ideas, methods, instructions or products referred to in the content.

