Article

Hybrid Grey–Fuzzy Approach for Optimizing Circular Quality Responses in Plasma Jet Manufacturing of Aluminum Alloy

1
Faculty of Science, University of Split, Ruđera Boškovića 33, 21000 Split, Croatia
2
Faculty of Mechanical Engineering, Computing and Electrical Engineering, University of Mostar, Matice Hrvatske b.b., 88000 Mostar, Bosnia and Herzegovina
3
Independent Researcher, 21000 Split, Croatia
*
Author to whom correspondence should be addressed.
Appl. Sci. 2025, 15(13), 7447; https://doi.org/10.3390/app15137447
Submission received: 9 June 2025 / Revised: 30 June 2025 / Accepted: 1 July 2025 / Published: 2 July 2025
(This article belongs to the Special Issue Advances in Manufacturing and Machining Processes)

Abstract

Plasma jet cutting is a non-conventional process commonly used in modern industry for processing metal sheets and preparing them for subsequent technological steps. In this context it is very important to achieve the best possible final-quality workpiece to minimize additional post-processing costs, and time. This is especially challenging by the plasma jet processing of aluminum and its alloys. In this paper, a comprehensive analysis regarding the machinability and optimal circular quality of aluminum alloy 5083 was performed. Process parameters whose effects were analyzed are the cutting speed, arc current and cutting height. The circular quality was considered through responses: the circular kerf width, circular bevel angle, and circularity error on the top and bottom sheet of the metal side. To design functional relations between the process inputs and quality performances, an artificial intelligence fuzzy logic technique supported by ANOVA was applied. In order to define the process conditions that result in optimal cut quality responses, the multi-objective optimization of hybrid grey relational analysis (GRA) and the fuzzy logic approach was presented. Corresponding surface plots were created to determine the Pareto front of optimal solutions that simultaneously optimize all circular quality objective functions. The optimization procedure was confirmed through a test in which the mean absolute percentage error represented as the validation metric.

1. Introduction

Plasma jet manufacturing is a non-conventional manufacturing process very widely applied today in various areas and industries such as machinery components fabrication, construction, shipbuilding, aerospace, railway, and heavy equipment manufacturing, as well as in the defense and military industry. The plasma jet manufacturing process is based on a plasma arc that has very large amount highly ionized gas energy that is able to cut and process different electrically conductive materials such as steels, aluminum, brass, copper, et al., at various thicknesses in high-density industrial plasma systems even up to 150 mm. A key point in each manufacturing process, and so in this one, is to finally obtain the optimal part quality and minimize eventual post-processing procedures that require additional time and costs. To perform with the best possible cut quality in the plasma jet manufacturing process, it is crucial is to be familiar with process parameter settings that correspond directly to the sheet metal thickness as well as manufacturing process conditions. Due to the complexity and vague nature of the plasma manufacturing process, it is usually very demanding to determine process conditions that correspond at the same time to optimize all important cut quality characteristics. In order to better understand the influence of the process parameters on various plasma jet cut quality responses and to find out the optimal process settings for a specific material, many authors conducted comprehensive investigations. Most of these investigations were performed on steels [1,2,3,4,5,6,7,8,9,10,11,12]. As is well known, steels are, due to their high melting point, very appropriate for processing by thermal manufacturing processes such as plasma jet cutting.
Besides steel, few papers have covered the plasma jet manufacturing process of aluminum alloys [13,14,15,16,17]. Other metallic materials are largely under-represented in the literature concerning the investigation of their machinability and the quality aspects of the plasma jet cutting process. Aluminum is very sensitive to heat input and due to that, it requests very precise handling with a plasma jet manufacturing system, as well as process parameters settings. Due to these characteristics, it represents a kind of challenge in a research sense where appropriate manufacturing process conditions will lead to the highest cut quality need to be defined.
Peko et al. [13] conducted a comprehensive investigation regarding the modeling and optimization of the cut quality characteristics on aluminum alloy 5083. Experimental trials involving straight cuts were carried out based on a full factorial experimental design, with the cutting speed, arc current, and cutting height selected as the input parameters. The evaluated cut quality characteristics included the kerf width, bevel angle, surface roughness (Ra and Rz), and material removal rate. A regression analysis was applied to generate mathematical models of the cut quality responses. Each mathematical model was verified by a comparison between experimental and predicted responses data as well as by calculating the mean absolute percentage error (MAPE). The 2D and 3D surface plots were presented to visualize the process parameter effects on predicted cut quality responses. ANOVA was applied to determine for each response the most influential parameter and corresponding interaction. Finally, multi-objective optimization was performed by desirability analysis. A set of Pareto optimal solutions that satisfy, in the same time, all cut quality characteristic objective functions was defined. Finally, these results were followed by graphical representations of the optimal cutting area and corresponding process parameters levels. Peko et al. [14] developed an artificial neural network (ANN) model for the prediction of the kerf width independent of the cutting speed, arc current, and cutting height process parameters. The ANN model was generated by training data obtained by experimentations, according to the Taguchi L18 plan, where straight cuts on aluminum alloy 5083 were produced. Two additional data sets were applied for the validation and testing of the developed kerf width model. The mean squared error and correlation coefficients proved the prediction accuracy of the developed model in all three data sets. Consequently, 2D and 3D response surface plots that visualize the process parameters’ effects on the analyzed response were generated. Also, these plots served for the determination of optimal process parameter settings that lead to a minimal kerf width. Peko et al. [15] examined the effect of the cutting speed, arc current, and cutting height on the formation of the dross height, molten metal localized on the bottom of metal sheet. In this paper, the authors performed experimental trials, straight cuts, according to the Taguchi L27 design on aluminum alloy 5083. In order to define the relations between the input parameters and dross height quality characteristics, the fuzzy logic technique was applied and a set of fuzzy IF-THEN rules was established. The fuzzy logic model was checked by a comparison between the experimental and predicted response data on a validation experimental data set and with verification measures: the mean absolute percentage error and coefficient of determination. Finally, response surface plots as well as contour plots present process parameter effects and enable the determination of optimal process conditions with minimal dross generation. Kadirgama et al. [16] analyzed the heat-affected zone (HAZ) width when cutting aluminum alloy 6061. The process parameters whose influence was analyzed in this paper are the arc current, standoff gap, and gas pressure. Additionally, a regression mathematical model of the heat-affected zone was developed. This model was optimized by a partial swarm optimization algorithm and corresponding process parameter levels that result with a minimal HAZ were identified. Hamid et al. [17] conducted experimentations according to the Taguchi L9 experimental plan by varying the levels of process parameters: the arc current, feed rate, gas pressure, and cutting distance when cutting aluminum alloy 5083. They performed multi-objective optimization by GRA in order to define the process parameter values that lead to minimal surface roughness and conicity responses. Additionally, ANOVA was applied to estimate the significance of each parameter on a grey relational grade. Patel et al. [18] investigated the influence of plasma jet cutting process conditions on responses such as the material removal rate, top and bottom kerf width, and bevel angle in cutting aluminum alloy 6082. The process parameters that were taken into account were the arc current, standoff distance, gas pressure, and cutting speed. To determine the process parameter settings that result in optimal cut quality characteristics, the authors generated main effects plots. Additionally, ANOVA was performed to discuss the statistical significance of each parameter on the analyzed responses.
As it is already seen, regarding the cut quality characteristics, the authors examined the cut quality of straight cuts through responses such as: the surface roughness, kerf width, taper, bevel angle, material removal rate, dross height, heat-affected zone, etc. Additionally, several studies [19,20,21] have focused on circular cuts and their quality characteristics, due to the distinct behavior of the plasma jet observed during rounded cutting.
Kechagias et al. [19] developed the ANN model that predicts the bevel angle circular cut quality response independent of the plate thickness, cutting speed, arc ampere, arc voltage, air pressure, pierce height, and torch standoff distance in cutting an St37 carbon steel plate. Experimental trials were conducted according to the Taguchi L18 design. These data were divided into three data sets: for training the ANN model, its validation, and testing. When the ANN model was generated, its prediction accuracy was tested on data sets for validation and testing. A coefficient of correlation and mean squared error were applied as prediction accuracy measures when a comparison between the experimental and predicted response data was performed. Finally, the developed ANN model served for the creation of 3D response surface plots that visualize the process parameter effects on the analyzed response as well as to determine the optimal manufacturing process conditions that result in a minimal bevel angle. Asiabanpour et al. [20] investigated the influence of the arc current, gas pressure, cutting speed, torch height, tool type, etc., on the dimensional accuracy, bevel angle, and dross height of circular cuts in the processing of a stainless steel sheet. The authors implemented the design of the experiments and the response surface methodology approach to discuss the process parameter effects, as well as to define regression mathematical models. Additionally, multi-response optimization was performed by a desirability analysis and a set of Pareto optimal solutions, that result in close-to-perfect cut quality characteristics, was derived. Chen et al. [21] applied the Taguchi method combined with the Six Sigma approach to optimize the roundness of holes for the indicator light of large electrical switchboards. Hole-cut quality responses were defined by the bevel magnitude and diameter deviation. Factors that were analyzed in this paper are the air pressure, pierce time, tip size, feed rate, voltage, and amperage. Authors generated S/N (signal-noise) ratio response graphs to define the optimal process parameter settings. Additionally, a t-test was applied to examine the effects of noise factors on response variables. Finally, after the overall optimal setting combination for the plasma jet manufacturing process was identified, confirmation runs were conducted and proved derived solutions. Kechagias et al. [22] performed the Taguchi optimization of the circular cuts bevel angle in the plasma jet cutting process of a mild steel plate. They took into consideration seven parameters: the plate thickness, cutting speed, arc ampere, arc voltage, air pressure, pierce height, and torch standoff distance. Authors calculated a S/N ratio for each experimental trial and derived diagrams according to the analysis of means (ANOM) technique. Using these diagrams, the optimum combination of parameter levels was identified. Additionally, interaction effects of the process parameters were discussed according to the generated interaction charts. Finally, ANOVA was conducted to discuss the percentage contribution of each process parameter effect on the analyzed bevel angle cut quality response.
Based on the above literature review, it is visible that there is a space regarding the investigation of the plasma jet cutting process parameter effects on the circular cut quality responses when machining an aluminum alloy. As it is previously mentioned, processing aluminum by thermal manufacturing processes such as plasma can be very demanding and thus it represents a research challenge to determine the process parameter levels that enable close-to-optimum cut quality characteristics. Accordingly, this paper brings a valuable scientific contribution and investigates the influence of the cutting speed, arc current, and cutting height on circular quality responses such as the circular kerf width, circular bevel angle, and circularity error when cutting aluminum alloy 5083. Additionally, this paper presents a novel scientific methodology in solving the multi-response optimization problem, which means a hybrid approach that is a combination of grey relational analysis and the fuzzy logic technique. The grey–fuzzy hybrid approach enhances traditional GRA by integrating fuzzy logic, an artificial intelligence (AI) technique, to more effectively manage uncertainty and imprecise data—particularly prevalent in manufacturing processes. Unlike standalone GRA, which relies on fixed weights and crisp values, the fuzzy component allows for adaptive weighting and linguistic evaluation, thereby improving the robustness and flexibility. Compared to other AI methods, such as artificial neural networks, the grey–fuzzy approach offers greater interpretability and eliminates the need for large data sets or intensive training, making it a more practical and efficient solution for multi-response optimization in complex or non-conventional manufacturing systems. This approach derives optimal solutions of a few analyzed circular quality responses and determines corresponding process parameters levels that result with a close-to-perfect circular cut quality. Finally, here, the derived findings can be successfully implemented in real industrial cases. The methodology framework of this paper is presented in Figure 1.

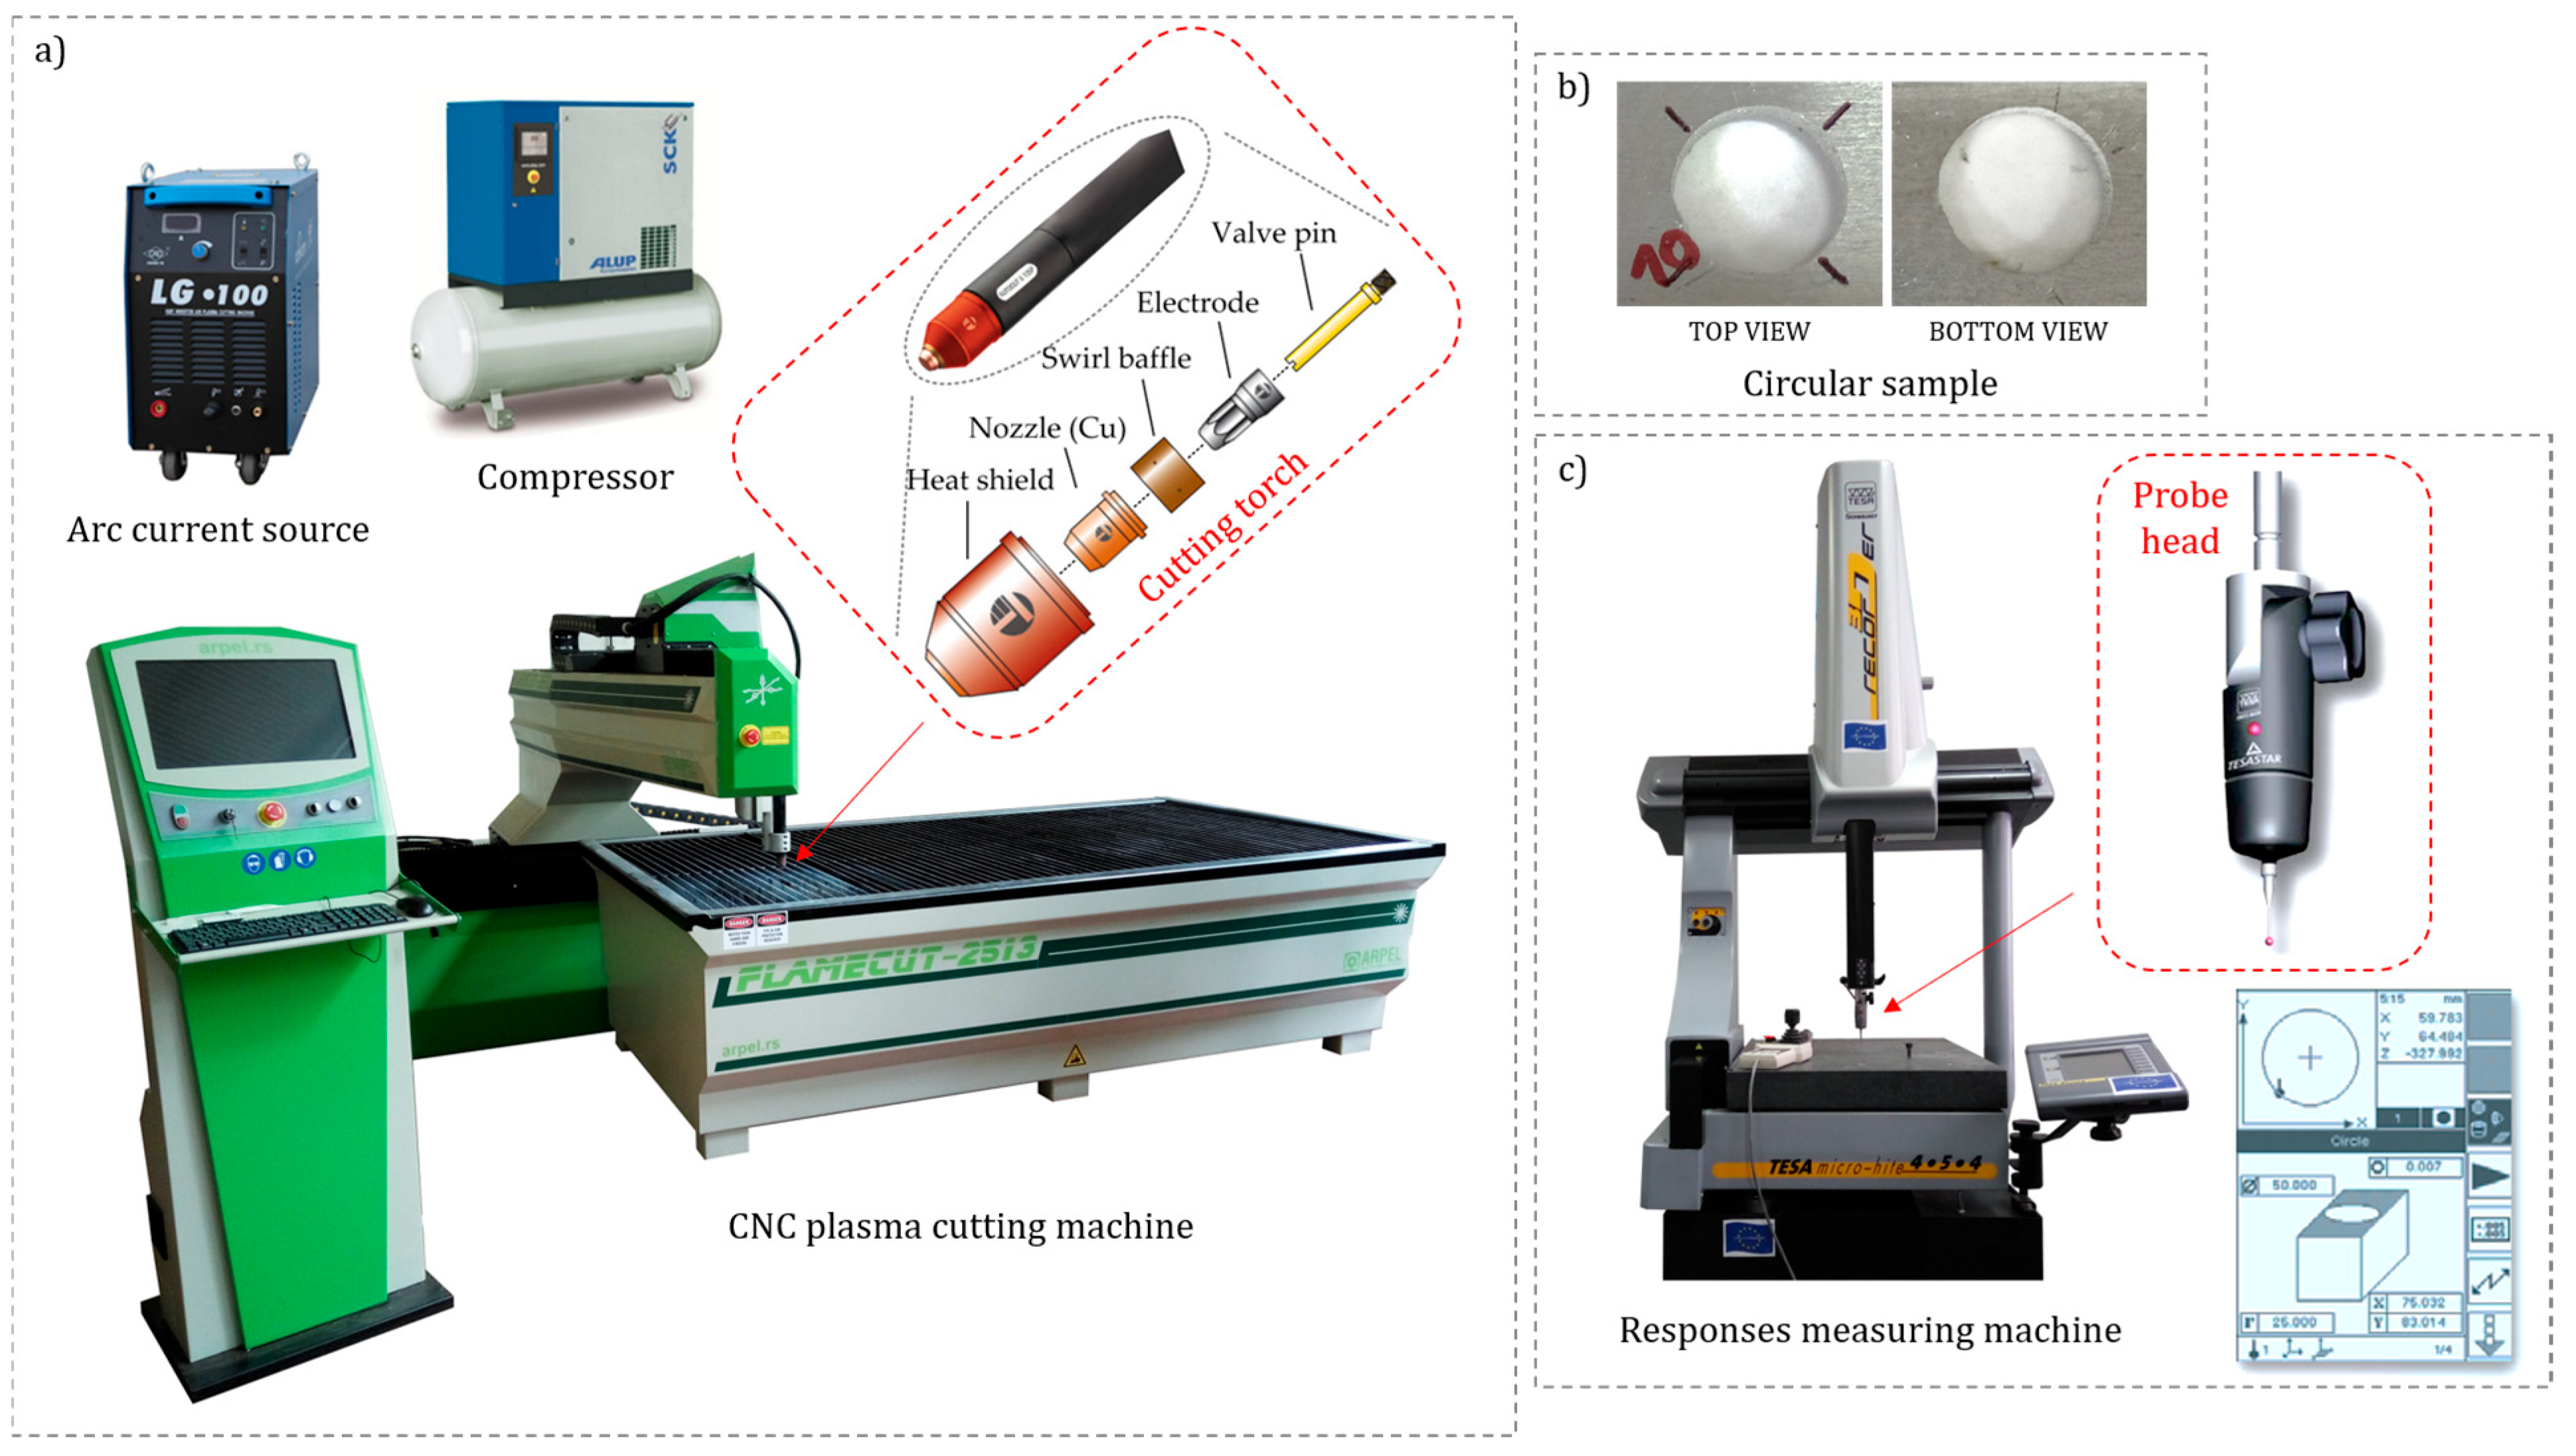
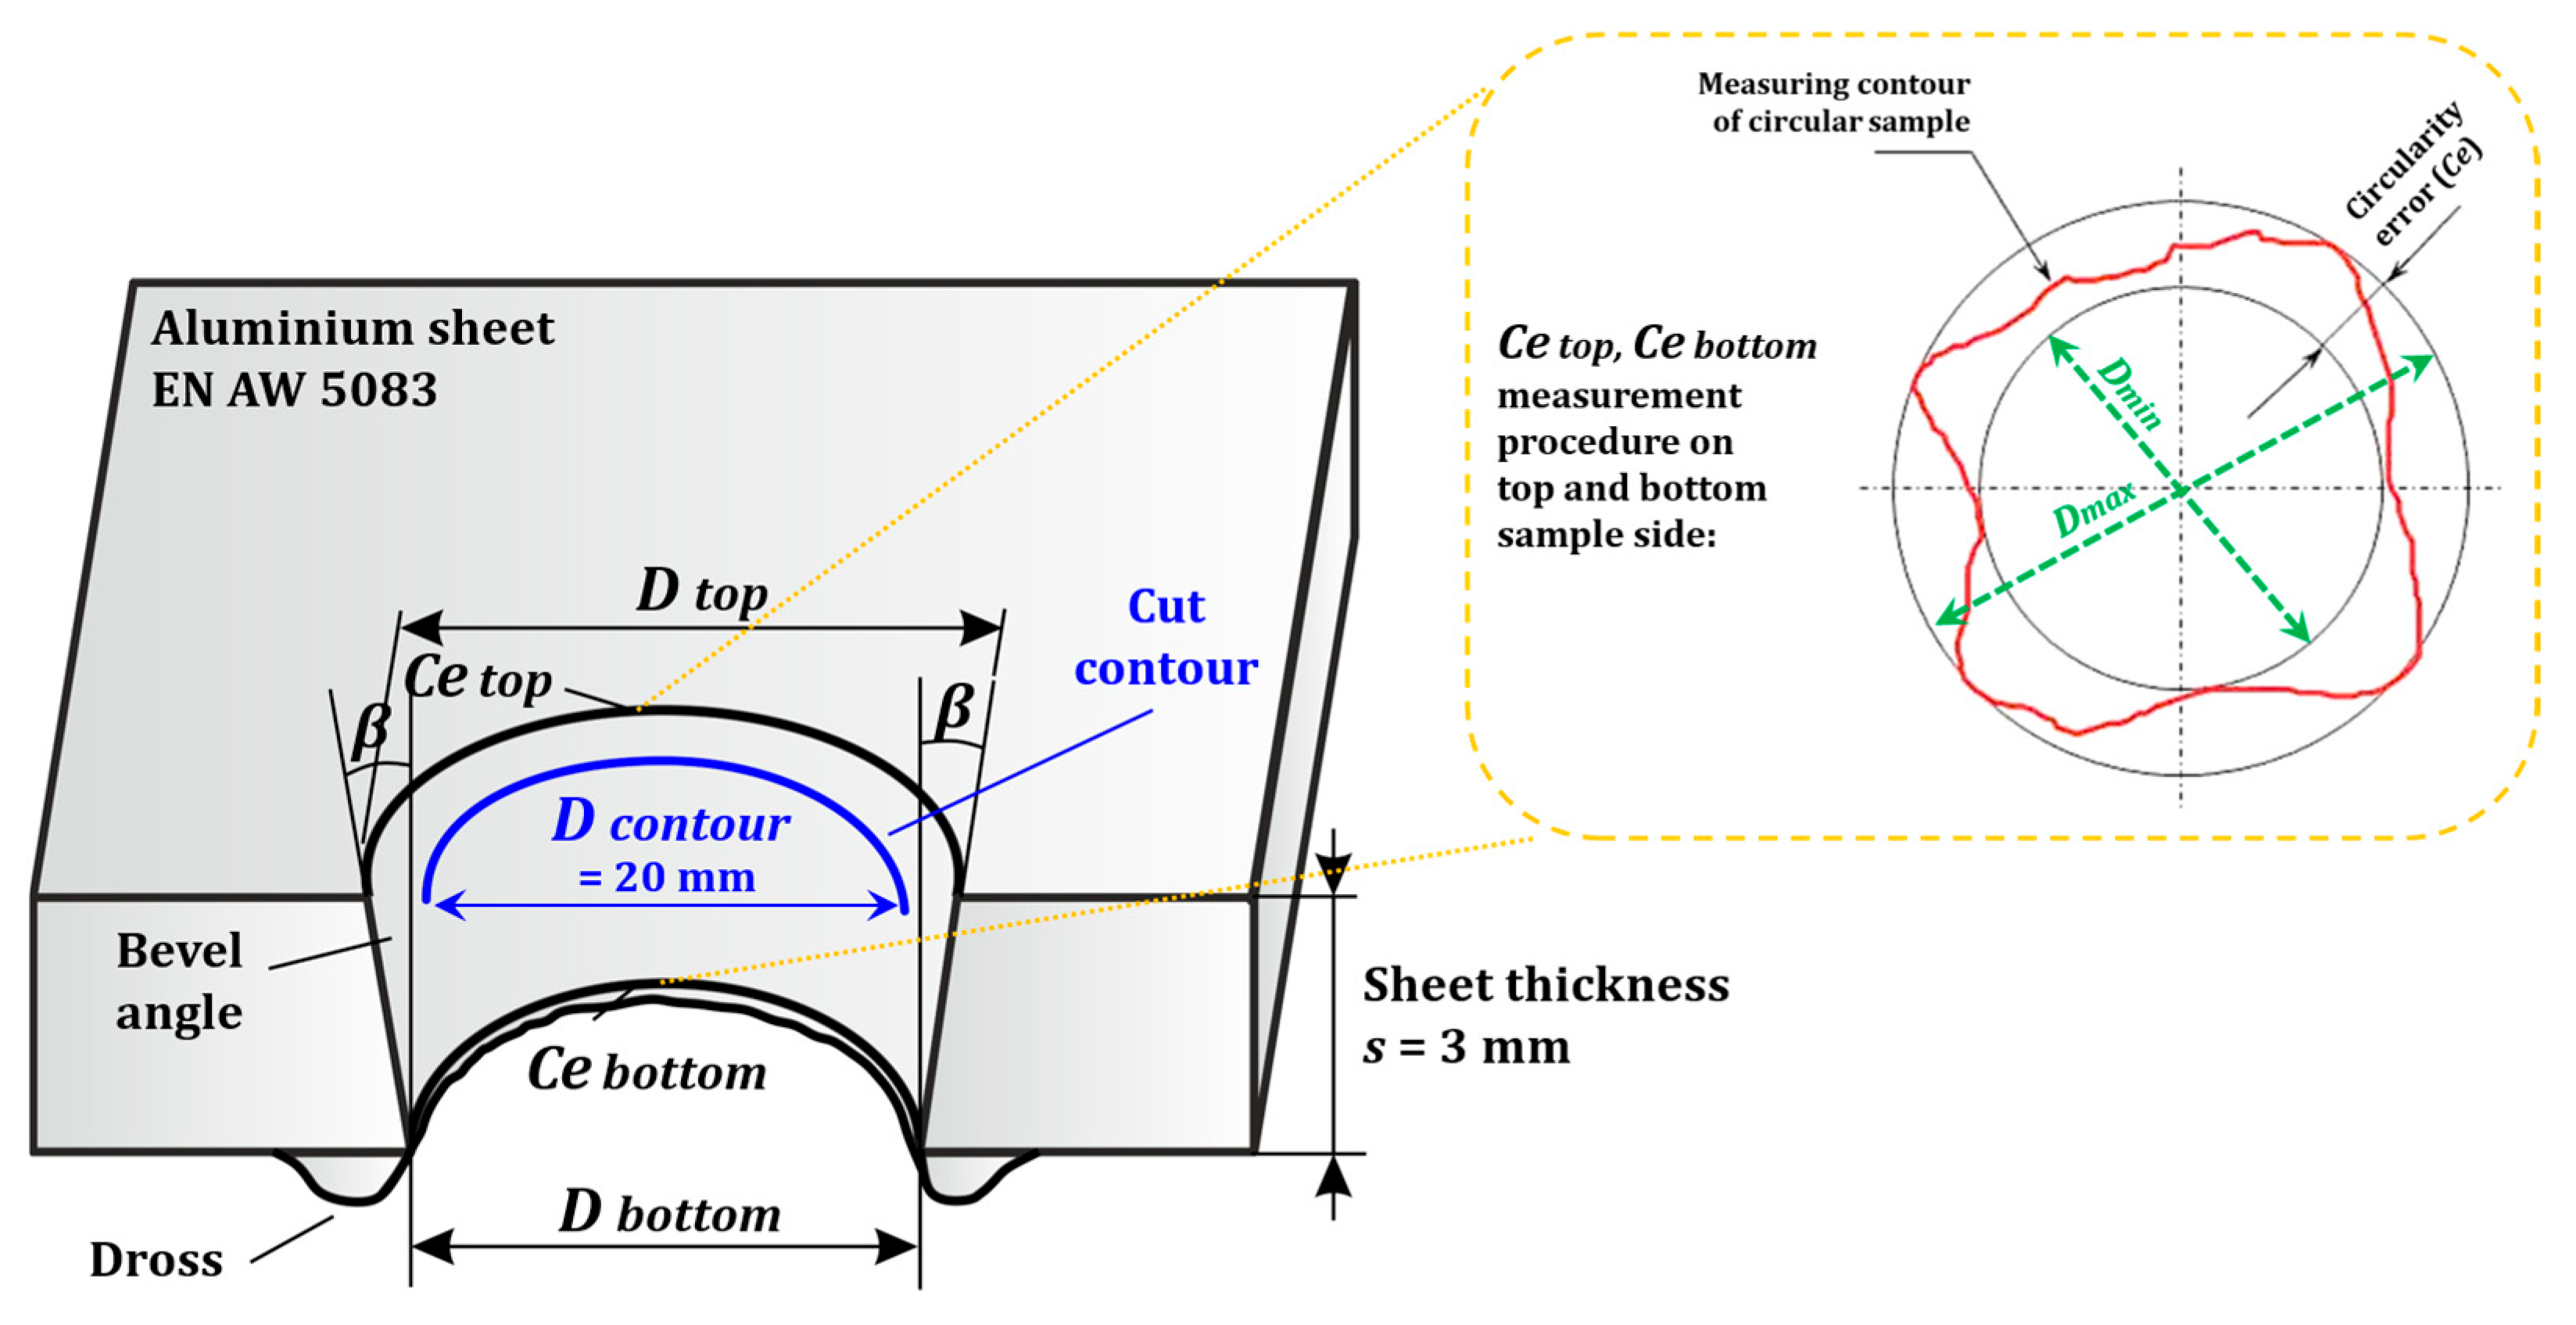
2. Experimental Research

Experimental work in this paper was conducted on CNC machine FlameCut 2513 (Arpel Automation, Belgrade, Serbia). Specifications of CNC plasma machine are stated in Table 1. Compressed air was applied as plasma gas. Compressor SCK5 200 PLUS (ALUP Kompresoren Gmbh, Reutlingen, Germany) integrated with air-purifying and drying system served for preparing compressed air. LG 100 IGBT InverterAir Plasma Cutting Machine (Wenzhou Rstar Welding Equipments Manufacture Co., Ltd., Wenzhou, China) was chosen as plasma arc current source. Figure 2a presents CNC plasma cutting machine together with arc current source, compressor, and cutting torch assembly. Aluminum alloy EN AW-5083 was defined as workpiece material. Mechanical composition as well as physical and mechanical properties of this material are presented in Table 2. Due to magnesium presence, this aluminum alloy was characterized by high weldability and corrosion resistance. Due to such properties, it is very widely applied in shipbuilding industry, marine applications, and automotive, transport, and aircraft industry [23]. As is already mentioned, plasma jet manufacturing process of aluminum leaves some concerns regarding its sensitivity to heat input and workpiece heat-affected zone. However, authors conducted investigation regarding influence of variable process parameters of plasma jet cutting process on heat-affected zone and material structure [24]. They found out that because aluminum alloy 5083 is non-heat-treatable alloy, significant structural changes in workpiece heat-affected zone did not appear. Thus, this aluminum alloy is very convenient for plasma jet processing. Workpiece sheet thickness that will be cut through in experimental trials is 3 mm. Experimental plan was defined according to Taguchi L27 orthogonal array with three variable process parameters: cutting speed v (mm/min), arc current I (A), and cutting height H (mm), as presented in Table 3. Process parameters that were kept constant are outlet nozzle diameter, 1.2 mm, and plasma gas (compressed air) pressure, 6 bar. Process parameters levels and ranges were defined according to preliminary experimental trials, manual instructions, and industrial experts’ consultations. In each experimental trial, three same circular cuts were produced. Plasma jet circular cutting was performed along a contour with a diameter of 20 mm. Example of top and bottom view of produced circular sample is shown in Figure 2b.
Circular cut quality responses that were analyzed in this paper are circular kerf width Ckw (mm), circular bevel angle β (°), circularity error—top Ce top (mm), and circularity error—bottom Ce bottom (mm). Circular kerf width responses were obtained according to Equation (1). Diameter values at top and bottom side of circular cuts were measured by TESA Micro Hite 3D 454 measuring machine (Tesa Technology, Norderstedt, Germany), Figure 2c. Diameter measurements of the produced circular cuts were performed along the circular edge at five equally spaced points on both the top and bottom sample sides. Mean of these five measurements was taken as diameter top D top (mm) and, respectively, diameter bottom D bottom (mm) value, while maximum and minimum values of these five measurements were taken as diameter maximum Dmax (mm) and, respectively, diameter minimum Dmin (mm) values. Consequently, such derived diameter values, with already known values of cutting contour diameter D contour (mm) and sheet thickness s (mm), served for calculating all mentioned circular cut quality responses according to Equations (1)–(4). Visual representation of all analyzed process responses is given in Figure 3.
C k w   m m = D   t o p D   c o n t o u r
β   ( ° ) = t a n 1 D   t o p D   b o t t o m 2 · s
C e   t o p   m m = D m a x D m i n 2
C e   b o t t o m   m m = D m a x D m i n 2

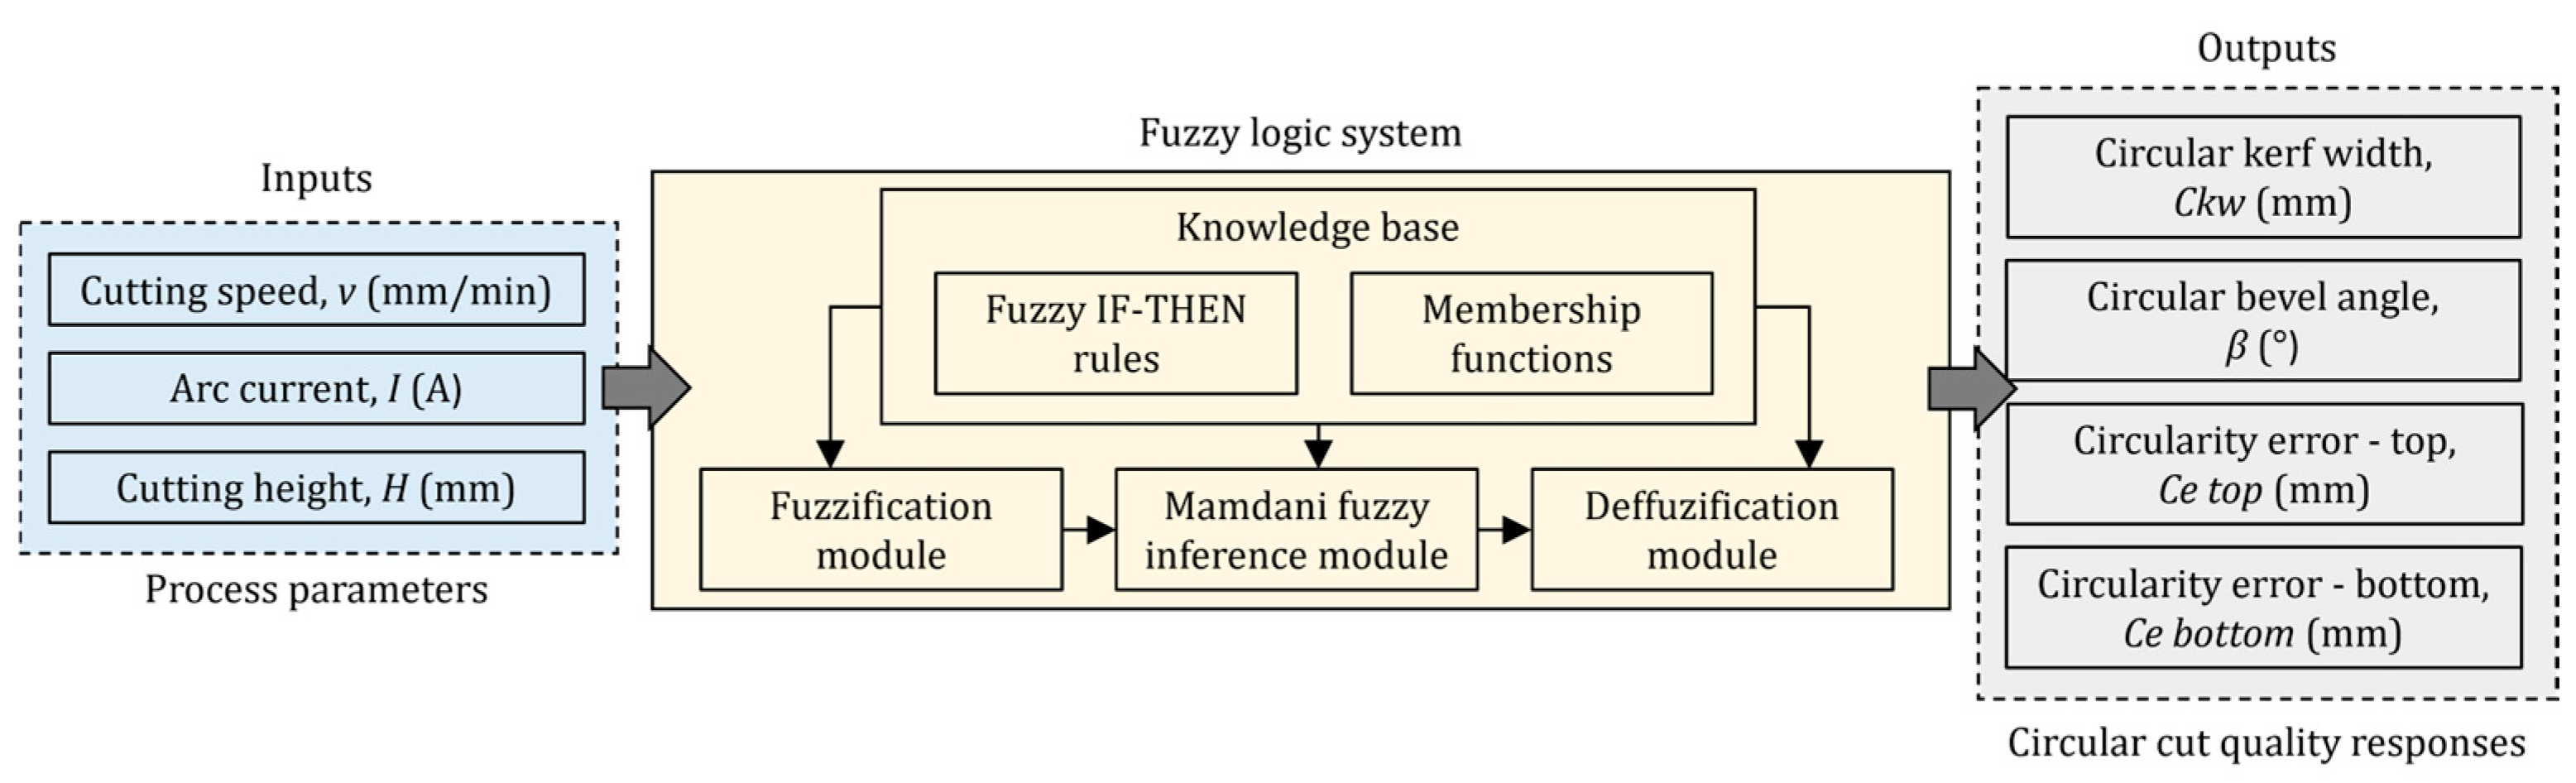
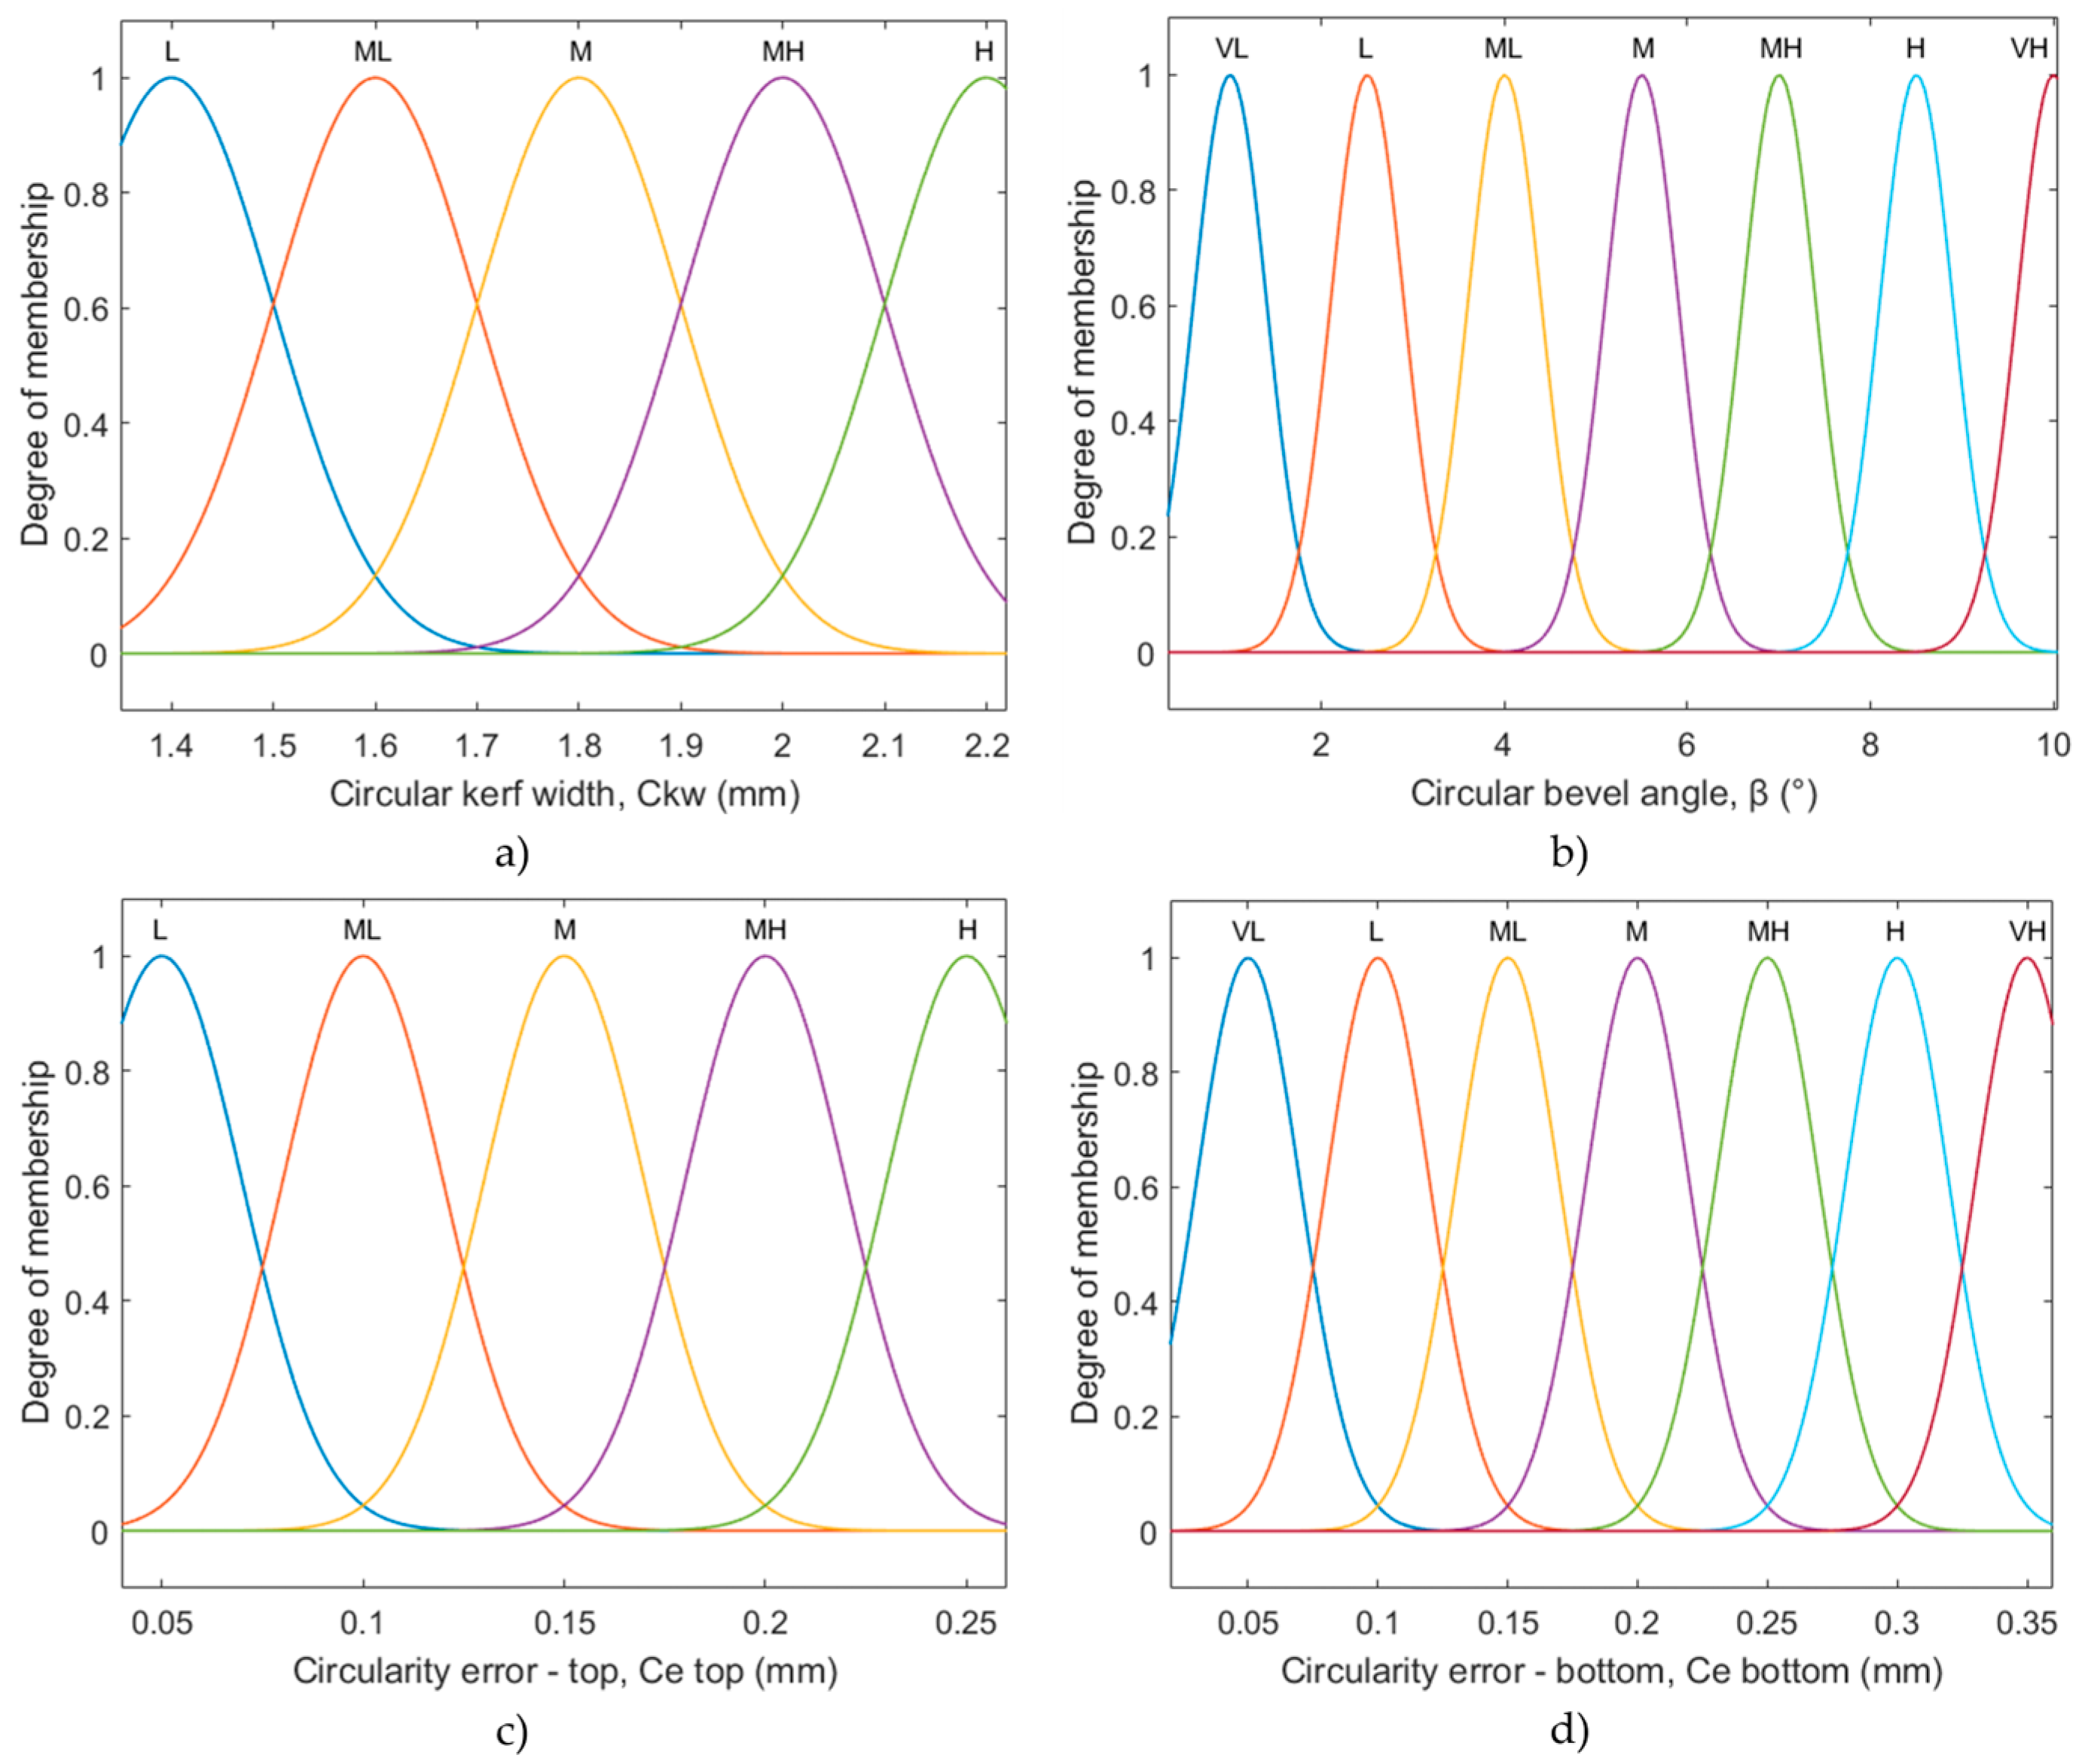
3. Modeling of Circular Quality Responses

In this section, in order to define functional relations between inputs, process parameters that were varied through experimental trials and measured plasma jet circular cut quality responses modeling will be performed by the application of fuzzy logic. Fuzzy logic is a form of artificial intelligence that has proven particularly useful for describing complex manufacturing processes and systems. The plasma jet manufacturing process can be characterized as one of these. Usually, due to ambiguous and imprecise information regarding analyzed responses, it is not possible to implement conventional mathematical modeling approaches such as regression analysis [25]. In these scenarios, fuzzy logic stands out as an effective solution for establishing relations between process inputs and outputs to better understand the process behavior and process parameters effects, as well as to reach optimal solutions regarding desirable response values [15].
Each fuzzy logic system consists of a few elements: a fuzzification module, fuzzy inference module, and defuzzification module. The fuzzification module assigns a fuzzy linguistic value to each input by determining its degree of membership within the range [0, 1]. The degree of membership is defined by membership functions. There are a few membership functions that can be applied in this step, such as: triangular, Gaussian, trapezoidal, sigmoid, linear, generalized bell, etc. The fuzzy inference module uses a knowledge base of fuzzy IF-THEN rules and membership functions to establish relationships between the inputs and outputs. Two of the most famous fuzzy inference modules are Mamdani and Sugeno. Mamdani is applied more usually than Sugeno due to its intuitiveness and ease of use. The fuzzy inference module is in this way in charge for defining fuzzy linguistic values of system outputs. Finally, the defuzzification module reshapes aggregated fuzzy outputs into exact non-fuzzy values. There are also a few defuzzification methods that can be applied in this step. Some of them are centroid, the middle of the maximum, the smallest of the maximum, the largest of the maximum, bisector, etc. [15,26].
In this paper, the Mamdani fuzzy inference system was applied to model the relationship between the inputs–plasma jet cutting process parameters—the cutting speed, arc current, and cutting height—and the outputs–circular cut quality responses—the circular kerf width, circular bevel angle, circularity error—top, and circularity error—bottom. The settings of this system are as followed: method: min or method: max; implication method: min; aggregation method: max; and defuzzification method: centroid. The architecture of the developed fuzzy logic system is presented in Figure 4.
The input and outputs of the fuzzy logic system were described by Gaussian membership functions. For each input, three Gaussian membership functions were defined linguistically as follows: L (low), M (medium), and H (high). Additionally, outputs from the fuzzy logic system were defined by five (the circular kerf width and circularity error—top) and seven (circular bevel angle and circularity error—bottom) Gaussian membership functions linguistically described as: VL (very low), L (low), ML (medium low), M (medium), MH (medium high), H (high), and VH (very high). These defined membership functions for the inputs and outputs are presented in Figure 5 and Figure 6.
In the next step, in order to establish functional relations between such defined fuzzy logic system inputs and outputs, based on the experimental results and preliminary and empirical findings, a set of 27 fuzzy IF-THEN rules was generated. These rules are listed in Table 4. Finally, the defuzzification module from the MATLAB R2023a Fuzzy logic toolbox converted aggregated fuzzy logic outputs data into exactly expressed numerical non-fuzzy values of a circular kerf width, circular bevel angle, circularity error—top, and circularity error—bottom responses. Such predicted responses data were marked by a yellow line in Figure 7a–d.
To evaluate the prediction accuracy of the developed fuzzy logic model for circular cut quality responses in the plasma jet cutting process of aluminum alloy 5083, a comparison was conducted between the experimentally obtained data and the model’s predicted values. For each response comparison data set, the mean absolute percentage error (MAPE) and coefficient of determination (R2) were calculated as prediction validation measures. The comparison results are presented in Figure 7a–d. As it is obvious from Figure 7, the calculated mean absolute percentage errors and coefficients of determination as well as a comparison between blue and yellow lines prove good matching between the experimental and predicted responses data. The obtained results are valid strictly within the boundaries of the defined experimental design and are based on the specific combinations of parameters varied according to the experimental plan. Consequently, the predictive performance and reliability of the model apply primarily to this constrained design space. Expanding the number of parameter combinations and exploring a broader experimental domain would undoubtedly contribute to improving the model’s robustness, reliability, and generalizability, and would allow for a more comprehensive assessment through the inclusion of wider prediction intervals. These results represent the basis for the further analysis of process parameter effects on analyzed responses and for ANOVA.
Generally, ANOVA serves as a good tool to discuss and check the statistical significance of each process parameter as well as parameter interactions on predicted responses. In this case, ANOVA was performed for all analyzed responses and its data are presented in Table 5. When analyzing the process parameters using ANOVA, it is important that the p-value is less than 0.05 because it indicates that the effect of the given parameter is statistically significant, not due to random variation. Accordingly, in this case, it is visible that all three process parameters have the most significant effect on the circular kerf width response. Through analysis of the circular bevel angle, the most significant contribution to the bevel angle variations are the cutting speed, arc current, and interaction of these two parameters. Additionally, the circularity error at the top is predominantly influenced by the cutting speed, arc current, and the interaction between the arc current and cutting height. Finally, only the cutting speed has the highest contribution on the circularity error—bottom response.
After the statistical significance of each process parameter and their interactions were estimated by ANOVA, the next step is to discuss the parameter effects on the analyzed circular cut quality responses. To achieve this, 3D surface plots were generated to illustrate the influence of two variable process parameters on a specific response, while the third parameter was held constant. These plots are presented in Figure 8, Figure 9, Figure 10 and Figure 11.
From Figure 8 and according to the ANOVA results regarding the further discussion of the most significant parameters, it is evident that a higher arc current, lower cutting speed, and greater cutting height lead to an increase in the kerf width. In [27], it was concluded that the plasma jet cutting heat input is proportional to the product of the arc current and arc voltage and inversely proportional to the cutting speed. That means that a higher arc current and lower cutting speed result in the increased removal of the cutting workpiece material and, accordingly, of the larger kerf width. Here is the same situation. Also, regarding the influence of the cutting height parameter on the circular kerf width, as in [27], it was determined that an increase in the cutting height causes a loss of arc coherence, resulting in arc deflection and the formation of a wider kerf; here, the same phenomenon can be also noticed.
Regarding the analysis of the bevel angle response, it is obvious from Figure 9 that higher cutting speeds and lower arc currents lead to the larger bevel angle. A lower arc current combined with a higher cutting speed results in a reduced amount of plasma jet cutting energy. Consequently, these parameter settings lead to a narrower circular kerf width. Due to the conical shape and characteristics of the plasma jet, the kerf width on the bottom side of the workpiece decreases more rapidly than on the top side, ultimately producing a larger bevel angle [28]. A greater bevel angle requires more demanding post-processing in order to achieve the optimal cut quality of the workpiece.
In addition to the analysis of the circular kerf width and bevel angle, two more responses significantly affect the circular cut quality and need for post-processing treatments. These responses are focused on the circularity error on the top and bottom side of the workpiece sheet. When circularity error—top is considered, taking into account the ANOVA results and parameters/interactions significance as well as surface plots from Figure 10, it can be seen that higher cutting speeds result in larger values of the circularity error. The arc current has a dual effect. At the same time, very low and very high arc current values cause an increase in the circularity error, Figure 10a. A high cutting speed brings instability and the dispersion of the plasma jet, and thus its deviation from a regular circular path motion. In this case, very low arc current values (45 A) additionally empower this instability effect of the plasma jet and result in a larger circularity error that is more noticeable at higher cutting speeds. On the other hand, a very high arc current (85 A) results in the more intense removal of the workpiece material, which results in the greater chipping of the cutting edge and the creation of unevenness. This finally brings an increase in the circularity error. At the very high cutting speed (6000 mm/min), this effect is combined with plasma jet instability and deviation that also enlarges the circularity error—top response. Figure 10c represents that at cutting speed 4000 mm/min, a higher cutting height contributes to an increase in the circularity error. This is especially visible at lower arc current values (45 A). As previously mentioned, very high cutting height values result in arc deflection that, as it is obvious, enhances the circularity error.
Regarding the circularity error—bottom, the ANOVA results defined that the cutting speed has the most influential effect on this response in comparison to other parameters and their interactions. From Figure 11 it can be concluded that a higher cutting speed brings a higher circularity error. The reason for this is the same as previously mentioned. A higher cutting speed results in the instability and deviation of the plasma jet and the loss of its shape and form, which is particularly evident at the bottom side of the workpiece sheet, and this, consequently, results in a lower cut quality and more circularity errors.
The analysis and discussion of the results presented in this study are strictly limited to the investigated experimental domain and are based on the structure of the defined experimental design. The reliability of the findings is reinforced by conducting multiple measurements for each response (five replicates), with the mean value adopted as the representative input for subsequent modeling, as outlined in Section 2. Furthermore, the quality and consistency of the analysis are substantiated by the strong predictive performance and robustness of the developed models, as illustrated in Figure 7a–d. The predictive capability of the models will be further demonstrated through validation experiments presented at the end of this study.

4. Multi-Response Optimization

The main objective of this chapter is to carry out a multi-response optimization procedure in order to identify the process parameter values that simultaneously minimize the circular kerf width, bevel angle, and circularity error on both the top and bottom surfaces of the workpiece sheet material. The obtained optimization results and corresponding process parameter values will be identified as those that achieve the highest possible quality of plasma jet circular cuts, thereby minimizing the need for the post-processing procedure. In order to carry this out, a hybrid grey–fuzzy approach was developed and applied. This approach combines grey relational analysis (GRA) and the artificial intelligence fuzzy logic technique. The fuzzy logic technique enhances the application of traditional GRA by incorporating human-like reasoning in the optimization procedure, making it more suitable for solving complex, real problems where uncertainty, vagueness, and subjectivity is quite often present. This novel scientific approach is already successfully utilized in multiple publications for solving optimization problems in manufacturing processes [29,30,31,32,33,34,35].
The GRA method is used to analyze numerical data sets from different responses in order to estimate how closely the experimental results match the ideal values. The degree of similarity between the actual and ideal responses is expressed by grey relational coefficients (GRC). In the case when the experimental and ideal response values are the same, then the GRC equals one. In order to perform multiple-response optimization, GRA converts multiple responses’ GRCs into a single output defined by a grey relational grade (GRG). In this moment, a multi-objective optimization problem was transferred into a single objective optimization problem where the goal is to find an experimental trial that results in the highest value of the GRG. The highest GRG value represents the optimal solution across multiple responses, regardless of whether the objective for a given response is to maximize or minimize its value. Finally, the levels of the process parameters corresponding to the optimal solution can be easily identified.
In order to conduct GRA, several steps must be completed. The first step is the normalization of the analyzed responses in the range of [0, 1] to decrease the variability of their actual experimental values. Depending on whether the objective of a given response is to maximize or minimize it, the appropriate normalization equation should be applied. In this case, the objective is to minimize all the circular cut quality responses: Ckw, β, Ce top, and Ce bottom. Accordingly, normalization was performed following Equation (5).
X i k = m a x   X i 0 k X i 0 k m a x   X i 0 k m i n   X i 0 k
where X i 0 k is the original sequence, X i ( k ) is the sequence after data pre-processing (normalization), m a x   X i 0 k is the largest value in X i 0 k , and m i n   X i 0 k is the smallest value in X i 0 k .
The second step in the GRA optimization process is calculating the GRC. The GRC for each response can be calculated following Equation (6).
ξ i ( k ) = Δ m i n + ξ   Δ m a x Δ 0 i ( k ) + ξ   Δ m a x
Δ 0 i ( k ) , Δ m i n and Δ m a x are calculated using Equations (7)–(9).
Δ 0 i ( k ) = X 0 k X i k
Δ m a x = m a x m a x X 0 k X i k
Δ m i n = m i n m i n X 0 k X i k
where ζ is the distinguishing coefficient in the range of [0, 1] (in general, ζ = 0.5 ), Δ 0 i ( k ) is the deviation sequence for the reference sequence, X 0 k is the reference sequence ( X 0 k = 1 ,   k = 1,2 n ,   n is number of responses), and X i k is the specific comparison sequence.
In the third step, the GRG is calculated following Equation (10). This Equation can be applied only in cases only when the importance weight of each response is equal.
G R G = 1 n k = 1 n ξ i ( k )
where n is number of responses.
The normalization results, as well as the calculated GRCs for all analyzed circular cut quality responses, and finally, the GRG values are presented in Table 6.
In the next subsection, the fuzzy logic technique will be joined to GRA in solving this multi-objective optimization task. As it is already mentioned, the main benefit of the application of fuzzy logic lies in its ability to effectively manage uncertainty, imprecision, and vagueness within the data, making all of the procedure more robust and better adjusted for complex optimization problems, especially in engineering and manufacturing. In GRA, uncertainty hidden within response GRCs as well as the GRG can be successfully overcome by incorporating the fuzzy logic technique in this multi-objective optimization procedure [33,34,35].
The main parts of each fuzzy logic system were already described in the previous section. The main difference between the fuzzy logic system developed for modeling cut quality responses in the previous section and this one implemented in GRA is within the defined inputs and output. In this case, the GRCs of the responses were selected as the inputs, while the GRG was defined as the output of the fuzzy logic system. The final output after the fuzzy reasoning process is expressed as the grey–fuzzy reasoning grade (GFRG). For fuzzy reasoning, the Mamdani fuzzy inference system was applied with the settings as follows: method: min or method: max; implication method: min; aggregation method: max; and defuzzification method: centroid. The architecture of the developed fuzzy logic system for implementation in GRA is presented in Figure 12.
The inputs and output of the fuzzy logic system were described by Gaussian membership functions. For each input, five Gaussian membership functions were defined as follows: VL (very low), L (low), M (medium), H (high), and VH (very high). Additionally, nine Gaussian membership functions were assigned to the output. These functions are EL (extremely low), VL (very low), L (low), ML (medium low), M (medium), MH (medium high), H (high), VH (very high), and EH (extremely high). The inputs and output membership functions are presented in Figure 13.
With the aim of defining the functional dependencies between the inputs and the outputs using the experimental results and previous experience, a set of 27 fuzzy IF-THEN rules was generated. A graphical representation of these rules is shown in Figure 14. First, four yellow columns define the fuzzy logic system inputs: the GRCs of the circular kerf width, circular bevel angle, circularity error—top, and circularity error—bottom, while the fourth blue one defuzzified the output: the GFRG. The settings of the fuzzy logic system inputs were designated to present the highest value of the GFRG output. The fuzzy logic reasoning process and calculation of the GFRG values were performed, as before in MATLAB R2023a Fuzzy logic toolbox. The defuzzified exact values of the GFRG are presented in Figure 15. The dark green columns represent the experimental trials (fourth, fifth, and ninth) with the three highest GFRG values. These solutions lie on the Pareto front, representing a set of compromise solutions for the simultaneous optimization of multiple objective functions: (Ckw) min, (β) min, (Ce top) min, and (Ce bottom) min. The highest GFRG value was achieved in the fifth experiment. The corresponding input process parameter levels are v = 2000 mm/min, I = 65 A, and H = 1.5 mm. This result corresponds to the GRG rank presented in Table 6’s last column.
In order to validate THE prediction accuracy of the developed fuzzy logic model, a comparison between the calculated GRG and predicted GFRG values was performed. The coefficient of determination (R2) and mean absolute percentage error (MAPE) were applied as validation measures. The comparison results are presented in Figure 16. The obtained R2 value of 0.9089 and MAPE of 5.68% indicate a strong agreement between the calculated GRG and predicted GFRG values, further confirming the accuracy of the developed fuzzy logic model.
In the next step, after the prediction accuracy of the developed model was verified, it was additionally applied to generate 3D surface plots. These plots offer a significant advantage by simplifying the evaluation and interpretation of the results and by enabling a clearer analysis of how the input variables affect the predicted output. Figure 17 shows the 3D surface plots of the GFRG, illustrating its variation based on the interaction of two circular cut quality response GRCs, while the remaining two GRCs are held constant at specific levels. The input settings were chosen to highlight the regions (red color) on the plots corresponding to the highest predicted GFRG values.
Finally, in order to discuss the influence of the plasma jet cutting process parameters, the cutting speed, arc current, and cutting height on the GFRG, and to determine the optimal process regions, the same Mamdani fuzzy inference system was applied. The inputs and output of this system were also described by Gaussian membership functions. These functions were already presented in Figure 5 and Figure 13b. The graphical representation of a developed set of 27 fuzzy IF-THEN rules is shown in Figure 18. The settings of the process parameters levels were chosen to define the highest value of the GFRG. Figure 19 reveals the comparison results between the calculated GRG and fuzzy-logic-predicted GFRG values. These results and calculated validation measures (R2: 0.838, MAPE: 5.97) confirm the prediction accuracy of this GFRG fuzzy logic model.
In order to analyze more precisely the influences of individual process parameters on the GFRG output, the main effects plots were created, Figure 20. These plots were generated based on the average fuzzy-logic-predicted GFRG values and serve to enhance the determination of the optimal process conditions and the identification of the most significant process parameters. The steep slope of the cutting speed’s blue line from Figure 20 reveals that this parameter has the highest influence on the GFRG while the other two parameters are less significant. The blue line points from this plot, that has the highest mean value, define the optimal process parameter levels. This corresponds to the next process parameter settings: v: 2000 mm/min, I: 65 A, H: 1.5 mm. Table 7 confirms these findings. The bold numbers in this table define the highest mean GFRG values for each parameter and, consequently, their optimal operating levels. The last column in Table 7 determines the significance rank of all parameters based on the range between the highest and lowest mean GFRG value. According to that, it can be concluded that the cutting speed has the highest significance for the GFRG, followed by the cutting height and, finally, the arc current. This is affirmed also by the ANOVA results, Table 8. ANOVA was performed with a confidence level of 95%. From the last column, it is visible that the p-value of the cutting speed is lower than 0.05, which confirms the previous conclusion that it has the greatest influence on the GFRG.
In order to determine the Pareto front of optimal solutions and to discuss the process parameter interactions’ effects on the GFRG values, 3D surface plots were constructed, Figure 21. In these plots, two parameters were varied while the third one was kept constant on a certain level. In Figure 21, the dark red color marks the areas with the highest GFRG values. These areas correspond to the most desirable solutions for the simultaneous optimization of all objectives, the circular quality response functions: (Ckw) min, (β) min, (Ce top) min, and (Ce bottom) min. These multi-objective optimization solutions correspond to the next plasma jet cutting process conditions: v = 2000 mm/min, I = 65 A, H = 1–1.5 mm/v = 2000 mm/min, I = 85 A, H = 2 mm.
Finally, the validation experimental test was performed to verify the prediction capabilities of the developed fuzzy logic models and to check their generalization ability. The process conditions for this additional test were chosen according to the parameters levels that correspond to the multi-objective optimization solutions. Accordingly, three additional experimental trials were conducted and the analyzed cut quality characteristics were measured. First, the prediction capability of the fuzzy logic model for the cut quality responses was tested, followed by the evaluation of the fuzzy logic model used to estimate the GFRG values. As a validation measure, MAPE was applied. The validation test results are presented in Table 9. The calculated MAPE values indicate that the previously described development process of the fuzzy logic models was successfully carried out and that they possess a very good prediction capability.

5. Conclusions

Based on the conducted research regarding the modeling and optimization of circular cut quality performances in the plasma jet processing of aluminum alloy 5083, the next findings can be derived:
-
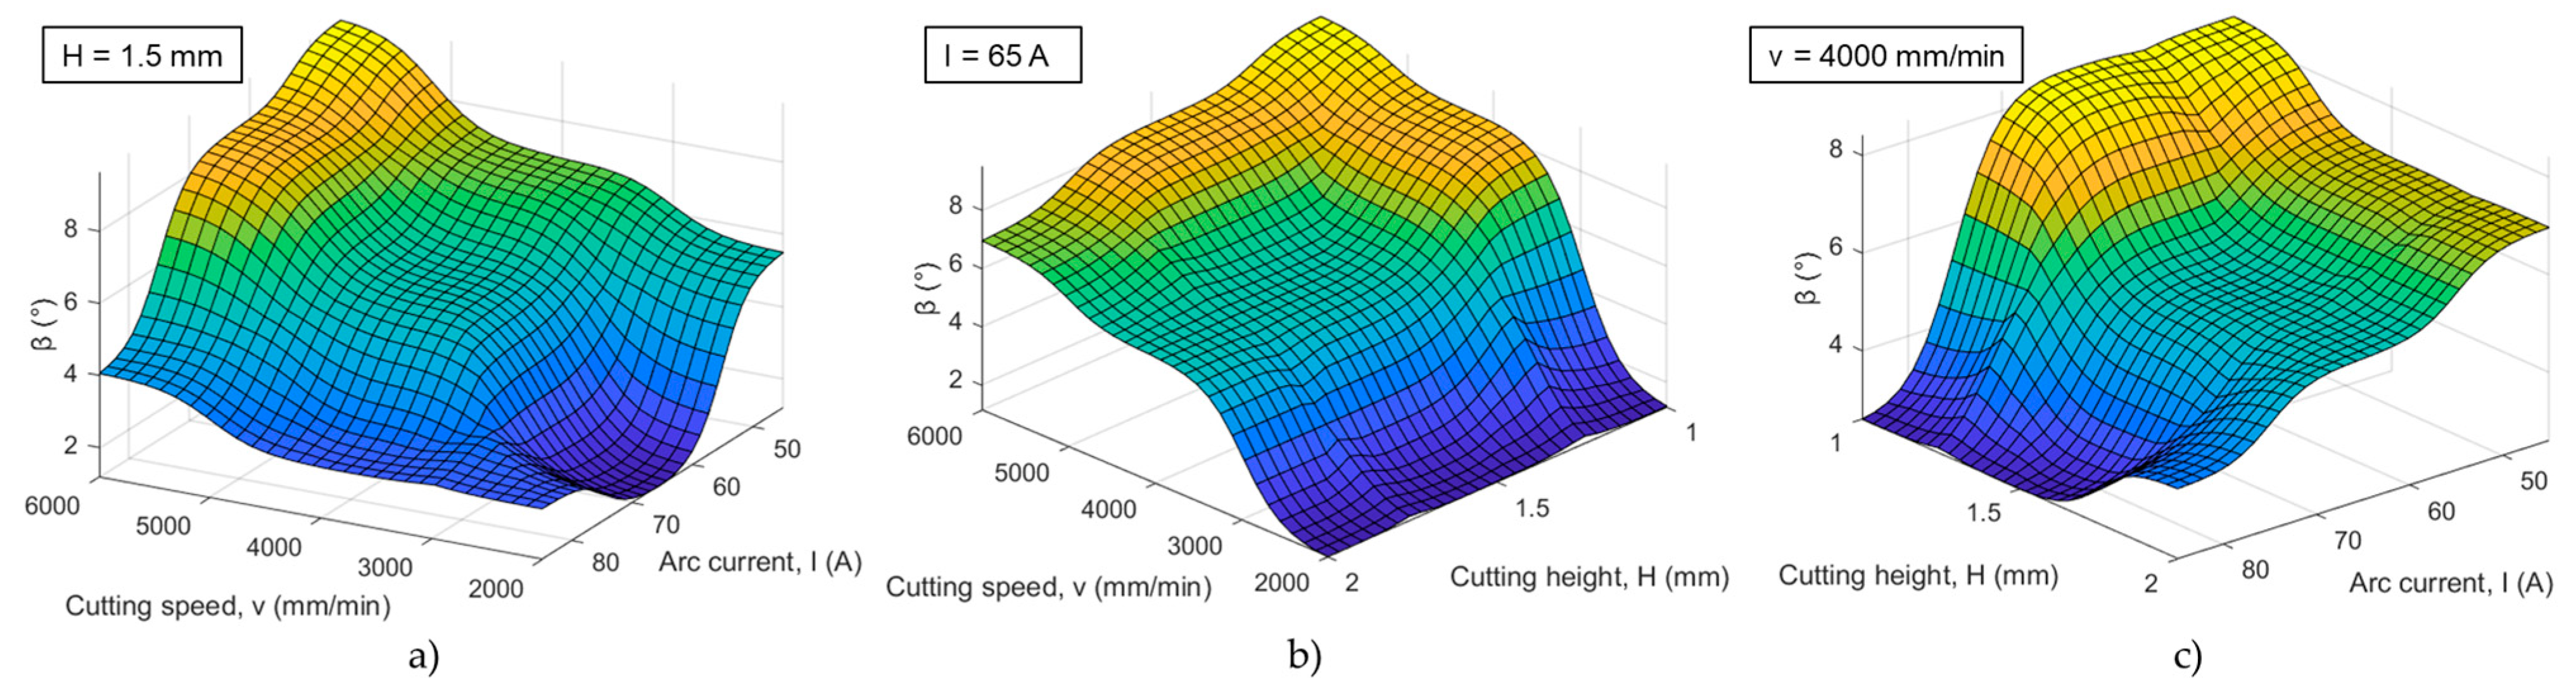
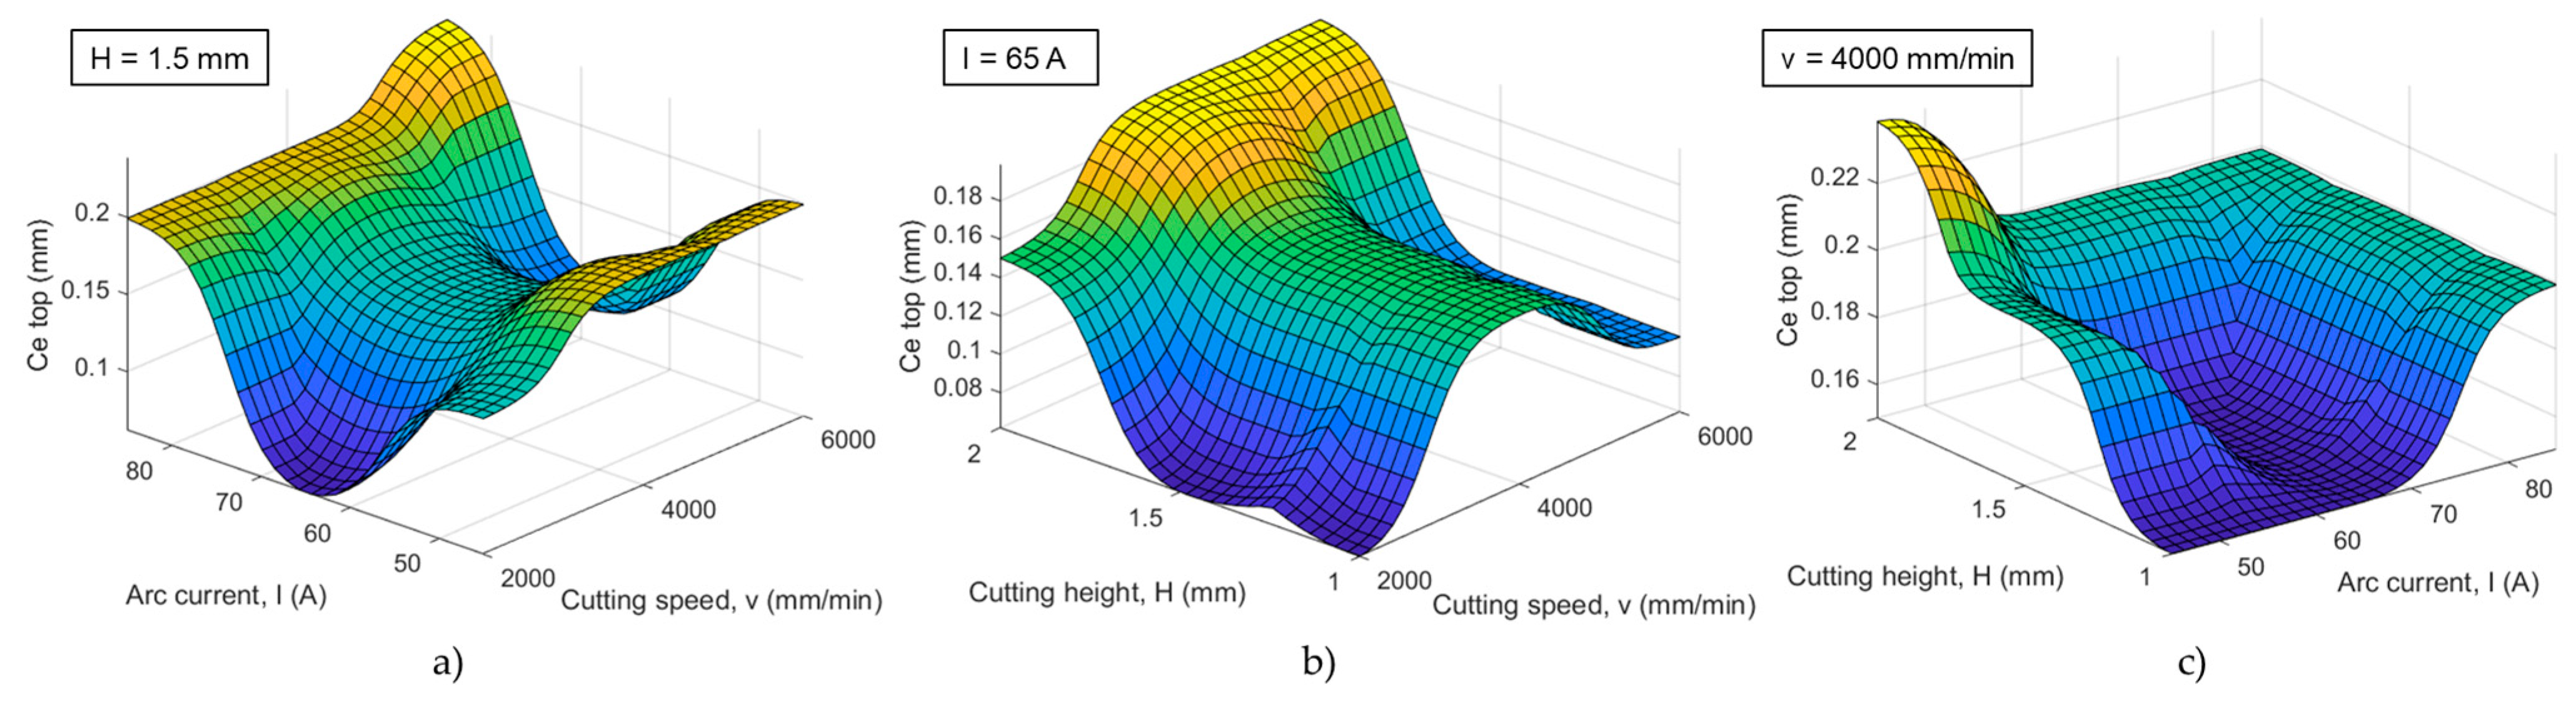
Experimental investigations according to the Taguchi L27 orthogonal array served as a solid foundation for examining the impact of the cutting speed, arc current, and cutting height on the circular cut quality responses: the circular kerf width, circular bevel angle, circularity error—top, and circularity error—bottom.
-
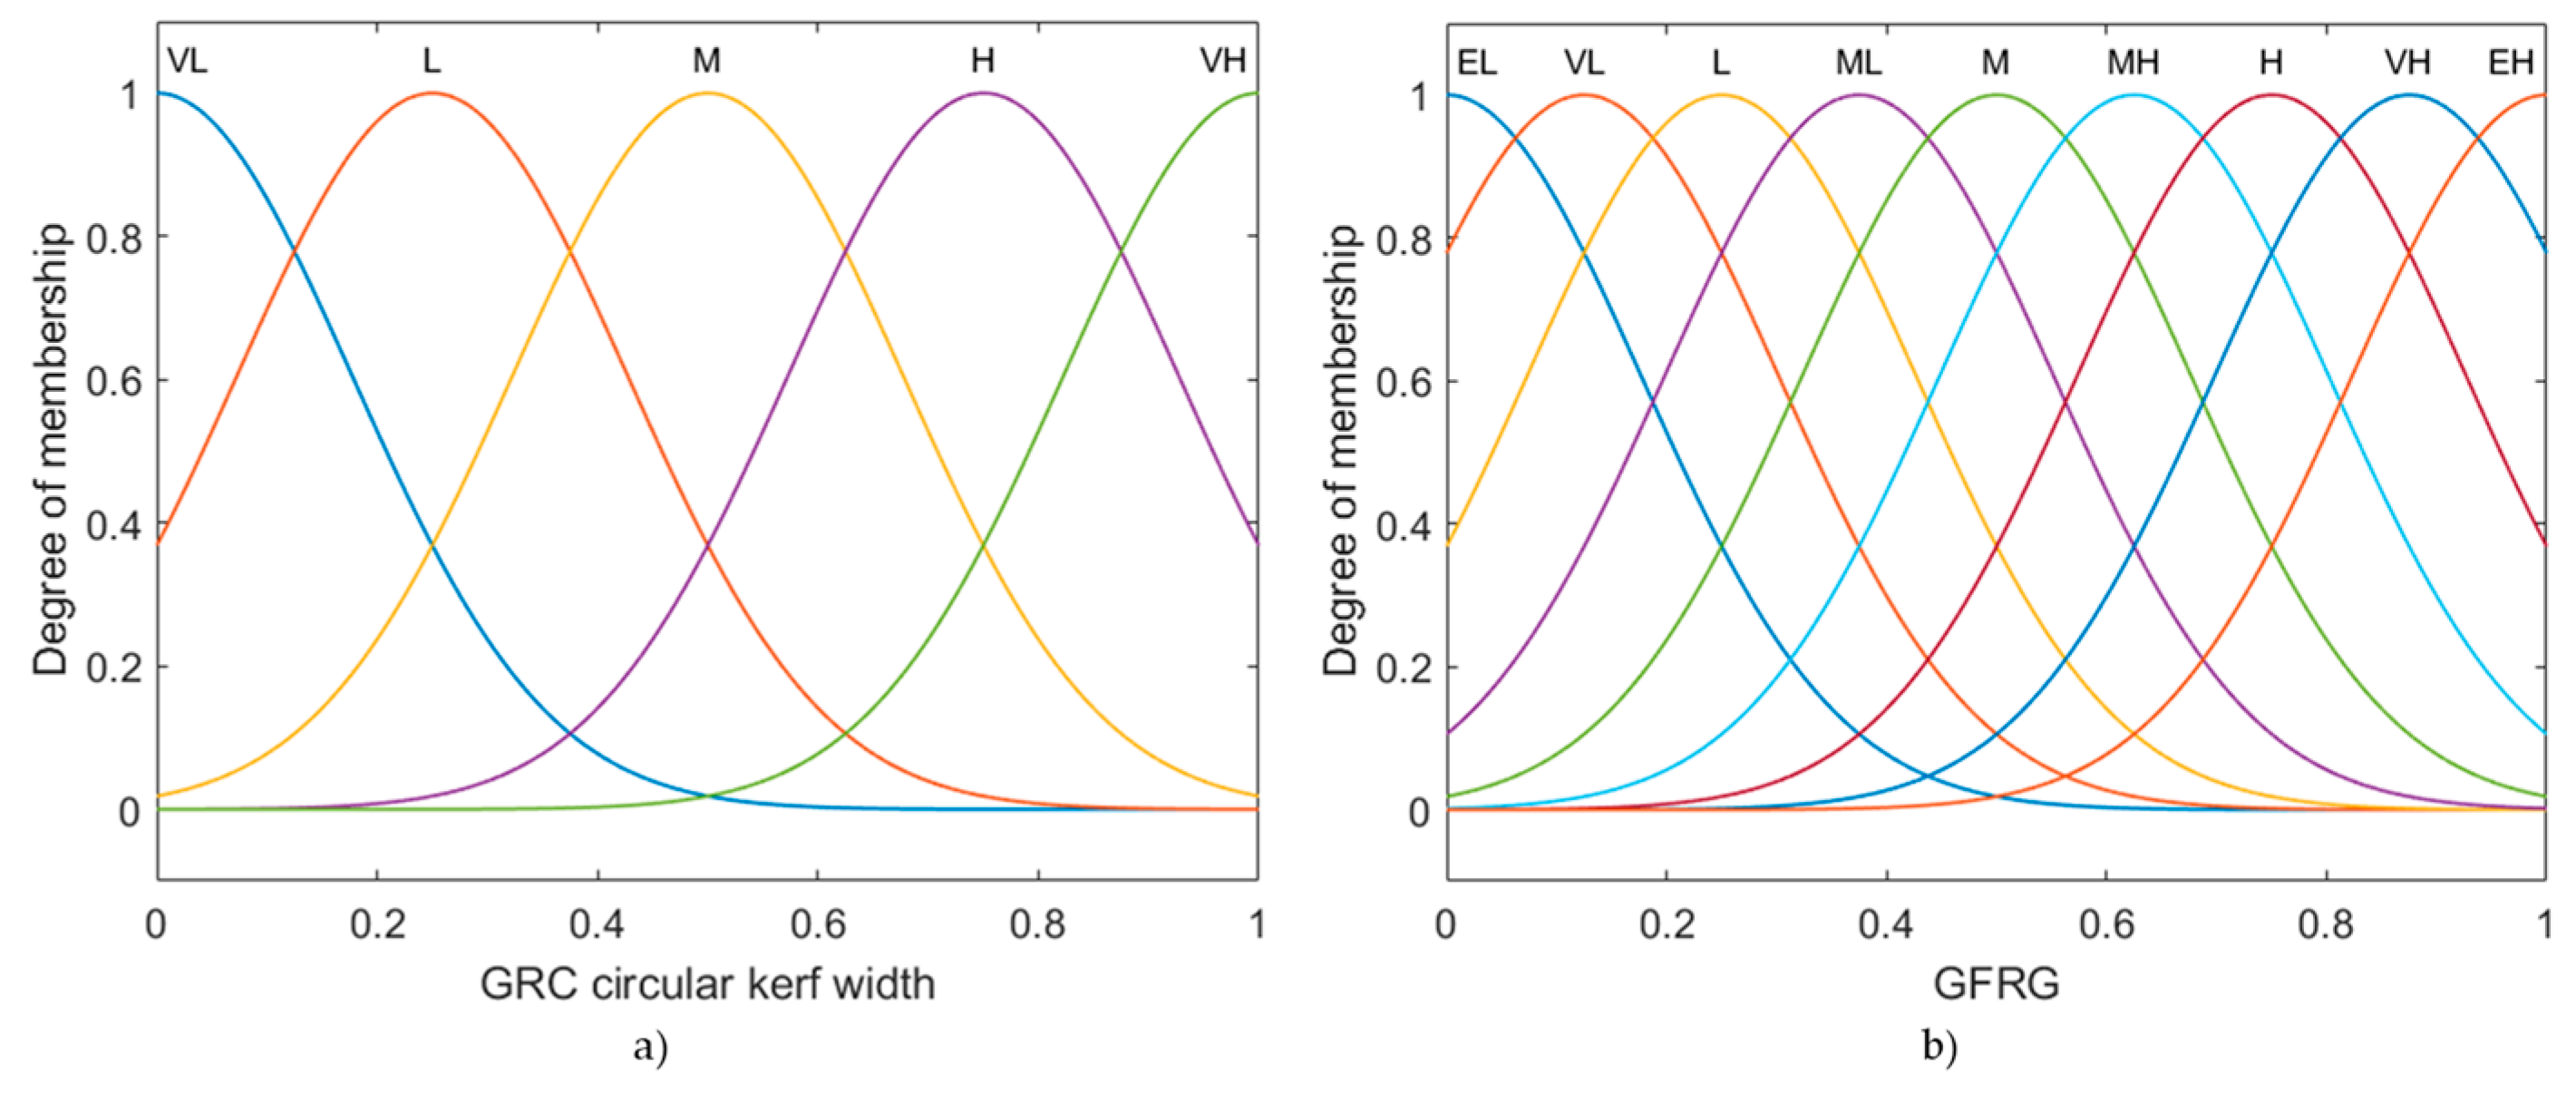
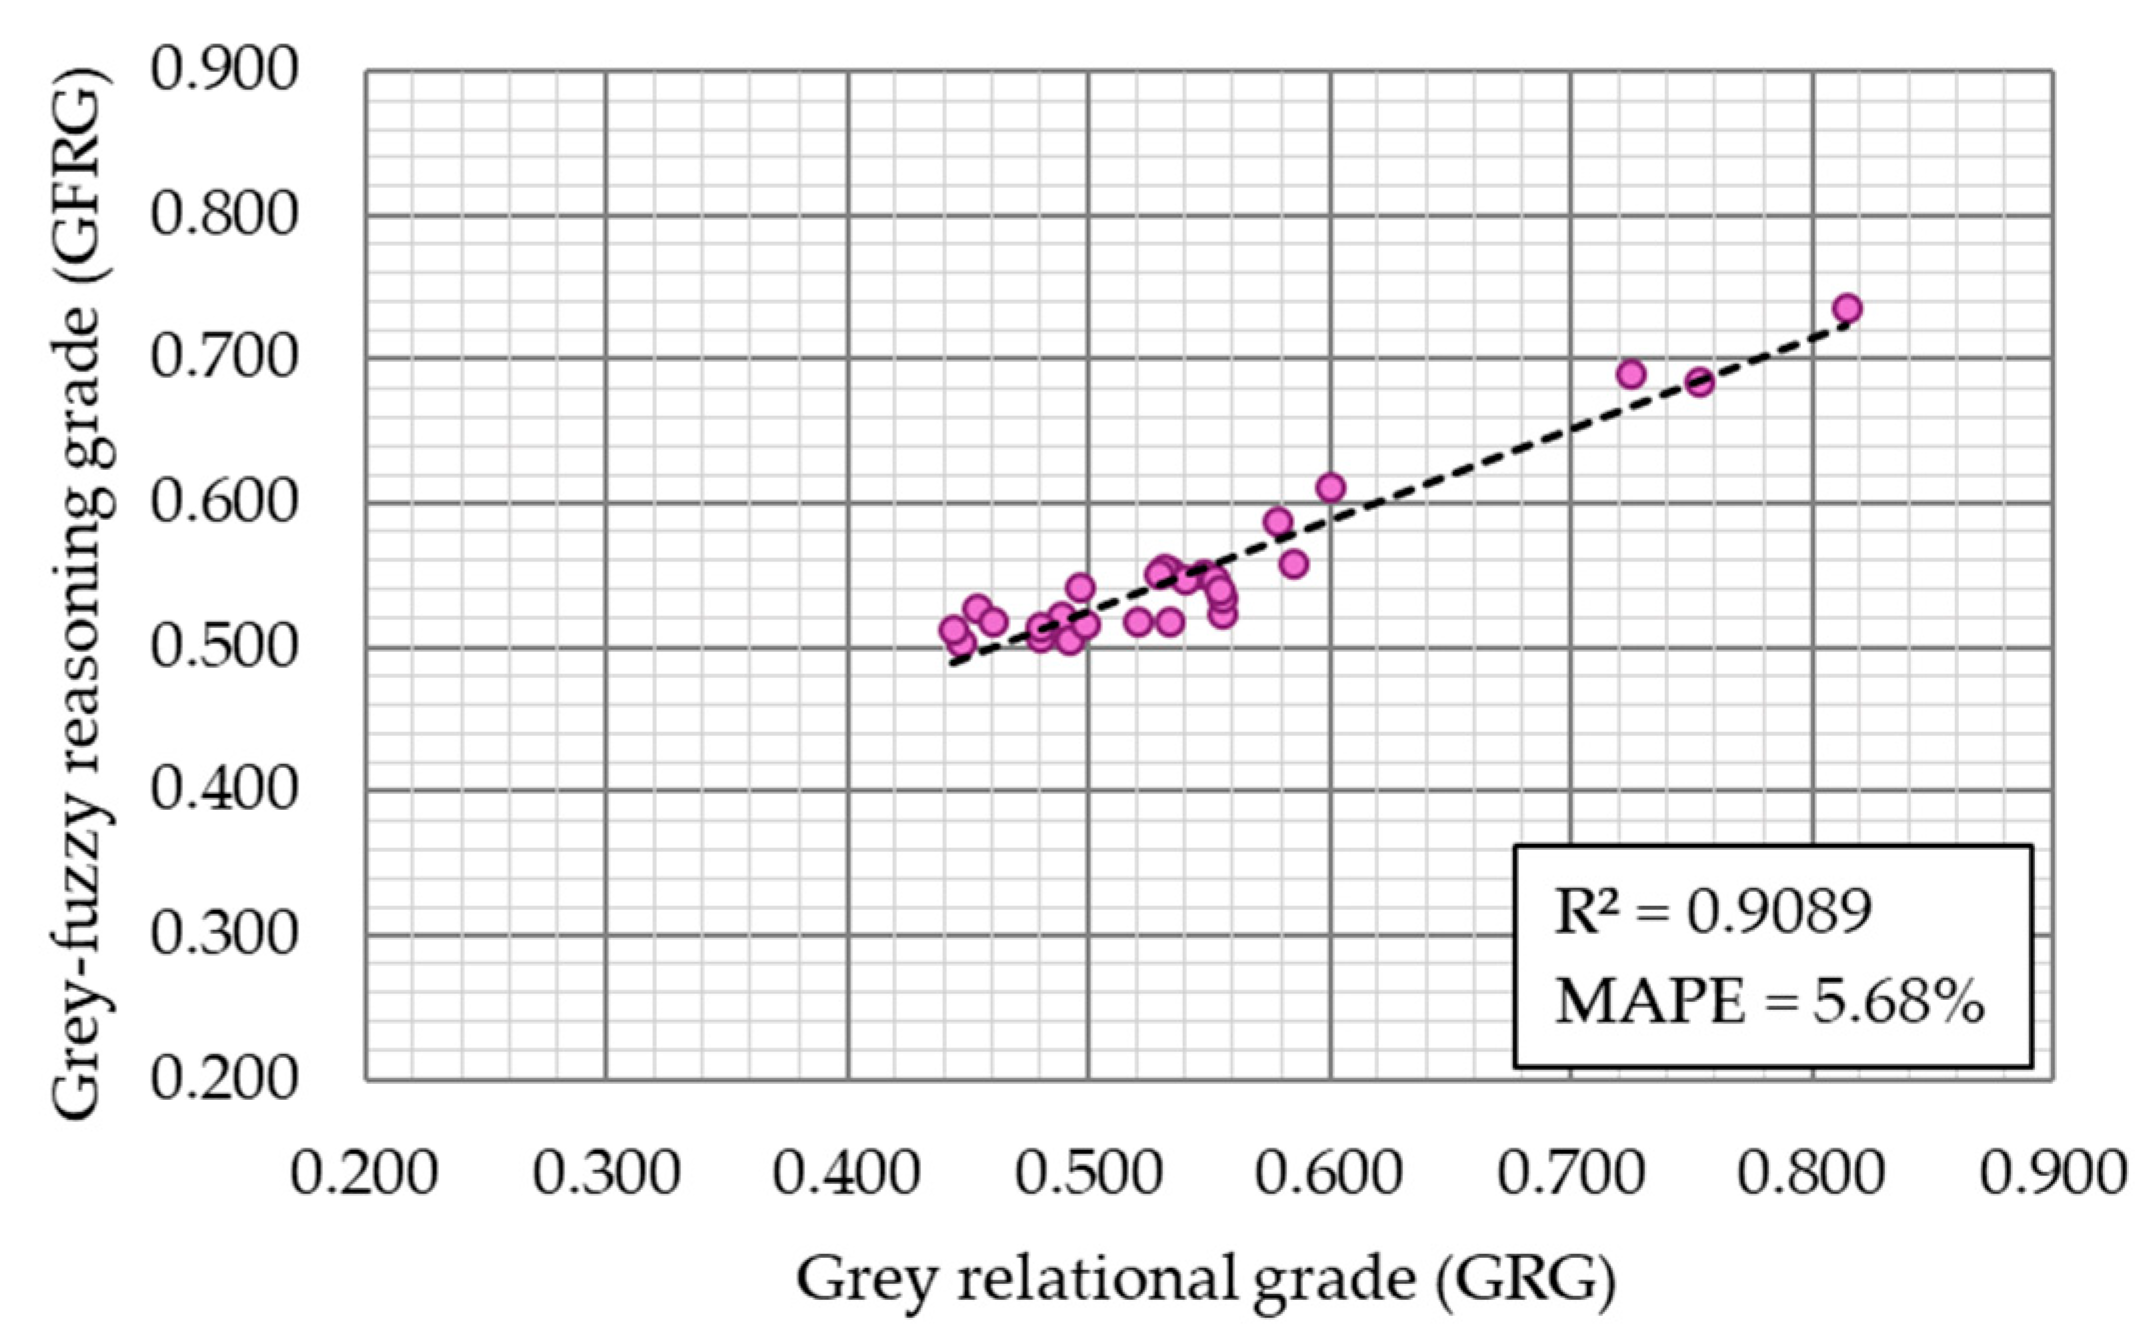
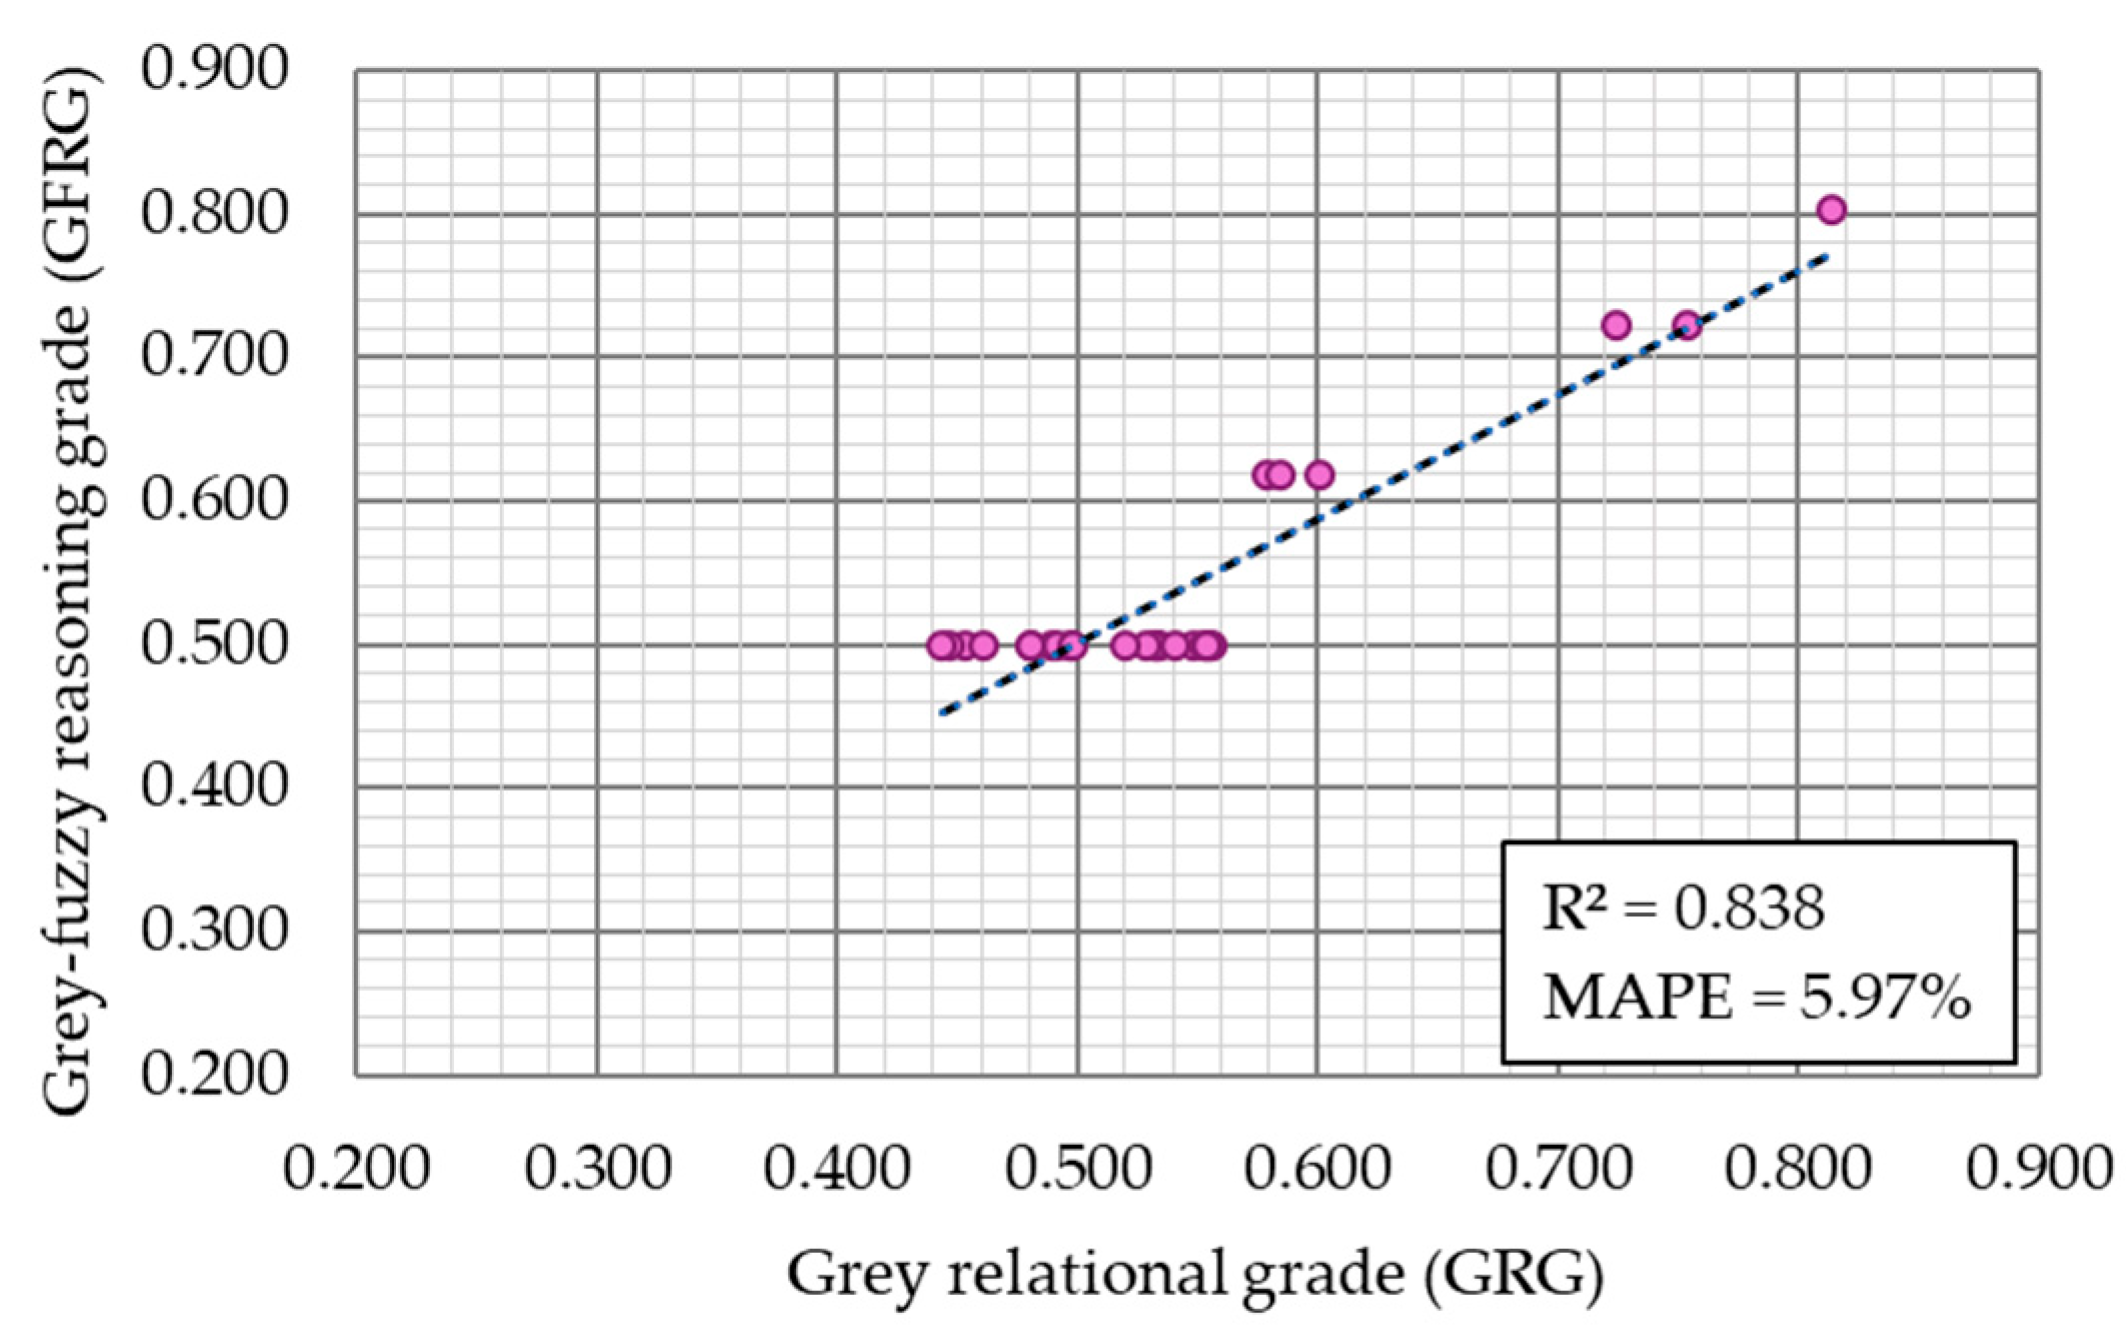
Artificial intelligence fuzzy logic technique combined with ANOVA proved as a good tool to define functional relations between process parameters and analyzed responses, as well as to discuss the effects of the parameters and their interactions with response variations. This confirmed high values of validation metrics such as the coefficient of determination and the mean absolute percentage error between the experimental and predicted response values. In this case, one of the confirmed benefits of the fuzzy logic technique is its ability to model complex manufacturing processes, such as plasma jet cutting, where imprecise and vague data sets are possible.
-
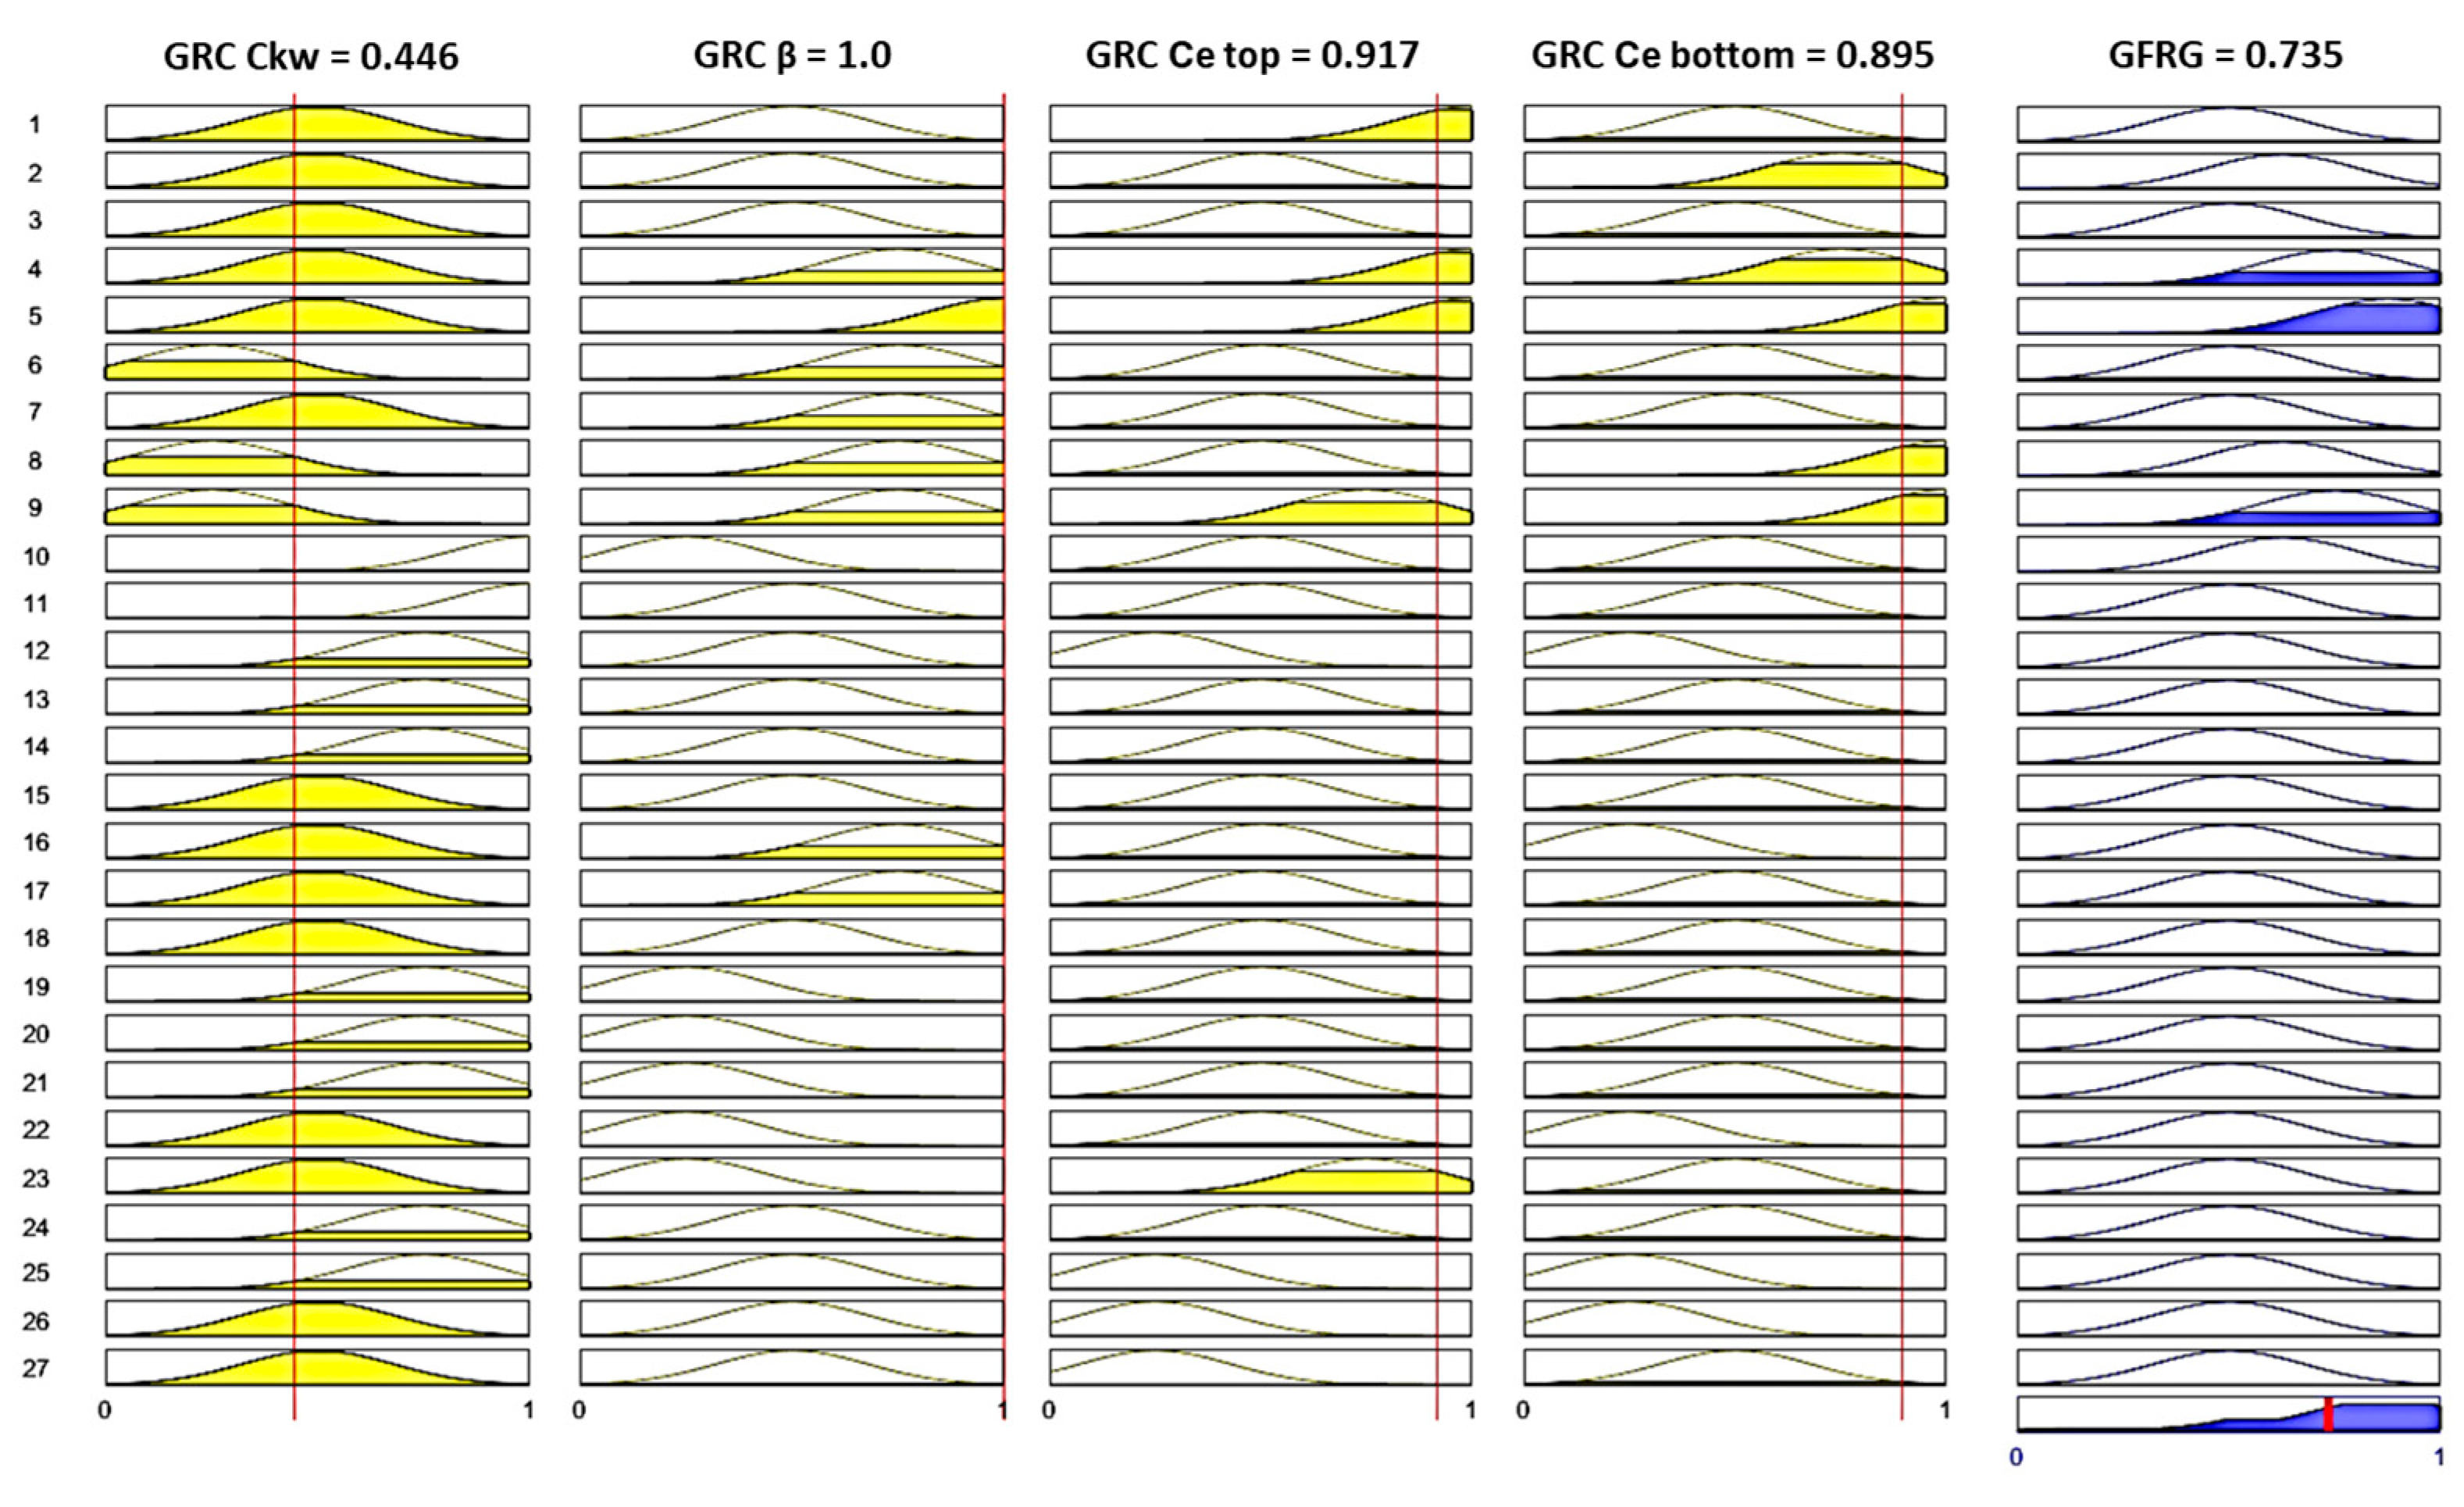
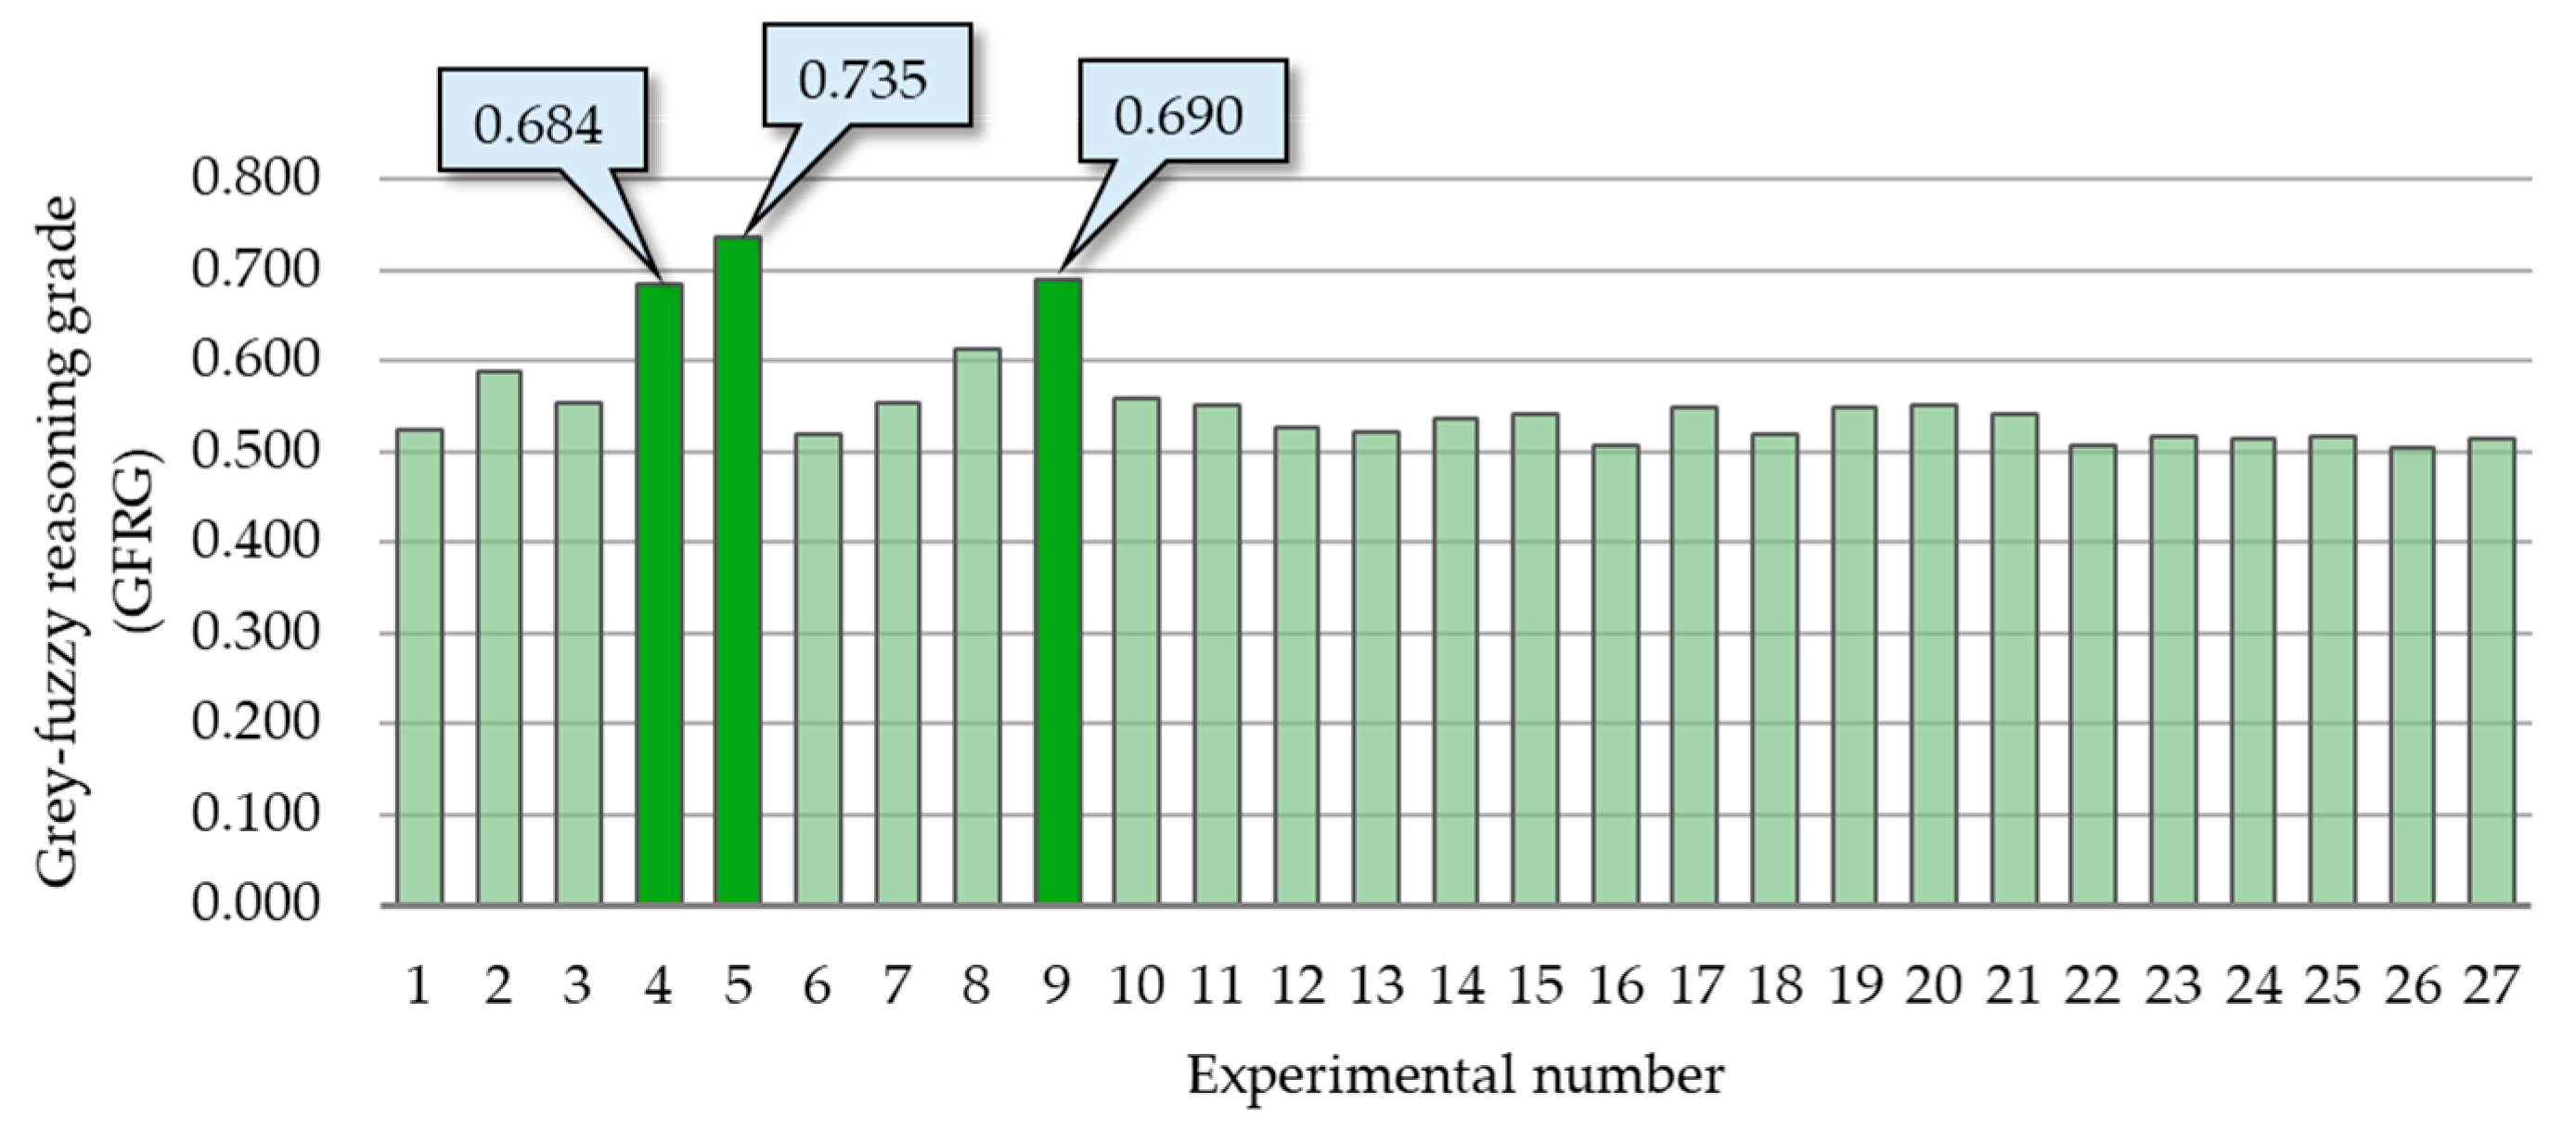
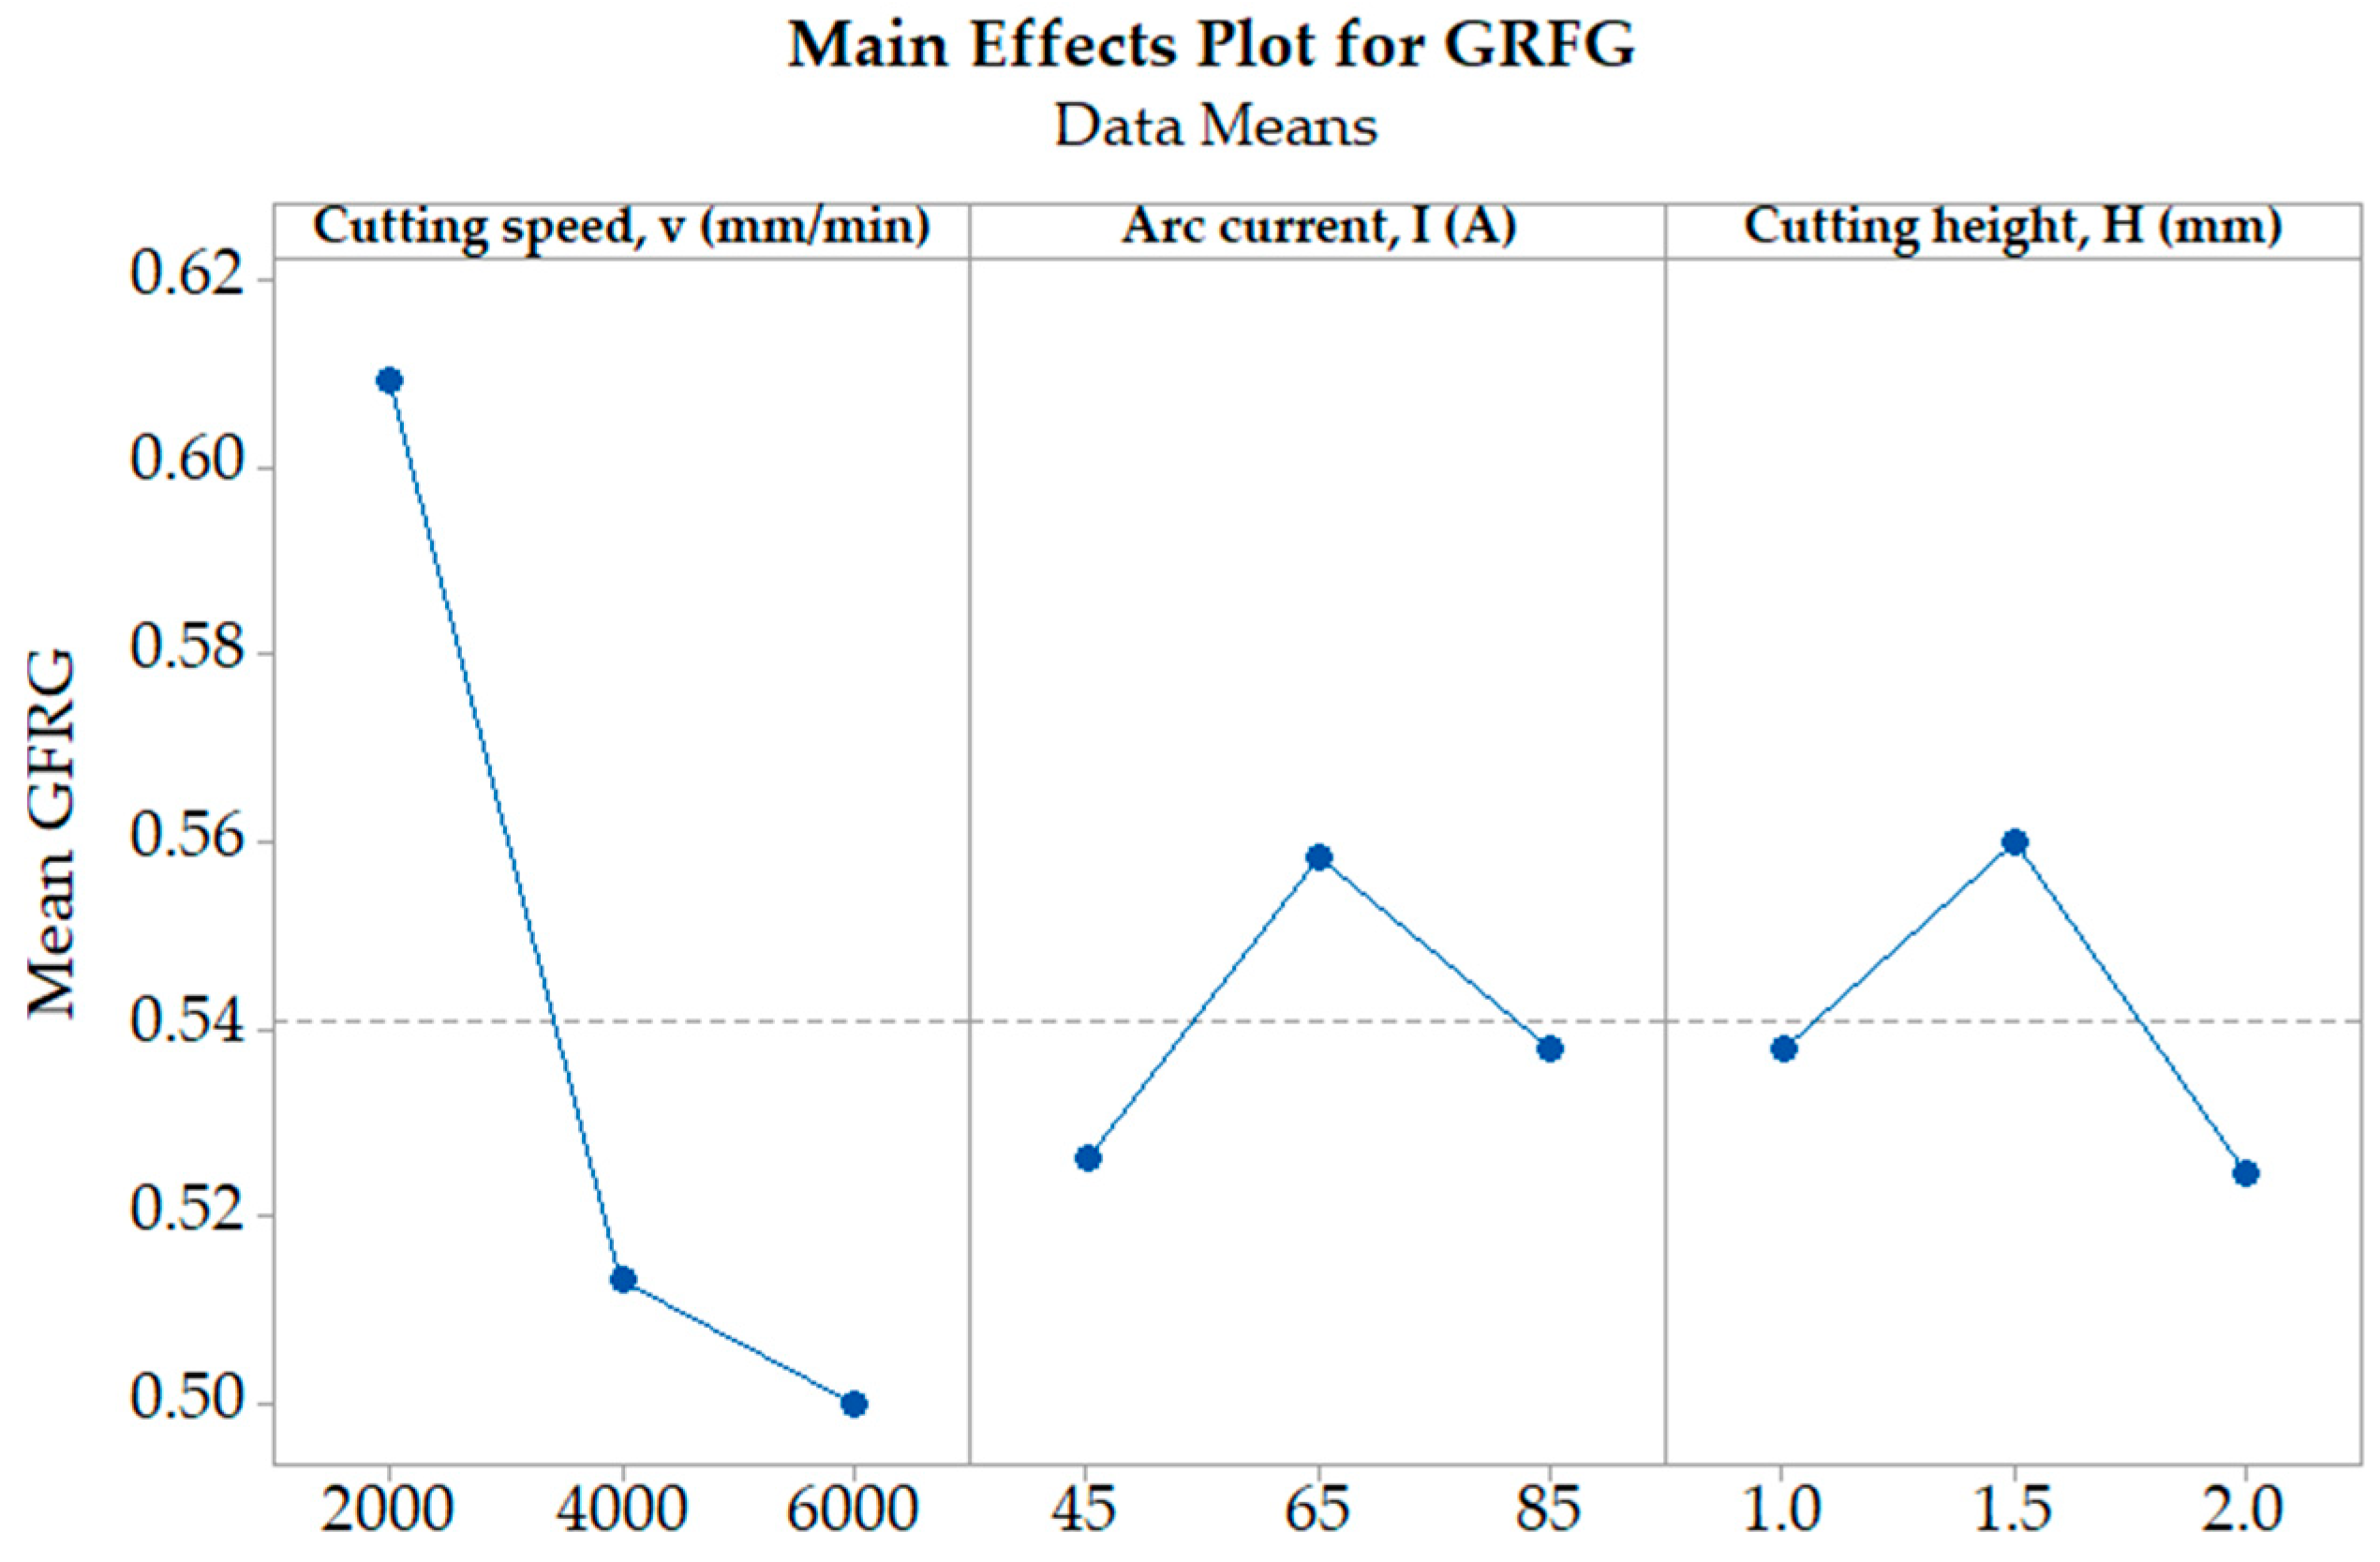
The novel hybrid grey–fuzzy approach for solving multiple circular quality response optimization problems was presented. By using it, optimal process parameter settings that result in minimal response objective functions were determined: v = 2000 mm/min, I = 65 A, H = 1.5 mm.
-
By analyzing 3D surface plots that show the influence of two process parameter variations on the GFRG values, a Pareto front of optimal solutions can be derived. This front corresponds to compromise solutions for the simultaneous optimization of circular quality responses. This front covers the next processing area: v = 2000 mm/min, I = 65 A, H = 1–1.5 mm/v = 2000 mm/min, I = 85 A, H = 2 mm.
-
ANOVA presented that the cutting speed has the largest influence on the GFRG, followed by the cutting height and arc current.
-
The validation experimental test confirmed the prediction and generalization capability of the developed circular quality responses as well as the GFRG fuzzy logic models. This was verified by calculating the mean absolute percentage errors between the newly received experimental and model-predicted data.
-
The optimal solutions presented in this paper, along with the novel hybrid grey–fuzzy approach, hold significant industrial relevance. Their practical application can enhance the process control and management, while also reducing manufacturing costs by minimizing post-processing procedures.
-
Future research in this area will focus on expanding the experimental domain and incorporating additional response variables into the analysis. Further investigations will explore the use of advanced artificial intelligence techniques, such as artificial neural networks for modeling, as well as evolutionary-based metaheuristic algorithms for multi-response optimization.

Author Contributions

Conceptualization, I.P.; methodology, I.P.; software, I.P.; validation, I.P., B.C., and J.Č.-V.; formal analysis, I.P. and J.Č.-V.; investigation, I.P.; resources, I.P., J.Č.-V., and T.M.; data curation, I.P. and B.C.; writing—original draft preparation, I.P.; writing—review and editing, I.P. and T.M.; visualization, I.P., B.C., and T.M.; supervision, I.P., B.C., J.Č.-V., and T.M. All authors have read and agreed to the published version of the manuscript.

Funding

This research received no external funding.

Institutional Review Board Statement

Not applicable.

Informed Consent Statement

Not applicable.

Data Availability Statement

The data presented in this study are available on request from the corresponding author.

Conflicts of Interest

The authors declare no conflicts of interest.

References

  1. Maity, K.P.; Kumar Bagal, D. Effect of process parameters on cut quality of stainless steel of plasma arc cutting using hybrid approach. Int. J. Adv. Manuf. Technol. 2015, 78, 161–175. [Google Scholar] [CrossRef]
  2. Pawar, S.S.; Inamdar, K.H. Experimental Analysis of Plasma Arc Cutting Process for SS 316L Plates. IOSR J. Mech. Civ. Eng. 2017, 5, 75–80. [Google Scholar] [CrossRef]
  3. Adalarasan, R.; Santhanakumar, M.; Rajmohan, M. Application of Grey Taguchi-based response surface methodology (GT-RSM) for optimizing the plasma arc cutting parameters of 304L stainless steel. Int. J. Adv. Manuf. Technol. 2015, 78, 1161–1170. [Google Scholar] [CrossRef]
  4. Radovanovic, M.; Madic, M. Modeling the plasma arc cutting process using ANN. Nonconv. Technol. Rev. 2011, 4, 43–48. [Google Scholar]
  5. Sandeep, R.; Sudhakara, D.; Sreenivasulu, B. Multi objective optimization of process parameters in plasma arc cutting of SS 420 using Grey-Taguchi analysis. Int. J. Adv. Eng. Res. Sci. 2015, 2, 46–52. [Google Scholar]
  6. Lazarević, A. Experimental research of the plasma arc cutting process. J. Appl. Eng. Sci. 2014, 12, 291–296. [Google Scholar] [CrossRef]
  7. Ilii, S.M.; Coteata, M.; Munteanu, A. Experimental results concerning the variation of surface roughness parameter (Ra) at plasma arc cutting of stainless-steel workpiece. Int. J. Mod. Manuf. Technol. 2010, 2, 31–36. [Google Scholar]
  8. Kumar Das, M.; Kumar, K.; Barman, K.T.; Sahu, P. Optimization of process parameters in plasma arc cutting of EN31 steel based on MRR and multiple roughness characteristics using grey relational analysis. Procedia Mater. Sci. 2014, 5, 1550–1559. [Google Scholar]
  9. Tsiolikas, A.; Kechagias, J.; Salonitis, K.; Mastorakis, N. Optimization of cut surface quality during CNC Plasma Arc Cutting process. Int. J. Syst. Appl. Eng. Dev. 2016, 10, 305–308. [Google Scholar]
  10. Srinivasa Raju, S.V.S.S.; Kodanda Ram, K.; Satyanarayana, D.V.S.S.; Sai Nishood Goud, M. Optimization of Process Parameters of Plasma Arc Cutting Using Taguchi’s Robust Design Methodology. IOSR J. Mech. Civ. Eng. 2016, 3, 124–128. [Google Scholar] [CrossRef]
  11. Bini, R.; Colosimo, B.M.; Kutlu, A.E.; Monno, M. Experimental study of the features of the kerf generated by a 200A high tolerance plasma arc cutting system. J. Mater. Process. Technol. 2008, 196, 345–355. [Google Scholar] [CrossRef]
  12. Chamarthi, S.; Sinivasa Reddy, S.; Kumar Elipey, M.; Ramana Reddy, D.V. Investigation Analysis of Plasma arc cutting Parameters on the Unevenness surface of Hardox-400 material. Procedia Eng. 2013, 64, 854–861. [Google Scholar] [CrossRef]
  13. Peko, I.; Marić, D.; Nedić, B.; Samardžić, I. Modeling and Optimization of Cut Quality Responses in Plasma Jet Cutting of Aluminium Alloy EN AW-5083. Materials 2021, 14, 5559. [Google Scholar] [CrossRef]
  14. Peko, I.; Nedić, B.; Đorđević, A.; Veža, I. Modelling of Kerf Width in Plasma Jet Metal Cutting Process using ANN Approach. Tech. Gaz. 2018, 25, 401–406. [Google Scholar]
  15. Peko, I.; Nedić, B.; Dunđer, M.; Samardžić, I. Modelling of Dross Height in Plasma Jet Cutting Process of Aluminium Alloy 5083 Using Fuzzy Logic Technique. Tech. Gaz. 2020, 27, 1767–1773. [Google Scholar]
  16. Kadirgama, K.; Noor, M.M.; Harun, W.S.W.; Aboue-El-Hossein, K.A. Optimisation of heat affected zone by partial swarm optimisation in air plasma cutting operation. J. Sci. Ind. Res. 2010, 69, 439–443. [Google Scholar]
  17. Hamid, A.; Novareza, O.; DwiWidodo, T. Optimization of process parameters and quality results using plasma arc cutting in aluminium alloy. J. Eng. Manag. Ind. Syst. 2019, 7, 7–14. [Google Scholar]
  18. Patel, S.B.; Vyas, T.K. Parametric Investigation of Plasma Arc Cutting on Aluminium Alloy 6082. In Proceedings of the International Conference on Ideas, Impact and Innovation in Mechanical Engineering, Pune, India, 1–2 June 2017; pp. 87–93. [Google Scholar]
  19. Kechagias, J.; Pappas, M.; Karagiannis, S.; Petropoulos, G. An ANN approach on the optimization of the cutting parameters during CNC plasma arc cutting. In Proceedings of the 10th Biennial Conference on Engineering Systems Design and Analysis, Istanbul, Turkey, 12–14 July 2010; pp. 643–649. [Google Scholar]
  20. Asiabanpour, B.; Vejandla, D.T.; Jimenez, J.; Novoa, C. Optimising the automated plasma cutting process by design of experiments. Int. J. Rapid Manuf. 2009, 1, 19–40. [Google Scholar] [CrossRef]
  21. Chen, J.C.; Li, Y.; Cox, R.A. Taguchi-based Six Sigma approach to optimize plasma cutting process: An industrial case study. Int. J. Adv. Manuf. Technol. 2009, 41, 760–769. [Google Scholar] [CrossRef]
  22. Kechagias, J.; Billis, M. A parameter design of CNC plasma-arc cutting of carbon steel plates using robust design. Int. J. Exp. Des. Process Optim. 2010, 1, 315–326. [Google Scholar] [CrossRef]
  23. Hussein, W.; Abdullah Al-Shammari, M. Fatigue and Fracture Behaviours of FSW and FSP Joints of AA5083-H111 Aluminium Alloy. IOP Conf. Ser. Mater. Sci. Eng. 2018, 454, 012055. [Google Scholar] [CrossRef]
  24. Peko, I.; Ljumović, P.; Nedić, B.; Dunđer, M. Analysis of the heat affected zone in plasma jet cutting process of the aluminium alloy EN AW5083. Zaštita Mater. 2019, 60, 174–181. [Google Scholar]
  25. Vrsalović, L.; Čatipović, N.; Gudić, S.; Kožuh, S. Beneficial effect of Cu content and austempering parameters on the hardness and corrosion properties of austempered ductile iron (ADI). Facta Univ. Ser. Mech. Eng. 2025, 23, 33–47. [Google Scholar] [CrossRef]
  26. Čatipović, N.; Peko, I.; Grgić, K.; Periša, K. Multi Response Modelling and Optimisation of Copper Content and Heat Treatment Parameters of ADI Alloys by Combined Regression Grey-Fuzzy Approach. Metals 2024, 14, 735. [Google Scholar] [CrossRef]
  27. Kusumoto, K.; Wang, J.; Nezu, K. A Study on the Cut Surface Quality of Mild Steel Plate by Oxygen Plasma Arc Cutting. Q. J. Jpn. Weld. Soc. 1999, 17, 201–208. [Google Scholar] [CrossRef]
  28. Wang, J.; Zhu, Z.; He, C.; Yang, F. Effect of dual swirling plasma arc cutting parameters on kerf characteristics. Int. J. Mater. Form. 2011, 4, 39–43. [Google Scholar] [CrossRef]
  29. Lukic, D.; Cep, R.; Milosevic, M.; Antic, A.; Zivkovic, A.; Todic, V.; Rodic, D. A Grey Fuzzy Approach to the Selection of Cutting Process from the Aspect of Technological Parameters. Appl. Sci. 2022, 12, 12589. [Google Scholar] [CrossRef]
  30. Dragičević, M.; Begović, E.; Ekinović, S.; Peko, I. Multi-Response Optimization in MQLC Machining Process of Steel St50-2 Using Grey-Fuzzy Technique. Tech. Gaz. 2023, 30, 248–255. [Google Scholar]
  31. Babu, J.; Madarapu, A.; Paul, L.; Ahmed, A.N.K.; Davim, J.P. Multi-Response Optimization during the High-Speed Drilling of Composite Laminate Using the Grey Entropy Fuzzy Method (GEF). Processes 2022, 10, 1865. [Google Scholar] [CrossRef]
  32. Sharma, A.; Kumar, V.; Babbar, A.; Dhawan, V.; Kotecha, K.; Prakash, C. Experimental Investigation and Optimization of Electric Discharge Machining Process Parameters Using Grey-Fuzzy-Based Hybrid Techniques. Materials 2021, 14, 5820. [Google Scholar] [CrossRef]
  33. Senthilkumar, N.; Sudha, J.; Muthukumar, V. A grey-fuzzy approach for optimizing machining parameters and the approach angle in turning AISI 1045 steel. Adv. Prod. Eng. Manag. 2015, 10, 195–208. [Google Scholar] [CrossRef]
  34. Horng, J.T.; Chiang, K.T. A grey and fuzzy algorithms integrated approach to the optimization of turning Hadfield steel with Al2O3/TiC mixed ceramic tool. J. Mater. Process. Technol. 2008, 207, 89–97. [Google Scholar] [CrossRef]
  35. Soepangkat, B.O.P.; Soesanti, A.; Pramujati, B. The use of Taguchi-grey-fuzzy to optimize performance characteristics in turning of AISI D2. Appl. Mech. Mater. 2013, 315, 211–215. [Google Scholar] [CrossRef]
Figure 1. Research methodology framework.
Applsci 15 07447 g001
Figure 2. Experimental setup: (a) CNC plasma cutting machine setup, (b) example of circular samples (top and bottom view), and (c) circular responses’ measuring machine TESA Micro Hite 3D 454.
Applsci 15 07447 g002
Figure 3. Experimental responses.
Applsci 15 07447 g003
Figure 4. Architecture of fuzzy logic system for modeling relations between plasma cutting process parameters and circular quality responses.
Applsci 15 07447 g004
Figure 5. Gaussian membership functions for inputs: (a) cutting speed, (b) arc current, and (c) cutting height.
Applsci 15 07447 g005
Figure 6. Gaussian membership functions for responses: (a) circular kerf width, (b) circular bevel angle, (c) circularity error—top, and (d) circularity error—bottom.
Applsci 15 07447 g006
Figure 7. Comparison between experimental and predicted circular quality responses: (a) circular kerf width, (b) circular bevel angle, (c) circularity error—top, (d) circularity error—bottom.
Applsci 15 07447 g007
Figure 8. Three-dimensional surface plots of circular kerf width quality response under the influence of parameter interactions: (a) cutting speed–arc current, (b) cutting speed–cutting height, and (c) arc current–cutting height.
Applsci 15 07447 g008
Figure 9. Three-dimensional surface plots of circular bevel angle quality response under the influence of parameters interactions: (a) cutting speed–arc current, (b) cutting speed–cutting height, and (c) arc current–cutting height.
Applsci 15 07447 g009
Figure 10. Three-dimensional surface plots of circularity error—top quality response under the influence of parameters interactions: (a) cutting speed–arc current, (b) cutting speed–cutting height, and (c) arc current–cutting height.
Applsci 15 07447 g010
Figure 11. Three-dimensional surface plots of circularity error—bottom quality response under the influence of parameters interactions: (a) cutting speed–arc current, (b) cutting speed–cutting height, and (c) arc current–cutting height.
Applsci 15 07447 g011
Figure 12. Architecture of fuzzy logic system for modeling relations between grey relational coefficients (GRC) of circular quality responses and grey–fuzzy reasoning grade (GFRG).
Applsci 15 07447 g012
Figure 13. Gaussian membership functions for (a) input: GRC circular kerf width and (b) output: GFRG.
Applsci 15 07447 g013
Figure 14. Graphical representation of fuzzy IF-THEN rules between inputs: GRCs of circular quality responses and GFRG.
Applsci 15 07447 g014
Figure 15. GFRG values for all experimental trials.
Applsci 15 07447 g015
Figure 16. Comparison results between calculated GRG and predicted GFRG values with validation measures R2 and MAPE.
Applsci 15 07447 g016
Figure 17. Three-dimensional surface plots of GRC circular quality response interactions: (a) circular kerf width and circular bevel angle, (b) circular kerf width and circularity error—top, (c) circular kerf width and circularity error—bottom, (d) circular bevel angle and circularity error—top, (e) circular bevel angle and circularity error—bottom, and (f) circularity error—top and circularity error—bottom effects on GFRG values.
Applsci 15 07447 g017
Figure 18. Graphical representation of fuzzy IF-THEN rules between process parameters: cutting speed, arc current, cutting height, and predicted GFRG values.
Applsci 15 07447 g018
Figure 19. Comparison results between calculated GRG and predicted GFRG values with validation measures R2 and MAPE.
Applsci 15 07447 g019
Figure 20. Main effects plot for grey–fuzzy reasoning grade (GFRG).
Applsci 15 07447 g020
Figure 21. Three-dimensional surface plots of process parameters interactions: (a) cutting speed and arc current, (b) cutting speed and cutting height, and (c) arc current and cutting height effects on GFRG values.
Applsci 15 07447 g021
Table 1. Specifications of CNC machine FlameCut 2513.
ProducerArpel Automation
Model FlameCut 2513
Overall sizes (mm)3720 × 2500 × 1850
Weight (kg)1300
Tool travels (X, Y, Z)3000 mm × 1500 mm × 200 mm
Maximum tool speed20,000 mm/min
Supply400 V/50 Hz
DriveAC Servo
X, Y, Z driveBall screw
Accuracy0.1 mm/m
Plasma typeUser defined
Table 2. Properties of aluminum EN AW 5083 alloy.
Chemical Composition
AlTiCrZnSiMgCuFeMn
Balance0.150.05–0.250.250.404–4.900.100.400.40–1
Physical Properties
DensityMelting pointThermal expansionModulus of elasticityThermal conductivityElectrical resistivity
2.65 g/cm3570 °C25 × 10–6/K72 GPa121 W/m·K0.058 × 10–6 Ω·m
Mechanical Properties
Proof stressTensile strengthElongationShear strengthVickers Hardness
145 MPa300 MPa23%175 MPa75 HV
Table 3. Experimental plan and circular quality response values.
Exp. TrialProcess ParametersCircular Quality Responses
v (mm/min)I (A)H (mm)Ckw (mm)β (°)Ce Top
(mm)
Ce Bottom (mm)
120004511.946.620.050.23
22000451.51.684.890.170.07
320004521.765.960.130.13
420006511.841.080.040.10
52000651.51.890.320.050.04
620006522.111.370.150.23
720008511.993.080.160.13
82000851.52.122.230.220.03
920008522.221.690.070.02
1040004511.358.660.140.23
114000451.51.377.090.180.30
1240004521.527.380.240.36
1340006511.618.130.150.23
144000651.51.525.430.150.18
1540006521.635.870.220.17
1640008511.663.180.210.32
174000851.51.753.120.180.15
1840008521.944.420.180.24
1960004511.4410.050.150.16
206000451.51.439.430.210.17
2160004521.479.620.140.15
2260006511.629.800.110.33
236000651.51.648.620.090.25
2460006521.577.560.180.26
2560008511.553.780.240.31
266000851.51.723.910.260.35
2760008521.834.670.230.27
Table 4. Fuzzy IF-THEN rules for modeling circular quality responses independent of process parameters: cutting speed, arc current, and cutting height.
1. rule: If (cutting speed is L) and (arc current is L) and (cutting height is L) then (Ckw is MH) (β is MH) (Ce top is L) (Ce bottom is MH) 15. rule: If (cutting speed is M) and (arc current is M) and (cutting height is H) then (Ckw is ML) (β is M) (Ce top is MH) (Ce bottom is ML)
2. rule: If (cutting speed is L) and (arc current is L) and (cutting height is M) then (Ckw is ML) (β is M) (Ce top is M) (Ce bottom is VL) 16. rule: If (cutting speed is M) and (arc current is H) and (cutting height is L) then (Ckw is ML) (β is L) (Ce top is MH) (Ce bottom is H)
3. rule: If (cutting speed is L) and (arc current is L) and (cutting height is H) then (Ckw is M) (β is M) (Ce top is M)(Ce bottom is ML) 17. rule: If (cutting speed is M) and (arc current is H) and (cutting height is M) then (Ckw is M) (β is L) (Ce top is MH) (Ce bottom is ML)
4. rule: If (cutting speed is L) and (arc current is M) and (cutting height is L) then (Ckw is M) (β is VL) (Ce top is L) (Ce bottom is L) 18. rule: If (cutting speed is M) and (arc current is H) and (cutting height is H) then (Ckw is MH) (β is ML) (Ce top is MH) (Ce bottom is MH)
5. rule:If (cutting speed is L) and (arc current is M) and (cutting height is M) then (Ckw is M) (β is VL) (Ce top is L) (Ce bottom is VL)19. rule:If (cutting speed is H) and (arc current is L) and (cutting height is L) then (Ckw is L) (β is VH) (Ce top is M) (Ce bottom is ML)
6. rule:If (cutting speed is L) and (arc current is M) and (cutting height is H) then (Ckw is H) (β is VL) (Ce top is M) (Ce bottom is MH)20. rule:If (cutting speed is H) and (arc current is L) and (cutting height is M) then (Ckw is L) (β is VH) (Ce top is MH) (Ce bottom is ML)
7. rule:If (cutting speed is L) and (arc current is H) and (cutting height is L) then (Ckw is MH) (β is L) (Ce top is M) (Ce bottom is ML)21. rule:If (cutting speed is H) and (arc current is L) and (cutting height is H) then (Ckw is L) (β is VH) (Ce top is M) (Ce bottom is ML)
8. rule:If (cutting speed is L) and (arc current is H) and (cutting height is M) then (Ckw is H) (β is L) (Ce top is MH) (Ce bottom is VL)22. rule:If (cutting speed is H) and (arc current is M) and (cutting height is L) then (Ckw is ML) (β is VH) (Ce top is ML) (Ce bottom is VH)
9. rule:If (cutting speed is L) and (arc current is H) and (cutting height is H) then (Ckw is H) (β is VL) (Ce top is L) (Ce bottom is VL)23. rule:If (cutting speed is H) and (arc current is M) and (cutting height is M) then (Ckw is ML) (β is H) (Ce top is ML) (Ce bottom is MH)
10. rule:If (cutting speed is M) and (arc current is L) and (cutting height is L) then (Ckw is L) (β is H) (Ce top is M) (Ce bottom is MH)24. rule:If (cutting speed is H) and (arc current is M) and (cutting height is H) then (Ckw is ML) (β is MH) (Ce top is MH) (Ce bottom is MH)
11. rule:If (cutting speed is M) and (arc current is L) and (cutting height is M) then (Ckw is L) (β is MH) (Ce top is MH) (Ce bottom is H)25. rule:If (cutting speed is H) and (arc current is H) and (cutting height is L) then (Ckw is ML) (β is ML) (Ce top is H) (Ce bottom is H)
12. rule:If (cutting speed is M) and (arc current is L) and (cutting height is H) then (Ckw is ML) (β is MH) (Ce top is H) (Ce bottom is VH)26 rule:If (cutting speed is H) and (arc current is H) and (cutting height is M) then (Ckw is M) (β is ML) (Ce top is H) (Ce bottom is VH)
13. rule:If (cutting speed is M) and (arc current is M) and (cutting height is L) then (Ckw is ML) (β is H) (Ce top is M) (Ce bottom is MH)27. rule:If (cutting speed is H) and (arc current is H) and (cutting height is H) then (Ckw is M) (β is ML) (Ce top is H) (Ce bottom is MH)
14. rule:If (cutting speed is M) and (arc current is M) and (cutting height is M) then (Ckw is ML) (β is M) (Ce top is M) (Ce bottom is M)
Table 5. ANOVAs for circular cut quality responses.
Circular Kerf WidthCircular Bevel Angle
SourceDFSSMSF-Valuep-ValueDFSSMSF-Valuep-Value
v20.777960.38897849.270.000292.39446.196875.910.000
I20.442070.22103328.000.000287.42543.712371.830.000
H20.073400.0367004.650.04624.9482.47394.060.061
v∙I40.012980.0032440.410.796430.6467.661412.590.002
v∙H40.015380.0038440.490.74640.7050.17630.290.877
I∙H40.059670.0149171.890.20642.4180.60450.990.464
Error80.063160.007894--84.8690.6086--
Total261.44460---26223.404---
Circularity Error—TopCircularity Error—Bottom
SourceDFSSMSF-Valuep-ValueDFSSMSF-Valuep-Value
v20.0258740.01293711.780.00420.1132520.05662611.880.004
I20.0207630.0103819.450.00820.0000520.0000260.010.995
H20.0056520.0028262.570.13720.0140070.0070041.470.286
v∙I40.0081480.0020371.850.21240.0652590.0163153.420.065
v∙H40.0051260.0012811.170.39340.0117700.0029430.620.662
I∙H40.0234370.0058595.340.02240.0076370.0019090.400.803
Error80.0087850.001098--80.0381190.004765--
Total260.097785---260.250096---
Table 6. Normalized circular quality responses data, their grey relational coefficients (GRC), calculated grey relational grade (GRG), and rank for all experimental runs.
Exp. No.Normalization ResultsGRCGRGRank
Ckw (mm)β (°)Ce Top (mm)Ce Bottom (mm)Ckw (mm)β (°)Ce Top
(mm)
Ce Bottom (mm)
10.3220.3530.9550.3820.4240.4360.9170.4470.5567
20.6210.5300.4090.8530.5690.5160.4580.7730.5796
30.5290.4200.5910.6760.5150.4630.5500.6070.53413
40.4370.9221.0000.7650.4700.8651.0000.6800.7542
50.3791.0000.9550.9410.4461.0000.9170.8950.8141
60.1260.8920.5000.3820.3640.8220.5000.4470.53314
70.2640.7160.4550.6760.4050.6380.4780.6070.53215
80.1150.8040.1820.9710.3610.7180.3790.9440.6014
90.0000.8590.8641.0000.3330.7800.7861.0000.7253
101.0000.1430.5450.3821.0000.3680.5240.4470.5855
110.9770.3040.3640.1760.9560.4180.4400.3780.54811
120.8050.2740.0910.0000.7190.4080.3550.3330.45425
130.7010.1970.5000.3820.6260.3840.5000.4470.48921
140.8050.4750.5000.5290.7190.4880.5000.5150.5558
150.6780.4300.1820.5590.6080.4670.3790.5310.49719
160.6440.7060.2270.1180.5840.6300.3930.3620.49220
170.5400.7120.3640.6180.5210.6350.4400.5670.54112
180.3220.5790.3640.3530.4240.5430.4400.4360.46124
190.8970.0000.5000.5880.8290.3330.5000.5480.55310
200.9080.0640.2270.5590.8450.3480.3930.5310.52916
210.8620.0440.5450.6180.7840.3430.5240.5670.5549
220.6900.0260.6820.0880.6170.3390.6110.3540.48022
230.6670.1470.7730.3240.6000.3700.6880.4250.52117
240.7470.2560.3640.2940.6640.4020.4400.4150.48023
250.7700.6440.0910.1470.6850.5840.3550.3700.49818
260.5750.6310.0000.0290.5400.5750.3330.3400.44726
270.4480.5530.1360.2650.4750.5280.3670.4050.44427
Table 7. Response table for grey–fuzzy reasoning grade (GFRG).
Process ParametersOperating LevelMax–MinRank
123
Cutting speed, v (mm/min)0.60930.51310.50000.10931
Arc current, I (A)0.52620.55840.53780.03223
Cutting height, H (mm)0.53780.55990.52470.03522
Table 8. ANOVA for GFRG.
SourceDFSSMSF-Valuep-Value
v20.0640900.0320455.680.011
I20.0047800.0023900.420.661
H20.0056900.0028450.500.612
Error200.1129160.005646--
Total260.187476---
Table 9. Validation test of circular quality responses and GFRG fuzzy logic models.
Process ParametersCircular Quality ResponsesExperimentalPredictedMAPE (%)GRGGFRGMAPE (%)
v = 2000 mm/min
I = 65 A
H = 1 mm
Ckw (mm)
β (°)
Ce top (mm)
Ce bottom (mm)
1.911.795.760.7560.7224.46
1.291.178.58
0.0590.0614.40
0.0950.1027.68
v = 2000 mm/min
I = 65 A
H = 1.5 mm
Ckw (mm)
β (°)
Ce top (mm)
Ce bottom (mm)
1.871.793.750.7870.8032.05
1.211.182.39
0.0650.0615.23
0.0590.0565.08
v = 2000 mm/min
I = 85 A
H = 2 mm
Ckw (mm)
β (°)
Ce top (mm)
Ce bottom (mm)
2.152.121.010.7590.7224.84
1.151.094.69
0.0670.0618.05
0.0610.0559.67
Disclaimer/Publisher’s Note: The statements, opinions and data contained in all publications are solely those of the individual author(s) and contributor(s) and not of MDPI and/or the editor(s). MDPI and/or the editor(s) disclaim responsibility for any injury to people or property resulting from any ideas, methods, instructions or products referred to in the content.

