Article

Mechanical Response and Fatigue Life Analysis of Asphalt Pavements Under Temperature-Load Coupling Conditions

by
Zhenzheng Liu
1,2,*,
Le Zhang
2,
Yuan Gao
2,
Yanying Dong
2,
Yuhang Liu
1,* and
Bo Li
1,*
1
Gansu Industry Technology Center of Transportation Construction Materials Research and Application, Lanzhou Jiaotong University, Lanzhou 730070, China
2
Key Laboratory of Transport Industry of Management, Control and Cycle Repair Technology for Traffic Network Facilitates in Ecological Security Barrier Area, Inner Mongolia Autonomous Region Transportation Research Development Institute, Hohhot 010051, China
*
Authors to whom correspondence should be addressed.
Appl. Sci. 2025, 15(13), 7441; https://doi.org/10.3390/app15137441
Submission received: 9 June 2025 / Revised: 30 June 2025 / Accepted: 1 July 2025 / Published: 2 July 2025

Abstract

The effects of heavy traffic and complex natural environmental conditions have made the problem of the inadequate life expectancy of asphalt pavements increasingly pronounced. In this study, finite-element software was used to establish the three-dimensional analytical model of temperature-load coupling under different axial loads and calculate the distribution law of temperature-load coupling stress under the most unfavorable loading conditions. By comparing temperature and coupled stresses at different depths, the extent to which combined stress changes due to environmental factors affect different depths was determined. Finally, the fatigue life patterns of asphalt pavements under different seasons and axle loads were analyzed. The results showed that the temperature-load coupling stress varied periodically under different axial loads. Among them, the temperature stress had less influence on the coupling stress in spring and fall and more influence in winter. As the depth increases, the coupling stresses and their range of influence gradually decrease. Also, the farther away from the wheel load position, the smaller the traveling load disturbance and the closer the coupling stresses were to the temperature stresses. Under the most unfavorable loading conditions, the change rule of the degree of influence of environmental effects along the depth direction showed that the winter gradually decreased, the spring and fall seasons for the first time decreased and then increased, and the minimum influence on the road surface was at 9 cm. Overall, the degree of influence of environmental action at different axial loads was 70.53%, 41.90%, 27.13%, and 23.77% along the depth direction.

1. Introduction

Semi-rigid asphalt pavement is the main structural form of high-grade highways, and for reflection cracks, as the main form of disease of semi-rigid asphalt pavement, their generation will significantly reduce the use of highway performance [1,2]. The development of reflection cracks is closely related to the shrinkage characteristics of the semi-rigid base material itself, while the ambient temperature field and traveling loads play a decisive role in the development of reflection cracks [3,4]. Therefore, combined with the local climate and traffic characteristics, the simulation of the mechanical response of semi-rigid asphalt pavement structures under the action of temperature, load, and temperature-load coupling has become an urgent problem in the design of semi-rigid asphalt pavement structure combinations and the treatment of reflective cracking disease.
Some results have been obtained for the study of the mechanical response of asphalt pavement under loading. Assogba et al. [5] investigated the effects of vehicle speed and overloading on the dynamic response of semi-rigid asphalt pavements and found that factors such as overloading and low speeds adversely affect pavement service life. Shan et al. [6,7] investigated the response of semi-rigid asphalt pavements under heavy traffic by means of fiber-optic sensor measurements and theoretical model analysis, and the results showed that fatigue cracks were caused by higher traffic loads. Barriera et al. [8,9] analyzed the mechanical response of asphalt pavements under moving loads using buried strain gauges and three-dimensional finite-element modeling, respectively, noting that temperature and travel speed have important effects on the stress response. However, pavements are also affected by environmental factors such as temperature during service. Bai et al. [10] analyzed the temperature response of asphalt pavement under high-temperature conditions based on a three-dimensional finite element model, and the results showed that the tensile and shear stresses of the asphalt layer decreased as the temperature increased. Zhao et al. [11] analyzed the temperature response of asphalt pavements under large temperature differences and low temperatures and found that severe cracks in pavements are closely related to dramatic changes in the pavement temperature field. Wang et al. [12] constructed an interlayer contact bonding model for semi-rigid asphalt pavements and found that the area of separation between the asphalt concrete layer and the subgrade negatively affects the strain in the asphalt pavement. Most of the above studies focus on the effect of single factors, such as load and temperature, on the mechanical response of asphalt pavement, which makes it difficult to simulate the complex environment in which asphalt pavement is located.
A large number of theoretical and practical studies on asphalt pavements have proved that stress fields, temperature fields, and their coupling exist in asphalt pavement structures. And it directly affects the stability of the asphalt pavement structure, stress distribution, and deformation field in the structural layer [13,14,15]. The combined effects of temperature and loads on asphalt pavements are not simple linear combinations, and the coupled effects of these actions will exacerbate the damage to the asphalt layer [7,16]. Researchers are beginning to focus on the mechanical response of asphalt pavements under multi-field coupling. Wang et al. [3,17,18] calculated the tensile and shear stresses of semi-rigid asphalt pavements under temperature-load coupling using the extended finite-element method and analyzed the emergence and expansion laws of reflection cracks under the coupling field, and the results showed that the modulus of the underlying layer is an important factor affecting the expansion of reflection cracks. Erlingsson et al. [19,20,21]. analyzed the mechanical response of saturated asphalt pavements under seepage-stress coupling and showed that higher vehicle speeds generate greater pore water pressure within the pavement.
In general, most of the existing studies focus on the effect of a single factor, such as vehicle load or temperature field, on the mechanical response of asphalt pavement structures. Although some scholars have coupled the vehicle load and temperature fields in their calculations, most of them are limited to two-dimensional models, while the coupled field of asphalt pavement structure is a three-dimensional problem. Therefore, it is difficult to accurately assess the structural mechanical response of asphalt pavements under the combined effects of actual vehicle dynamic loads and temperature fields.
In this study, a typical semi-rigid asphalt pavement structure in Northwest China is taken as the research object, and the three-dimensional finite-element model of the pavement structure is established by using finite element software. The temperature field and different axle types of traffic loads are applied to the model to study the mechanical response law of semi-rigid asphalt pavement under this coupled field, and to provide a reference for the structural design of semi-rigid asphalt pavements and the prevention and treatment of reflection cracking disease.

2. Methodology

2.1. Structural and Material Parameters

The thermal property parameters of the materials in each layer of the pavement structure are provided in Table 1. These parameters of materials are collected from other verified literature [22,23,24]. The analysis of temperature stresses in asphalt pavements is based on the temperature field, which is mainly influenced by the modulus of elasticity and temperature shrinkage coefficient. In addition, Northwest China has a large temperature difference, and the asphalt surface layer is directly exposed to the atmospheric environment, so the temperature changes it suffers cannot be ignored. The temperature stress parameters for each structure of the asphalt pavement are shown in Table 2 and Table 3.

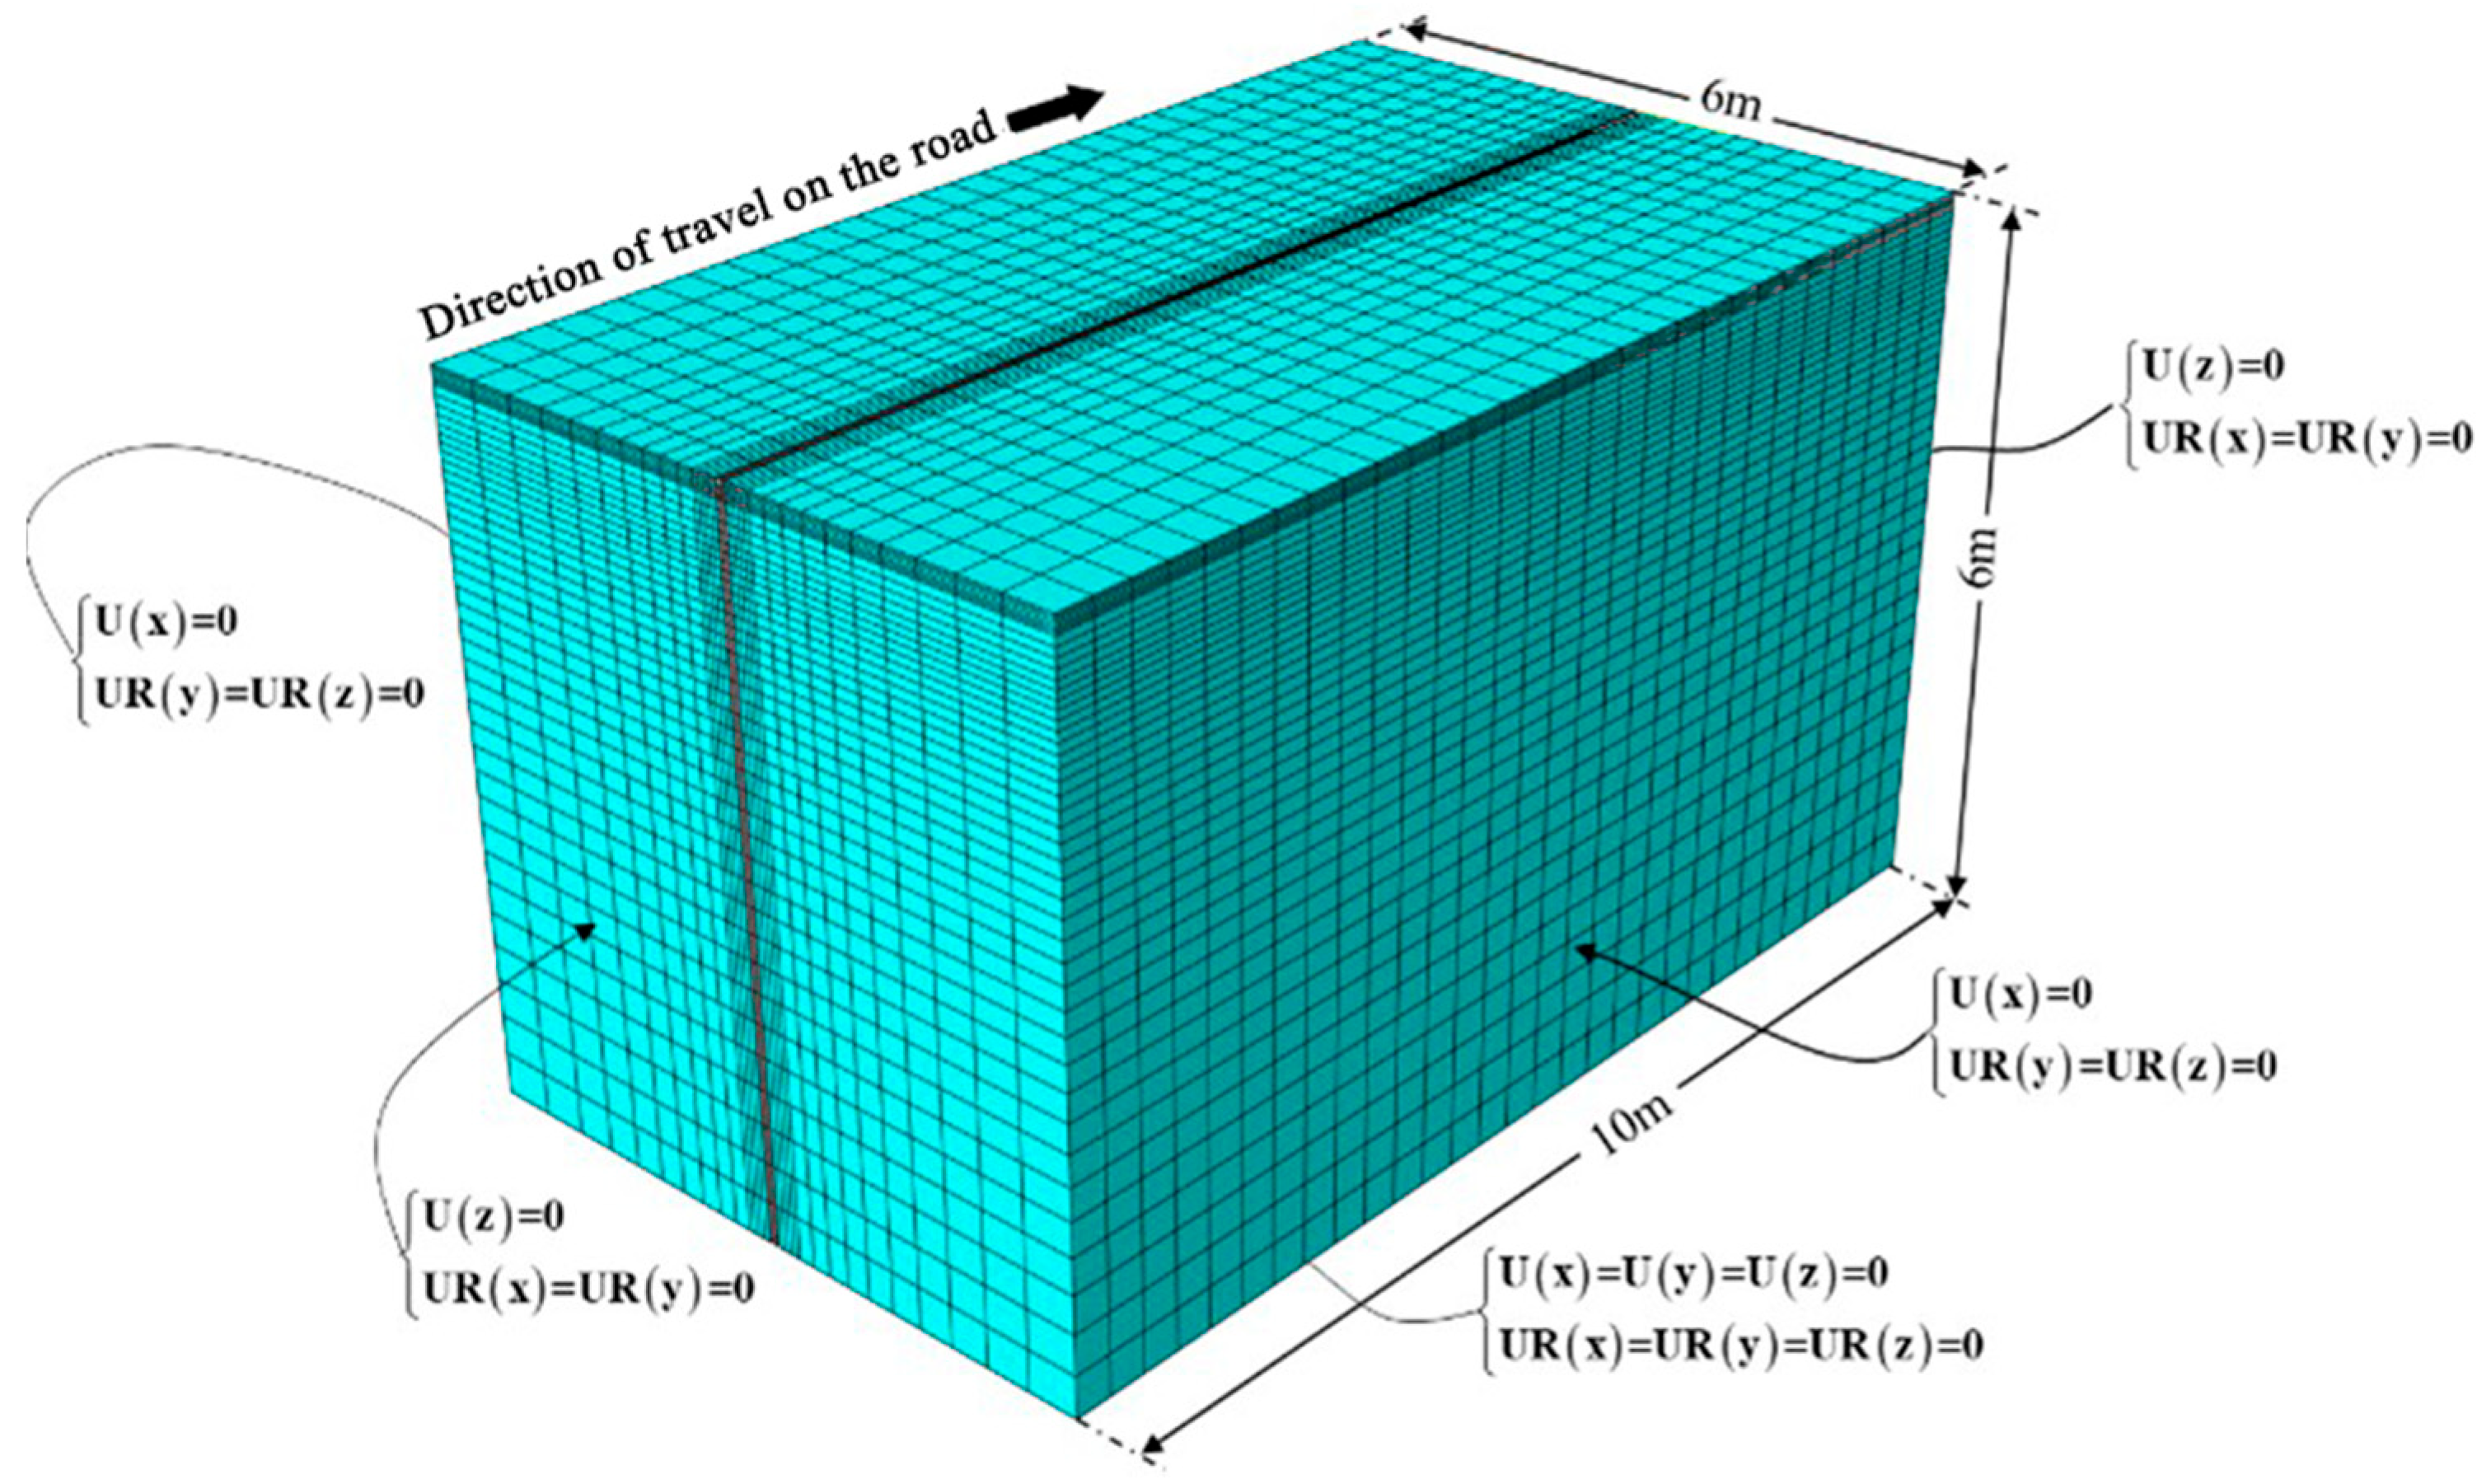
2.2. Model Establishment

2.2.1. Assumptions

According to the structural characteristics of asphalt pavement and the actual stress response, the problem is simplified in the calculation, and the model has the following main assumptions [15]:
(1)
The structural surface material of asphalt pavement is homogeneous, continuous, and isotropic viscoelastic. Subgrade, subbase, and soil base are homogeneous, continuous, and isotropic elastic materials.
(2)
The soil base extends indefinitely in depth, with the remaining layers of limited thickness.
(3)
Temperature and heat transfer continuity in each structural layer.
(4)
Pavement structural temperature field variations are only related to the roadway along the depth direction.
(5)
No consideration of the effect of moisture on pavement structure.

2.2.2. Introduction to the Model

In this study, the semi-rigid asphalt pavement structure is taken as the research object, and finite element software is used to establish the three-dimensional model of the pavement. The size of the pavement structure model is 6 m × 6 m × 10 m. The cell type is an eight-node thermally coupled hexahedral cell, with both transverse and longitudinal boundary conditions fixing only the displacements in their respective directions, XSYMM (U1 = UR2 = UR3 = 0) and ZSYMM (U3 = UR1 = UR2 = 0), respectively, and the bottom boundary condition is completely fixed (U1 = U2 = U3 = UR1 = UR2 = UR3 = 0). Grid division of the structural layer of asphalt pavement is used to increase the number of species and determine the appropriate reduction of the number of soil base species. The final pavement finite-element structure is shown in Figure 1.

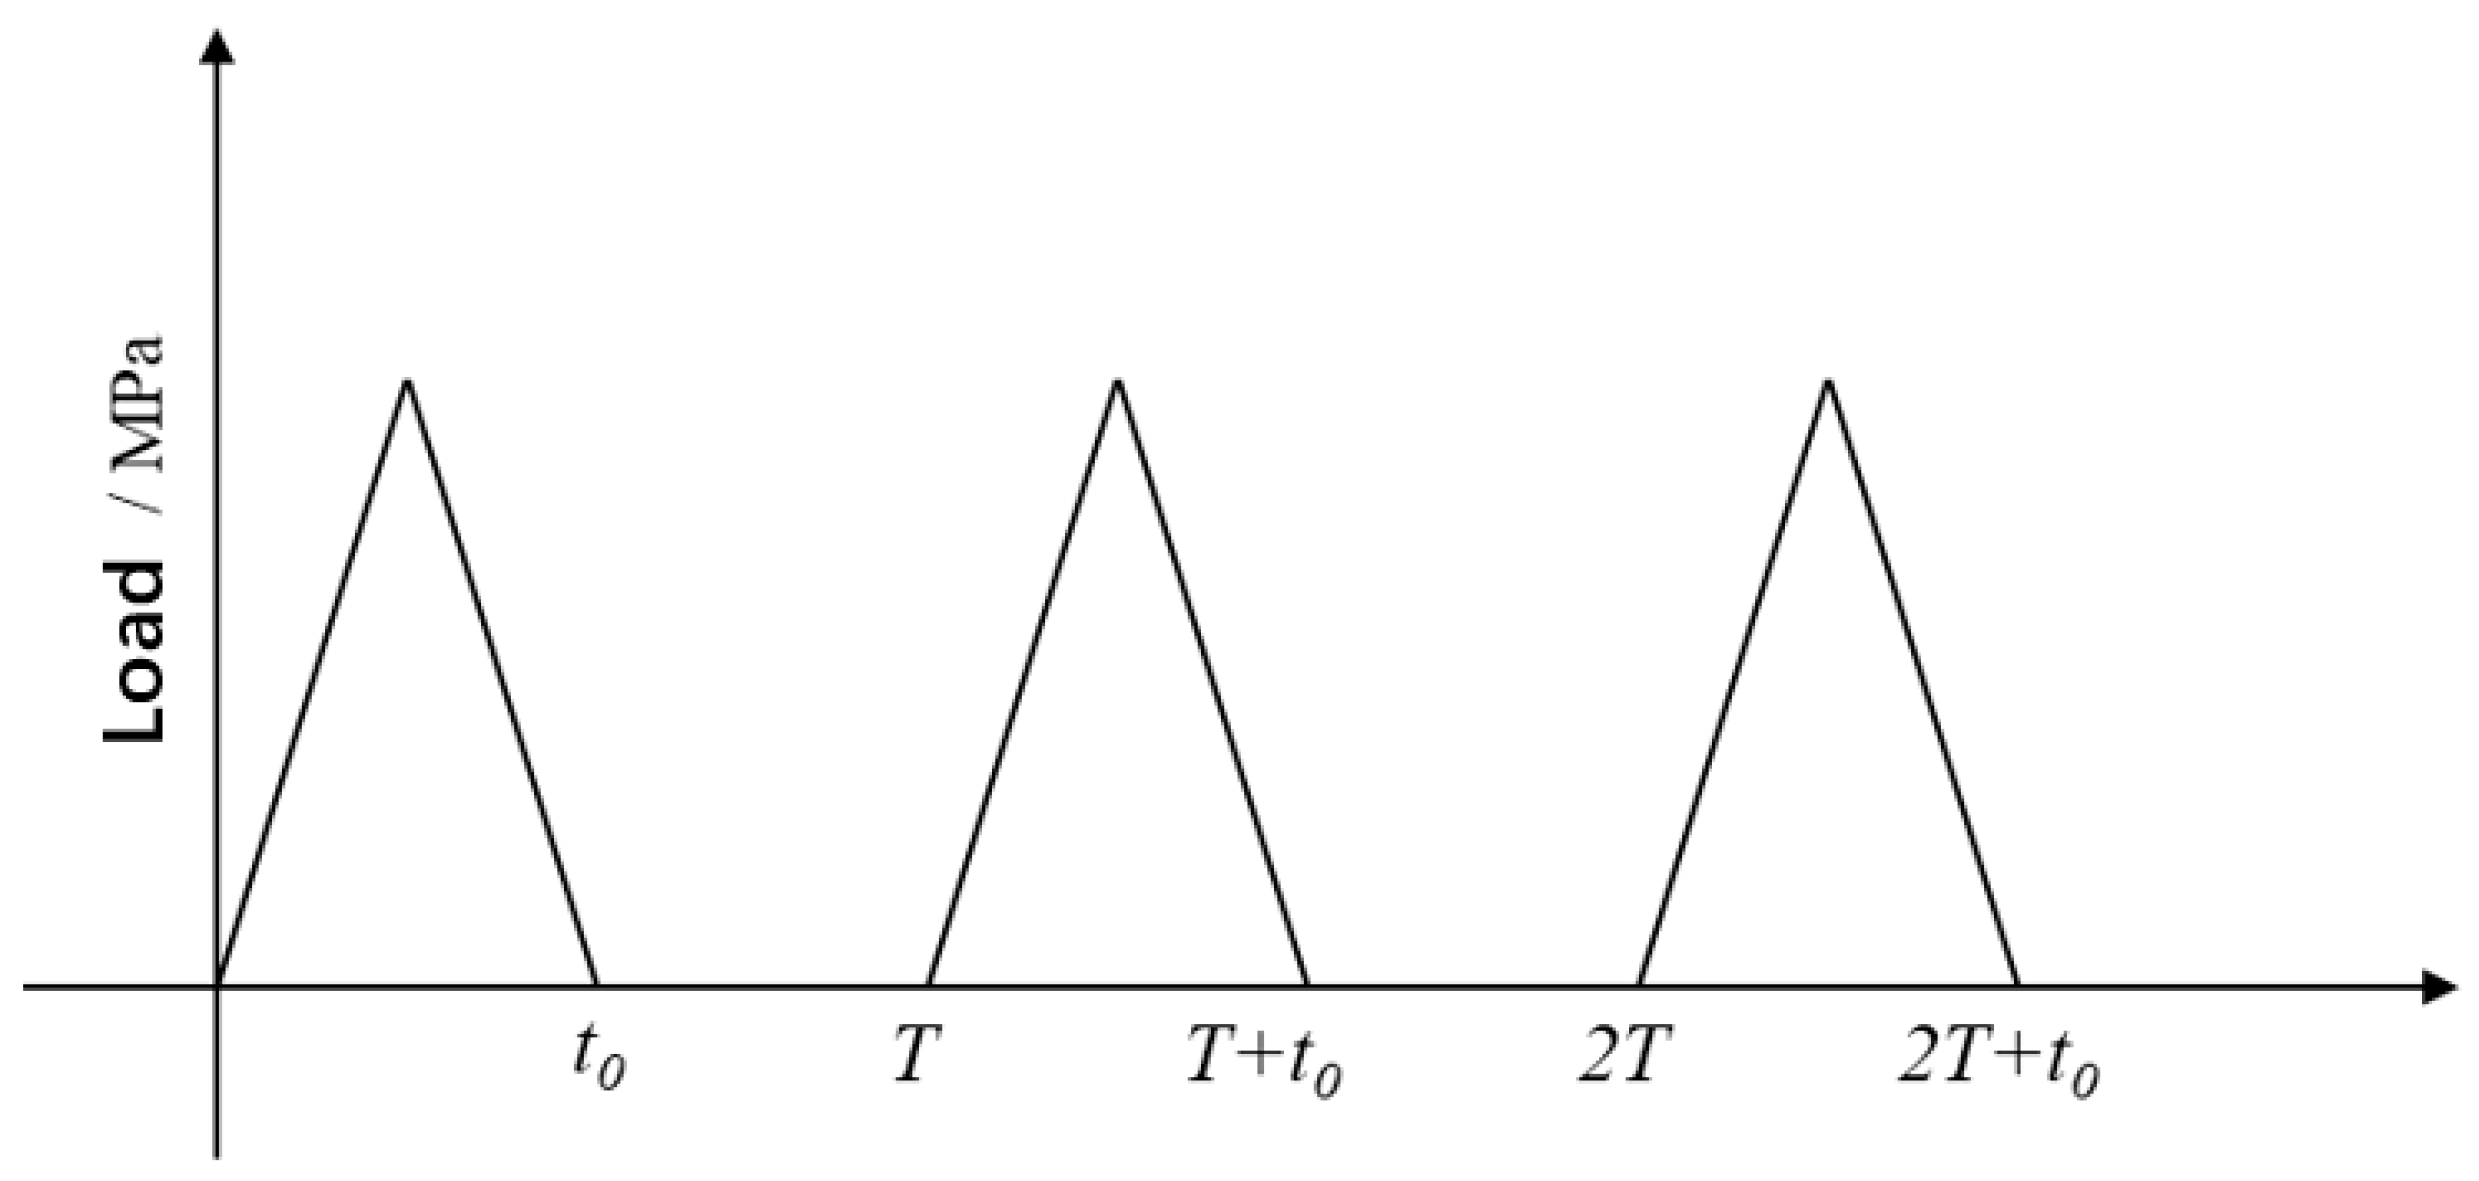
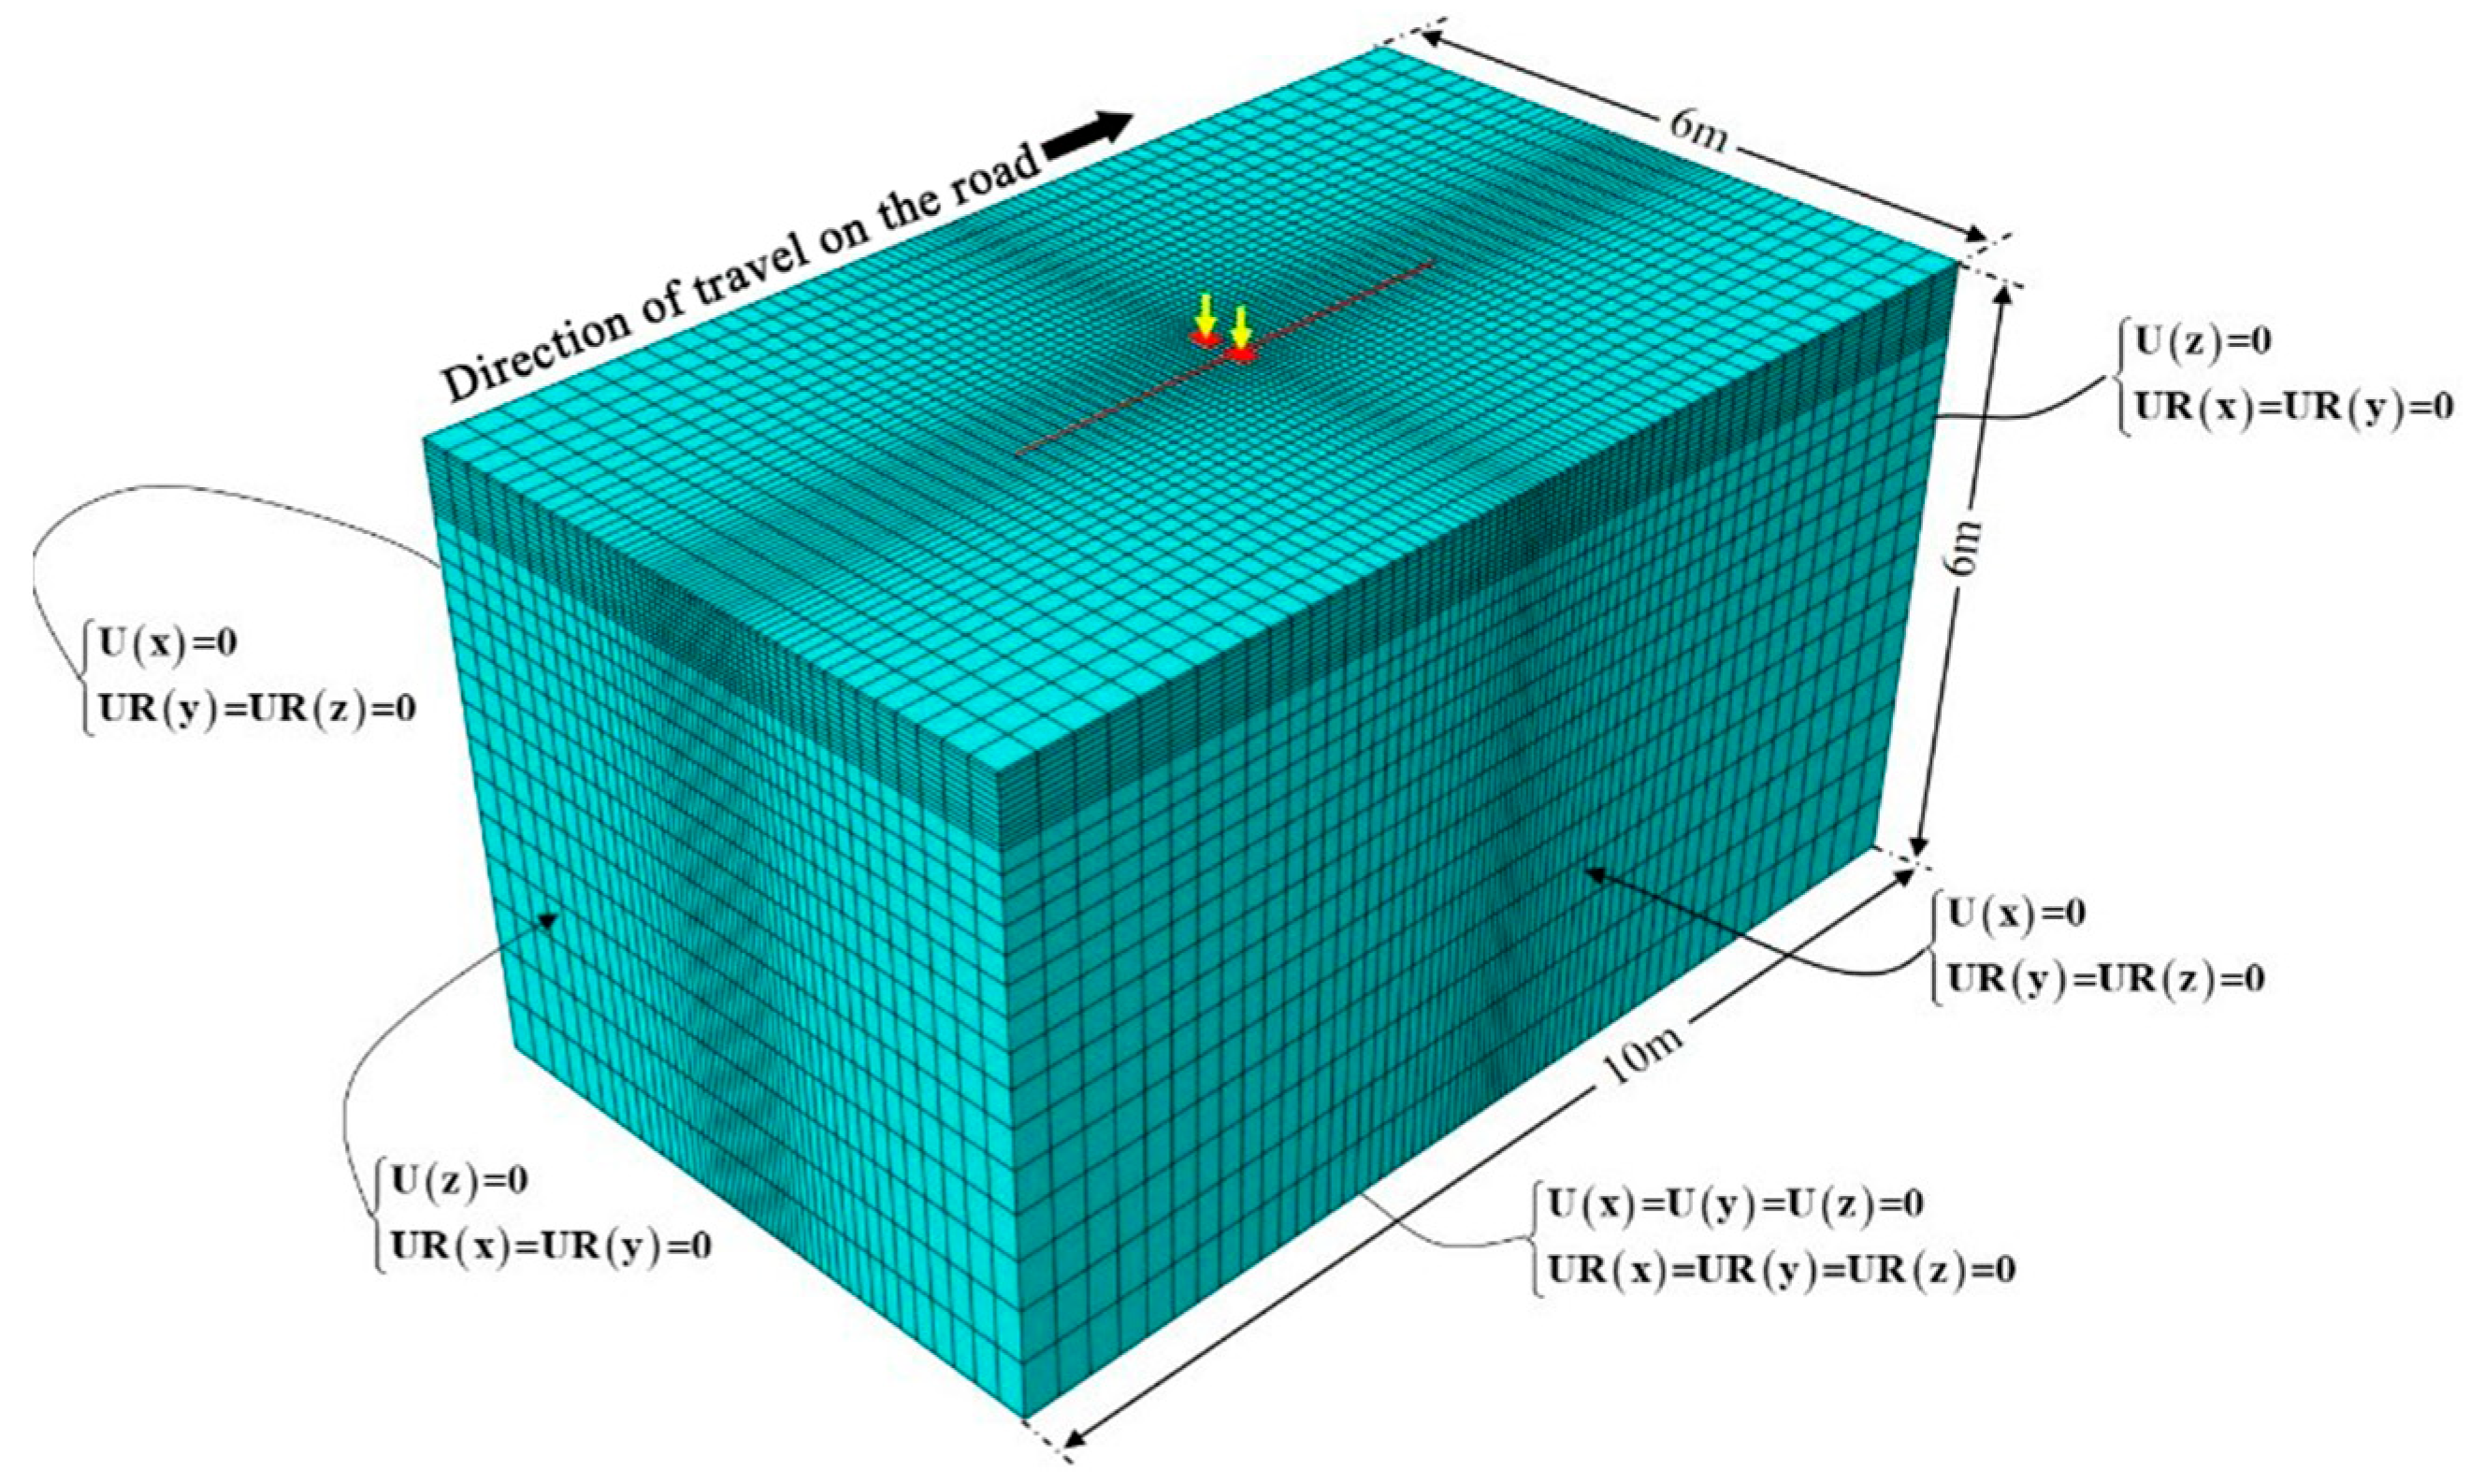
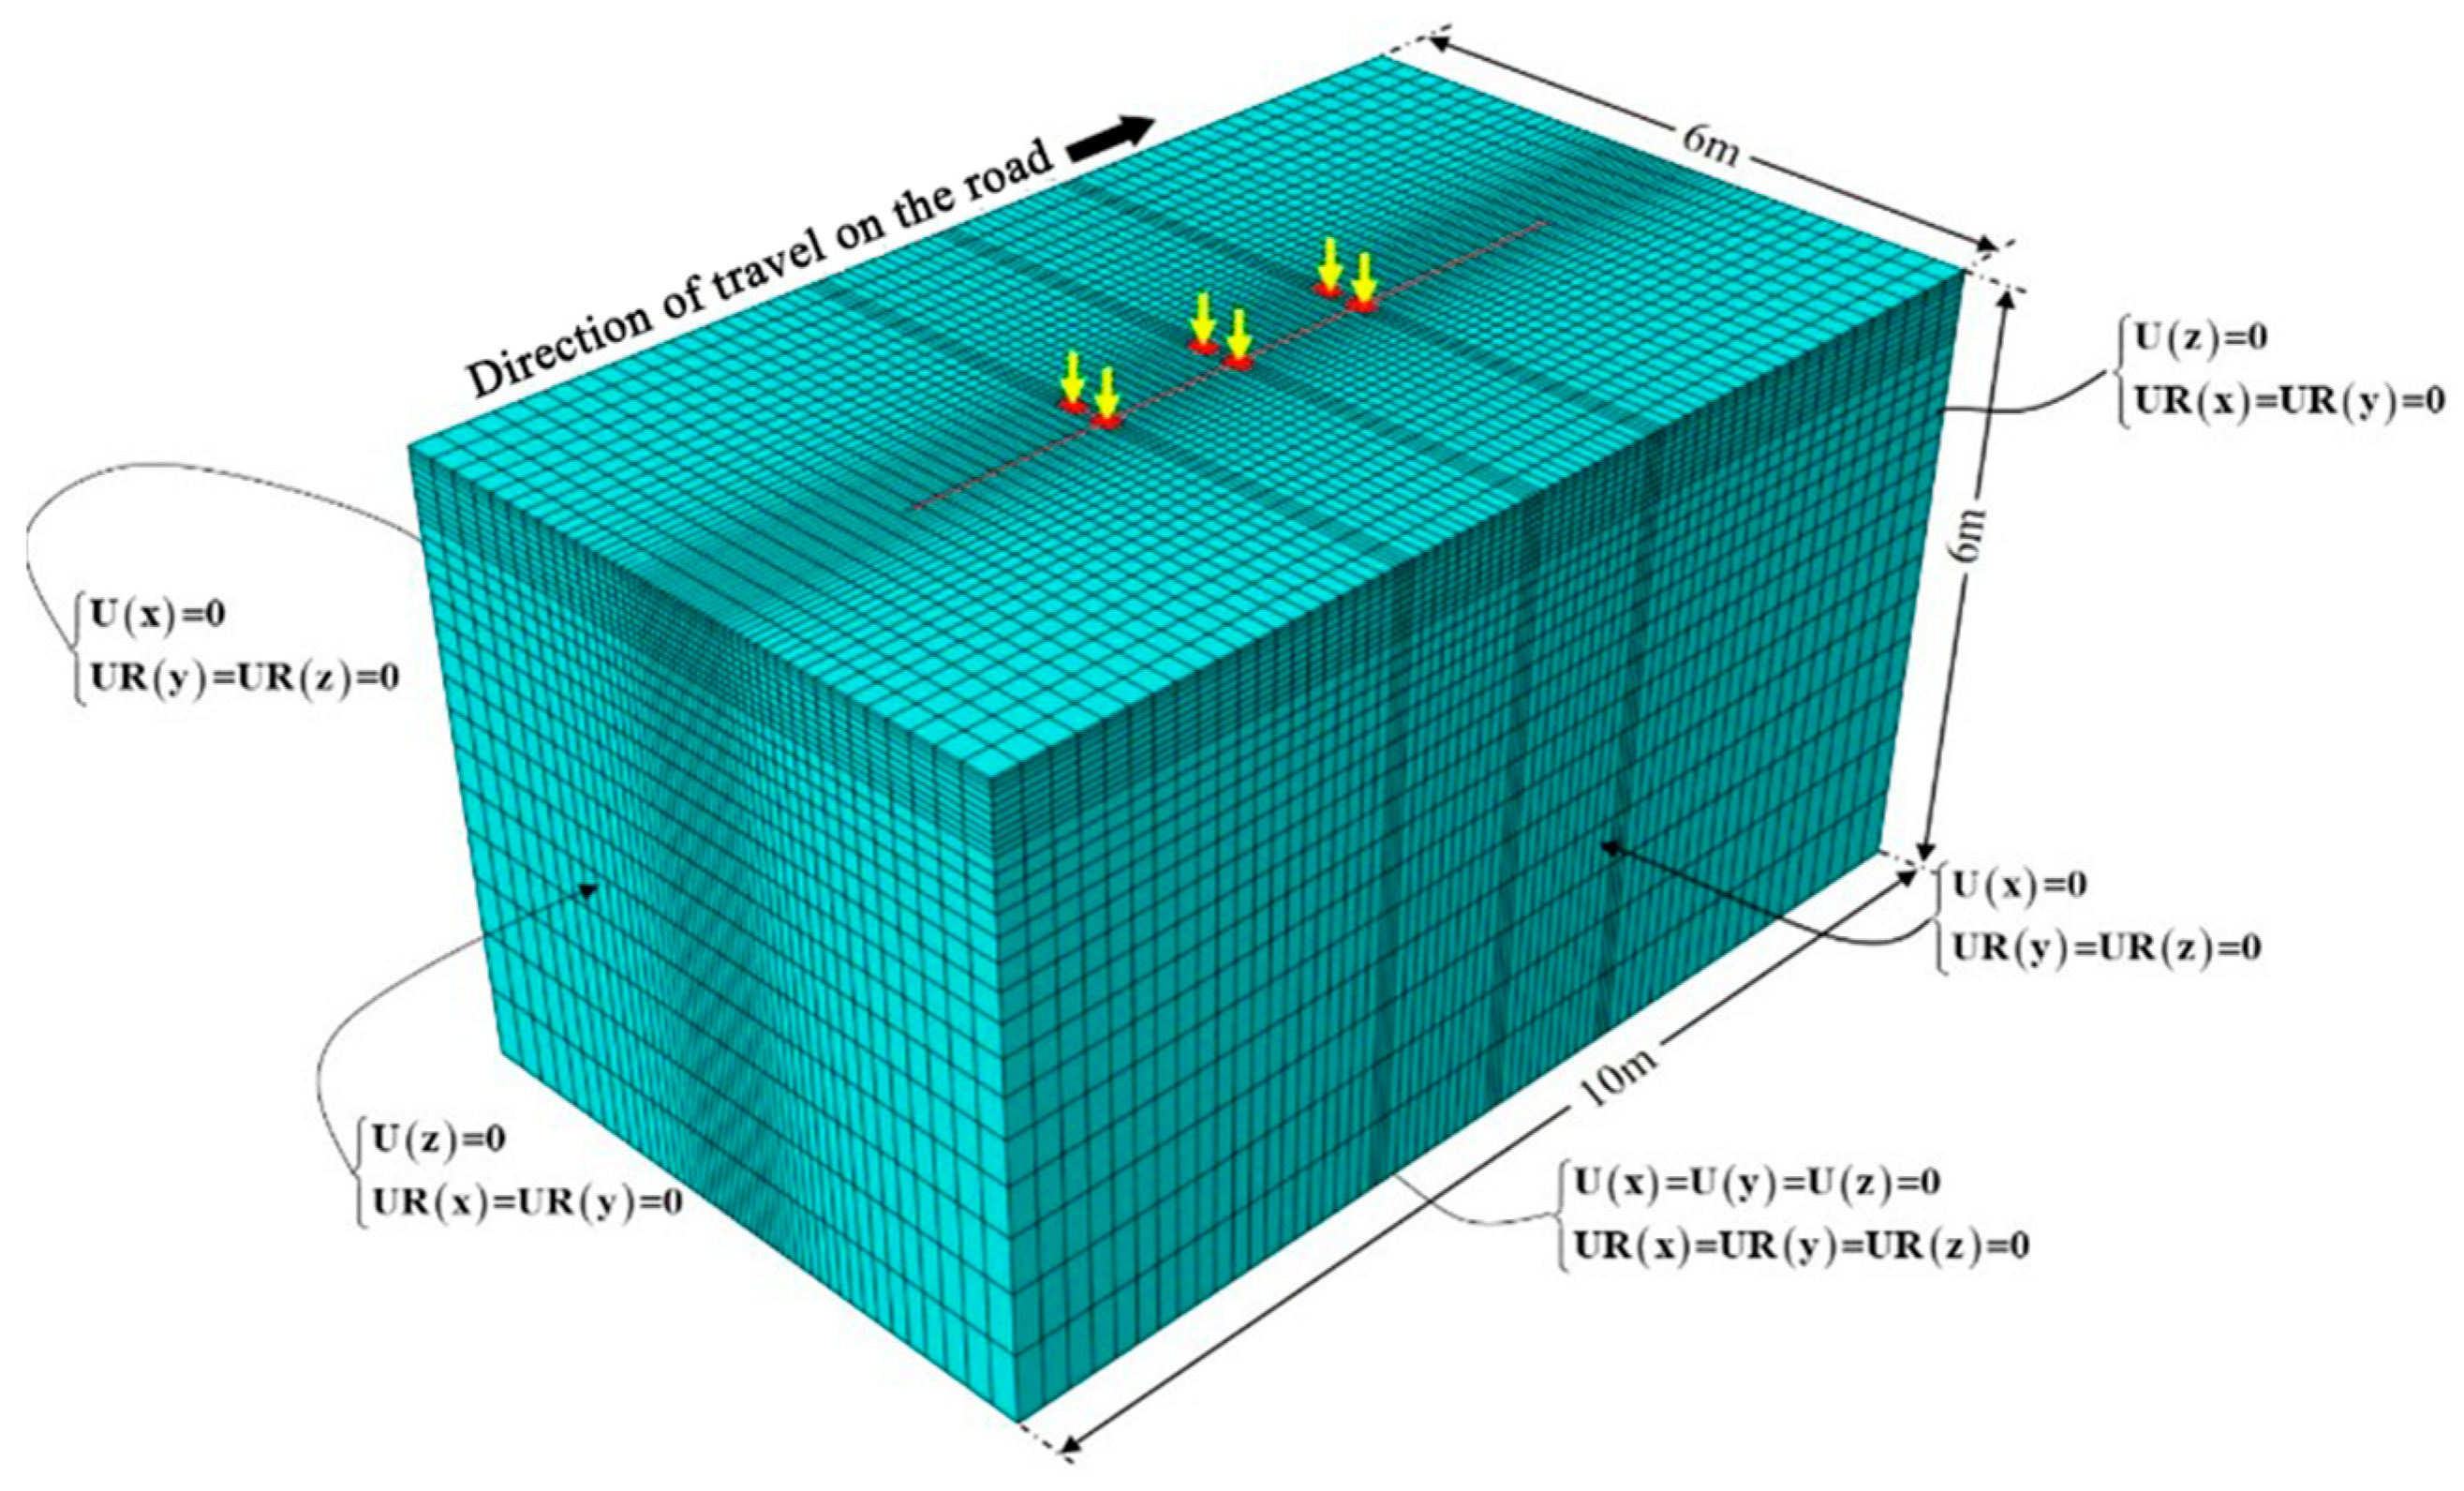
2.2.3. Vehicle Load Modeling

In recent years, the proportion of heavy-duty vehicles is increasing year by year, and the pavement structure is subjected to greater axle loads. Vehicles were selected to be weighed at one of the toll plazas with a high volume of truck traffic in order to determine the distribution of traffic axle loads. And their axle loads were statistically analyzed according to the full load axle load distribution factor.
During the statistical process, it was found that there were multiple axle types for some of the axle counts, so the models with this type of axle count were approximated in the calculations. The results for different shaft types are shown in Figure 2.
Axle-type parameters are based on toll station statistics and include single, double, and triple axles. The distance between the shafts of different shaft types is 1.311 m. Referring to the research results of previous papers [25,26], the tire grounding shape is simplified as a rectangle. The same dimensions were used to characterize the grounded area of the three types of axle-type tires, and the schematic of their tire grounding dimensions is shown in Figure 3.
At present, the driving load is simplified into a triangular wave load or a sine and cosine load, and these two different load simplifications have little influence on the calculation results. The load in this study is simplified to a triangular wave load, and its action form is shown in Figure 4.
The single action time of the triangular wave load can be calculated using the following formula:
t = 12 r V
where V is the driving speed (m/s); r is the tire contact length (m); and t is the time of a single load (s).
In this study, the approximate load action time is 0.02 s, the equivalent dynamic load coefficient is 1.13, and the grounding pressures of different axial types are 0.8221 MPa, 0.6216 MPa, and 0.7520 MPa, respectively.
The mesh is divided into different axial loads according to the dimensions shown in Figure 1. A temperature-displacement-coupled analysis step is used. The global size is 0.05. The unit type is an eight-node thermally coupled hexahedral unit (C3D8T). Restart analysis is established during analysis, outputting one restart request per analysis step. The final meshing results, boundary conditions, and selected stress analysis paths are obtained as shown in Figure 5, Figure 6 and Figure 7.

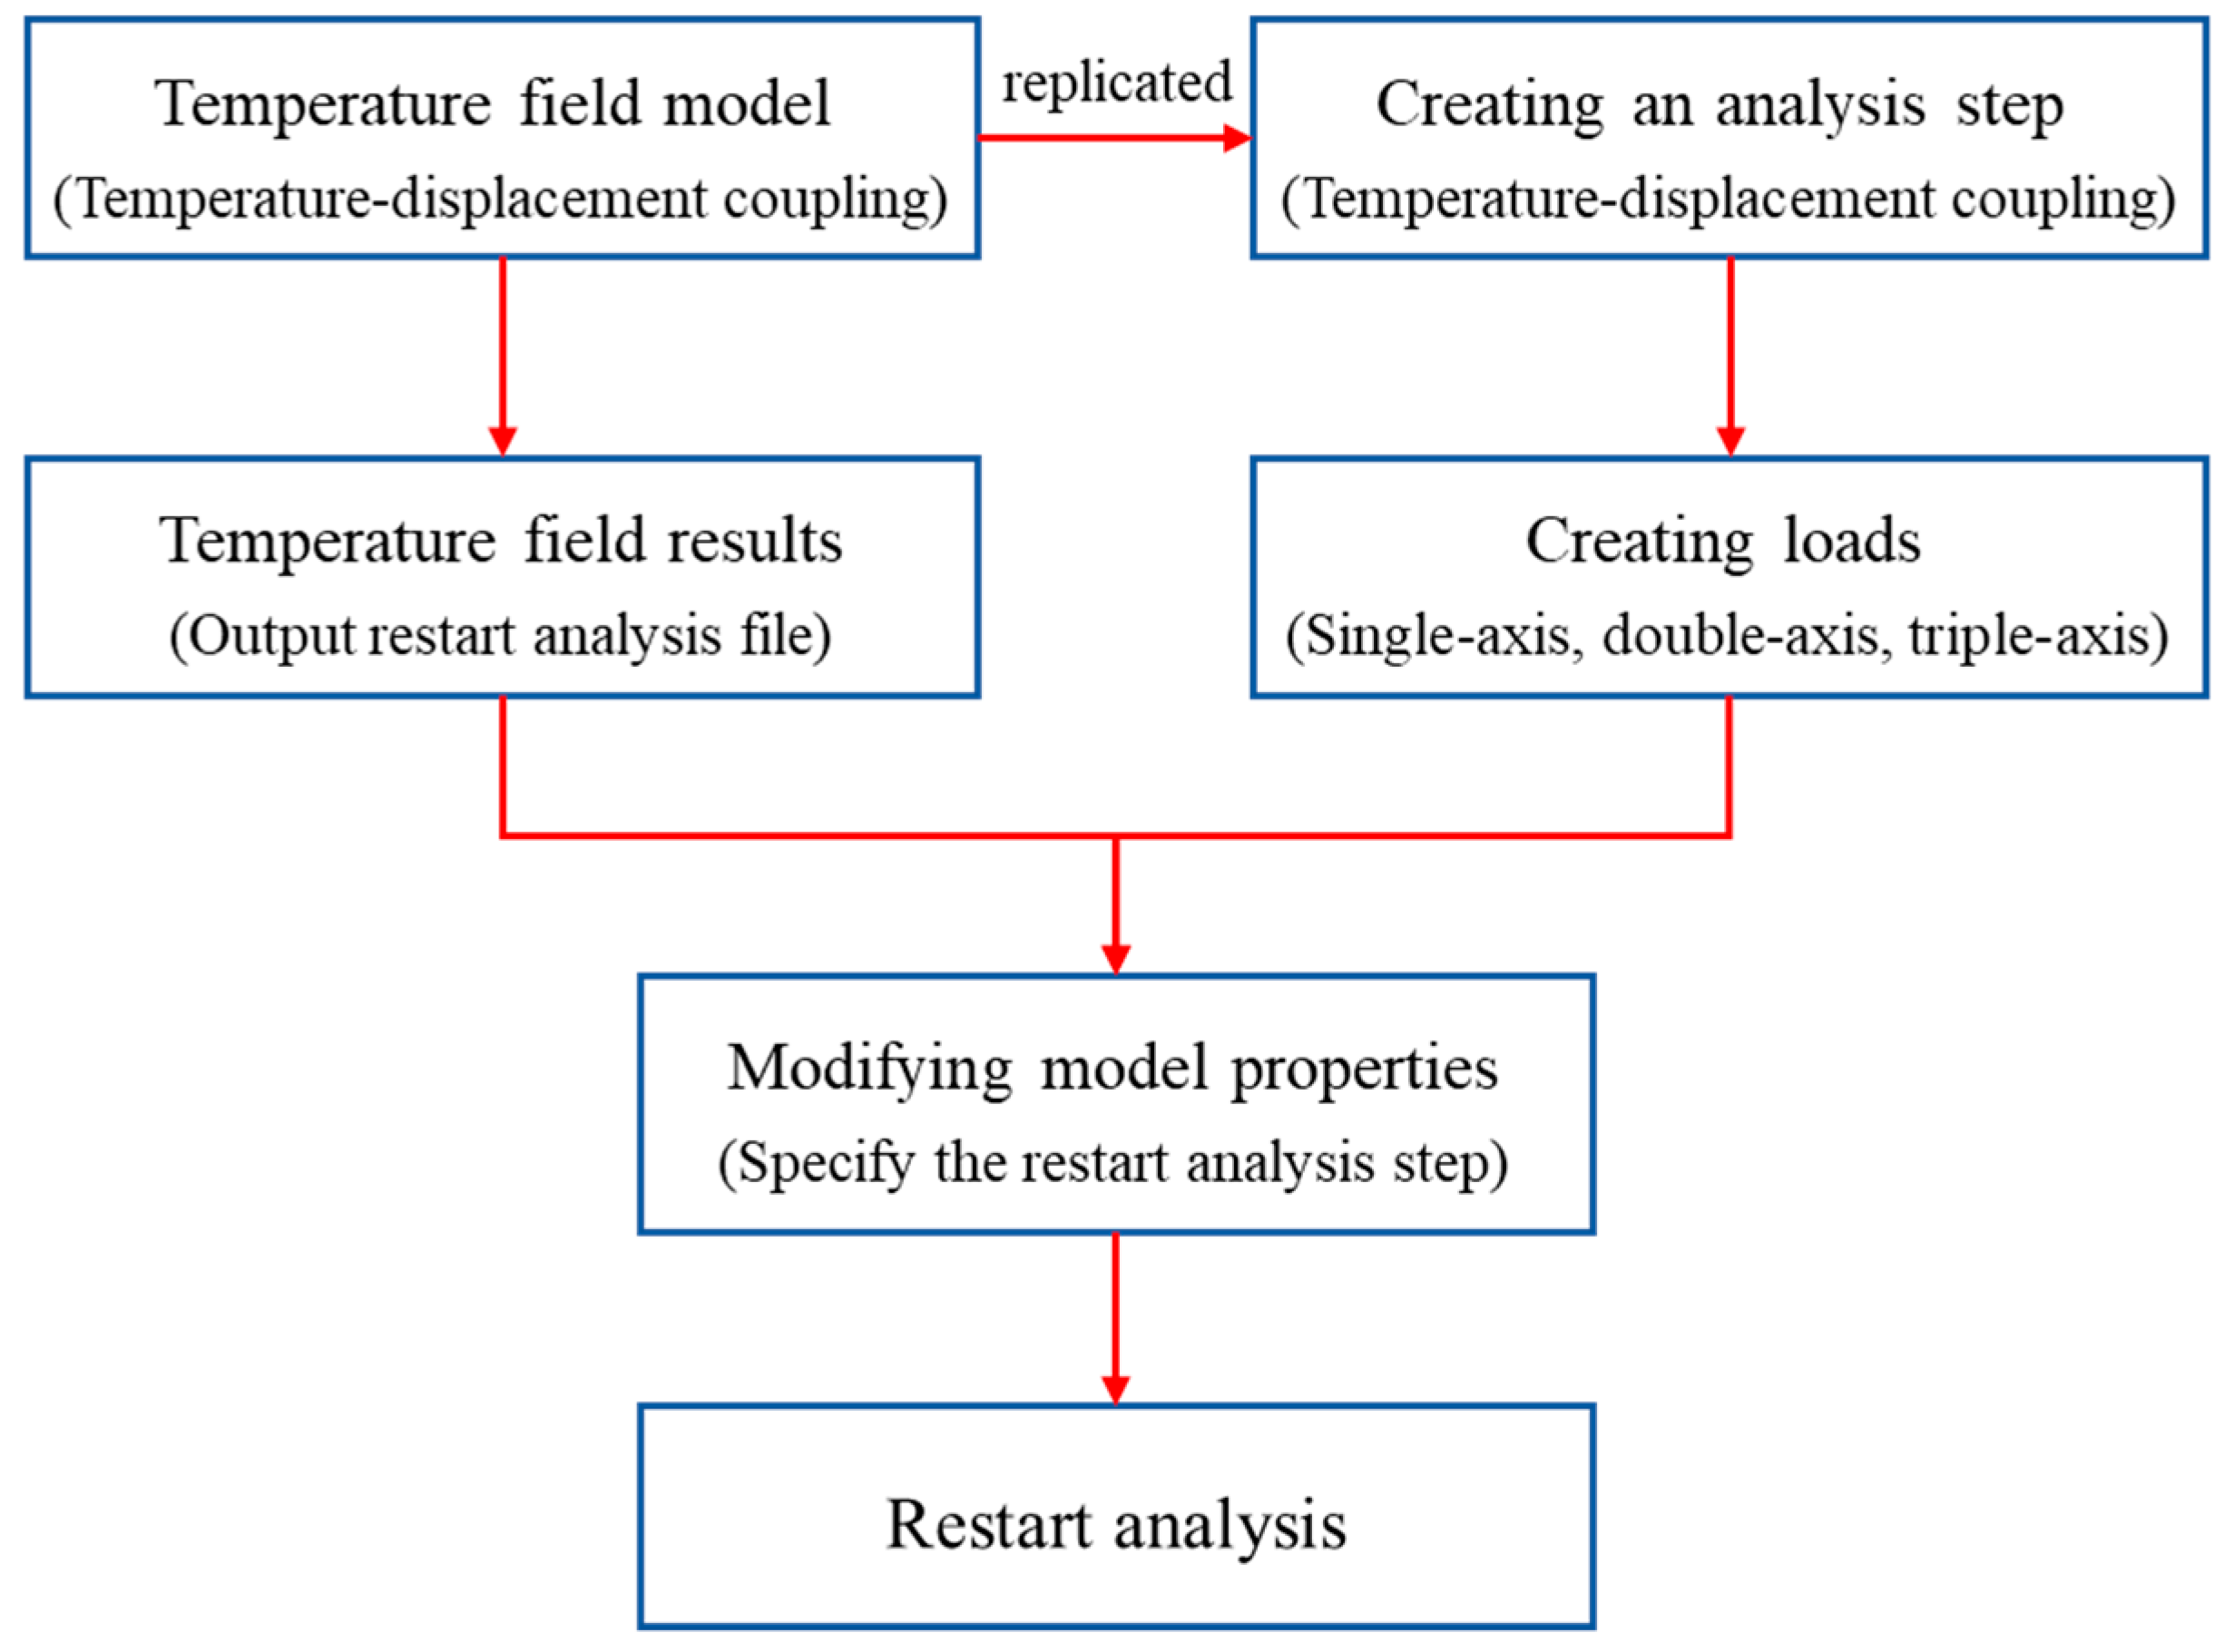
2.3. Temperature-Load Coupling

In order to study the structural mechanical response of pavements under temperature and wheel loads, a simultaneous coupled analysis of the temperature field and the load field is required. In this paper, the restart method in finite element software is used to realize this process, which is divided into three main steps [3]. Firstly, the output request for restart data is set up in the temperature stress calculation model. Secondly, the loading conditions are modified on the basis of the temperature stress field calculation model. Finally, submit a calculation assignment for computation. Calculation mainly includes nine kinds of working conditions, such as different temperature fields and different axle loads. Each condition includes 24 restart analysis models. The computational flow is shown in Figure 8.

3. Results and Discussion

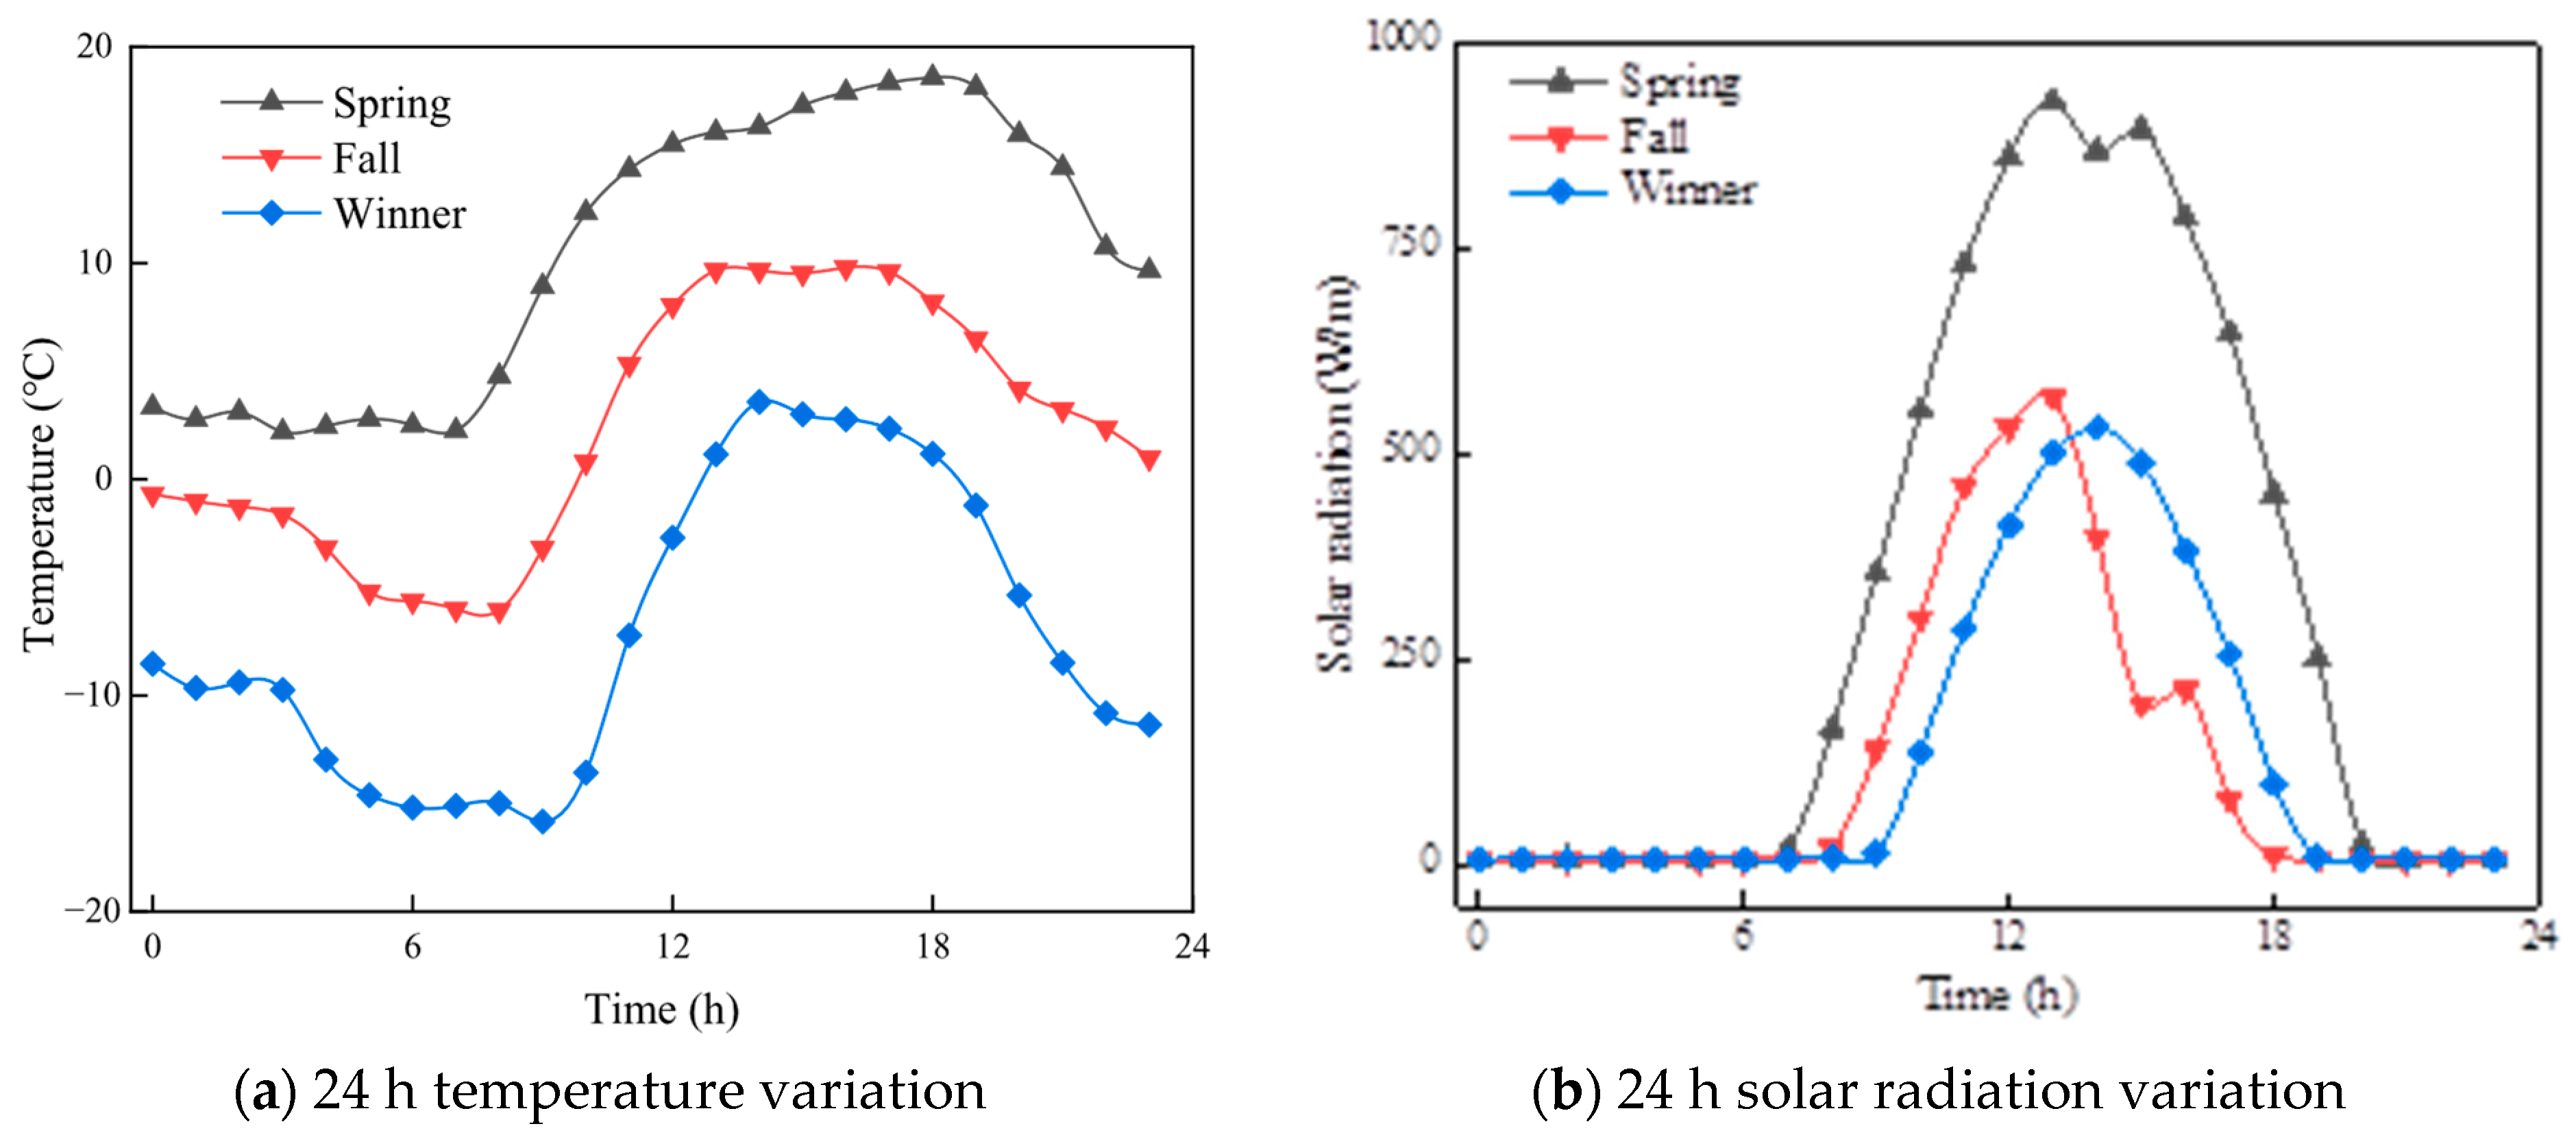
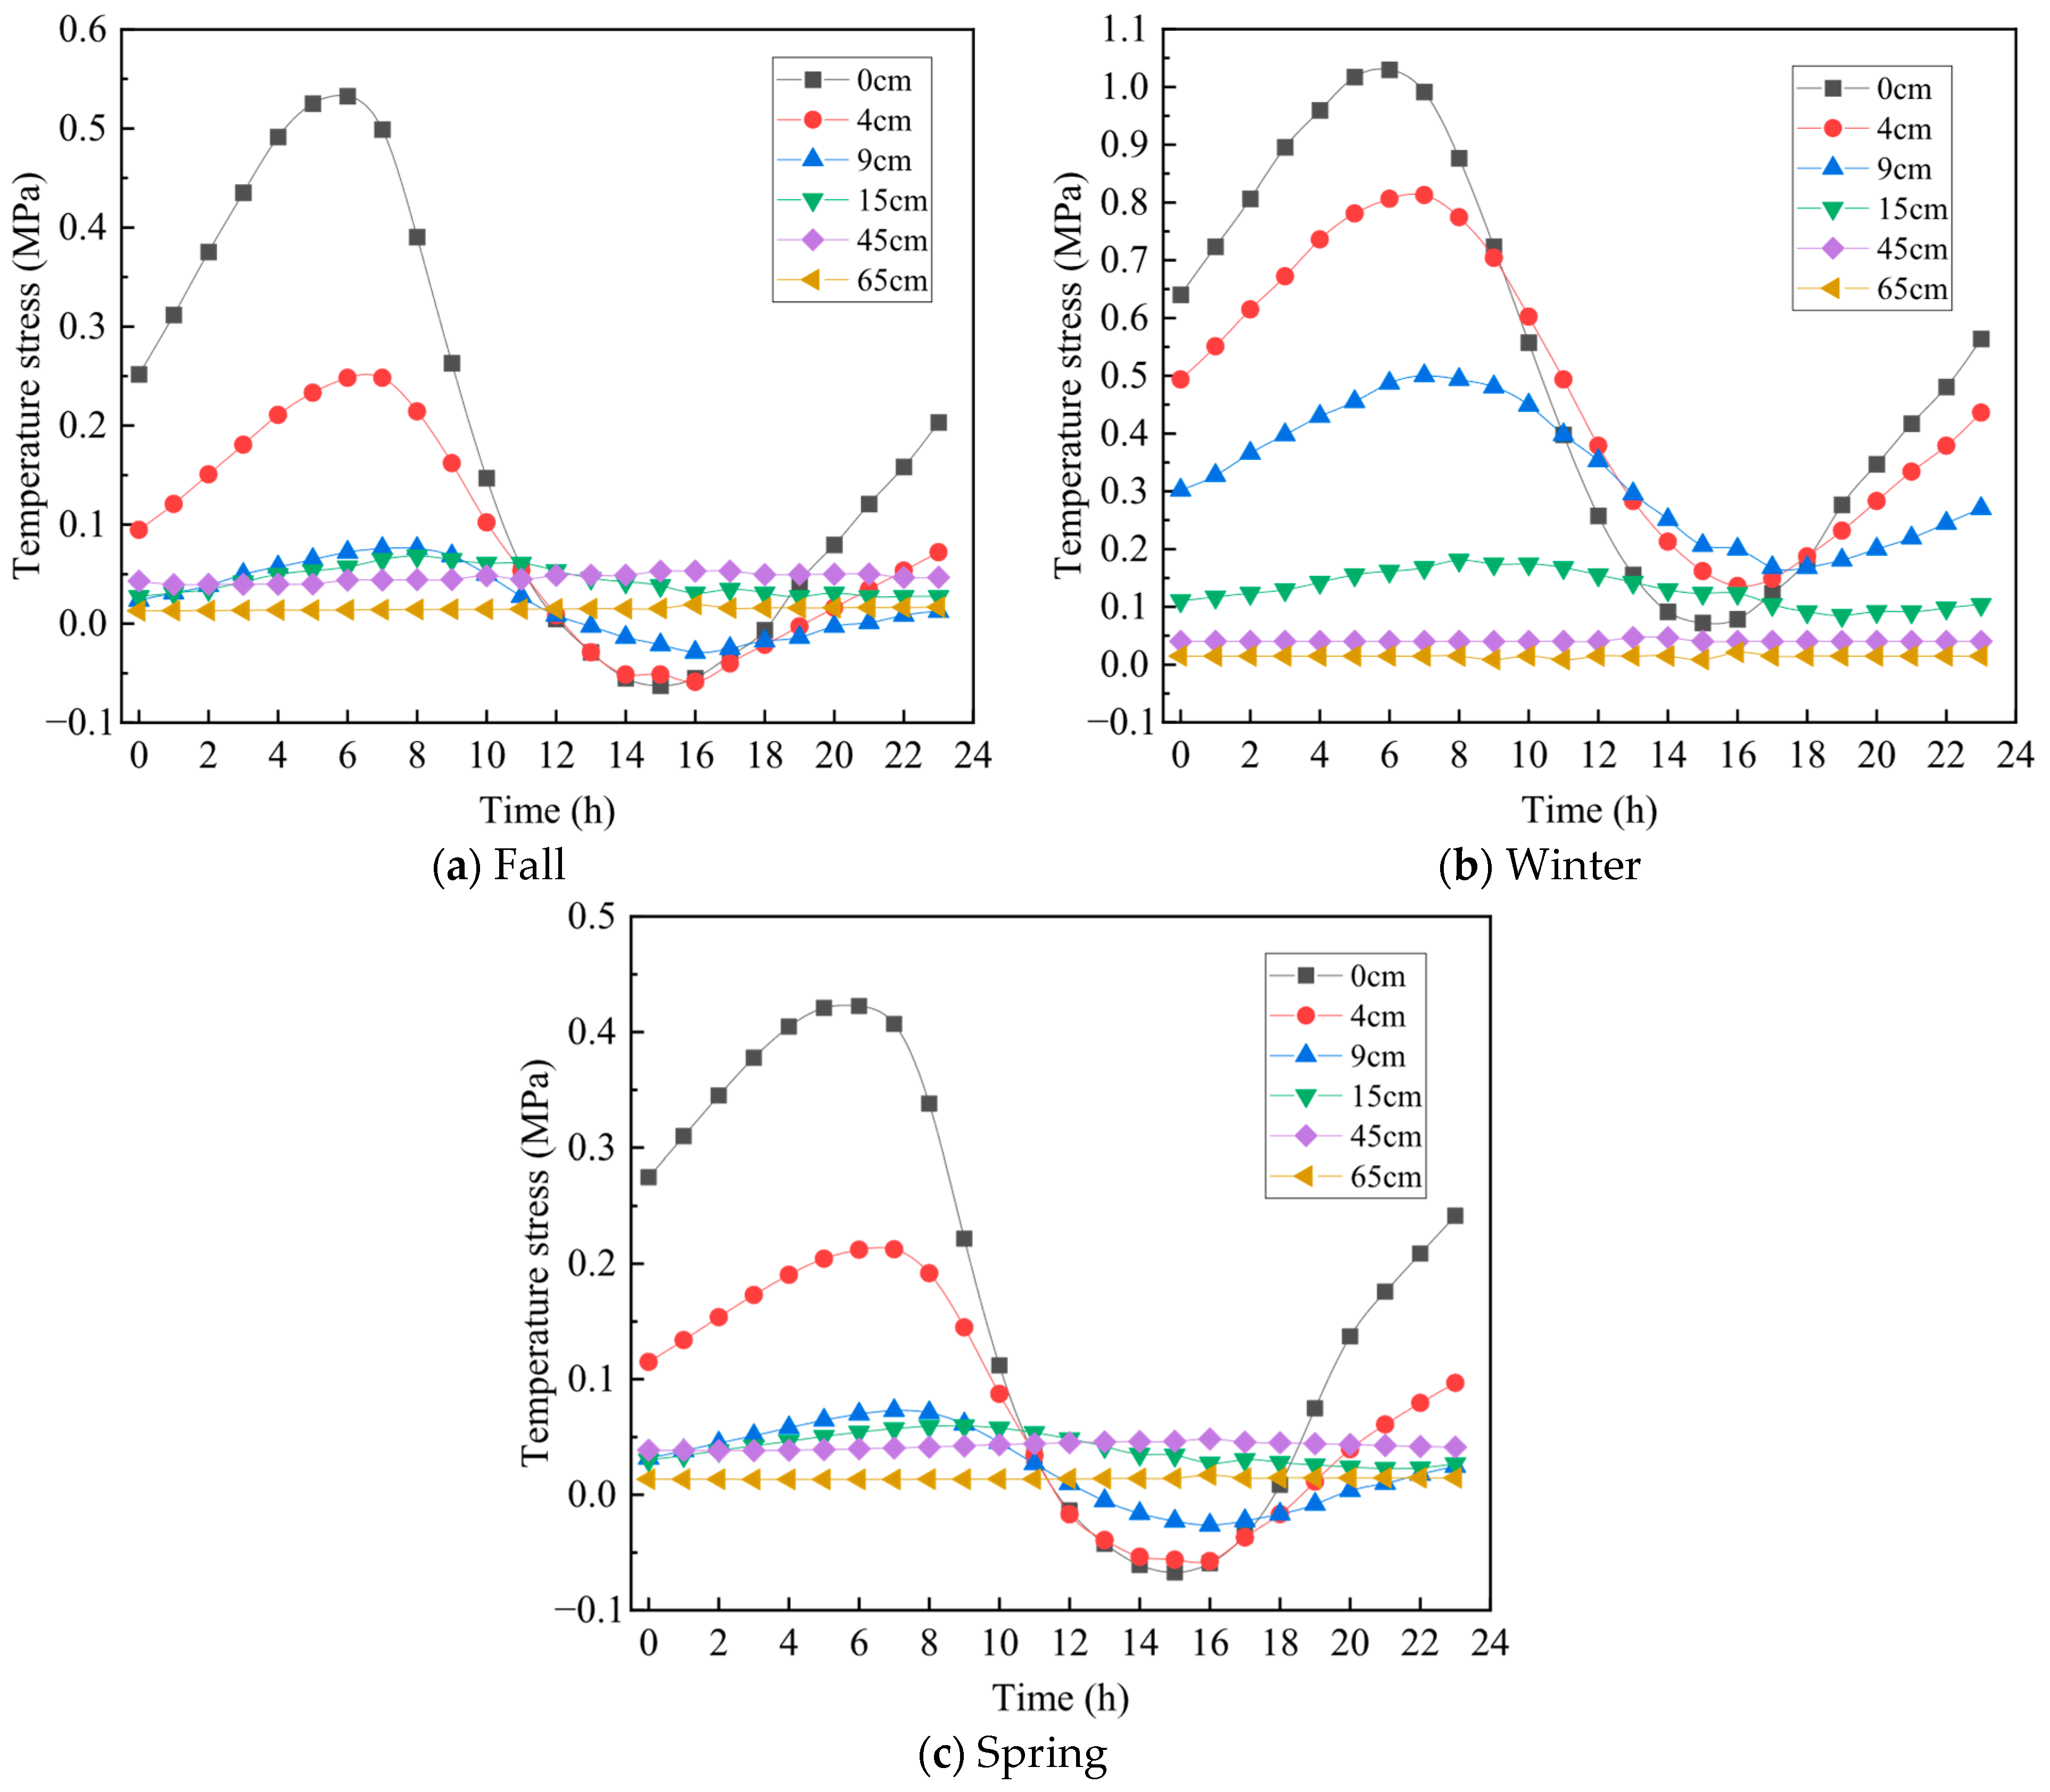
3.1. Temperature Stress of Pavement Under Typical Temperature Conditions

Based on the measured data from a meteorological station along the highway, the large temperature difference in spring and fall and the extreme low temperature difference in winter were selected as typical continuous variable temperature environments. Figure 9 shows the variation of air temperature and solar radiation over a 24 h period under different seasons in the region.
According to the asphalt pavement temperature field theory [27,28,29], a combination of solar radiation, air temperature, convective heat exchange, and effective radiation from the pavement is used to realize the temperature field simulation. The temperature changes in each structural layer of the pavement for 1 day under spring, fall, and winter temperature differences are shown in Figure 10.
From the figure, it can be seen that the temperature change trend of each structural layer under the three temperature difference conditions is basically the same. The magnitude of change in each structural layer decreases with depth. The magnitude of change in the surface layer was significant, while the base layer and below remained essentially stable. In addition, it can be seen that the pavement temperature field in the fall is mainly characterized by heat dissipation from the interior to the exterior. The internal temperature of the pavement structure reaches a minimum in winter and then exhibits heat absorption from the outside in spring.
The temperature gradient along the depth direction undergoes a change from negative to positive to negative over the course of the day. The temperature gradient was close to zero from 8:00 to 10:00 and reached a maximum by about 14:00 in the afternoon. The temperature gradient again approached 0 at ~18:00–22:00 p.m. The negative temperature gradient gradually increased and reached its maximum at ~5:00–6:00 a.m. The maximum positive temperature gradient was 90.62 °C/m, and the maximum negative temperature gradient was 68.54 °C/m. Both positive and negative temperature gradients reached their maximum in winter.
By introducing the temperature field into the mechanical model, the temperature stresses induced by different temperature differences in each structural layer of the pavement can be obtained. When temperature is a single factor, temperature stresses are mainly manifested as horizontal transverse tensile stresses in the pavement. And when the generated transverse tensile stress is greater than the ultimate tensile strength of the material, transverse cracks will be generated, extended, and expanded. The distribution patterns of tensile stresses in each structural layer of the pavement under continuous temperature change in spring, fall, and winter are shown in Figure 10.
As can be seen from Figure 11, the temperature stresses in each structural layer show a regular variation. Spring and fall seasons show alternating tensile and compressive stresses, and winter seasons show complete tension with little effect of temperature stresses at the base. In terms of daily variation, the road surface temperature stress reached its maximum value at 6:00 in all three seasons, and the maximum compressive stress appeared at 15:00. Combined with Figure 9, it can also be seen that the road surface temperature extremes and temperature stress extremes exhibit the same pattern of change. And the peak temperature and the peak stress appear to be lagged sequentially with depth, and the greater the depth, the longer the lag time. And the longer the lag time of the peak temperature stress is compared to the peak temperature with increasing depth.
Table 4 shows the maximum values of tensile stresses in each structural layer for the temperature difference between fall, winter, and spring. From Table 4, it can be seen that the tensile stresses in each structural layer at the three temperature differences tended to decrease gradually with increasing depth from the pavement. The tensile stresses in all other structural layers were significantly greater under winter temperature differences than under fall and spring temperature differences. In addition, the maximum tensile stresses on the road surface under the three seasons were 0.533 MPa, 1.028 MPa, and 0.422 MPa, respectively. It can be found that winter temperature differences are more severe in terms of pavement damage than fall and spring temperature differences. And the maximum tensile stress on the road surface reaches 1.0228 MPa in winter, and the pavement is very susceptible to cracking due to tension.

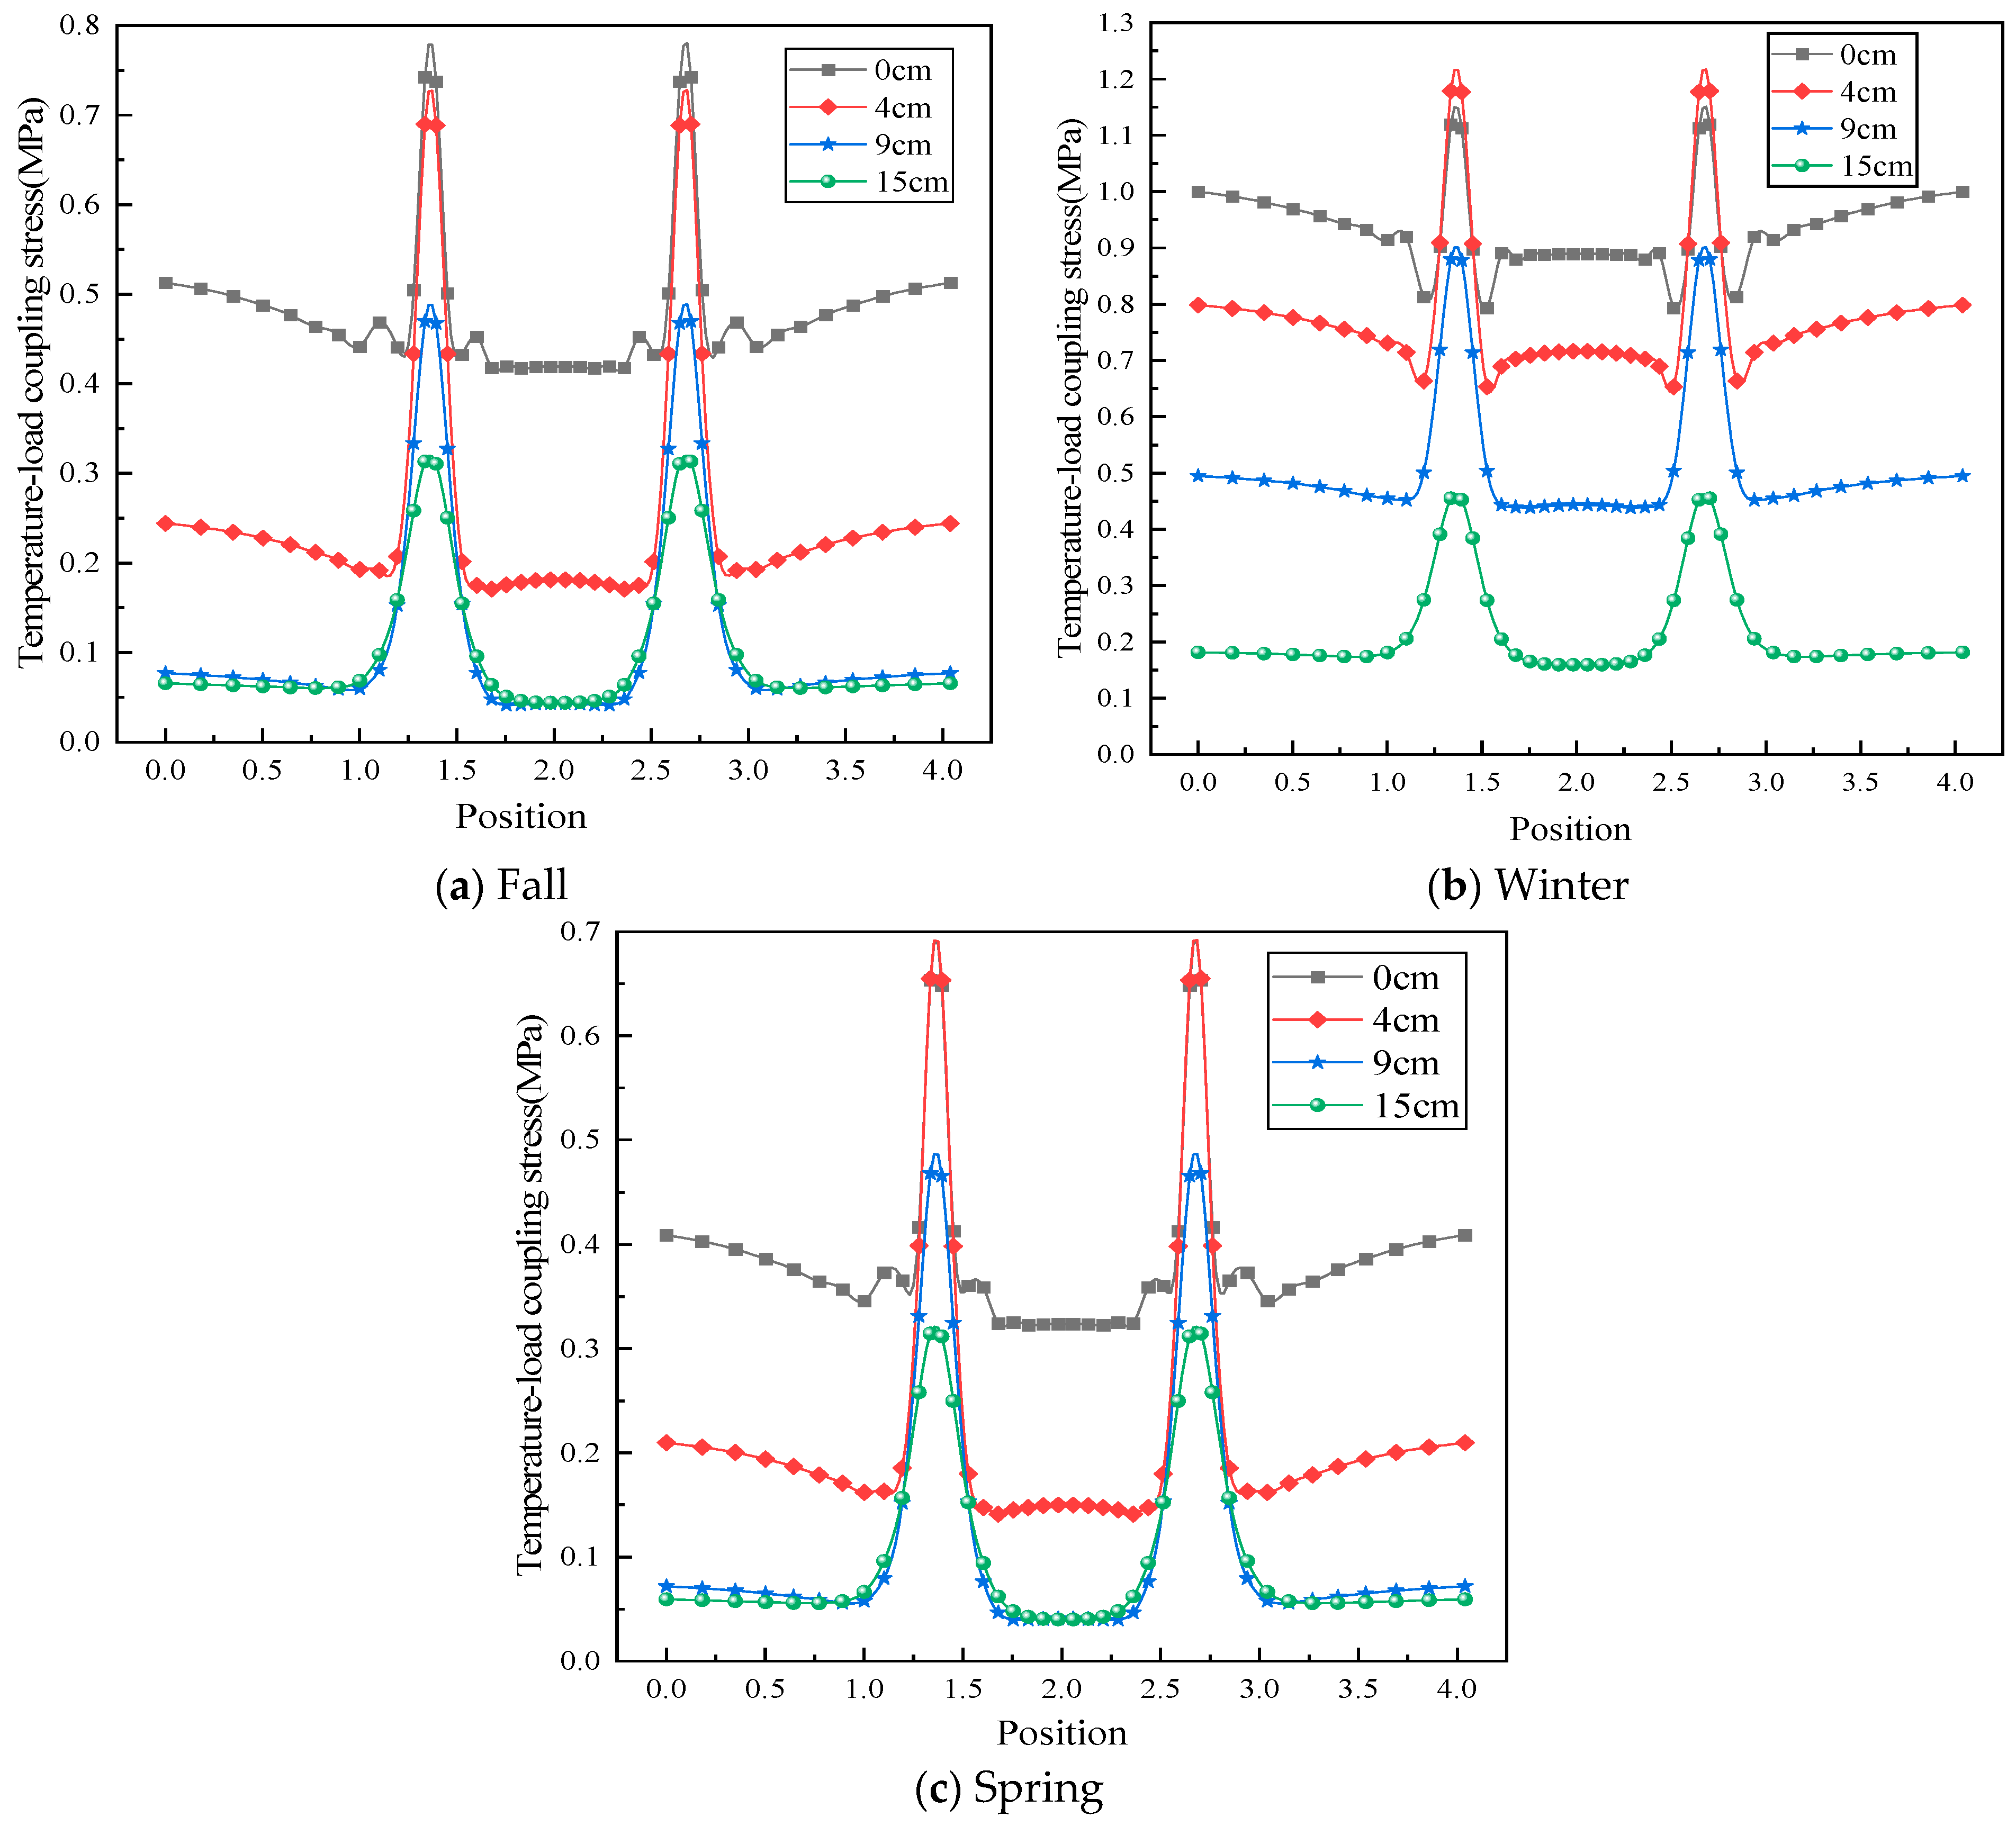
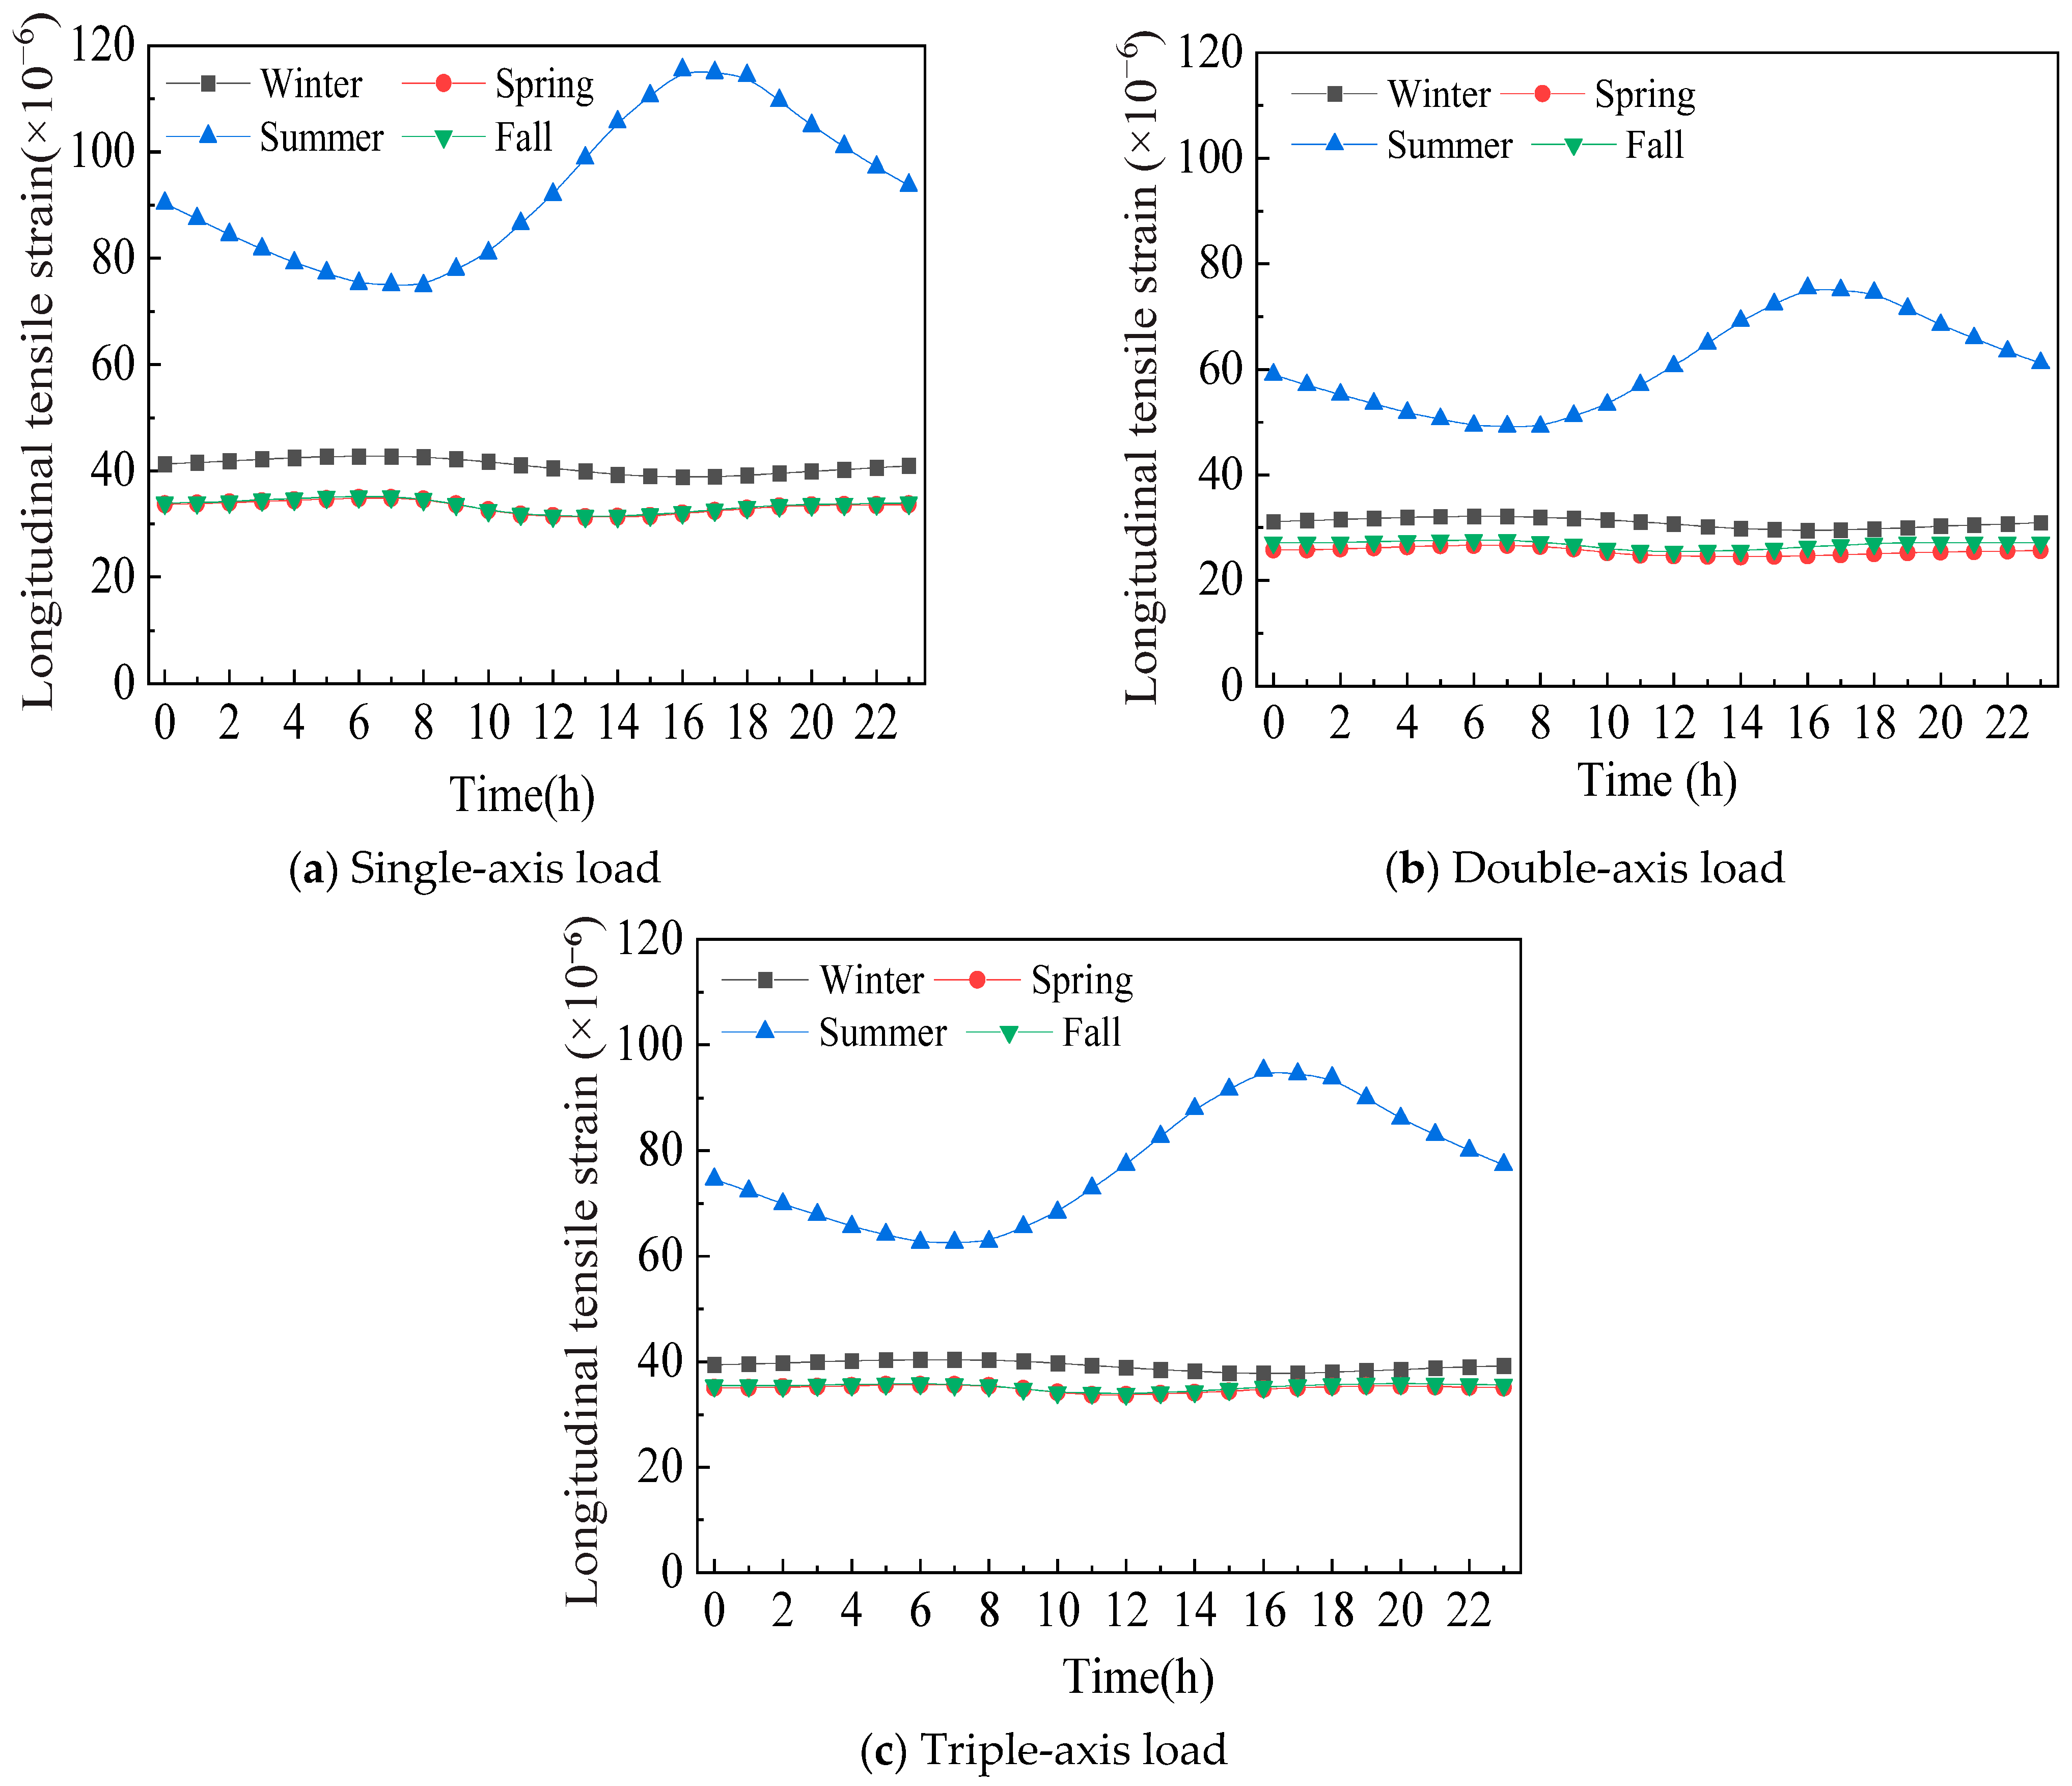
3.2. Load-Temperature Coupled Stress Analysis

3.2.1. Single-Axis Load-Temperature Coupling Stress

The single-axis load-temperature coupling stress variation rule is shown in Figure 12. It can be seen that the location of the maximum temperature-load coupling stress under single-axis loading occurs directly below the wheel load. As the depth of the road surface increases, the magnitude of the change in coupled stresses becomes smaller and less affected by temperature stresses.
A sub-high stress peak occurs in the upper layer at 20 cm from the edge of the wheel load with time variations. A comparison of the peaks of the second-highest stresses at different times of the day reveals that they are mainly related to road surface temperature stresses. The second-highest stress is largely absent in the winter when the temperature stress is low, and this stress occurs mainly in the high-temperature period between 12:00 and 16:00. The secondary high-stress peaks disappear with increasing depth. Outside of 30 cm from the edge of the wheel load, the time-dependent coupled stress action curves show different patterns. By comparing the coupling stress change curve and the temperature stress change curve, it is found that this change rule is caused by the temperature stress. When the temperature stress is manifested as compressive stress, the coupling stress curve at this location shows a gradual decrease, and vice versa, a decrease followed by an increase. It was also found that the temperature-load coupling stresses decreased the fastest from ~8:00–12:00 h under these three seasons.

3.2.2. Double-Axis Load-Temperature Coupling Stress

The change rule of the coupled load-temperature stress of the double axis is shown in Figure 13. The maximum temperature-load coupling stress under double-axis loading occurs below the wheel load. Secondary high stresses occur on both sides of the wheel load, which gradually disappear with depth. The temperature-load coupling stresses on the road surface in the region of the center of the two-wheel loads alternately change, with temperature stresses at different depths showing a tendency for concave and convex intermediate stress curves. At the time when the temperature stress becomes tensile stress in each layer, 30 cm away from the wheel load edge, the coupled stress action curves with time change show a direct decreasing tendency. By comparing the variation curves of coupling stress on the analyzed path in different seasons, it is found that the temperature stress has less influence on the coupling stress in spring and fall and more influence in winter.

3.2.3. Triple-Axis Load-Temperature Coupled Stress

The rule of change of the coupled load-temperature stress of the triple axle is shown in Figure 14. The maximum temperature-load coupling stresses under triple-axis loading occur below the tire loads on both sides, and the next highest stresses occur at 10 cm on either side of the wheel loads. As the temperature increases, the location of the next highest stress gradually moves closer to the center of the wheel load. At the same time, a stress peak occurs again 25 cm on either side of the center wheel load, but it is relatively small. In the two regions between the three-wheel loads, there is no significant trend in the temperature-load coupling stresses. When the temperature stresses in each layer become tensile stresses, the coupling stresses on the outside of the wheel loads on both sides of the triple axis show a tendency to decrease gradually. In other cases, the coupling stresses are shown to increase and then decrease as the coupling stresses are farther away from the wheel load until they approach the temperature stresses. With seasonal changes, the temperature stress affects the temperature-load coupling stress to the same extent as the other axial load patterns.

3.3. Evaluation of Environmental Effects

3.3.1. Environmental Effects of Single-Axis Loading

By comparing the temperature stress and coupling stress in different seasons, it is found that the change rule of coupling stress and temperature stress with time is basically the same, where the peak coupling stresses lag with depth. The maximum temperature stresses and coupling stresses at different depths are compared, respectively, and the results are shown in Table 5.
As can be seen from Table 5, the coupling stresses from the road surface along the depth direction show an increase and then a decrease in the spring and winter seasons. It reaches its maximum at 4 cm of road surface. And the influence of temperature stress gradually becomes smaller with increasing depth, and the contribution of traveling load action gradually increases. A comparison of the relative magnitude of temperature stress and coupling stress reveals that with the change of annual seasons, the law of action of temperature stress shows an increase and then a decrease from fall to spring. In addition, the effect of temperature stress on the coupling stress in the spring and fall seasons shows a tendency to decrease and then increase. The temperature stress at 9 cm below the road surface had the least effect on the coupling stress. It shows a gradual decrease in winter. Overall, the degree of temperature influence on the road surface along the depth direction is 66.0%, 38.7%, 24.7%, and 21.3% in that order.

3.3.2. Environmental Effects of Double-Axis Loading

Table 6 shows the comparison of temperature stresses and coupling stresses in different seasons under duplex loading. As can be seen from Table 6, the temperature-load coupling stresses show an increase and then a decrease in the depth direction in spring and winter, and a gradual decrease in the fall. The degree of influence of temperature stresses on temperature-load coupling stresses shows a gradual decrease in winter along the depth direction. The effect of temperature stress on coupling stress at the road surface can reach 92%. The spring and fall seasons showed a decrease followed by an increase, with the least effect at 9 cm. Overall, the degree of temperature influence on the road surface along the depth direction is 76.3%, 45.7%, 30.0%, and 26.3%, in that order.

3.3.3. Environmental Effects of Triple-Axis Loading

Table 7 shows the comparison of temperature stresses and coupling stresses in different seasons under triple-axis loading. From Table 7, the temperature-load coupling stresses show an increase, followed by a decrease in the depth direction in spring and winter seasons. The maximum depth is 4 cm below the road surface. It shows a gradual decrease in fall. Along the depth direction, the degree of influence of temperature stress on the coupling stress manifestation shows a gradual decrease in winter and a decrease followed by an increase in spring and fall. A minimum of 14% is reached at 9 cm. Overall, the degree of temperature influence on the road surface along the depth direction is 69.3%, 41.3%, 26.7%, and 23.7%, in that order.

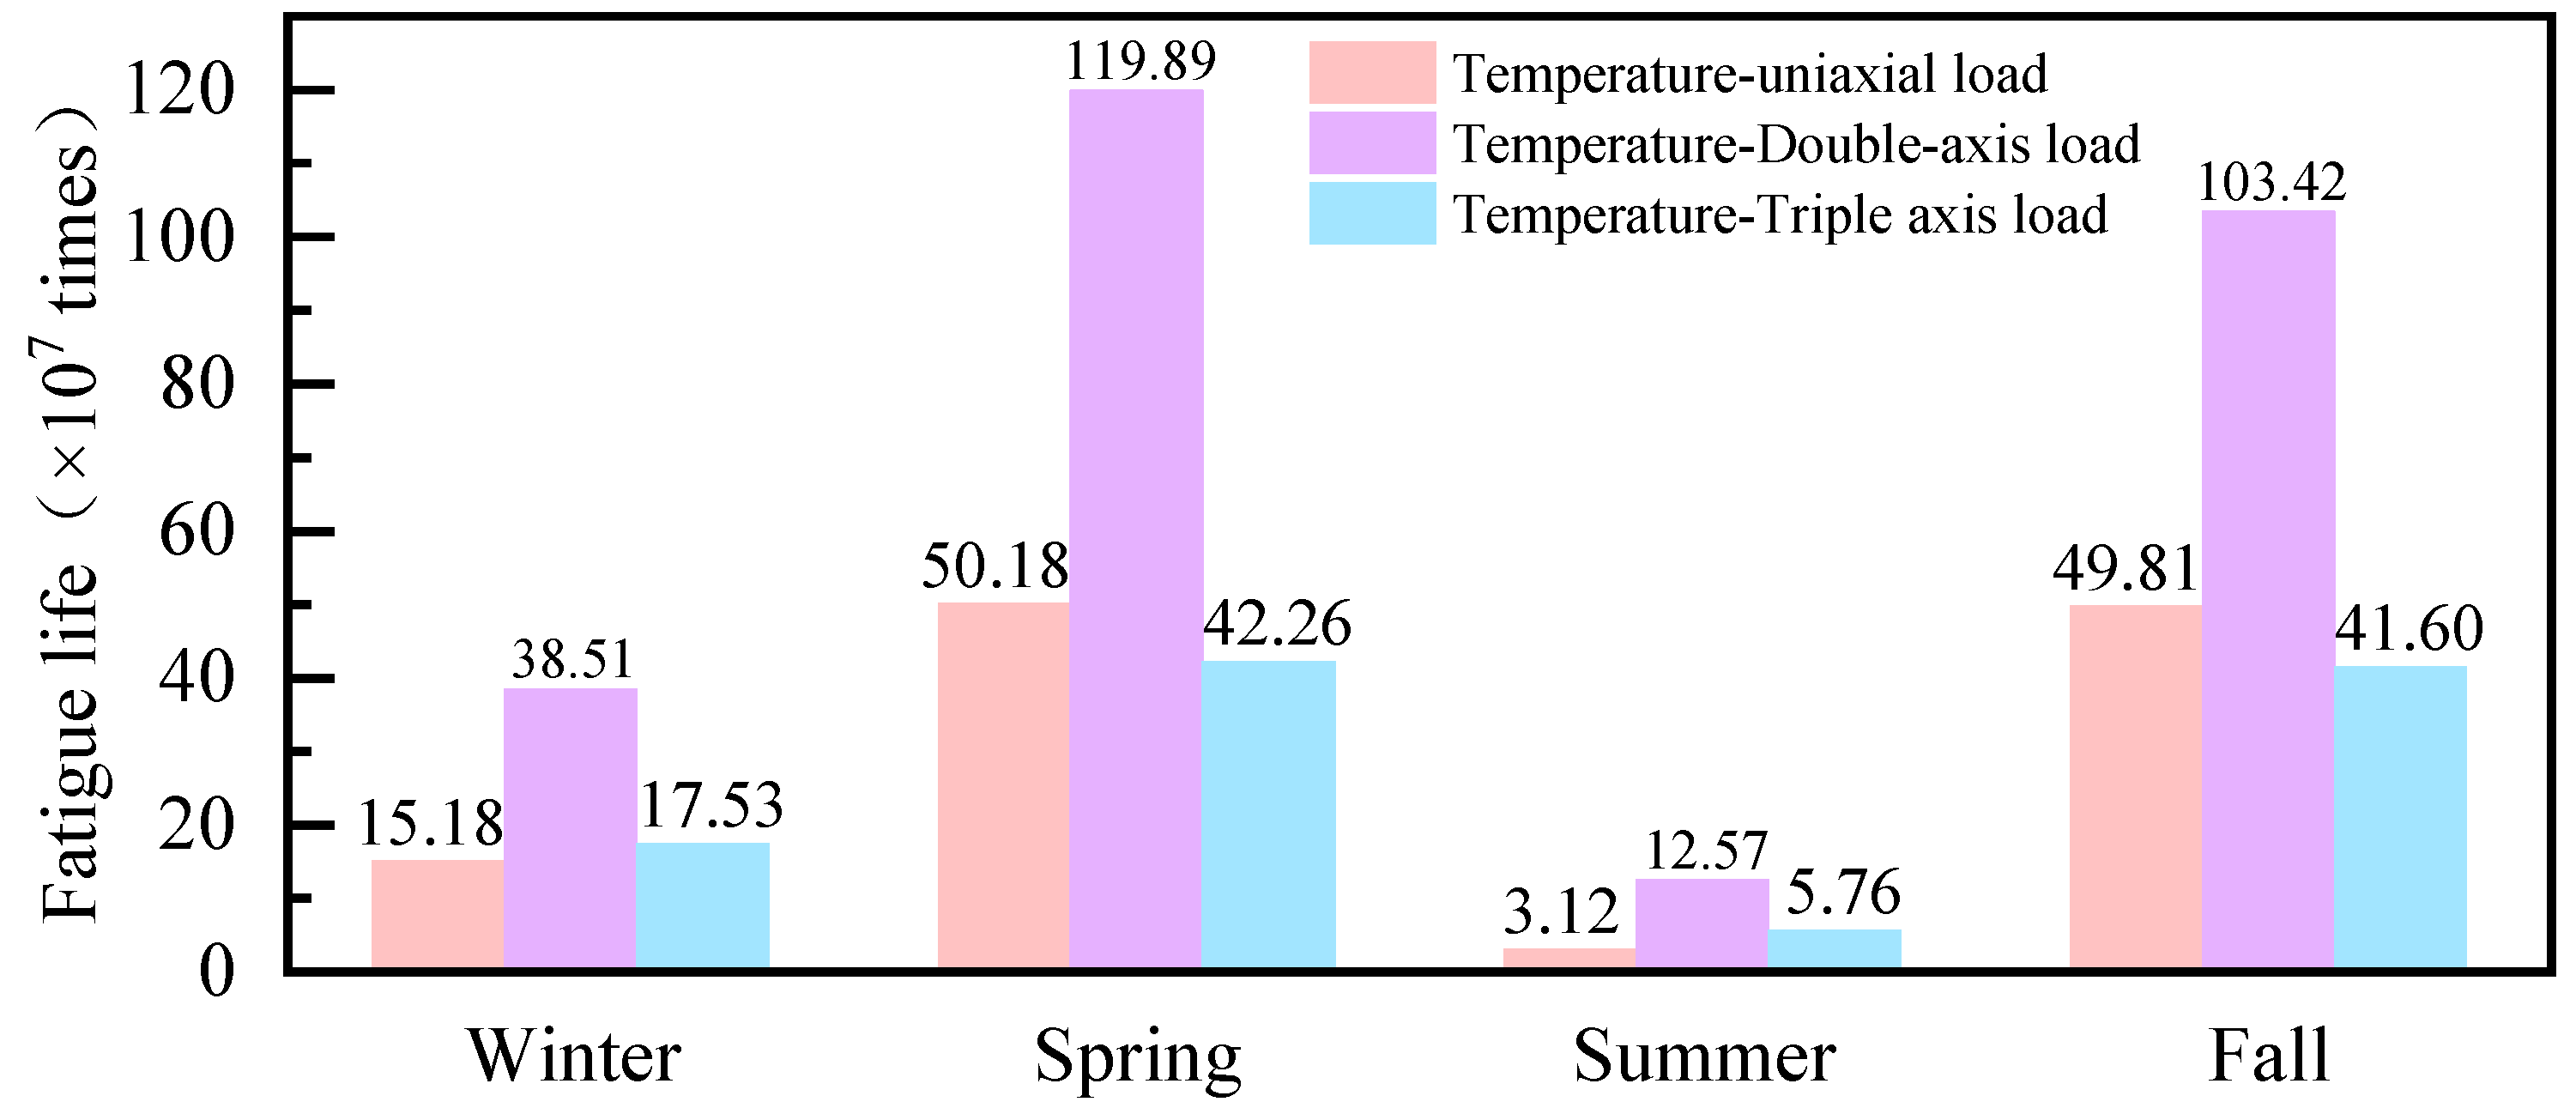
3.4. Fatigue Life Analysis of Pavement Under Coupling

In order to ensure that the asphalt pavement structure has good serviceability and durability, the asphalt pavement design methods in many countries take the fatigue characteristics of the pavement as the basic design principle [30,31]. Therefore, it is important to study the fatigue performance of asphalt pavement structures under natural environmental conditions and traffic loads. In this study, the fatigue life equation from the American Ground Asphalt Association’s pavement design methodology is used [32,33], which is modeled as:
N f = 0.2659 × 10 4.84 × V F A 0.69 × 4.325 × 10 3 × ε 3.291 × E 0.854
where N f represents the fatigue life of asphalt mixtures; ε represents bending and tensile strains; E represents the dynamic modulus; VFA is asphalt saturation; and 0.65 is taken here.
Combined with the above finite-element model, the representative wheel load pressures of different axle types are 0.8221 MPa, 0.6216 MPa, and 0.7520 MPa, respectively. The longitudinal tensile strains at the bottom of the asphalt layer for different seasons were calculated and shown in Figure 15.
As can be seen from Figure 15, the longitudinal tensile strain at the bottom of the asphalt layer under different temperature-axial load couplings is shown to be the largest in the summer and smaller in the other three seasons. The winter strain was slightly higher than the spring and fall seasons. The fatigue life of asphalt pavements was calculated using representative strains under different temperature-axial load couplings, respectively. The results are shown in Figure 16.
From the fatigue life of Figure 16, it can be seen that from the coupling effect of different axle types, single and triple axles have a greater impact on the fatigue effect of the pavement, and double axles have a smaller impact. The reason for this is mainly related to the axle loads in the axle load statistics section. In terms of different seasonal variations, coupling has the greatest effect on pavement fatigue life in summer, followed by winter, and the least effect in spring and fall.

4. Conclusions

In this study, the stress response under the most unfavorable environment and axial load is calculated by establishing finite-element models under different axial loads, and the environmental effects are evaluated. The main conclusions are as follows:
(1)
The temperature stresses in each structural layer show regular variations, with complete tensile stresses in winter and alternating tensile and compressive stresses in spring and fall.
(2)
The winter temperature difference is more serious than the fall and spring temperature differences in terms of damage to the pavement, and since the maximum tensile stress on the road surface in winter reaches 1.0228 MPa, the pavement is very susceptible to cracking due to tension.
(3)
The temperature-load coupling stress varies periodically, and the temperature stress has less influence on the coupling stress in spring and fall and more influence in winter.
(4)
Under traveling load, the coupling stress and its influence range decrease with the increase in depth, while the farther away from the wheel load position, the smaller the traveling load disturbance. The maximum coupling stresses appear directly below the wheel loads under single-axle and double-axle loads and below the wheel loads on both sides under triple-axle loads.
(5)
Under the most unfavorable loading conditions, the degree of influence of environmental effects along the depth direction gradually decreases in winter, and it first decreases and then increases in spring and autumn. Overall, the difference in the degree of environmental effects along the depth direction under different axle loads is not significant, which is 70.53%, 41.90%, 27.13%, and 23.77%, in order.

Author Contributions

Conceptualization, Y.G.; Data curation, Z.L.; Methodology, Y.L.; Funding acquisition, L.Z. and Y.G.; Project administration, Y.G. and Y.D.; Resources, Y.D.; Writing—original draft, Z.L. and Y.L.; Supervision, B.L. All authors have read and agreed to the published version of the manuscript.

Funding

The authors gratefully acknowledge the financial support received from the Innovation Group in Fundamental Research (25JRRA145), Ningxia Hui Autonomous Region Key R&D Program (2023BEG02044), the National Natural Science Foundation of China (52468065), the Industry Support and Guidance Project by University and College in Gansu Province (2020C-13), and the Gansu Science and Technology Major Project (22ZD6GA010).

Institutional Review Board Statement

Not applicable.

Informed Consent Statement

Not applicable.

Data Availability Statement

The original contributions presented in this study are included in the article. Further inquiries can be directed to the corresponding authors.

Conflicts of Interest

The authors declare no conflict of interest.

References

  1. Jing, C.; Zhang, J.; Song, B. An innovative evaluation method for performance of in-service asphalt pavement with semi-rigid base. Constr. Build. Mater. 2020, 235, 117376. [Google Scholar] [CrossRef]
  2. Shi, Z.; Yue, J.; Xu, L.; Wang, X. Peridynamics for Fracture Analysis of Reflective Cracks in Semi-Rigid Base Asphalt Pavement. Appl. Sci. 2022, 12, 3486. [Google Scholar] [CrossRef]
  3. Wang, X.; Zhong, Y. Reflective crack in semi-rigid base asphalt pavement under temperature-traffic coupled dynamics using XFEM. Constr. Build. Mater. 2019, 214, 280–289. [Google Scholar] [CrossRef]
  4. Millien, A.; Dragomir, M.L.; Wendling, L.; Petit, C.; Iliescu, M. Geogrid Interlayer Performance in Pavements: Tensile-Bending Test for Crack Propagation. In 7th RILEM International Conference on Cracking in Pavements; Scarpas, A., Kringos, N., Al-Qadi, I., Loizos, A., Eds.; Springer: Dordrecht, The Netherlands, 2012; pp. 1209–1218. [Google Scholar]
  5. Assogba, O.C.; Tan, Y.; Sun, Z.; Lushinga, N.; Bin, Z. Effect of vehicle speed and overload on dynamic response of semi-rigid base asphalt pavement. Road Mater. Pavement Des. 2021, 22, 572–602. [Google Scholar] [CrossRef]
  6. Shan, J.; Shao, H.; Li, Q.; Sun, P. Comparison of Real Response and Theoretical Modeling of Pavement with Thick Asphalt Layers under Heavy Traffic Load. Adv. Civ. Eng. 2019, 2019, 8097890. [Google Scholar] [CrossRef]
  7. Chen, X.; Zhang, J.; Wang, X. Full-scale field testing on a highway composite pavement dynamic responses. Transp. Geotech. 2015, 4, 13–27. [Google Scholar] [CrossRef]
  8. Barriera, M.; Lebental, B.; Pouget, S. Towards road pavement response under moving loads. Road Mater. Pavement Des. 2019, 20 (Suppl. 1), S480–S499. [Google Scholar] [CrossRef]
  9. Beskou, N.D.; Hatzigeorgiou, G.D.; Theodorakopoulos, D.D. Dynamic inelastic analysis of 3-D flexible pavements under moving vehicles: A unified FEM treatment. Soil Dyn. Earthq. Eng. 2016, 90, 420–431. [Google Scholar] [CrossRef]
  10. Bai, T.; Cheng, Z.; Hu, X.; Fuentes, L.; Walubita, L.F. Viscoelastic modelling of an asphalt pavement based on actual tire-pavement contact pressure. Road Mater. Pavement Des. 2021, 22, 2458–2477. [Google Scholar] [CrossRef]
  11. Zhao, X.; Shen, A.; Ma, B. Temperature response of asphalt pavement to low temperatures and large temperature differences. Int. J. Pavement Eng. 2020, 21, 49–62. [Google Scholar] [CrossRef]
  12. Wang, X.; Ma, X. Responses of Semi-Rigid Base Asphalt Pavement with Interlayer Contact Bonding Model. Adv. Civ. Eng. 2020, 2020, 8841139. [Google Scholar] [CrossRef]
  13. Kettil, P.; Engström, G.; Wiberg, N.E. Coupled hydro-mechanical wave propagation in road structures. Comput. Struct. 2005, 83, 1719–1729. [Google Scholar] [CrossRef]
  14. Xue, Q.; Liu, L.; Zhao, Y.; Chen, Y.-J.; Li, J.-S. Dynamic behavior of asphalt pavement structure under temperature-stress coupled loading. Appl. Therm. Eng. 2013, 53, 1–7. [Google Scholar] [CrossRef]
  15. Chen, L.; Zhao, X.; Qian, Z.; Li, X. Mechanical behavior of asphalt pavement on steel-concrete composite beam bridge under temperature-load coupling. Constr. Build. Mater. 2023, 403, 133099. [Google Scholar] [CrossRef]
  16. Yang, J.; Tan, L.; Qi, X.; Zhang, C. Investigation on permanent deformation in steel-concrete composite beam bridge deck pavement under temperature-load coupling effect. Front. Mater. 2023, 10, 1284928. [Google Scholar] [CrossRef]
  17. Wang, X.; Li, K.; Zhong, Y.; Xu, Q.; Li, C. XFEM simulation of reflective crack in asphalt pavement structure under cyclic temperature. Constr. Build. Mater. 2018, 189, 1035–1044. [Google Scholar] [CrossRef]
  18. Wang, H.; Wu, Y.; Yang, J.; Wang, H. Numerical Simulation on Reflective Cracking Behavior of Asphalt Pavement. Appl. Sci. 2021, 11, 7990. [Google Scholar] [CrossRef]
  19. Erlingsson, S. Impact of Water on the Response and Performance of a Pavement Structure in an Accelerated Test. Road Mater. Pavement Des. 2010, 11, 863–880. [Google Scholar] [CrossRef]
  20. Dan, H.-C.; He, L.-H.; Zhao, L.-H.; Chen, J.-Q. Coupled hydro-mechanical response of saturated asphalt pavement under moving traffic load. Int. J. Pavement Eng. 2015, 16, 125–143. [Google Scholar] [CrossRef]
  21. Ding, Y.; Wang, H. Evaluation of Hydroplaning Risk on Permeable Friction Course using Tire–Water–Pavement Interaction Model. Transp. Res. Rec. 2018, 2672, 408–417. [Google Scholar] [CrossRef]
  22. Biswal, D.R.; Sahoo, U.C.; Dash, S.R. Structural response of an inverted pavement with stabilised base by numerical approach considering isotropic and anisotropic properties of unbound layers. Road Mater. Pavement Des. 2020, 21, 2160–2179. [Google Scholar] [CrossRef]
  23. Cortes, D.D.; Santamarina, J.C. The LaGrange case history: Inverted pavement system characterisation and preliminary numerical analyses. Int. J. Pavement Eng. 2013, 14, 463–471. [Google Scholar] [CrossRef]
  24. Jiang, X.; Zhang, M.; Xiao, R.; Polaczyk, P.; Bai, Y.; Huang, B. An investigation of structural responses of inverted pavements by numerical approaches considering nonlinear stress-dependent properties of unbound aggregate layer. Constr. Build. Mater. 2021, 303, 124505. [Google Scholar] [CrossRef]
  25. Sahoo, U.C.; Reddy, K.S. Effect of nonlinearity in granular layer on critical pavement responses of low volume roads. Int. J. Pavement Res. Technol. 2010, 3, 320. [Google Scholar]
  26. Saad, B.; Mitri, H.; Poorooshasb, H. Three-dimensional dynamic analysis of flexible conventional pavement foundation. J. Transp. Eng. 2005, 131, 460–469. [Google Scholar] [CrossRef]
  27. Allen, R.G.; Trezza, R.; Tasumi, M. Analytical integrated functions for daily solar radiation on slopes. Agric. For. Meteorol. 2006, 139, 55–73. [Google Scholar] [CrossRef]
  28. Aziz, A. A similarity solution for laminar thermal boundary layer over a flat plate with a convective surface boundary condition. Commun. Nonlinear Sci. Numer. Simul. 2009, 14, 1064–1068. [Google Scholar] [CrossRef]
  29. Kang, F.; Li, J.; Zhao, S.; Wang, Y. Structural health monitoring of concrete dams using long-term air temperature for thermal effect simulation. Eng. Struct. 2019, 180, 642–653. [Google Scholar] [CrossRef]
  30. Lv, S.; Yuan, J.; Peng, X.; Zhang, N.; Liu, H.; Luo, X. A structural design for semi-rigid base asphalt pavement based on modulus optimization. Constr. Build. Mater. 2021, 302, 124216. [Google Scholar] [CrossRef]
  31. Zhao, Y.; Alae, M.; Fu, G. Investigation of mechanisms of top-down fatigue cracking of asphalt pavement. Road Mater. Pavement Des. 2018, 19, 1436–1447. [Google Scholar] [CrossRef]
  32. Yu, J.; Tsai, B.-W.; Zhang, X.; Monismith, C. Development of asphalt pavement fatigue cracking prediction model based on loading mode transfer function. Road Mater. Pavement Des. 2012, 13, 501–517. [Google Scholar] [CrossRef]
  33. Norouzi, A.; Kim, D.; Kim, Y.R. Numerical evaluation of pavement design parameters for the fatigue cracking and rutting performance of asphalt pavements. Mater. Struct. 2016, 49, 3619–3634. [Google Scholar] [CrossRef]
Figure 1. The 3D model of pavement structure is divided into several cells.
Applsci 15 07441 g001
Figure 2. Schematic diagram of different axle loads.
Applsci 15 07441 g002
Figure 3. Tire grounding schematic.
Applsci 15 07441 g003
Figure 4. Triangular wave load form.
Applsci 15 07441 g004
Figure 5. Schematic diagram of single-axis load meshing.
Applsci 15 07441 g005
Figure 6. Schematic diagram of double-axis load meshing.
Applsci 15 07441 g006
Figure 7. Schematic diagram of triple-axis load meshing.
Applsci 15 07441 g007
Figure 8. Restart analysis flowchart.
Applsci 15 07441 g008
Figure 9. Changes in air temperature and solar radiation under typical temperature differences.
Applsci 15 07441 g009
Figure 10. Temperature changes in each structural layer of the pavement.
Applsci 15 07441 g010
Figure 11. Temperature stress distribution in each structural layer of the pavement.
Applsci 15 07441 g011
Figure 12. Evolution of single-axis load-temperature coupling stress under different seasons.
Applsci 15 07441 g012
Figure 13. Evolution of double-axis load-temperature coupling stress under different seasons.
Applsci 15 07441 g013
Figure 14. Evolution of triple-axis load-temperature coupling stress under different seasons.
Applsci 15 07441 g014
Figure 15. Longitudinal tensile strain at the bottom of asphalt layer with different axial patterns.
Applsci 15 07441 g015
Figure 16. Fatigue life under different combinations of axle loads.
Applsci 15 07441 g016
Table 1. Thermal properties of pavement materials.
ParameterAC-16AC-20AC-25Cement-Treated BaseSubgradeSoil Base
Thicknesses (m)0.040.050.060.300.20-
Density (kg/m3)230021002050220021001800
Poisson’s ratio0.250.250.250.250.250.40
Thermal conductivity
(J/m·h·°C)
324039604680561651485616
Specific heat (J/kg·°C)800850900911.710401040
Solar radiation absorption0.90
Road surface emissivity0.81
Table 2. Temperature stress parameters of surface material.
Temperature
(°C)
AC-16AC-20AC-25
Elastic Modulus (MPa)Temperature Shrinkage Coefficient
(°C−1)
Elastic Modulus (MPa)Temperature Shrinkage Coefficient
(°C−1)
Elastic Modulus (MPa)Temperature Shrinkage Coefficient
(°C−1)
−3012,467.51.20 × 10−512,530.81.30 × 10−59200.31.20 × 10−5
−208580.21.40 × 10−58367.61.60 × 10−55421.71.50 × 10−5
−105741.31.70 × 10−54810.52.10 × 10−53345.61.80 × 10−5
03828.52.00 × 10−53142.42.60 × 10−52958.22.20 × 10−5
102693.52.30 × 10−51978.42.40 × 10−51637.22.00 × 10−5
2017562.50 × 10−514412.10 × 10−51285.31.80 × 10−5
301188.12.30 × 10−51185.61.80 × 10−51073.21.60 × 10−5
40824.61.70 × 10−5857.61.50 × 10−5890.31.40 × 10−5
50564.31.40 × 10−5616.51.20 × 10−5610.21.40 × 10−5
60383.81.20 × 10−5384.71.00 × 10−5364.21.00 × 10−5
Table 3. Temperature stress parameters of base layer and soil-based materials.
Temperature
(°C)
Cement Stabilized Gravel BaseCement-Lime Gravel SubgradeSoil Base
Elastic Modulus (MPa)Temperature Shrinkage Coefficient
(°C−1)
Elastic Modulus (MPa)Temperature Shrinkage Coefficient
(°C−1)
Elastic Modulus (MPa)Temperature Shrinkage Coefficient
(°C−1)
5015002.50 × 10−510005.50 × 10−5605.0 × 10−5
352.35 × 10−54.80 × 10−5
251.72 × 10−52.53 × 10−5
150.72 × 10−51.38 × 10−5
50.05 × 10−51.25 × 10−5
−50.83 × 10−50.63 × 10−5
−150.50 × 10−54.00 × 10−5
Table 4. Maximum tensile stress of each structure of pavement.
Structural LevelMaximum Tensile Stress (MPa)
FallWinterSpring
Top surface course0.2500.8160.212
Intermediate layer0.0810.5000.073
Under surface layer0.0660.1780.060
Base0.0530.0470.046
Subgrade0.0190.0210.017
Table 5. Temperature stresses and coupling stresses under uniaxial loading.
Depth
(m)
Winter Stress (MPa)Spring Stress (MPa)Fall Stress (MPa)
Temperature StressCoupling StressPercentageTemperature StressCoupling StressPercentageTemperature StressCoupling StressPercentage
01.0281.2330.830.4220.7870.540.5320.8730.61
0.040.8161.3370.610.2120.8150.260.2500.8530.29
0.090.5001.0190.490.0730.6010.120.0810.6030.13
0.150.1780.5510.320.0600.3910.150.0660.3960.17
Table 6. Temperature stresses and coupling stresses under duplex loads.
Depth
(m)
Winter Stress (MPa)Spring Stress (MPa)Fall Stress (MPa)
Temperature StressCoupling StressPercentageTemperature StressCoupling StressPercentageTemperature StressCoupling StressPercentage
01.0281.1200.920.4220.6540.650.5320.7430.72
0.040.8161.1860.690.2120.6550.320.2500.6900.36
0.090.5000.8800.570.0730.4680.160.0810.4680.17
0.150.1780.4550.390.0600.3120.190.0660.3100.21
Table 7. Temperature and coupling stresses under triple-axis loading.
Depth
(m)
Winter Stress (MPa)Spring Stress (MPa)Fall Stress (MPa)
Temperature StressCoupling StressPercentageTemperature StressCoupling StressPercentageTemperature StressCoupling StressPercentage
01.0281.1820.870.4220.7390.570.5320.8270.64
0.040.8161.2740.640.2120.7520.280.2500.7880.32
0.090.5000.9590.520.0730.5430.130.0810.5450.15
0.150.1780.5070.350.0600.3480.170.0660.3530.19
Disclaimer/Publisher’s Note: The statements, opinions and data contained in all publications are solely those of the individual author(s) and contributor(s) and not of MDPI and/or the editor(s). MDPI and/or the editor(s) disclaim responsibility for any injury to people or property resulting from any ideas, methods, instructions or products referred to in the content.

