Article

Research on the Prediction of Concealed Uranium Deposits Using Geo-Electrochemical Integrated Technology in the Guangzitian Area, Northern Guangxi, China

1
College of Earth Sciences, Guilin University of Technology, Guilin 541006, China
2
Applied Nuclear Technology in Geosciences Key Laboratory of Sichuan Province, Chengdu University of Technology, Chengdu 610059, China
3
Nuclear Geological Brigade of Guangxi Zhuang Autonomous Region, 310, Guilin 541199, China
*
Authors to whom correspondence should be addressed.
Appl. Sci. 2025, 15(13), 7426; https://doi.org/10.3390/app15137426
Submission received: 26 May 2025 / Revised: 26 June 2025 / Accepted: 28 June 2025 / Published: 2 July 2025
(This article belongs to the Special Issue Recent Advances in Geochemistry)

Abstract

To achieve a significant breakthrough in the exploration of uranium resources in the Guangzitian area of northern Guangxi, China, an innovative combination of exploration methods was implemented at the peripheral regions of the Guangzitian uranium deposit under the guidance of the following principle: “exploring the edges and identifying the bottom, delving deep and un-covering blind spots”. This study introduces geo-electrochemical integrated technology for prospecting research at the peripheral areas of the Guangzitian deposit. By validating the technology’s effectiveness on known geological sections, distinct geo-electrochemical extraction anomalies were identified above recognized ore bodies. Simultaneously, soil ionic conductivity and thermally released mercury anomalies were observed, partially indicating the presence of concealed uranium deposits and fault structures. These findings demonstrate that geo-electrochemical integrated technology is effective in detecting buried uranium mineralization in this region. Subsequently, a geological-geoelectrical prospecting model was established through a systematic analysis of anomaly characteristics and metallogenic regularity, and it was subsequently applied to unexplored areas. As a result, one key anomaly verification zone, one Class A comprehensive anomaly zone, two Class B comprehensive anomaly zones, and one Class C comprehensive anomaly zone were identified within the unexplored research area. Drilling engineering validation was conducted in the No. Ι key anomaly verification zone, resulting in the discovery of an industrial-grade uranium ore body. This achievement not only provides critical technical support but also develops a robust theoretical foundation for future mineral exploration endeavors.

1. Introduction

Uranium resources are crucial strategic resources and energy minerals, serving as fundamental raw materials for the development of the nuclear industry. The Guangzitian uranium deposit is situated in the north of Guilin City, Guangxi Zhuang Autonomous Region, China, within the Xiang-Gui segment of the Nanling uranium metallogenic belt. As one of the typical representatives of carbonaceous-siliceous-pelitic uranium deposits in China, it plays a significant role in uranium geological research and resource exploitation [1]. The Guangzitian deposit, together with nearby uranium deposits of the same type—such as Tuditang, Dajiangbei, and Kuangshijiao—as well as a series of ore deposits and mineralization points, forms the northern Guangxi uranium ore field [2]. If infill exploration can connect isolated uranium deposits and occurrences in the northern Guangxi uranium ore field, the defined resource inventory will be substantially expanded. However, the periphery of the Guangzitian deposit is predominantly characterized by agricultural land use (rice paddies and orchards). Due to the obscuration caused by burial depths and the overlying cover layer, the geochemical exploration anomalies remain poorly defined, and discerning the mineralization characteristics is challenging [3]. Over the years, relevant geological units have conducted extensive geological exploration operations in this region, yet the results have remained suboptimal. Therefore, by following the principle of “exploring the edges and identifying the bottom, delving deep and uncovering blind spots” for the Guangzitian deposit, an innovative combination of methods has been employed. Geo-electrochemical integrated technology was introduced to extract effective exploration information; summarize the distribution patterns of ore-forming elements; integrate the results of anomaly verification; and enhance the positioning and prediction accuracy of hidden ore bodies within the deep edges and periphery of the deposit [4].
Geo-electrochemical integrated technology comprises three principal methodologies: geo-electrochemical extraction measurement, soil ionic conductivity measurement, and thermally released soil mercury measurement [5]. As a geochemical exploration method integrating disciplines such as geochemistry, geo-electrochemistry, and geophysics, geo-electrochemical integrated technology’s origins trace back to the CHIM developed by Soviet scholars in the late 1960s [6]. It was introduced to China in the 1980s by Xu Bangliang and Fei Xiquan. In 1989, Pan Yongfei proposed standardizing the technology. Significant methodological and technological enhancements were achieved in 2003 by Luo Xianrong and Kang Ming, particularly through the development of low-voltage-dipole geoelectrical extraction de-vices, facilitating substantial advancements in China. In 2017, scholars such as Wen Meilan and Sun Binbin drafted the “Technical Regulations for Geo-electrochemical Measurement (Draft for Comment)” jointly. Following over three decades of development, the electrochemical mechanism behind Earth’s halo formation has been progressively refined, and associated instrumentation has undergone significant upgrades.
Numerous scientific research and industrial organizations have achieved significant success in exploring concealed mineral deposits across various mineral types and geo-logical coverage areas by employing geo-electrochemical integrated technology. The minerals involved encompass over ten categories, including gold, silver, copper, lead, zinc, tungsten, tin, arsenic, antimony, nickel, and uranium. For instance, in the arid Gobi Desert region of Qinghai, China, this technique demonstrated significantly superior precision in targeting lead-zinc ore bodies at approximately 100 m depth compared to displaced rock geochemical surveys [7]. In the thick loess-covered terrain of Shanxi, soil geochemical surveys yielded only weak responses to gold ore bodies buried at depths of 38–200 m, whereas distinct geo-electrochemical anomalies accurately reflected the location of gold mineralization [7]. On the frozen plateau of Tibet, soil geochemical surveys could only identify shallow mineralization, while geo-electrochemical surveys revealed clear anomalies directly above the ore bodies [8]. Particularly in the eolian sand-shallow cover area of Inner Mongolia, 1:50,000 scale geo-electrochemical surveys successfully delineated multi-element anomalous targets coincident with known lead-zinc-silver mineralization. Eventually, through geophysical IP (Induced Polarization) gradient surveys and drilling programs, a 6 m thick Ag-Cu-rich ore body was discovered at a depth of over 540 m, achieving a breakthrough in mineral exploration. In contrast, the soil geochemical survey only showed sporadic anomalies [9]. These collective results validate the efficacy of geo-electrochemical technology in thick-cover regions. Consequently, they provide the methodological foundation for this study’s application in targeting concealed carbonaceous-siliceous-pelitic uranium deposits within the thick Quaternary cover sequences of northern Guangxi. The applied techniques have proven effective for deposits of multiple genetic types, and they include the following: high-temperature, medium-temperature, low-temperature hydrothermal, sedimentary exhalative, stratabound, sediment-hosted and modified, volcanogenic, volcanic-sedimentary metamorphic, skarn, and sandstone-hosted deposits [10,11,12]. Currently, studies on the application of geo-electrochemical techniques for exploring concealed uranium deposits have covered various regions. These include the Four Mile East and Goulds Dam in Australia; the Dongsheng and Dachengliang areas within the Ordos Basin in Inner Mongolia, China, for sandstone-hosted uranium deposits; the Huxi area, Xiangshan area, and Shengyuan Basin in Jiangxi, China, for volcanic rock-hosted uranium deposits; and the Motianlun area in Guangxi and the Lujing area in Hunan, China, for granite-hosted uranium deposits [13,14,15,16,17,18,19,20]. Considerable prospecting achievements have been attained in these studies. However, in previous research, there were challenges, such as the large and uneven spacing of geo-electrochemical measurement points and lines, making it difficult to predict abnormal planes and causing local anomalies to be overlooked. Another problem was inconsistent supply current, voltage, electrification duration, and extraction liquid selection, making it hard to evaluate the extraction effect. Moreover, there is a lack of systematic research on carbonaceous-siliceous-pelitic uranium deposits. Therefore, this study summarizes previous explorations, selects the best working parameters, and utilizes geo-electrochemical integrated technology to search for concealed carbonaceous-siliceous-pelitic uranium deposits in the thickly covered area outside the Guangzitian deposit. The aim is to develop a set of exploration techniques and methods suitable for finding concealed uranium deposits in this region and to solve the deep and peripheral exploration problems in the Guangzitian area. This is of great significance for increasing mineral reserves in the northern Guangxi uranium ore field and researching understudied topics with respect to the application of geo-electrochemical integrated technology in the search for concealed carbonaceous-siliceous-pelitic uranium deposits.

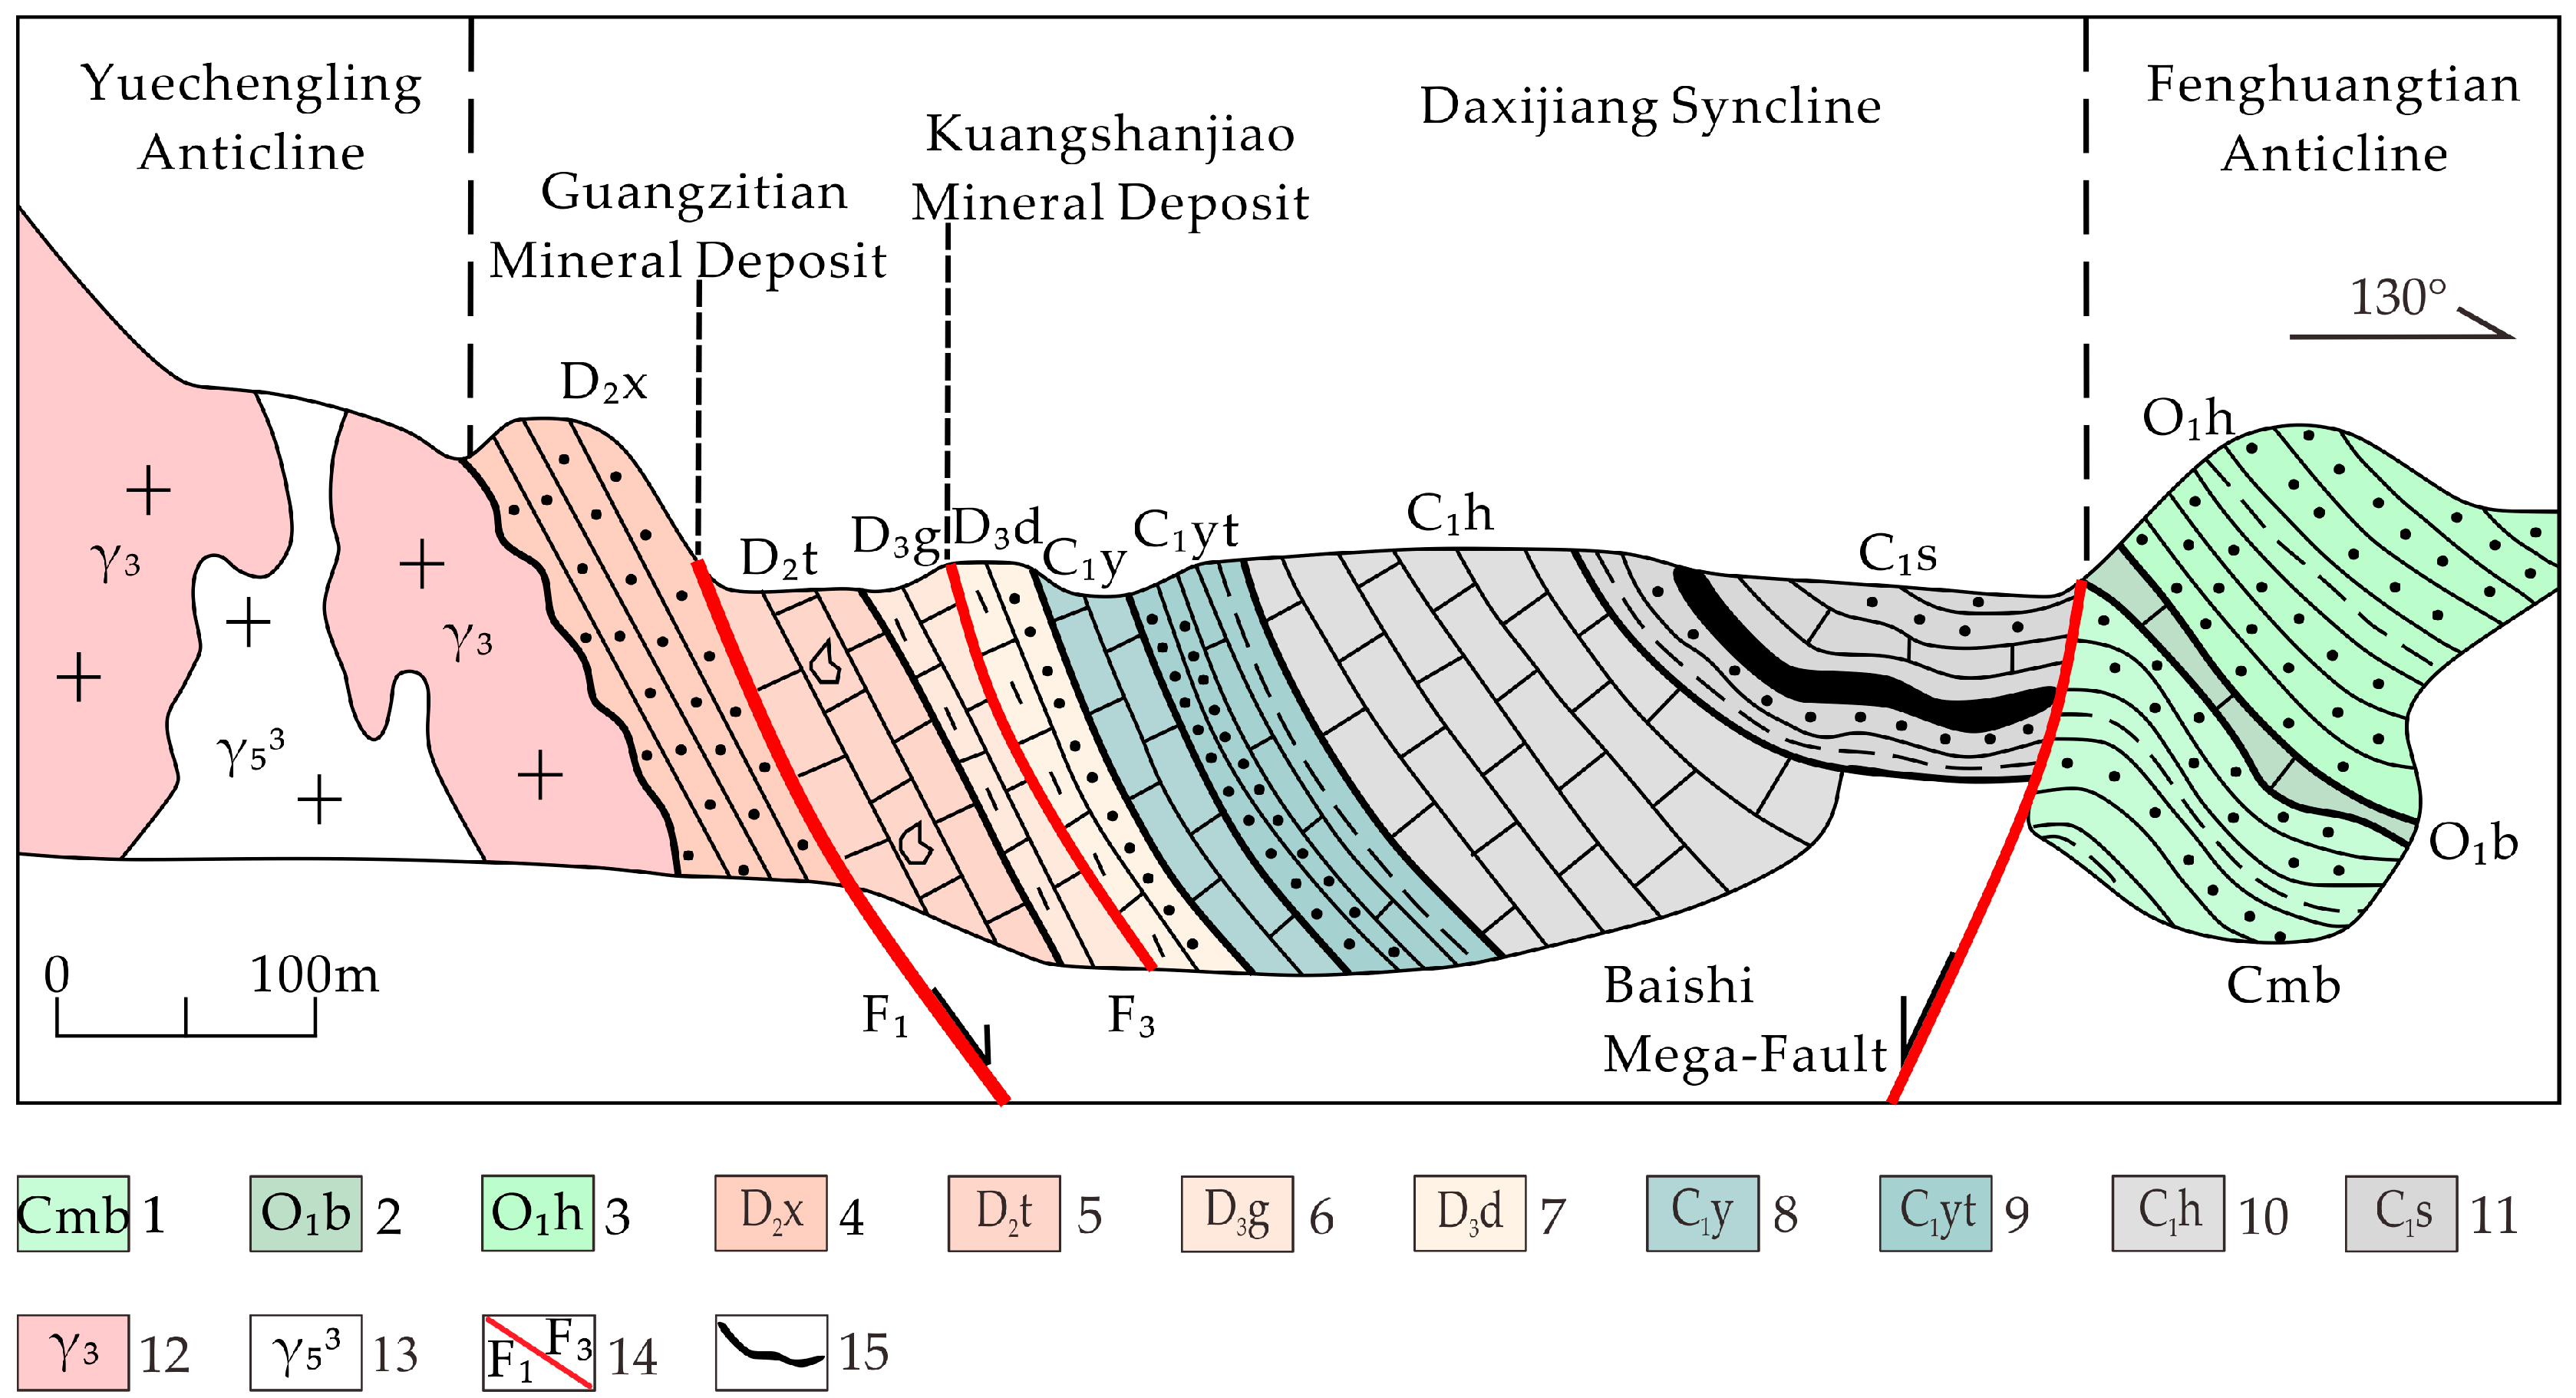
2. Regional Geological Setting

The study area is situated at the junction of the Yangtze Block, the Yuechengling Fold Belt within the Northern Guangxi Block, the Nanhua Mobile Belt, and the Haiyangshan Uplift in the Central-Northeastern Guangxi Fold System. The regional topography descends from the west to the east, with the western area comprising a mid-low mountainous region at elevations exceeding 1000 m, which is characterized by steep terrain, intense dissection, and the frequent occurrence of sharp peaks and conical summits along ridgelines. To the east lies a hilly area with altitudes ranging from 300 to 500 m, and this area is characterized by gentle slopes, rounded mounds, partially exposed bedrock, and a relative height difference of less than 200 m. The uranium deposit is situated within the transitional zone between the mid-low mountains and hilly domains (Figure 1) [21].
The stratigraphic sequence within the study area exhibits relatively complete exposure, with strata from the Proterozoic to Quaternary systems displaying varying degrees of outcrop, except for the absence of the Silurian and Triassic systems. The lithology is predominantly composed of sandstone, with the Devonian, Carboniferous, and Ordovician systems being the most extensively distributed. Notably, the Middle-Upper Devonian series constitutes the principal ore-bearing strata within the mining field. The tectonic evolution demonstrates multiphase superposition characteristics. The Caledonian Orogeny resulted in the folding and uplift of the Lower Paleozoic strata, resulting in the formation of the Yuechengling Anticline, the Daxijiang Syncline, and the Fenghuangtian Anticline. This process was accompanied by large-scale magmatic intrusions and the development of synkinematic faults, such as the Baishi Major Fault. Subsequently, the Indochinese Orogeny reactivated the uplift and basement faults of the Upper Paleozoic strata, forming several fault zones within the Devonian system on the western wing of the Daxijiang Syncline. These include the F1 and F3 interlayer compression fracture zones, the NE-trending F2 fault zone group ( F 2 0 ,   F 2 1 ,   F 2 2 ,   a n d   F 2 3 ), the F11 cross-cutting fault zones, and the east-west fault zone group. All these structures are closely associated with mineralization processes. The Yanshanian block faulting ultimately shaped the Daxijiang syncline, which comprises platform cover strata displaying arc-shaped bending with an eastward convex apex, which is characterized by a narrow and uplifted northern termination and broad subsided southern portion superimposed upon the Caledonian fold basement rift trough. Under E-W-trending extensional stress during the Himalayan period, the Daxijiang-Longshui fault-depression basin was formed (Figure 2) [22]. The location and morphology of uranium orebodies are controlled by fault-bounding grabens and interlayer fracture zones; the orebodies mainly occur as stratiform, lenticular, vein-type, and irregular shapes [23]. Magmatic rocks are widely distributed in the area, predominantly consisting of Caledonian medium-grained to coarse-grained and medium-grained to fine-grained porphyritic biotite granites, exhibiting an average uranium content of 16.5 × 10⁻⁶ and zircon U-Pb isotopic ages of 414 Ma. These are accompanied by Yanshanian fine-grained biotite granites with higher uranium enrichment (26.2 × 10⁻⁶) and isotopic ages ranging from 152 to 201 Ma (zircon U-Pb dating), and they are classified as uranium-enriched granitic bodies. The multiphase and multistage magmatic intrusions ultimately constituted the Yuechengling composite granite batholith, which is presumed to have contributed partial metallogenic materials for uranium mineralization [24].

3. Technical Principles, Methodology, Sampling, and Analysis

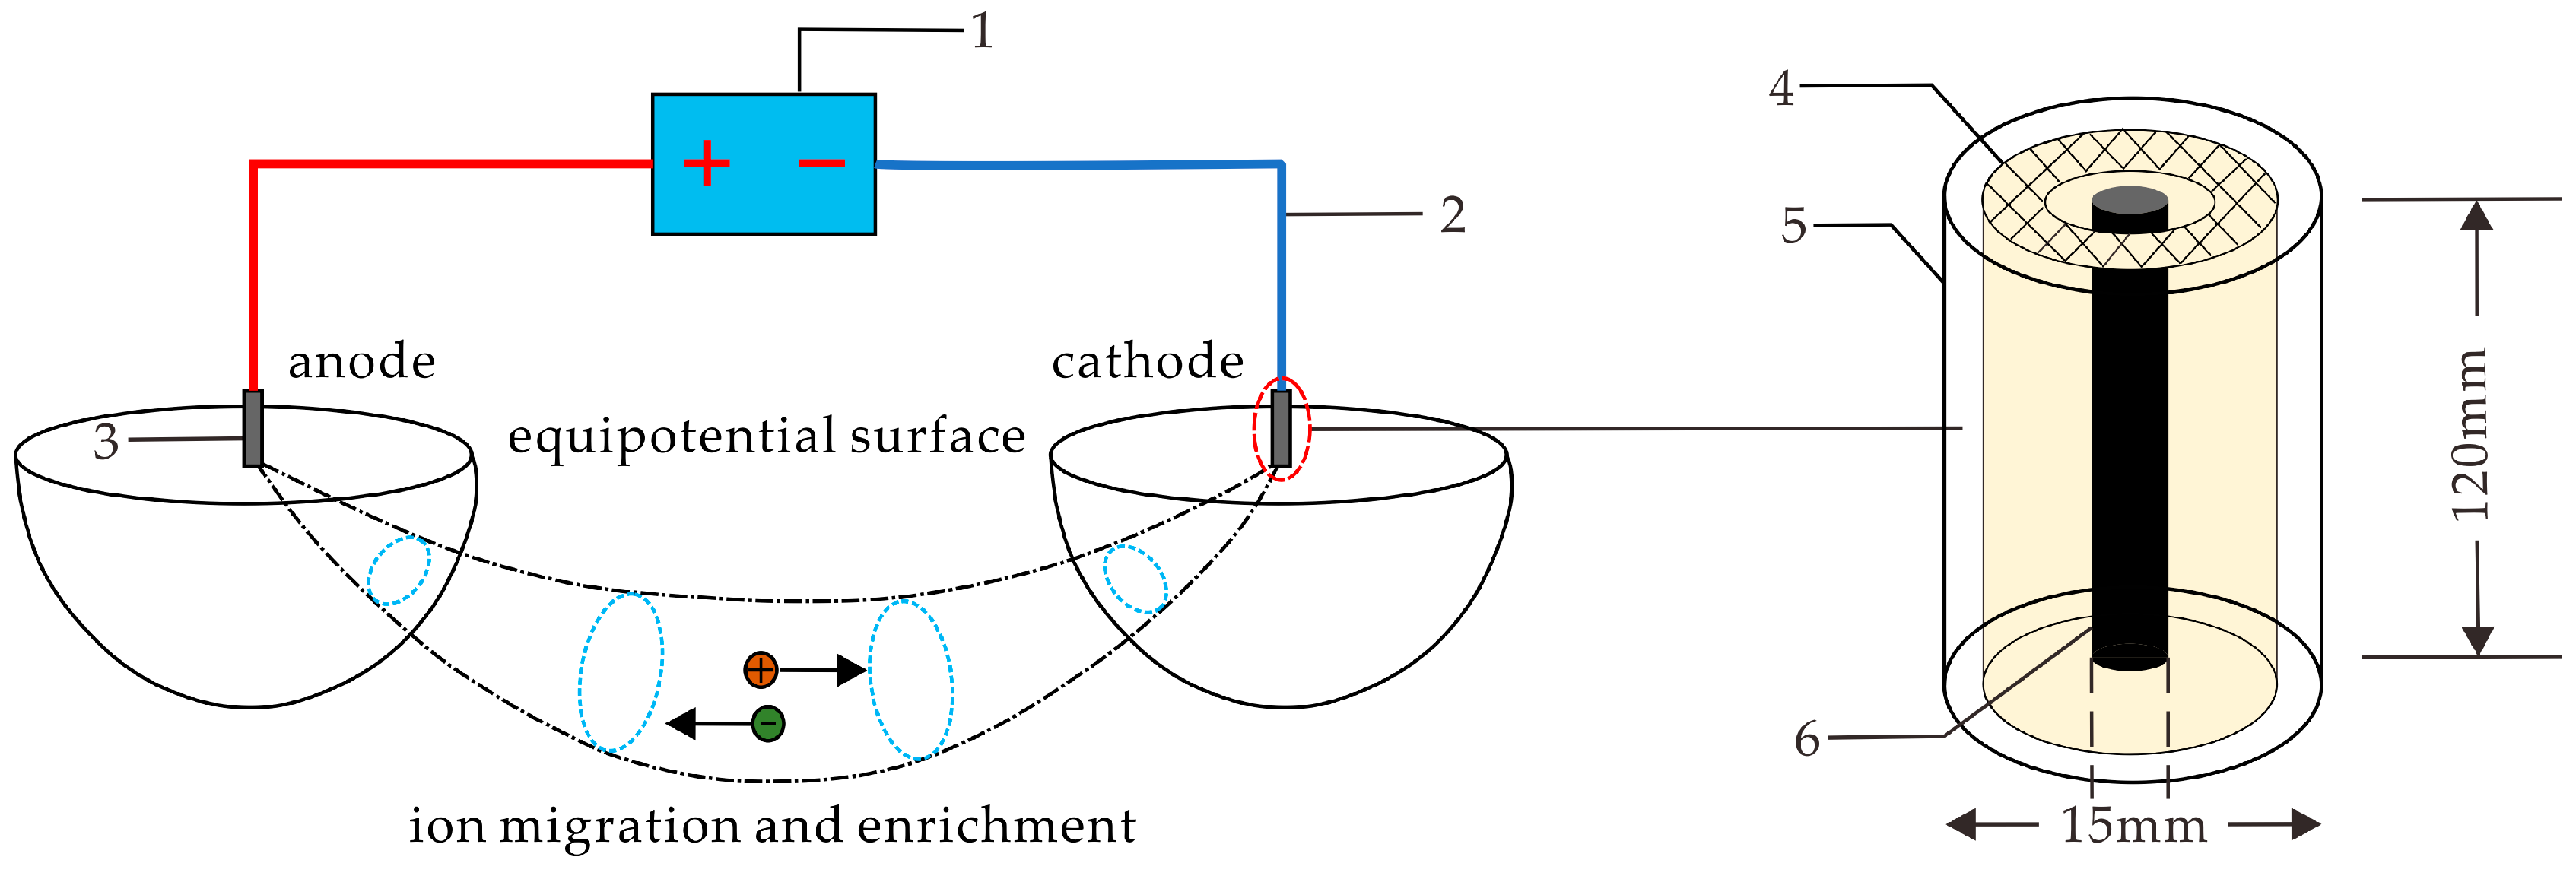
3.1. Technical Principles

(1) Geo-electrochemical extraction measurements, also known as the geo-electrochemical extraction method, are carried out under natural conditions. Due to the potential difference between various minerals within deep ore bodies, electrochemical dissolution occurs, generating metal ions, colloids, or complexes. These ions migrate toward the surface through groundwater flow, diffusion, and electrodynamic effects, forming ion halos. Upon the application of an artificial electric field, the pre-existing electrochemical equilibrium is perturbed, initiating the directional migration of cations and anions towards respective electrodes. This process establishes a continuous ionic replenishment chain through successive displacement, facilitating the upward transportation of deep-seated mineralization signals to shallow horizons. A renewed dynamic equilibrium is subsequently achieved following sustained current application. This technique directly detects the surface ion anomalies corresponding to the composition of deep ore bodies, and the method is characterized by its simplicity and high efficiency. Moreover, practical applications demonstrate that the distribution of these anomalies often aligns with the vertical projection of deep ore bodies, making it especially suitable for the exploration of concealed mineral deposits [11,25,26];
(2) The soil ionic conductivity measurement technique operates on analogous electro-chemical dissolution principles driven by oxidation-reduction potential gradients within concealed ore bodies. When ore masses become intersected by fissure water systems or groundwater tables, a natural electrolytic environment is established. Contrasting oxidative conditions between upper and lower ore body sections generate electrochemical potential disparities, thereby inducing electron transfer processes that disrupt electrical neutrality. This disequilibrium triggers the directional migration of cations and anions through electrochemical mobilization, ultimately culminating in the enrichment of ionic species within near-surface soil horizons to form characteristic ionic dispersion halos [25,27]. Electrical conductivity, though a geophysical parameter, serves as an effective geo-chemical indicator by measuring the total conductive ion concentration in soils to reflect the co-enrichment halos of U6+, WO42−, SO42−, Ca2+, and Fe3+ ions. This integrated approach demonstrates superior capability in revealing deep-seated mineralization signals compared to individual element analysis. In particular, in geologically complex terrains where conventional geophysical and geochemical exploration methods fail to achieve breakthroughs, soil ionic conductivity measurements have proven to be an exceptional technique for mineral exploration [28,29,30];
(3) Thermally released soil mercury measurement represents a mineral exploration technique grounded in mercury’s distinctive geochemical properties (liquid state at ambient temperatures, high volatility, and strong thiophilicity and migration capacity). The fundamental principle of this methodology lies in the ubiquitous presence of mercury anomalies surrounding metallic ore deposits, where mercury vapor in soils originates from concealed mineralization bodies [31,32]. Mercury in hydrothermal systems predominantly occurs as native mercury or mercury compounds within sulfide minerals or migrates along fractures to form primary halos. Mercury vapor ascending through groundwater systems or structural discontinuities becomes adsorbed by soil to form geochemical anomalies. However, these anomalies are frequently associated with tectonic activities rather than directly indicating mineralization bodies, and they are susceptible to anthropogenic interference from vegetation cover or agricultural activities. Consequently, the integration of stepwise thermal release protocols becomes imperative for distinguishing genuine anomalies, thereby effectively delineating concealed ore bodies and fault zones. This methodology demonstrates broader applicability beyond mineral exploration, extending to hydrogeological investigations and engineering geological assessments involving structural fracture systems [33,34].

3.2. Sample Collection and Analytical Testing

In accordance with the “from known to unknown” principle, a feasibility test of the method was conducted on a known section of Line L00, which is located approximately 3 km north of the Guangzitian deposit. This section—where the ore body is exposed through drilling engineering and geological conditions that are similar to those of the study area—features 53 measurement points established at 25 m intervals. In the unknown area, covering approximately 2.75 square kilometers outside the Guangzitian deposit (Figure 3), a total of 21 survey lines and 462 measurement points were systematically arranged based on a mineral exploration grid of 100 m × 25 m for predictive research.
This electrochemical extraction measurement utilizes an independently powered, low-voltage dipole electric extraction device developed by the Hidden Ore Deposit Prediction Research Institute of the Guilin University of Technology. This device comprises two main components: a power supply system and an ion absorber. The power supply employs low-voltage direct currents, while the ion absorber consists of specially treated adsorption materials with specific specifications, in addition to cylindrical graphite carbon rods wrapped in filter paper. A wire is extended from one end of the carbon rod and connected to the power-supply system, thereby forming the ground electricity-extraction device (Figure 4). The key features of this device include its compact size, low operating voltage, self-contained power supply, and ease of operation [35].
The field sampling work was carried out in strict compliance with the technical specifications for geo-electrochemical extraction and measurement. Two sampling pits, each approximately 30 cm in depth, were established at 1 m intervals perpendicular to the measurement line’s direction between sampling points (based on the visible residual layer soil). Initially, the soil samples required for measuring soil ionic conductivity and thermally released mercury were collected. Subsequently, ground electro-extraction electrodes, in conjunction with the extraction solution, were parallelly placed within the sampling pits and backfilled sequentially according to the soil-extraction sequence. Following a 48 h electro-extraction period, the ground electro-extraction device was retrieved [36].
Following air-drying at room temperature, the adsorption materials wrapped around the anode and cathode of the ion extraction apparatus were sent to the Testing Center of Guilin Institute of Mineral Geology under the China Nonferrous Metals Industry. The samples were decomposed using nitric-acid-hydrogen peroxide-aqua regia extraction. Subsequently, elements such as U, Th, W, Mo, and As were analyzed and tested via inductively coupled plasma mass spectrometry (ICP-MS). The detection limits of the current determination method are shown in Table 1 [20,37]. The soil samples were dried and sieved through a 100-mesh aperture sieve. Then, the Hidden Ore Deposit Prediction Research Institute of the Guilin University of Technology analyzed and tested the samples using an electrical conductivity meter and a mercury analyzer.

4. Research on the Effectiveness of Mineral Exploration

To validate the applicability and effectiveness of the geo-electrochemical integration technology for detecting concealed uranium deposits in the study area, a methodological effectiveness study was conducted on the known Line L00’s profile located north of the research region. This selected profile exhibits analogous geological conditions and contains ore bodies confirmed through drilling engineering verification [36]. Analyses of element content profile maps revealed that geo-electrochemical extraction anomalies, soil ionic conductivity, and thermal soil mercury release all exhibited varying degrees of geochemical anomalies (Figure 5).

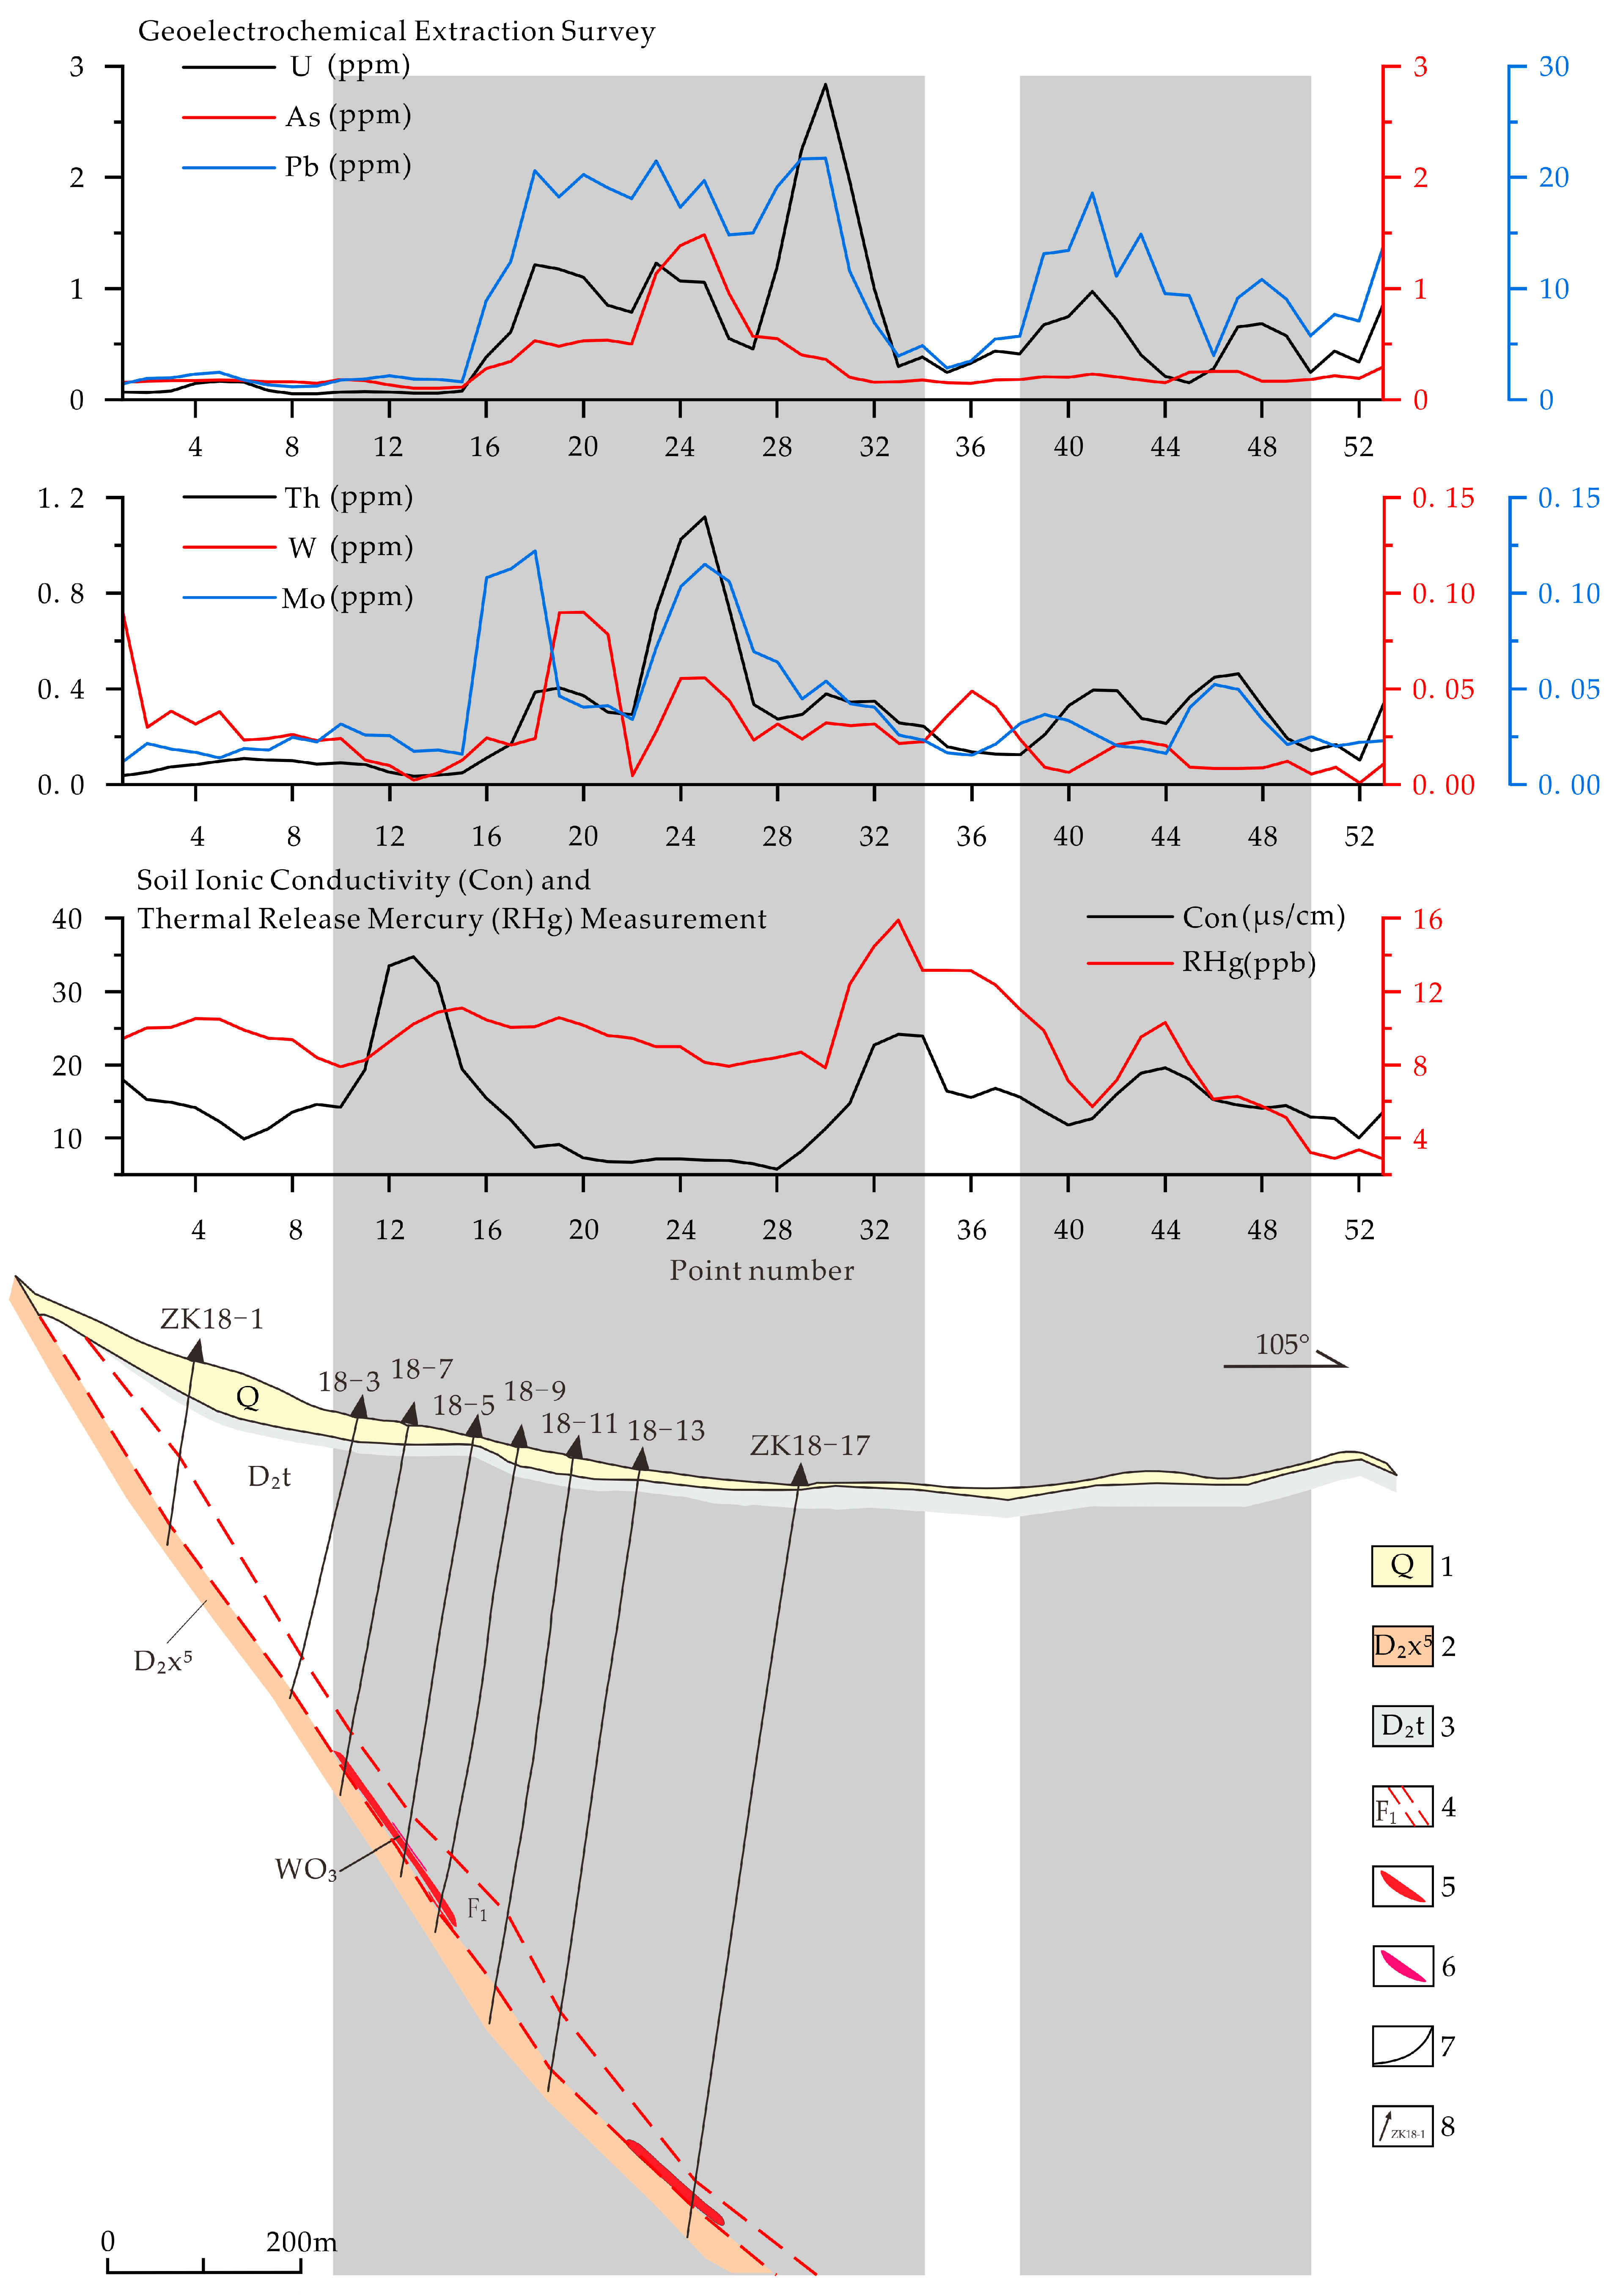
4.1. Anomaly Characteristics of the Known Profile

(1) The geo-electrochemical extraction anomalies of U, As, Th, and W exhibited a single-peak pattern, while the Pb and Mo anomalies displayed a rabbit-ear-shaped configuration, predominantly distributed between points 15 and 32, with a composite anomaly width of approximately 425 m. The peak concentration of U, the primary ore-forming element, reached 2.84 × 10⁻⁶, representing 6.8 times the background value, which provides a clear indicator for the lower segment of the KT4-11 uranium orebody at depths of −400 to −480 m. The associated element Mo showed an anomaly intensity ranging from 0.03 × 10⁻⁶ to 1.22 × 10⁻⁶, corresponding to 1.31–4.69 times the background value. Among all of the elements analyzed via geo-electrochemical extraction, Mo exhibited the strongest spatial correlation with the two underlying mineralized zones of the known orebody;
(2) The soil ionic conductivity anomalies occurred between points 9 and 18, exhibiting a lambda-shaped morphology locally, with a peak value of 34.78 μs/cm and a composite anomaly width of approximately 250 m. These anomalies correlate well with the upper segment of the KT4-11 uranium orebody and the industrial-grade tungsten ore body at depths of 0 to −160 m. While the soil thermally released mercury anomalies did not dis-play distinct peaks above the two uranium orebody segments, the general trend of the anomaly curve indicated elevated values relative to the background, forming an anomaly zone that is spatially consistent with the overlying mineralization;
(3) Between the two orebody segments, the anomalous peaks of various elements were observed. It is inferred that mobile ions extracted through geo-electrochemical methods not only migrated vertically upward from the ore-hosting positions but also ascended along interlayer fractured zones to reach the surface. However, the known profile along Line L00 exhibited a negative topographic depression characterized by elevated peripheries and a depressed central area. Consequently, mineralization-related components may have been transported under the combined effects of rainwater runoff, chemical leaching, and gravitational forces, ultimately accumulating in the topographically low areas to form superimposed strong anomalies through enrichment processes;
(4) At points 32–45, where engineering control was absent, the anomalies of elements such as U, Th, Mo, and Pb were observed, along with anomalies in soil ionic conductivity and thermally released soil mercury. Two possible reasons for these anomalies can be inferred: first, the upward migration of elements from the underground areas to the surface through fracture zones may have resulted in the formation of anomalies; second, there might have been undiscovered uranium ore bodies beneath these points [38].
The results of the feasibility test indicate that the abnormal patterns and characteristics detected by the three methods effectively reflect the location of deep ore bodies. This demonstrates that geo-electrochemical integrated technology is both feasible and efficient for exploring concealed uranium deposits in this region [39].

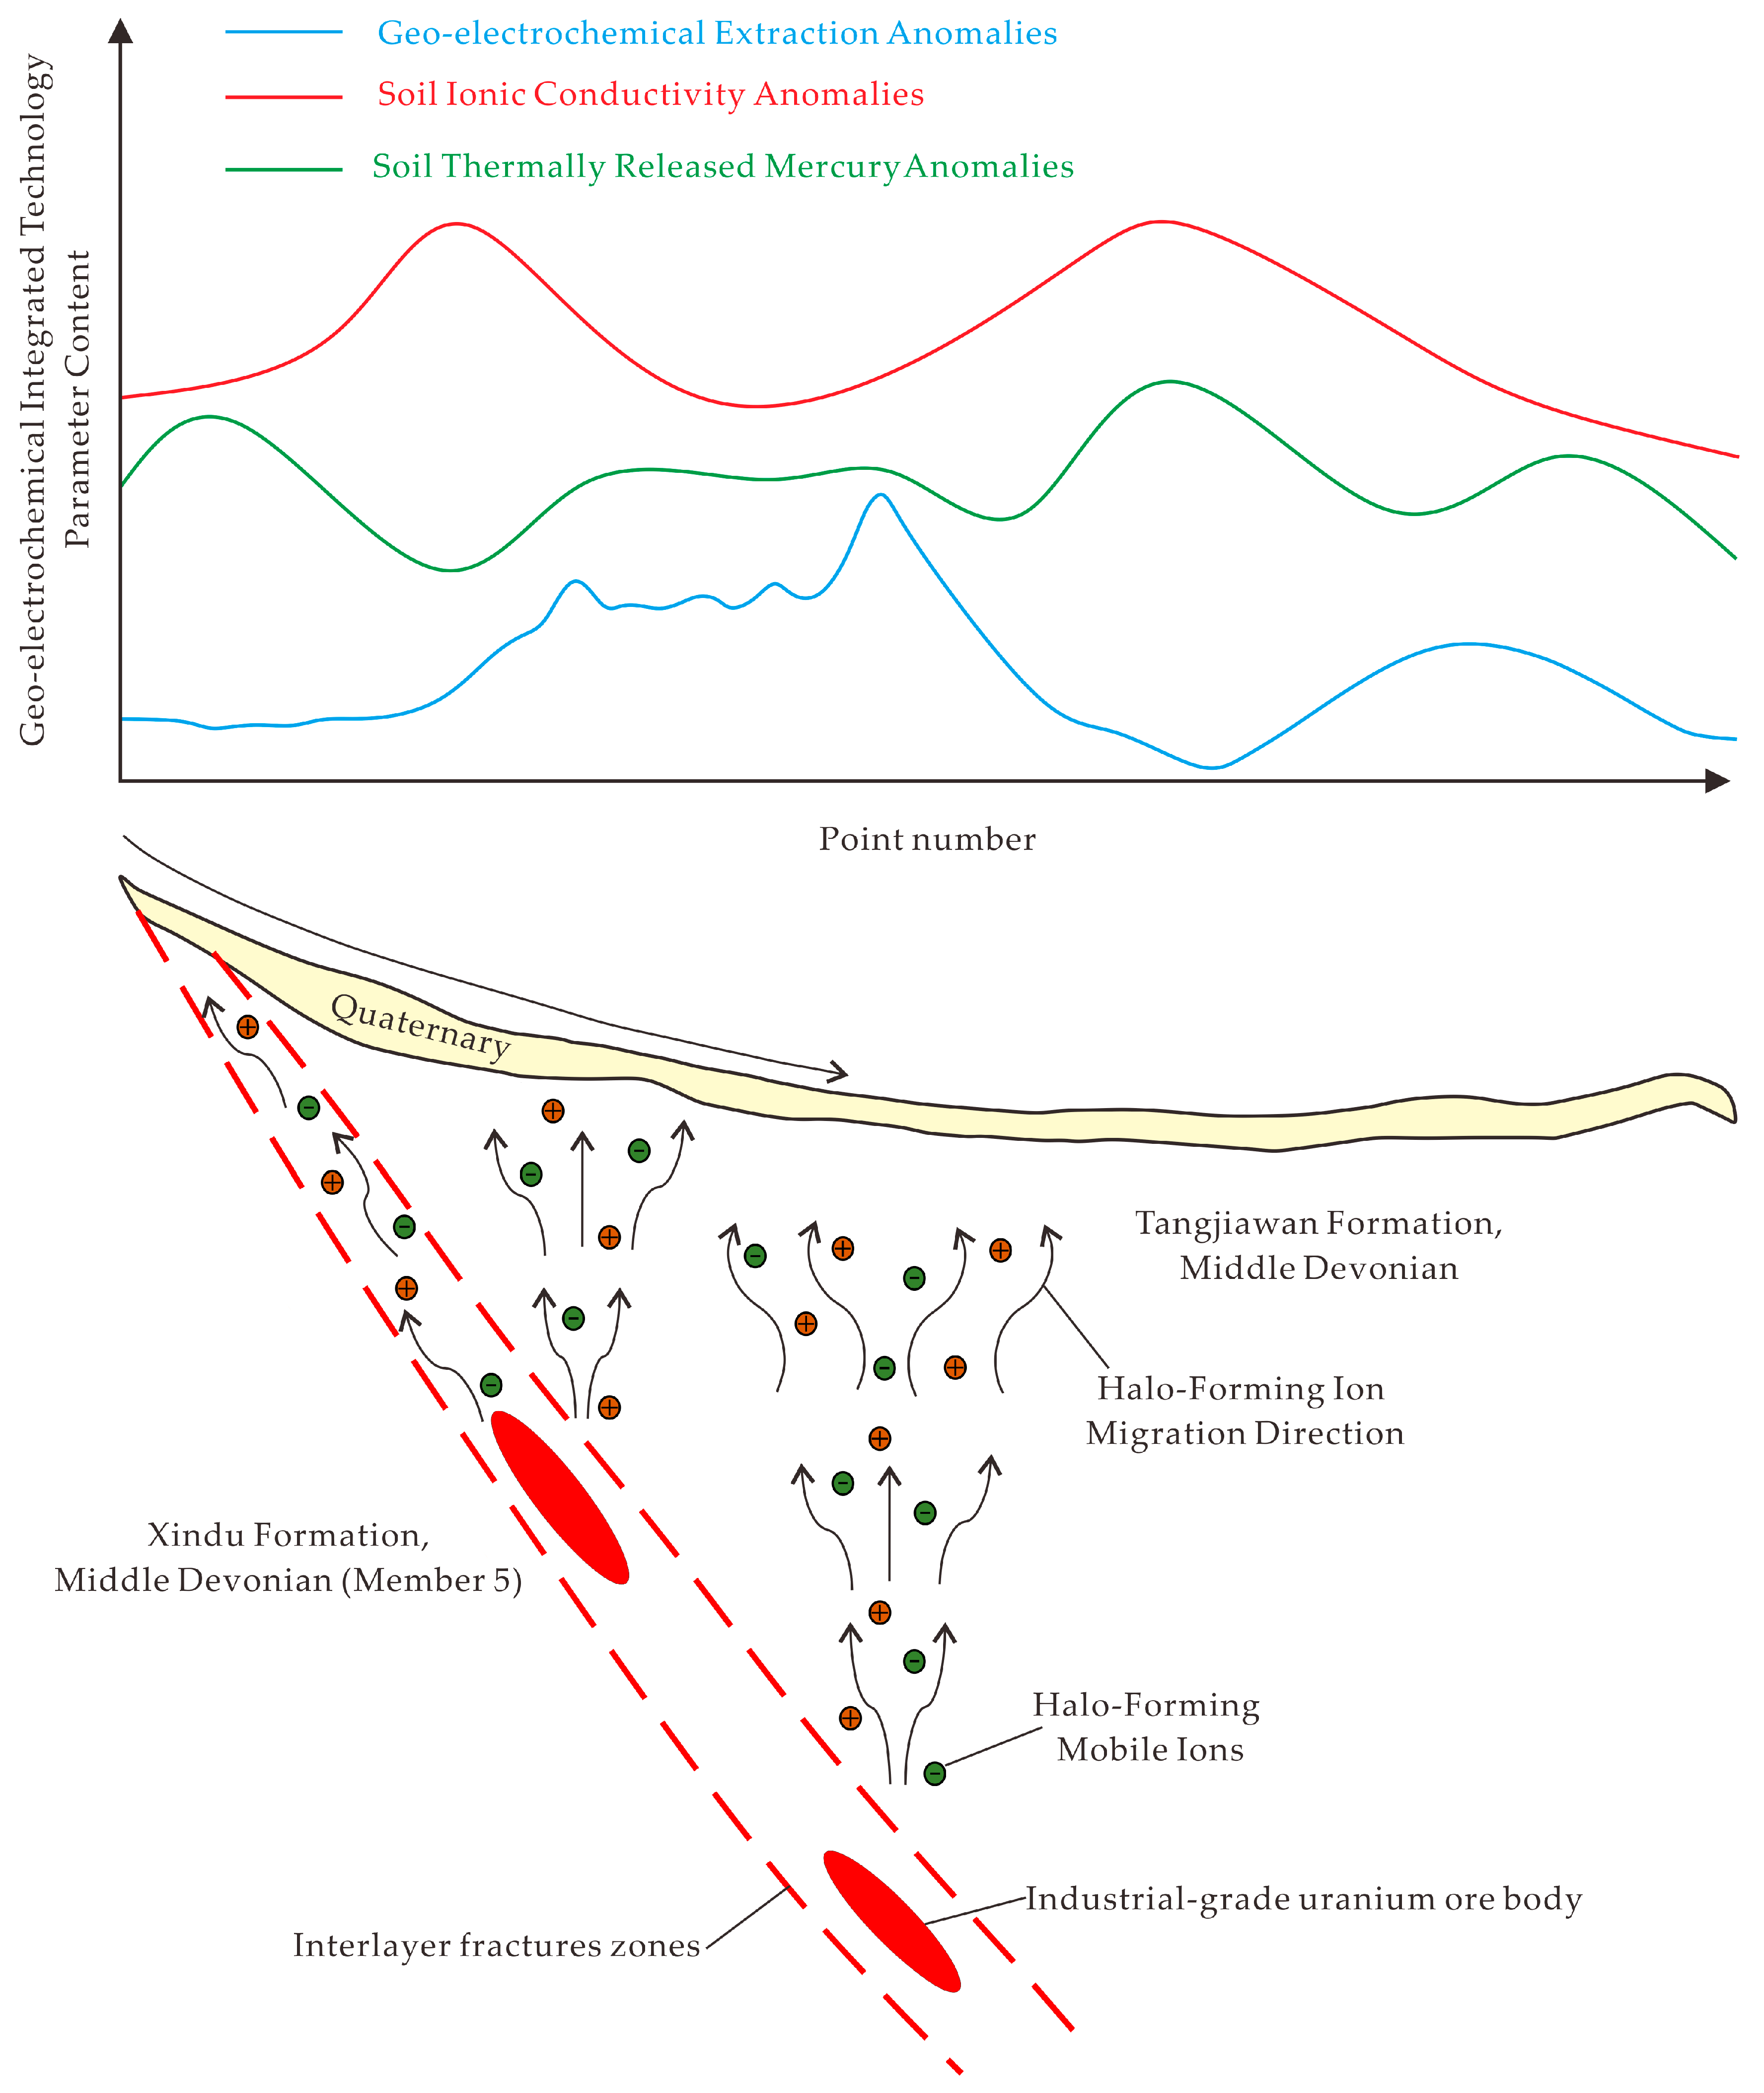
4.2. Geology-Geoelectric Prospecting Model

4.2.1. Indicators in Geological Exploration

The Middle Devonian Xindu Formation (D2x) and Tangjiawan Formation (D2t) constitute the principal uranium-hosting strata in the study area. The F1 interlayer fracture zones and the secondary fractured zones—developed along their contact interface—serve as critical ore-bearing structures and primary migration pathways for mineralized fluids. Uranium mineralization bodies, strictly constrained by lithology and stratigraphic position, exhibit stratiform and lenticular geometries along these fractured zones. Three essential prospecting indicators for carbonaceous-siliceous-argillaceous uranium deposits in this region have been identified: ① clastic rocks enriched with phosphates, vanadates, and Fe-Mn constituents, intercalated with variegated carbonate and siliceous lithologies; ② interlayer compression fracture zones and cross-cutting fault zones; and ③ wall-rock alterations, including carbonatization, silicification, bleaching, and iron mineralization. These geological features collectively provide diagnostic criteria for carbonaceous-siliceous-pelitic uranium deposits exploration in the study area [40,41].

4.2.2. Geo-Electrochemical Extraction and Measurement Markers of Soil Ionic Conductivity and Thermally Released Mercury

The geo-electrochemical extraction survey revealed distinct elemental anomalies of U, Th, W, Mo, As, and Pb with local overlaps, effectively indicating the presence of deep-seated concealed uranium mineralization. Th, as a decay product of U, shares similar geochemical affinities with its parent element, while Mo demonstrates the most effective geochemical signature for carbonaceous-siliceous-argillaceous uranium mineralization [42]. Therefore, three critical prospecting indicators can be established: ① U-Th-Mo anomalies as direct exploration criteria; ② W-As-Pb anomalies exhibiting strong correlation with U as indirect indicators; and ③ coincident lambda-shaped soil ionic conductivity anomalies and rabbit-ear-shaped thermally released mercury anomalies serving as significant structural-geochemical markers (Figure 6) [43].

5. Research on Mineral Prospecting Prediction

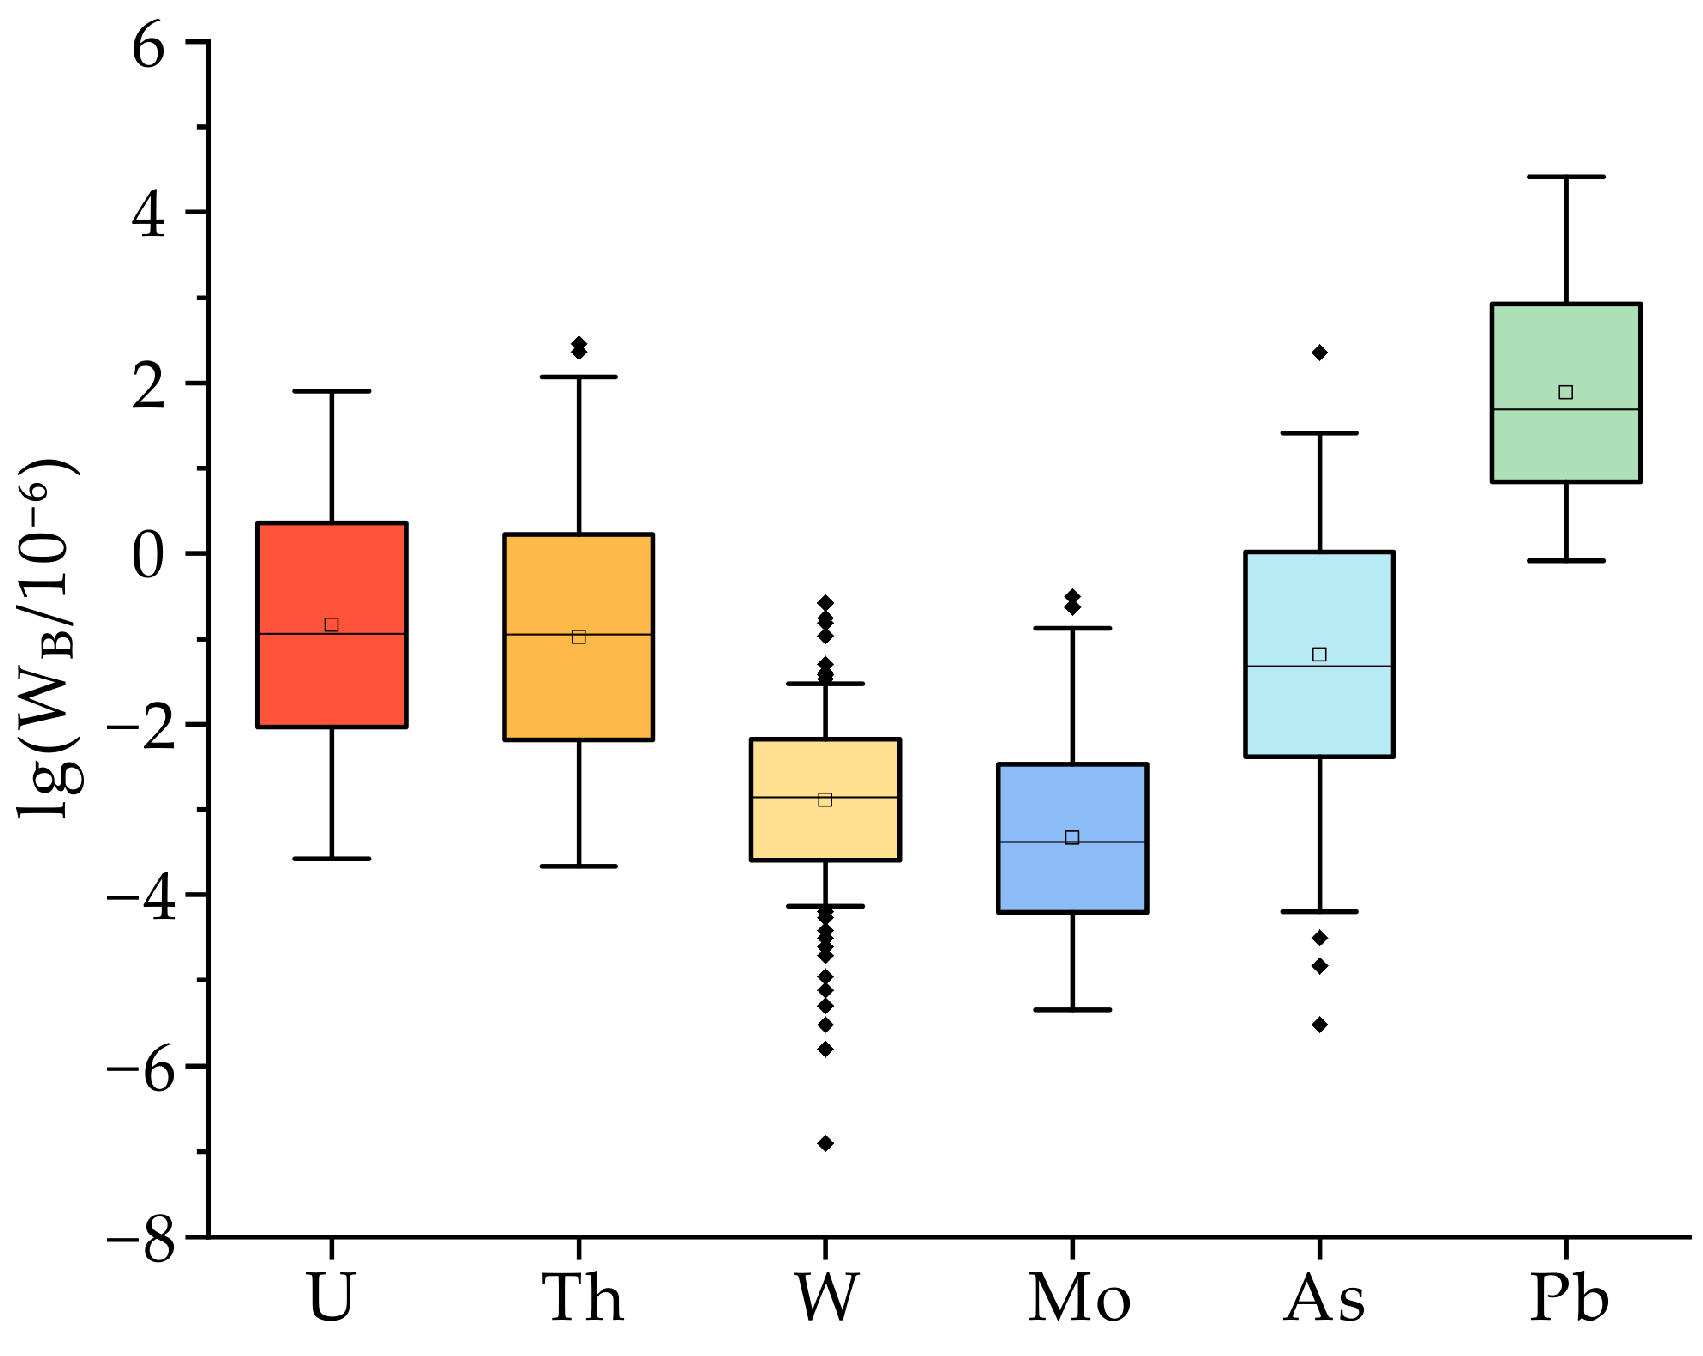
5.1. Statistical Analysis of Parameters

To study the effectiveness of the proposed method, geo-electrochemical integrated technology was employed to conduct mineral exploration predictions in the study area. The content data of the six obtained elements were statistically analyzed using GeoChem Studio 2.5.9 and SPSS 27.0 software (Table 2). Through examination of the skewness and kurtosis values of each element, it was evident that none of the elements followed a normal distribution. Consequently, a logarithmic transformation was applied to the original data. As shown in the box plot (Figure 7), although outliers remained present in Th, W, Mo, and As after logarithmic transformation, the mean values of these elements were closer to their medians, and they were centrally located within the box. This indicates the objectivity of the statistical analysis, suggesting that “the data of major elements approximate a normal distribution, while the logarithmic-transformed data of trace elements conform to a normal distribution” [36].
The coefficient of variation (CV1) of the original data serves as an indicator of element dispersion; however, it may occasionally be susceptible to interference from high background values or non-mineralization factors, such as stratigraphy, weathering, and diagenetic modifications. Such interference can obscure the distinction between mineralization anomalies and uniformly distributed high backgrounds. Therefore, the ratio of the coefficient of variation of the original data (CV1) to that of the background data (CV2) provides a quantitative measure of the specific contribution to dispersion caused by mineralization. As shown in Figure 8, the CV1/CV2 ratios of the primary mineralization element U, its decay product Th, and associated elements W, Mo, As, and Pb are all greater than 1. This indicates that the high-value anomaly of U in the study area is primarily attributable to mineralization or hydrothermal activity. Moreover, this anomaly not only reflects the intensity of mineralization but also exhibits synergistic behavior with elements such as Th, Mo, As, and Pb during migration and precipitation processes.

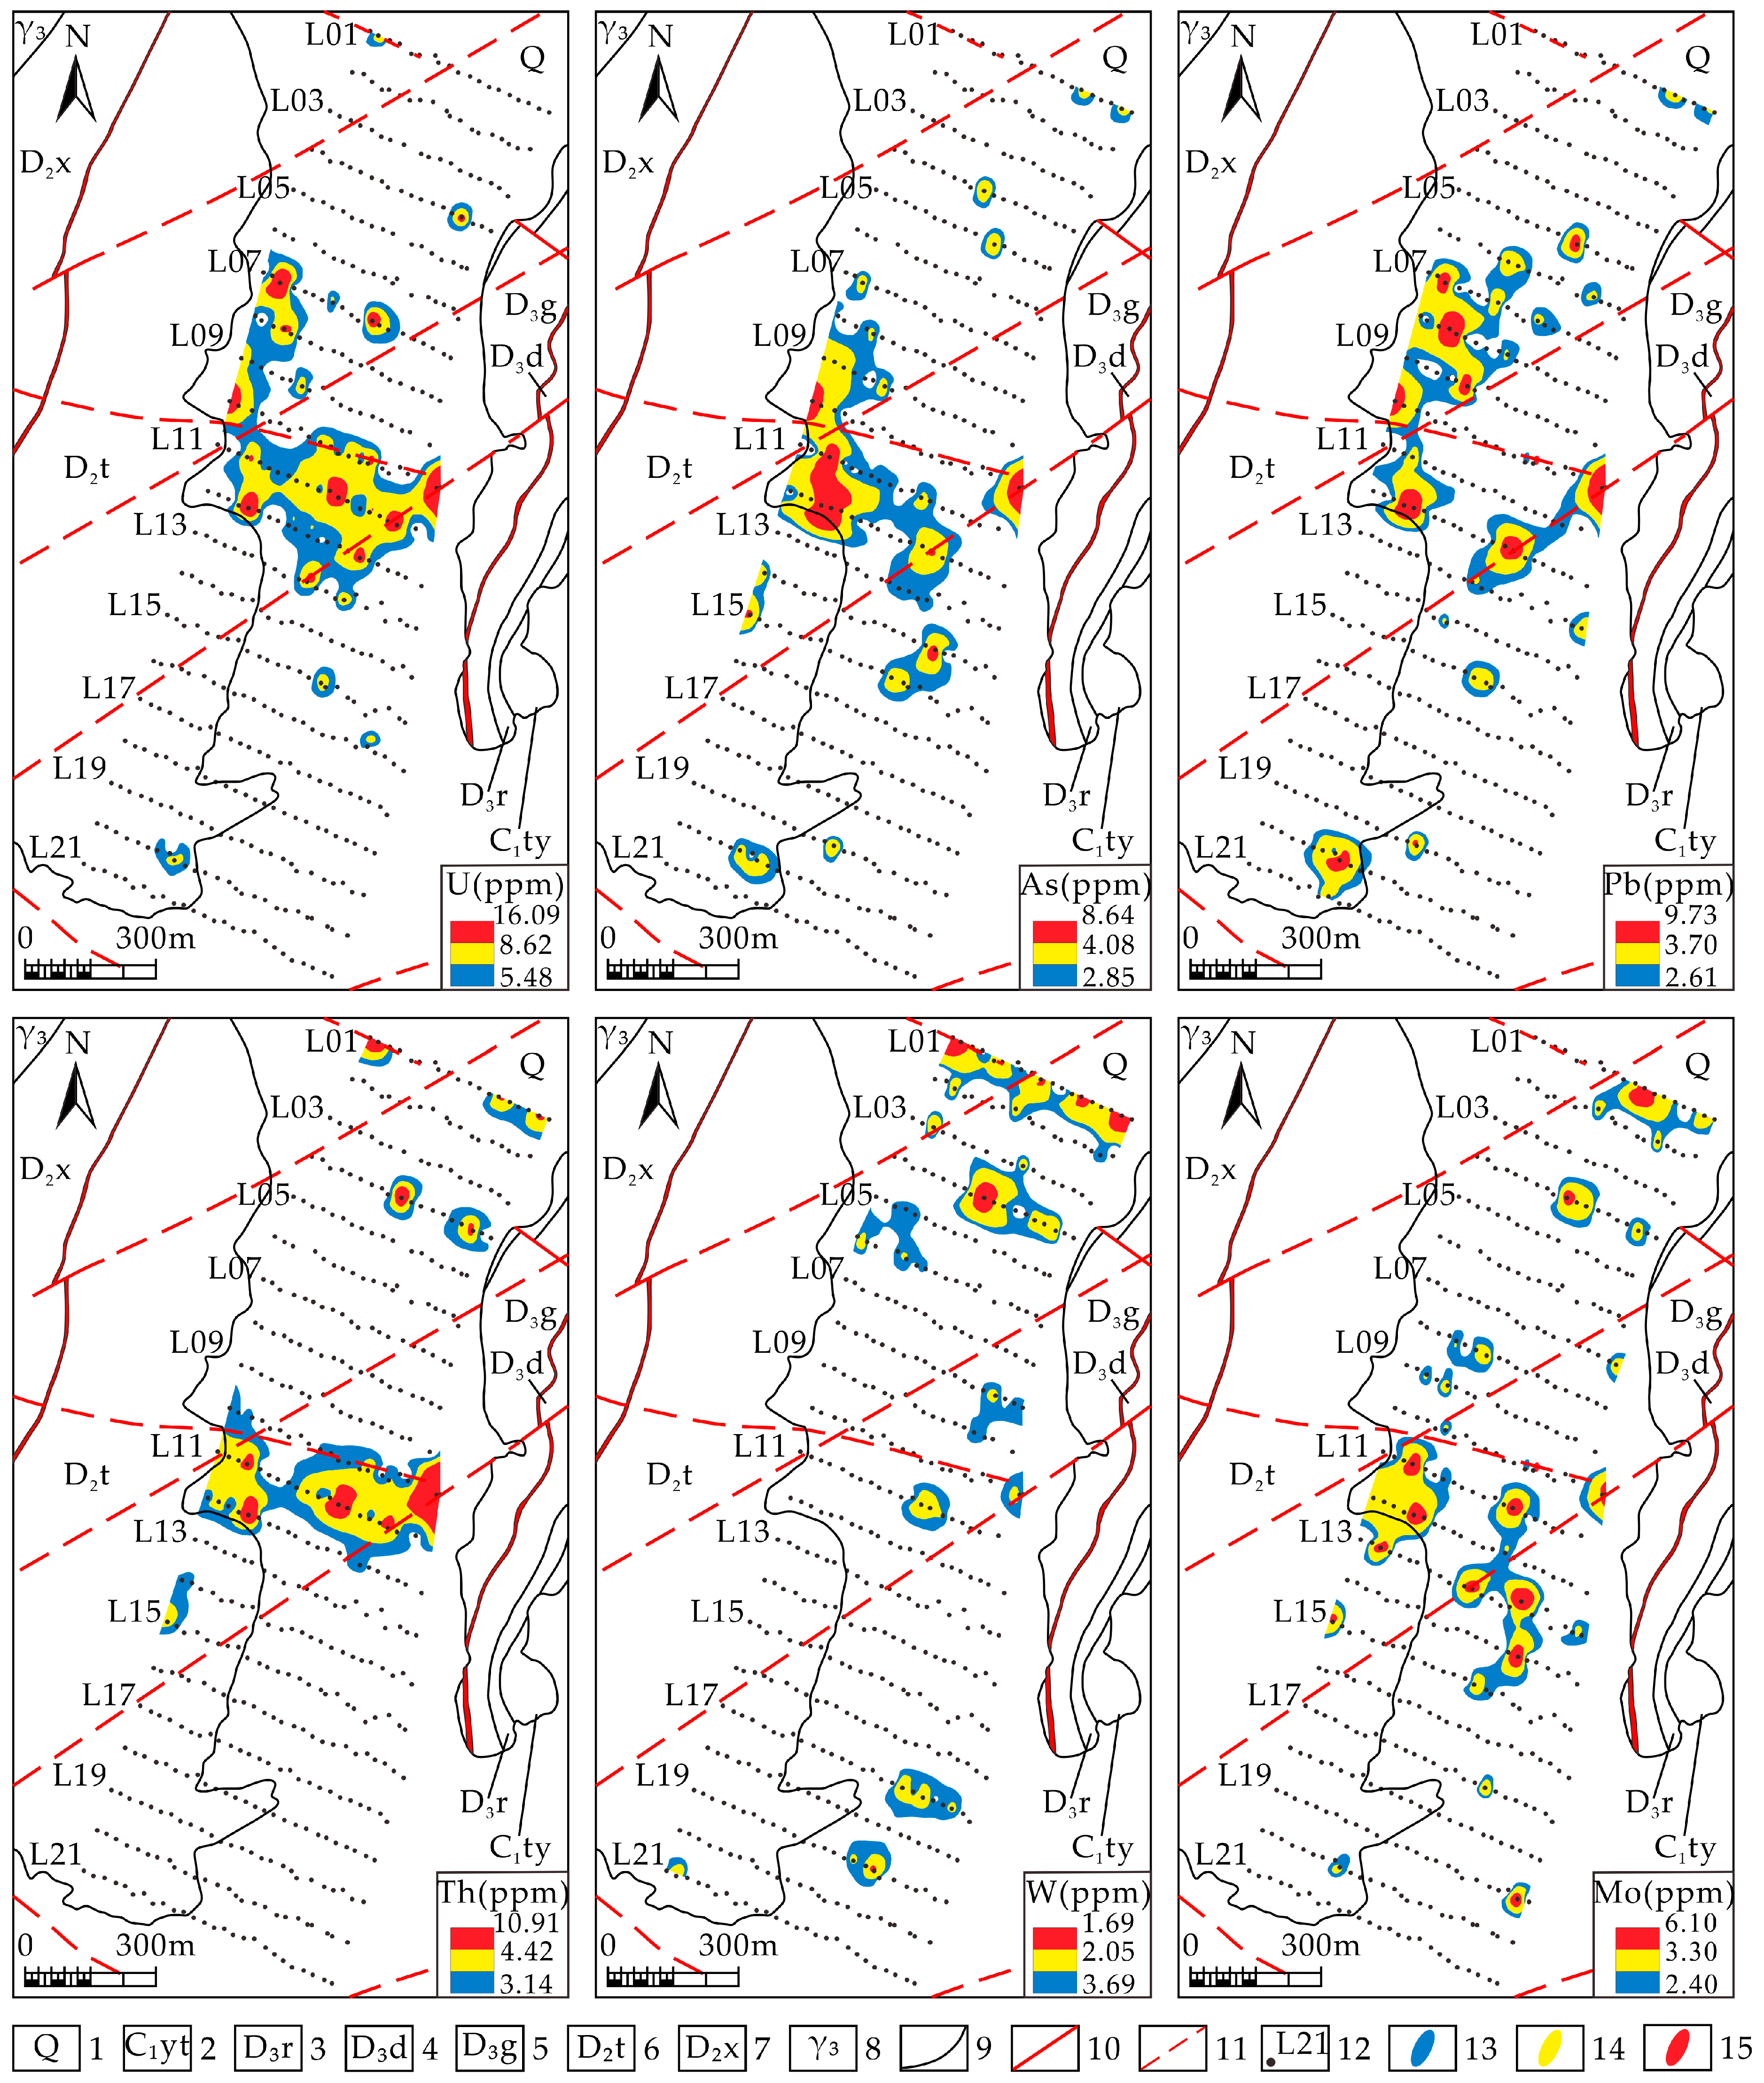
5.2. Planar Anomaly Characteristics of Geoelectrochemical Extraction Elements

In total, 462 sampling sites were stratified into subregions according to land-use types (mountainous areas, orchards, and paddy fields) within the study area. The boxplot methodology was systematically applied to iteratively eliminate single-element outliers within each subregion until normal distribution compliance was achieved, thereby establishing representative mean “ x - ” values. Subregion-processed datasets were generated by calculating the ratio of raw-element concentrations to their respective subregional means. These normalized values were then ranked in ascending order, with cumulative frequency thresholds of 85%, 92%, and 98%, designated as the lower limits of outer, intermediate, and inner geochemical anomaly zones, respectively (Table 3).
It can be observed from the single-element anomaly planar graph (Figure 9) that all six elements exhibit well-defined concentration centers, and the third-level anomaly zones are distinctly delineated. Consequently, in conjunction with the geological conditions of the study area, an analysis of the elemental abnormal characteristics was conducted.
The anomaly of element U is situated centrally within the study area, covering an area of 0.15 km2 with a peak value of 31.74 × 10⁻⁶. The anomalous region primarily corresponds to Quaternary sediments. This area is traversed by three northeast-oriented faults and one northwest-oriented fault. Notably, the concentrated centers in the eastern portion of the anomaly exhibit a beaded distribution pattern, which aligns well with the inferred orientation of the faults. As the primary ore-forming element, U undoubtedly serves as a reliable indicator of uranium ore bodies. However, considering the regional geochemical characteristics, it is evident that the western part of the study area comprises the Yuechengling granite body, where U contents in the uranium-bearing layer are typically lower than those in moderately acidic granite bodies [44]. Consequently, due to the influence of high-uranium granite bodies, the indicative significance of the U anomaly in this study area may not be singular.
The anomalous distributions of the As and Pb elements exhibit similarities and extend in a north-to-south orientation. The main body of the anomaly is situated in the central part of the study area. The anomalous region of As covers an area of 0.13 km2, with a peak value of 37.32 × 10⁻⁶. The concentration center is located at the intersection of inferred NE-trending and NW-trending faults, and the anomaly remains open to both the east and west regions of the study area. As migrates in hydrothermal fluids along faults in the form of As-S complexes (e.g., AsS33−) accompanied by U6+. Upon encountering reducing barriers, such as organic matter and pyrite, within carbon-silica mudstones, U6+ is reduced to U4+, resulting in the precipitation of uranium minerals. AsS33− either combines with Fe to form arsenopyrite or adsorbs onto the surface of pyrite. Common uranium ore assemblages in the study area include pitchblende-arsenopyrite-galena-pyrite associations. Consequently, the anomalous distribution of As serves as an effective indicator of uranium mineralization. The anomalous region of Pb spans an area of 0.13 km2, with a peak value of 16.75 × 10⁻⁶. The long axis of the anomaly trends in a north-northeast direction, and its concentration center is inferred to align along northeast-distributed faults in a beaded pattern. Pb functions as a comprehensive tracer of hydrothermal activities, uranium migration and enrichment, and mineralization ages [45]. The geochemical behavior of deposits is closely linked to the activation-precipitation process of uranium. A significant positive correlation exists between Pb and U in ores, making Pb a key associated element for uranium exploration [46].
The Th element anomaly is situated at the intersection of the central structure within the study area. Its long axis extends in the northwest direction. The anomaly covers an area of 0.11 km2, with a peak value of 36.52 × 10⁻⁶. Measurement lines L01 and L04 traverse the inner, middle, and outer zones of the anomalies induced by high localized values. As a decay product of the U element, the Th element anomaly primarily corresponds to moderately acidic magmatic rock masses and alkaline rock bodies associated with multi-stage uranium-bearing activities [47]. Furthermore, granite and carbon-silicone-mudstone uranium mineralization exhibits a close relationship with the spatial distribution of the Th element anomaly.
The W element anomaly is predominantly concentrated in survey lines L01 and L04. Extending along the northwest direction, faults are distributed in a linear pattern, with an anomalous area of 0.06 km2 and a peak anomaly value of 10.83 × 10⁻⁶. Based on the known section of line L00, lens-shaped scheelite occurs within the uranium-bearing layer of the study area. These scheelite deposits exhibit a close genetic and spatial relationship with uranium orebodies. According to previous studies, pitchblende has been found to contain relatively high concentrations of W. Under microscopic observation, white tungsten ore primarily occurs as net-like veins interspersed within pitchblende. Its strong depletion of heavy rare earth elements (HREEs) aligns with the characteristics of the northern Dushiling white tungsten deposit; however, the occurrence of uranium mineralization is significantly later than that of regional tungsten mineralization. These features suggest that tungsten source layers that were formed early may provide some ore-forming materials for subsequent uranium mineralization [2].
The Mo element anomaly is predominantly situated in the northern and central regions of the study area, exhibiting a band-like and bead-like distribution along structural trends. The anomalous area spans 0.11 km2, with a peak value of 17.71 × 10⁻⁶. For carbon-silicon-mudstone uranium deposits, the Mo element often demonstrates superior indicative properties compared to the U element. In shallow continental shelf sediments, abundant organic matter, phosphorus, iron, and manganese oxides are present, which can reduce multivalent elements such as molybdenum, uranium, and vanadium to lower-valence ions through reactions with hydrogen sulfide, thereby enriching them [42,48]. Consequently, when exploring concealed carbon-silicon-mudstone uranium deposits within the study area and utilizing multi-element combination anomalies such as U-Th-W-Mo-As-Pb while paying particular attention to the nesting sites of each element, this approach proves to be more effective than relying solely on the single-element anomaly of U.

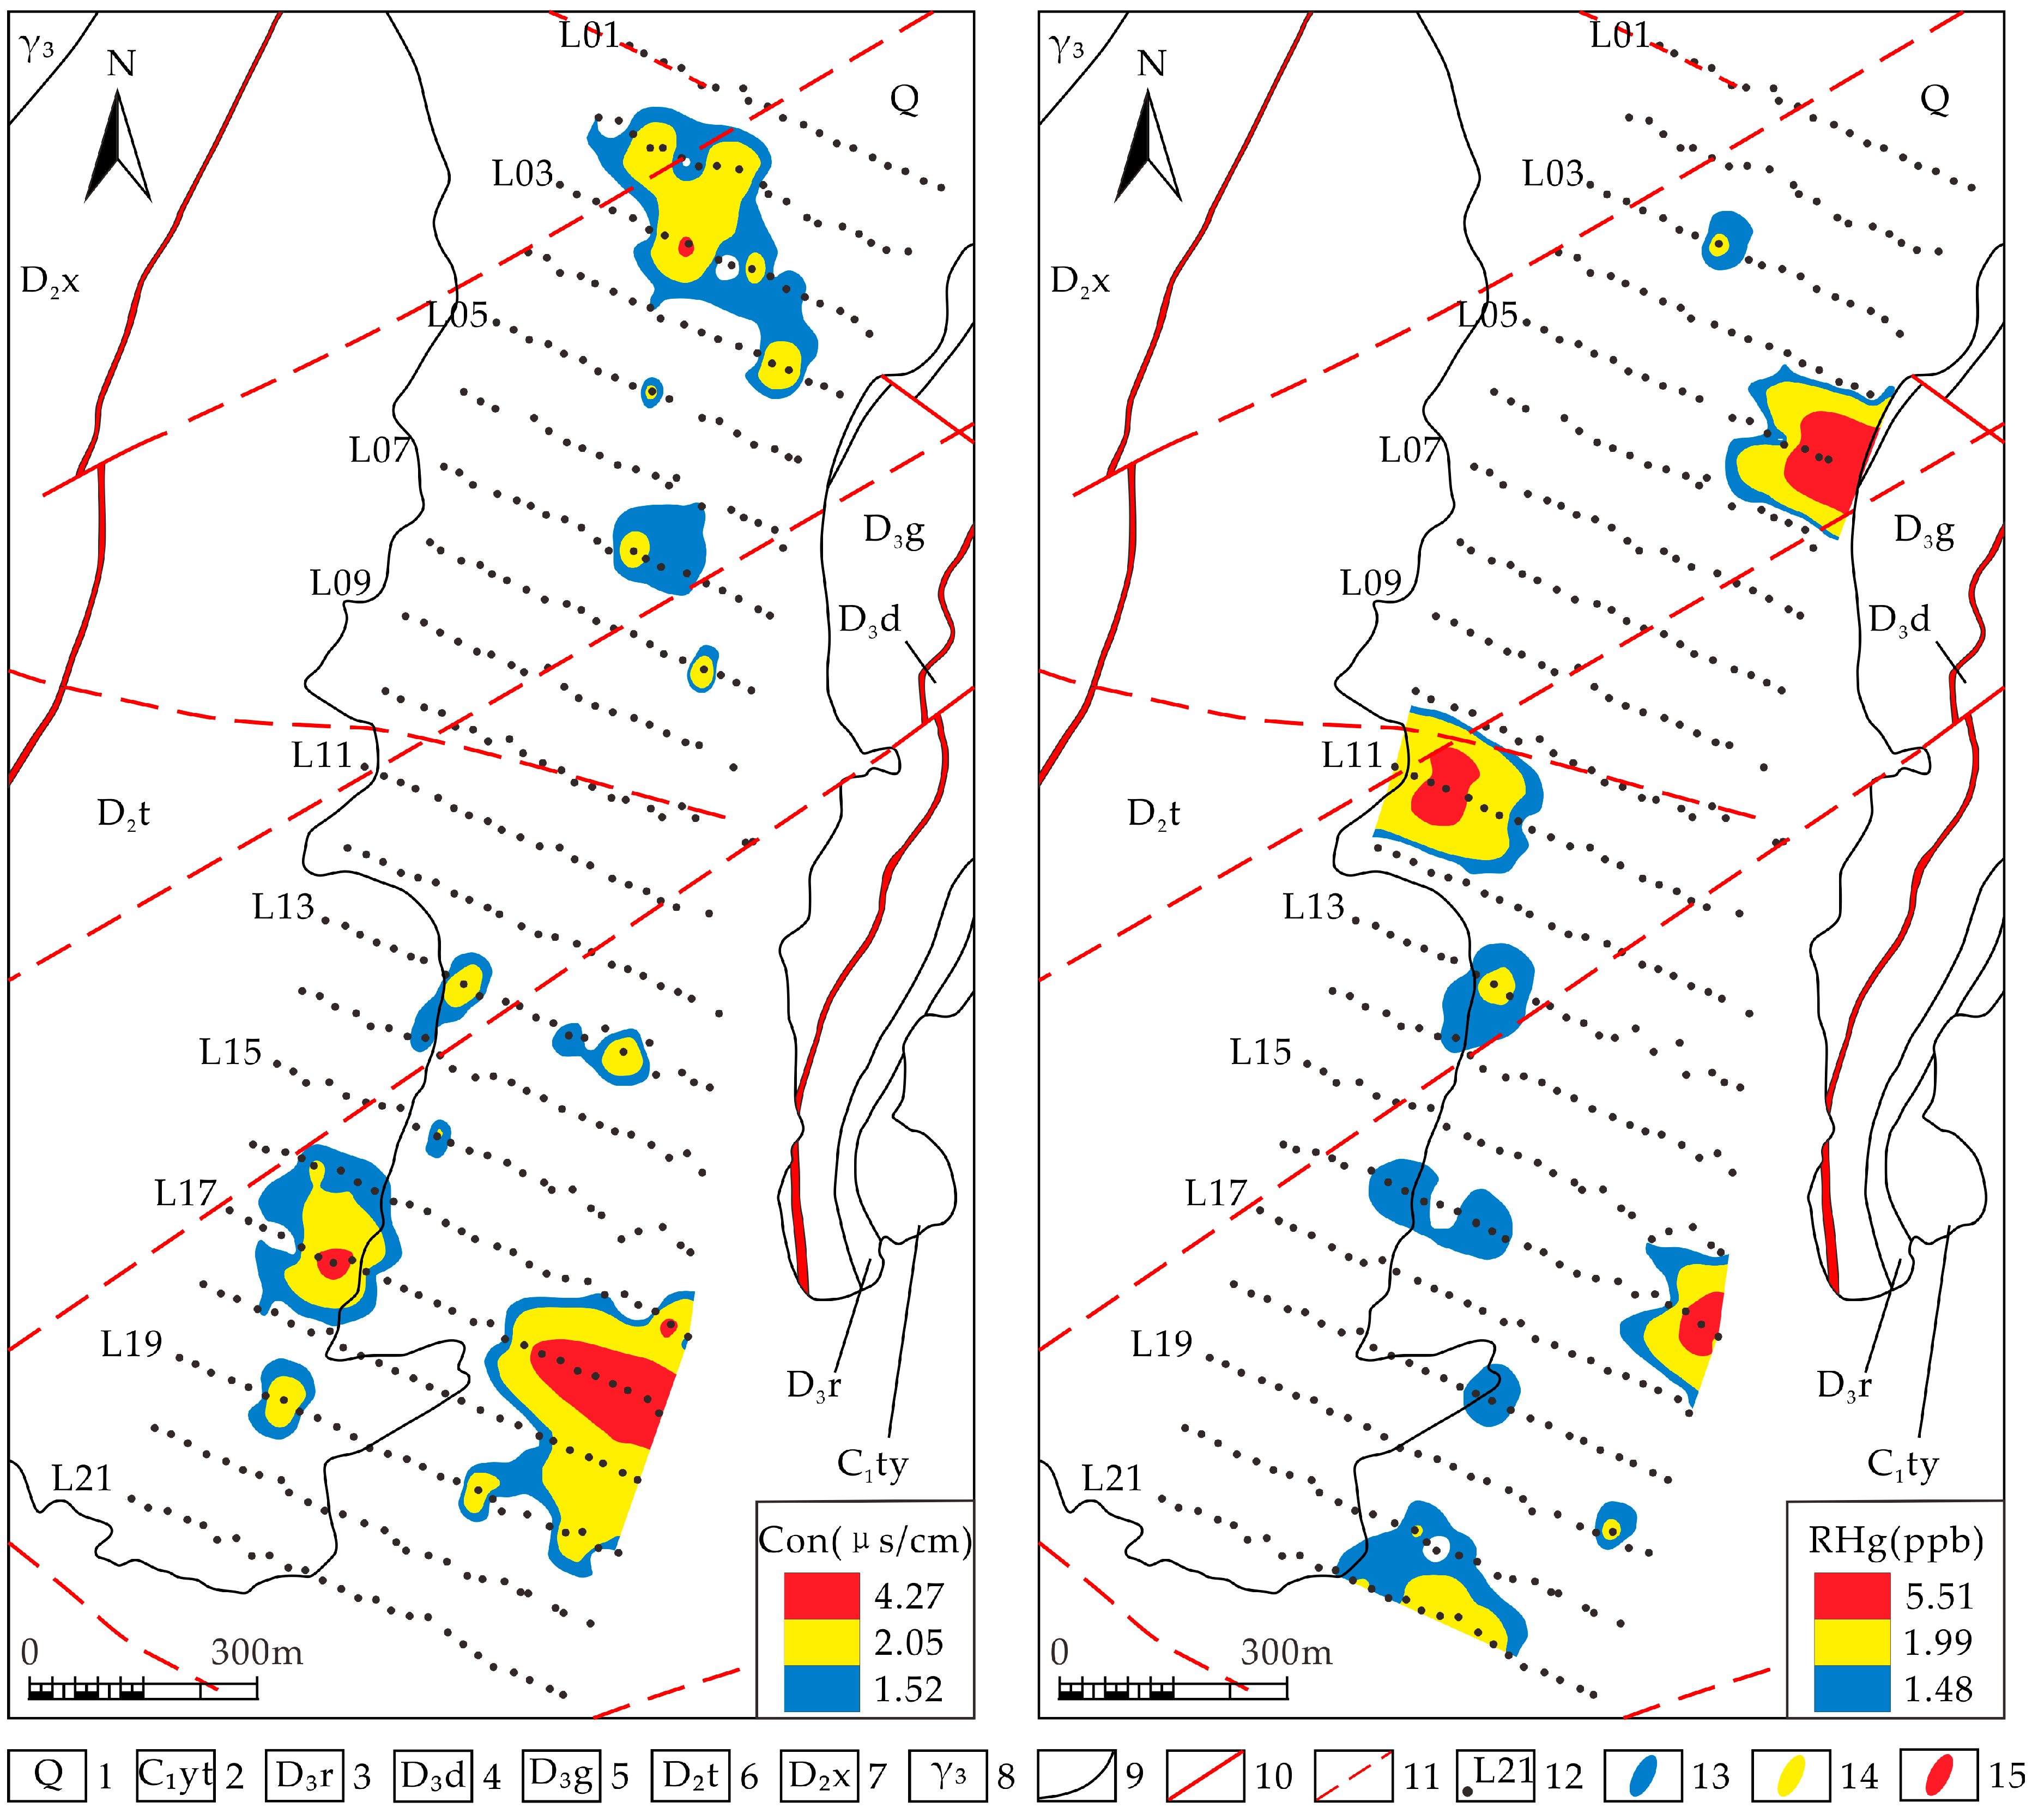
5.3. Abnormal Characteristics of Soil Ionic Conductivity and Thermally Released Soil Mercury

The anomalies in soil ionic conductivity and thermally released soil mercury were distributed across the study area from the north to the south. The anomaly’s zoning was distinct, exhibiting single-point, beaded, band-like, and irregular planar distributions (Figure 10). The anomalous area of soil ionic conductivity measured 0.16 km2, with a peak abnormal value of 5.22 μS/cm. These findings exhibited certain discrepancies compared to the anomalies extracted using in situ electrochemistry. At the convergence sites of each element’s anomalies, the conductivity anomalies were not pronounced. This could potentially be attributed to the uranium ore being situated near the geochemical barrier within the oxidation-reduction transition zone [49]. Additionally, there is an oxidation-reduction environmental gradient extending from the north to the south in the study area. In the deep oxidation zone, the low mineralization degree of interlayer water results in high soil ionic conductivity, thereby causing the observed conductivity anomalies. Conversely, in the deep reduction zone, the interlayer water exhibits a high mineralization degree while the soil ionic conductivity remains low, resulting in no apparent anomalies. This phenomenon arises due to variations in the types of ions contributing to conductivity between the deep interlayer water and surface soil water [29].
The anomalous area of thermally released soil mercury is 0.11 km2, with a peak value of 49.39 × 10⁻⁹. The anomaly is relatively large at the intersection of the L11 line’s structure, and it matches well with the anomalies of various elements extracted via geo-electrochemistry. Due to the strong penetrating power of mercury, the tendency of mercury vapor to rise along the structural fracture zone, and the control of uranium deposits by interlayer fractures zones [34,50], it is inferred that the two open anomalies located at L05 and L16 lines, as well as the string-of-beads anomalies distributed along the southeast direction at L13–21 lines, may indicate the existence of concealed fault fracture zones, which also have good potential for mineral exploration.

5.4. Target Area Delineation and Engineering Validation

5.4.1. Demarcation of the Target Area

Based on the metallogenic geological conditions and the coincidence of anomalies, including primary metallogenic elements, associated elemental anomalies, soil thermometric mercury, and ionic conductivity anomalies in the study area, four integrated anomaly zones and one priority anomaly verification area were delineated. These consist of one Class A integrated anomaly zone, two Class B integrated anomaly zones, and one Class C integrated anomaly zone (Figure 11).
The A-1 integrated anomaly zone, situated in the central part of the study area, comprises mono-elemental anomalies (U, As, Pb, Th, W, and Mo) and soil thermometric mercury anomalies, covering a total anomalous area of 0.4 km2. Geo-electrochemical extraction reveals the large-scale, high-intensity, and well-zoned anomalies of primary metallogenic and associated elements. Characterized by favorable metallogenic geological conditions, this anomaly zone is jointly controlled by two NE-trending inferred faults and one NW-trending fault. It incorporates high-temperature to low-temperature elemental associations, which are indicative of multiphase and multistage mineralization processes in the region. As the most prospective target for concealed uranium mineralization, the No. One priority anomaly verification area was delineated within the A-1 zone and prioritized for drilling verification.
The B-1 integrated anomaly zone, situated in the northern sector of the study area, consists of mono-elemental anomalies (As, Pb, Th, W, and Mo), with a total anomalous coverage of 0.08 km2. The associated elemental anomalies exhibit moderate spatial extent and relatively high intensities, demonstrating relatively complete zonation patterns. Notably, the tungsten (W) anomaly displays a belt-shaped distribution along an inferred NW-trending fault, establishing this zone as a preferred target area for scheelite exploration. Comprehensive analysis suggests modest mineral exploration potential in this zone.
The B-2 integrated anomaly zone, situated in the northern sector of the study area, incorporates mono-elemental anomalies (U, As, Pb, Th, W, and Mo) coupled with soil ionic conductivity and thermometric mercury anomalies, exhibiting a composite anomalous area of 0.08 km2. The associated elemental anomalies demonstrate moderate spatial extent with relatively high intensity, showing relatively complete zonation patterns. The ionic conductivity of the soil and the thermally released soil mercury in this region exhibit significant anomalies. It is hypothesized that concealed fractures and fragmentation zones may exist within the concealed fault fracture zones. In conjunction with the B-1 comprehensive anomaly area, utilizing a combination of trenching, drilling, and other exposure techniques is recommended to investigate continuous high-value-point areas and high-value connection zones between adjacent sampling lines. This approach will aid in the detailed analysis and evaluation of the two comprehensive anomaly regions.
The C-1 integrated anomaly zone, situated in the southern sector of the study area, comprises mono-elemental anomalies (U, As, Pb, and Mo), with a composite anomalous area of 0.03 km2. The primary metallogenic and associated elemental anomalies exhibit limited spatial extent and moderate continuity, demonstrating poor spatial correlations with soil ionic conductivity and thermometric mercury anomalies. No surface expressions of fault structures or ore-hosting strata outcrops were observed. However, the U-As-Pb-Mo element combination anomaly demonstrates good consistency in this region. Targeted geological surveys are recommended for conducting an initial assessment of the anomalies and mineralization-related alterations. Favorable locations for mineralization can then be identified for engineering deployment.

5.4.2. Engineering Validation

Through the geo-electrochemical extraction of element anomalies and assessments of mineralization potential, drilling verification was conducted in the No. One priority anomaly verification area. Drilling projects were successively arranged at points 2, 4, 8, and 12 on the L11 line, where each element showed a single-peak anomaly area, namely, ZK192-11, ZK190-7, ZK192-1, and ZK192-17 (Table 4). An industrial uranium orebody was discovered within the F1 interlayer compressional fracture zone. The orebody exhibits a lenticular morphology, with local occurrences of graphitization, hematitization, and pyritization. The ore body is controlled by drilling a length of 225 m, with a thickness ranging from 0.81 to 9.96 m, an average thickness of 6.67 m, a grade ranging from 0.05% to 1.32%, and an average grade of 0.19%. The ore types can be classified as fractured brecciated dolomite and argillaceous siltstone. The dolomite-type ore exhibits a dark gray color and massive structure, with well-developed hematitization and pyritization alterations. Calcite veinlets were observed to be distributed along cleavage fractures (Figure 12a). Petrographically, the ore is primarily composed of dolomite and calcite. Microscopic examination under alizarin red staining reveals dolomite grains ranging from 0.03 to 0.06 mm in size, accounting for 70–75% of the rock volume, while calcite and other minerals constitute 25–30%. A porphyroclastic to cataclastic texture is evident, characterized by mineral clasts set within a finer-grained matrix. The clasts show no significant displacement and display mutually adapted boundaries. Fractures are filled with comminuted host rock material and calcite (Figure 12c). Based on the backscattered electron images of the dolomite-type ores (not collected during this study but from the same Guangzitian area), uraninite occurs as cryptocrystalline aggregates displaying disseminated and veinlet textures. The veinlets range from 0.02 to 0.15 mm in width. Constituent particles and devitrified microcrystals range from tens to hundreds of nanometers in scale. Vein-type uraninite is closely associated with colloform pyrite and galena (Figure 12e). The siltstone-type ore exhibits grayish-black to grayish-green coloration (Figure 12b) and a fine silt texture. It is primarily composed of quartz clasts within an argillaceous cement. Quartz clasts range from 0.005 to 0.01 mm in size, are subrounded, well-rounded, and moderately sorted. The clay matrix is relatively minor in abundance (Figure 12d). According to the backscattered electron images of the siltstone-type ores (not collected in this study but from the same Guangzitian area), it was revealed that uraninite occurs as disseminated and colloform masses within intergranular spaces, with a particle size of 0.02–0.06 mm Galena is relatively abundant in the ore, primarily exhibiting colloform or veinlet textures in close association with uraninite. Certain galena grains occur as inclusion-like forms enveloped by uraninite (Figure 12f).
Based on the above analysis, in key anomaly verification area No. One, the ore body corresponds well with the anomaly (Figure 13), and it has considerable potential for mineral exploration. Drilling projects can be arranged from the west to the east based on the characteristics of the geo-electrochemical extraction profile and planar anomalies to control the deep ore body. Similarly, the A-1, B-1, and B-2 comprehensive anomaly zones also have good prospects for mineral exploration. Conducting more in-depth research and engineering arrangements for these areas is recommended.

6. Conclusions

(1) The research results regarding the effectiveness of geo-electrochemical integrated technology in mineral exploration along the L00 line demonstrate that this technology can accurately identify the locations of deep ore bodies. It is evident that a technical approach primarily based on geo-electrochemical extraction and measurement—complemented by soil ionic conductivity and thermally released soil mercury, is both feasible and effective in identifying concealed carbon-silicon-mudstone uranium minerals within the study area;
(2) Based on the geological characteristics, geochemical features, and genetic analysis of the deposit in the study area, the formation of carbonate rocks and siliceous rocks, interlayer compression fracture zones, cross-cutting fault zones, and surrounding rock alteration are identified as key geological indicators in prospecting. Abnormalities in primary ore-forming elements such as U, Th, and Mo serve as direct prospecting indicators, while W, As, and Pb function as indirect indicators. Additionally, soil ionic conductivity and thermally released soil mercury are considered significant prospecting indicators;
(3) Based on the convergence sites of U-Th-W-Mo-As-Pb anomalies and in conjunction with metallogenic geological conditions, one key anomaly verification area, one Class A comprehensive anomaly area, two Class B comprehensive anomaly areas, and one Class C comprehensive anomaly area were delineated. With respect to the Guangzitian deposit, this provides crucial technical support and a theoretical foundation for the principles of “exploring the edges and identifying the bottom, delving deep and uncovering blind spots” and “connecting points to form a surface” in the uranium mining areas in northern Guangxi.

Author Contributions

Writing—original draft preparation, X.Z. and Y.M.; Writing—review and editing, M.W. and Q.L.; Collecting the samples, X.Z., Y.M., Y.J. (Yuheng Jiang), W.Y., J.Z. and M.W.; Software and data processing, X.Z. and Y.J. (Yuxiong Jiang); Funding acquisition, M.W. and Q.L. All authors have read and agreed to the published version of the manuscript.

Funding

This research was funded by the National Natural Science Foundation of China (Grant No. 42163004) and the Guangxi Natural Science Foundation (2025GXNSFAA069927).

Institutional Review Board Statement

Not applicable.

Informed Consent Statement

Not applicable.

Data Availability Statement

Dataset available on request from the authors.

Conflicts of Interest

The authors declare no conflicts of interest.

References

  1. Xu, D.R.; Chi, G.X. Diversity of uranium deposits in China—An introduction to the special issue. Ore Geol. Rev. 2021, 129, 103944. [Google Scholar] [CrossRef]
  2. Xiao, W.; Fan, H.H. Genesis of the Guangzitian uranium—Tungsten deposit in northern Guangxi—Geochemical evidences from in-situ U-Pb dating of pitchblende and mineral geochemistry. Geol. Rev. 2022, 68, 831–844. [Google Scholar]
  3. Cheng, Q. Singularity theory and methods for mapping geochemical anomalies caused by buried sources and for predicting undiscovered mineral deposits in covered areas. J. Geochem. Explor. 2012, 122, 55–70. [Google Scholar] [CrossRef]
  4. Liang, M.; Gao, W. Soil geochemical characteristics and ore prospecting prediction in Gaojianzi area, northern Hebei province. Geoscience 2023, 37, 1567–1579. [Google Scholar]
  5. Liu, P.F.; Wen, M.L. The application of geo-electrochemical integrated technology to the prospecting in the Xiyi Pb-Zn deposit, Yunnan province. Geophys. Geochem. Explor. 2016, 40, 655–660. [Google Scholar]
  6. Liu, P.F.; Luo, X.R. Geo-electrochemical anomaly prospecting for uranium deposits in southeastern China. Appl. Geochem. 2018, 97, 226–237. [Google Scholar] [CrossRef]
  7. Qiu, W.; Luo, X.R. Comparative study between the geo-electrochemical method and other geo-chemical exploration methods. Gold Sci. Technol. 2011, 19, 7–11. [Google Scholar]
  8. Gao, Y.; Luo, X.R. Geo-electrochemical extraction method for concealed gold deposits prospecting in high-altitude permafrost regions: A case study from the Dagou area, Golmud, Qinghai province, China. Guilin Univ. Technol. 2017, 37, 274–279. [Google Scholar]
  9. Li, S.; Sun, B.B. 1:50 000 electro-geochemical survey in the Luokedun lead-zinc polymetallic deposit, Inner Mongolia. Geophys. Geochem. Explor. 2020, 44, 514–522. [Google Scholar]
  10. Kang, M.; Luo, X.R. Improvement and applied results of geoelectrical chemistry methods. Geol. Explor. 2003, 5, 63–66. [Google Scholar]
  11. Luo, X.R.; Yang, X. Research on the detection of concealed ore deposits via geo-electrochemical measurements and preliminary surveys for mineral exploration. Geol. Explor. 1989, 12, 43–51. [Google Scholar]
  12. Liu, P.F.; Luo, X.R. Main study progress and prospect of geo-electrochemistry technology in China. Met. Mine 2022, 11, 10–22. [Google Scholar]
  13. Hou, D.M.; Luo, X.R. A comparative study of the prospecting for hidden uranium deposits by applying geo-electrochemical method in China and Australia. Geol. Bull. China 2012, 31, 126–135. [Google Scholar]
  14. Man, R.H.; Luo, X.R. Application of the geo-electrochemical method on prospecting for concealed uranium deposits in the Dongsheng area of the Ordos Basin. Bull. Mineral. Petrol. Geochem. 2015, 34, 1007–1013. [Google Scholar]
  15. Huang, N.N. The Research of Using Geo-Eletrochemical Integration Technology to Concealed Uranium Deposits in Dachengliang Area of Inner Mongolia. Master’s Thesis, Guilin University of Technology, Guilin, China, April 2017. [Google Scholar]
  16. Wen, M.L.; Luo, X.R. Electro-geochemical method in search of concealed uranium deposits in a area of Jiangxi province. Mineral. Explor. 2011, 2, 404–408. [Google Scholar]
  17. Ouyang, F.; Luo, X.R. Characteristics of geo-electric extraction anomalies and prospecting prediction in Lejia survey area, Xiangshan orefield, Jiangxi province. Met. Mine 2022, 11, 154–166. [Google Scholar]
  18. Wen, X.Q.; Luo, X.R. New method study in search of uranium deposit. Guilin Univ. Technol. 2003, 1, 26–30. [Google Scholar]
  19. Zhang, J.; Wen, M.L. Prospecting prediction using geoelectric extraction in the periphery of the No.374 deposit in Rongshui, Guangxi. Geoscience 2024, 38, 214–223. [Google Scholar]
  20. Zhao, X.Y.; Ouyang, F. Application of geo-electrochemical methods to prospecting in the concealed uranium: A case study of Lujing area, Zhuguang. Met. Mine 2022, 11, 167–178. [Google Scholar]
  21. Tang, B. Research on Mineralization Mineralogical Characteristics and Metallogenic Mechanism of Guangzitian Deposits. Master’s Thesis, East China University of Technology, Nanchang, China, June 2017. [Google Scholar]
  22. He, Y.K.; Zhang, D.H. Fluid geochemistry and its mineralization significance of the uranium ore deposit in Quanzhou, Guangxi province. Geol. Explor. 2010, 46, 670–680. [Google Scholar]
  23. Zhang, L.; Wang, F.Y. Metallogenesis of uranium deposits in China: Perspectives from uraninite chemistry. Ore Geol. Rev. 2024, 173, 106251. [Google Scholar] [CrossRef]
  24. Xiao, W. Mineralization of Uranium Deposits in the Quanzhou Ore Field in Guangxi Province. Master’s Thesis, China University of Geosciences, Beijing, China, May 2015. [Google Scholar]
  25. Luo, X.R. The Mechanism of Electro-Geochemical Halo-Formation and the Application of Electrochemical Method to Exploration of Metallic Ore Deposits. Ph.D. Thesis, Hefei University of Technology, Hefei, China, May 2005. [Google Scholar]
  26. Liu, P.F.; Wen, M.L. Geo-electrochemical extraction technology test and the prospecting prediction in cold plateau area. Geol. China 2015, 42, 2000–2007. [Google Scholar]
  27. Luo, X.R. Research and application effectiveness of novel methods in concealed deposit exploration. Geol. Explor. 1995, 1, 44–49. [Google Scholar]
  28. Wen, M.L.; Ouyang, F. Anomaly characteristics, components of soil ionic conductivity and prospecting prediction of tin deposits in Pinggui area, Guangxi. Geol. Bull. China 2013, 32, 784–789. [Google Scholar]
  29. Hou, L.H.; Tan, K.R. Experimental study on soil ionic conductivity measurement in prospecting and exploration of in-situ leachable sandstone-type uranium deposits. Geotecton. Metallog. 2002, 4, 448–451. [Google Scholar]
  30. Luo, X.R.; Zhou, T.F. Ionic conductivity anomaly characteristics and ionic components of soil in gold deposits in the Daxin’anlin forest overburden region. Geol. Explor. 2005, 2, 46–50. [Google Scholar]
  31. Zheng, C.J.; Luo, X.R. Comparison of conventional-warming RHg mercury release of soil with ladder-warming RHg mercury release, and ore prediction in Jielagepu au deposit, southern Tibet. Mineral. Petrol. 2018, 38, 99–110. [Google Scholar]
  32. Wei, J.S. Application and discussion of geochemical mercury measurement methods. Geophys. Geochem. Explor. 1999, 1, 22–28. [Google Scholar]
  33. Su, H.Y.; Luo, X.R. Application of soil heat-released mercury survey in prospecting prediction of copper-nickel polymetallic deposits in western Mianluening, Shaanxi province. Min. Explor. 2021, 12, 338–347. [Google Scholar]
  34. Zhou, Z.Y.; Luo, X.R. Measurement of heat releasing hg of soil and prospecting prediction in Shilongshan polymetallic gold deposit, Luoning county of Henan province. Mineral. Petrol. 2018, 38, 49–58. [Google Scholar]
  35. Liu, P.F.; Luo, X.R. Retrospect and prospect for geo-electrochemical technology research in the past three decades of China. J. Guilin Univ. Technol. 2018, 38, 47–55. [Google Scholar]
  36. Tang, R.; Ouyang, F. The prediction of electrochemical prospecting in Youfang area of the Xiangshan orefield. Geophys. Geochem. Explor. 2021, 45, 1425–1438. [Google Scholar]
  37. Shi, Y.H.; Yang, Z.P. Determination of trace elements in electroadsorption mineral exploration foam plastic samples by ICP-MS. Spectrosc. Spectr. Anal. 2009, 29, 1687–1690. [Google Scholar]
  38. Wang, D. Study on Searching for Concealed Uranium Deposits by Geo-Electrochemical Survey in Lejia Area, Xiangshan, Jiangxi Province. Master’s Thesis, Guilin University of Technology, Guilin, China, March 2020. [Google Scholar]
  39. Lu, C.Y.; Ouyang, F. Application of geo-electrochemical extraction technology in Chuandong survey area of Zhugongtang lead-zinc mine in Guizhou [J/OL]. Min. Explor. 2024, 1–17. [Google Scholar]
  40. Chen, J.Y.; Bai, Q. Discussion on the prospecting directions of carbonaceous-siliceous-argillaceous type uranium deposit in Hongliuhe-Fangshankou area, Gansu. Uranium Geol. 2020, 36, 500–509. [Google Scholar]
  41. Zhong, F.J.; Pan, J.Y. Exploration targeting model for carbonaceous-siliceous-argillaceous (C-SA) type uranium deposits in China. Acta Mineral. Sin. 2015, 35 (Suppl. S1), 372–373. [Google Scholar]
  42. Fu, J.; Zhao, N.B. Indicator characteristics of elementary geochemistry and anomaly model for Chinese carbonaceous-siliceous-argillaceous rock type uranium deposit. Uranium Geol. 2014, 30, 298–304. [Google Scholar]
  43. Wen, M.L.; Luo, X.R. A study of the ore-prospecting work based on multiple geosciences information in the Jinchuan Cu-Ni deposit. Geol. China 2013, 40, 594–601. [Google Scholar]
  44. Fu, J.; Zhao, N.B. Characteristics of indicator elements combination and genesis of four types of uranium mineralization in China. Geophys. Geochem. Explor. 2015, 39, 217–221. [Google Scholar]
  45. Song, H.; Xu, Z.Q. Geochemistry and LA-ICP-MS zircon U-Pb geochronological dating of diabase dykes and their relationship with mineralization of the carbonate-siliceous-pelitic rock type uranium deposits in Daxin-Qinjia, western Guangxi. Acta Petrol. Sin. 2019, 35, 2845–2863. [Google Scholar]
  46. Ye, Y.Q.; Chen, Y.L. Vertical zoning characteristics of trace element in gangue mineral of uranium deposit 510-1 in Zoige. Uranium Geol. 2015, 31, 510–516. [Google Scholar]
  47. Fu, J.; Zhao, N.B. Geochemical characteristics of uranium, thorium and potassium anomalies in China in relation to uranium mineralization. Geophys. Geochem. Explor. 2014, 38, 200–204. [Google Scholar]
  48. Fu, J.; Zhao, N.B. Geochemical anomaly characteristics of molybdenum in China and their indicative role for uranium mineralization. In Proceedings of the 2013 Annual Academic Conference of the Chinese Nuclear Society, Harbin, China, 11 September 2013. [Google Scholar]
  49. Zhao, N.B.; Fu, J. Study on the anomaly extraction of soil metal active state in sandstone type uranium deposit. Bull. Sci. Technol. 2019, 35, 33–39. [Google Scholar]
  50. Zou, D.F.; Yao, T. Experimental study on the application of soil thermorelease mercury methodin a gold mine area of Jiangxi province. World Nonferr. Met. 2020, 18, 65–67. [Google Scholar]
Figure 1. Location diagram of the study area in various administrative divisions of China, Guangxi and the northern of Guangxi (ad).
Applsci 15 07426 g001
Figure 2. Schematic geological cross-section of the Daxijiang faulted basin, Northern Guangxi [24]. 1—Bianxi Formation: Sandstone interbedded with shale; 2—Baidong Formation: limestone; 3—Huang’ai Formation: sandstone interbedded with shale; 4—Xindu Formation: sandstone with basal conglomerate; 5—Tangjiawan Formation: dolomite and bioclastic limestone; 6—Guilin Formation: limestone and dolomite; 7—Dongcun Formation: argillaceous dolomite and sandstone; 8—Yaoyunling Formation: limestone; 9—Yingtang Formation: sandstone and shale interbedded with limestone; 10—Huangjin Formation: limestone; 11—Simen Formation: sandstone and shale with lenticular limestone, coal-bearing; 12—Caledonian granite; 13—Yanshanian granite; 14—mineralized fault zone and numbers; 15—coal sea.
Applsci 15 07426 g002
Figure 3. Geological map (a) and tectonic location map (b) of the study area. Revised based on a specific work report from the Nuclear Geological Brigade of Guangxi Zhuang Autonomous Region, 310. 1—Quaternary; 2—Yintang Formation, Lower Carboniferous; 3—Yaoyunling Formation, Lower Carboniferous; 4—Rongxian Formation, Upper Devonian; 5—Dongcun Formation, Upper Devonian (Members 2—3); 6—Dongcun Formation, Upper Devonian (Member 1); 7—Guilin Formation, Upper Devonian (Member 2); 8—Guilin Formation, Upper Devonian (Member 1); 9—Tangjiawan Formation, Middle Devonian; 10—Xindu Formation, Middle Devonian (Member 5); 11—Xindu Formation, Middle Devonian (Member 4); 12—Xindu Formation, Middle Devonian (Member 3); 13—Xindu Formation, Middle Devonian (Member 2); 14—Xindu Formation, Middle Devonian (Member 1); 15—Caledonian granite; 16—stratigraphic unconformity boundary; 17—fault; 18—inferred fault; 19—exploration line number.
Applsci 15 07426 g003
Figure 4. Schematic diagram of an independently powered dipole geoelectric extraction device and its electrode structure. 1—DC power supply; 2—conductive wires; 3—ion absorber; 4—adsorption materials; 5—filter paper; 6—graphite carbon rods.
Applsci 15 07426 g004
Figure 5. Integrated geological-geo-electrochemical anomaly profile of Line L00. 1—Quaternary; 2—Xindu Formation, Middle Devonian (Member 5); 3—Tangjiawan Formation, Middle Devonian; 4—interlayer fracture zones and serial number; 5—industrial-grade uranium ore body; 6—industrial-grade tungsten ore body; 7—stratigraphic boundary; 8—borehole and serial number.
Applsci 15 07426 g005
Figure 6. Schematic diagram of the geological-geo-electrochemical prospecting model in the study area.
Applsci 15 07426 g006
Figure 7. Box diagram of elemental content after logarithmic conversion.
Applsci 15 07426 g007
Figure 8. Degree of element dispersion in study area.
Applsci 15 07426 g008
Figure 9. Single-element anomaly map of geoelectrical extraction in the study area. 1—Quaternary; 2—Yingtang Formation, Lower Carboniferous; 3—Rongxian Formation, Upper Devonian; 4—Dongcun Formation, Upper Devonian; 5—Guilin Formation, Upper Devonian; 6—Tangjiawan Formation, Middle Devonian; 7—Xindu Formation, Middle Devonian; 8—Caledonian granite; 9—stratigraphic boundary; 10—fault; 11—inferred fault; 12—sampling location and exploration line number; 13—outer anomaly zone; 14—middle anomaly zone; 15—inner anomaly zone.
Applsci 15 07426 g009
Figure 10. Anomaly map of soil ionic conductivity and thermally released mercury in the study area. 1—Quaternary; 2—Yingtang Formation, Lower Carboniferous; 3—Rongxian Formation, Upper Devonian; 4—Dongcun Formation, Upper Devonian; 5—Guilin Formation, Upper Devonian; 6—Tangjiawan Formation, Middle Devonian; 7—Xindu Formation, Middle Devonian; 8—Caledonian granite; 9—stratigraphic boundary; 10—fault; 11—inferred fault; 12—sampling location and exploration line number; 13—outer anomaly zone; 14—middle anomaly zone; 15—inner anomaly zone.
Applsci 15 07426 g010
Figure 11. Comprehensive anomaly map of the study area. 1—Quaternary; 2—Yingtang Formation, Lower Carboniferous; 3—Rongxian Formation, Upper Devonian; 4—Dongcun Formation, Upper Devonian; 5—Guilin Formation, Upper Devonian; 6—Tangjiawan Formation, Middle Devonian; 7—Xindu Formation, Middle Devonian; 8—Caledonian granite; 9—stratigraphic boundary; 10—fault; 11—inferred fault; 12—sampling location and exploration line number; 13—U element anomaly; 14—As element anomaly; 15—Pb element anomaly; 16—Th element anomaly; 17—W element anomaly; 18—Mo element anomaly; 19—comprehensive anomaly area and number; 20—key anomaly verification area and number.
Applsci 15 07426 g011
Figure 12. Images of the uranium ore hand specimen from borehole ZK192-17, identification photomicrographs of thin-polished sections, and in situ ore microscopic features. (a)—Hand specimen of grey cataclastic-micritic calcareous dolomite ore; (b)—hand specimen of fine-grained silty sandstone ore; (c)—cataclastic texture of the dolomite ore; (d)—fine-grained silt texture of the silty sandstone ore; (e)—veinlet pitchblende encrusting galena and pyrite within dolomite ore (reflected light) [24]; (f)—colloidal pitchblende coexisting with scheelite and galena in silty sandstone ore (backscattered electron image) [24]. Ptc: pitchblende; Py: pyrite; Gn: galena; Sh: scheelite.
Applsci 15 07426 g012
Figure 13. The comprehensive geological geodesic anomaly profile of Line 11.
Applsci 15 07426 g013
Table 1. Detection limit of inductively coupled plasma mass spectrometry method.
ElementDetection Limit (μg/g)ElementDetection Limit (μg/g)
U0.0065Mo0.0048
Th0.1670As0.0717
W0.0498Pb0.8620
Table 2. Statistical parameters of geo-electric chemistry element contents.
Data CategoryParametersUThWMoAsPb
Original dataSample Size N1462462462462462462
Maximum6.7211.720.560.6010.5882.47
Minimum0.020.020.010.010.010.91
Average0.890.760.070.050.6011.58
Standard Deviation1.241.210.060.060.8313.53
Skewness2.554.744.574.524.891.89
Kurtosis6.6630.5428.9930.1846.903.40
Coefficient of
Variation CV1
1.391.590.851.171.381.17
Eliminate the data with exceptional valuesSample Size N2393405441433378338
Average0.450.430.060.040.304.65
Standard Deviation0.390.360.030.030.242.82
Coefficient of
Variation CV2
0.870.830.470.740.820.61
CV1/CV21.601.921.811.581.681.92
Note: The unit for element content is μg/g.
Table 3. Elemental anomaly zoning values in the study area.
ElementOriginal DataData After Partition Processing
MaximumMinimumAverage85%92%98%MaximumMinimumAverage85%92%98%
U6.720.030.891.592.163.1231.740.102.965.437.4210.13
Th11.720.030.761.421.993.3036.520.051.863.344.646.93
W0.560.000.070.090.100.1810.830.021.221.521.853.31
Mo0.600.010.050.080.100.1417.710.141.472.062.543.77
As10.580.000.601.091.511.9637.320.041.772.823.676.37
Pb82.480.9211.5820.9227.1434.9216.750.081.602.543.245.20
Note: The unit for element content is μg/g.
Table 4. Borehole parameters for Line L11.
ParameterZK192-11ZK190-7ZK192-1ZK192-17
Elevation (m)258.10246.65231.44228.32
Drilling Depth (m)458.92514.68643.87781.45
Initial Borehole Inclination (°)85.781.482.481.8
Depth of Ore Encounter (m)442.08498.89636.71360.80
True Thickness of Ore Body (m)6.739.170.819.96
Ore Body Grade Range (%)0.05–1.32
Average Ore Body Grade (%)0.186
Disclaimer/Publisher’s Note: The statements, opinions and data contained in all publications are solely those of the individual author(s) and contributor(s) and not of MDPI and/or the editor(s). MDPI and/or the editor(s) disclaim responsibility for any injury to people or property resulting from any ideas, methods, instructions or products referred to in the content.

