Article

The Development of a Lane Identification and Assessment Framework for Maintenance Using AI Technology †

by
Hohyuk Na
1,*,
Do Gyeong Kim
1,2,
Ji Min Kang
1 and
Chungwon Lee
3
1
Department of Transportation Engineering, University of Seoul, Seoul 02504, Republic of Korea
2
Department of Urban Big Data Convergence, Graduate School, University of Seoul, Seoul 02504, Republic of Korea
3
Department of Civil and Environmental Engineering, Seoul National University, Seoul 08826, Republic of Korea
*
Author to whom correspondence should be addressed.
This article is a revised and expanded version of a paper entitled “Development of a Lane Identification and Assessment Framework for Maintenance Using AI Techniques”, which was presented at the 16th ITS European Congress, held in Seville, Spain, 19–21 May 2025.
Appl. Sci. 2025, 15(13), 7410; https://doi.org/10.3390/app15137410
Submission received: 26 May 2025 / Revised: 26 June 2025 / Accepted: 30 June 2025 / Published: 1 July 2025

Abstract

This study proposes a vision-based framework to support AVs in maintaining stable lane-keeping by assessing the condition of lane markings. Unlike existing infrastructure standards focused on human visibility, this study addresses the need for criteria suited to sensor-based AV environments. Using real driving data from urban expressways in Seoul, a YOLOv5-based lane detection algorithm was developed and enhanced through multi-label annotation and data augmentation. The model achieved a mean average precision (mAP) of 97.4% and demonstrated strong generalization on external datasets such as KITTI and TuSimple. For lane condition assessment, a pixel occupancy–based method was applied, combined with Canny edge detection and morphological operations. A threshold of 80-pixel occupancy was used to classify lanes as intact or worn. The proposed framework reliably detected lane degradation under various road and lighting conditions. These results suggest that quantitative, image-based indicators can complement traditional standards and guide AV-oriented infrastructure policy. Limitations include a lack of adverse weather data and dataset-specific threshold sensitivity.

1. Introduction

Roads, as essential elements of transportation infrastructure, support spatial mobility for socio-economic activities and thus contribute to societal and economic development [1]. To accommodate constant vehicle and pedestrian movement, facilities such as traffic control devices and safety installations are implemented to ensure efficient flow and reduce traffic-related losses. Most countries set national or local standards prescribing installation and maintenance procedures to ensure proper functioning. Road authorities oversee construction and management accordingly.
Current standards for installing roadway facilities were primarily established to help human drivers perceive road conditions and respond safely during manual driving. These standards assumed human-operated vehicles. However, the rapid advancement opresentmous driving technologies presents new challenges. Since autonomous vehicles (AVs) rely on sensors and Artificial Intelligence (AI) to perceive the road environment and make decisions without human intervention, future roadway standards may need to adopt approaches better suited for AV operations [2]. For instance, the lane keeping assistance system (LKAS) enables AVs to maintain lane position using onboard devices such as cameras and LiDAR sensors [3,4,5]. If lane markings are poorly maintained, AVs may fail to recognize them, increasing the risk of unintentional lane departure and collisions.
However, current standards for installing longitudinal pavement markings mainly focus on retroreflectivity, ensuring nighttime visibility for human drivers under manual driving [6]. Whether these standards suit autonomous driving remains uncertain. Prior studies have linked many ADAS disengagements to environmental factors like degraded lane markings [7]. Since AVs use onboard sensors to detect lane shapes, the marking shape may be more critical than visibility. Thus, AV-oriented standards should include shape criteria alongside retroreflectivity, yet no formal research has addressed this need.
Numerous studies have been conducted to improve the lane detection capabilities of AVs, which are essential for the proper functioning of autonomous driving systems [8,9]. However, most of these efforts have focused on enhancing the lane recognition performance of the vehicle itself. As lane departure accidents still occur, it is difficult to conclude that AV technology has yet reached complete reliability. Therefore, realizing a fully autonomous driving environment—capable of standalone operation—will require not only advances in vehicle-based technologies but also support from road infrastructure systems.
This study aims to support autonomous driving by enabling more reliable lane positioning through infrastructure analysis. It proposes a vision-based framework to quantitatively evaluate the impact of lane marking conditions on AV operations. The framework integrates two core algorithms: (1) a YOLOv5-based algorithm for accurately identifying lane markings among various road symbols and (2) a degradation assessment algorithm that determines whether the identified markings are faded, based on pixel-level occupancy thresholds. Specifically, this study makes three key contributions: (i) a customized YOLOv5-based lane identification module that distinguishes lane markings from other road surface symbols using class redefinition and lane-specific data augmentation; (ii) a quantitative lane degradation assessment algorithm that determines whether detected lane markings are faded using a pixel occupancy threshold; and (iii) an integrated framework that combines detection and degradation assessment to enable practical and explainable infrastructure-level support for AV lane-keeping tasks. Unlike previous approaches relying on implicit deep model features, this method improves objectivity and explainability through explicit threshold-based criteria. The findings may inform future installation standards considering both retroreflectivity and geometric integrity, contributing to AV-compatible infrastructure design.
This article is a revised and expanded version of a paper titled “Development of a Lane Identification and Assessment Framework for Maintenance Using AI Techniques”, presented at the 16th ITS European Congress, Seville, Spain, 19–21 May 2025 [10]. Compared to the conference version, this extended journal article enhances the theoretical foundation and algorithmic depth of the study. Specifically, Introduction has been reinforced to include a more comprehensive discussion on the development and limitations of autonomous driving technologies and the inadequacy of current lane marking standards. Additionally, a broader literature review has been conducted to clearly establish the necessity, validity, and originality of the proposed research. The algorithms have also been elaborated with improved visual representations and pseudocode to enhance readability and intuitive understanding.

2. Literature Review

Recent advances in autonomous driving technologies have highlighted two critical challenges in lane-related research: accurately detecting lane markers under varying conditions and objectively evaluating their degradation. Addressing these issues is essential to ensure AV safety and infrastructure adaptability.
Research on lane markings can largely be categorized into two major objectives: improving lane detection accuracy and evaluating lane degradation. Studies targeting detection accuracy mainly focus on the precise identification and tracking of lane markers. A real-time lane modeling and tracking method using distance transform techniques has shown reliable performance in relatively simple urban environments [11].
Among Convolutional Neural Network (CNN)-based approaches, a representative example is the end-to-end learning method for autonomous driving, in which steering angles are predicted directly from road images to maintain lane position [12]. Another study introduced a Spatial CNN that not only recognizes lane markers but also contributes to scene understanding [13]. A combined method using a CNN and Random Sample Consensus (RANSAC) was proposed to improve the robustness of lane detection [14], while a deep learning model based on OverFeat showed the effective recognition of lanes and vehicles in highway environments [15]. These studies mainly focused on improving detection accuracy and real-time performance. The YOLO (You Only Look Once) algorithm, developed by Redmon et al., provides real-time object detection and has been widely used in autonomous driving applications [16]. Roy and Bhaduri proposed a YOLOv5 model with a transformer-based head to classify damaged and intact lane markings using improved augmentation techniques [17]. Swain and Tripathy further extended YOLO techniques to detect lanes in complex multi-lane environments under diverse conditions [18]. More recently, Yang et al. proposed a Transformer-based lane detection framework (LDTR) with an anchor chain representation that improves robustness in nighttime and occluding conditions [19], and Zoljodi et al. introduced a contrastive learning framework (CLLD) utilizing cross-similarity to enhance lane detection under fading and low-visibility conditions [20].
Studies assessing lane degradation have increasingly adopted segmentation-based models, which are critical in this domain. For example, an encoder–decoder architecture using DeepLabv3+ was proposed to analyze lane markings at the pixel level and evaluate their deterioration [21]. A semantic segmentation method based on generative adversarial networks (GANs) has also been developed for lane detection tasks [22]. An instance segmentation approach showed high accuracy in identifying lanes under complex conditions [23]. In addition, ENet, a lightweight segmentation network, was introduced for real-time detection [24]. Liu et al. proposed a dual-branch network combining detection and segmentation, enhancing robustness against occlusion and improving the accuracy of lane degradation assessment [25].
However, most previous studies on lane maintenance still face critical limitations. First, a consistent and quantitative criterion for evaluating the condition of lane markings remains underdeveloped [20,21,22,23,25]. Second, although some recent studies have attempted to assess degradation in complex road environments and under adverse weather conditions [20,25], establishing a practical and generalizable evaluation framework remains a challenge. Lastly, labeling-based damage assessments often reflect the subjective judgment of researchers, leading to inconsistencies in evaluation [15,17,19,23].
In summary, this study contributes to the literature by introducing a dual-stage algorithm that enables both precise lane identification and quantifiable degradation assessment, addressing the limitations of subjective or inconsistent evaluations in prior work.

3. Data Preparation

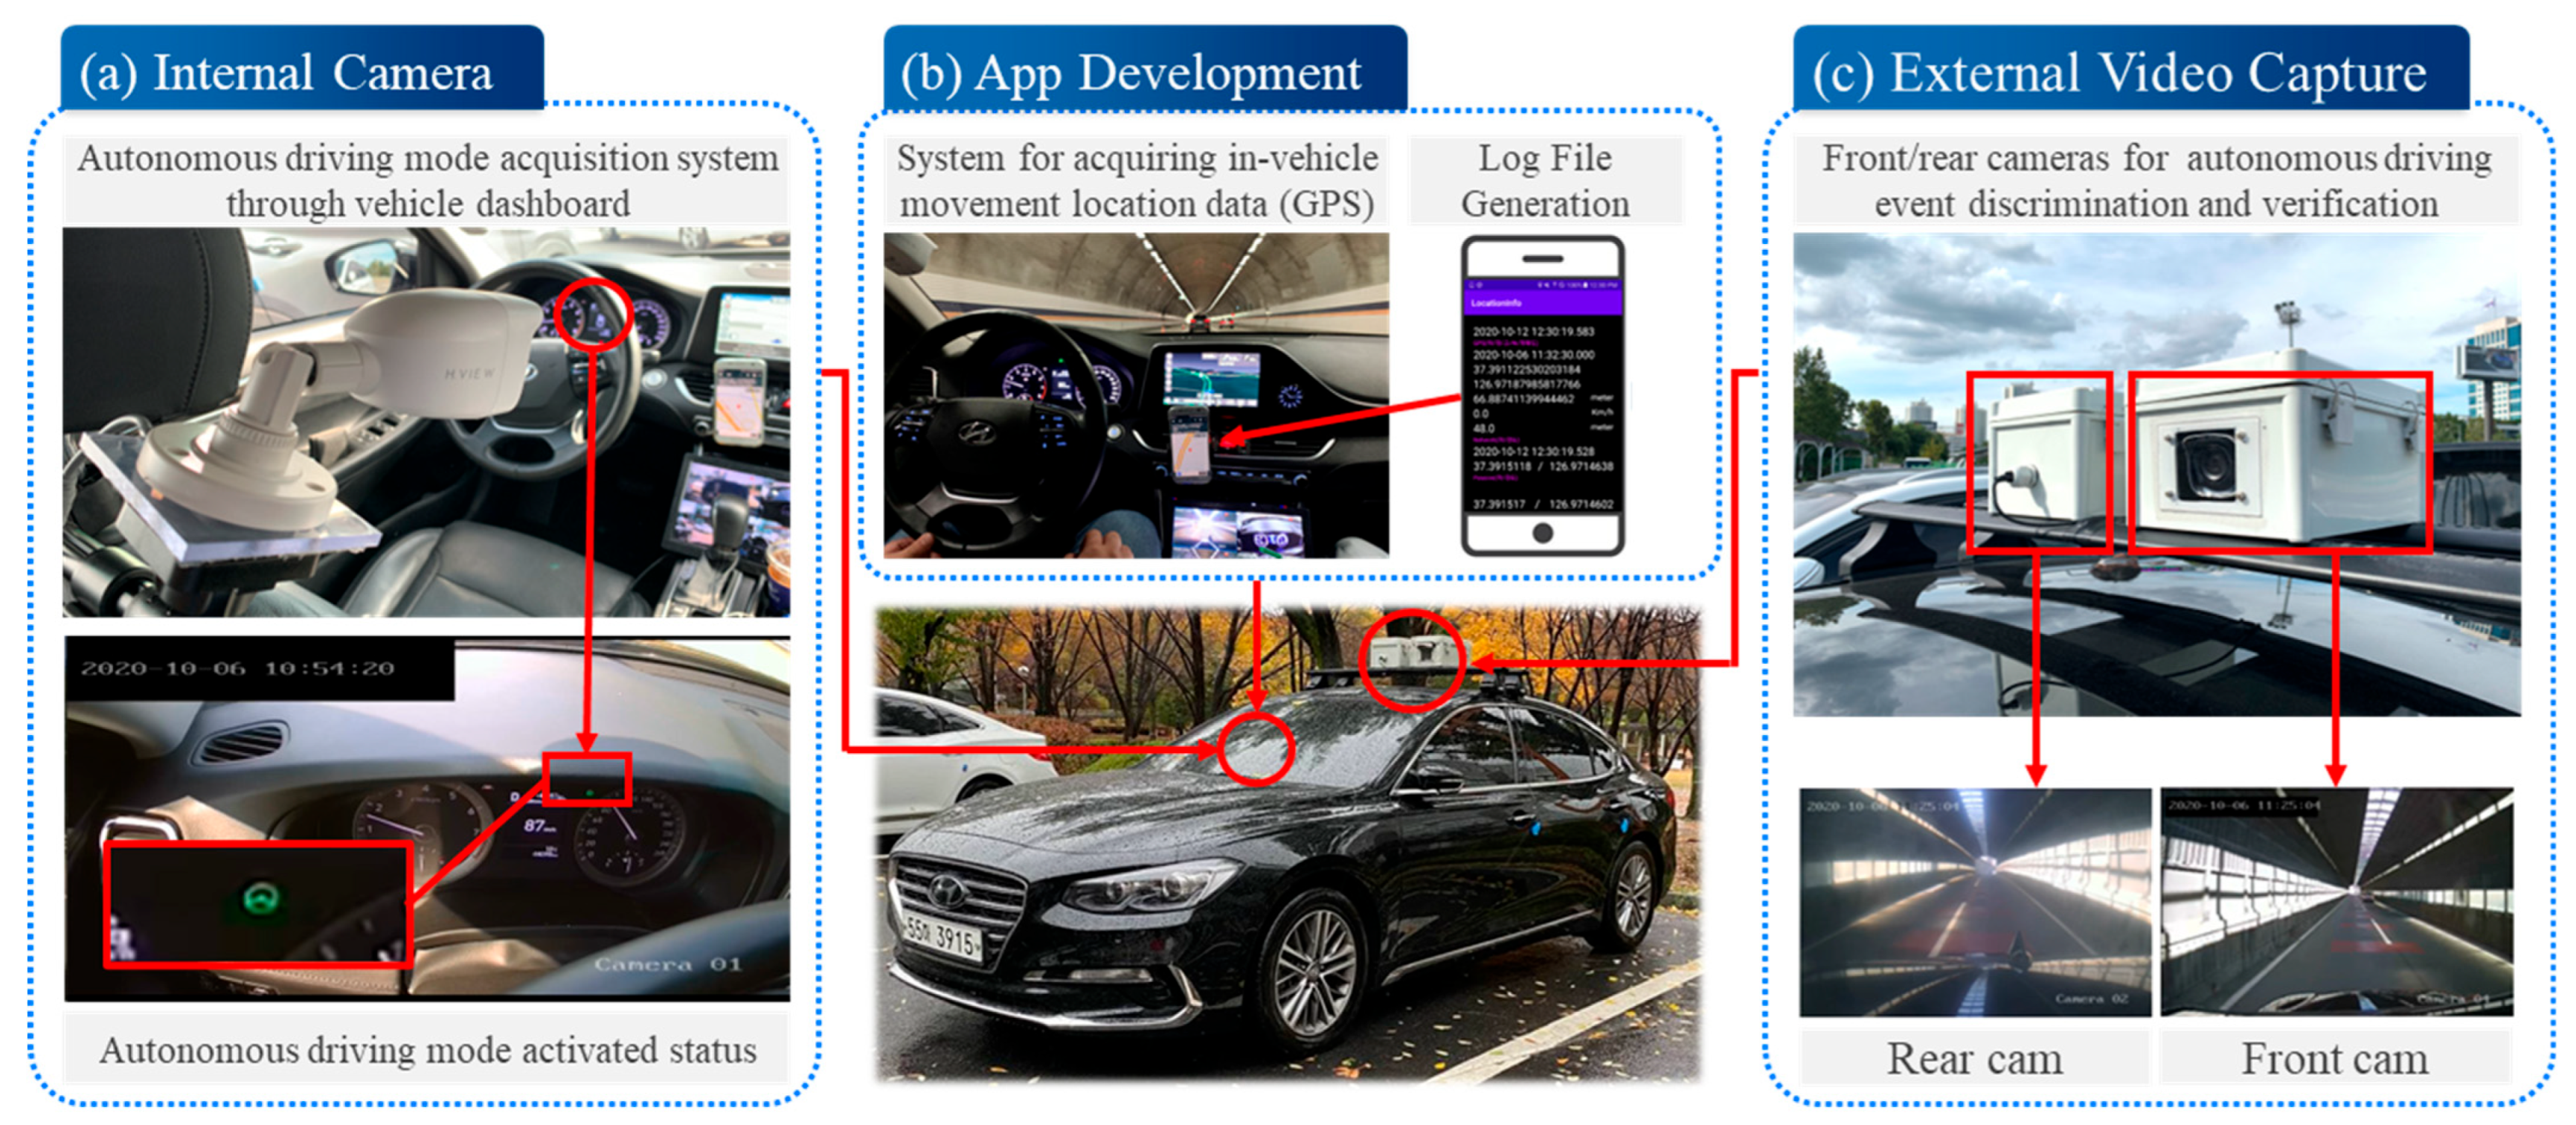
3.1. Data Collection Equipment

To collect training data for developing lane identification and condition assessment algorithms, four main devices were used: cameras mounted inside and outside the vehicle, an internal GPS system, and a mobile application.
Cameras were installed in two vehicles with Level 2 to 2.5 autonomous driving features. An in-vehicle camera (Figure 1a) recorded the LKAS operation status shown on the instrument panel. Two external cameras on the vehicle roof (Figure 1c) captured front and rear views during LKAS disengagement. A mobile device with an application (Figure 1b) was also installed to log GPS coordinates and reasons for LKAS disengagement.

3.2. Field Data Collection

Data were collected over a one-year period from October 2021 to October 2022 on seven major urban expressways in Seoul, Republic of Korea, which are characterized by uninterrupted traffic flow and are representative of real-world autonomous driving conditions. A total of 896 driving sessions were conducted, covering 20,172 km under a wide range of traffic and environmental conditions, including peak hours, nighttime driving, and adverse weather such as rain or fog. Figure 2 presents the surveyed expressway segments, detailing their names and lengths across the Seoul metropolitan area.

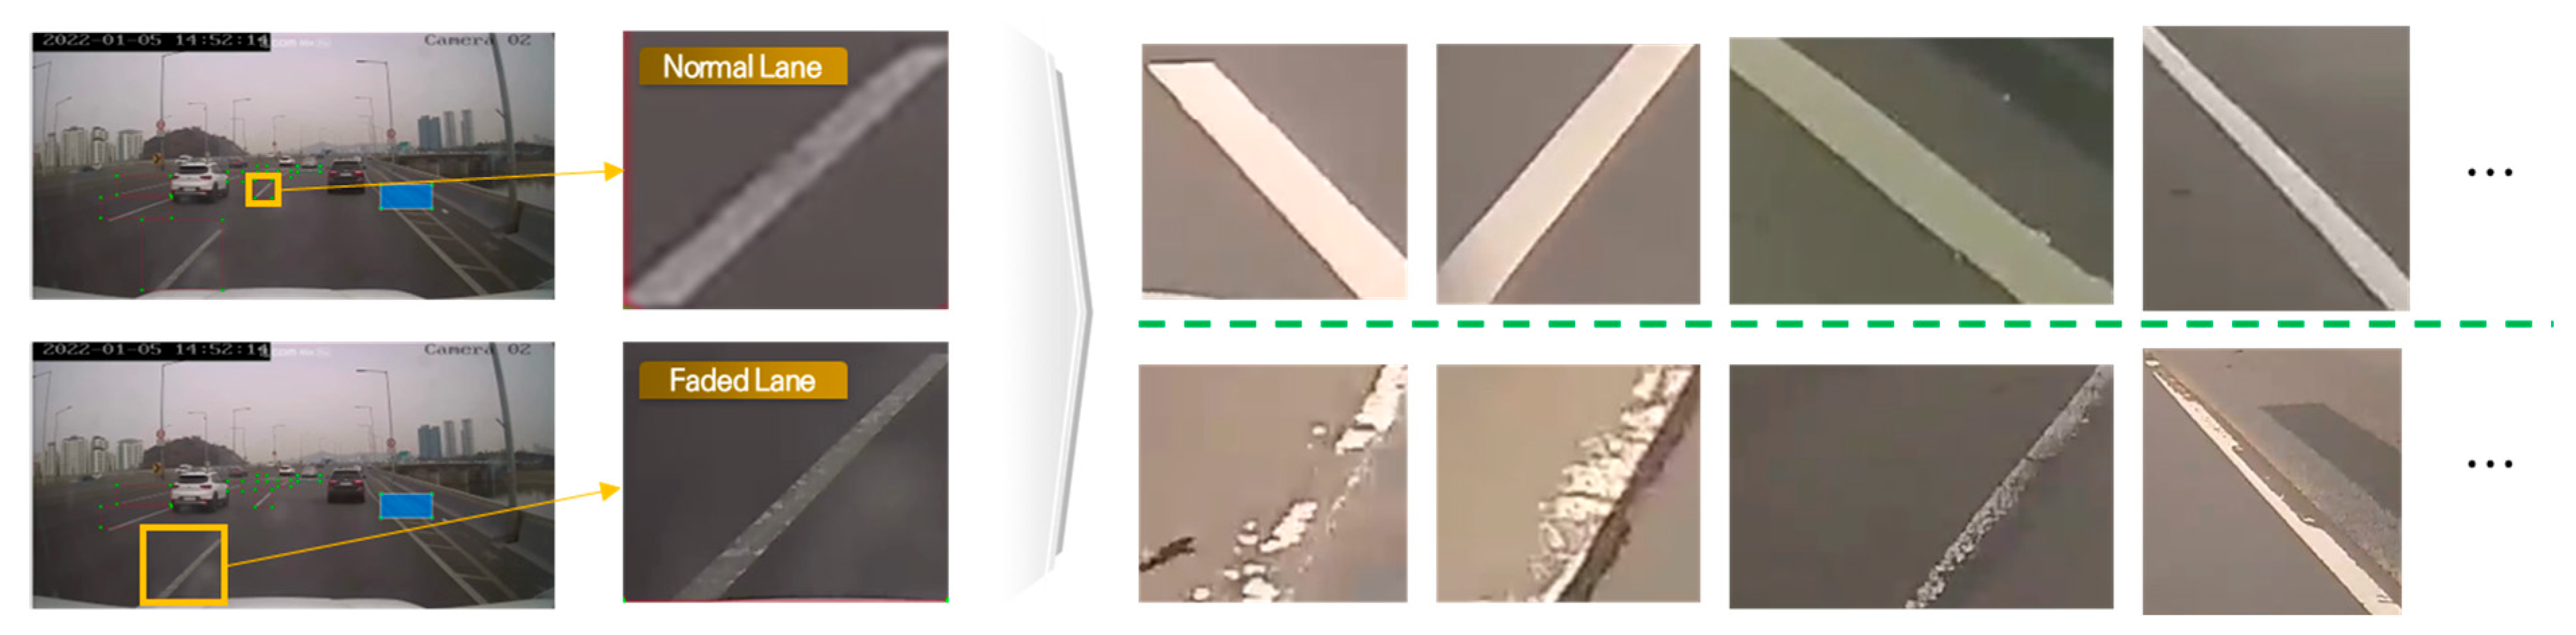
3.3. Data Pre-Processing

Through field investigations, three types of data were collected: (1) in-vehicle video footage of LKAS disengagement (Figure 1a), (2) disengagement reasons recorded via a mobile app, and (3) forward-facing video from an external camera (Figure 1c). These heterogeneous sources were synchronized by date and time and merged into a unified dataset using Python (version 3.8.19) “pandas (version 2.0.3)” library.
The main goal of this study is to develop an algorithm that identifies lane markings in image data and determines LKAS engagement status. To this end, images at LKAS disengagement moments were extracted from the integrated dataset and used for training. This involved manual timestamp synchronization between the LKAS database and video footage, followed by selecting relevant frames. During the field survey, 1595 LKAS disengagements were recorded, 244 of which were due to lane detection issues. Among these, segments with disengagements over one second were selected, and frames were extracted at 10 fps, resulting in 330 images. The process is shown in Figure 3.

4. Framework Development and Validation

Figure 4 presents the overall workflow of this study, including data preparation, lane identification, and lane condition assessment. A YOLO-based object detection model was used to detect lane markings and other roadway elements. Based on this, a quantitative and systematic method was developed to assess lane conditions. The process consists of three main stages: data preparation (Section I; see Section 3), lane identification algorithm development (Sections II–IV; see Section 4.1), and lane condition assessment algorithm development (Section V; see Section 4.2).

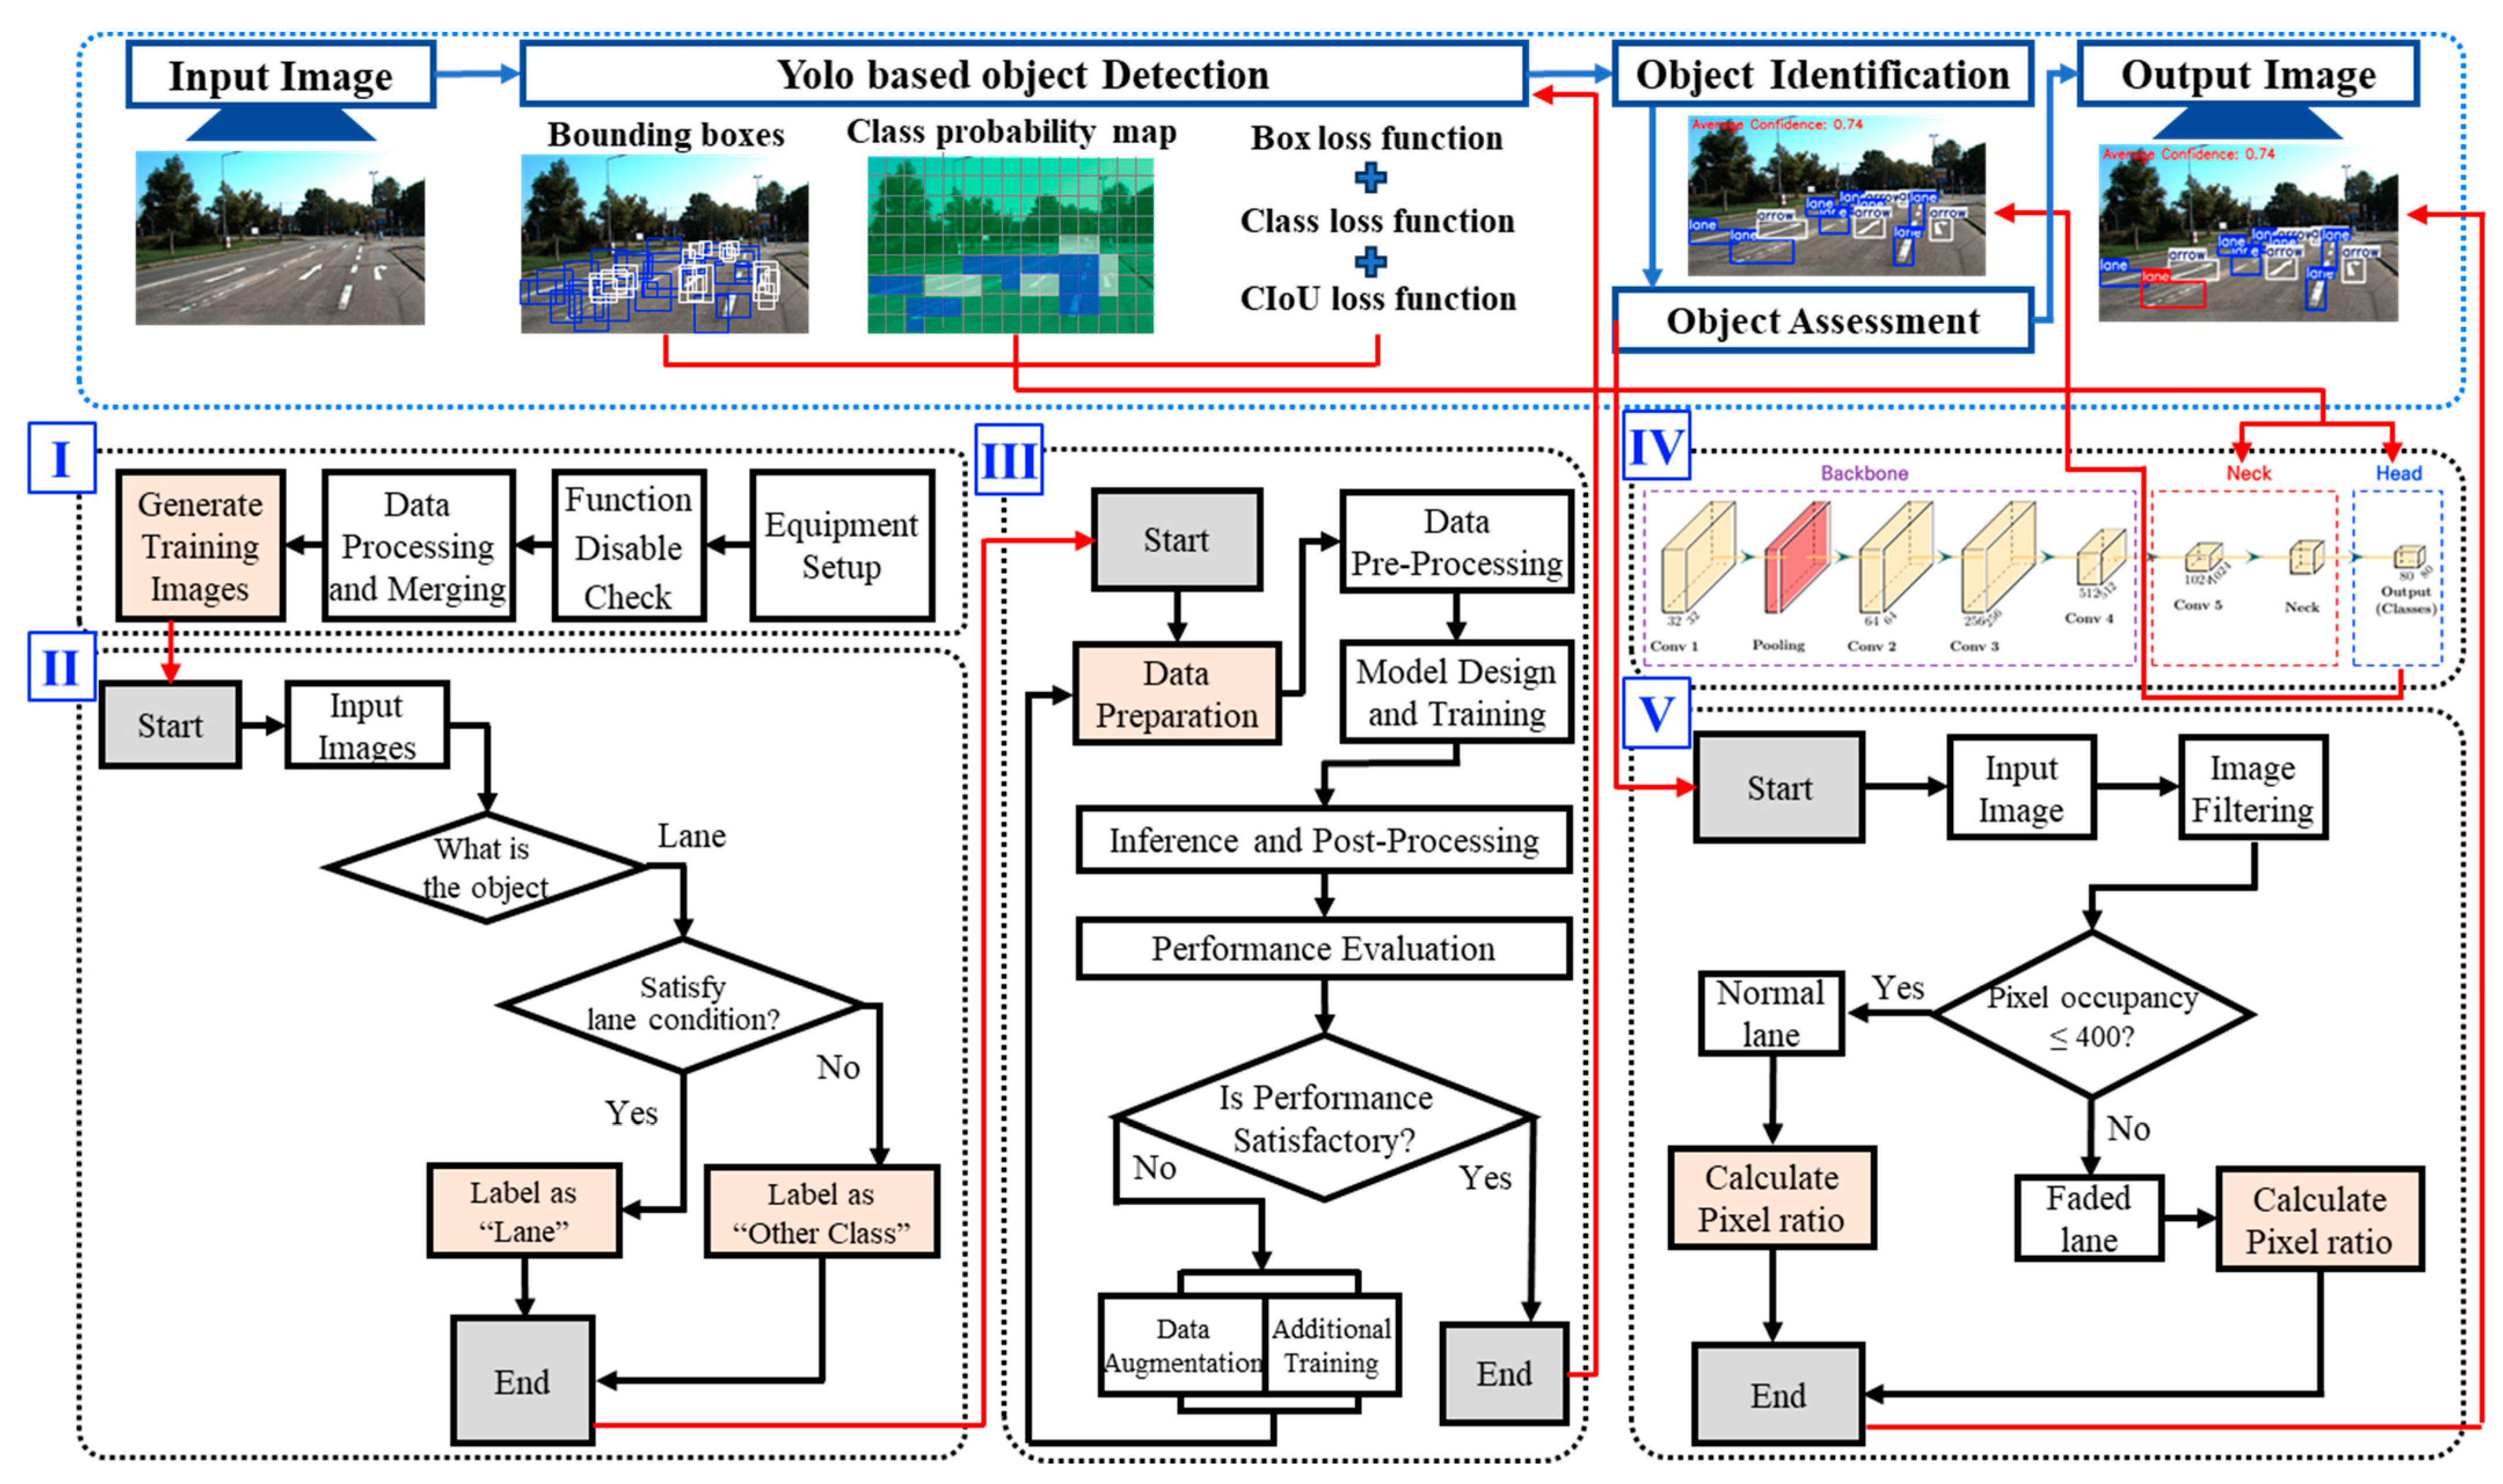
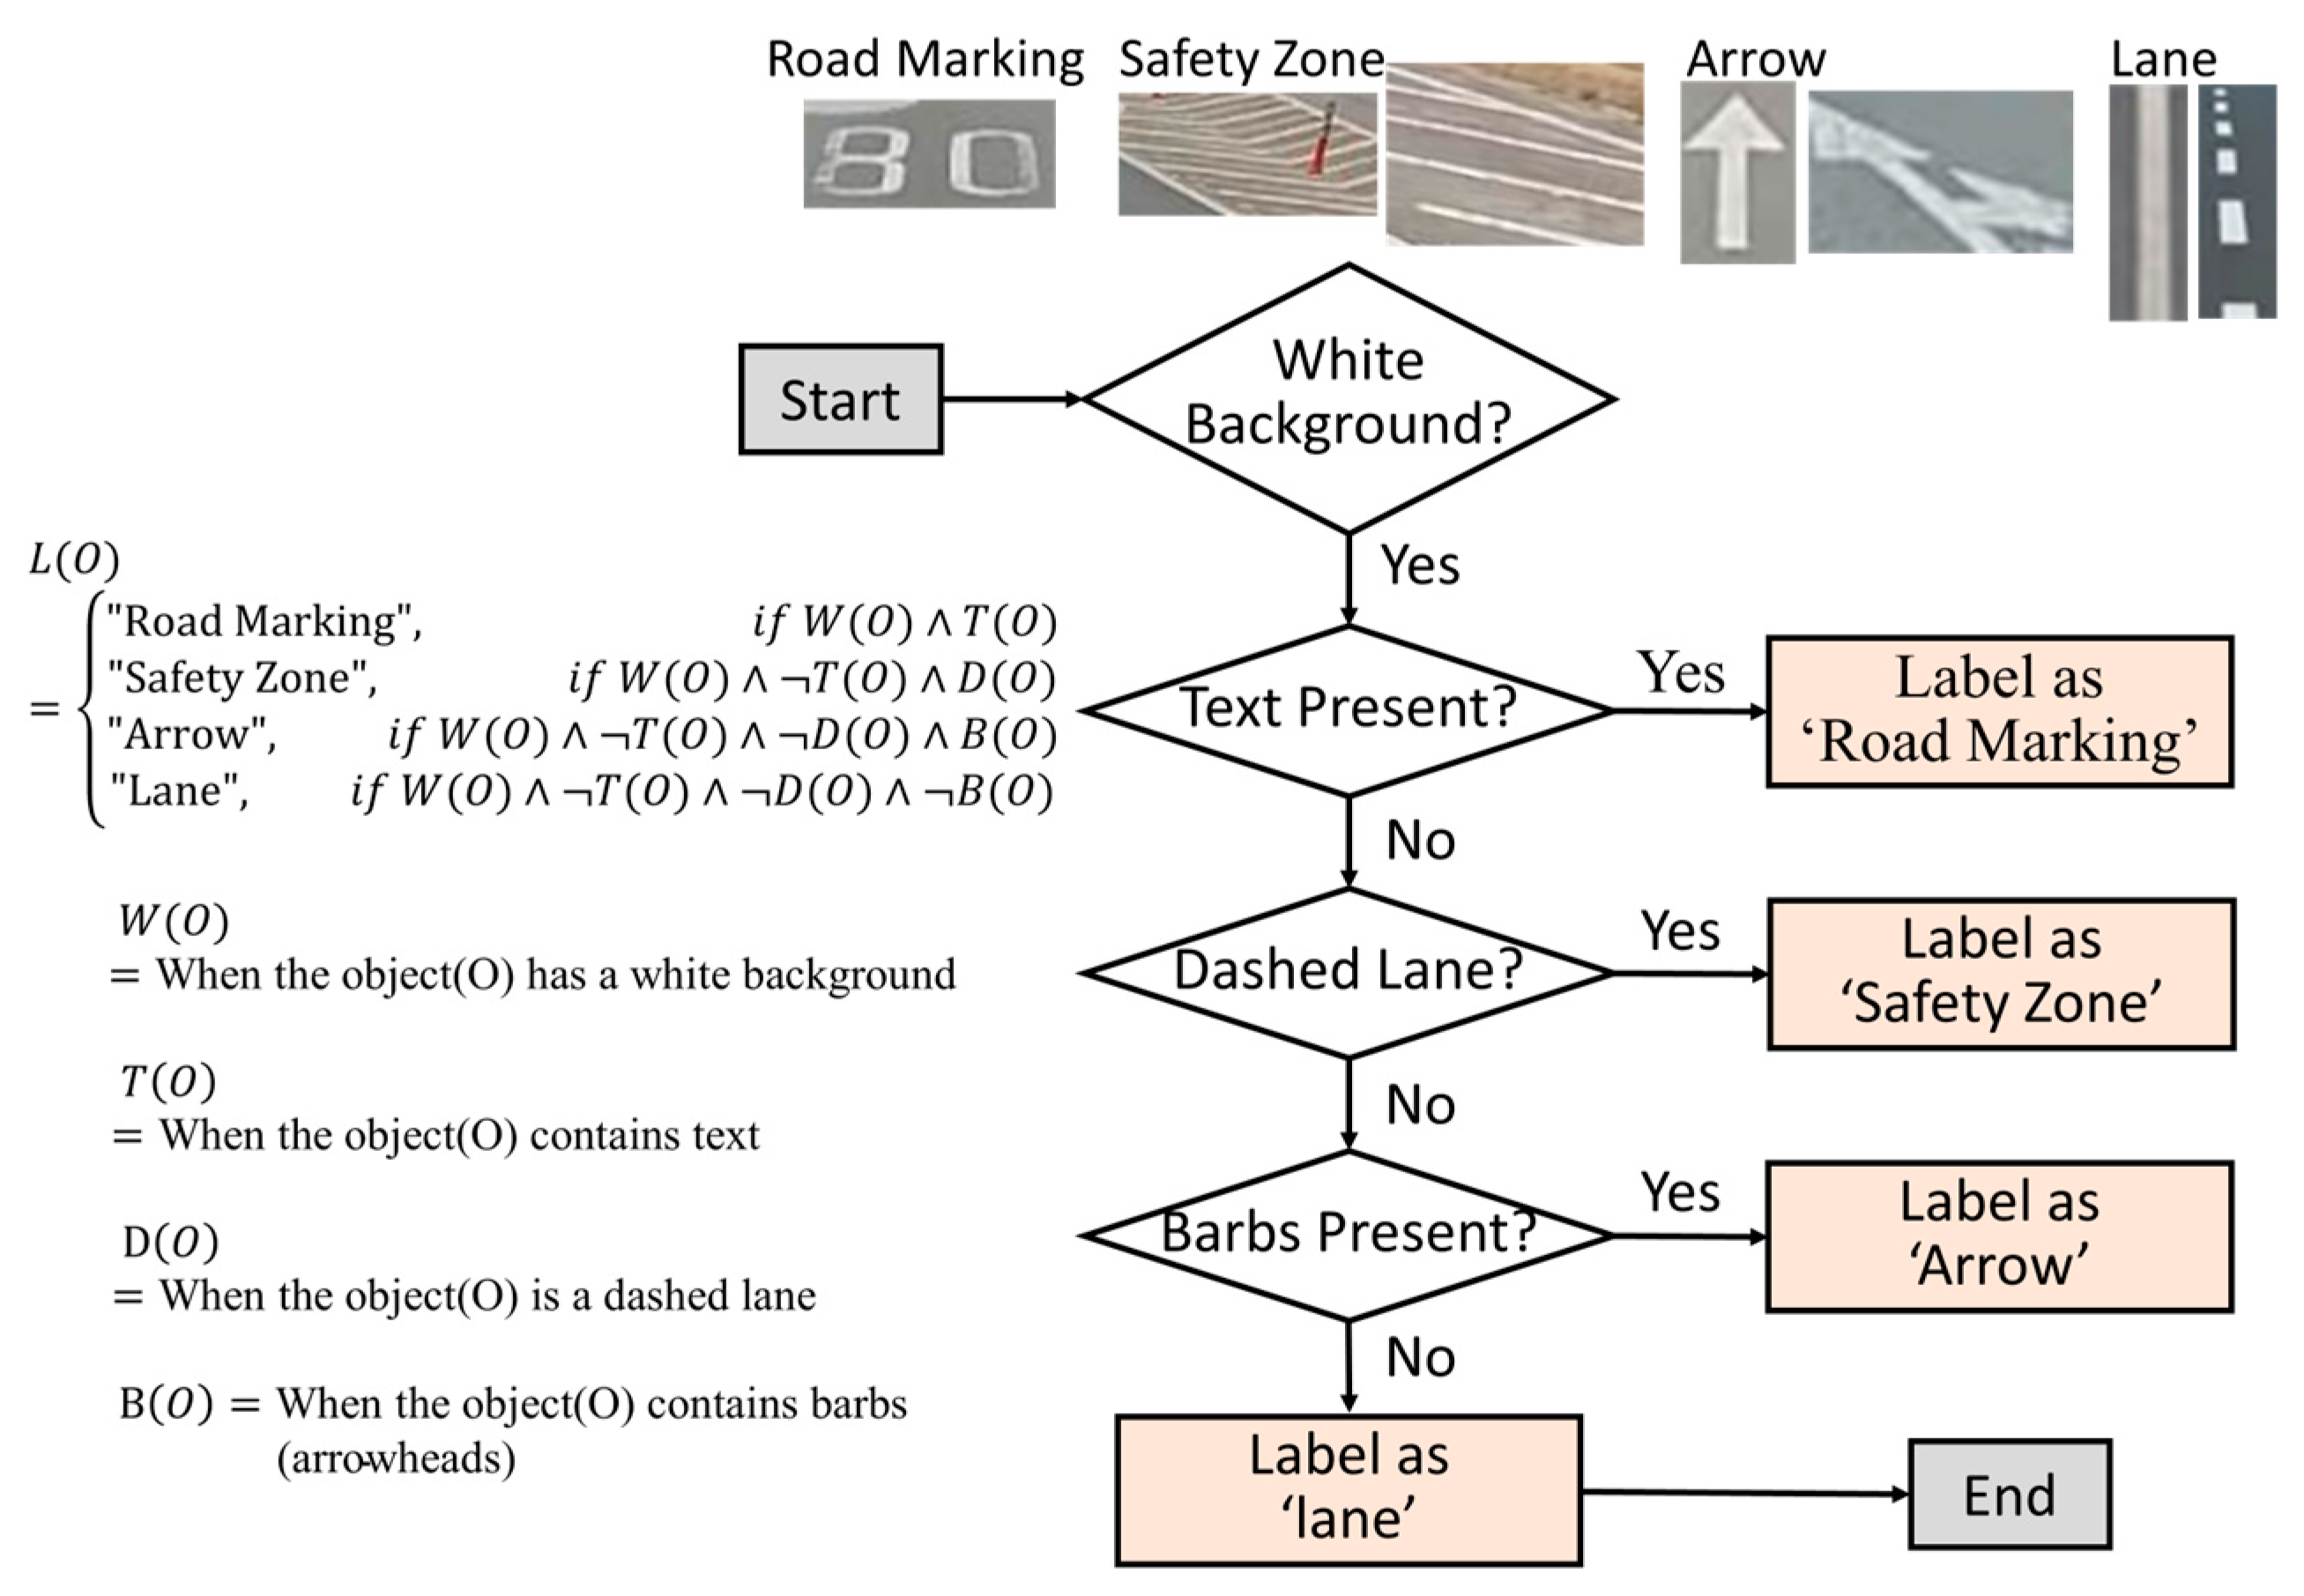
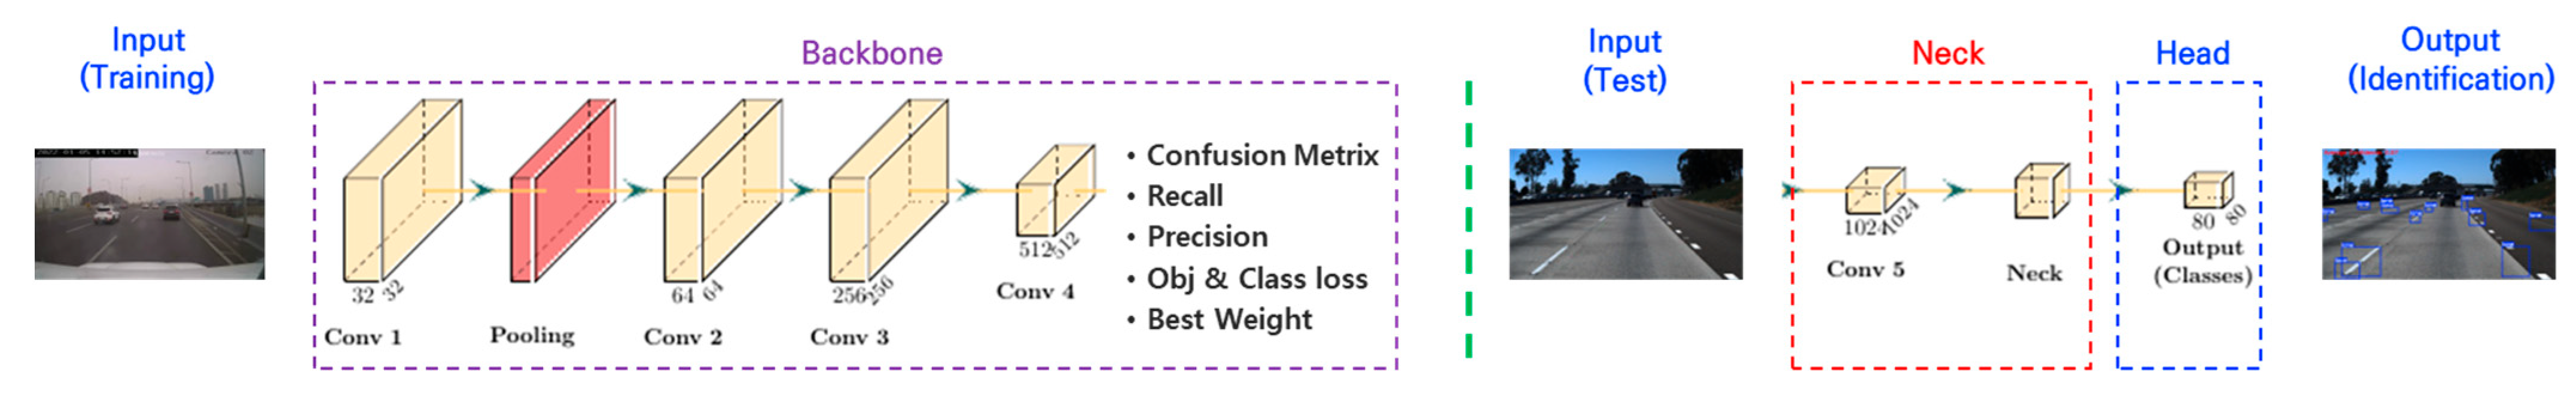
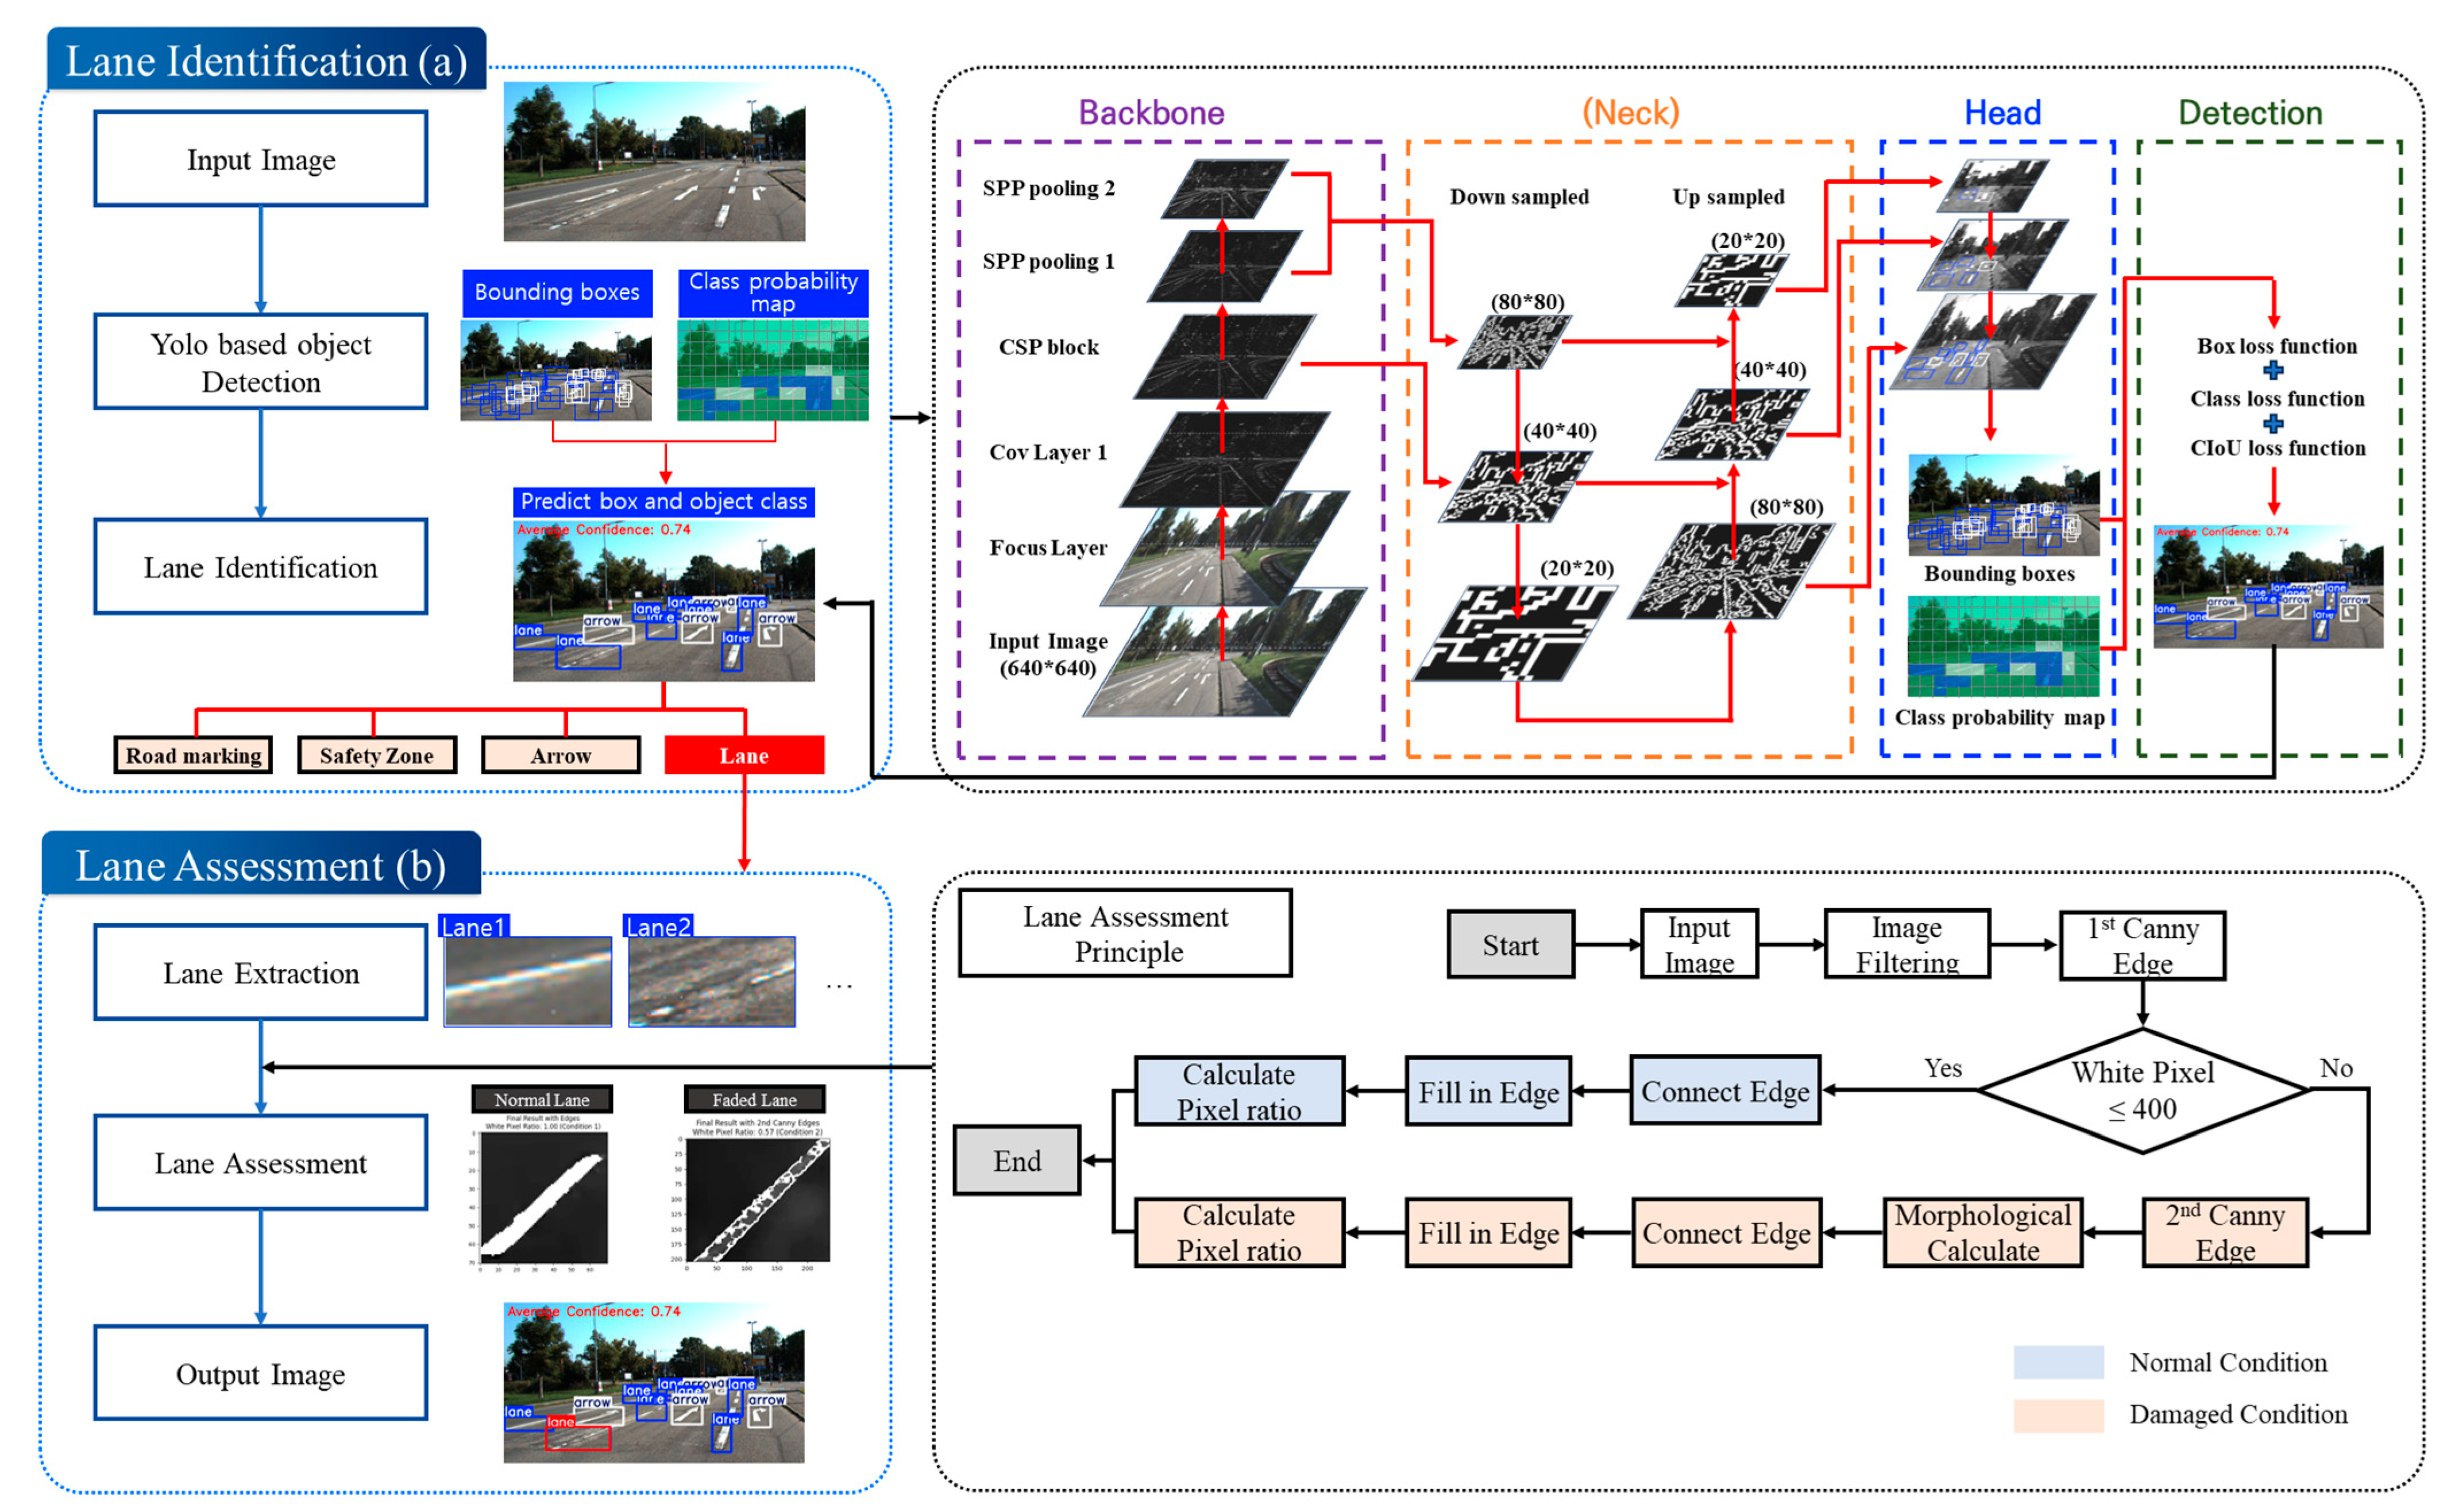
4.1. Lane Identification Algorithm Development

In the early phase of this study, a single-label annotation approach was applied for lane classification; however, the resulting model exhibited relatively low accuracy metrics. To address this limitation, a multi-label annotation method was introduced, which led to improved performance in both lane detection and classification, enabling more precise lane identification. According to previous research, the application of multi-label annotation can enhance the object differentiation capability of trained models compared to single-label methods [26]. This study incorporated this approach to more effectively distinguish lanes from other objects in the roadway environment.
Based on the experimental results, a refined labeling scheme was established to clearly distinguish lane markings from other roadway elements, as illustrated in Figure 5. The labeling criteria were designed to minimize confusion between lanes and other components on the road. Specifically, regions with white backgrounds containing text were labeled as “road markings,” those containing dashed lines were labeled as “safety zones,” regions with arrows were labeled as “arrows,” and areas that did not include any text, dashed lines, or arrows were labeled as “lanes.” This multi-labeling strategy was implemented to improve the reliability of lane detection and reduce false positives.
In the initial experiments, training the model using the originally labeled images resulted in relatively low accuracy metrics. To address this limitation, a multi-labeling technique was applied alongside data augmentation to improve the model’s robustness against various types of noise and environmental variations, prevent overfitting, and ensure consistent performance on new datasets. Similar effects have been observed in previous studies, where data augmentation was shown to effectively enhance the generalization capability of deep learning models [27].
The original dataset consisted of 330 images collected at moments when autonomous driving functions (e.g., LKAS) were disengaged. Various data augmentation techniques—such as brightness adjustment, rotation, scaling, and random cropping—were then applied to reflect diverse road conditions, increasing the training dataset to 3304 images. Figure 6 presents examples of images generated by the augmentation algorithm. The corresponding process is described in Algorithm 1.
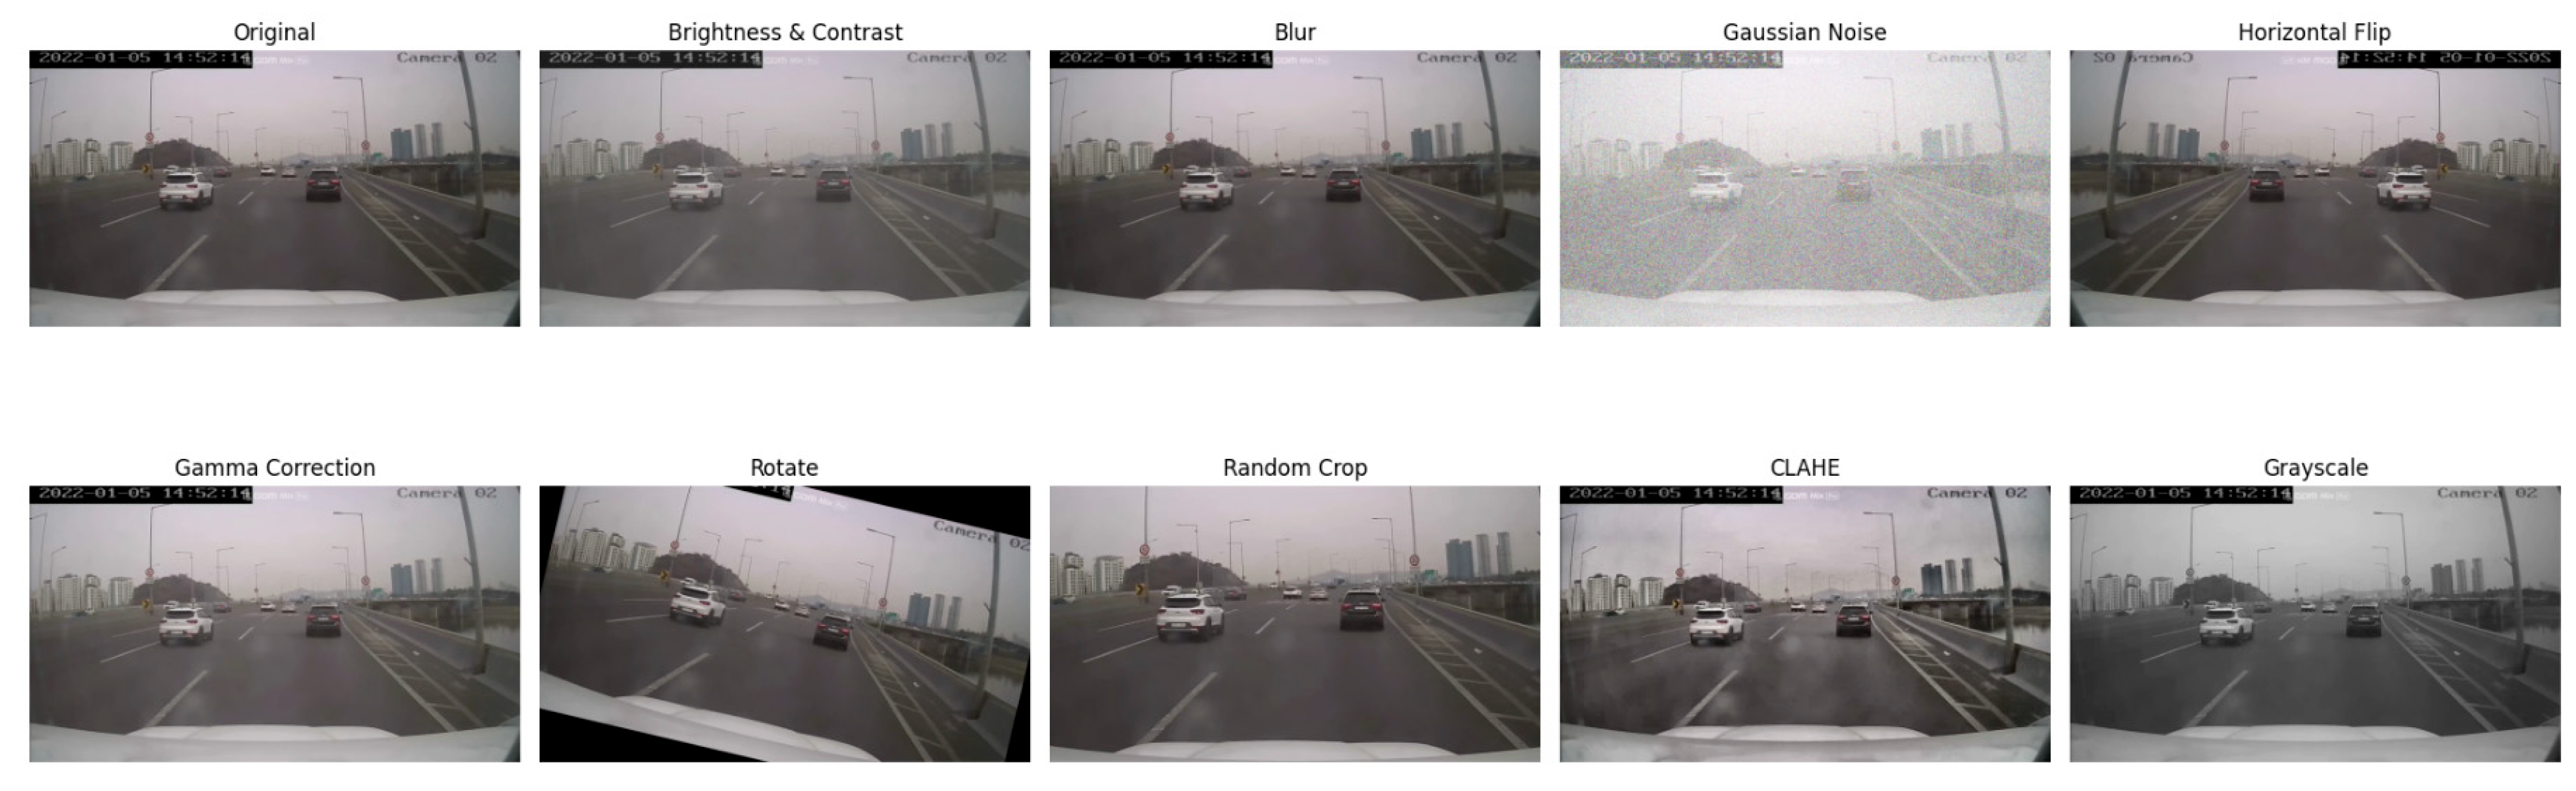
Algorithm 1. Data Augmentation Algorithm
function Load_Image(image_path)
  • Load image as binary data
  • Decode image using OpenCV
  • Return image
end function
function Apply_Augmentations (image, labels)
4. Define augmentation techniques
5. for each augmentation in list do
6.     if augmentation is brightness_contrast then
7.    Randomly adjust brightness and contrast
8.     else if augmentation is blur then
9.    Apply Gaussian blur to reduce detail
10.   else if augmentation is noise then
11.    Add random Gaussian noise to simulate camera noise
12.   else if augmentation is horizontal_flip then
13.    Flip image horizontally and adjust bounding boxes
14.   else if augmentation is gamma_correction then
15.    Randomly adjust gamma for varied lighting
16.   else if augmentation is rotation then
17.    Rotate image randomly and adjust bounding boxes
18.   else if augmentation is crop then
19.    Randomly crop image and rescale bounding boxes
20.   else if augmentation is CLAHE then
21.    Apply Contrast Limited Adaptive Histogram Equalization
22.   else if augmentation is grayscale then
23.    Convert image to grayscale
24.   end if
25. end for
26. return augmented images and labels
end function
After the training image dataset was constructed, the lane identification algorithm based on YOLOv5 was designed with the structure shown in Figure 7. The algorithm follows a sequential process from input to output.
Although more recent versions such as YOLOv10 offer architectural improvements, YOLOv5 was selected for this study due to its proven training stability and effective performance on small-scale datasets, which match the characteristics of our data.
In the input stage, the trained images are fed into the model. In the backbone stage, the model generates an optimal weight file (best weight file) through training while simultaneously evaluating performance metrics such as the confusion matrix, recall, precision, and object and class loss. In the neck stage, the verified best weight file is used to assess the lane detection accuracy on new images. The head stage utilizes the outputs from the neck to detect the type and location of lanes. Finally, in the output stage, the model produces the lane identification results, including lane classes and positional information.
The performance of object detection using the YOLOv5 algorithm was evaluated using standard metrics, including precision, recall, mean average precision (mAP), and intersection over union (IoU). Precision, as defined in Equation (1), measures the proportion of correctly predicted positive instances among all instances predicted as positive. Recall (Equation (2)) refers to the proportion of actual positive instances that were correctly identified by the model. The mean average precision, or mAP, defined in Equation (3) is the average of precision values across all levels of recall and is commonly interpreted as the area under the precision–recall curve. Finally, the model applies non-maximum suppression (NMS) based on intersection over union (IoU) to select the most accurate bounding box predictions. IoU, shown in Equation (4), quantifies the degree of overlap between the predicted bounding box and the ground truth.
Precision = True   Positives ( TP ) True   Positives ( TP ) + False   Positives ( FP )
Recall = True   Positives TP TruePositives TP + False   Negatives FN
AP = 0 1 Precision Recall d Recall ,   mAP = 1 N i = 1 N A P i
IOU = Detected   area     Actual   area Detected   area     Actual   area × 100
Training was conducted in a high-performance computing environment equipped with a 13th-generation Intel® Core™ i9-13900HK processor and an NVIDIA GeForce RTX 4080 GPU. The dataset was divided into 80% for training and 20% for validation. The XL model was trained for 100 epochs, with the confidence threshold set at 0.4 and the IoU threshold at 0.45. The batch size was set to 16 and the learning rate to 0.01, optimized using the SGD optimizer. Additionally, data augmentation techniques based on Mosaic and HSV transformations were applied to improve the model’s generalization performance. According to the confusion matrix analysis shown in Figure 8, object recognition accuracy ranged from 93% to 100%. Both object and class loss rates were low, and the model achieved a mean average precision (mAP) of 97.4%, a precision of 98.3%, and a recall of 94.0%, demonstrating excellent performance.
Furthermore, the model achieved an inference speed of 21.3 FPS on an RTX 4080 GPU, with GPU memory usage remaining below 2.5 GB and CPU utilization under 40%. These results demonstrate the framework’s suitability for real-time deployment with efficient resource usage.
To evaluate the reliability of the training results, the performance of YOLOv5 was compared with a CNN (ResNet34) and other YOLO versions. As shown in Figure 9, we present both the pre- and post-training performance of YOLOv5 to highlight the impact of the additional training phase, which used low-visibility and faded lane images that were not included in the original training dataset. YOLOv5 achieved the highest performance after additional training, with a recall of 94.0%, a precision of 98.3%, and a mean average precision (mAP) of 97.4%. It outperformed the CNN (ResNet34), which achieved a precision of 97.0% and mAP of 96.0%, and surpassed YOLOv10, indicating the effectiveness of simpler algorithms in small-scale datasets.
Although YOLOv10 is a newer version with architectural enhancements, YOLOv5 showed higher performance in our dataset due to better generalization with smaller training samples and a more stable training process. This observation aligns with prior findings that, despite YOLOv10’s improvements in mAP, its significantly increased parameter count, and computational complexity can lead to slower inference and overfitting risks on limited datasets [28].

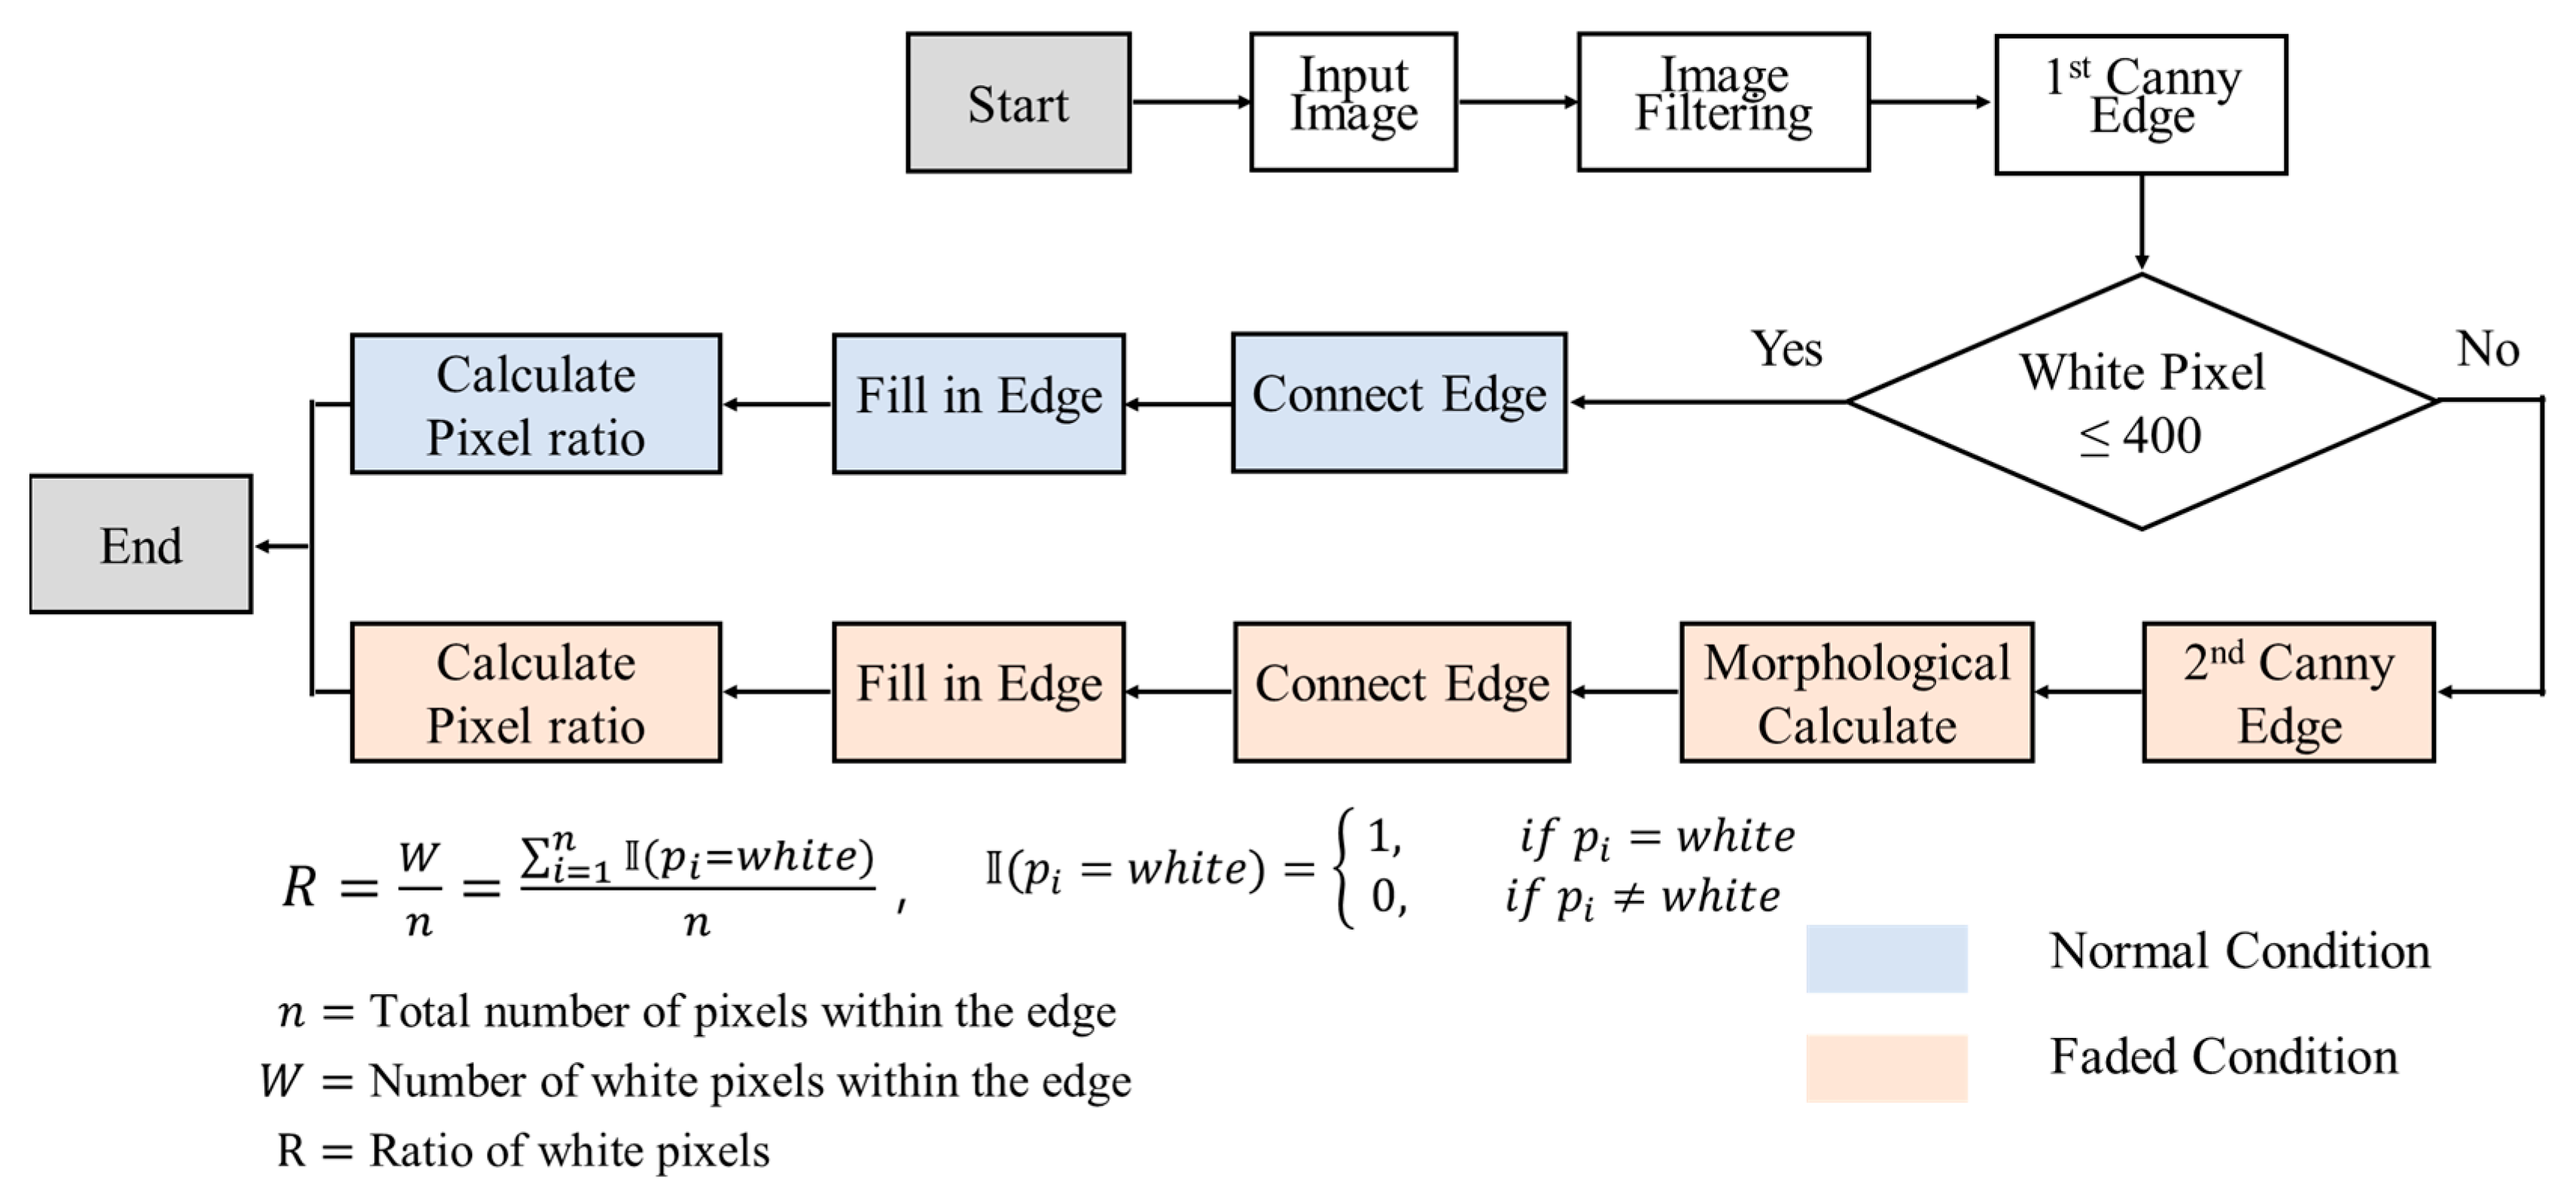
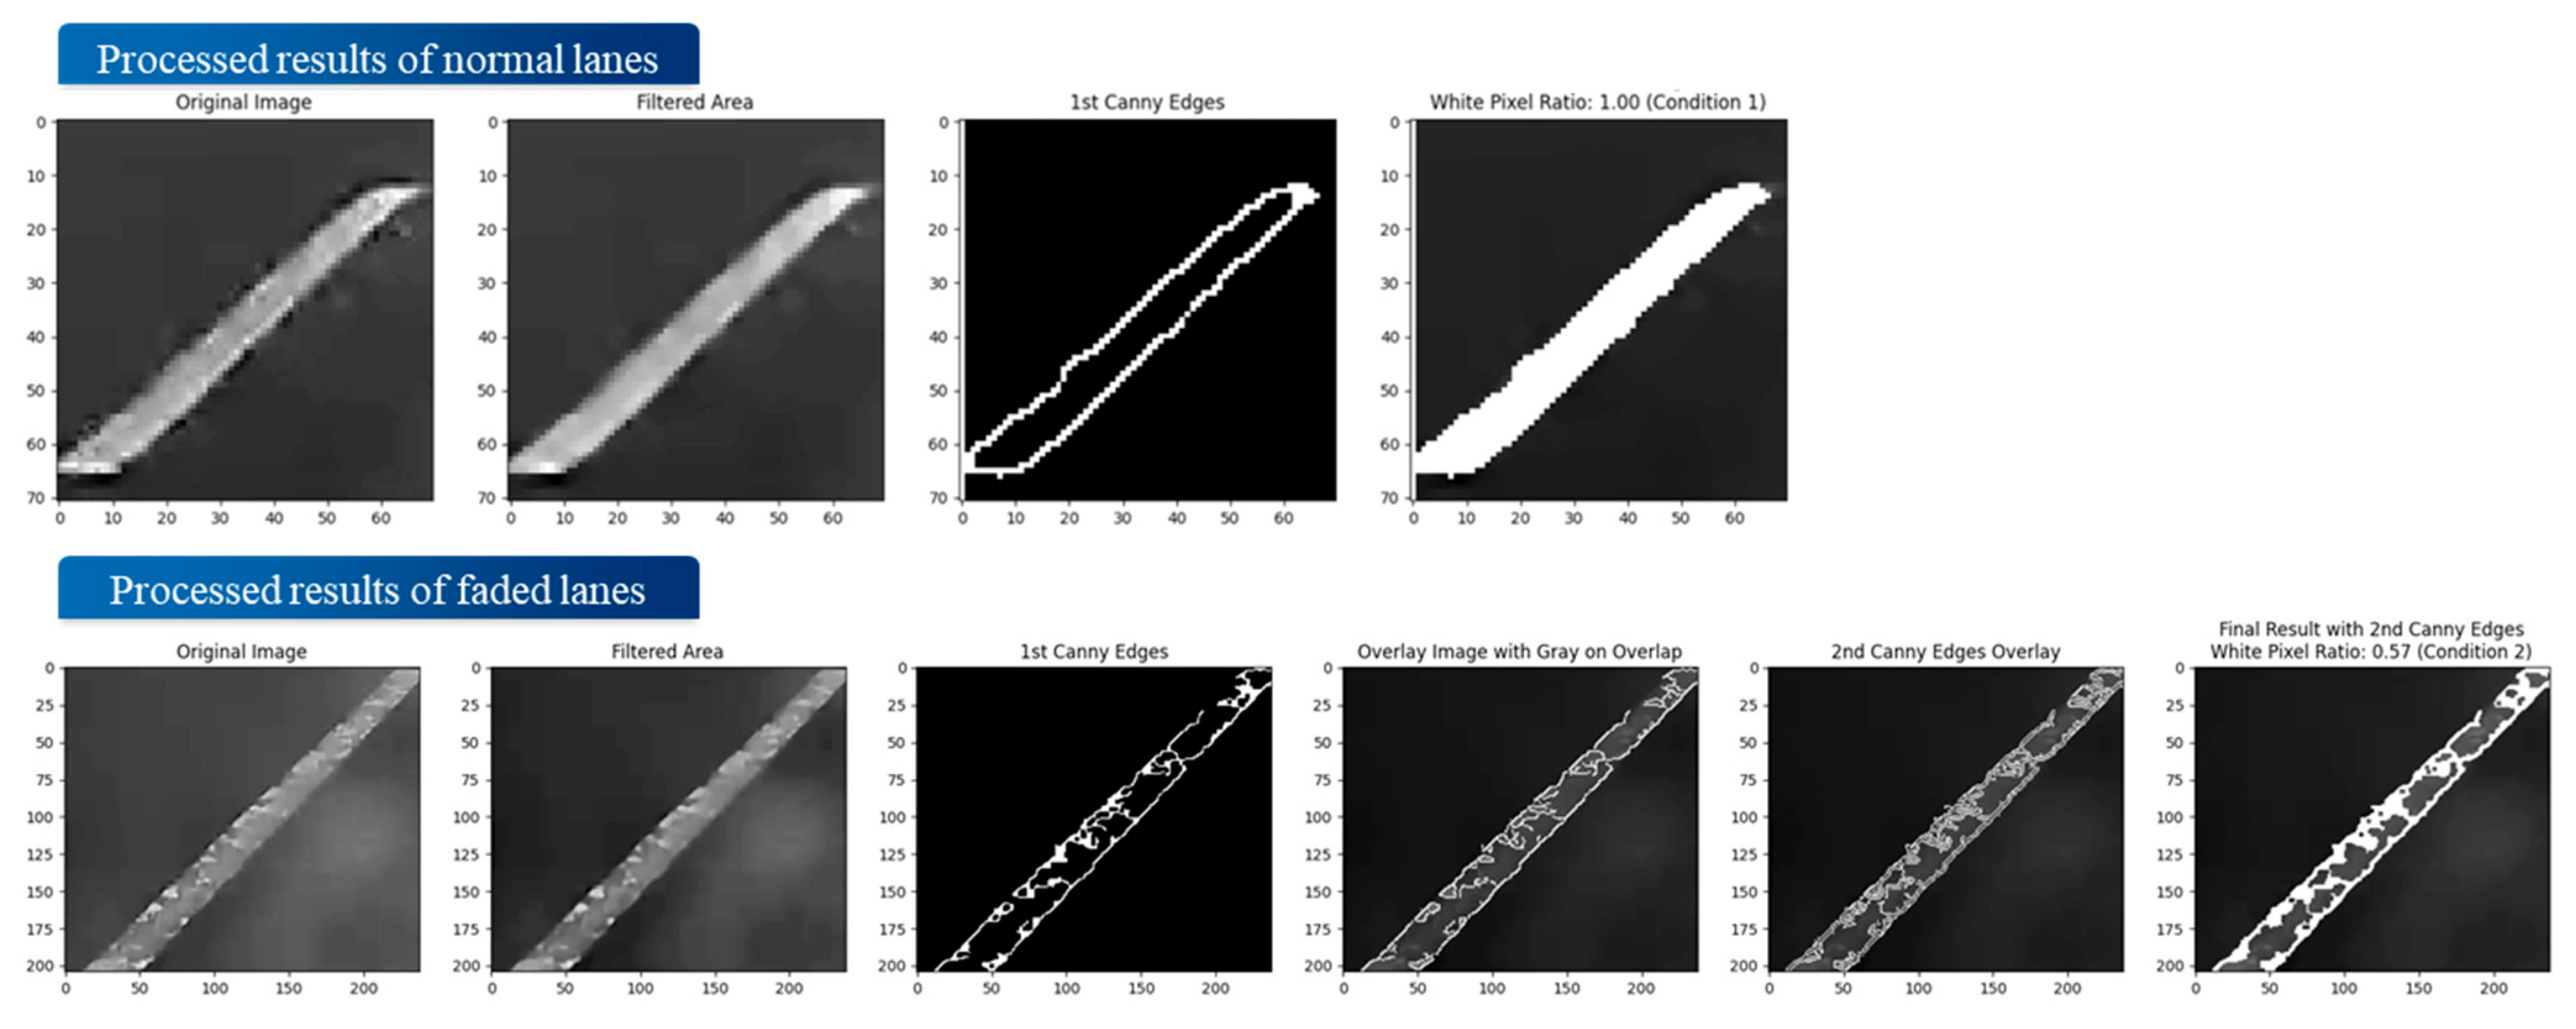
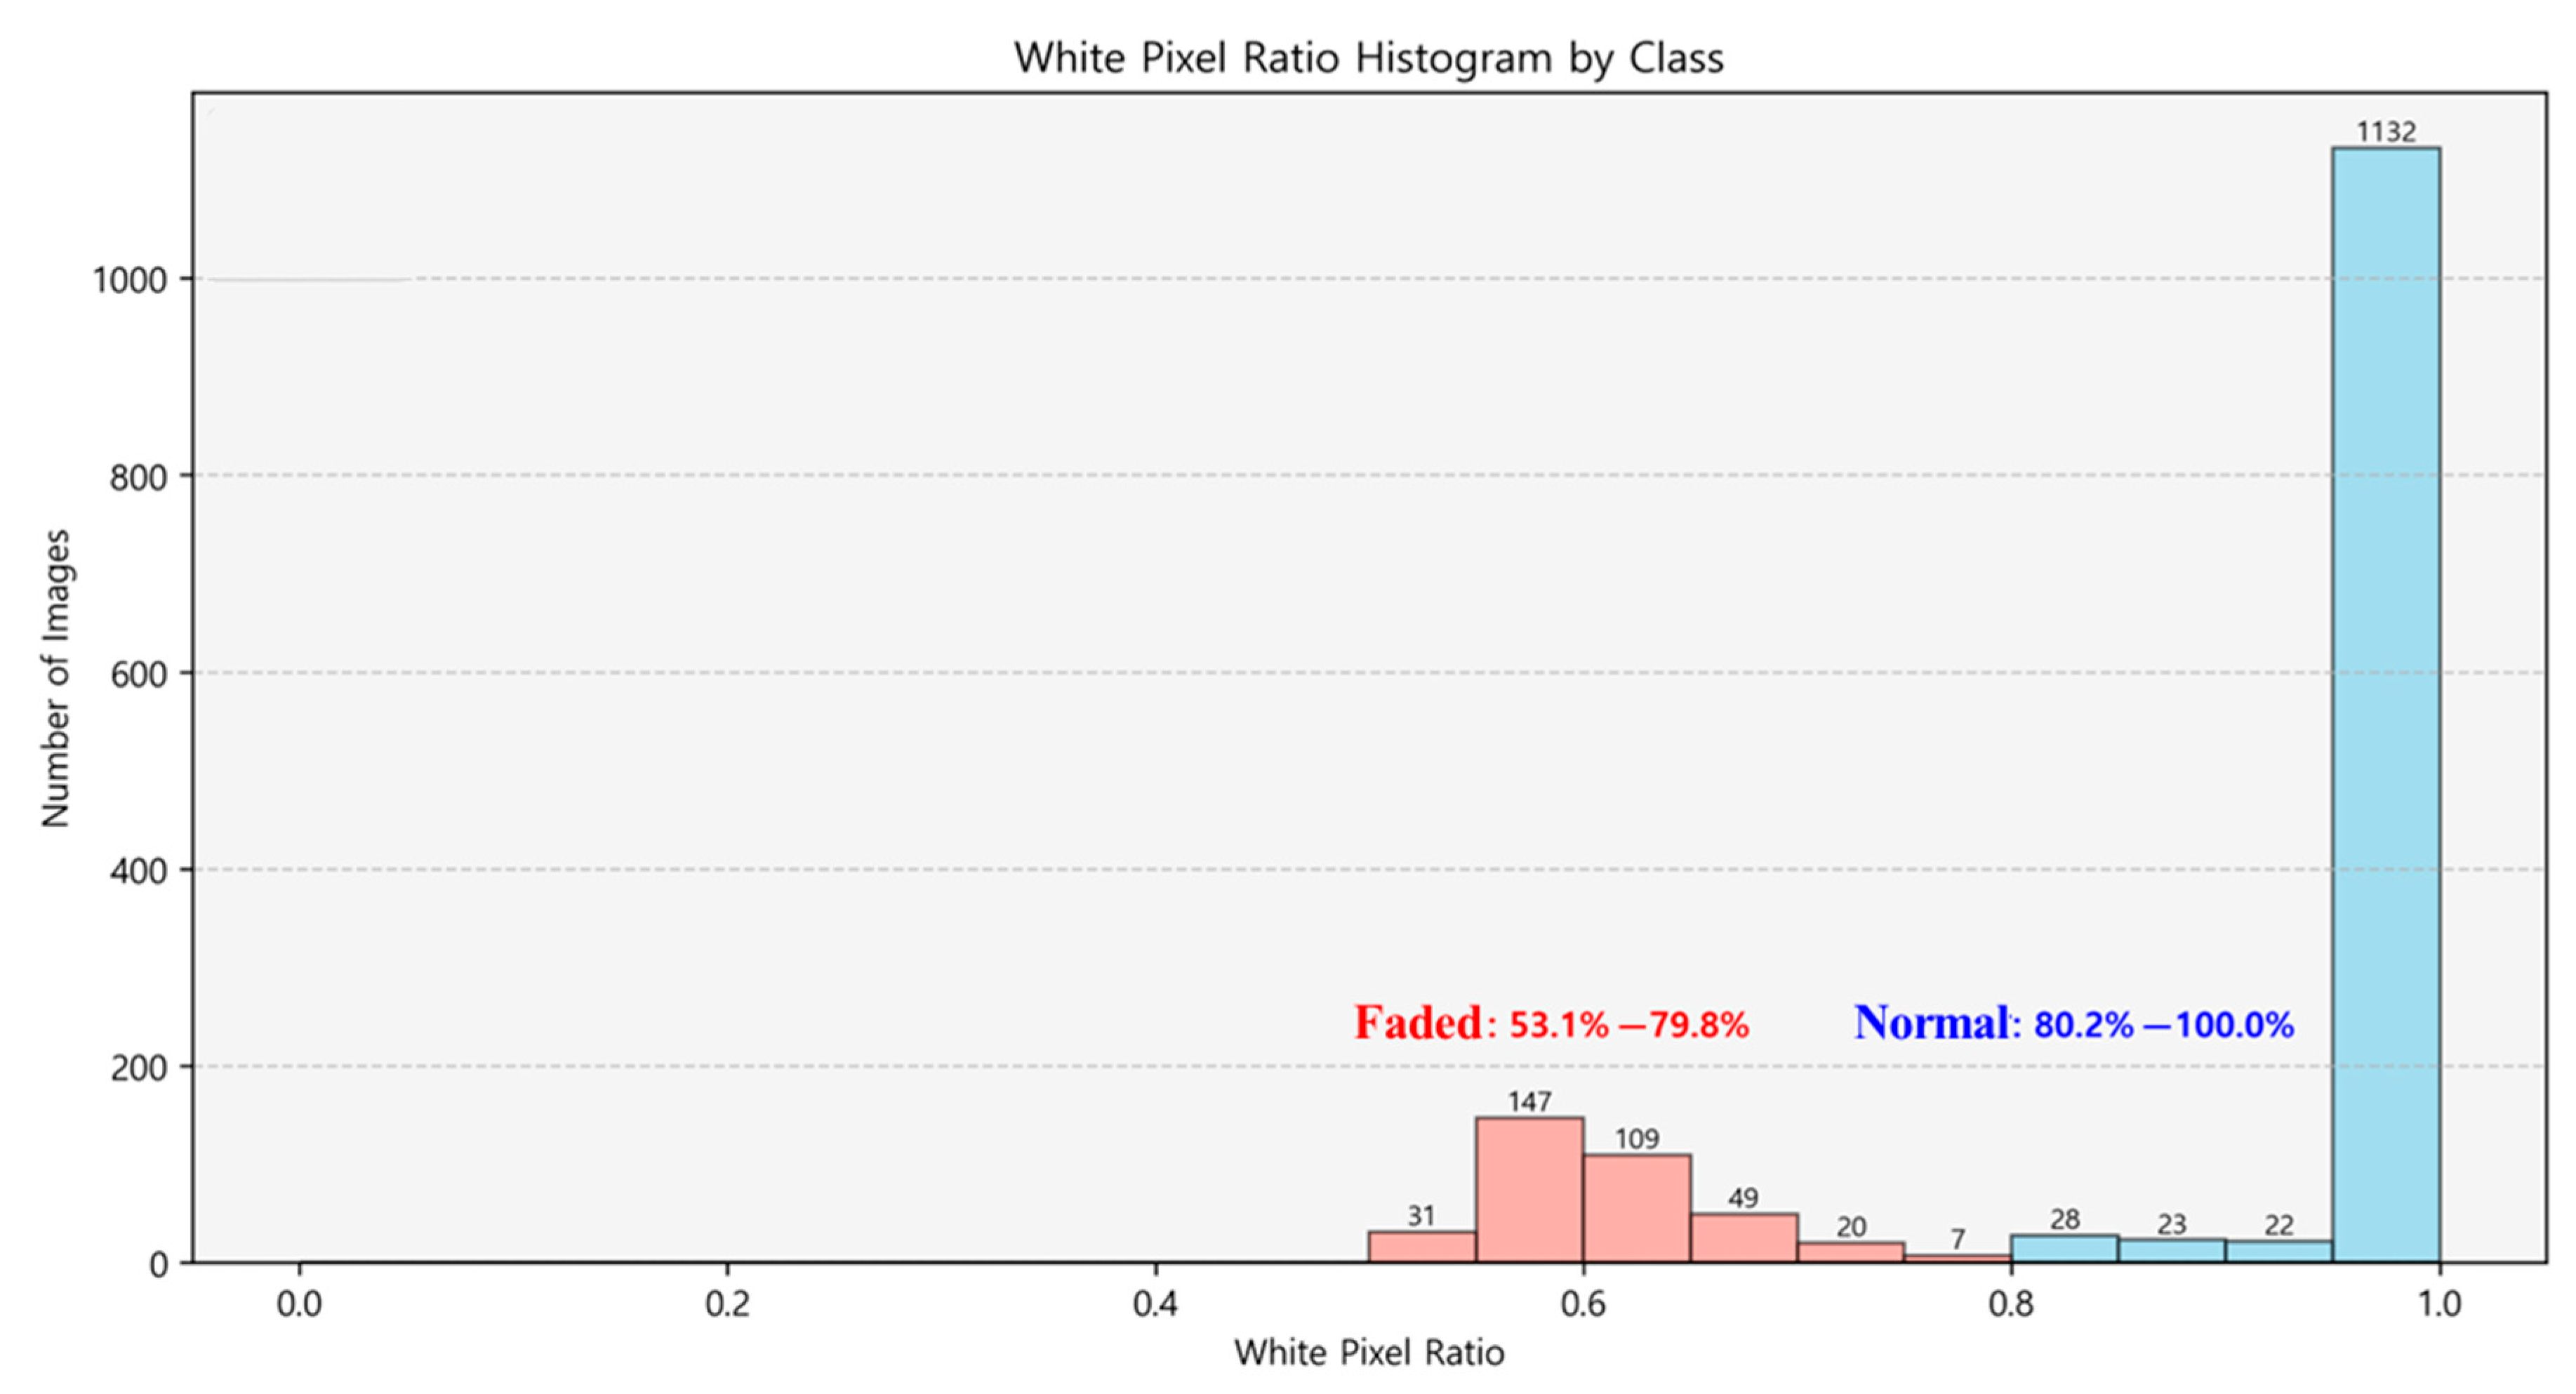
4.2. Lane Assessment Algorithm Development

The YOLO algorithm is widely used in computer vision due to its lightweight architecture and fast, accurate object detection. However, its focus on detection and classification limits its ability to assess object condition, importance, or risk—reducing its usefulness in decision-making contexts. To overcome this, the present study proposes an extended YOLO-based lane evaluation algorithm that incorporates quantitative assessment and explicit evaluation criteria.
This algorithm builds on a previously developed lane identification model, adding a process in the head section to evaluate lane degradation. As shown in Figure 10, the algorithm consists of three key steps: applying image processing techniques, defining quantitative indicators to distinguish between intact and degraded markings, and classifying each lane as normal or worn.
To develop the image processing techniques, it was necessary to extract individual lane images from the training data. In the original training images, both intact and worn lane markings were labeled together with the background, requiring separation from surrounding visual elements. To address this, approximately 1600 lane images containing background elements were extracted from the training dataset. The extraction process and resulting samples are presented in Figure 11.
In the lane condition verification process, different image processing techniques are applied depending on the condition of the lane markings. For intact lanes, edge-filling is performed to ensure continuity without gaps, followed by the calculation of pixel occupancy. In contrast, for degraded lanes, edge extraction, secondary Canny edge detection, and morphological operations are used to remove noise and restore the lane area before computing the pixel occupancy ratio. Figure 12 provides a conceptual illustration of the lane condition evaluation process, and detailed algorithmic steps are outlined in Algorithm 2.
Algorithm 2: Lane Assessment Process
Input: Image set I , Hyperparameter CSV P
Output: White Pixel Ratio and Final Processed Images
1.  
Initialize result folder and clear existing files.
2.  
for each image i I \in i I do
3.  
if i is not in supported format then
4.  
  Skip to next image.
5.  
end if
6.  
 Read image i and apply grayscale conversion.
7.  
 Retrieve optimized parameters T 1 T 2 for i from P.
8.  
 Apply median filter to reduce noise.
9.  
 Apply Canny edge detection with T 1 and T 2 .
10.
 Generate overlay image with filtered edges.
11.
 Connect close edge pixels.
12.
if Number of edges ≤ 400 (Condition 1) then
13.
  Fill internal edges and calculate white pixel ratio.
14.
else
15.
  Perform second Canny edge detection (Condition 2).
16.
  Apply morphological operations and calculate white pixel ratio.
17.
end if
18.
 Save processed results and append white pixel ratio to CSV.
19.
if Current index < Visualization Limit then
20.
  Display visualization of intermediate steps.
21.
end if
22.
end for
23.
Save all processed images and pixel ratios to output folder.
Figure 13 shows the analysis results for intact and worn lane markings. In intact lanes, few internal pixels were detected in the first Canny edge detection, indicating a good condition. In worn lanes, many internal pixels appeared initially but were removed through a second Canny detection and morphological operations, resulting in a low final pixel occupancy.
Figure 14 illustrates the pixel occupancy distribution for intact and worn lane markings, based on the lane evaluation algorithm shown in Figure 14. The analysis showed that intact lanes had pixel occupancy between 80.2% and 100.0%, while worn lanes ranged from 53.1% to 79.8%. Based on this, lanes with occupancy above 80% were classified as intact and those below 80% as worn. This threshold enables a quantitative assessment of lane degradation and supports consistent evaluation across various road environments. Although the effective data range starts from approximately 0.4, the figure retains the full 0.0–1.0 scale to ensure consistency and transparency in visual representation.

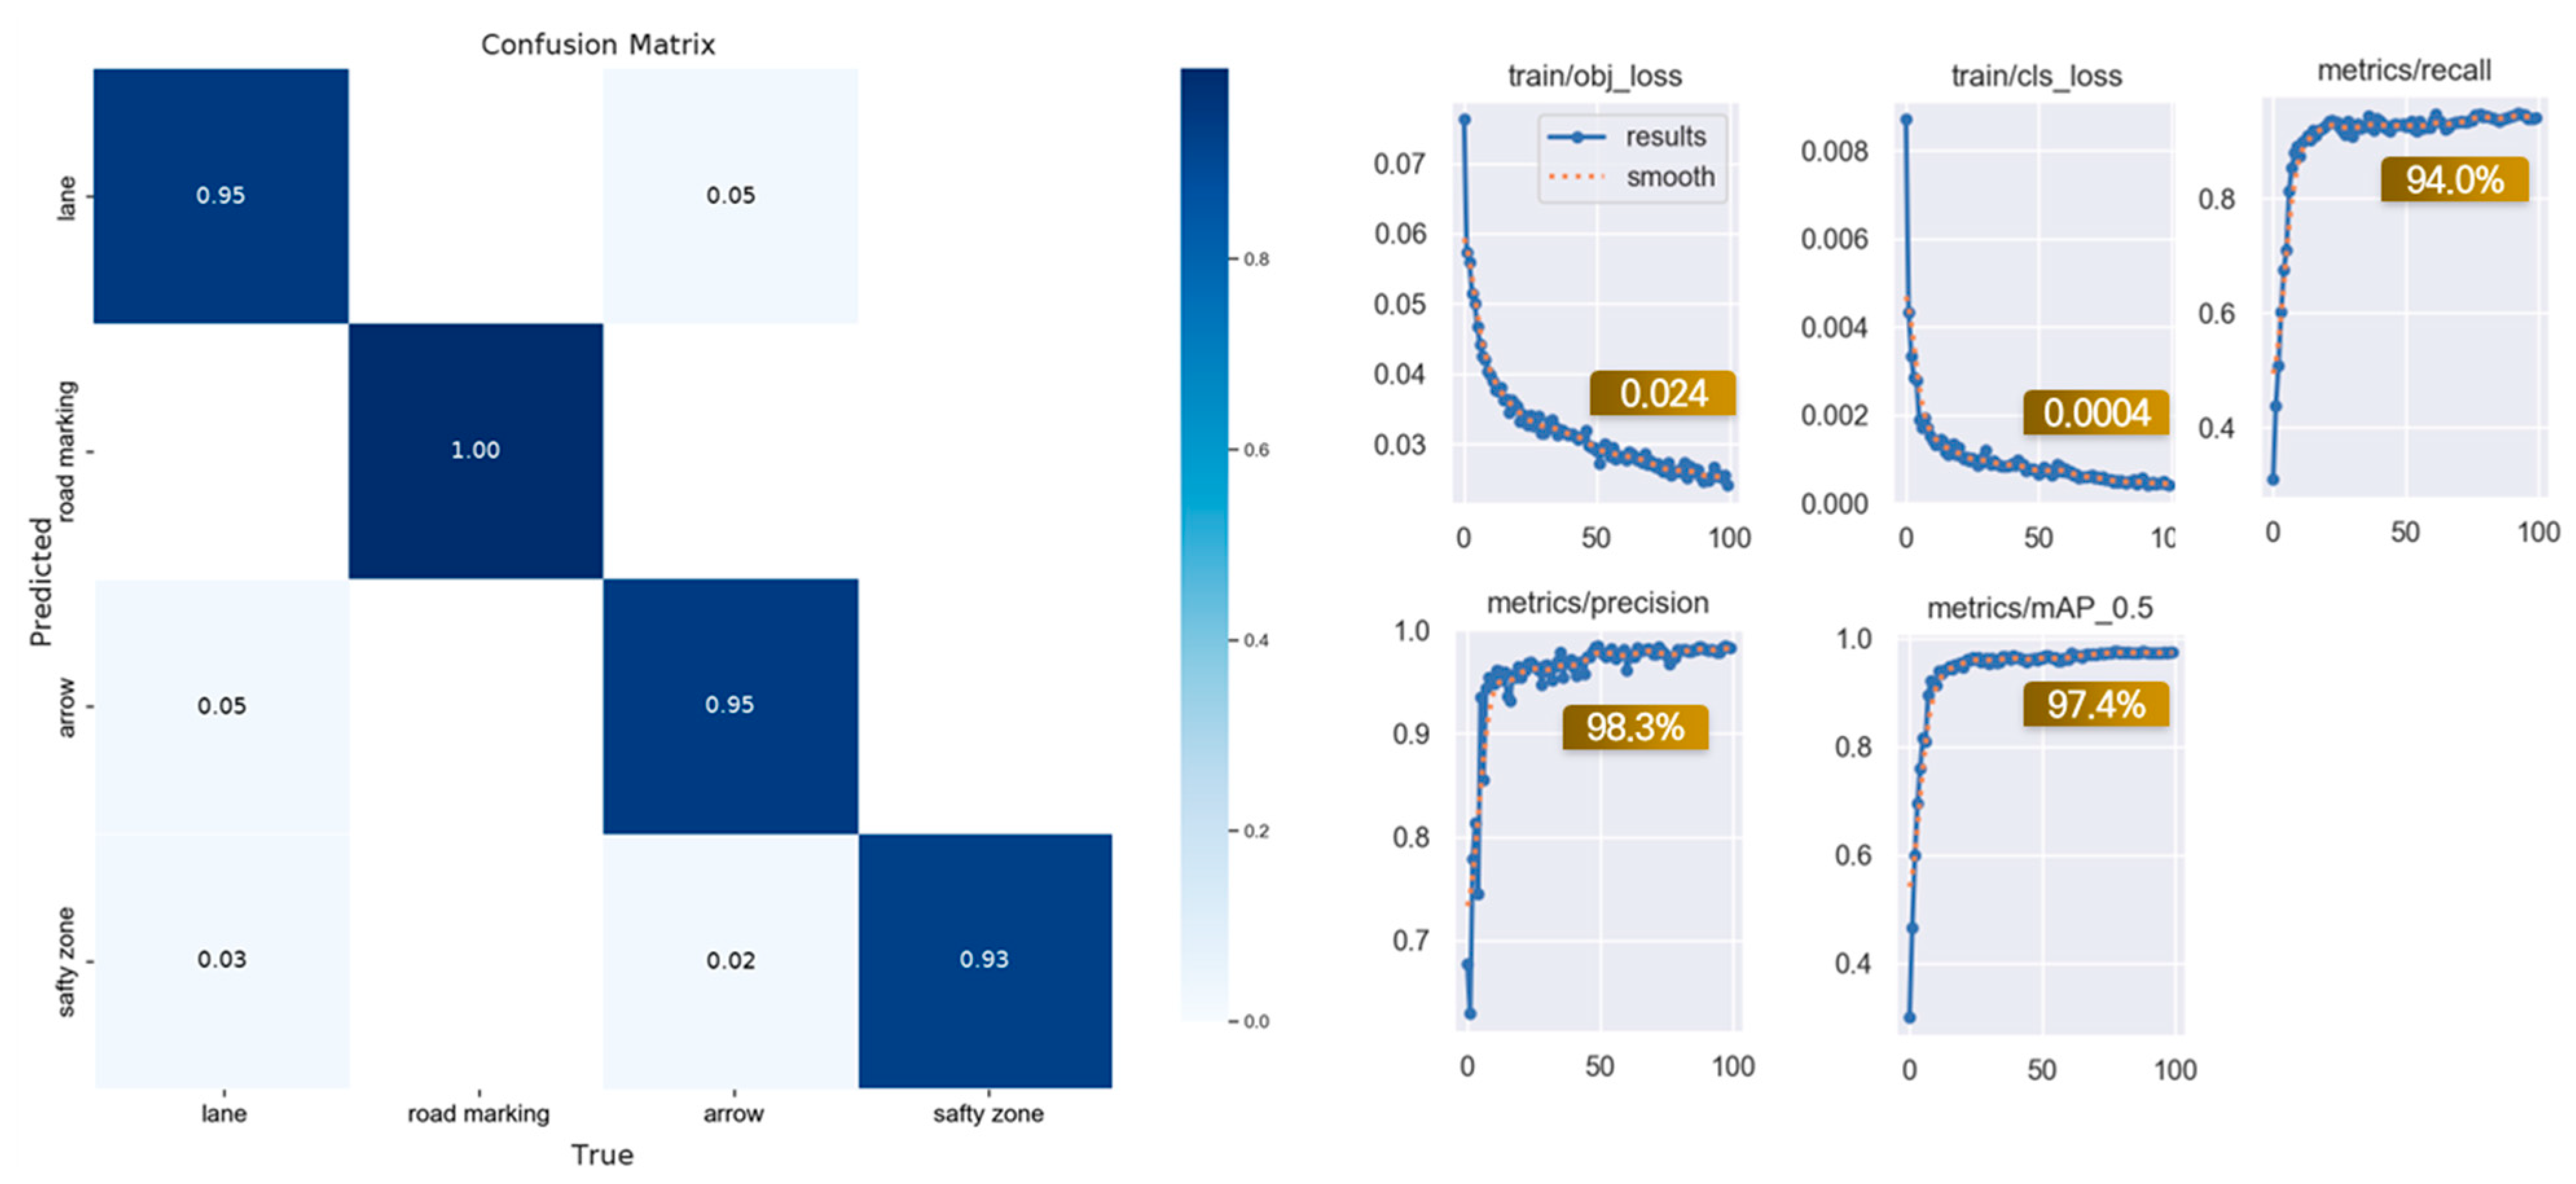
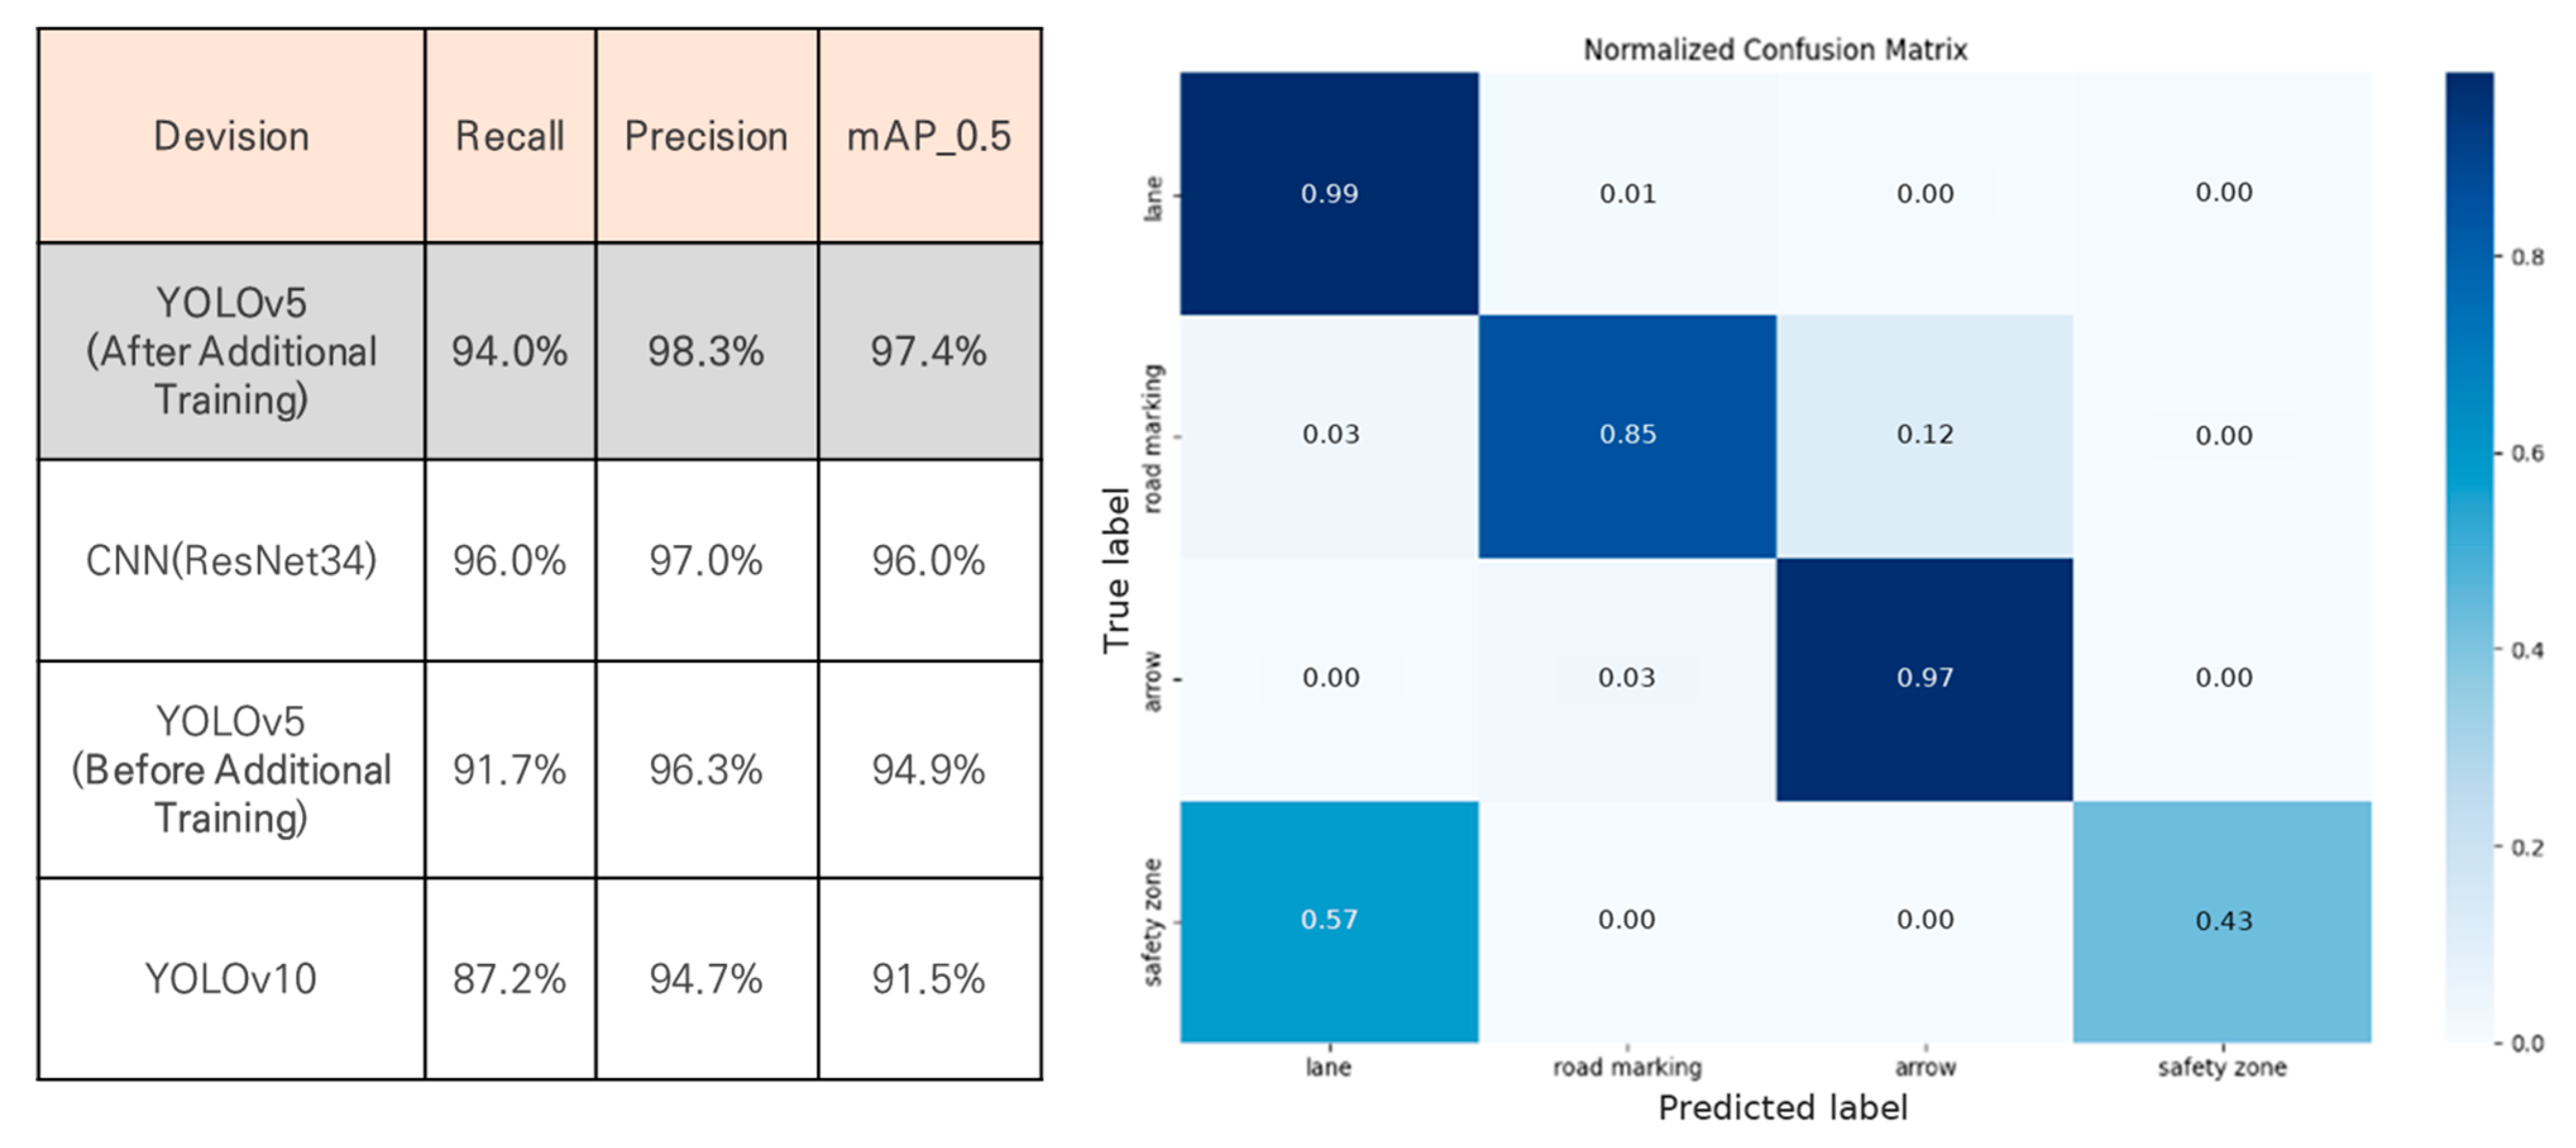
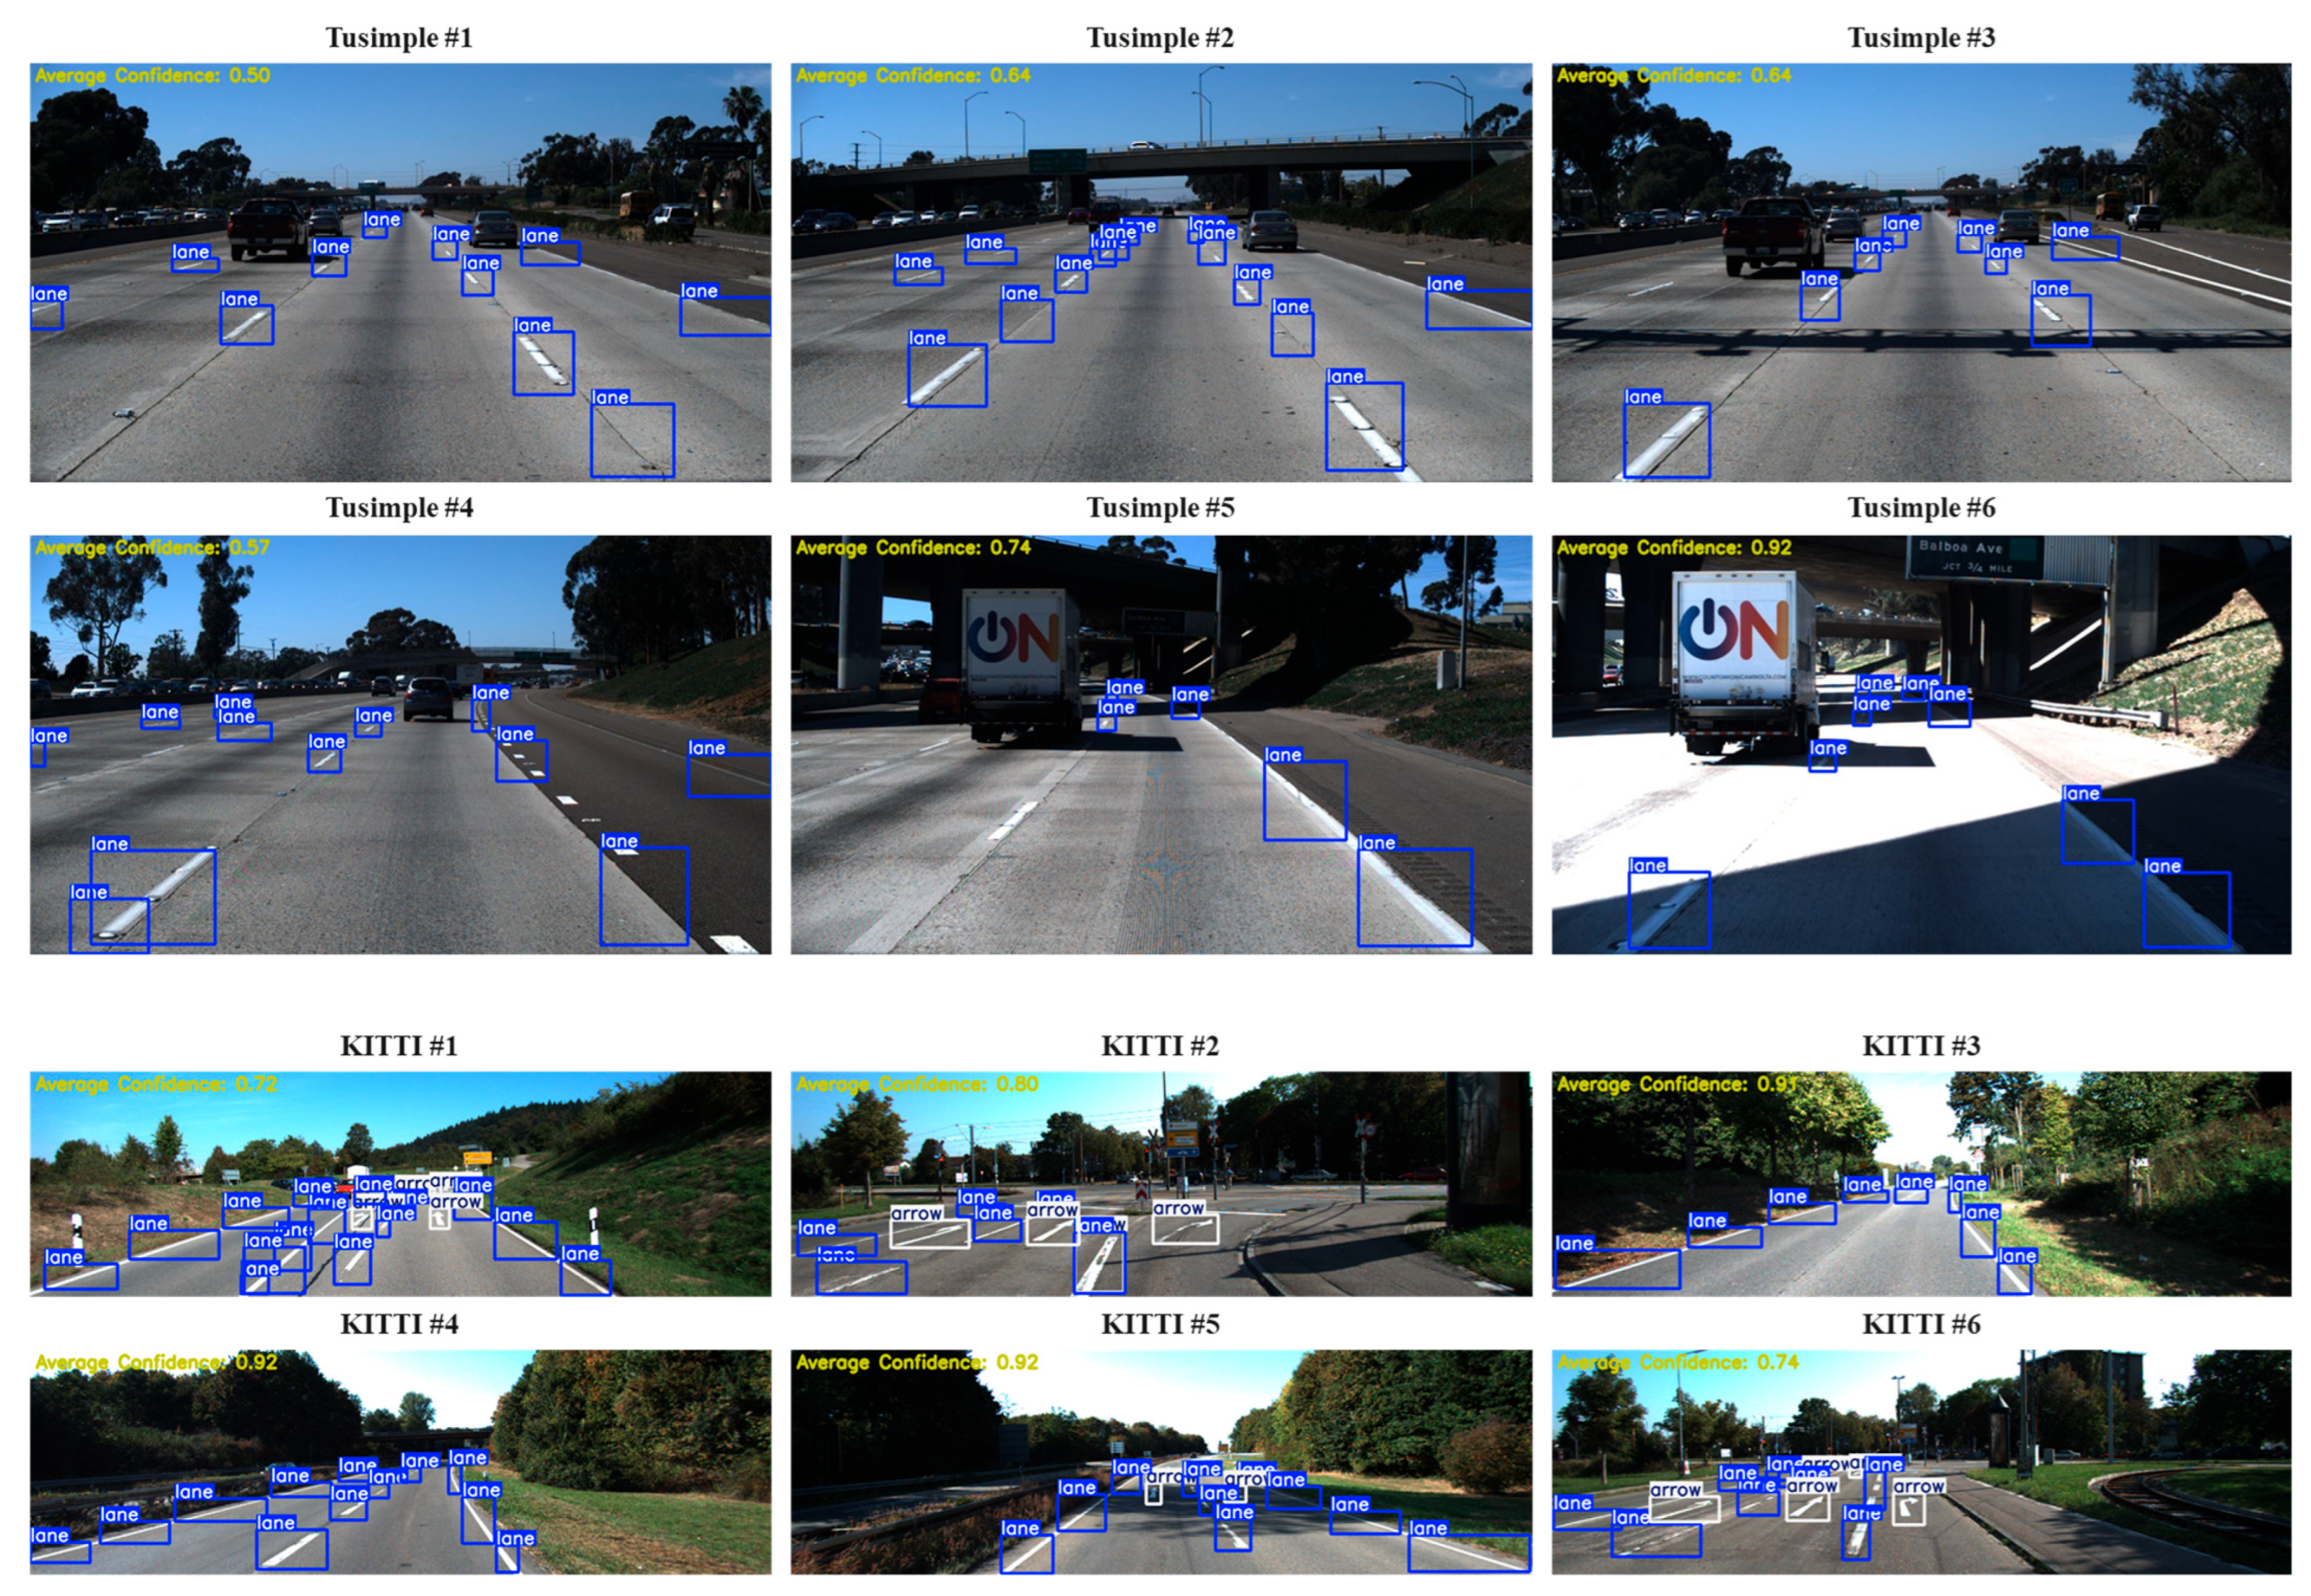
4.3. Performance Validation and Framework Development

To evaluate the generalization performance of the lane identification algorithm, accuracy was tested on new images. Six arterial road images were selected from each of the KITTI and TuSimple datasets. As shown in Figure 15, the average intersection over union (AIoU) ranged from 0.64 to 0.92, reflecting the accuracy of the predicted object locations.
Figure 16 presents the results of lane condition assessment. While most intact and worn lanes were accurately classified, several issues were identified. First, non-lane areas were occasionally misclassified as worn lanes. Second, lanes located farther from the image center were sometimes misclassified due to reduced resolution. Third, in twilight conditions, decreased brightness led to the false identification of intact lanes as worn.
Figure 17 illustrates the structure of the lane identification and assessment framework developed in this study. The framework consists of two main stages: lane identification and lane assessment. In the identification stage, a YOLO-based object detection model is used to detect road elements, including lanes, from the input image and classify lane objects. In the assessment stage, each detected lane is individually analyzed. Pixel occupancy is calculated, and Canny edge detection along with morphological operations is applied to determine whether the lane is in a normal condition. This approach enables reliable lane detection and evaluation under diverse road conditions and generates an output image containing both the detected lanes and their condition status.

5. Conclusions

This study proposed a vision-based framework for lane identification and condition assessment to support the stable lane-keeping functionality of AVs. Unlike conventional road standards focused on human perception and nighttime visibility, the proposed framework addresses the need for evaluation criteria suited to sensor-based AV driving environments by focusing on the geometric integrity of lane markings.
A YOLOv5-based lane detection algorithm was developed using real-world driving data collected from major urban expressways in Seoul. Multi-label annotation and data augmentation techniques were employed to enhance the model’s accuracy and generalization. The trained model achieved a mean average precision (mAP) of 97.4%, and its performance was validated on external datasets such as KITTI and TuSimple, confirming its robustness. Based on the detection results, a lane condition assessment algorithm was constructed using pixel occupancy analysis combined with edge and morphological operations. A threshold of 80% pixel occupancy was introduced to distinguish between intact and worn lanes, and this criterion was shown to perform reliably under various road and lighting conditions.
The findings suggest that AI-based evaluation techniques can complement existing visibility-based standards and support the development of AV-compatible lane maintenance policies by providing quantitative, interpretable criteria. The framework is also applicable in real-world conditions, offering both technical feasibility and policy relevance.
However, several limitations should be noted. The training data were limited to urban expressways and typical day/night scenarios, lacking adverse weather or rural road conditions. Additionally, the 80% pixel occupancy threshold was derived from the characteristics of the training dataset and may vary depending on lane material, color, and brightness contrast. Its generalizability should be validated with diverse datasets and environments.
To address these limitations, future research should explore integrating more advanced techniques capable of improving performance in challenging environments. For example, Transformer-based models (e.g., LDTR) can offer improved robustness under nighttime and occluded scenes, contrastive learning frameworks (e.g., CLLD) enhance detection in fading or low-visibility conditions, and dual-branch architectures allow simultaneous detection and degradation segmentation. While not applied in the current study, these techniques hold potential to reinforce the proposed framework by enabling adaptive evaluation under complex road and environmental conditions.
Building on these insights, future research should aim to integrate such approaches to improve performance under adverse conditions and to establish more adaptive evaluation criteria beyond fixed pixel occupancy thresholds. By laying the groundwork for such advancements, the proposed framework contributes a practical baseline for infrastructure assessment in autonomous driving. Continued research should focus on expanding environmental diversity in training data and refining evaluation methods to ensure broader applicability and consistency.

Author Contributions

Conceptualization, H.N., D.G.K.; data curation, H.N., J.M.K.; formal analysis, H.N.; methodology, H.N.; project administration, H.N.; supervision, H.N.; validation, H.N., C.L.; visualization, H.N.; writing—original draft preparation, H.N.; writing—review and editing, H.N. All authors have read and agreed to the published version of the manuscript.

Funding

This research received no external funding.

Institutional Review Board Statement

Not applicable.

Informed Consent Statement

Not applicable.

Data Availability Statement

The data used to support the findings of this study are available from the corresponding author upon request.

Conflicts of Interest

The authors declare no conflicts of interest.

References

  1. World Road Association (PIARC). The Contribution of Road Transport to Sustainability and Economic Development: A PIARC Special Project; World Road Association (PIARC): Nanterre, France, 2020. [Google Scholar]
  2. Grigorescu, S.; Trasnea, B.; Cocias, T.; Macesanu, G. A Survey of Deep Learning Techniques for Autonomous Driving. J. Field Robot. 2019, 37, 362–386. [Google Scholar] [CrossRef]
  3. Em, P.P.; Hossen, J.; Fitrian, I.; Wong, E.K. Vision-Based Lane Departure Warning Framework. Heliyon 2019, 5, e02169. [Google Scholar] [CrossRef] [PubMed]
  4. Paek, D.; Kong, S.-H.; Wijaya, K.T. K-Lane: Lidar Lane Dataset and Benchmark for Urban Roads and Highways. arXiv 2021, arXiv:2110.11048. [Google Scholar] [CrossRef]
  5. Yadav, S.; Kumar, S.N.T.; Rajalakshmi, P. Vehicle Detection and Tracking Using Radar for Lane Keep Assist Systems. In Proceedings of the 2023 IEEE 97th Vehicular Technology Conference (VTC2023-Spring), Florence, Italy, 20–23 June 2023. [Google Scholar] [CrossRef]
  6. Federal Highway Administration (FHWA). Manual on Uniform Traffic Control Devices for Streets and Highways, 11th ed.; USA Department of Transportation: Washington, DC, USA, 2023. [Google Scholar]
  7. California Department of Motor Vehicles (DMV). Disengagement Reports; 2024. Available online: https://www.dmv.ca.gov/portal/vehicle-industry-services/autonomous-vehicles/disengagement-reports/ (accessed on 29 July 2024).
  8. Tang, J.; Li, S.; Liu, P. A Review of Lane Detection Methods Based on Deep Learning. Pattern Recognit. 2021, 111, 107623. [Google Scholar] [CrossRef]
  9. Mamun, A.A.; Ping, E.P.; Hossen, J.; Tahabilder, A.; Jahan, B. A Comprehensive Review on Lane Marking Detection Using Deep Neural Networks. Sensors 2022, 22, 7682. [Google Scholar] [CrossRef] [PubMed]
  10. Na, H.; Kim, D.; Kang, J.; Lee, C. Development of a Lane Identification and Assessment Framework for Maintenance Using AI Techniques. In Proceedings of the 16th ITS European Congress, Seville, Spain, 19–21 May 2025. [Google Scholar]
  11. Aly, M. Real-Time Detection of Lane Markers in Urban Streets. In Proceedings of the 2008 IEEE Intelligent Vehicles Symposium, Eindhoven, The Netherlands, 4–6 June 2008; pp. 7–12. [Google Scholar]
  12. Bojarski, M.; Testa, D.; Dworakowski, D.; Firner, B.; Flepp, B.; Goyal, P.; Jackel, L.D.; Muller, U. End-to-End Learning for Self-Driving Cars. arXiv 2016, arXiv:1604.07316. [Google Scholar] [CrossRef]
  13. Pan, X.; Shi, J.; Luo, P.; Wang, X.; Tang, X. Spatial As Deep: Spatial CNN for Traffic Scene Understanding. In Proceedings of the 32nd AAAI Conference on Artificial Intelligence, New Orleans, LA, USA, 2–7 February 2018. [Google Scholar]
  14. Kim, J.; Lee, M. Robust Lane Detection Based on Convolutional Neural Network and Random Sample Consensus. In Neural Information Processing: 21st International Conference, Proceedings of the ICONIP 2014, Kuching, Malaysia, 3–6 November 2014; Springer: Cham, Switzerland, 2014; pp. 454–461. [Google Scholar] [CrossRef]
  15. Huval, B.; Wang, T.; Tandon, S.; Kiske, J.; Song, W.; Pazhayampallil, J.; Andriluka, M.; Rajpurkar, P.; Migimatsu, T.; Cheng-Yue, R.; et al. An Empirical Evaluation of Deep Learning on Highway Driving. arXiv 2015, arXiv:1504.01716. [Google Scholar] [CrossRef]
  16. Redmon, J.; Divvala, S.; Girshick, R.; Farhadi, A. You Only Look Once: Unified, Real-Time Object Detection. In Proceedings of the IEEE Conference on Computer Vision and Pattern Recognition (CVPR), Las Vegas, NV, USA, 27–30 June 2016; pp. 779–788. [Google Scholar] [CrossRef]
  17. Roy, A.M.; Bhaduri, J. A Computer Vision Enabled Damage Detection Model with Improved YOLOv5 Based on Transformer Prediction Head. arXiv 2023, arXiv:2303.04275. [Google Scholar] [CrossRef]
  18. Swain, S.; Tripathy, A.K. Real-Time Lane Detection for Autonomous Vehicles Using YOLOv5 Segmentation Model. J. Auton. Veh. Technol. 2024, 12, 718–728. [Google Scholar] [CrossRef]
  19. Yang, Z.; Shen, C.; Shao, W.; Xue, R. LDTR: Transformer-Based Lane Detection with Anchor-Chain Representation. Comput. Vis. Media 2024, 10, 753–769. [Google Scholar] [CrossRef]
  20. Wang, P.; Luo, Z.; Zha, Y.; Zhang, Y.; Tang, Y. End-to-End Lane Detection: A Two-Branch Instance Segmentation Approach. Electronics 2025, 14, 1283. [Google Scholar] [CrossRef]
  21. Chen, L.-C.; Papandreou, G.; Kokkinos, I.; Murphy, K.; Yuille, A.L. DeepLabv3+: Encoder-Decoder with Atrous Separable Convolution for Semantic Image Segmentation. In Proceedings of the European Conference on Computer Vision (ECCV), Munich, Germany, 8–14 September 2018; pp. 801–818. [Google Scholar] [CrossRef]
  22. Ghafoorian, M.; Nugteren, C.; Baka, N.; Booij, O.; Hofmann, M. EL-GAN: Embedding Loss Driven Generative Adversarial Networks for Lane Detection. arXiv 2018, arXiv:1806.05525. [Google Scholar] [CrossRef]
  23. Neven, D.; De Brabandere, B.; Georgoulis, S.; Proesmans, M.; Van Gool, L. Towards End-to-End Lane Detection: An Instance Segmentation Approach. Mach. Vis. Appl. 2018, 29, 1281–1293. [Google Scholar]
  24. Paszke, A.; Chaurasia, A.; Kim, S.; Culurciello, E. ENet: A Deep Neural Network Architecture for Real-Time Semantic Segmentation. arXiv 2016, arXiv:1606.02147. [Google Scholar] [CrossRef]
  25. Zoljodi, A.; Abadijou, S.; Alibeigi, M.; Daneshtalab, M. Contrastive Learning for Lane Detection via Cross-Similarity (CLLD). Pattern Recognit. Lett. 2024, 185, 175–183. [Google Scholar] [CrossRef]
  26. Peng, J.; Bu, X.; Sun, M.; Zhang, Z.; Tan, T.; Yan, J. Large-Scale Object Detection in the Wild from Imbalanced Multi-Labels. arXiv 2020, arXiv:2005.08455. [Google Scholar] [CrossRef]
  27. Yun, S.; Han, D.; Oh, S.J.; Chun, S.; Choe, J.; Yoo, Y. CutMix: Regularization Strategy to Train Strong Classifiers with Localizable Features. In Proceedings of the IEEE/CVF International Conference on Computer Vision (ICCV), Seoul, Republic of Korea, 27 October–2 November 2019; pp. 6022–6031. [Google Scholar] [CrossRef]
  28. Zhang, J. Evolution of YOLO: A Comparative Analysis of YOLOv5, YOLOv8, and YOLOv10. In Proceedings of the 9th International Conference on Computing Innovation and Applied Physics (CONF-CIAP 2025), Singapore, 23–25 March 2025; pp. 185–192. [Google Scholar] [CrossRef]
Figure 1. Devices installed for data collection: (a) an in-vehicle camera capturing the LKAS activation status; (b) a mobile application recording GPS coordinates and LKAS disengagement reasons; (c) external cameras capturing front and rear vehicle views.
Applsci 15 07410 g001
Figure 2. Data collection routes along major urban expressways in Seoul: Olympic-daero (43.1 km), Gangbyeonbuk-ro (28.4 km), Seobu-gansun-ro (12.4 km), Dongbu-gansun-ro (29.6 km), Naebu-sunhwan-ro (22.0 km), Bukbu-gansun-ro (8.3 km), and Gangnam Sunhwan-ro (13.8 km).
Applsci 15 07410 g002
Figure 3. Matched internal DB with external videos.
Applsci 15 07410 g003
Figure 4. YOLO-based lane identification and assessment process: (I) Image generation and preprocessing procedures for equipment setup and function check. (II) Object labeling process to distinguish lane markings from other classes. (III) Model training, evaluation, and additional training through inference results. (IV) YOLOv5 architecture structure consisting of backbone, neck, and head. (V) Lane condition assessment algorithm that analyzes lane pixel occupancy and classifies the lane as normal or faded based on a threshold value.
Applsci 15 07410 g004
Figure 5. Labeling decision process for lane-related objects, including road markings, arrows, safety zones, and lanes (both dashed and solid lines are labeled as “lane”).
Applsci 15 07410 g005
Figure 6. Image examples after data augmentation.
Applsci 15 07410 g006
Figure 7. Structure of the lane identification algorithm (YOLOv5).
Applsci 15 07410 g007
Figure 8. (Left) Confusion Matrix/(Right) Performance Results.
Applsci 15 07410 g008
Figure 9. (Left) comparison analysis results/(right) CNN confusion matrix.
Applsci 15 07410 g009
Figure 10. Structure of the lane assessment algorithm.
Applsci 15 07410 g010
Figure 11. Results of normal and faded lane extraction.
Applsci 15 07410 g011
Figure 12. Lane condition evaluation algorithm: concept and process.
Applsci 15 07410 g012
Figure 13. Analysis results of normal and faded lanes.
Applsci 15 07410 g013
Figure 14. Classification of normal and faded lanes based on white pixel ratio using defined thresholds.
Applsci 15 07410 g014
Figure 15. Average IOU analysis results per image.
Applsci 15 07410 g015
Figure 16. Visualization of lane assessment results generated by the proposed algorithm.
Applsci 15 07410 g016aApplsci 15 07410 g016b
Figure 17. Framework for lane identification and condition assessment: (a) Lane identification algorithm using YOLOv5 to detect various road markings and isolate objects classified as “lane” for further evaluation. (b) Lane condition assessment algorithm that determines whether each lane is faded or normal through pixel-level edge detection and morphological processing; the assessment logic is embedded in the head stage of the YOLOv5 architecture to enable integrated lane detection and degradation analysis.
Applsci 15 07410 g017
Disclaimer/Publisher’s Note: The statements, opinions and data contained in all publications are solely those of the individual author(s) and contributor(s) and not of MDPI and/or the editor(s). MDPI and/or the editor(s) disclaim responsibility for any injury to people or property resulting from any ideas, methods, instructions or products referred to in the content.

