Article

Post-Certification Quality Analysis of Traditional Indian Fried Snacks

by
Surya Sasikumar Nair
1,*,
Ansa Varghese
2,3,
Monika Trząskowska
1,
Wojciech Kolanowski
4,
Anna Katarzyna Mazurek-Kusiak
5 and
Joanna Trafiałek
1,*
1
Department of Food Gastronomy and Food Hygiene, Institute of Human Nutrition Sciences, Warsaw University of Life Sciences–SGGW, Nowoursynowska Str. 159, 02-776 Warsaw, Poland
2
Department of Science, Faculty of Engineering and Science, University of Greenwich, Pembroke, Central Avenue, Chatham Maritime, Kent ME4 4TB, UK
3
Malayalam Exports, South Vellarappilly P.O. Sreemoolanagaram, Aluva, Ernakulam District, Kochi 683580, India
4
Healthcare Institute, State University of Applied Sciences in Przemyśl, 37-700 Przemyśl, Poland
5
Department of Tourism and Recreation, University of Life Sciences in Lublin, 15 Akademicka Street, 20-950 Lublin, Poland
*
Authors to whom correspondence should be addressed.
Appl. Sci. 2025, 15(13), 7404; https://doi.org/10.3390/app15137404
Submission received: 6 June 2025 / Revised: 26 June 2025 / Accepted: 27 June 2025 / Published: 1 July 2025
(This article belongs to the Special Issue Emerging Trends in Food Safety and Quality Control)

Abstract

Microbiological safety and quality consistency are critical challenges in the production of traditional Indian fried snacks, particularly in small-scale food enterprises. With growing export demand, maintaining strict quality control measures is essential. This study assessed the microbiological and physicochemical quality of five traditional Indian fried snacks—Kerala Murukku, Kerala Mixture, Banana Chips, Tapioca Chips, and Achappam—produced in a Food Safety Management System (FSMS)-certified facility over a four-year period (2020–2023). Products were evaluated for moisture, pH, salt content, acid value, and Total Plate Count (TPC). The number of ingredients for each product was recorded from standardized product formulation documents. TPC levels remained within acceptable limits (below 50,000 CFU/g) across all products. Among them, Kerala Mixture consistently showed the highest microbial counts (up to 4.61 log CFU/g) and Achappam the lowest, with no detectable variance (1.00 log CFU/g). Statistically significant year-wise differences (p < 0.05) were observed in all quality parameters. Kerala Mixture showed variation in salt and microbial load; Kerala Murukku varied in moisture, pH, and salt; while Tapioca Chips varied in moisture and salt. PCA identified that TPC, salt content, number of ingredients, and pH were key contributors to product variability. Cluster analysis confirmed Kerala Mixture as the most susceptible product to contamination risk. These findings provide valuable insights into the quality trends within an FSMS-certified environment and highlight the importance of strict post-processing controls.

1. Introduction

Traditional foods, native to specific regions, serve as a dietary staple for people of all age groups. Among them, fried snacks, especially cereals and legume-based snacks, are particularly popular due to their distinctive taste, ability to satisfy hunger, and contribution to energy and nutrient intake, particularly through carbohydrates, fats, and proteins [1,2,3,4]. India’s rich culinary diversity has led to the creation of a wide array of deep-fried and high-temperature processed foods. The Indian snacks product market reached USD 5347 million in 2024 and is expected to grow at an 8.26% compound annual growth rate by 2033 [5,6], which are categorized as chips, namkeen, extruded snacks, and others [7]. Several factors, including processing methods, starch–protein structure, and processing environments, influence the quality of these snacks [8]. Deep-fat frying is a common method used in the preparation of flour-based fried snacks [2]. However, microbial contamination poses a significant food safety concern in these products.
Microbial contamination in traditional snacks can be attributed to several sources, including raw ingredients, improper handling, and post-processing conditions. Staphylococcus aureus has been reported as one of the most frequently occurring pathogens in ready-to-eat (RTE) foods, primarily due to its ability to survive on human skin and environmental surfaces as an opportunistic microorganism. Thus, even if high-temperature frying effectively kills the S. aureus cells that are present in the ingredients, such as raw flours and grains, before cooking, inadequate post-processing practices can cross-contaminate the foods from equipment or workers. Several studies have reported that such practices can be the root cause of most foodborne diseases [9,10,11,12,13,14]. Moreover, S. aureus can produce heat-stable enterotoxins, so the consumption of contaminated products may lead to staphylococcal food poisoning even in the absence of viable cells [9]. Bacillus and Serratia species, which are spore-forming and environmentally persistent contaminants, have been frequently associated with RTE snacks and cereal products. A study on the microbiological safety of some Nigerian RTE fried snacks sold along the highways showed contamination with Bacillus cereus, S. aureus, Escherichia coli, and Salmonella spp. [15]. Spices such as pepper and curry paste often contain high concentrations of Bacillus spores. While these spices are not RTE foods, their use in seasoning poses a risk of indirect contamination. The presence of such microorganisms indicates potential contamination from raw ingredients and improper storage conditions [11]. As such, implementing an effective food safety management system (FSMS) is essential to mitigating potential hazards.
Moreover, India faces a significant challenge with foodborne diseases, particularly diarrheal infections, causing significant mortality and morbidity. Over 60% of emerging pathogens are from animals and the environment, transmitted through food and water. However, reported incidents are inaccurate due to their sporadic and self-limiting nature. The Integrated Disease Surveillance Programme (IDSP), a national initiative by the Ministry of Health and Family Welfare in India, is responsible for tracking and responding to epidemic-prone diseases. Surveillance data from the IDSP show a significant increase in outbreaks across India [16,17,18,19]. Moreover, a recent comprehensive review by Albert et al. 2024 has detailed the current situation of foodborne and waterborne disease outbreaks in India, highlighting risk factors, surveillance gaps, and control measures, emphasizing the need for improved regulatory frameworks and public awareness [20]. The Hazard Analysis and Critical Control Point (HACCP) and International Organization for Standardization (ISO) 22000 frameworks are widely used in food businesses to identify and control safety hazards. ISO 22000 integrates HACCP principles with good manufacturing practices to form a comprehensive Food Safety Management System (FSMS) [21,22,23,24]. As consumer expectations for safe and consistent food products grow, the verification of FSMS implementation, particularly HACCP, is crucial for real-world production effectiveness [25,26,27].
While several studies have explored ISO 22000:2018 implementation in food manufacturing [27,28,29], few have assessed FSMS performance through direct analysis of product quality in traditional South Indian fried snacks. The present study was conducted in a small-scale food exporting company in India operating under an ISO 22000:2018-certified environment. A previous study carried out in this same facility assessed FSMS implementation using a direct audit method [30], providing a complementary perspective on compliance with ISO 22000:2018 requirements. The current study aimed to evaluate product quality by analyzing the physicochemical and microbiological quality of traditional Indian fried snacks in the period from 2020 to 2023. The working hypothesis was that, within such a certified environment, the selected quality parameters, moisture%, acid value of extracted fat, pH, salt content, and total plate count (TPC), would remain within acceptable safety limits over the study period. These indicators were used to assess product quality and potential contamination risks, which in turn reflect the effectiveness of process control under the FSMS framework.

2. Materials and Methods

2.1. Characteristics of the Company

The present study was conducted in a small-scale food manufacturing and exporting firm located in Kerala, India. The company specializes in producing traditional South Indian fried snacks solely for export markets and operates under an internationally recognized food safety framework. To comply with global food safety requirements and meet importing country expectations, the company implemented the ISO 22000:2018 certification in 2020. The scope of FSMS ISO 22000:2018 implementation in this company covers all stages of production, from raw material procurement to final sales.
Although ISO 22000:2018 establishes well-structured food safety controls, this study does not evaluate the direct impact of certification. Instead, the research focuses on verifying product quality trends within the FSMS-certified environment, assessing physicochemical and microbiological parameters as indicators of process consistency and compliance with international safety standards.

2.2. Sample Collection and Processing

Five traditional Indian fried snacks were selected for analysis based on their popularity and demand in the export market [5,31]: Kerala Murukku, Kerala Mixture, Banana Chips, Tapioca Chips, and Achappam (Figure 1). These snacks are deep-fried, flour- or starch-based snacks commonly consumed across India. Kerala Murukku is a rice-flour and black gram-based, spiral-shaped snack; Kerala Mixture consists of deep-fried chickpea flour noodles mixed with nuts and spices; Banana Chips and Tapioca Chips are thinly sliced, deep-fried fruit and root vegetable chips, respectively; and Achappam is a crispy, flower-shaped fried snack or rose cookie made from rice flour.
All products were manufactured in an ISO 22000:2018-certified facility and packed in metalized polyethylene terephthalate (PET) packaging material, with modified-atmospheric packaging (nitrogen-flushed) immediately after processing. Packaging material was double-sealed and stored at ambient temperature [32]. Samples were collected randomly once per year from 2020 to 2023. A total of 20 samples were collected, comprising one finished product packet for each of the five products per year from 2020 to 2023. Each sample was analyzed in triplicate to ensure data reliability. The physicochemical and microbiological analysis was performed by the company according to the company’s internal procedures, and the resulting data were made available for this study. The full ingredient composition for each product is shown in Table 1.

2.3. Physicochemical Analysis

The analytical methods applied by the company followed the IS 12711 (1989): Bakery products—Methods of analysis [33]. Product samples were finely ground, and the ground powder was used for the estimation of physicochemical quality parameters, including moisture content, salt content, pH, and acid value of extracted fat. These parameters are the most frequently recommended tests to assess the quality of deep-fried snacks, and serve as essential indicators of product safety, shelf life, and sensory quality [34]. The moisture content of the samples was measured by the hot air oven method, where 10 g of the sample was dried in a 100 ± 2 °C oven until constant weight was achieved. The moisture content of finished products is usually less than 2% [35]. The salt content was analyzed by ashing 5.0 g of the sample, dissolving the chloride residues, and titrating with 0.1N silver nitrate (AgNO3) using potassium chromate as an indicator until a permanent light brick red color was observed. The pH of the 10 g samples homogenized with 100 mL of distilled water was determined with a calibrated pH meter. The lower pH value (acidic) in food samples may result from the oxidation of fat content, resulting in the formation of fatty acids [36]. The acid value of extracted fat was determined by extracting fat using a Soxhlet apparatus and then dissolving it in a solvent (isopropyl alcohol/toluene) and titrating it with a standard alkali (potassium hydroxide/sodium hydroxide) solution after adding phenolphthalein as an indicator. A lower acid value indicates better fat quality in food [37], values exceeding one are generally considered an indication of rancidity and reduced product safety [38].

2.4. Microbiological Analysis

Total Plate Count (TPC) or Aerobic Plate Count (APC) was selected as the microbiological parameter in this study because it serves as a general hygiene indicator and reflects overall microbial load in food products [39]. TPC assessment is widely used in food safety evaluations to monitor contamination levels during processing and storage.
Microbiological analysis was performed by the company following procedures based on the FDA’s Bacteriological Analytical Manual (BAM) methods [40]. Packed product samples were analyzed for the Total Plate Count (TPC) method. Samples (10 g) were aseptically weighed, homogenized in 90 mL 0.1% Butterfield’s phosphate buffer, and serially diluted. The TPC was estimated by inoculating the samples into Plate Count Agar (PCA) (Himedia) and incubating them at 37 °C for 48 h. The colony-forming units per gram (cfu/g) were calculated using the following formula:
N = C 1 × n 1 + 0.1 × n 2 × d
where
N = number of colonies per ml or gram of sample;
C = sum of all colonies of plates counted;
n1 = number of plates in the first dilution counted;
n2 = number of plates in the second dilution counted;
d = dilution from which the first counts were obtained [40].
According to the Food Safety and Standards Authority of India (FSSAI) [41], the maximum acceptable microbiological count is 50,000 CFU per gram. Other studies have adopted 5.99 log cfu/g as a microbial safety threshold for similar products [26,42,43]. Samples exceeding this limit were considered microbiologically unsafe.

2.5. Statistical Analysis

The statistical analysis of the physicochemical and microbiological data was performed using Statistica software version 13.3 PL. Each test was performed in triplicate, and all values were shown as mean ± standard deviation. The Analysis of Variance (ANOVA) test, Tukey’s HSD test, Principal Component Analysis (PCA) [44], Spearman’s correlation, and multivariate cluster analysis were used. Significance was determined when p < 0.05.
The ANOVA and Tukey’s HSD test were conducted to evaluate the potential differences in product quality metrics across years. The Principal Component Analysis (PCA) and Spearman’s correlation were conducted to evaluate the relationship between quality parameters, ingredient load, and years across the fried snack products. Cluster analysis was used to develop dendrograms, clustering products based on microbial quality (CFU/log), as this method helps identify patterns in microbial contamination and assess similarities in food safety performance across different products. Ward’s method was applied to minimize the variance within the groups, and the Euclidean distance was calculated during the grouping of products [45].

3. Results

3.1. Physicochemical Analysis

Table 2 presents the mean ± standard deviation values for moisture content, acid value, pH, and salt content in the five fried snack products from 2020 to 2023. One-way ANOVA results indicated statistically significant differences over the years for all the physicochemical parameters.
Moisture content varied significantly by year for Kerala Murukku (p = 0.0032), Kerala Mixture (p = 0.0126), and Banana Chips (p = 0.0003), but no significant differences were found in Tapioca Chips (p = 0.2001) and Achappam (p = 0.1842). Post hoc comparisons of Tukey’s HSD test indicated that moisture content in Kerala Murukku in 2023 was significantly lower than in 2020 (p = 0.0222), 2021 (p = 0.0242), and 2022 (p = 0.0024). For Kerala Mixture, the moisture content had a significantly higher value from 2021 to 2022 (p = 0.0093), with a near-significant difference compared to 2020 (p = 0.0523). Regarding Banana Chips, the 2021 moisture content was significantly higher than in 2020 (p = 0.0037), 2022 (p = 0.0019), and 2023 (p = 0.0004).
The acid value of the fat extracted from the snack samples remained below 1.0 mg KOH/g across all years, indicating acceptable fat quality, and showed significant differences in Kerala Mixture (p = 0.0093), Banana Chips (p = 0.0022), and Tapioca Chips (p < 0.0001), but remained statistically unchanged in Kerala Murukku (p = 0.308) and Achappam (p = 0.0588). Tukey’s HSD test revealed that the acid value of Kerala Mixture in 2021 was significantly higher than in both 2022 (p = 0.0070) and 2023 (p = 0.0384). For Banana Chips, acid values in 2020 were significantly higher than in 2022 (p = 0.0026) and 2023 (p = 0.0068). In Tapioca Chips, the acid values in 2022 and 2023 were significantly lower than in 2020 and 2021 (all p < 0.0003), with no statistically significant difference observed between 2022 and 2023 (p = 0.8453).
pH values remained above 5 in all products, indicating mild acidity or neutral profiles. However, statistically significant differences were identified in Kerala Murukku (p < 0.000001), Tapioca Chips (p = 0.0234), and Achappam (p = 0.00007). Kerala Mixture (0.5806) and Banana Chips (p = 0.0786) did not show significant year-over-year changes in pH. The pH of Kerala Murukku shows gradually higher values from 5.96 in 2020 to 6.14 in 2023. The post hoc Tukey’s HSD test confirmed that the pH in 2023 was significantly higher than that in 2020 (p = 0.0002), 2021 (p = 0.0030), and 2022 (p = 0.0021), while no significant difference was found between 2021 and 2022 (p = 0.9882). In Tapioca Chips, although ANOVA indicated overall significance, Tukey’s HSD did not identify statistically significant pairwise differences at the 0.05 level. Nonetheless, a borderline difference was noted between 2020 and 2022 (p = 0.0522). For Achappam, the Tukey’s HSD test showed that pH values in 2022 and 2023 were significantly higher than in 2020 and 2021 (all p < 0.01), while no significant difference was found between 2022 and 2023 (p = 0.2221).
The salt content varied significantly by year across all products: Kerala Murukku (p = 0.0082), Kerala Mixture (p = 0.0167), Banana Chips (p = 0.0011), Tapioca Chips (p = 0.0055), and Achappam (p = 0.0379). A post hoc analysis using Tukey’s HSD test provided further insight into these differences. In Kerala Murukku, the salt content in both 2022 and 2023 was significantly higher than in 2020 (p = 0.0161 and p = 0.0130, respectively), although no significant differences were found between 2021 and the other years. For Kerala Mixture, the salt level in 2023 was significantly higher compared to both 2020 (p = 0.0256) and 2021 (p = 0.0283), indicating a trend of increasing salt incorporation in recent years. In Banana Chips, the salt levels in 2022 and 2023 were significantly greater than those in 2020, with p-values of 0.0035 and 0.0111, respectively. However, no statistically significant difference was detected between 2022 and 2023, suggesting stabilization in formulation practices during this period. Similarly, for Tapioca Chips, the salt content in 2022 and 2023 was significantly higher than in 2020 (p = 0.0145 and p = 0.0126, respectively), and 2023 levels were also elevated compared to those in 2021 (p = 0.0481), further indicating a progressive increase in seasoning levels. Regarding Achappam, a significant reduction in salt content was noted in 2022 compared to 2021 (p = 0.0430), although other pairwise comparisons were not statistically significant.
These observed variations in moisture, acid value, pH, and salt are likely influenced by the manual production process, where inconsistencies in the duration for frying, cooling, and mixing ingredients may affect the quality of the final product.

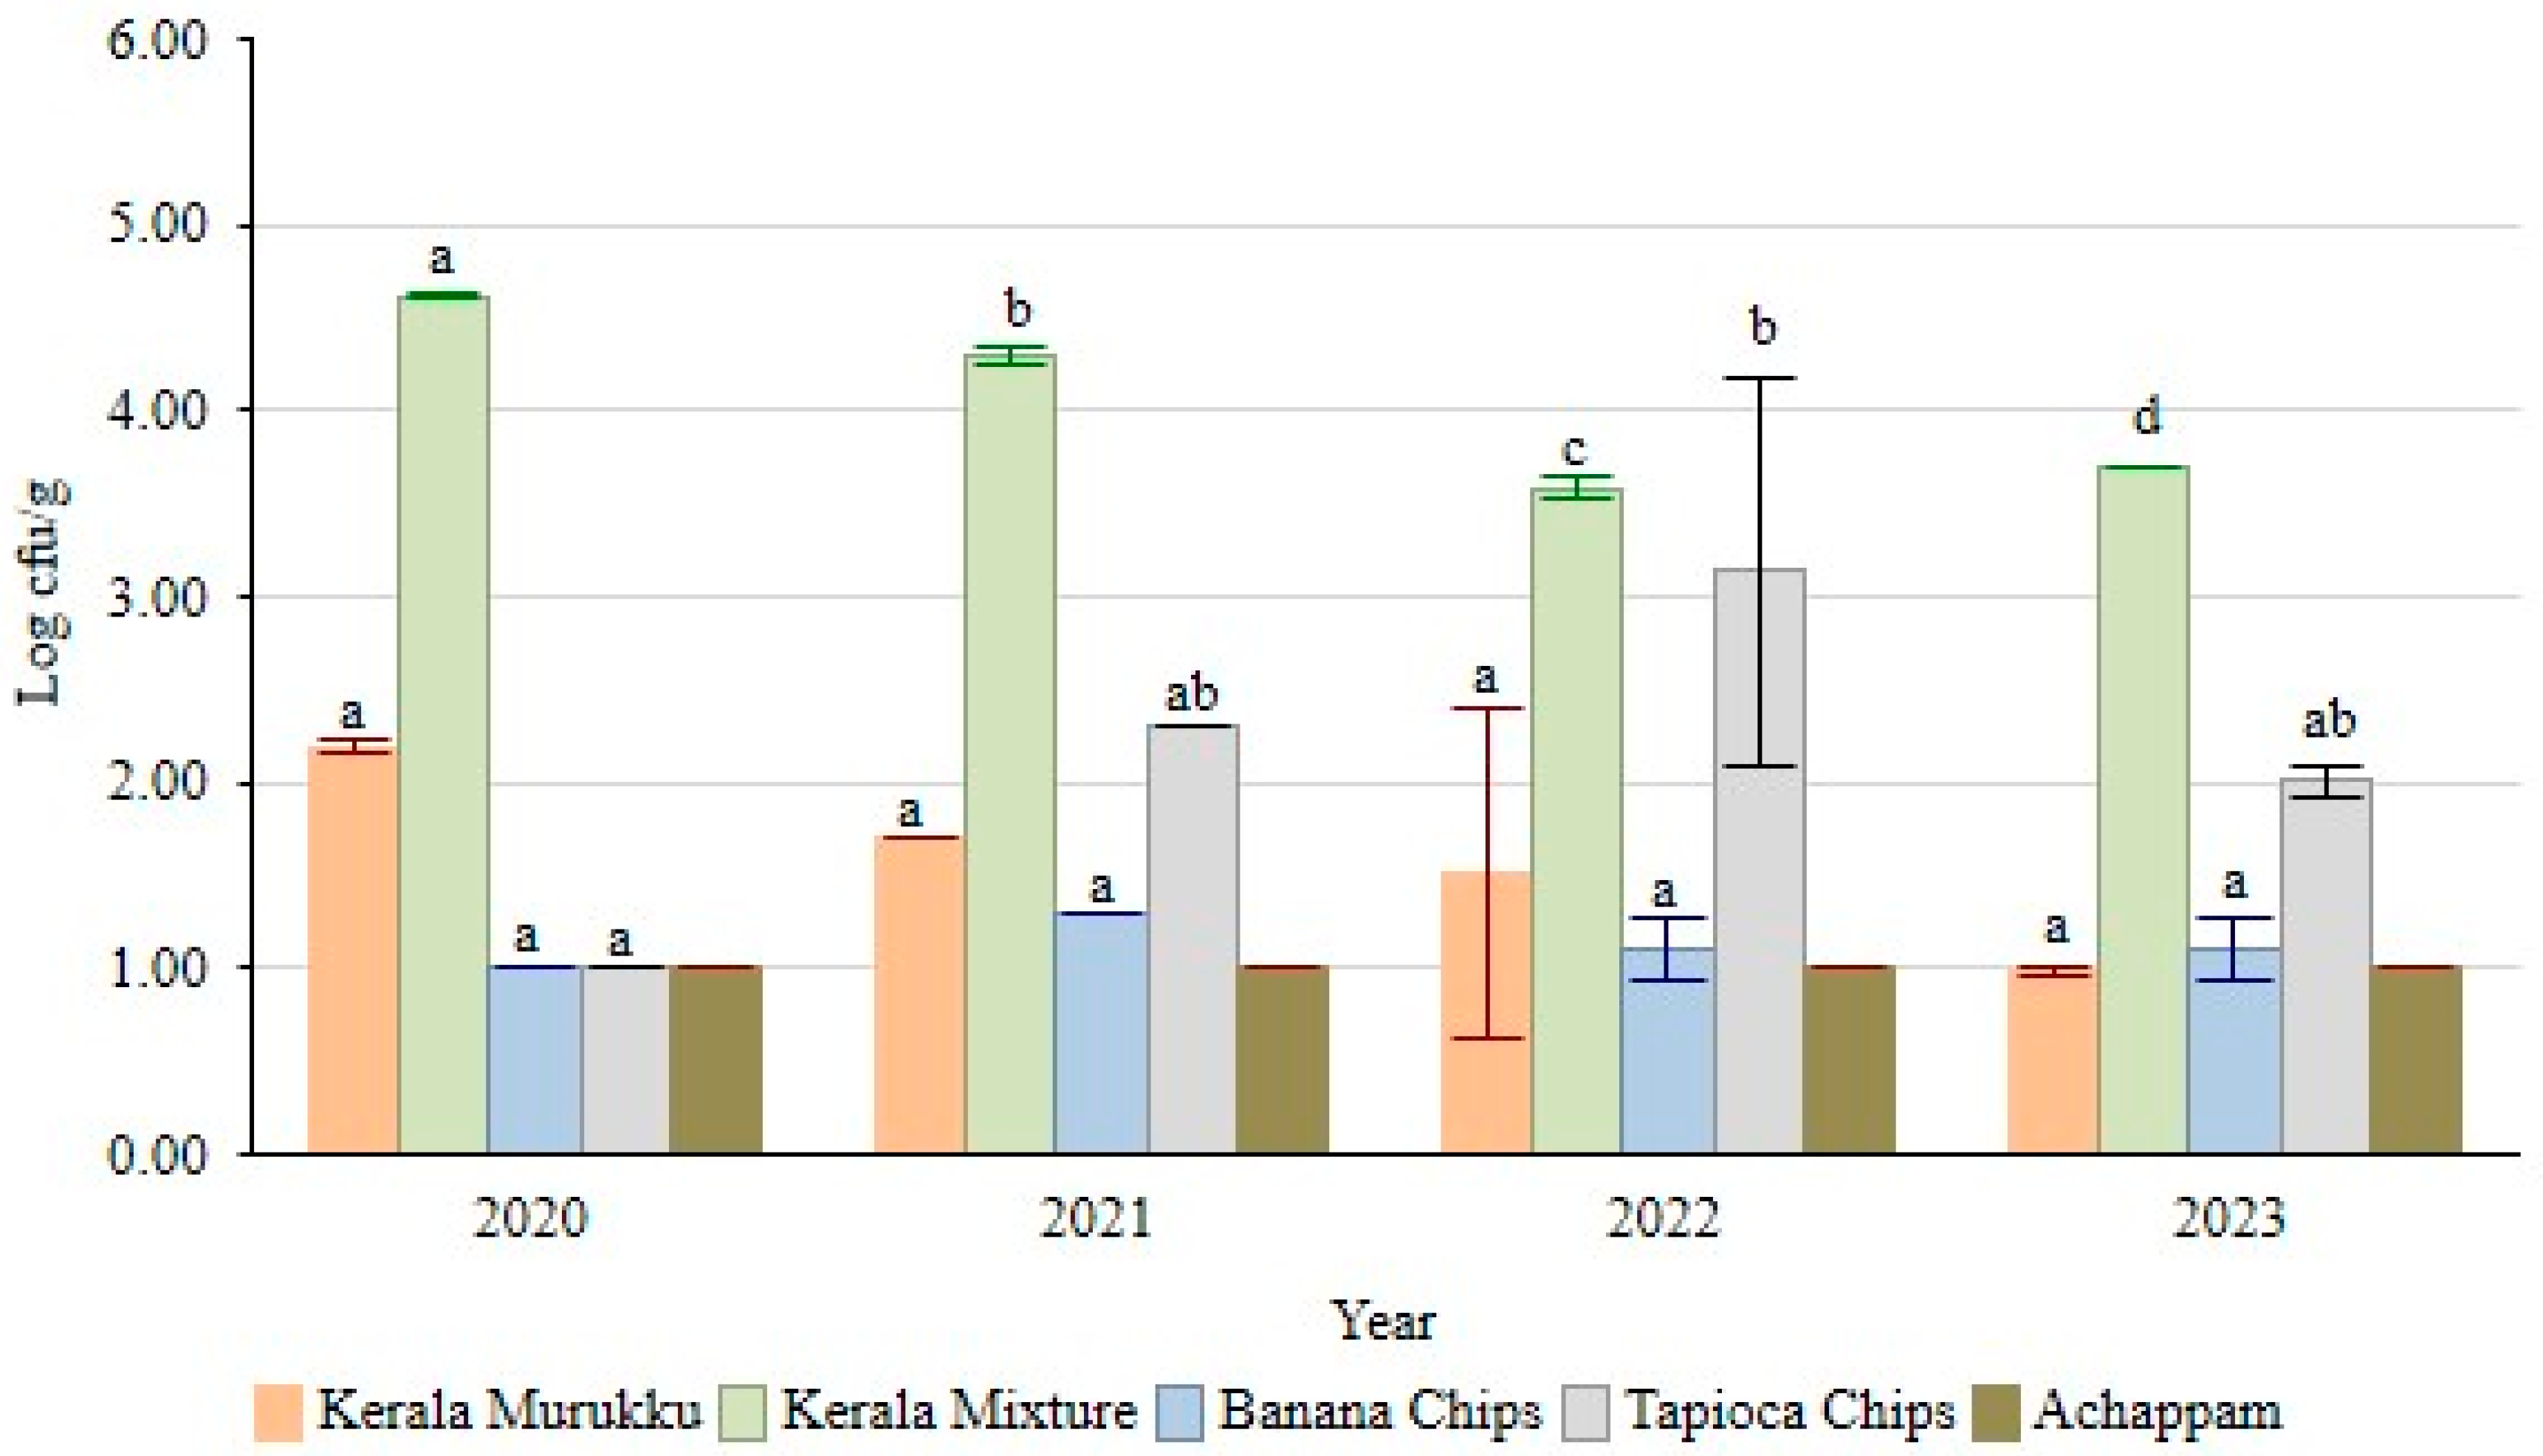
3.2. Microbiological Quality of Fried Products

The microbiological quality of food samples based on the total plate count is shown in Figure 2, presenting the mean values with standard deviations across products and years. The total plate count (TPC), expressed in log CFU/g, varied across years for certain products. One-way ANOVA revealed statistically significant differences in TPC over time for Kerala Mixture (p < 0.000001) and Tapioca Chips (p = 0.0074), while no significant variation was detected for Kerala Murukku (p > 0.05), Banana Chips (p > 0.05), and Achappam. All samples exhibited measurable aerobic bacterial counts, though none exceeded the regulatory threshold for acceptable microbial limits in ready-to-eat fried snacks (5.99 log CFU/g). Among the five products, Kerala Mixture consistently demonstrated the highest mean TPC values throughout the study period, with 4.61 log CFU/g recorded in 2020 and 3.70 log CFU/g in 2023. Tukey’s HSD post hoc test indicated that the 2023 TPC was significantly lower than that of 2020 (p = 0.0002), 2021 (p = 0.0002), and 2022 (p = 0.0178), suggesting a statistically supported variation between these time points. In Kerala Murukku, TPC values ranged from 2.19 log CFU/g in 2020 to 0.98 log CFU/g in 2023. Despite numerical differences, ANOVA did not detect statistically significant changes over time (p = 0.0667). Tapioca Chips showed notable variation in 2022. According to Tukey’s test, the TPC of Tapioca chips in 2022 was significantly different from 2020 (p = 0.0049), but no other yearly comparisons reached statistical significance. For Banana Chips, TPC values remained within a narrow range, and ANOVA confirmed the absence of statistically significant year-wise variation (p = 0.8764). Achappam presented uniform microbial results across all years, with TPC values remaining constant at 1.00 log CFU/g.

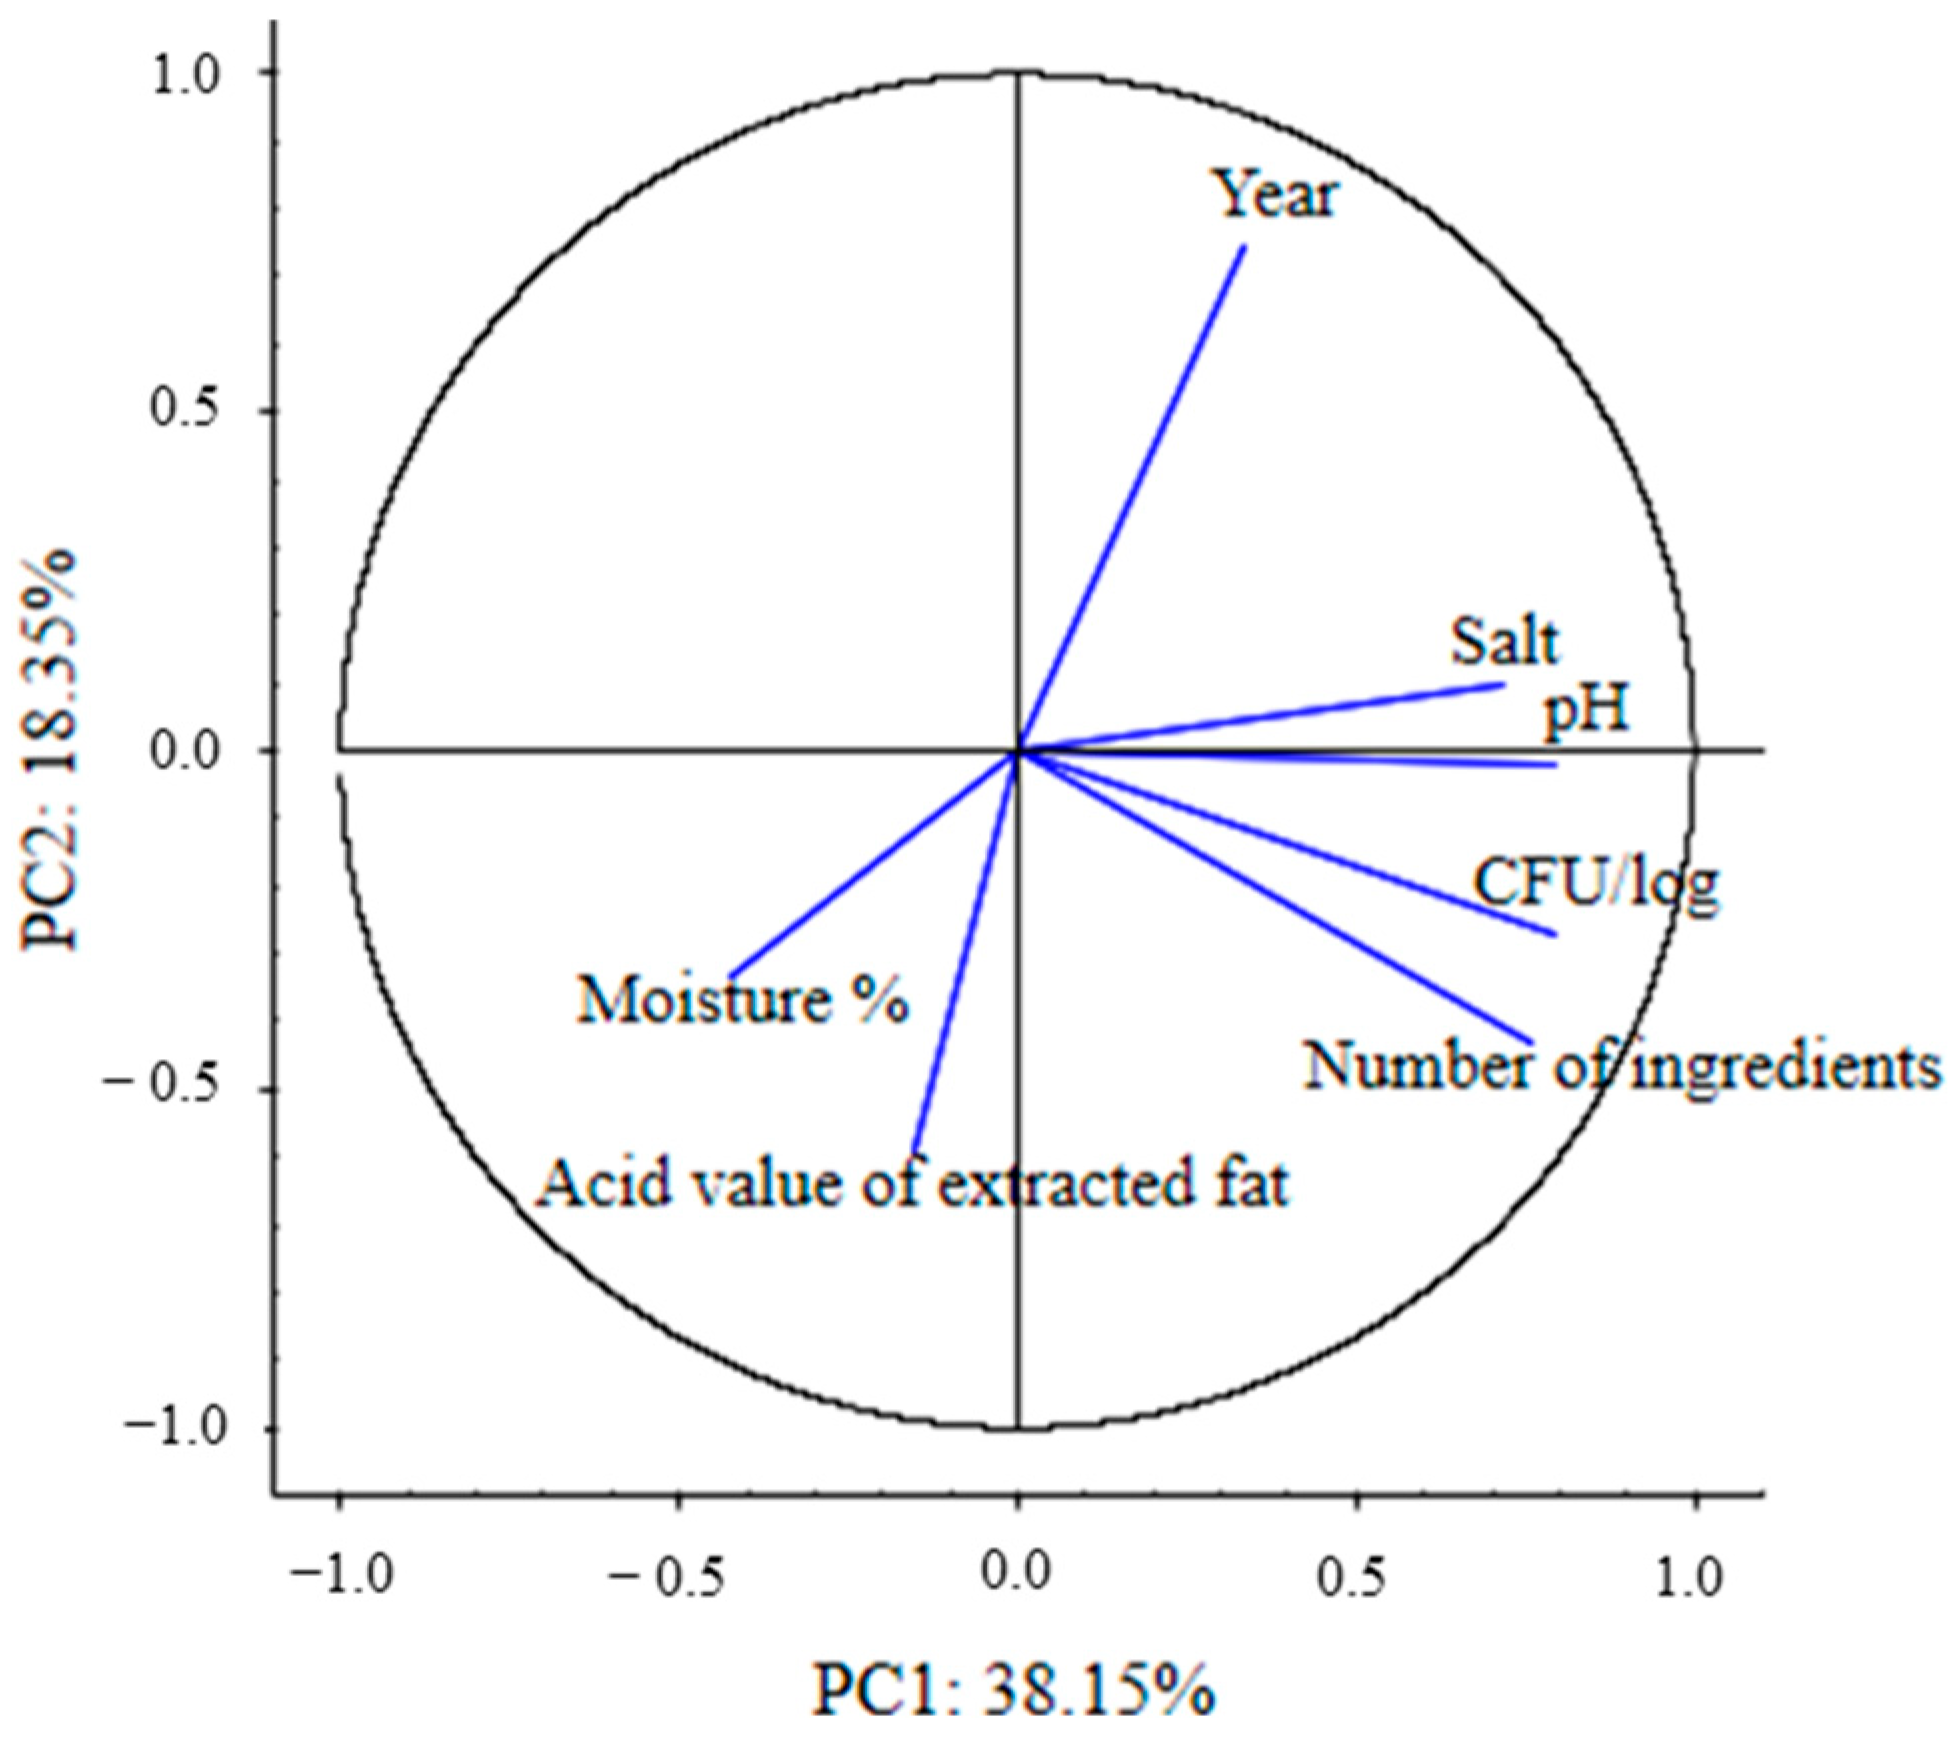
3.3. Correlation Between Physicochemical Parameters and Microbial Counts Across Products

Principal Component Analysis (PCA) grouped the samples based on their physicochemical and microbiological characteristics. The PCA biplot (Figure 3) illustrates the projection of variables on the factor plane defined by the first two principal components (PC1 and PC2). Together, these components accounted for 56.50% of the total variance, with PC1 and PC2 explaining 38.15% and 18.35% of the variance, respectively. These components were selected because they capture the most significant factors contributing to variability in the data, particularly in relation to the microbial counts and physicochemical parameters across different snack products [46]. The PC1 is positively correlated with the number of ingredients, CFU/log, pH, and salt content, and forms a group, acting as major contributors to the variance across time. PC2 is influenced by moisture% and acid value, but with negative correlations with PC1.
The correlation analysis further reveals that CFU/log moderately correlates with pH (r = 0.52) and salt content (r = 0.50), suggesting microbial activity is influenced by these parameters. The number of ingredients also positively correlates with CFU/log (r = 0.57) and pH (r = 0.57), indicating that more complex formulations may impact microbial stability. Moisture content is negatively correlated with pH (r = −0.35) and CFU/log (r = −0.28), suggesting that drier products may exhibit lower microbial counts and different pH characteristics. The acid value of extracted fat showed weak correlations with other variables, except for moisture (r = 0.14). In addition, the positive and negative correlations obtained from PCA were further confirmed by Spearman’s correlation method. In addition, Spearman’s test shows a strong negative relationship of acid value of extracted fat with years (p = −0.56, r = −0.18), indicating improved oil stability over time, likely due to enhanced filtration practices and reduced re-use of frying oil post-certification.

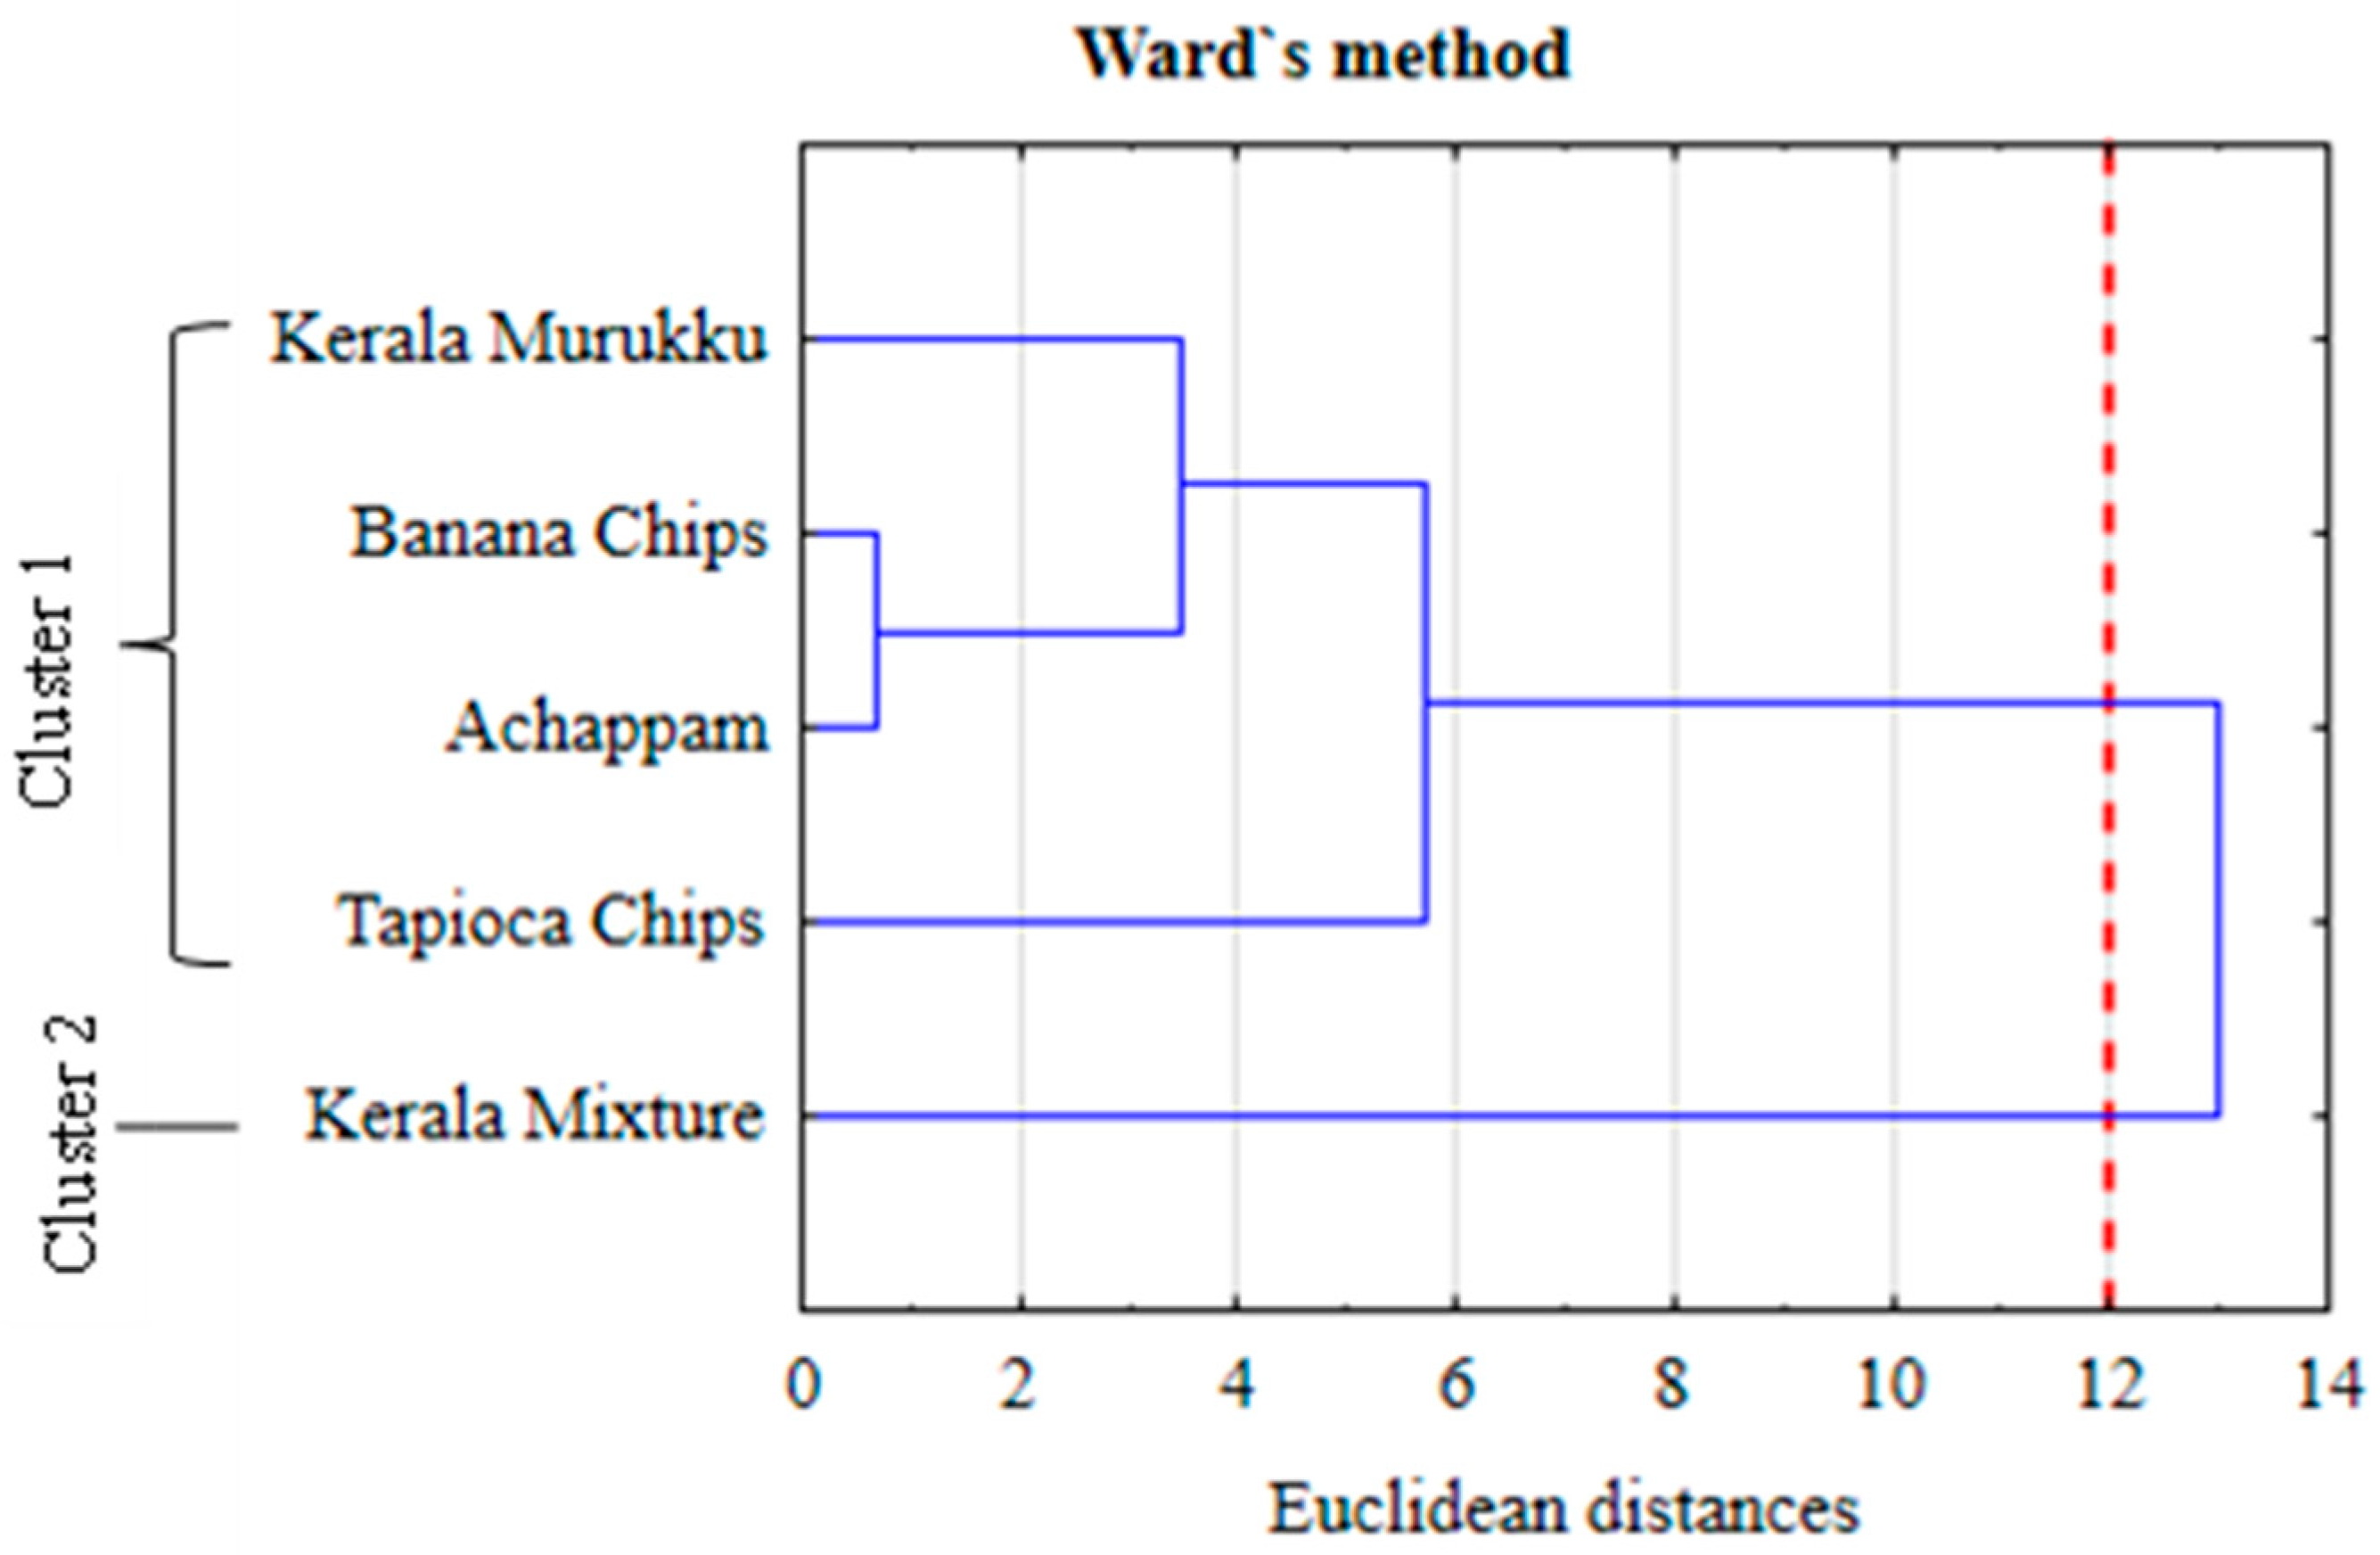
3.4. Clustering of Products Based on Microbial Quality

Multivariate cluster analysis was conducted to classify the products based on their microbial quality over the study period. Products grouped with high microbial count were indicated as areas needing improvement. Two clusters were identified according to the similarities in microbial quality (CFU/log) (Figure 4). Cluster 1 included four products (Kerala Murukku, Banana chips, Achappam, and Tapioca chips), indicating a consistently low microbial count in these years and highlighting effective food safety measures. Cluster 2 included one product (Kerala Mixture), indicating a higher microbial count than the other products. Kerala mixture shows a comparatively higher microbial count (CFU/log: 4.61 ± 0.01 in 2020, 3.70 ± 0.00 in 2023) compared to other products. However, although microbial counts fluctuated slightly over the years, they remained within acceptable safety limits for all products.

4. Discussion

This study was carried out to assess the physicochemical properties and microbiological quality trends in traditional fried snack products manufactured in an ISO 22000:2018-certified company. A fundamental aspect of food safety management is regulating the product composition to maintain microbial stability and shelf life. In food processing, variations in parameters such as moisture content, acid value, pH, and salt content can indicate shifts in manufacturing consistency, ingredient control, and storage conditions [2,8]. The physicochemical parameters of five traditional Indian fried snacks show variations due to differences in ingredient composition, manual processing, thermal behavior during frying, and shape of the product [47].
The moisture level in fried snacks is crucial in determining the shelf life of snack products [2,38]. Year-wise fluctuations in moisture content were statistically significant in Kerala Murukku, Kerala Mixture, and Banana Chips. Despite these fluctuations, all recorded moisture values remained below the 2% threshold commonly associated with microbial spoilage in low-moisture products. Excess moisture in salty snack products can occasionally lead to localized areas of high-water activity, which can enable mold development; however, such occurrences are uncommon and not typically expected in properly processed and packaged products [35]. These fluctuations can be due to variations in slice thickness, frying duration, and ambient cooling. This variability can be attributed to differences in mass and heat transfer properties during frying. The final oil uptake and moisture content are crucial quality parameters for fried products, ensuring a balance between water evaporation and diffusion [48]. Salt has several functions within the human body, as well as in influencing and balancing the qualities of food [49]. Salt content showed significant variations across all products, with pronounced differences observed in Kerala Mixture, Kerala Murukku, and Banana Chips. These changes may be attributed to unstandardized mixing and variation in component surface area. Increased surface area from finer particle sizes promotes salt and spice absorption, especially in dry spice coatings [48]. The salt content observed in this study remained below the reported range for Indian packaged fried snacks (1.45–2.71%) as documented by Raj et al. (2015), indicating comparatively moderate sodium levels and potentially reduced dietary risk when consumed in typical amounts [49]. The estimated average daily salt intake in India stands at 8.0 g/day, which far exceeds the World Health Organization (WHO) recommended limit (<5.0 g of salt per day) [49,50,51]. Concerning this, the measured salt content in Kerala Mixture and Kerala Murukku might raise concerns if consumed regularly, as they could further elevate sodium intake in the targeted population. Auto-oxidation of lipids and fats produces free fatty acids, which break down into smaller molecules, causing food quality degradation. The acid value measures the amount of free fatty acids in fat [52]. Acid value, a marker of oil degradation, showed statistically significant reductions over time in Tapioca Chips, Kerala Mixture, and Banana Chips, suggesting improved oil handling or turnover practices [48]. For example, the consistently lower acid values in 2023 across several products suggest that routine monitoring or adjustments in oil reuse practices may have been implemented. Kerala Murukku and Achappam showed no statistically significant change; however, all values stayed below the value that is considered unfavorable to safety or sensory quality. pH plays a role in microbial growth control [42]. Statistically significant year-wise pH variation was observed in Kerala Murukku, Tapioca Chips, and Achappam, though the overall pH range remained above 5 across all products. pH, an effective indicator of food stability, has been associated with microbiological and chemical reactions that cause food deterioration [53]. The pH values of Banana chips were found similar to those stated by Assanvo et al. (2023), who reported that the pH values of their ripe and unripe plantain chips range from 5.16 to 6.04, respectively [42].
Microbial analysis can predict the safety and stability of products [8]. Food microbiological quality may be generally determined by TPC; a high TPC count could suggest that the items were not produced hygienically or kept properly. Studies have reported that foods with a TPC level of more than 106 CFU/g may pose a risk of food poisoning pathogens such as Salmonella, E. coli, and Staphylococci [26]. In this study, all products are manufactured following standard operating procedures, indicating that when products are produced under hygienic conditions, the risk of food safety hazards is minimized. The consistently acceptable range of microbial count and physicochemical properties observed throughout the study period may be attributed to the modified air packaging, which effectively reduced environmental contamination.
Most international guidelines recommend Mesophilic aerobic bacteria (MAB) analysis as an indicator of microbiological status in ready-to-eat (RTE) foods. In this regard, MAB counts exceeding 5 log cfu/g are considered a potential risk for the presence of pathogens [54]. The findings of this study align with these guidelines, reinforcing that the products analyzed meet internationally recognized microbiological safety standards. Based on the results obtained, it has been found that the microbiological safety of all the samples examined indicated low levels of TPC (<5 log CFU/g). The study found an average count of 4.61 log cfu/g in Kerala Mixture in 2020, which was the highest TPC count across all products, while in the subsequent year, the average TPC level remained below this value. These results suggest possible post-frying and process environment contamination, likely caused by stages in seasoning, mixing, cooling, and packaging processes. Previous study indicates that while low-moisture snacks are generally microbiologically stable, contamination hazards remain, especially after frying, due to the application of seasonings and handling during cooling and packaging [35]. Seasonings that are added after frying without a kill-step provide a risk of contamination and necessitate strict hygiene measures. As outlined in ISO 22000, risk reduction should incorporate hazard-based control methods, environmental monitoring, and sanitation verification [21]. A similar study on the traditional snack “Chanachur” reported unsatisfactory microbial quality in both branded and unbranded samples, attributing contamination to improper handling, unclean mixing machines, and poor personal hygiene among food handlers [55]. High microbial counts in ready-to-eat (RTE) snacks are usually associated with poor hygiene and storage conditions, especially in unregulated or street-vendor settings. For example, a study in Nigeria reported the presence of total aerobic bacteria, coliforms, and foodborne pathogens such as S. aureus and E. coli in snack products sold in unsanitary conditions [11]. Despite this, unseasoned finished fried products typically have aerobic plate counts of less than 100–1000 CFU/g. The results also found that the product Achappam has consistently had the lowest microbial count among all products.
The results obtained in this study are like to the data reported for Banana chips by Navarro et al. (2018), who evaluated the microbiological quality of plantain banana snacks in Venezuela, revealing a load of 5.78 × 10² CFU/g for aerobic mesophilic germs, indicating the product is safe for consumption without any harmful health effects [56]. The authors emphasize the importance of a sanitized production line and immediate packaging of products to minimize outdoor exposure and contamination. These findings reinforce the importance of maintaining strict post-processing controls, especially for the Kerala Mixture, which showed a higher TPC count across all years. If food products have been put out in areas where airborne contamination occurs for an extended time, recontamination by air should be taken into account. The settling velocity of microorganisms, their concentration in the air, the product’s exposure time, and the area within it all affect the entrance of microbial load to food through the air [54]. Food deterioration can occur due to factors like oil oxidation, carbohydrate-rich browning, and protein changes. Polymeric films with inert gas with effective barrier properties are crucial to prevent the fried snacks from oxygen and moisture damage. Metalized polyethylene terephthalate (PET)/low-density polyethylene terephthalate (LDPE) or PET/Aluminum laminates are effective packaging materials that maintain food’s microbial and physicochemical stability during storage [57]. In this study, all the products are packaged in metalized PET laminated packages to avoid oxidation, protect the product’s safety and quality, and prevent premature staling.
Furthermore, a study examined the microbiological quality of various popular dried foods and reported the potential for fungus (105–107 cfu/g) and bacteria (104–107 cfu/g) contamination of dried foods, highlighting the need for regular microbiological examination to safeguard public health and prevent food-borne illnesses [13]. Previous studies proved that successful implementations of food safety management systems (FSMS), such as ISO 22000:2018, can help to improve microbiological quality and operational control. For example, a case study of a chaga mushroom processor in Vietnam found that implementing FSMS resulted in lower coliform levels and improved supplier oversight [27]. Similarly, food manufacturers working under ISO 22000 achieved better microbiological results than those using less stringent systems such as Makanan Selamat Tanggungjawab Industri (MeSTI) [58]. While this study did not directly evaluate FSMS implementation, the facility involved was ISO 22000:2018 certified, and the observed year-to-year variation in product quality parameters emphasizes the importance of continuous and practical application of such systems, particularly in manual small-scale settings.
This study reveals that standardized processing measures are crucial for maintaining quality consistency across products, with variations in parameters and higher microbial load in Kerala Mixture likely due to manual small-scale operations. Even if the company has ISO 22000:2018 certification, this certification basically verifies that adequate system structures and documentation for food safety are in place. However, previous research has emphasized that FSMS effectiveness depends not only on certification status but on how well the system is implemented in daily practice [26,59]. The observed variation emphasizes the possibility that regular monitoring, verification, or corrective actions might not be carried out adequately or systematically. This indicates an ongoing gap between established procedures and their actual implementation, particularly in environments with limited resources. The study emphasizes the need for robust operator-level controls and standard operating procedures to maintain product quality uniformity. It calls for transparent, unannounced food safety inspections by regulatory bodies. Advanced imaging technologies, like high-speed computed tomography, have improved scientific understanding of how frying parameters affect oil absorption and moisture migration, even though they are not yet applicable at the small-scale enterprise level. This has indirectly helped to refine fundamental quality control techniques in conventional settings [60]. This study also suggests that fully automated systems are largely unaffordable for small enterprises due to high capital and skill requirements. Therefore, in addition to regulatory control, governmental support through schemes that fund modernization, equipment upgrades, and technical training (such as India’s Pradhan Mantri Formalisation of Micro Food Processing Enterprises Scheme (PM-FME) program) is essential [61,62].

Limitations and Future Perspective

This study contributes to the existing literature by assessing the microbiological and physicochemical quality of traditional South Indian fried snacks produced within an ISO 22000:2018-certified company. Rather than evaluating the direct impact of certification, the findings highlight how quality parameters evolved over time within a structured FSMS environment. Since this study focused on a single manufacturing firm, future research should examine multiple small- and medium-scale enterprises to enable a broader comparison of FSMS implementation and its effectiveness across different operational settings. Moreover, incorporating pathogen-specific testing alongside TPC evaluations could provide deeper insights into microbiological safety in fried snack products. Moreover, future studies could explore the impact of seasonal variations on product quality, as changes in raw material availability and environmental factors may affect the microbiological and physicochemical properties of fried snacks. Despite this, future studies should explore the feasibility of incorporating edible coatings as an additional protective barrier, particularly for moisture and acid value control. The safety and quality of deep-fried foods can be enhanced by edible coatings, particularly those derived from chitosan and cellulose. By sustaining moisture, these coatings improve texture without overdrying. Likewise, they reduce oil absorption, which lowers oil content and retains moisture stability [63,64].

5. Conclusions

This study provides valuable insights into the physicochemical and microbiological quality trends of traditional fried snacks in a small-scale Indian food manufacturing company operating under an ISO 22000:2018-certified Food Safety Management System (FSMS). Based on four years of data (2020–2023), the results demonstrate that physicochemical parameters have remained within ranges not associated with food safety risks, and total plate count (TPC) values for all products remained below the acceptable limit of 5.99 log CFU/g. Statistically significant year-wise differences were identified in most products, particularly in Kerala Mixture, which showed the most pronounced variation in microbial load and salt content. These results emphasize the importance of more frequent monitoring and tighter control of post-processing operations, including stages in seasoning, mixing, cooling, and packaging processes. Although pre-certification baseline data were unavailable, preventing a direct assessment of the impact of ISO 22000 implementation, the consistent product quality monitoring observed during the study reflects a structured approach aligned with ISO 22000 verification principles, particularly Clause 8.8, which emphasizes product monitoring and analysis of results. This study does not claim full verification of ISO 22000:2018 compliance. Rather, it demonstrates how regular analysis of key safety parameters can support the internal evaluations of FSMS performance. These findings can serve as a reference for other small-scale food enterprises aiming to strengthen FSMS implementation by targeting product-specific risks and optimizing monitoring schedules. Ultimately, the study affirms that adopting structured food safety practices enables small-scale manufacturers to maintain consistent product safety and quality, despite the variability inherent in traditional manual production processes.

Author Contributions

Conceptualization, J.T. and S.S.N.; investigation, data curation, visualization, writing—original draft, methodology, S.S.N.; formal analysis, A.K.M.-K. and A.V.; writing—review and editing, S.S.N., M.T. and W.K.; validation, writing—review and editing, supervision, J.T. and S.S.N. All authors have read and agreed to the published version of the manuscript.

Funding

This research was funded by the Project “Actions Towards Internationalization of the Doctoral School of the Warsaw University of Life Sciences—SGGW” under the STER NAWA scholarship, grant number BPI/STE/2021/1/00031/U/00001.

Institutional Review Board Statement

Not applicable.

Informed Consent Statement

Not applicable.

Data Availability Statement

The original contributions presented in this study are included in the article. Further inquiries can be directed to the corresponding author(s).

Acknowledgments

The authors express their thanks to the company Malayalam Exports for taking part in the evaluation.

Conflicts of Interest

The authors declare no conflicts of interest.

References

  1. Sharma, A.; Mishra, S.; Kumar, S.; Singh, A.; Singh, M.; Vishwakarma, N. Quality Evaluation of Instant Chakli Mix Snack: Quality Evaluation of Chakli. J. AgriSearch 2022, 9, 176–181. [Google Scholar] [CrossRef]
  2. Sivaranjani, S.; Singh, S.M.; Rao, P.S. Quality Attributes of Traditional Food from Blends of Rice Flour and Jaggery Syrup under Different Frying Conditions. J. Agric. Food Res. 2024, 16, 101074. [Google Scholar] [CrossRef]
  3. Ibadullah, W.Z.W.; Idris, A.A.; Shukri, R.; Mustapha, N.A.; Saari, N.; Abedin, N.H.Z. Stability of Fried Fish Crackers as Influenced by Packaging Material and Storage Temperatures. Curr. Res. Nutr. Food Sci. J. 2019, 7, 369–381. [Google Scholar] [CrossRef]
  4. Kumar, S.B.; Asha, M.R.; Prakash, M. Quality Mapping and Positioning of Sev—A Deep Fat Fried Snack. Int. J. Food Prop. 2015, 18, 2433–2441. [Google Scholar] [CrossRef]
  5. Saha, T.; Singh, M.K.; Rai, D.C.; Kumar, A. HR-MS-Based Bioactive Profiling of Green Banana Flour and Millets-Based Murukku Snack. Food Humanit. 2025, 4, 100511. [Google Scholar] [CrossRef]
  6. Renub Research India Snacks Market Analysis Forecast 2025–2033. Available online: https://www.renub.com/ (accessed on 13 May 2025).
  7. Verma, T.; Aggarwal, A.; Dey, P.; Chauhan, A.K.; Rashid, S.; Chen, K.-T.; Sharma, R. Medicinal and Therapeutic Properties of Garlic, Garlic Essential Oil, and Garlic-Based Snack Food: An Updated Review. Front. Nutr. 2023, 10, 1120377. [Google Scholar] [CrossRef]
  8. Nawaz, A.; Danish, A.; Ali, S.; Shahbaz, H.; Khalifa, I.; Ahmed, A.; Ahmad, S.; Ahmed, W. Evaluation and Storage Stability of Potato Chips Made from Different Varieties of Potatoes Cultivated in Pakistan. J. Food Process. Preserv. 2021, 45, e15437. [Google Scholar] [CrossRef]
  9. Kadariya, J.; Smith, T.C.; Thapaliya, D. Staphylococcus Aureus and Staphylococcal Food-Borne Disease: An Ongoing Challenge in Public Health. BioMed Res. Int. 2014, 2014, 827965. [Google Scholar] [CrossRef]
  10. Syne, S.-M.; Ramsubhag, A.; Adesiyun, A.A. Microbiological Hazard Analysis of Ready-to-Eat Meats Processed at a Food Plant in Trinidad, West Indies. Infect. Ecol. Epidemiol. 2013, 3, 20450. [Google Scholar] [CrossRef]
  11. Nnenna, O. Microbiological Quality Assessment of Ready-to-Eat Snacks. Asian J. Res. Biosci. 2022, 4, 60–70. [Google Scholar]
  12. James, C.; Dixon, R.; Talbot, L.; James, S.J.; Williams, N.; Onarinde, B.A. Assessing the Impact of Heat Treatment of Food on Antimicrobial Resistance Genes and Their Potential Uptake by Other Bacteria—A Critical Review. Antibiotics 2021, 10, 1440. [Google Scholar] [CrossRef] [PubMed]
  13. Ahmed, T.; Sharmin, A.; Dipu, M.R.; Islam, T. Microbiological Quality Analysis of Different Types of Popular Dried Food Items. Food Res. 2020, 4, 1297–1302. [Google Scholar] [CrossRef] [PubMed]
  14. Almualla, N.A.; Laleye, L.C.; Abushelaibi, A.A.; Al-qassemi, R.A.; Wasesa, A.A.; Baboucarr, J. Aspects of the Microbiological Quality and Safety of Ready-to-Eat Foods in Sharjah Supermarkets in the United Arab Emirates. J. Food Prot. 2010, 73, 1328–1331. [Google Scholar] [CrossRef] [PubMed]
  15. Solomon, O.; Braide, W. A Study of Microbial Safety of Ready-to-Eat Foods Vended on Highways: Onitsha-Owerri, South East Nigeria. Int. Res. J. Microbiol. 2012, 3, 66–71. [Google Scholar]
  16. Bhalla, T.C.; Monika; Sheetal; Savitri. International Laws and Food-Borne Illness. In Food Safety and Human Health; Academic Press: Cambridge, MA, USA, 2019; pp. 319–371. [Google Scholar] [CrossRef]
  17. Ministry of Health & Family Welfare Government of India Integrated Disease Surveillance Programme (IDSP). Available online: https://idsp.mohfw.gov.in/index.php (accessed on 12 May 2025).
  18. Bisht, A.; Kamble, M.P.; Choudhary, P.; Chaturvedi, K.; Kohli, G.; Juneja, V.K.; Sehgal, S.; Taneja, N.K. A Surveillance of Food Borne Disease Outbreaks in India: 2009–2018. Food Control 2021, 121, 107630. [Google Scholar] [CrossRef]
  19. CDAlert. Food-Borne Diseases and Food Safety in India; Technical Bulletin for NCDC: New Delhi, India, 2017. [Google Scholar]
  20. Albert, V.; Ramamurthy, T.; Das, S.; Dolma, K.G.; Majumdar, T.; Baruah, P.J.; Chaliha Hazarika, S.; Apum, B.; Das, M. Comprehending the Risk of Foodborne and Waterborne Disease Outbreaks: Current Situation and Control Measures with Special Reference to the Indian Scenario. Heliyon 2024, 10, e36344. [Google Scholar] [CrossRef]
  21. ISO 22000:2018; Food Safety Management Systems—Requirements for Any Organization in the Food Chain. ISO: Geneva, Switzerland, 2018.
  22. ISO 22000:2018; Food Safety Management. International Organization for Standardization: Geneva, Switzerland, 2018. Available online: https://www.iso.org/publication/PUB100430.html (accessed on 26 June 2025).
  23. ISO 9001:2015; Quality Management Systems—Requirements. ISO: Geneva, Switzerland, 2015.
  24. FAO; WHO. General Principles of Food Hygiene; Codex Alimentarius Code of Practice, No.CXC 1-1969; Codex Alimentarius Commission: Rome, Italy, 2023. [Google Scholar]
  25. Awuchi, C.G. HACCP, Quality, and Food Safety Management in Food and Agricultural Systems. Cogent Food Agric. 2023, 9, 2176280. [Google Scholar] [CrossRef]
  26. Fathurrahman, R.N.; Rukayadi, Y.; Ungku Fatimah, U.Z.A.; Jinap, S.; Abdul-Mutalib, N.A.; Sanny, M. The Performance of Food Safety Management System in Relation to the Microbiological Safety of Salmon Nigiri Sushi: A Multiple Case Study in a Japanese Chain Restaurant. Food Control 2021, 127, 108111. [Google Scholar] [CrossRef]
  27. Chen, H.; Liou, B.; Hsu, K.; Chen, C.; Chuang, P. Implementation of Food Safety Management Systems That Meets ISO 22000:2018 and HACCP: A Case Study of Capsule Biotechnology Products of Chaga Mushroom. J. Food Sci. 2021, 86, 40–54. [Google Scholar] [CrossRef]
  28. Elizabeth, I.; Suyatma, N.; Yuliana, N.; Ranasasmita, R.; Syaifullah, S. Integration of ISO 22000 (2018) and HAS 23000 through Management System Audit: Case Study in Corned Beef Producer. Indones. J. Halal Res. 2021, 3, 43–55. [Google Scholar] [CrossRef]
  29. Rihawi, B. The Impact of ISO 22000: 2018 on Food Facilities Performance with Multiple Production Lines. CyTA—J. Food 2024, 22, 2431281. [Google Scholar] [CrossRef]
  30. Sasikumar Nair, S.; Mazurek-Kusiak, A.K.; Trafialek, J.; Kolanowski, W. Assessing Food Safety Compliance in a Small-Scale Indian Food Manufacturer: Before and after Certification of the Food Safety Management System and Foreign Supplier Verification Program. Appl. Sci. 2023, 13, 12190. [Google Scholar] [CrossRef]
  31. Markets and Data India Ethnic Snacks Market Assessment, Opportunities and Forecast, FY2017-FY2031F. Available online: https://www.marketsandata.com/industry-reports/india-ethnic-snacks-market (accessed on 9 January 2025).
  32. Saurabh, S.; Jyoti, J. Studies on Development, Quality Evaluation and Packaging Materials on the Storage Stability of Snack Food (SEV). Int. J. Agric. Food Sci. Technol. 2013, 4, 515–522. [Google Scholar]
  33. IS 12711:1989; Bakery Products—Methods of Analysis. Bureau of Indian Standards: New Delhi, India, 1989.
  34. Jonnalagadda, P.R.; Bhat, R.V.; Sudershan, R.V.; Nadamuni Naidu, A. Suitability of Chemical Parameters in Setting Quality Standards for Deep-Fried Snacks. Food Qual. Prefer. 2001, 12, 223–228. [Google Scholar] [CrossRef]
  35. Kuehm, J.; Casas, D. Salty Snack Foods. In The Microbiological Safety of Low Water Activity Foods and Spices; Gurtler, J.B., Doyle, M.P., Kornacki, J.L., Eds.; Springer: New York, NY, USA, 2014; pp. 295–314. ISBN 978-1-4939-2061-7. [Google Scholar]
  36. Ahmad, S.; Ashraf, K.; Khan, I. Quality and Shelf Life of Snack Food as Influenced by Incorporation of High Protein Pulses in Multipurpose Flour. J. Food Sci. Nutr. FSN 2017, 3, 19–24. [Google Scholar] [CrossRef]
  37. Halagarda, M.; Suwała, G. The Quality of Salted Potato Chips Available on the Polish Market. Krakow Rev. Econ. Manag. KREM 2017, 8, 71–86. [Google Scholar] [CrossRef]
  38. Adelagun, R.O.A.; Berezi, E.P.; Fagbemi, J.O.; Igbaro, O.J.; Aihkoje, F.E.; Ngana, O.; Osondu, G.; Garba, M.S. Evaluation of Level of Rancidity of Edible Oil in Some Fried Snacks Food. J. Chem. Soc. Nigeria 2023, 48, 154–161. [Google Scholar] [CrossRef]
  39. Zhang, X.; Li, Y.; Sun, J.; Kan, H.; Wang, Z.; Xiang, P. A Preliminary Study on the Quality of Street Vended Foods around a University in Kunming, China. Food Sci. Nutr. 2020, 8, 6670–6679. [Google Scholar] [CrossRef]
  40. Maturin, L.; Peeler, J.T. BAM Chapter 3: Aerobic Plate Count. In Bacteriological Analytical Manual (BAM); FDA: Silver Spring, MD, USA, 2001. [Google Scholar]
  41. Food Safety and Standards Authority of India (FSSAI). Food Safety and Standards (Food Products Standards and Food Additives) Regulations; FSSAI: New Delhi, India, 2011. [Google Scholar]
  42. Assanvo, J.; Niamke, A.; Koffi, K.; Dago, K.; Kouadio, A. Evaluation of the Health Quality of Plantain Banana Chips Sold in Cocody (Abidjan, Cote d’Ivoire): Case of Coliforms and Aerobic Mesophilic Germs. Int. J. Adv. Res. 2023, 11, 502–516. [Google Scholar] [CrossRef]
  43. NSW Food Authority. Microbiological Quality Guide for Ready-to-Eat Foods: A Guide to Interpreting Microbiological Results; NSW/FA/CP028/0906; NSW Food Authority: Sydney, Australia, 2009. [Google Scholar]
  44. Szymczak, B.; Szymczak, M.; Trafiałek, J. Prevalence of Listeria Species and L. Monocytogenes in Ready-to-Eat Foods in the West Pomeranian Region of Poland: Correlations between the Contamination Level, Serogroups, Ingredients, and Producers. Food Microbiol. 2020, 91, 103532. [Google Scholar] [CrossRef]
  45. Wiatrowski, M.; Czarniecka-Skubina, E.; Trafiałek, J. Consumer Eating Behavior and Opinions about the Food Safety of Street Food in Poland. Nutrients 2021, 13, 594. [Google Scholar] [CrossRef] [PubMed]
  46. Joshee, K.; Abhang, T.; Kulkarni, R. Fatty Acid Profiling of 75 Indian Snack Samples Highlights Overall Low Trans Fatty Acid Content with High Polyunsaturated Fatty Acid Content in Some Samples. PLoS ONE 2019, 14, e0225798. [Google Scholar] [CrossRef] [PubMed]
  47. Debnath, S.; Bhat, K.; Rastogi, N. Effect of Pre-Drying on Kinetics of Moisture Loss and Oil Uptake during Deep Fat Frying of Chickpea Flour-Based Snack Food. LWT—Food Sci. Technol. 2003, 36, 91–98. [Google Scholar] [CrossRef]
  48. Basak, S.; Chakraborty, S.; Singhal, R.S. Revisiting Indian Traditional Foods-A Critical Review of the Engineering Properties and Process Operations. Food Control 2023, 143, 109286. [Google Scholar] [CrossRef]
  49. Raj, M.C.V.; Sandeep, P.G.; Bhavya, S.N.; Prakash, J. Salt Consumption Behavior among Selected Subjects and Salt Content of Common Processed Snack Foods. Indian J. Nutr. Diet. 2015, 52, 442–451. [Google Scholar]
  50. Radhika, G.; Sathya, R.M.; Sudha, V.; Ganesan, A.; Mohan, V. Dietary Salt Intake and Hypertension in an Urban South Indian Population—[CURES—53]. J. Assoc. Physicians India 2007, 55, 405–411. [Google Scholar]
  51. Perappadan, B.S. Indians Continue to Consume More Salt than WHO Recommendation. The Hindu, 27 September 2023. [Google Scholar]
  52. Garg, A.; Sharma, R.; Dey, P.; Kumar, A. Chapter 1.3—Food Auto-Oxidation: An Overview. In Antioxidants Effects in Health; Nabavi, S.M., Silva, A.S., Eds.; Elsevier: Amsterdam, The Netherlands, 2022; pp. 43–68. ISBN 978-0-12-819096-8. [Google Scholar]
  53. Hwang, K.E.; Choi, Y.-S.; Choi, S.-M.; Kim, H.-W.; Choi, J.-H.; Lee, M.-A.; Kim, C.-J. Antioxidant Action of Ganghwayakssuk (Artemisia princeps Pamp.) in Combination with Ascorbic Acid to Increase the Shelf Life in Raw and Deep Fried Chicken Nuggets. Meat Sci. 2013, 95, 593–602. [Google Scholar] [CrossRef]
  54. Rodriguez, M.; Valero, A.; Carrasco, E.; Pérez-Rodríguez, F.; Posada, G.D.; Zurera, G. Hygienic Conditions and Microbiological Status of Chilled Ready-to-Eat Products Served in Southern Spanish Hospitals. Food Control 2011, 22, 874–882. [Google Scholar] [CrossRef]
  55. Mahal, Z.; Pramanik, K. Determination of Microbiological Status of Chanachur, a Traditional Spicy Ready-to-Eat Snack and Its Quality Improvement by Gamma Radiation. Res. Rev. Biosci. 2014, 8, 262–268. [Google Scholar]
  56. Navarro, B.; Peña, L.; Villamizar, B.; Cayama, Y.; Carrero, P.; Vergel, C.; González, C.; Morón, M.; Uzcátegui, D.; Chirinos, R.; et al. Microbiological Quality of Plantain Snacks (Musa AAB CV. HORN) made in the South Zone of Maracaibo Lake, Venezuela. Acta Bioclínica 2018, 8, 147–161. [Google Scholar]
  57. Bellary, A.N.; Indiramma, A.R.; Prakash, M.; Sowbhagya, H.B.; Rastogi, N.K. Effect of Storage Conditions and Packaging Materials on Quality Parameters of Curcuminoids Impregnated Coconut and Raw Banana Slices: Metallized PET/LDPE as Suitable Packaging Material. J. Food Process. Preserv. 2017, 41, e12936. [Google Scholar] [CrossRef]
  58. Yen, C.; Merican, S.; Rashid, N.; Bakar, A.; Omar, S.; Sanny, M. Assessing the Performance of Food Safety Management System Using Food Safety Management System Diagnostic Tools and Microbial Assessment Scheme: A Case of Powdered Beverage Manufacturers. Malays. J. Med. Sci. 2021, 28, 129–142. [Google Scholar] [CrossRef] [PubMed]
  59. Nyarugwe, S.P.; Linnemann, A.; Nyanga, L.K.; Fogliano, V.; Luning, P.A. Food Safety Culture Assessment Using a Comprehensive Mixed-Methods Approach: A Comparative Study in Dairy Processing Organisations in an Emerging Economy. Food Control 2018, 84, 186–196. [Google Scholar] [CrossRef]
  60. Verma, U.; Riley, I.M.; Lukić, B.; Broche, L.; Verboven, P.; Delcour, J.A.; Nicolaï, B.M. High-Speed Computed Tomography to Visualise the 3D Microstructural Dynamics of Oil Uptake in Deep-Fried Foods. Nat. Commun. 2025, 16, 2600. [Google Scholar] [CrossRef]
  61. The Times of India. Delhi Expands Incubation Infra to Boost Micro Food Enterprises, Startup Ecosystem. The Times of India, 17 May 2025. [Google Scholar]
  62. National Portal of India. PM Formalisation of Micro Food Processing Enterprises (PMFME) Scheme| National Portal of India. Available online: https://www.india.gov.in/pm-formalisation-micro-food-processing-enterprises-pmfme-scheme (accessed on 23 May 2025).
  63. Nair, S.S.; Trafiałek, J.; Kolanowski, W. Edible Packaging: A Technological Update for the Sustainable Future of the Food Industry. Appl. Sci. 2023, 13, 8234. [Google Scholar] [CrossRef]
  64. Wang, Z.; Ng, K.; Warner, R.D.; Stockmann, R.; Fang, Z. Application of Cellulose- and Chitosan-Based Edible Coatings for Quality and Safety of Deep-Fried Foods. Compr. Rev. Food Sci. Food Saf. 2023, 22, 1418–1437. [Google Scholar] [CrossRef]
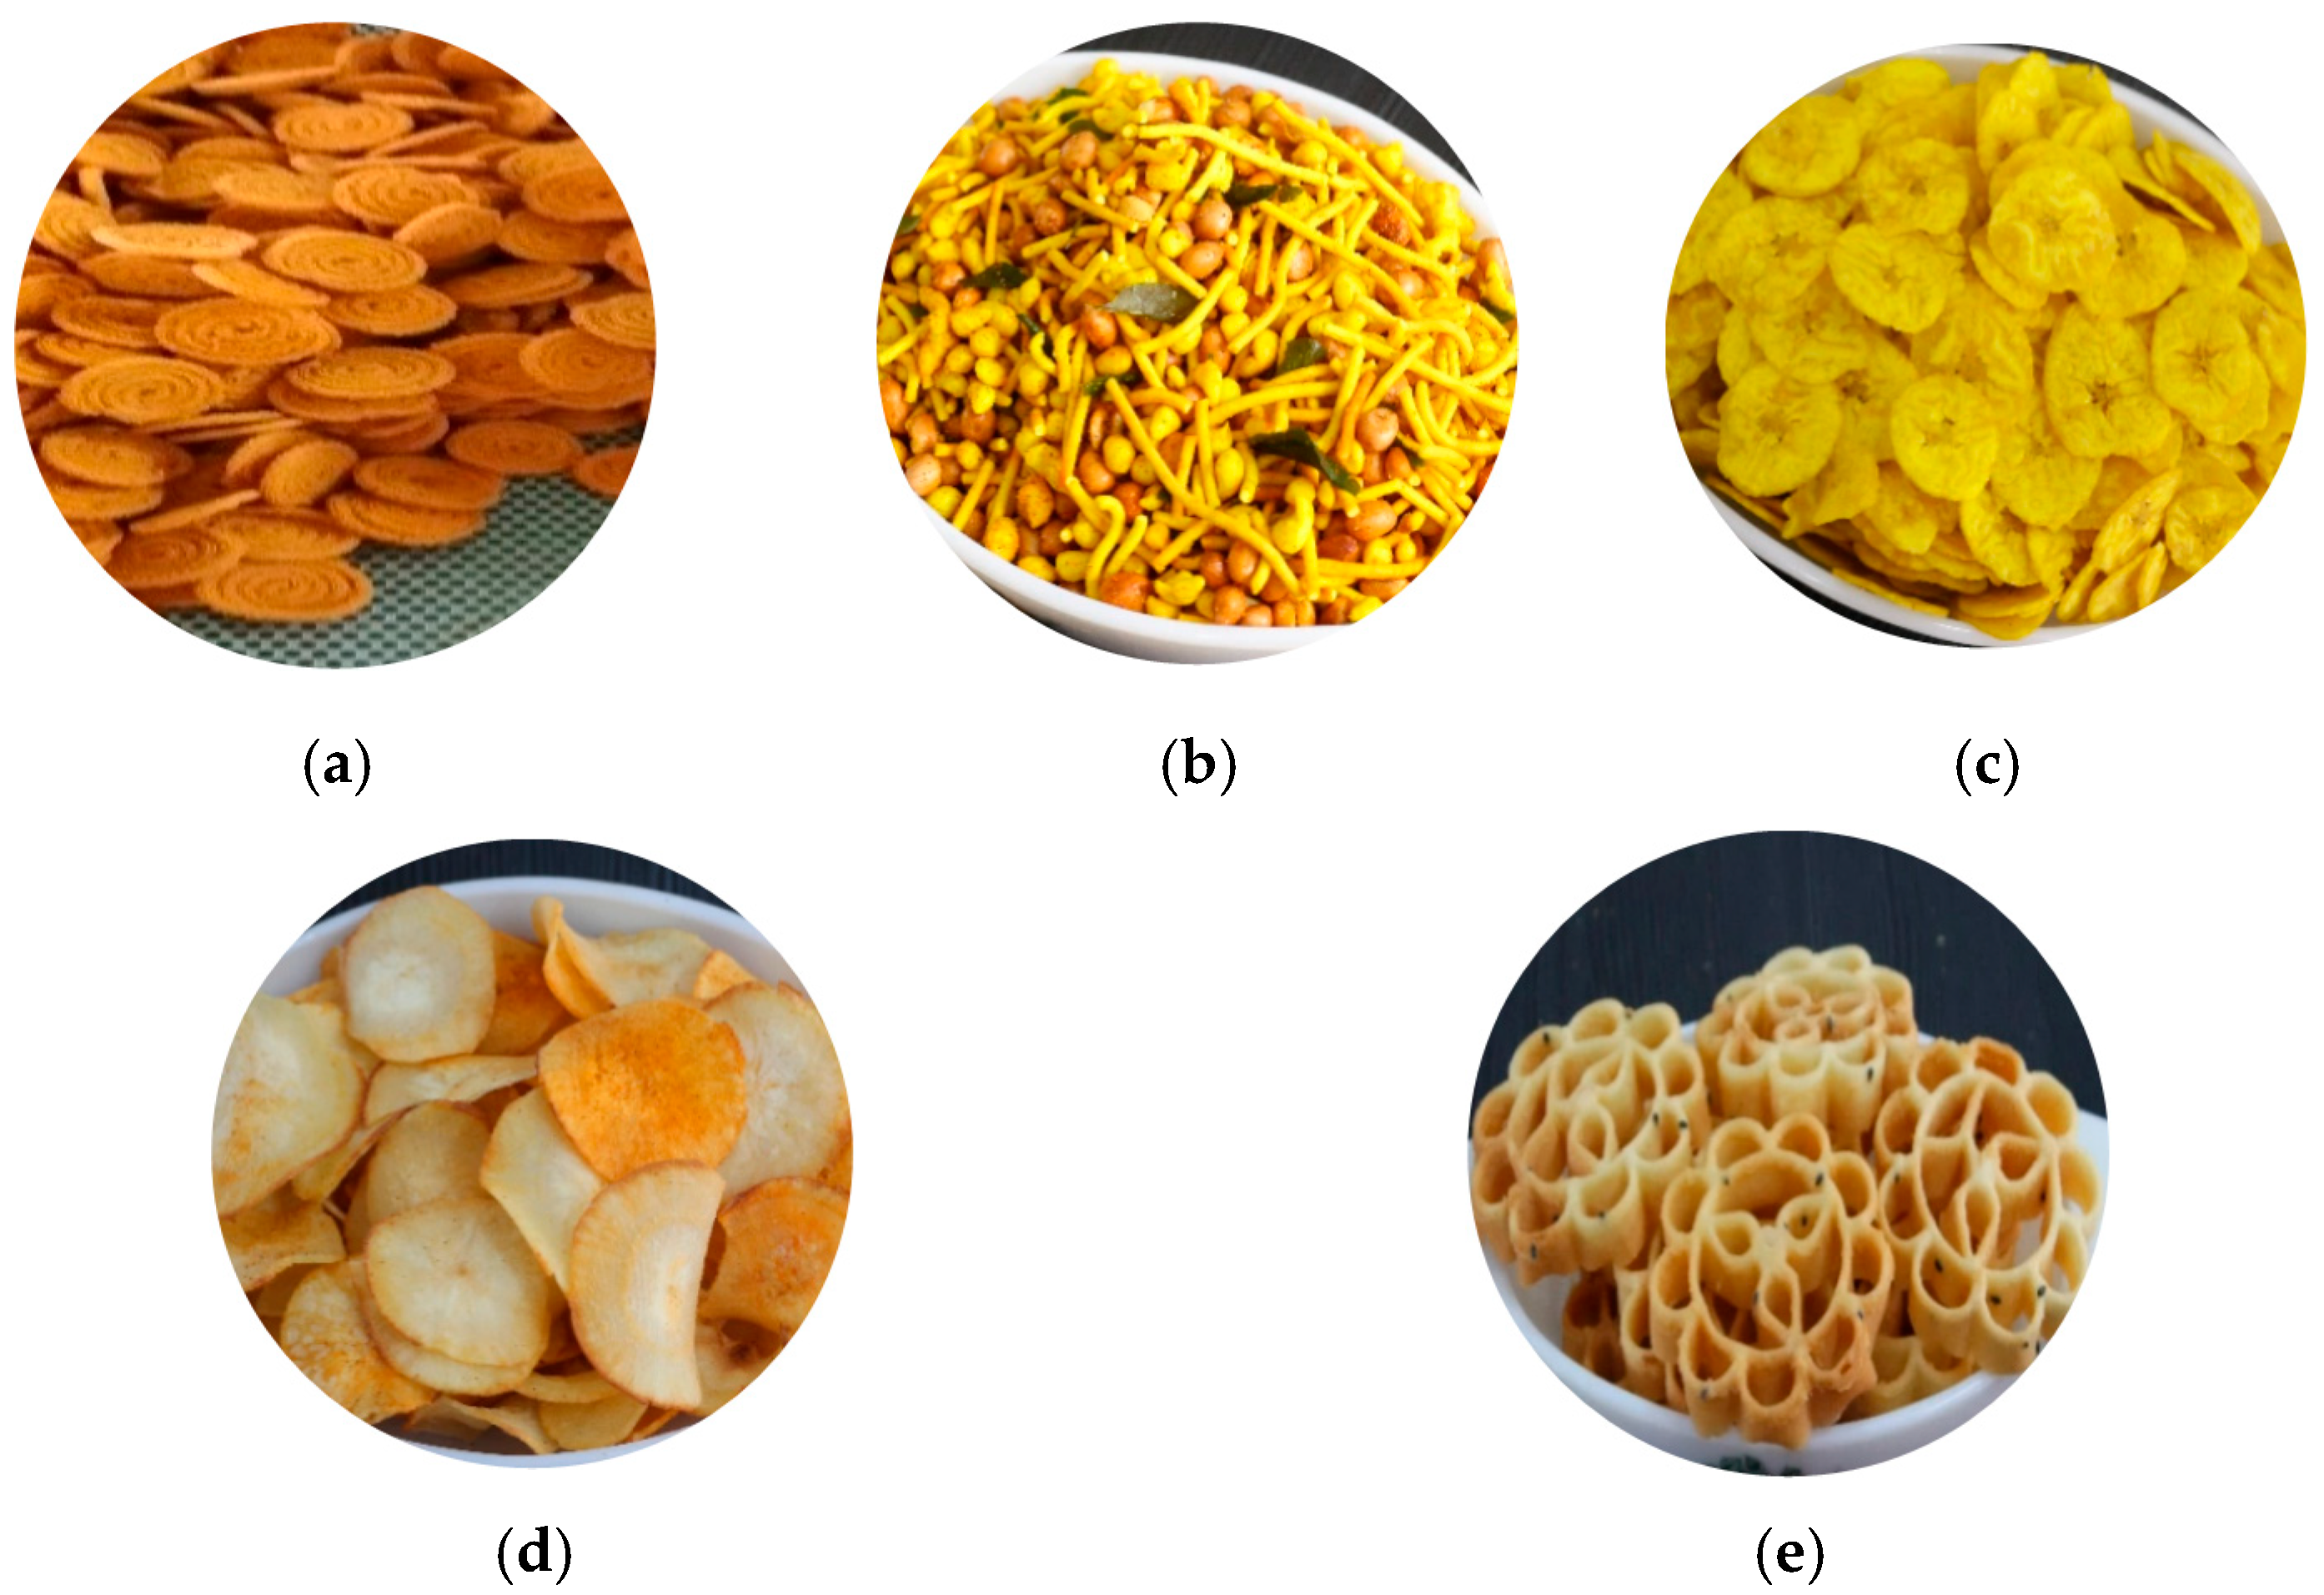
Figure 1. Images of the products used for this study: (a) Kerala Murukku, (b) Kerala Mixture, (c) Banana Chips, (d) Tapioca Chips, and (e) Achappam.
Applsci 15 07404 g001
Figure 2. Total Plate Count (log CFU/g) in five traditional Indian fried snack products from 2020 to 2023. Bars indicate mean values ± standard deviation. The x-axis groups products by year. Superscript letters denote statistically significant differences between years within each product (p < 0.05). Means sharing the same letter are not significantly different. Superscripts are only shown for products with significant ANOVA results.
Applsci 15 07404 g002
Figure 3. The principal component analysis biplot for correlations among physicochemical and microbiological parameters, ingredient count, and sampling years across all products.
Applsci 15 07404 g003
Figure 4. Dendrogram illustrating the hierarchical clustering of the five fried snack products based on their mean Total Plate Count (log CFU/g) values from 2020 to 2023, using Ward’s method with Euclidean distances. The red dotted line represents the cut-off point (Euclidean distance ≈ 12) used to determine the clusters.
Applsci 15 07404 g004
Table 1. Ingredients of sample products.
SamplesIngredients
Kerala MurukkuRice Flour, Refined Palmolein Oil, Black Gram flour (Urud Dal), Chili Powder, Salt, Small Onion, Garlic, Sesame Seeds, Fennel seeds, Ajwain
Kerala MixtureBesan (Chickpea) Flour, Peanuts, Refined Palmolein Oil, Pea Flour, Rice Flour, Salt, Chili Powder, Curry Leaves, Turmeric, Garam Masala (Spices), Asafoetida
Banana chipsPlantain, Refined Palmolein Oil, Turmeric, Salt
Tapioca chipsTapioca, Refined Palmolein Oil, Chili Powder, Salt
AchappamRice Flour, Sugar, Refined Palmolein Oil, Eggs, Corn flour, Sesame Seeds
Table 2. Physicochemical parameters of the five products from 2020 to 2023.
VariableYearMean ± Standard Deviation
Kerala MurukkuKerala MixtureBanana ChipsTapioca ChipsAchappam
Moisture%20202.37 ± 0.01 a0.83 ± 0.01 a1.48 ± 0.01 b1.64 ± 0.01 a1.68 ± 0.01 a
20212.37 ± 0.06 a0.55 ± 0.01 a2.93 ± 0.01 a1.63 ± 0.01 a1.37 ± 0.02 a
20222.57 ± 0.25 a1.52± 0.53 b1.30 ± 0.60 b2.20 ± 0.45 a1.96 ± 1.18 a
20231.97 ± 0.01 b0.97 ± 0.03 ab0.79 ± 0.33 b1.62 ± 0.55 a0.78 ± 0.30 a
Acid value20200.32 ± 0.01 a0.30 ± 0.01 ab0.38 ± 0.01 a0.49 ± 0.01 a0.28 ± 0.01 a
20210.33 ± 0.01 a0.49 ± 0.17 a0.30 ± 0.06 ab0.50 ± 0.01 a0.81 ± 0.46 a
20220.97 ± 1.03 a0.15 ± 0.05 b0.20 ± 0.05 b0.29 ± 0.02 b0.28 ± 0.06 a
20230.17 ± 0.01 a0.25 ± 0.04 b0.23 ± 0.01 b0.28 ± 0.01 b0.25 ± 0.08 a
pH20205.96 ± 0.00 a6.35 ± 0.01 a5.53 ± 0.01 a6.23 ± 0.01 a5.82 ± 0.01 a
20216.02 ± 0.01 b6.37 ± 0.00 a5.84 ± 0.01 a5.97 ± 0.00 a5.97 ± 0.00 a
20226.02 ± 0.02 b6.34 ± 0.16 a6.02 ± 0.38 a5.96 ± 0.14 a6.25 ± 0.09 b
20236.14 ± 0.02 c6.43 ± 0.05 a5.77 ± 0.08 a6.19 ± 0.15 a6.15 ± 0.07 b
Salt20200.33 ± 0.06 a1.09 ± 0.01 a0.42 ± 0.01 a0.36 ± 0.01 a0.18 ± 0.01 ab
20210.73 ± 0.59 ab1.10 ± 0.01 a0.52 ± 0.14 a0.48 ± 0.18 ab0.19 ± 0.03 b
20221.33 ± 0.06 b1.19 ± 0.10 ab0.96 ± 0.14 b0.87 ± 0.16 b0.10 ± 0.00 a
20231.37 ± 0.12 b1.26 ± 0.04 b0.96 ± 0.14 b0.88 ± 0.19 b0.17 ± 0.06 ab
Different superscript letters within each column indicate statistically significant differences between years for that product (p < 0.05), based on Tukey’s HSD test. Values sharing the same superscript letters are not statistically significant.
Disclaimer/Publisher’s Note: The statements, opinions and data contained in all publications are solely those of the individual author(s) and contributor(s) and not of MDPI and/or the editor(s). MDPI and/or the editor(s) disclaim responsibility for any injury to people or property resulting from any ideas, methods, instructions or products referred to in the content.

