Abstract
User Identity Linkage (UIL) has emerged as a focal point of research in the field of network analysis and plays a critical role in the governance of cyberspace; related technologies can also be extended for applications in traffic safety and traffic management. The traditional random walk-based UIL method has achieved a balance between performance and interpretability, but it still faces several challenges, such as low discriminability of nodes, instability of feature extraction, and missing features in matching scenarios. To address these challenges, this paper presents Adap-UIL, a multi-feature UIL framework based on an Adaptive Graph Walk. First, we design and implement an Adaptive Graph Walk method based on the Restarted Affinity Coefficient (RAC), which enhances both the neighborhood and higher-order features of nodes, and then we integrate cross-network features to form Adap-UIL with a more enriched node representation, facilitating user identity linkage. Experimental results on real datasets show that the Adap-UIL model outperforms the benchmark models, especially in the P@5 and P@10 metrics by 5 percentage points, and it captures key features more efficiently and effectively.
1. Introduction
According to the “53rd Statistical Report on the Development Status of the Internet in China” published by the China Internet Network Information Center (CNNIC) in March 2024 [1], the development of Internet applications is characterized by verticalization, diversification, and personalization. Behind the diversified Internet application platforms, there are highly overlapping users among different platforms, which allows researchers to go beyond the boundaries of a single platform and conduct in-depth analysis of social network users from more perspectives and dimensions. Furthermore, User Identity Linkage across social networks, that is linking users belonging to the same individual in different social networks, has attracted more and more attention in cross-network analysis in various fields, such as social networks, biological networks, and collaborative authorship networks [2]. Related technologies can also be extended for applications in traffic safety and traffic management.
The current mainstream research framework is a two-stage approach, that is, first characterizing user nodes in social networks and then further aligning them. In the user feature representation phase, the embedding-based method is one of the mainstream approaches, including graph neural network-based methods, geometry-based methods, and random walk-based methods [2]. Among these, random walk-based methods achieve a balance between performance and interpretability, and have received wide attention. In the embedding representation stage of the random walk-based method, the graph is first converted into a sequence of nodes by random walk, and the sequence of nodes is regarded as a sequence similar to text, and then text embedding methods (e.g., Word2Vec) are applied to learn node representations, representing the nodes as low-dimensional dense vectors containing semantic information for the subsequent alignment algorithm.
However, current approaches still encounter several limitations, such as low discriminability of nodes, instability of feature extraction, and missing features in matching scenarios. This paper is devoted to addressing these limitations. The main contributions of this paper are as follows:
Firstly, we propose a novel Adaptive Graph Walk based on the Restarted Affinity Coefficient (RAC) that constructs a weighted graph according to the RAC and then generates node sequences to capture the higher-order features more stably.
Seconly, we propose the Adap-UIL framework, which integrates the cross-network features by combining a cross-network walk with an Adaptive Graph Walk to enrich the node features.
At last, experiments on two real datasets are conducted to validate the performance of Adap-UIL, and the results show significant improvement over baselines. Moreover, Adap-UIL achieves higher precision more efficiently.
2. Related Works
User Identity Linkage, also known as User Alignment, which is the linking of user identities belonging to the same individual in different social networks, is a hot research topic in the field of social networking. It was first introduced by Zafarani [3] in 2009, and has evolved significantly over the past decade. A recent comprehensive survey by Saxena and Chandra [2] systematically categorizes existing methods into two core modules: representation generation and alignment learning. This framework highlights the progression of the field from early heuristic approaches to sophisticated machine learning-based solutions.
Representation generation methods mainly include traditional methods, optimal transmission-based methods, and embedding-based methods.
Traditional methods formulate network alignment as a graph-matching problem, which considers one network as a noisy permutation of the other. These methods directly compute the alignment matrix. IsoRank [4] only applies the structural consistency constraint. BigAlign [5] only leverages attribute consistency. In contrast, REGAL [6] and FINAL [7] incorporate both structural and attribute consistency, employing low-rank matrix approximation to speed up calculations.
Optimal transmission-based methods work at the distribution level rather than capturing the neighborhoods of the individual nodes. These methods aim to align graphs by minimizing the cost of transporting one distribution to another. Existing works represent graphs as continuous [8] (e.g., multivariate Gaussian with graph Laplacian covariance) or discrete distributions [9,10] (node-set uniform or statistical feature distributions), minimizing Wasserstein-like discrepancies (e.g., Kullback–Leibler divergence in [10]) for distribution matching. Recent advances integrate position-aware information with Gromov–Wasserstein discrepancy minimization to improve alignment precision, such as FGW [11], using random walk-based cost tensors for hierarchical cluster-node alignment, and PARROT [12], employing random walk regularization on product graphs. Semi-supervised approaches like [13] further optimize the Sinkhorn distance with adaptive entropy regularization, while Galopa [14] innovatively merges optimal transport with graph neural networks for self-supervised learning.
Embedding-based methods include three main types, namely, graph neural network-based methods, geometric-based methods, and random walk-based methods. Graph neural network-based methods can excel in Network Alignment (NA) by integrating structural/attribute information but face challenges in capturing higher-order relationships and oversmoothing. Methods like GraphletAlign [15] and SAlign [16] incorporate higher-order structures (graphlets/attention), while GAlign [17] and WAlign [18] concatenate multi-layer embeddings to mitigate oversmoothing. Hypergraph-based GCNs [19] and positional-aware models like NeXtAlign [20] further enrich representations. Geometric-based methods shift to the hyperbolic space rather than Euclidean space, leveraging its efficiency in modeling the hierarchical structures with fewer parameters. HUIL [21] uses the Lorentz model for hyperbolic embedding, while PERFECT [22] employs the Poincaré model to unify user-community embeddings but lacks attribute integration. HGENA [23] and HCNA [24] introduce Hyperbolic Graph Convolutional Networks (HGCNs) for attribute-aware embedding. GINA [25] learns dual Euclidean-hyperbolic representations, reconciles them via anchor links, and predicts alignments by merging intranetwork embeddings. Random walk-based methods have advanced significantly, yet they commonly suffer from undifferentiated node traversal. PALE [26] and Deeplink [27] rely on generic random walks that treat all neighborhood nodes equally, neglecting structural hierarchy. FRUI-P [28] and CENA [29] use walk-based context modeling, but CENA’s jumping probability applies uniformly across nodes rather than adapting to local features. While CEGA [30] enhances trainability, it lacks node-specific weighting. BRIGHT [31] and DSANE [32] introduce anchor nodes or deep architectures but still employ homogeneous sampling, failing to prioritize critical nodes (e.g., community hubs). e-UASN [33] and ERW [34] optimize walk efficiency but do not address indiscriminate node importance, assuming uniform relevance in walks. This limitation hinders representation quality in heterogeneous networks.
Embedding-based methods excel at automatically learning non-linear structural or semantic relationships via neural networks or geometric models. They enhance generalization to diverse networks through random walk strategies, fuse multi-modal data, and adapt dynamically to network changes. These advantages allow for the creation of rich, low-dimensional representations for user identity linkage, surpassing traditional and distance-based methods in complex scenarios. However, they still face the following challenges:
(1) Low discriminability of nodes. The undifferentiated wandering strategy of the node ignores the differences between nodes. In real social networks, there are significant differences in the importance of nodes and the strength of associations between nodes.
(2) Instability of feature extraction. Capturing of higher-order features by random walk results in instability. Although the higher-order features of nodes can be captured, when the number of walks is insufficient, the capture of higher-order features is highly contingent and easily deviates from the original features.
(3) Missing features in matching scenarios. In cross-network user alignment scenarios, cross-network user features are crucial for model construction, so the cross-network features of nodes need to be considered.
3. Definitions
In this section, we introduce the basic terminology related to this paper.
We consider a set of different social networks as , each of which is defined as a Social Network Graph (SNG).
Definition 1
(Social Network Graph). Let be a social network, where V represents the set of nodes, each node represents a user, is the set of edges representing the set of social relationships connecting users, and indicates the social relationship between nodes and . We represent each SNG with a unique latent user space by network embedding. This method learns the probabilistic distributions of nodes and uses low-dimensional vectors to represent them in a latent space.
Definition 2
(Network Embedding Mode [35]). Given network , network embedding aims to encode each node into a low-dimensional latent space with a mapping function , where d is the dimension of the latent space. It is synonymous with node embedding or node representation.
Definition 3
(User Identity Linkage [34]). Given two social networks and , the task of UIL is to find every pair of users and that belong to the same person. We utilize an alignment matrix:
where N and M denote the number of nodes and , respectively, and the matrix can be represented as follows:
4. Adaptive Graph Walk Based on Restarted Affinity Coefficients
4.1. Affinity Coefficients (ACs) Between Nodes
Given the adjacency matrix of the original graph is P, then the first-order transition probability of any two vertices can be expressed as:
where denotes the neighbors of node i and denotes the number of neighbors of node i. Then, the probability that node j is visited by source node i after k hops can be expressed as:
where is the k-order transition matrix of the graph, that is:
where is the first-order transition matrix, A is the adjacency matrix of the graph, D is the diagonal matrix, and the element on the diagonal is the degree magnitude of the node in the graph, that is:
where denotes the degree of node i.
To evaluate how the transition matrix evolves with increasing k, we compute its Frobenius norm. As illustrated in Figure 1, the matrix stabilizes completely when . We then monitor four randomly selected elements ; Figure 2 shows their convergence to stable values at .

Figure 1.
Convergency of transition matrix as k increases.
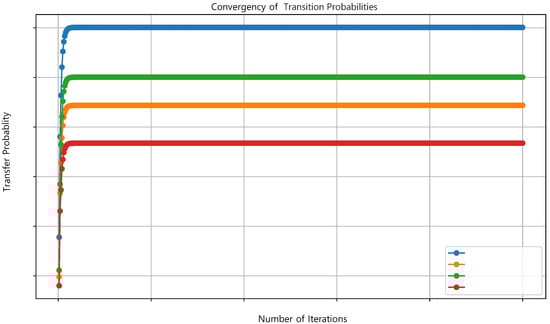
Figure 2.
Convergency of transition probabilities.
The stabilized probability can be viewed as the affinity coefficient between the source node i and other nodes, namely, the probability that any node j can be accessed from the source node i. Then, the affinity coefficient between any node j and the source node i can be expressed as:
where is the number of nodes in the graph. Taking all nodes in the graph as source nodes, respectively, and performing an unlimited number of random walks with transition probabilities between graph nodes, the affinity coefficient matrix M can be obtained as:
4.2. Restarted Affinity Coefficients
In order to better capture the local features of the nodes, this paper introduces the restart probability in Random Walk with Restart (RWR) and affinity coefficients to construct the RAC.
RWR has been widely used in graph data mining. In RWR, it walks along the edges from a given source node i; for each node visited, it will return to the source node with the probability to restart or visit its neighbors with the probability . is the restart probability or the restart coefficient for RWR. So, the probability that node j is visited by source node i by k steps is represented as:
where denotes the k-order transition probability; here, the number of transfers is and the steps are not restarted, which is why the power of is . For the case where a restart occurs at step x in , it is equivalent to the case where k is replaced with .
According to the affinity calculation formula, with the introduction of the restart coefficient, the RAC of any node j with source node i can be expressed as:
Taking all the nodes as sources nodes, performing an unlimited number of RWR, the restarted affinity coefficients matrix M can be obtained as:
It can be proved that for any node i in the graph as the source node, we set the sum of its restarted affinity coefficient scores with all other nodes to be 1, that is:
4.3. Adaptive Graph Walk Based on RAC
The original graph is converted to a weighted graph based on RAC with edge weights between any two nodes in the graph:
where is the RAC between node i and j, that is, the final probability after convergence.
The weighted graph walk based on RAC can be free from the constraints of the original neighbor matrix, but adaptively selects the next node according to the restart affinity coefficients, and each step statistically aggregates infinite-step transitions in the statistical sense, hence referred to as the Adaptive Graph Walk in this paper. The restart coefficient is able to adjust the strength of capturing neighborhood features during the walk process, and the Adaptive Graph Walk based on RAC can also capture higher-order features between nodes more directly. Figure 3 shows the differences among random walk, RWR, and Adaptive Walk, in which RWR strengthens the local features of node 1, while the Adaptive Graph Walk makes it possible to reach node 5 from node 1 even though they have no direct edge, such as node 5 and node 3. By making two otherwise distant nodes directly reachable with some probability, the Adaptive Graph Walk strengthens the higher-order features.
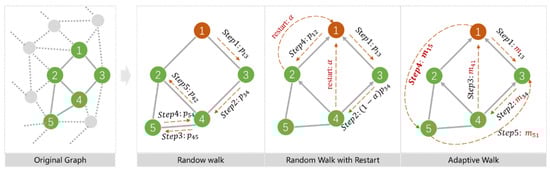
Figure 3.
Differences among the Adaptive Graph Walk and other approaches.
The Adaptive Graph Walk algorithm described in Algorithm 1 consists of three main steps:
- Compute the RAC matrix M using the adjacency matrix A and restart coefficient .
- Traverse the graph using M as the transition probability matrix, where each node serves as a starting point to generate 50-node sequences.
- Output the generated node sequences.
| Algorithm 1 Adaptive Graph Walk with Restart Coefficient |
| Require: 1: Graph 2: adjacency matrix A 3: restart coefficient 4: walk length nodes 5: number of walks Ensure: Node sequence set 6: Define affinity matrix M 7: Compute RAC matrix M from adjacency matrix A and ▹ Step 1 8: for each node do ▹ Step 2 9: for to N do 10: Initialize current node 11: Initialize walk sequence 12: for to do 13: Sample next node from transition probabilities in M at node u 14: Append to s 15: 16: end for 17: Add s to 18: end for 19: end for 20: Output ▹ Step 3 |
5. Adap-UIL: Multi-Feature-Aware User Identity Linkage Based on Adaptive Graph Walk
As shown in Figure 4, the UIL framework mainly consists of three parts: graph walk, fusion embedding, and matching. The graph walk includes the intranetwork Adaptive Graph Walk and the internetwork walk; the fusion embedding generates node vectors, respectively, and then concatenates them, and the matching process adopts a multi-layer perceptron (MLP).
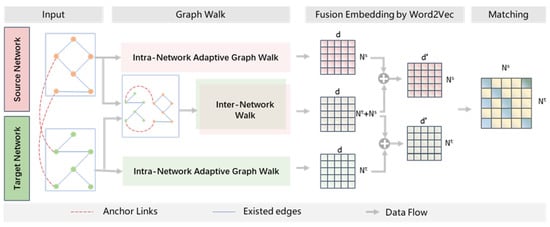
Figure 4.
Framework of Adap-UIL.
In the process of graph walk, the intranetwork walk adopts the Adaptive Graph Walk method based on the aforementioned RAC, following the transition probabilities of , and the internetwork walk adopts the cross-network walk.
The cross-network walk follows the following transition probabilities:
where denotes the neighbors of node i, and denotes the number of neighbors of node i; denotes the probability of node transfer across the networks.
is a known set of anchor node pairs , where is the set of anchor nodes, and are virtual edges between the anchor nodes from different networks.
The fusion embedding generates the intranetwork vector representation and the internetwork vector representation of each node using word2vec, respectively, and concatenates the two vectors to form the final vectors. The final representation of the node is:
In the process of embedding for each network and each walk process, respectively, the user sequences for the given network can be represented as:
Embedding maximizes the log probability by the following formula:
where N is the number of users of the network, and W is the size of the sliding window. In the formula, the conditional probability represents the probability of co-occurrence of user and its neighbor :
where N represents the number of users in the network. In this module, we define the probability of an edge between two nodes as
where represents the sigmoid function.
We use negative sampling to maximize the target function to improve the training effect.
where the first item is the existing edge modeling and the second item is the negative sampling. K is the number of negative edges sampled, and the sampling probability of each node is , where is the degree of the node.
In the training process, we use stochastic gradient descent to update the node representation.
After obtaining the network representation, we learn the mapping function F in a supervised manner. For each pair of observed anchor nodes , an MLP minimizes the cosine similarity between them. The loss function is computed by:
where the loss ranges from 0 to 2—0 for the same and 2 for exactly the opposite.
6. Experiments and Results
In order to evaluate the performance of our model on general UIL tasks, we conducted comparative experiments with more baseline methods on the Douban Online-Offline dataset and the Facebook-Twitter dataset. The experimental environment used in this paper is an Ubuntu 18.04.3 × 64 server with an Intel (R) Xeon (R) Silver 4214 CPU @ 2.20 GHz, with 48 cores and 125 G memory. The GPU is Nvidia’s RTX 2080Ti, with 4 pieces and 11 G memory size. The experimental code was Python, version 3.5.6; the deep learning framework used is Pytorch, version 1.3.0; the CUDA toolkit version is 10.1.243, the cuDNN version is 7.6.4, and networkx v1.11.
6.1. Datasets
In this paper, two realistic datasets that are widely used in user identity linking tasks are selected for the experiments, and information for the datasets is shown in Table 1.

Table 1.
Statistics of datasets.
- Douban Online-Offline: The data are published by COSNET [36]. First, a target network containing 1118 users is extracted from the offline network, and then a subnetwork containing these users is extracted from the online network as the source network, which has 3906 user nodes. There are 1118 anchor users between the two networks.
- Facebook-Twitter: The data are published by FINAL [7] and were collected from two completely different social networks, including 1792 Facebook users and 3493 Twitter users, including 1515 anchor users. Their subscription relationships in the two social networks were quite different.
6.2. Baseline and Settings
We selected several typical UIL models that are often used as comparative models as baselines.
PALE [26]: A classical embedding-based UIL model that includes the embedding process and mapping process just like ERW-UIL. It employs deepwalk in the embedding process, and employs MLP in the mapping process.
IONE [37]: A classical embedding-based model based on the follower–followee relationships between users. It is always taken as a baseline in UIL tasks.
Deeplink [27]: A typical UIL method based on Deepwalk using a different mapping architecture than PALE.
DSANE [32]: Our preliminary work that integrates depth walk and breadth walk for node representation; in this paper, the graph enhancement module is removed for easy comparison.
ERW-UIL [34]: Our preliminary work, generating node sequences by random walk and removing the edges walked at the same time. Similarly, we removed the graph enhancement module for better comparison.
6.3. Evaluation Metrics
In order to evaluate the performance of UIL, we choose , MAP, AUC, and Hit-Precision as our evaluation indicators, as most UIL tasks have used.
can be calculated as follows:
where indicates whether there is a correct match in the top-k list and n is the number of anchor nodes tested.
MAP, AUC, and Hit-Precision are used for evaluating the ranking performance of the algorithms, defined as:
where m is the number of negative user identities and is the rank of the positive matching identity.
6.4. Experimental Results and Analysis
In terms of parameter consistency, the , , and parameters are the same for all models. In the network embedding part, we use Hierarchical Softmax; we set = 10, as the transition matrix converges at about ; = 50, = 50 are set based on the comparison experiments among different and . For the mapping process, the activate function is RELU and the is 0.0001, and the is 32; these parameter settings are determined based on our previous experience, aiming to strike an optimal balance between training efficiency and model convergence.
Table 2 and Table 3 show the results on the Douban Online-Offline dataset and Facebook-Twitter dataset; the training set ratio is 0.8, the total dimension is 256, the restart probability is 0.4, and the cross-network walk probability is 0.5.
Table 2.
Experimental results on Douban Online-Offline.
Table 3.
Experimental results on Facebook and Twitter.
As shown in Table 2, the AUC and Hit Precision indicators are almost identical for all models, so they can be ignored for this comparison. Due to the imbalance of the data, the Accuracy values of all models are less than 0.5, while Adap-UIL and PALE are closest to 0.5, which is a quite significant advantage over several other models. In contrast, the advantage of Adap-UIL in the Precision@k metrics is more obvious: p@5, p@10, p@20, p@30 are on average 0.20, 0.16, 0.11, 0.09 higher than the other models, and p@5 and p@10 are about 5 percentage points higher than the best model in the baseline. We can conclude that it is able to more accurately detect positive samples with higher confidence, or that it captures the key features better and more quickly.
As k increases, p@30 also has a slight advantage over the best baseline results, indicating that it is able to maintain a better generalization performance at the same time.
Figure 5 demonstrates that the validation loss (about ) is substantially higher than the training loss (about ), highlighting a fundamental challenge in social network user identity linkage tasks. Although the model effectively captures strong matching signals (achieving 0.95 p@30), its ability to generalize to ambiguous cases is limited due to cross-platform data heterogeneity and sparse alignment supervision. Although the early stopping strategy () successfully prevents overfitting to source network biases, the inherent uncertainty arising from unseen network pairs in the validation set naturally leads to higher prediction variance.

Figure 5.
Changes in loss values per iteration or training epoch.
Table 3 shows the results on the Facebook-Twitter dataset. In terms of parameters, the training set ratio is 0.8, the dimension is 256, the restart ratio is 0.4, and the cross-network walk probability is 0.5. Based on the results of the previous experiments, the values of the metrics of AUC and Hit-Precision are removed in the current experiment, as they are of low discriminative power.
Table 3 shows that Adap-UIL has an average improvement of 10 percentage points over the baselines, and has advantages of several percentage points over the best baseline method. In particular, there is an increase of about 4 percentage points in p@20 and p@30.
Above all, the experiments on the two datasets showed that Adap-UIL has a better performance than the baselines, especially on the metrics .
6.5. Ablation Experiments
6.5.1. Validation of Restart Coefficient
In order to select the best restart coefficient , the validation experiments of the restart coefficients are carried out in this paper under different and different vector dimensions , respectively. The takes values in the range of , and takes values in the range of ; takes values in the range of .
For each parameter pair , the is set as different values and the model run for 10 times; the maximum value is recorded as and the average values as . We can obtain nine and nine . We count the number of times the maximum optimal result and the average optimal result are obtained for each .
For example, when the dimension is 64 and the is 0.1, each runs 10 times as a set of results, and will recode the and for it. For in , we will obtain nine and nine . Then, we will compare the nine and nine , respectively, for different restart coefficients. If an like 0.4 obtains the max of , it receives 1 point.
In a similar fashion, for kinds of combinations of dimensions with , , we run 90 experiments for all the nine restart coefficients, and obtain 96 best results for and . Since there are cases where some restart coefficients obtain the optimal value at the same time, the total score is 111. The statistical results are shown in Table 4; the of 0.4 obtains the highest score, so we set the as 0.4 for Adap-UIL.
Table 4.
Performance comparison among different alpha .
6.5.2. Validation of Cross-Network-Walk Ratio
Set the , and . The virtual edges across the network can provide more additional information for the nodes, but the model will heavily rely on the anchor node if the ratio is too high. So we set the highest value as , and we set in the range of . For each run, 10 experiments are conducted as a group, resulting in 5 groups of 50 experiments in total. For each group, we observe the 10 metrics shown in Table 5, and record the maximum and average values for each metric in the same group. Then, we compare the metrics, respectively, among different . If the ratio ranks first (including a tie), it will obtain 1 point, or if it ranks last. Each will obtain two scores based on the average value and the maximum value for each metric.
Table 5.
Performance comparison for the cross-network-walk ratio.
The experimental results are shown in Table 5. The results are worst when the ratio is 0.1; it fluctuates between 0.2, 0.3, and 0.4, and changes qualitatively at 0.5. Therefore, the is determined as 0.5 in this paper.
6.5.3. Performance Validation of Cross-Network Walk
In order to verify the importance of the cross-network walk in the model, we consider three different walk approaches while the other parts of the model remain unchanged. The comparison experiments are as follows:
- AM-UIL: a UIL model based on the Affinity Coefficient—the affinity coefficient is used as the probability of sequence generation, and the restart ratio is 0.
- RWR-UIL: a UIL model based on RWR. It does not use the affinity coefficient but instead uses the RWR for sequence generation. The , the , and the .
- ReAM-UIL: a UIL model based on RAC; the difference with Adap-UIL is that its is 0. The , the , and the .
- Adap-UIL: a UIL model based on the Adaptive Graph Walk. The , the , the , and the is 0.5.
From Table 6, it can be concluded that the cross-network walk has a certain effect on all the indicators. Compared with the optimal situation of the comparison model, the increase in Accuracy and MAP is the biggest at about 4 percent; compared with the average situation of the comparison model, the increase in and is the biggest at about 5 percent. Thus, the cross-network walk does improve the overall effectiveness of the model.
Table 6.
Experimental results on Douban Online-Offline.
7. Conclusions and Discussion
This paper presents Adap-UIL, an adaptive graph walk-based framework for multi-feature-aware user identity linkage. The key innovation lies in the development of an RAC-based adaptive graph walk method that simultaneously captures both local neighborhood characteristics and higher-order structural features of nodes. By effectively integrating cross-network features, we construct more comprehensive node representations that significantly enhance the performance of user identity linkage tasks. Extensive experiments conducted on real-world datasets demonstrate that Adap-UIL consistently outperforms existing baseline methods across multiple evaluation metrics.
However, several limitations warrant further investigation. First, we observe notable performance variations across different datasets, with particularly suboptimal results on the Facebook-Twitter dataset, indicating room for improvement in cross-platform generalization capability. Second, while the model demonstrates overall strong performance, the accuracy metrics across both datasets suggest potential for further optimization. Future research directions will focus on the following: (1) enhancing feature extraction algorithms to improve model generalization, (2) developing more effective negative sampling strategies to boost accuracy, and (3) investigating domain adaptation techniques to address performance discrepancies across different social platforms. These improvements will further strengthen the robustness and applicability of our framework in real-world scenarios.
Author Contributions
Conceptualization, X.X. and Y.L.; methodology, X.X. and H.G.; software, H.G.; validation, X.X. and H.G.; formal analysis, T.Z. and H.G.; investigation, H.G.; resources, Y.L.; data curation, X.X.; writing—original draft preparation, X.X.; writing—review and editing, Y.L. and T.Z.; visualization, X.X.; supervision, Y.L.; project administration, Y.L. and T.Z.; funding acquisition, T.Z. All authors have read and agreed to the published version of the manuscript.
Funding
This research was funded in part by the National Natural Science Foundation of China (NO.62272117) and the National Key Research and Development Program of China (NO. 2024YFB31NL00102).
Institutional Review Board Statement
Not applicable.
Informed Consent Statement
Not applicable.
Data Availability Statement
The code and data are available at https://github.com/Xiexiaqing/Adap-UIL (accessed on 25 April 2025).
Conflicts of Interest
The authors declare no conflicts of interest. The funder played a role in the formal analysis, writing—review and editing, and in project administration.
References
- CNNIC. 2024. 53rd Statistical Report on the Development Status of China’s Internet. Available online: https://www.cnnic.net.cn/n4/2024/0322/c88-10964.html (accessed on 25 April 2024).
- Saxena, S.; Chandra, J. A Survey on Network Alignment: Approaches, Applications and Future Directions. In Proceedings of the Thirty-Third International Joint Conference on Artificial Intelligence, Jeju, Republic of Korea, 3–9 August 2024; International Joint Conferences on Artificial Intelligence Organization: San Francisco, CA, USA, 2024; pp. 8216–8224. [Google Scholar]
- Zafarani, R.; Liu, H. Connecting Corresponding Identities across Communities. In Proceedings of the Third International Conference on Weblogs and Social Media, San Jose, CA, USA, 17–20 May 2009. [Google Scholar]
- Singh, R.; Xu, J.; Berger, B. Global Alignment of Multiple Protein Interaction Networks with Application to Functional Orthology Detection. Proc. Natl. Acad. Sci. USA 2008, 105, 12763–12768. [Google Scholar] [CrossRef] [PubMed]
- Koutra, D.; Tong, H.; Lubensky, D. Big-align: Fast Bipartite Graph Alignment. In Proceedings of the 2013 IEEE 13th International Conference on Data Mining, Dallas, TX, USA, 7–10 December 2013; pp. 389–398. [Google Scholar]
- Heimann, M.; Shen, H.; Safavi, T.; Koutra, D. Regal: Representation Learning-based Graph Alignment. In Proceedings of the 27th ACM International Conference on Information and Knowledge Management, Turin, Italy, 22–26 October 2018; pp. 117–126. [Google Scholar]
- Zhang, S.; Tong, H. Final: Fast Attributed Network Alignment. In Proceedings of the 22nd ACM SIGKDD International Conference on Knowledge Discovery and Data Mining, San Francisco, CA, USA, 13–17 August 2016; pp. 1345–1354. [Google Scholar]
- Maretic, H.P.; Gheche, M.E.; Chierchia, G.; Frossard, P. Got: An Optimal Transport Framework for Graph Comparison. In Advances in Neural Information Processing Systems; Curran Associates Inc.: Red Hook, NY, USA, 2019; Volume 32. [Google Scholar]
- Xu, H.; Luo, D.; Carin, L. Scalable Gromov-Wasserstein Learning for Graph Partitioning and Matching. In Advances in Neural Information Processing Systems; MIT Press: Cambridge, MA, USA, 2019; Volume 32. [Google Scholar]
- Li, C.; Wang, S.; Yu, P.S.; Zheng, L.; Zhang, X.; Li, Z.; Liang, Y. Distribution Distance Minimization for Unsupervised User Identity Linkage. In Proceedings of the 27th ACM International Conference on Information and Knowledge Management, Toronto, ON, Canada, 22–26 October 2018; pp. 447–456. [Google Scholar] [CrossRef]
- Zeng, K.; Dong, Z.; Hou, L.; Cao, Y.; Hu, M.; Yu, J.; Lv, X.; Li, J.; Feng, L. Interactive Contrastive Learning for Self-Supervised Entity Alignment. In Proceedings of the 31st ACM International Conference on Information & Knowledge Management, Baltimore, MD, USA, 7–11 November 2022; pp. 2465–2475. [Google Scholar]
- Zeng, Z.; Du, B.; Zhang, S.; Xia, Y.; Liu, Z.; Tong, H. Hierarchical Multi-Marginal Optimal Transport for Network Alignment. arXiv 2023, arXiv:2310.04470. [Google Scholar] [CrossRef]
- Xu, J.; Li, C.; Huang, F.; Li, Z.; Xie, X.; Yu, P.S. Sinkhorn Distance Minimization for Adaptive Semi-Supervised Social Network Alignment. IEEE Trans. Neural Netw. Learn. Syst. 2023, 34, 1–14. [Google Scholar] [CrossRef] [PubMed]
- Wang, Y.; Zhao, Y.; Wang, D.Z.; Li, L. Galopa: Graph Transport Learning with Optimal Plan Alignment. In Proceedings of the Thirty-seventh Conference on Neural Information Processing Systems, Virtual, 10–16 December 2023. [Google Scholar]
- Almulhim, A.; Dave, V.S.; Hasan, M.A. Network Alignment Using Graphlet Signature and High Order Proximity. In Machine Learning, Optimization, and Data Science; Nicosia, G., Ojha, V., Malfa, E.L., Malfa, G.L., Jansen, G., Pardalos, P.M., Giuffrida, G., Umeton, R., Eds.; Springer: Siena, Italy, 2019; Volume 11943, pp. 130–142. [Google Scholar]
- Saxena, S.; Chandra, J. SAlign: A Graph Neural Attention Framework for Aligning Structurally Heterogeneous Networks. J. Artif. Intell. Res. 2023, 77, 949–969. [Google Scholar] [CrossRef]
- Trung, H.T.; Vinh, T.V.; Tam, N.T.; Yin, H.; Weidlich, M.; Hung, N.Q.V. Adaptive Network Alignment with Unsupervised and Multi-Order Convolutional Networks. In Proceedings of the 2020 IEEE 36th International Conference on Data Engineering, Dallas, TX, USA, 20–24 April 2020; pp. 85–96. [Google Scholar]
- Gao, J.; Huang, X.; Li, J. Unsupervised Graph Alignment with Wasserstein Distance Discriminator. In Proceedings of the 27th ACM SIGKDD Conference on Knowledge Discovery and Data Mining, Singapore, 15–19 August 2021; pp. 426–435. [Google Scholar]
- Sun, X.; Yin, H.; Liu, B.; Chen, H.; Meng, Q.; Han, W.; Cao, J. Multi-Level Hyperedge Distillation for Social Linking Prediction on Sparsely Observed Networks. In Proceedings of the Web Conference 2021, Ljubljana, Slovenia, 19–23 April 2021; pp. 2934–2945. [Google Scholar]
- Zhang, S.; Tong, H.; Jin, L.; Xia, Y.; Guo, Y. Balancing Consistency and Disparity in Network Alignment. In Proceedings of the 27th ACM SIGKDD Conference on Knowledge Discovery and Data Mining, Singapore, 15–19 August 2021; pp. 2212–2222. [Google Scholar]
- Wang, F.; Sun, L.; Zhang, Z. Hyperbolic user identity linkage across social networks. In Proceedings of the GLOBECOM 2020-2020 IEEE Global Communications Conference, Taipei, Taiwan, 7–11 December 2020; pp. 1–6. [Google Scholar]
- Sun, L.; Zhang, Z.; Zhang, J.; Wang, F.; Du, Y.; Su, S.; Yu, P.S. PERFECT: A Hyperbolic Embedding for Joint User and Community Alignment. In Proceedings of the 2020 IEEE International Conference on Data Mining, Sorrento, Italy, 14–17 December 2020; pp. 501–510. [Google Scholar]
- Zhou, F.; Li, C.; Xu, X.; Liu, L.; Trajcevski, G. HGENA: A Hyperbolic Graph Embedding Approach for Network Alignment. In Proceedings of the 2021 IEEE Global Communications Conference, Madrid, Spain, 6–10 December 2021; pp. 1–6. [Google Scholar]
- Saxena, S.; Chakraborty, R.; Chandra, J. HCNA: Hyperbolic Contrastive Learning Framework for Self-Supervised Network Alignment. Inf. Process. Manag. 2022, 59, 103021. [Google Scholar] [CrossRef]
- Wang, Y.; Wang, W.; Zhen, Z.; Peng, Q.; Jiao, P.; Liang, W.; Shao, M.; Sun, Y. Geometry Interaction Network Alignment. Neurocomputing 2022, 501, 618–628. [Google Scholar] [CrossRef]
- Man, T.; Shen, H.; Liu, S.; Jin, X.; Cheng, X. Predict Anchor Links Across Social Networks via an Embedding Approach. In Proceedings of the Twenty-Fifth International Joint Conference on Artificial Intelligence, New York, NY, USA, 7–15 July 2016; pp. 1823–1829. [Google Scholar]
- Zhou, F.; Liu, L.; Zhang, K.; Trajcevski, G.; Wu, J.; Zhong, T. DeepLink: A Deep Learning Approach for User Identity Linkage. In Proceedings of the IEEE INFOCOM 2018—IEEE Conference on Computer Communications, Honolulu, HI, USA, 16–19 April 2018; pp. 1313–1321. [Google Scholar] [CrossRef]
- Zhou, X.; Liang, X.; Du, X.; Zhao, J. Structure Based User Identification Across Social Networks. IEEE Trans. Knowl. Data Eng. 2018, 30, 1178–1191. [Google Scholar] [CrossRef]
- Du, X.; Yan, J.; Zha, H. Joint Link Prediction and Network Alignment via Cross-Graph Embedding. In Proceedings of the 28th International Joint Conference on Artificial Intelligence (IJCAI), Macao, China, 10–16 August 2019; pp. 1230–1236. [Google Scholar]
- Tang, W.; Sun, H.; Wang, J.; Qi, Q.; Chen, H.; Chen, L. Cross-Graph Embedding with Trainable Proximity for Graph Alignment. IEEE Trans. Knowl. Data Eng. 2023, 35, 12556–12570. [Google Scholar] [CrossRef]
- Yan, Y.; Zhang, S.; Tong, H. BRIGHT: A Bridging Algorithm for Network Alignment. In Proceedings of the Web Conference 2021, Ljubljana, Slovenia, 19–23 April 2021; pp. 3907–3917. [Google Scholar] [CrossRef]
- Xiong, Z.; Xie, X.; Wu, X.; Peng, Y.; Lu, Y. DSANE: A Dual Structure-Aware Network Embedding Approach for User Identity Linkage. In Proceedings of the 2023 IEEE 8th International Conference on Big Data Analytics, Hong Kong, China, 3–5 March 2023; pp. 193–198. [Google Scholar]
- Zhen, Y.; Hu, R.; Li, D.; Xiao, Y. User Alignment Across Social Networks Based on Ego-Network Embedding. In Proceedings of the 2022 International Joint Conference on Neural Networks, Padua, Italy, 18–23 July 2022; pp. 1–7. [Google Scholar]
- Xie, X.; Zang, W.; Hu, Y.; Ji, J.; Xiong, Z. Novel Method of Edge-Removing Walk for Graph Representation in User Identity Linkage. Electronics 2024, 13, 715. [Google Scholar] [CrossRef]
- Zhang, D.; Yin, J.; Zhu, X.; Zhang, C. Network embedding: Taxonomies, frameworks and applications. Comput. Sci. Rev. 2020, 38, 100303. [Google Scholar] [CrossRef]
- Zhang, Y.; Tang, J.; Yang, Z.; Pei, J.; Yu, P.S. COSNET: Connecting Heterogeneous Social Networks with Local and Global Consistency. In Proceedings of the 21th ACM SIGKDD International Conference on Knowledge Discovery and Data Mining, Sydney, Australia, 10–13 August 2015; pp. 1485–1494. [Google Scholar] [CrossRef]
- Liu, L.; Cheung, W.K.; Li, X.; Yin, Z. Aligning Users across Social Networks Using Network Embedding. In Proceedings of the 25th International Joint Conference on Artificial Intelligence (IJCAI-16), New York, NY, USA, 9–15 July 2016; pp. 3065–3071. [Google Scholar]
Disclaimer/Publisher’s Note: The statements, opinions and data contained in all publications are solely those of the individual author(s) and contributor(s) and not of MDPI and/or the editor(s). MDPI and/or the editor(s) disclaim responsibility for any injury to people or property resulting from any ideas, methods, instructions or products referred to in the content. |
© 2025 by the authors. Licensee MDPI, Basel, Switzerland. This article is an open access article distributed under the terms and conditions of the Creative Commons Attribution (CC BY) license (https://creativecommons.org/licenses/by/4.0/).