Abstract
Seismic waveform feature extraction is a critical task in seismic exploration, as it directly impacts reservoir prediction and geological interpretation. However, large-scale seismic data and nonlinear relationships between seismic signals and reservoir properties are challenging for traditional machine learning methods. To address these limitations, this paper proposes a novel framework combining Convolutional Neural Network (CNN) and Uniform Manifold Approximation and Projection (UMAP) for seismic waveform feature extraction and analysis. The UMAP-CNN framework leverages the strengths of manifold learning and deep learning, enabling multi-scale feature extraction and dimensionality reduction while preserving both local and global data structures. The evaluation experiments, which considered runtime, receiver operating characteristic (ROC) curves, embedding distribution maps, and other quantitative assessments, illustrated that the UMAP-CNN outperformed t-distributed stochastic neighbor embedding (t-SNE), locally linear embedding (LLE) and isometric feature mapping (Isomap). A case study in the Ordos Basin further demonstrated that UMAP-CNN offers a high degree of accuracy in predicting coal seam thickness. Furthermore, our framework exhibited superior computational efficiency and robustness in handling large-scale datasets.
1. Introduction
The primary objective of seismic exploration is to delineate subsurface geological structures and characterize reservoir distributions to support energy resource development [1]. The seismic data is acquired through high-resolution three-dimensional seismic survey utilizing artificial sources to send seismic energy into the earth. This energy reflects off subsurface geological layers and is subsequently recorded by a dense, areal grid of surface receivers. The collected reflection data is then processed to build a 3D digital model of the subsurface geology. As a critical seismic attribute, waveform data encapsulates extensive information about subsurface structures, reservoirs, and hydrocarbon content. Among various analytical methods, waveform shape clustering has become a widely adopted technique for interpreting oil and gas content through seismic attribute analysis [2]. Unlocking the rich reservoir-related information embedded within seismic waveforms can significantly enhance reservoir prediction, improve the accuracy of reservoir characterization, and increase drilling success rates [3,4]. Traditionally, seismic attribute analysis has relied heavily on linear dimensionality reduction methods, such as Principal Component Analysis (PCA) and Independent Component Analysis (ICA) [5]. However, due to the inherently complex and nonlinear relationship between seismic signals and reservoir properties, these linear approaches often fail to accurately capture the geometric structure of high-dimensional data [6]. As a result, features derived from such reductions typically lack the capacity to retain the latent information within the original waveform data and cannot effectively simulate the seismic response of pore fluids [7,8,9]. With advancements in seismic exploration technology, there is a pressing need for new approaches capable of extracting abstract seismic attributes, analyzing waveform variation patterns, elucidating the implications of different waveform signatures, and ultimately achieving more accurate geological body identification.
In recent years, manifold learning—an essential subfield of nonlinear dimensionality reduction—has shown considerable promise in revealing the intrinsic structure of data with heterogeneous distributions and in suppressing noise by projecting high-dimensional seismic data into a lower-dimensional space [10,11]. This methodology offers fresh opportunities for seismic waveform feature extraction and optimization. In seismic exploration, earlier studies adopted algorithms such as Local Linear Embedding (LLE) and t-Distributed Stochastic Neighbor Embedding (t-SNE) [12,13]. While these approaches surpass Principal Component Analysis (PCA) in many aspects, manifold learning techniques inevitably experience information loss during the projection process [14]. Even the more recent nonlinear dimensionality reduction method Uniform Manifold Approximation and Projection (UMAP) is constrained by shallow feature representations and a limited generalization capacity [15]. This limitation causes it to struggle in capturing the deeper information embedded in seismic waveforms, ultimately rendering it less effective for interpretation tasks in geologically complex regions.
The extraction of high-quality features is a critical component in clustering seismic waveform data [16]. Deep learning has attracted considerable attention in seismic waveform classification for its hierarchical capacity to learn and represent complex, meaningful features [17,18]. Compared to traditional methods, deep learning approaches are capable of extracting more advanced and robust representations [19]. A variety of deep learning architectures have been successfully applied to seismic waveform classification by simulating human cognitive processes to interpret data and uncover latent attributes [20,21]. Among these, the Convolutional Neural Network (CNN) has been applied widely due to its high efficiency in minimizing the operating parameters and enhancing the speed of operation. Numerous studies have shown that CNN outperforms conventional techniques in both suppressing noise and detecting weak signals [22,23,24]. However, CNN still faces persistent challenges in seismic layer tracking, including data scarcity, overfitting, excessive model complexity, and inadequate lateral resolution in layer identification [25,26,27].
Recognizing the complementary strengths of manifold learning and CNN, this study introduces, for the first time, a UMAP-CNN-coupled framework for seismic waveform feature extraction, aiming to solve the high dimensionality problem and enhance classification accuracy in seismic facies analysis. By combining UMAP with CNN, multi-scale deep features are directly extracted from seismic data and mapped to low-dimensional space to achieve waveform feature space compression and information fusion, avoiding the deviation in artificial attribute design.
2. Methods
2.1. UMAP
Uniform Manifold Approximation and Projection (UMAP) is a recently developed dimensionality reduction technique [28,29]. As a manifold learning method, UMAP is designed to preserve both the global and local structures of high-dimensional data during projection to a lower-dimensional space. This includes maintaining the topological relationships and inter-point distances inherent in the original data. UMAP has been successfully applied across a diverse range of data types, including gene expression profiles, image datasets, and textual information, often yielding visually compelling and interpretable low-dimensional representations.
UMAP is founded on three key assumptions: (1) the data are uniformly distributed on a Riemannian manifold, (2) the Riemannian metric is locally constant, and (3) the manifold is locally connected. Based on these assumptions, given a high-dimensional seismic datasets with input vectors and , we can achieve low-dimensional output vectors through the UMAP algorithm, where , , and . The specific realization of UMAP can be decomposed into the following steps:
(1) Construct probability distributions in high-dimensional spaces. UMAP finds the embedded manifold by identifying the fuzzy topological structure of a low-dimensional projection. To construct this structure, UMAP represents data points as a weighted high-dimensional graph, where edge weights indicate the likelihood of connections between points. UMAP uses an exponential probability distribution function to compute the similarity between high-dimensional data points:
where is the distance between the data points and , is the distance between and its first nearest neighbor, is a scaling factor that depends on the density of the data.
When the weight between the data points and in the graph differs from the weight between and , UMAP applies a symmetrization process to the high-dimensional probabilities. After UMAP aggregates points with locally varying metrics, the weight from node A to B may not be equal to the weight from B to A. Therefore, joint probability is used to ensure symmetry.
In addition, UMAP uses the number of nearest neighbors instead of perplexity. The number of nearest neighbors is defined as the nearest data points around a given data point, which determines how many adjacent nodes each data point has in the KNN graph:
(2) Construct probability distributions in low-dimensional spaces. Design a probability function to compute the relationship between low-dimensional data points. Note that is the embedding corresponding to . In the embedding space, the probability that a point has the point as its neighbor can be computed by the similarity of these points:
where and for default UMAP.
(3) Construct a cost function to make the relationship between high-dimensional sample points as similar as possible to the relationship between low-dimensional sample points. Binary cross entropy (CE) is used as the cost function in the UMAP with the goal of minimizing the distance between high-dimensional and low-dimensional space [30]. The formula is as follows:
Compared to other manifold learning methods, UMAP offers superior dimensionality reduction performance in less time, while preserving more accurate local structures and effectively representing global structures. However, the algorithm still faces high computational and memory demands. In practical applications, UMAP is implemented in a matrix-based form, which makes it challenging to manage large datasets due to memory limitations. Furthermore, its performance on sequence data is constrained by issues related to classification accuracy and stability, stemming from the large volume of data, background noise, and high computational cost [21].
2.2. UMAP-CNN Framework Architecture
The architecture of the UMAP-CNN is shown in Figure 1. The encoder consists of two components: the convolutional part for feature extraction and the embedding part, which maps the high-dimensional seismic waveform space into a low-dimensional space while preserving the intrinsic structure of the data. To be able to access the latent representation, all types of encoders were implemented in two parts: from to , and from to . Arranging the two parts in series produced the full encoder:
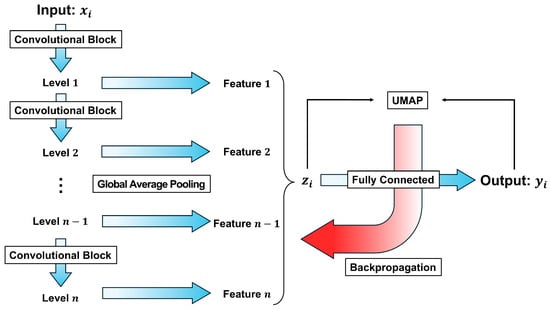
Figure 1.
Illustration of the UMAP-CNN encoder architecture.
On the far left, the first part features a structure that creates multiple levels, each with a different field of view of the seismic data. A series of convolutional block layers progressively extract features from data , capturing its characteristics. These levels are processed by further average pooling and a flattening layer to generate a set of values, which together form the latent representation of , and then form the high-dimensional representation.
The second part was implemented as a cost function analysis between the high-dimensional and low-dimensional representation based on the principles of UMAP. A series of fully connected networks were used to map to . The red arrow denotes the backpropagation mechanism, which updates the trainable parameters of all layers.
3. Experiment
3.1. Study Area
The study area is located in the eastern part of the Ordos Basin, in the southwestern region of Shenmu City, as shown in Figure 2A. During the late Early Ordovician period, the Caledonian orogeny caused the overall uplift of the Ordos Basin, exposing the land surface to prolonged weathering and erosion. In the Late Carboniferous Benxi period, the Ordos Basin began to subside gradually, with seawater transgressing from east to west, leading to sediment deposition [31,32]. The Benxi Formation consists of three stratigraphic members, arranged from bottom to top: the Hutian, Pangou, and Jinci Members (Figure 2B) [33]. The Hutian Member corresponds to the lowstand systems tract (LST) and comprises ferruginous–aluminous rocks and black mudstone. The Pangou Member is equivalent to the transgressive systems tract (TST) and is characterized by dark-gray mudstone, Pangou sandstone, limestone, sandstone, and minor coal seams. The Jinci Member, corresponding to the highstand systems tract (HST), contains a thick basal sandstone unit, followed by dark-gray mudstone and shale with thin coal seams, with the stable No. 8 coal seam at the top marking the boundary between the Taiyuan and Benxi Formations.
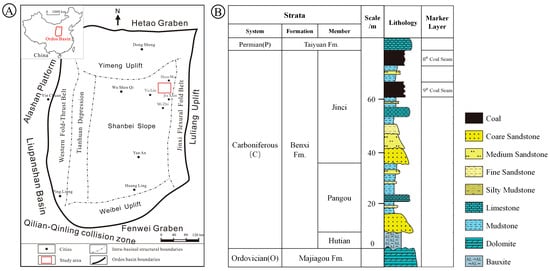
Figure 2.
Geological background of the study area: (A) a map showing the location of the study area; (B) a stratigraphic column of the study area.
In the eastern part of the basin, the Taiyuan Formation developed in delta plain, delta front, and shallow marine subtidal environments. The lithological assemblages associated with these different sedimentary environments, along with the coal seams of the Benxi Formation, form distinct reservoir–seal combinations, such as coal–sandstone, coal–mudstone, and coal–gray mudstone combinations. Their spatial distribution is controlled by the coal lithology of the Benxi Formation and the sedimentary environments of the Taiyuan Formation [34].
Figure 3 presents the seismic profile of the study area, showing that hor11 marks the top boundary of the Taiyuan Formation, while hor19 represents the zero-crossing point of the 0-phase seismic reflection of the No. 8 coal seam in the Benxi Formation. This can be roughly considered the central position of the No. 8 coal seam in the vertical direction. Regionally, the target layer is the No. 8 coal seam in the Shenmu area, with a burial depth exceeding 2200 m. The coal seam thickness ranges from 8 to 12 m, with an average of 9 m, and it gradually thins from northeast to southwest [35]. The coal seam has significant thickness and stable distribution. The dominant seismic data frequency is approximately 40 Hz. The deep burial and low resolution present considerable challenges for coal seam identification and prediction.
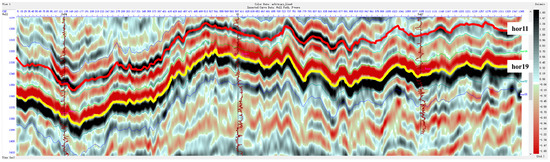
Figure 3.
Seismic profile of the study area.
3.2. Data Processing
The seismic data volume in the study area is well-defined and its full data information is shown in Figure 4, which was obtained from the Open Seismic Repository. The dataset consists of 1240 of time-migrated 3D seismic data, comprising 1676 main lines and 2197 tie lines located on the Gaojiapu block (Figure 4). The time range of the seismic data is 60 , the sampling rate in time dimension is 4 , and the sampling rate in spatial dimension is 25 .
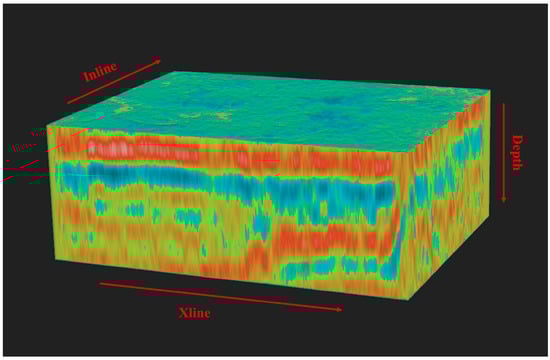
Figure 4.
Three-dimensional seismic data in the study area.
Before training the network, the most important step is data processing. The datasets were normalized to ensure the values varied within the interval 0 to 1, as shown in Formula (6):
where is the original data of the i-th sample; is the data after is normalized; is the maximum value of the original data; and is the minimum value of the original data.
3.3. Model Training
The encoder network architecture consists of 12 layers. Convolutional layers are employed as the primary components in the network due to their advantages in parameter sharing and efficient down sampling of input data. This design aims to preserve the network’s learning capability while minimizing the number of parameters to reduce computational complexity and the risk of overfitting. The input seismic data comprises 28 samples per seismic trace. The encoder follows the structure:
where denotes a convolutional layer with filters, a kernel size of 3, and a stride of 2, and represents a fully connected layer with an output dimension of .
ReLU and Sigmoid functions are used as the activation function. UMAP has some hyper-parameters that influence its performance. Training was performed using a learning rate of 0.005 and a batch size of 500, based on the Adam optimization algorithm. The Number of Neighbors was set as 30 and the Minimum Allowed Distance was 0.3.
4. Results and Application
4.1. Experiment Results
The model training process after training the model with more than 500 epochs is presented in Figure 5. With the continuous iteration of the network, the mean square error of the model gradually decreases and eventually approaches the global optimum. Initially, as the number of epochs increased, the loss decreased rapidly. After 30 epochs, the decrease slowed down and gradually stabilized. The loss value eventually stabilized around 0.05.
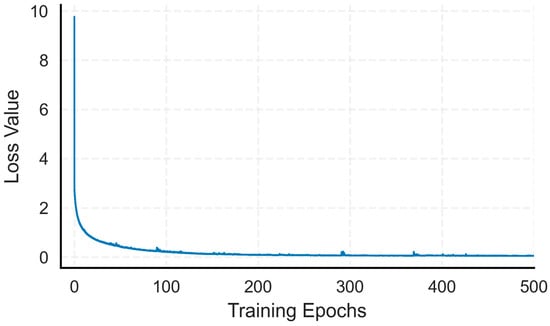
Figure 5.
Training loss over 500 epochs.
To evaluate the performance of the proposed UMAP-CNN, based on the labeled seismic waveform classification dataset, we compared it with other widely used manifold learning methods, namely t-SNE, LLE and Isometric Mapping (Isomap). These experiments adopt the default parameters in the cited documents to make the results more consistent for comparison.
Figure 6 shows the processing efficiency of four dimensionality reduction algorithms across different dataset sizes. LLE maintains a consistently low execution time across all dataset sizes, but it consumes a lot of computation tine and memory for matrix operations. UMAP-CNN, while slightly less efficient than LLE, still offers a competitive runtime. In contrast, t-SNE and Isomap demonstrate a steep increase in runtime as the dataset size increases, culminating in over 80 s for the largest dataset evaluated, which suggests these two methods may not be the most appropriate choice for large-scale data processing tasks due to their computational intensity.
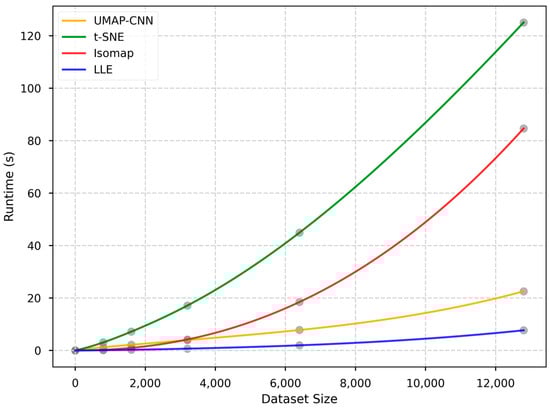
Figure 6.
Runtime performance of four methods.
By comparing the ROC curves of the four models (Figure 7), the AUC value of the UMAP-CNN model reaches the optimal value (0.96), followed by the t-SNE model (0.93), Isomap model (0.86), and LLE model (0.64). An AUC value equal to 0.5 indicates a random classification performance, and an AUC value equal to 1 indicates a perfect classification performance, showing that the performance of the UMAP-CNN is better than that of the t-SNE, Isomap, and LLE.
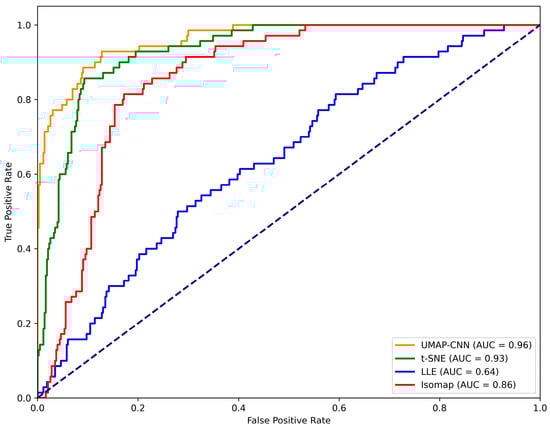
Figure 7.
ROC curves of four methods.
UMAP-CNN and other manifold learning methods were employed to generate two-dimensional representations of seismic data. In Figure 8, panels A through D present the two-dimensional projections obtained using four dimensionality reduction methods: UMAP (A), t-SNE (B), LLE (C), and Isomap (D). A visual inspection of these projections indicates that UMAP-CNN and t-SNE outperform the other methods in terms of cluster separability and structural preservation. UMAP-CNN demonstrates an effective capacity to capture the intrinsic geometry of the data, striking a balance between maintaining both local and global structures. While t-SNE also provides clear cluster separation, it exhibits some overlap among adjacent clusters, suggesting a stronger emphasis on preserving local rather than global relationships. In contrast, LLE and Isomap show limited effectiveness in distinguishing distinct clusters, particularly when applied to datasets characterized by high complexity or variability.
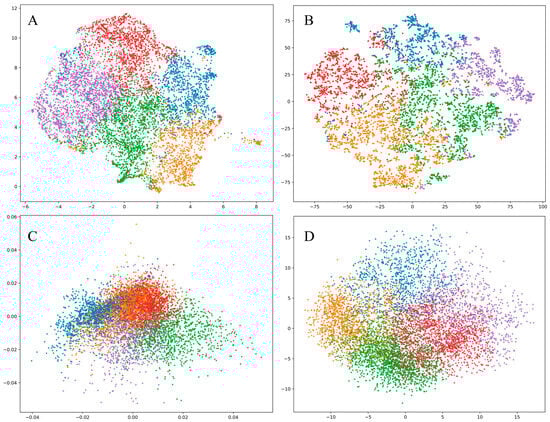
Figure 8.
Two-dimensional embedding distribution map of different methods: (A) UMAP-CNN; (B) t-SNE; (C) LLE; (D) Isomap.
For the quantitative assessment, the overall accuracy (OA) of all classes, the average accuracy (AA) of each class, and the Kappa score are calculated. As illustrated in detail in Table 1, the results reveal the good performance of UMAP-CNN compared to the other techniques. Clearly, UMAP-CNN provides a higher feature extraction capability in classification.

Table 1.
Classification of different methods.
4.2. Application
In the study area, seismic waveform analysis was performed on the target interval corresponding to the No. 8 coal seam in the Benxi Formation. Initially, the UMAP-CNN model was employed to leverage its feature extraction and memory capabilities for dimensionality reduction and global sorting of seismic waveform data, enabling unsupervised learning of seismic facies features. Subsequently, seismic facies feature analysis was conducted by integrating existing geological knowledge and drilling data to enhance the interpretability and geological relevance of the extracted features.
Figure 9 presents the results of layer flattening and seismic waveform analysis along the top boundary of the Taiyuan Formation. As indicated by the color bar on the right, the top interface of the Taiyuan Formation is located at approximately 10 ms on the time axis. Using this as a reference, the seismic waveform analysis effectively reveals the temporal thickness variation in the top boundary of the Benxi Formation, observed within the 40-60 ms range on the time axis. This variation highlights favorable zones for the development of the No. 8 coal seam, as greater temporal thickness typically correlates with enhanced coal seam development. A comparison with known well thickness data (represented by the black bars in Figure 9 and Figure 10, where longer bars indicate greater coal seam thickness) and manually interpreted seismic stratigraphy (Figure 10) confirms that UMAP-CNN provides a high degree of accuracy in characterizing coal seam thickness and reconstructing the paleogeography of the Benxi Formation. These findings demonstrate the proposed method’s excellent performance in capturing seismic waveform features and its capacity for efficient data processing.
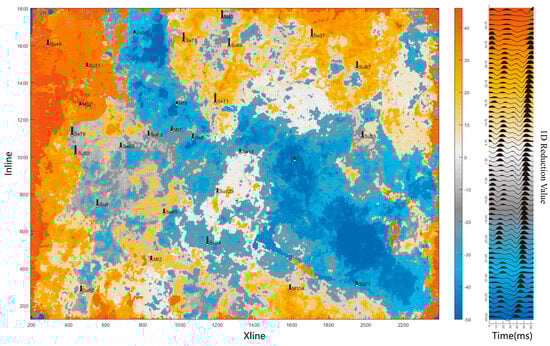
Figure 9.
UMAP−CNN dimensionality reduction results.
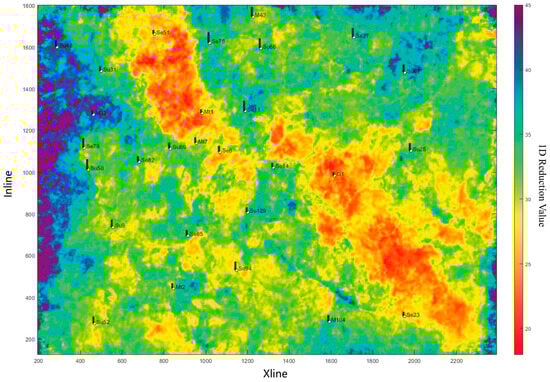
Figure 10.
Sedimentary facies diagram of the Benxi Formation based on stratigraphic interpretation.
5. Discussion
The proposed UMAP-CNN framework has significant practical implications for seismic exploration and reservoir characterization. By providing a more accurate and efficient method for seismic waveform features extraction, the framework can aid in identifying favorable zones for hydrocarbon accumulation, improving drilling success rates, and optimizing reservoir management strategies. Additionally, the framework’s ability to handle large-scale datasets makes it particularly valuable in regions with limited well data, where traditional methods often struggle to provide reliable predictions. The results from the Ordos Basin case study highlight the framework’s potential to enhance geological interpretations and support decision-making in exploration and production activities.
When compared to other manifold learning techniques such as t-SNE, LLE, and Isomap in the experiment, the UMAP-CNN framework demonstrates a superior performance in both computational efficiency and classification accuracy. This performance gain can be attributed to the framework’s ability to balance local and global data structures while effectively capturing the intrinsic geometry of high-dimensional seismic data. The integration of UMAP and CNN leverages the complementary strengths of manifold learning and deep learning, overcoming the limitations of shallow feature representation often encountered in traditional manifold learning techniques and mitigating the “curse of dimensionality” associated with high-dimensional feature spaces in deep learning. This synergy results in a more robust and interpretable feature representation, which is critical for accurate seismic facies classification and geological interpretation.
Despite its advantages, the UMAP-CNN framework has certain limitations that warrant further investigation. First, the framework’s performance is sensitive to hyperparameter selection. While this study employed default hyperparameters for consistency, future work could explore automated hyperparameter tuning or adaptive methods to optimize performance across different datasets. Second, the framework’s computational efficiency may still be a challenge for extremely large seismic datasets due to the memory requirements of UMAP. Addressing this limitation could involve developing more efficient implementations of UMAP or integrating parallel computing techniques to handle large-scale data.
Another area for future improvement is the incorporation of additional geophysical attributes and prior geological knowledge into the framework. While the current study focuses on seismic waveform data, integrating other attributes such as amplitude, phase, and frequency could enhance the framework’s ability to capture multidimensional relationships in seismic data. Furthermore, extending the framework to account for temporal or spatial dependencies in seismic data could improve its applicability to dynamic reservoir characterization and monitoring.
In summary, the UMAP-CNN framework offers a promising approach to seismic waveform feature extraction and clustering, addressing key challenges in traditional methods while providing robust and interpretable results. Future research could further refine the framework to address its limitations and expand its applicability to a broader range of geophysical problems.
6. Conclusions
This study introduces a novel UMAP-CNN framework for seismic waveform feature extraction and analysis, addressing the limitations of traditional linear and nonlinear dimensionality reduction methods. By integrating the strengths of manifold learning and deep learning, the proposed framework effectively captures the intrinsic geometric structure of high-dimensional seismic data while reducing redundancy and noise. The experimental results demonstrate that UMAP-CNN outperforms traditional methods such as t-SNE, LLE, and Isomap in waveform dimensionality reduction and clustering. The application of the No. 8 coal seam thickness prediction in the Ordos Basin shows that UMAP-CNN’s composite feature extraction can accurately characterize sedimentary facies and reservoir distribution, aligning with the actual results. Furthermore, the framework exhibits strong computational efficiency and robustness, making it suitable for large-scale seismic data processing tasks. The proposed method not only enhances the interpretability of seismic waveform features but also provides a reliable foundation for reservoir prediction and geological interpretation in areas with limited well data. Future work will focus on optimizing the UMAP-CNN framework for broader applications in seismic exploration and extending its use to other geophysical domains.
Author Contributions
L.Z.: methodology, software, formal analysis, visualization, writing—original draft, writing—review and editing. H.Y.: conceptualization, methodology, funding acquisition, supervision, software, writing—original draft, writing—review and editing. G.L.: validation, writing—review and editing. All authors have read and agreed to the published version of the manuscript.
Funding
This research was funded by CNPC Science and Technology Major Project (Grant No. 2023ZZ05-05 and 2025ZG80-04) and the Scientific Research Fund of Institute of Engineering Mechanics, China Earthquake Administration (Grant No. 2022QJGJ04).
Institutional Review Board Statement
Not applicable.
Informed Consent Statement
Not applicable.
Data Availability Statement
The original contributions presented in this study are included in the article. Further inquiries can be directed to the corresponding author.
Acknowledgments
Authors gratefully acknowledge anonymous reviewers and all editors for their thorough reading of this manuscript and for their insightful questions and constructive suggestions, which significantly improved the quality of this article.
Conflicts of Interest
Author Lifu Zheng was pursuing his master’s degree at the Research Institute of Petroleum Exploration and Development, China National Petroleum Corporation. Author Hao Yang was employed by the Research Institute of Petroleum Exploration and Development, China National Petroleum Corporation. The remaining author declares that the research was conducted in the absence of any commercial or financial relationships that could be construed as a potential conflict of interest.
References
- Liu, X.F.; Zheng, X.D.; Xu, G.C.; Wang, L.; Yang, H. Locally linear embedding-based seismic attribute extraction and applications. Appl. Geophys. 2010, 7, 365–375. [Google Scholar] [CrossRef]
- Chen, Q.; Sidney, S. Seismic attribute technology for reservoir forecasting and monitoring. Lead. Edge 1997, 16, 445–452. [Google Scholar] [CrossRef]
- Zhang, Y.L.; Yang, C.C.; Jia, S.G. Research and application of seismic attribute technology. Prog. Geophys. 2005, 20, 1129–1133. [Google Scholar] [CrossRef]
- Guo, H.J.; Liu, Q.C. History, current status and development trends of seismic attribute technology. Geophys. Geochem. Explor. 2008, 32, 19–22. [Google Scholar]
- Gong, H.; Zhou, Z.L.; Ni, Y. Reduction dimension of seismic attribution parameter based on Isomap algorithm. Nat. Gas Ind. 2008, 28, 38–40. [Google Scholar] [CrossRef]
- Wu, B.N. Seismic amplitude response characteristics of oil-bearing saturability variation of the reservoir model. Geophys. Geochem. Explor. 2015, 39, 1271–1277. [Google Scholar] [CrossRef]
- Yin, X.Y.; Kong, G.Y.; Zhang, G.Z. Seismic attribute optimization method based on kernel PCA and its application. Pet. Geophys. Explor. 2008, 43, 179–183. [Google Scholar] [CrossRef]
- Zhong, Y. Research on Nonlinear Seismic Attribute Technology and its Application; Chengdu University of Technology: Chengdu, China, 2008. [Google Scholar]
- Zheng, J.J.; Wang, Y.G.; Du, L. Attribute optimization method based on probabilistic KPCA and its application. Pet. Geophys. Explor. 2014, 49, 567–571. [Google Scholar]
- Liu, C.; Guo, K.; Luo, D.J. A non-linear modeling method for seismic data optimization and forecasting physical property parameters. Prog. Geophys. 2007, 22, 1880–1883. [Google Scholar]
- Ni, Y. Nonlinear dimensionality reduction of Isomap in the analysis of seismic attribute parameter data. J. Southwest Univ. Natl. (Nat. Sci. Ed.) 2008, 34, 397–400. [Google Scholar]
- Roweis, S.T.; Saul, L.K. Nonlinear dimensionality reduction by locally linear embedding. Science 2000, 290, 2323–2326. [Google Scholar] [CrossRef] [PubMed]
- Van der Maaten, L.; Hinton, G. Visualizing data using t-SNE. J. Mach. Learn. Res. 2008, 9, 2579–2605. [Google Scholar]
- Li, S.; Lin, H.; Zang, Z.; Wu, L.; Xia, J.; Li, S.Z. Invertible manifold learning for dimension reduction. In Proceedings of the Joint European Conference on Machine Learning and Knowledge Discovery in Databases, Bilbao, Spain, 13–17 September 2021; pp. 713–728. [Google Scholar]
- McInnes, L.; Healy, J.; Saul, N.; Großberger, L. UMAP: Uniform Manifold Approximation and Projection. J. Open Source Softw. 2018, 3, 861. [Google Scholar] [CrossRef]
- Du, B.; Xiong, W.; Wu, J.; Zhang, L.; Zhang, L.; Tao, D. Stacked convolutional denoising auto-encoders for feature representation. IEEE Trans. Cybern. 2017, 47, 1017–1027. [Google Scholar] [CrossRef]
- Gao, L.; Gu, D.; Zhuang, L.; Ren, J.; Yang, D.; Zhang, B. Combining t-distributed stochastic neighbor embedding with convolutional neural networks for hyperspectral image classification. IEEE Geosci. Remote Sens. Lett. 2019, 17, 1368–1372. [Google Scholar] [CrossRef]
- Zheng, L.; Luo, G.; Tan, Q.; Zhang, B.; Lv, X. Detecting collapsed buildings caused by earthquake from remote sensing images based on deep learning. In Proceedings of the SPIE Third International Conference on Electronics Technology and Artificial Intelligence (ETAI 2024), Guangzhou, China, 17–19 May 2024; p. 1328610. [Google Scholar]
- Zhang, L.; Zhang, L.; Du, B. Deep learning for remote sensing data: A technical tutorial on the state of the art. IEEE Geosci. Remote Sens. Mag. 2016, 4, 22–40. [Google Scholar] [CrossRef]
- Meier, M.A.; Ross, Z.E.; Ramachandran, A.; Balakrishna, A.; Nair, S.; Kundzicz, P.; Yue, Y. Reliable real-time seismic signal/noise discrimination with machine learning. J. Geophys. Res. Solid Earth 2019, 124, 788–800. [Google Scholar] [CrossRef]
- Zheng, L.; Fu, G.; Luo, G. Hazard zonation for potential earthquake-induced landslide in the eastern East Kunlun fault zone. Open Geosci. 2024, 16, 20220704. [Google Scholar] [CrossRef]
- O’Shea, T.J.; Corgan, J.; Clancy, T.C. Convolutional radio modulation recognition networks. In Proceedings of the Engineering Applications of Neural Networks: 17th International Conference, EANN 2016, Aberdeen, UK, 2–5 September 2016; pp. 213–226. [Google Scholar]
- Zhou, H.; Feng, X.; Dong, Z.; Liu, C.; Liang, W. Application of denoising CNN for noise suppression and weak signal extraction of lunar penetrating radar data. Remote Sens. 2021, 13, 779. [Google Scholar] [CrossRef]
- Oppliger, J.; Denner, M.M.; Küspert, J.; Frison, R.; Wang, Q.; Morawietz, A.; Chang, J. Weak-signal extraction enabled by deep-neural-network denoising of diffraction data. Nat. Mach. Intell. 2024, 6, 180–186. [Google Scholar] [CrossRef]
- Ovcharenko, O.; Hou, S. Deep learning for seismic data reconstruction: Opportunities and challenges. In Proceedings of the First EAGE Digitalization Conference and Exhibition, Glasgow, UK, 30 Novermber–3 December 2020; p. 202032054. [Google Scholar]
- Pradhan, A.; Mukerji, T. Consistency and prior falsification of training data in seismic deep learning: Application to offshore deltaic reservoir characterization. Geophysics 2022, 87, N45–N61. [Google Scholar] [CrossRef]
- Wang, F.; Alkhalifah, T.A. Learnable Gabor kernels in convolutional neural networks for seismic interpretation tasks. IEEE Trans. Geosci. Remote Sens. 2024, 62, 5906709. [Google Scholar] [CrossRef]
- Allaoui, M.; Kherfi, M.L.; Cheriet, A. Considerably improving clustering algorithms using UMAP dimensionality reduction technique: A comparative study. In Proceedings of the International Conference on Image and Signal Processing, Marrakesh, Morocco, 4–6 June 2020. [Google Scholar]
- Zhang, Q.; Liu, Y.; Fang, H.J.G. Manifold learning-based UMAP method for geochemical anomaly identification. Geochemistry 2024, 84, 126157. [Google Scholar] [CrossRef]
- De Boer, P.-T.; Kroese, D.P.; Mannor, S.; Rubinstein, R.Y. A Tutorial on the Cross-Entropy Method. Ann. Oper. Res. 2005, 134, 19–67. [Google Scholar] [CrossRef]
- Liu, C.; Zhao, H.; Sun, Y. Tectonic background of Ordos Basin and its controlling role for basin evolution and energy mineral deposits. Energy Explor. Exploit. 2009, 27, 15–27. [Google Scholar] [CrossRef]
- Jin, R.; Yu, R.; Miao, P. Background of the Ordos Basin. In Geological Background of Sandstone-Type Uranium Deposits in Ordos Basin, Northwest China; Springer Geology: Singapore, 2023. [Google Scholar]
- Huang, D.; Xu, H.; Hu, J.; Dong, Y.; Jiao, P.; Chen, S.; Zhou, G.; Wu, X.; Wu, H. Pore development patterns and gas control effects of No.8 deep coal seam of Ordos Basin. Coal Sci. Technol. 2025, 53, 115–123. [Google Scholar] [CrossRef]
- Xu, F.; Wang, C.; Xiong, X.; Li, S.; Wang, Y. Deep coalbed methane reservoir forming modes and key technical countermeasures: Case study of eastern margin of Ordos Basin. China Offshore Oil Gas 2022, 34, 30–42. [Google Scholar]
- Li, G.; Yao, Y.; Wang, H.; Meng, L.; Li, P.; Zhang, Y.; Wang, J.; Ma, L. Deep coalbed methane resources in the Shenmu-Jiaxian block, Ordos Basin, China: Geological characteristics and exploration potential. Coal Geol. Explor. 2024, 52, 70–80. [Google Scholar] [CrossRef]
Disclaimer/Publisher’s Note: The statements, opinions and data contained in all publications are solely those of the individual author(s) and contributor(s) and not of MDPI and/or the editor(s). MDPI and/or the editor(s) disclaim responsibility for any injury to people or property resulting from any ideas, methods, instructions or products referred to in the content. |
© 2025 by the authors. Licensee MDPI, Basel, Switzerland. This article is an open access article distributed under the terms and conditions of the Creative Commons Attribution (CC BY) license (https://creativecommons.org/licenses/by/4.0/).